| 1 This report is proprietary and confidential. No part of it may be circulated, quoted, or reproduced for distribution without prior written approval from the authors. This document is a summary for general information only and does not constitute legal advice. Advice of appropriate counsel must be sought prior to any consideration of the issues raised herein
Transcript
| 1
This report is proprietary and confidential. No part of it may be circulated, quoted, or reproduced for distribution without prior written approval from the authors. This document is a summary for general information only and does not constitute legal advice. Advice of appropriate counsel must be sought prior to any consideration of the issues raised herein
affordability of this system is becoming increasingly
challenging for consumers and the government.
Healthcare spending has outpaced economic
growth for years, increasing from 8.3 percent of
GDP in 2003 to 9.4 percent in 2013. Private health
insurance is an essential component to alleviate the
burden on the public system, but is under financial
strain: annual premium revenue growth has ranged
from 7 to 9 percent in 2013-151, while participation
has flat-lined at 47 percent of the population2. New
measures are needed to keep healthcare within the
means of all Australians.
Reforming the prostheses reimbursement model is
a promising opportunity to contribute to the
sustainability of healthcare in Australia. Prostheses
represent a significant amount of expenditure,
comprising over 10 percent of total
reimbursements by private insurers3; and current
pricing governance mechanisms for prostheses
have led to benefit levels that are often twice as
high as prices in comparable systems, both
domestically and abroad.
As will be shown, by addressing the area of
prostheses reimbursement, the Australian health
system could save $800 million in annual
expenditure while preserving quality of care. This
could translate into a premium reduction of 4.5
percent, or a savings of over $150 per policy.
Furthermore, lower premiums are estimated to
enable a migration of 300,000 Australians towards
private health insurance, creating up to $276
million in additional value for government and
significantly reducing the burden on the public
health system.
In order to improve the system, Australia’s private
health insurers developed a set of 11 potential
reforms based on international case studies, a
review of the literature, and expert interviews.
These were evaluated in terms of both impact (i.e.,
ability to reduce value flowing out of the system
while improving or preserving outcomes) and
feasibility (i.e., magnitude of reform required and
potential downside risks). Appendix A provides
further detail on this evaluation.
Two options emerged as the most promising
avenues for reform, diverging significantly in scope
of impact and change required. The first avenue is
reference pricing, which would enhance the current
model with a stronger fact base of domestic and
international benchmarks. Reference pricing may
be relatively straightforward to accomplish, as it
requires little reform, has widespread usage, and
could lower benefits to benchmark levels (i.e., by 45
percent) within two or three years.
The second, and longer-term, opportunity is to
integrate prostheses costs into an episode-based
payment. Agreeing on a predetermined
reimbursement per procedure (e.g., per MBS item)
would create stronger incentives for manufacturers
to compete on price and improve the sustainability
of the overall health system.
For these or any potential improvements to the
reimbursement of prostheses, three criteria should
be carefully considered:
■ Improve or maintain clinical outcomes
– quality of care is the paramount objective of
the entire prosthesis field, and any reforms
undertaken should not compromise patient
welfare.
■ Make healthcare more affordable and
accessible for Australians –by
eliminating excess expenditure, reform can
reduce private insurance premiums and
alleviate the burden on the health system.
■ Align incentives towards financial
sustainability – the government can
increase transparency into true costs and
value to promote competition and set a
sustainable course for prostheses expenditure
in the future.
This report is divided into three sections: first, the
case for change analyses the root causes and impact
of current inefficiencies. Next, the proposed
alternative – reference pricing – is presented.
Finally, a perspective is offered on what longer-
term evolutions to the value chain and
complementary reforms should be considered as
part of a holistic approach.
3
The case for change
The case for change is built on four key points:
■ Historical regulatory conditions have driven
and then entrenched highly inflated prices
in Australia’s private prostheses market,
and the current governance model in place
to regulate these prices is flawed.
■ International and domestic price
benchmarks suggest that, on average, the
Australian private health system is paying
nearly twice the efficient benefit level for
prostheses.
■ There is an imbalance between who benefits
and who pays in the current system, with
the value tilted heavily towards the
multinational shareholders of
manufacturers and providers at the expense
of Australian consumers and taxpayers.
■ There is a lack of transparency into the true
cost of prostheses in the health system and
the extent of value disbursed through
rebates or other incentives.
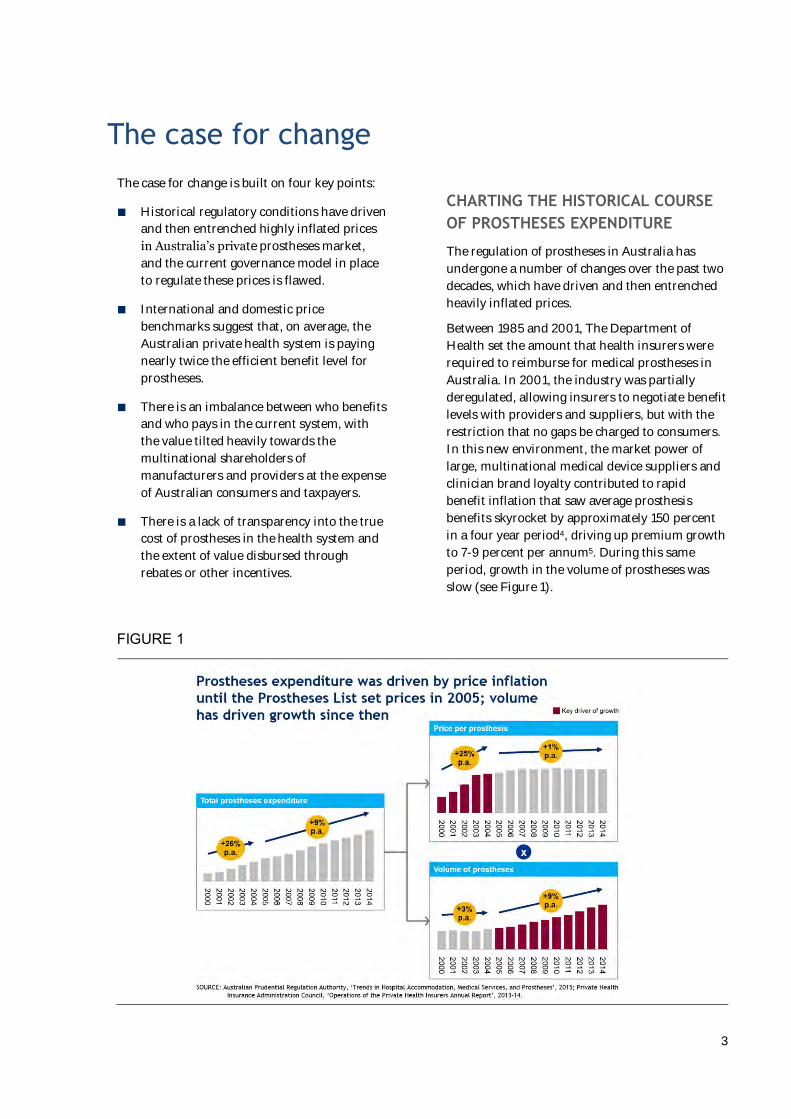
CHARTING THE HISTORICAL COURSE
OF PROSTHESES EXPENDITURE
The regulation of prostheses in Australia has
undergone a number of changes over the past two
decades, which have driven and then entrenched
heavily inflated prices.
Between 1985 and 2001, The Department of
Health set the amount that health insurers were
required to reimburse for medical prostheses in
Australia. In 2001, the industry was partially
deregulated, allowing insurers to negotiate benefit
levels with providers and suppliers, but with the
restriction that no gaps be charged to consumers.
In this new environment, the market power of
large, multinational medical device suppliers and
clinician brand loyalty contributed to rapid
benefit inflation that saw average prosthesis
benefits skyrocket by approximately 150 percent
in a four year period4, driving up premium growth
to 7-9 percent per annum5. During this same
period, growth in the volume of prostheses was
slow (see Figure 1).
FIGURE 1
4
In reaction to this price spiral, the government
intervened in 2005 to set benefits using the
Prostheses List, transitioning to a new model in
a mostly cost-neutral way, thereby locking in
reimbursements at inflated levels. A maximum
reimbursement level was also set for each item,
re-opening the possibility for providers to charge
payment gaps, but was removed in 2010 as in
practice it was not used. Currently, the Prostheses
List continues to mandate a single minimum
reimbursement benefit for each item on the list,
benchmarked to groups of comparable items and
set relative to the price of the year before. As a
result, today’s Prostheses List is winning the
battle but losing the war: price inflation is under
control, but reimbursement levels remain
significantly higher than other comparable health
systems – and each year, hundreds of millions of
dollars of excess value are flowing to the
shareholders of manufacturers and providers, at
the expense of insurers, consumers, and
government.
Regulating the Prostheses List
Today, the Prostheses List Advisory Committee
(PLAC) deals with over 1,200 product
submissions a year6, mostly from medical device
manufacturers applying to introduce a new or
upgraded product into the market. While there is
a focus on assessing and pricing new entries,
many entries remain unchanged: close to half of
all items on the Prostheses List retained the same
benefit level from 2011 – 20157. In order to add or
update an item on the List, a ‘sponsor’ (the
medical device company who owns the new
technology) must submit an application, which is
assessed by the PLAC’s associated Clinical
Advisory Groups (CAGs) to determine suitability
of the device for inclusion on the list. Once the
initial assessment has been passed, the PLAC will
negotiate amongst themselves to arrive at a set
benefit level to charge, based mostly on
reimbursement levels of equivalent products
already on the Prostheses List. The sponsor then
i Refers to private providers’ current incentive to select Prostheses List items with the highest possible benefit level if benefits
differ, to maximise rebates received given the cost will be passed on to insurers regardless. Therefore, a manufacturer looking to
sell at a lower price (with a corresponding lower margin and less ability to provide rebates to providers) has few prospective
customers, and cannot break into the market.
has the right to appeal the set benefit level,
triggering a review by external consultants with a
clinical background to determine whether the case
warrants reopening8.
Despite the structured nature of the approvals
process, the methodology used to review and
assign benefit levels to Prostheses List items is
limited in four key ways:
■ PLAC does not systematically collect price
point data from manufacturers, public
hospitals or international benchmarking
services. As a result, domestic or
international benchmarks are rarely
considered, leading to pricing ‘in a vacuum’.
■ New entrants have no incentive to compete
on price, for two reasons. First, hospitals
have no sensitivity to invoice price, so
competitors gain no competitive advantage
from a lower minimum reimbursement.
Second, the minimum reimbursement level
is set at the price offered by manufacturers
comprising 25 percent of the market, so a
new product cannot drive down prices until
it gains significant share.i,9. The impact can
be seen, for example, when patents expire:
while competitors are quick to list ‘me-too’
products, they typically do so at the existing
minimum reimbursement level, not at the
expected ‘generic’ discount seen in
pharmaceuticals and other systems. Rebates
are not included, motivating providers and
manufacturers to ‘price shield’ in contracts
(i.e., agree to maintain a high invoice price
and negotiate on opaque rebates.
■ Manufacturers regularly do not provide all
the data required by PLAC to build a robust
view of cost base vs. clinical effectiveness,
citing the information as ‘commercial in
confidence’.
■ Comparative effectiveness is typically
calculated using average outcomes,
regardless of individual patient needs.
5
Hence, the ‘average’ superior product may
be favoured even where an alternative
would be more suitable.
In summary, regulatory changes over the past
two decades have first created, and then locked
in highly inflated prostheses benefit levels in
Australia’s private health market. Furthermore,
the current governance model that has been put
in place to regulate the system is flawed, and
unable to leverage the right price signals to bring
costs down.
THE PRICE IS WRONG: SIZING THE
MAGNITUDE OF CURRENT
INEFFICIENCIES
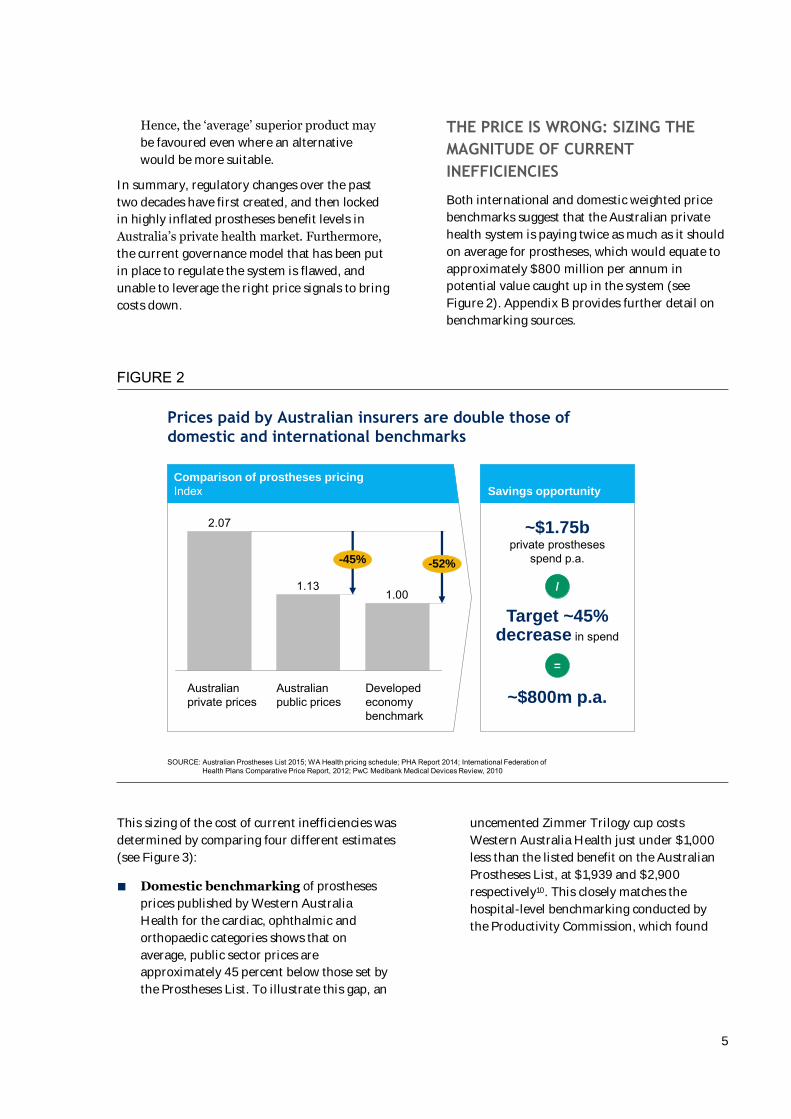
Both international and domestic weighted price
benchmarks suggest that the Australian private
health system is paying twice as much as it should
on average for prostheses, which would equate to
approximately $800 million per annum in
potential value caught up in the system (see
Figure 2). Appendix B provides further detail on
benchmarking sources.
FIGURE 2
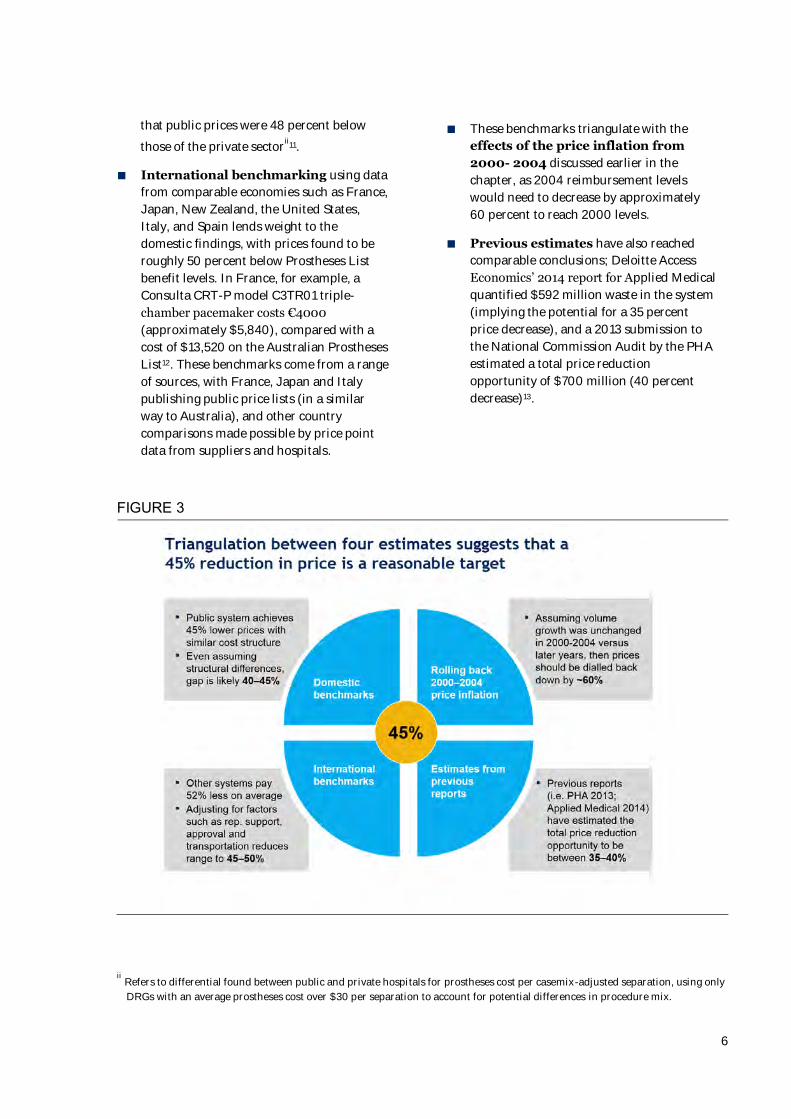
This sizing of the cost of current inefficiencies was
determined by comparing four different estimates
(see Figure 3):
■ Domestic benchmarking of prostheses
prices published by Western Australia
Health for the cardiac, ophthalmic and
orthopaedic categories shows that on
average, public sector prices are
approximately 45 percent below those set by
the Prostheses List. To illustrate this gap, an
uncemented Zimmer Trilogy cup costs
Western Australia Health just under $1,000
less than the listed benefit on the Australian
Prostheses List, at $1,939 and $2,900
respectively10. This closely matches the
hospital-level benchmarking conducted by
the Productivity Commission, which found
Prices paid by Australian insurers are double those of
domestic and international benchmarks
1.001.13
2.07
Australian private prices
-52%-45%
Developedeconomy benchmark
Australian public prices
SOURCE: Australian Prostheses List 2015; WA Health pricing schedule; PHA Report 2014; International Federation of Health Plans Comparative Price Report, 2012; PwC Medibank Medical Devices Review, 2010
Comparison of prostheses pricing
Index Savings opportunity
/
=
~$1.75b private prostheses
spend p.a.
Target ~45% decrease in spend
~$800m p.a.
6
that public prices were 48 percent below
those of the private sectorii
11.
■ International benchmarking using data
from comparable economies such as France,
Japan, New Zealand, the United States,
Italy, and Spain lends weight to the
domestic findings, with prices found to be
roughly 50 percent below Prostheses List
benefit levels. In France, for example, a
Consulta CRT-P model C3TR01 triple-
chamber pacemaker costs €4000
(approximately $5,840), compared with a
cost of $13,520 on the Australian Prostheses
List12. These benchmarks come from a range
of sources, with France, Japan and Italy
publishing public price lists (in a similar
way to Australia), and other country
comparisons made possible by price point
data from suppliers and hospitals.
■ These benchmarks triangulate with the
effects of the price inflation from
2000- 2004 discussed earlier in the
chapter, as 2004 reimbursement levels
would need to decrease by approximately
60 percent to reach 2000 levels.
■ Previous estimates have also reached
comparable conclusions; Deloitte Access
Economics’ 2014 report for Applied Medical
quantified $592 million waste in the system
(implying the potential for a 35 percent
price decrease), and a 2013 submission to
the National Commission Audit by the PHA
estimated a total price reduction
opportunity of $700 million (40 percent
decrease)13.
FIGURE 3
ii Refers to differential found between public and private hospitals for prostheses cost per casemix-adjusted separation, using only
DRGs with an average prostheses cost over $30 per separation to account for potential differences in procedure mix.
7
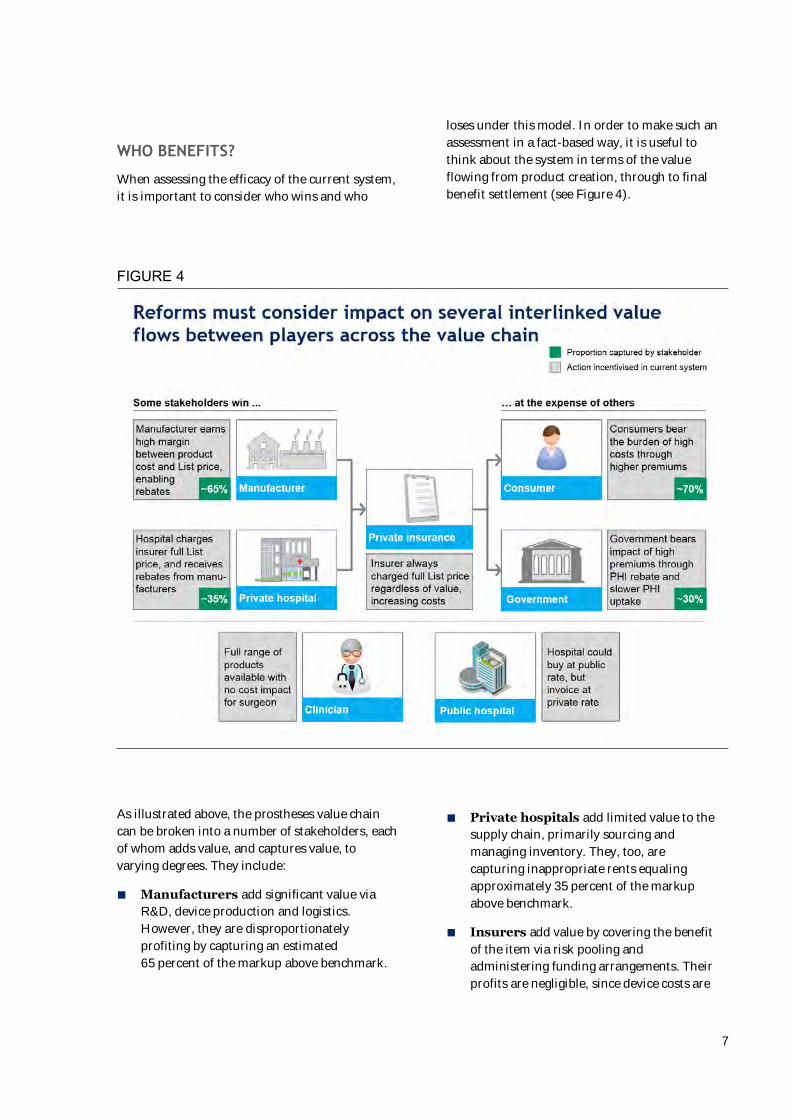
WHO BENEFITS?
When assessing the efficacy of the current system,
it is important to consider who wins and who
loses under this model. In order to make such an
assessment in a fact-based way, it is useful to
think about the system in terms of the value
flowing from product creation, through to final
benefit settlement (see Figure 4).
FIGURE 4
As illustrated above, the prostheses value chain
can be broken into a number of stakeholders, each
of whom adds value, and captures value, to
varying degrees. They include:
■ Manufacturers add significant value via
R&D, device production and logistics.
However, they are disproportionately
profiting by capturing an estimated
65 percent of the markup above benchmark.
■ Private hospitals add limited value to the
supply chain, primarily sourcing and
managing inventory. They, too, are
capturing inappropriate rents equaling
approximately 35 percent of the markup
above benchmark.
■ Insurers add value by covering the benefit
of the item via risk pooling and
administering funding arrangements. Their
profits are negligible, since device costs are
8
passed on to consumers through regulated
premium increases.
■ Consumers bear the bulk of the cost –
approximately 70 percent – through
insurance premiums, but are largely
insensitive to the excess payments as they
are blended into a single premium payment.
■ The Australian Government subsidises
roughly 30 percent of prostheses costs,
regulates the system, and covers the
healthcare costs of consumers who drop out
of private health insurance because of
unaffordable premiums.
■ Other stakeholders also influence this
flow. For example, clinicians often drive
product choice, and public hospitals invoice
insurers for private patients.
Value is and should be distributed along the
chain; however, the system currently tilts that
value too heavily towards manufacturers, at the
expense of consumers and the Australian
Government.
Medical device manufacturer margins are
extremely high. In FY15, the top five multinational
manufacturers supplying Australian hospitals
earned an average gross margin of ~70 percent on
their products internationally14, implying that they
are earning a substantial markup even on already
lucrative international benchmark prostheses
prices. In Australia, manufacturers are also
capturing at least part of the additional markup
from international benchmark prices to
Prostheses List reimbursement levels (with the
other portion going to private hospitals in the
form of rebates), making it likely that they are
earning even higher margins on private
procedures in Australia.
Private hospital margins are also high – for
instance, a large Australian listed private hospital
operator recorded EBITDA margins of
25 percent.15 By comparison, the average
operating margin for American hospitals has
ranged between 3.1 and 3.4 percent for the last
three years16 .
One contributing factor to those margins is the
sharing of the excess value created between
international benchmark prices and Prostheses
List benefits through the practice of rebates for
providers in exchange for spend volume. While
insurers are in theory able to request information
on any direct rebates given for particular
prostheses and subsequently claim back the value,
there are myriad ways of accounting for rebates
within a provider/supplier contract that are less
overtly tied to particular items, and therefore
highly unlikely to be picked up and claimed in
practice.
The magnitude of the markup split cannot
therefore be quantified exactly, however expert
and field interviews have led to an approximation
of ~35 percent going to providers (accounting for
the wide variability in prevalence of rebates across
different categories of prostheses spend), leaving
~65 percent for manufacturers. Private hospitals
therefore have an incentive to always charge the
List price to insurers and negotiate rebates
connected with spend in other ways, and then to
drive increased use of those products that attract
the greatest rebate.
Some evidence suggests that Public hospitals
also receive a marginal benefit under the current
system, when they invoice private patient insurers
for the full List amount, but only pay
manufacturers public prices. However, this
benefit is estimated to be relatively small, as
manufacturers typically charge the full Prostheses
List price for privately insured patients in public
hospitals.
WHO PAYS?
The ultimate burden of a system that drives
inflated prostheses spend is borne by consumers
and taxpayers.
Consumers bear most of the excessive costs
driven by the current system through higher
premiums. Given private healthcare insurance
premiums are a function of total benefit spend,
an excess value of $800 million flowing out of the
system equates to approximately 4.5 percent in
premiums for the 11 million Australians who
currently hold private health insurance, or $150 a
year per insurance policy17. Effectively, this means
that Australian private healthcare consumers are
currently subsidising the corporate shareholders
of multinational manufacturers and private
hospitals.
9
The Federal Government has also historically
paid a heavy price for the inefficiencies of the
current system. Since 1999, the Australian
Government has offered a rebate of approximately
30 percent to all Australians with private health
insurance, to encourage a shift from public to
private healthcare. This means that nearly one
third of the excess private healthcare spend that
has been passed through to consumers in the form
of higher premiums has in fact accrued to public
purses. Over time, this additional spend has
amounted to a considerable loss to the system –
over the past decade, excess government spend on
private health insurance rebates due to inflated
prostheses costs alone equals $1.7 billion of
taxpayer money.18
Premiums and PHI participation
Consumers are increasingly hard-pressed to bear
these excess costs in Australia’s constrained
economic climate. For the first time in fifty years,
personal disposable income has fallen for four
quarters in a row. Debt-to-income ratios have
tripled to 152 percent since the 1990s, and
nominal wages and real disposable income have
flattened, forcing many to tap into personal
savings to maintain living standards.
In this environment, consumers are very sensitive
to changes in the affordability of high-cost items
such as private health insurance, and tend to vote
with their feet. Comparative analysis of PHI
premium and membership growth over the past
decade indicates that a strong negative correlation
(R2 = 0.75) exists between premium growth rates
and membership growth rates (see Figure 5). This
reflects the experience of introducing the
Government Rebate, where the 30 percent benefit
introduced in 1999 was followed by 15 percent
membership growth in just two years.19 These two
data points suggest that for a 4.5 percent decrease
in premium growth, ~300,000 additional
Australians will take up private health insurance.
FIGURE 5
10
This correlation highlights another cost borne by
taxpayers under the current regime – namely, the
cost of providing public healthcare benefits to
Australians who would otherwise have taken up
private health insurance, or upgraded their
insurance to more comprehensive coverage, if
premiums were lower. Saving 45 percent of
prostheses spend would lower overall private
health expenditure by approximately 4.5 percent,
encouraging 300,000 additional Australians to
take up private health insurance.
Such a shift would deliver two broad benefits to
the Australian Government and taxpayers:
reduced strain on the public health system, and
greater healthcare choice for more Australians.
This reduced strain would manifest in improved
access to services. To take a simplified exampleiii
,
300,000 less Australians in the public system
could lead to a decrease of over 13% in median
wait times for elective surgery (from 36 to 31
days)iv
20. It follows that lower premiums would
also prompt many existing private health
insurance members to upgrade to more
comprehensive policies: broader private coverage
would further reduce the burden on the public
system.
Increased participation in private health
insurance could also create up to $276M in net
value for government in Australia, via three
changes: the avoided cost of treating 300,000
patients in the public system, less the cost of
additional private health insurance rebates, and
the revenue lost on the Medicare Levy Surcharge.
iii Assumes that migration of patients from the public to private system manifests as a linear, one-off
reduction in demand. In reality, the relationship between demand reduction and waiting times is non-
linear, and conducting a full flow analysis would likely result in even bigger decreases in waiting times
iv Calculation based on 30 people per 1,000 population requiring elective surgery in any given year and
approximately 700,000 elective surgeries being performed in the public system each year
v Based on AIHW $4,900 cost per separation, taking into account MBS coverage of 75% medical costs across
both systems
Assuming an average saving of $3,980 per
hospital separation performed in the private
system versus the public systemv and an average
of 410 separations per 1,000 Australians21,
300,000 people shifting to the private health
system equates to an additional $493M in avoided
public costs. $135M in additional government
expenditure due to the ~30% government rebate22
and $82M in government revenue lost from
Medicare Levy Surcharge on non-privately
insured Australians (depending on income tier)23
would then need to be subtracted, to arrive at the
net value of $276M. It would then be the task of
government to decide how the $493M in value
created in the public system would be used: it
could manifest as cost savings, or be reinvested to
reduce burden on capacity.
In summary, a system that offers rents in excess
of international benchmarks to certain
stakeholders must necessarily be imposing an
undue burden on other stakeholders, and under
the current prostheses pricing and regulatory
model, it is consumers and taxpayers who lose.
Every year, Australians are paying $800 million in
excess margins to profit the shareholders of
largely multinational manufacturers and
providers, and the Australian Government is
bearing the burden of an additional 300,000
people relying on public health insurance who
otherwise may have switched to private coverage
if premiums were lower, estimated at up to
$276M a year. It is time to re-evaluate the
incentives and value flows in the system to ensure
a more equitable distribution for all stakeholders.
11
Reference pricing: bringing benefits in line with domestic and international peers
OVERVIEW OF PROPOSAL
In this section, a reference pricing model is
proposed which would adjust reimbursement
levels for each clinical category of products to
bring them in line with comparable health
systems. By defining a basket of common
products with domestic and international peers,
and accounting for variances in delivery model,
exchange rate, etc., this system can ensure that all
stakeholders receive fair compensation for their
value-add with little incremental overhead
required.
Reference pricing is a well-accepted system which
is currently used in several countries. For
instance, Japan has employed international
reference pricing for over a decade (see sidebar).
France, Italy, the Czech Republic, Russia and the
U.K. are other exemplars of domestic or
international reference pricing. In applying this
model to prosthesis pricing in the Australian
health system, the proposed reform would closely
resemble the recent reforms to the
Pharmaceutical Benefits Scheme (PBS) where
more stringent requirements on price disclosure
and international references are expected to yield
$3.1 billion in savings by 201824.
A concerted effort to introduce reference pricing
could yield significant near-term impact; by
setting a target of price parity with comparable
benchmarks, the Australian Government could
reduce expenditure levels by an estimated
45 percent, as described previously. In addition
to reflecting external benchmarks, this objective
would effectively undo the extreme price inflation
of 2001-2004, when benefit levels rose by up to
27 percent every six months.
A 3-year sequence of price revisions is
recommended, in order to bring benefit levels in
line with benchmark levels as rapidly as possible,
while providing adequate time for stakeholders to
update their business models and contract terms.
To maximise impact, the Australian Government
should consider setting the largest decrease in the
first year, for example, aim for a 25 percentage
point price reduction in that time frame, if data
permits.
It is therefore proposed that the Australian
Government develop a reference pricing scheme
to reduce prostheses expenditure by
approximately 45 percent, or $800 million p.a.,
over three years. The following sections outline
the expected benefits of this approach, analysis of
risks and considerations, and one potential
implementation design based on six key
parameters.
12
Case study of international reference pricing – Japan
Japan uses a prostheses list to control prices for complex or innovative prostheses. Commoditised prostheses, such as sutures or gauze, are included in the cost of the procedure.
Price-setting for a new prosthesis incorporates reference pricing as a part of a multistage process. At the initial stage, a prosthesis is categorised as one of two types – devices that develop existing products and devices with innovative technologies. Prostheses that fall into the first category are benchmarked against existing comparable devices, with premiums for added value. The price of the second category is determined through zero-based pricing which breaks down manufacturer costs.
It is only at this stage that international reference pricing is applied. The price generated by the first stage is compared against those of the US, UK, Germany, France and Australia. If the initial price is more than 1.5 times the international average, it will be reduced by up to 25 percent.
Finally, Japan mitigates against the risk that manufacturers will delay or decline to release new products on the market by applying an additional premium to products that launch in Japan within 180 days of their US release.
Japan has successfully utilised international reference pricing alongside other pricing strategies. The Ministry has cut prices every two years (e.g., by 5.6 percent in 2012) which has held prostheses price growth below health inflation.25
EXPECTED BENEFITS FOR CONSUMERS
AND GOVERNMENT
As described earlier, a 45 percent average
reduction in prosthesis prices would yield
significant benefits for the Australian consumer.
Premium growth would be curtailed – for
instance, if the reduction had been distributed
across the past three years, annual premium
growth rates would have been lowered by an
average of ~1.5 percent per annum. This
translates into total run-rate savings of
~4.5 percent per year on private health insurance
premiums.
The Australian Government would also greatly
benefit from increasing consumer demand for
private insurance. The correlation described
earlier indicates that a 4.5 percent reduction in
premiums could encourage roughly 300,000
Australians to switch to private insurance. Based
on this migration, the financial burden on the
public system could be reduced by up to $276
million. Additional gains would be derived from
consumers upgrading their insurance products,
and hence consuming fewer high-cost public
hospital resources.
In addition to these direct financial gains, the
proposed reform would also yield secondary
benefits across the system. New manufacturers
will more easily introduce low-cost alternatives
into the market, fostering competition. Quality
of care is likely to improve with more appropriate
provider incentives – the risk of physician
influence and unnecessary product usage could
decrease as providers receive less excess profit per
procedure. Finally, the resources expended in
negotiation between the PLAC and manufacturers
can be repurposed, as reimbursement levels are
set based on an objective fact base.
ANALYSIS OF POTENTIAL CONCERNS
AND RESPONSES
The proposed reforms would have significant
implications for manufacturers, providers,
consumers and the Australian Government. As
such, these stakeholders should be involved in all
phases of the design, and potential unintended
consequences must be carefully examined. A risk
13
analysis was conducted, divided into structural
and clinical downsides.
Structural risks
Three structural risks were identified which could
limit the reform’s ability to achieve its stated
aims: manufacturer exit, increasing gap
payments, and price hikes for public hospitals.
Manufacturers will feel the greatest margin
pressure, and may threaten to exit the market.
While care must be taken to maintain a viable
industry for medical technology players, three
facts suggest that the risk of supplier flight is
relatively low. First, the proposed reform would
not reduce prices below comparable benchmarks.
There are no evident reasons why prices should be
higher in Australia, since transportation costs
have been lowered by the shift to Asian
production, product representatives assist to a
similar degree in other systems, and Australia’s
distributor network is also comparable. Hence,
suppliers should still attain the same margins in
the private Australian market as elsewhere.
Second, a scan of twelve developed countries did
not reveal any instances where healthcare reform,
including shifting to a reference pricing model for
prostheses, spurred a major supplier exit, nor of
disruption to supply. Finally, Australia’s exposure
to individual suppliers is quite low, with only 1.3
percent of prostheses spend in categories with
only one supplier.26 Thus, manufacturer exit
appears to be an acceptably small risk to product
supply.
The uncontrolled growth of gap payments could
be another adverse consequence, if the current
regulation prohibiting manufacturers from
charging prices above the Prostheses List benefit
levels were loosened. This could adversely impact
consumers via growing out-of-pocket expenses, as
well as potentially reducing the efficiency of
providers and clinicians, who would spend more
time discussing product choice with patients.
However, 20 percent of prostheses included gaps
as recently as 201127, suggesting that a moderate
level of gap payments could motivate consumers
to participate more actively in selecting the right
prosthesis. The Australian Government may wish
to establish protective measures such as requiring
manufacturers to agree to no-gap pricing as a
condition of listing.
Potential cross-subsidisation between public and
private systems was also examined;
manufacturers could claim that the high prices
paid by private patients are effectively subsiding
low prices in the public system. This is directly
contradicted by domestic and international
benchmarks (see Figure 2), which have
demonstrated that Australia’s public system has
prices in line with several other countries. Hence
there is no evidence to suggest that a decline in
private prices should entail a commensurate rise
in public prices. In fact, public buyers may benefit
from the increased transparency afforded by
international benchmarks in their negotiations.
Clinical risks
Three clinical risks were identified: surgeon
throughput may be reduced if manufacturers
reduce product representative levels in theatres,
choice of prostheses may be curtailed by
providers, and innovative products could be
slower to reach the Australian market.
Manufacturers’ product representatives now
attend the great majority, perhaps 90 percent,
of orthopaedic surgeries. If lower revenues cause
manufacturers to reduce their sales force,
surgeons may no longer receive the same degree
of support. However, interviews with surgeons
and international experts indicate that product
reps do attend in genuinely necessary cases even
in systems with lower price points. Hence, any
cutbacks in representative support would likely be
limited to ‘bread-and-butter’ operations, where
the surgeon’s product knowledge is expected to be
more than adequate.
Providers may assert that the loss of revenue from
manufacturer rebates creates a financial pressure
to constrain physician choice. This logic seems
flawed, since the Prostheses List aims to flow
payment through providers, eliminating any
incentive to narrow suppliers. Furthermore, many
private hospitals are already narrowing choice, for
instance, nearly 50 percent of private providers
purchase knees from only one or two
manufacturers.28
14
Finally, manufacturers may claim that lower
reimbursements will choke the supply of next-
generation technology. While it is important to
preserve access to such products, other countries
are doing so at lower prices – matching their
reimbursement levels, if carefully managed, can
maintain a flow of innovative products without
overpaying for their benefits.
KEY PARAMETERS OF THE PROPOSED
DESIGN
The success of the proposed reference pricing
reform will largely depend on the quality of its
design and implementation. Six key parameters
have been analysed below in order to permit a
more comprehensive evaluation of the proposal
and to accelerate progress towards a more
sustainable pricing model (see Figure 6).
FIGURE 6
1. Data sources. To ensure that prostheses
benefit benchmarks remain accurate and relevant,
the Australian Government could consider
adopting a PBS-style approach, wherein
manufacturers must provide reference price
points from other countries as part of their
submission to the TGA or PLAC. The PLAC should
define confidence criteria to determine when a
benchmark may be used, and assess this
independent of industry input. The inclusion of
manufacturer catalogue numbers for each item in
the Prostheses List would also facilitate cross-
referencing.
If a PBS-style approach is unachievable, a
secondary method of determining benchmarks
would be to identify target systems by evaluating
three criteria: their performance in achieving
best-in-class benefit levels, their degree of
comparability with the Australian health system,
and the availability of comprehensive data. An
initial assessment suggested that high-potential
15
systems include the Australian public system, the
U.K., France, Spain, Japan, large U.S. health
systems, and/or Sweden. Appendix B includes a
case study illustrating the availability of
comparable data for France.
As next steps, it is proposed that the
Australian Government explore the PBS
model of soliticing reference data from
manufacturers, as well as looking into
public and private sources of benchmark
data.
2. Calculation methodology. Several formulae
are employed for reference pricing worldwide,
typically at the product level. The most common
are average, median, or minimum prices from the
benchmark set. It is proposed that reimbursement
levels be set to the minimum benchmark price
achieved in comparable systems, in order to
ensure that consumers are paying efficient prices
for prostheses. Where data is not available for a
given product, three options exist: either the
manufacturer can supply reference prices as
described above, or prices of clinically equivalent
products can be used, or similar products may be
used as a starting point, with the supplier asked to
justify any price premium. A mechanism should
be added to adjust for currency fluctuations. The
experience of other international reference pricing
systems indicates that average exchange rates
from the past three years should be used.29
As a next step, the Australian Government
could define the formula which will be
employed – potentially adopting the
common minimum-of-comparable-systems
formula.
3. Integration with current pricing levels.
To smoothly progress towards full benchmark
pricing, it is proposed that the PLAC define both
current and target reimbursement levels for each
product. A simple step-down mechanism can then
be used to define interim reimbursement levels
during the transition period. For instance, the first
change to reimbursement levels could close half of
the gap between current and target
reimbursement levels, with the second half closed
over the following one to two years. Exceptional
cases, such as brand-new products, may be
assessed separately, although clear guidelines
should be set to ensure that this channel is limited
to less than 5 percent of submissions.
As a next step, the Australian Government
could define the step-down function to
smoothly move reimbursement levels to
benchmark in the near-term.
4. Operating model. Under a reference pricing
scheme, the PLAC would function with a narrower
focus of activities. Its price-setting functions
would be simplified to administer reference
pricing and rule on exceptional cases. The PLAC’s
composition and interaction points with industry
could be restructured to ensure that
reimbursement levels are set objectively as
intended. This would involve a rebalancing to
ensure equal representation of insurers to
combined manufacturers and providers (who are
frequently aligned), with a dominant
representation of health economists and
clinicians. Manufacturers would be invited to
contribute input to the process via three clear
steps – first by providing information during the
submission, then by presenting to the PLAC prior
to price-setting for high-spend products, and
finally by choosing whether or not to accept the
set benefit level.
The final proposed change would be to strengthen
the delisting role of the PLAC. Under the current
model, products are rarely delisted and outcomes
may be compromised by clinicians continuing to
use obsolete products. This is discussed further in
the ‘Complementary recommendations’ section
below. Patent expiration could be another trigger
for review of relative clinical effectiveness and
reimbursement level-setting.
As a next step, the Australian Government
could refine the mandate, composition and
processes of the PLAC in collaboration
with affected stakeholders.
5. Governance structure. A steering
committee of five members (three senior
policymakers and representatives from the
Medical Technology Association of Australia and
Private Healthcare Australia) should be
16
established to review progress 2 months before
the release of each Prostheses List. A balanced
scorecard of performance metrics should be
established to assess progress on average
reduction of benefit levels, maintenance of
adequate supply, control of gap payments, PLAC
backlog, overhead cost of PLAC, and delisting of
obsolete products.
As a next step, the Australian Government
could establish this body, including a
charter and performance scorecard.
6. Sequence of roll out. It is proposed that the
3-year timeline described above commence in
May 2016, via inclusion in the national budget.
Reimbursement levels should be adjusted as of
the August 2016 Prostheses List for all products
with reference prices meeting the defined
confidence criteria. The benchmarking should
initially focus on setting the right prices for the
500 prostheses that comprise 75 percent of total
expenditure. The set of products with reference
prices should be re-evaluated six weeks before the
release of each Prostheses List to ensure that
benchmarks are incorporated as soon as possible.
As a next step, the Australian Government
could lay out a timeline of key milestones,
objectives and priorities for the
implementation of reference pricing.
To summarise, we propose that the Australian
Government develop a reference pricing scheme
based on domestic and international benchmarks
from May 2016 to 2019. The key success factors
include a robust methodology to obtain and
calculate reference prices, a more objective
process and team composition for price-setting,
and a clear roll-out plan for smooth and
predictable change. This investment would be
amply justified by the benefits to consumers and
government, and would bring Australia’s pricing
practices and performance in line with other
developed countries.
17
Broader vision of a best-in-class health system
RATIONALE FOR BROADER REFORM
While the reference pricing model outlined above
addresses the primary challenge of price
disparities between Australia and peer health
systems, three major inefficiencies would remain
unresolved:
■ Manufacturers would continue to operate
with limited incentives for price
competition. Central determination of
benefit levels would lead manufacturers to
negotiate with the Australian Government
for higher prices, but to otherwise maximise
pricing to providers.
■ Knowledge would remain asymmetrical
regarding the relative merits of the
prostheses available, limiting providers’
ability to choose the optimal prosthesis for
any given situation.
■ Providers would have no incentive to ensure
that cost-effectiveness is factored into
prosthesis selection.
A value-based reimbursement model can more
effectively align incentives around selecting the
right product for the right patient. Numerous
health systems around the world have integrated
the cost of prostheses into a broader episode of
care, creating strong incentives for providers to
improve both outcomes and cost-effectiveness.
Broadly speaking, two types of ‘value-based
reimbursement models’ can be considered:
reforms can target episode/unit cost
management, or take on the holistic management
of utilisation and total cost of care. As presented
earlier (Figure 1), the market appears to have
responded to fixed reimbursement levels
by increasing volume utilisation following the re-
introduction of the Prostheses List. This suggests
that the Australian healthcare system could
benefit from a holistic solution to address the
utilisation of healthcare resources. However, this
paper will focus on potential reimbursement
mechanisms to control unit costs within each
episode of care, as these measures are likely to be
more readily implemented and drive near-term
impact.
Various models have been adopted abroad. For
instance, France, Germany, the US and the UK all
generally embed prosthesis reimbursement into
Diagnosis-Related Group (DRG) episodes (see the
France example in sidebar). More recently,
American bundled payment programs are
integrating prostheses payments into an episode
of care, negotiated by HMOs, providers and GPOs.
Spain includes prostheses costs into hospitals’
global budgets. Sweden has instituted a
centralised program for value-based
reimbursement, including significant narrowing
of reimbursed products and standard follow-up
on orthopaedic cases.
ONE VISION FOR VALUE-BASED
REIMBURSEMENT
The basic concept of ‘paying for the package, not
for the piece’ is well-established; labour and other
costs are already integrated into a single DRG-
based reimbursement for procedures involving
prostheses, and DRG service weights are widely
used in the public sector for budgets and funding
allocation.
Integrating prostheses devices into a bundled
payment could unlock value by encouraging
competition among manufacturers, since
providers would no longer pass on product-
specific prices to insurers and would therefore be
incentivised to control procedure costs.
With the management of costs in the hands of the
providers, those providers that can both control
product proliferation and optimise clinician needs
in the context of medical device costs would
benefit. Hospitals that failed to control product
proliferation and/or struggled to engage clinicians
and manufacturers would see their financial
competitiveness decline. Critically, hospitals
would be required to engage more actively with
surgeons to balance the best outcomes for their
patient with their individual accountability for
cost to the hospital. The hospital would be
required to shift from being passive cost centres
18
(or even misaligned operators). The ensuing
clinical dialogue would be likely to improve costs
and patient outcomes.
Operationalising this solution appears very
feasible. Instead of relying on a Prostheses List to
set the minimum benefit per product, the
Australian Government could limit regulation to
requiring suppliers to agree to low- or zero-gaps
for patients on items that are listed. By legislating
this requirement, hospitals and manufacturers
would be pressed to agree on mutually satisfactory
prices and protect against consumer cost inflation.
The role of the PLAC would thus be limited to
obtaining agreement on gap conditions, and
identifying the link to a valid MBS item number.
Application for listing would be predicated by
approval by the TGA.
MBS item numbers seem preferable to DRGs as a
basis for prosthesis value funding. Some DRGs
contain several subtypes of procedures, which
may differ significantly in prosthetic device needs.
Hence, a single blended reimbursement level per
DRG for prostheses would be complex to
calculate, and some hospitals may ‘cherry pick’
subtypes with low prosthesis outlays. MBS items,
however, are much more granular and better-
suited to match prosthesis needs to a given
procedure. Furthermore, the Prostheses List
already includes a valid MBS item for each
prosthesis on the list.
The Australian Government may have a role to
play in ensuring fair determination of the
prosthesis value assigned to each MBS item.
These price points should be connected to
comparable benchmarks, while ensuring that
surgeon’s product choice is not unduly inhibited.
Regulation may also be required to determine the
regular revision of these values (e.g., refresh
benchmarks every two years) and to ensure that
procedures do not result in multiple MBS
numbers with prosthesis costs. Once the system
stabilises, a further de-regulation could see
insurers and providers independently negotiating
prosthesis values for each MBS item.
Such changes could also support the Australian
Government’s broader reform agenda. For
instance, the ongoing MBS review aims to
transform Medicare reimbursement into ‘a
contemporary tool for helping drive best practice
in healthcare, not just in primary care but across
the system … it could potentially change the way
treatment is organised for patients’, according to
Dr. Bruce Robinson, the review lead.30
POTENTIAL ADDITIONAL BENEFITS OF
EPISODE-BASED REIMBURSEMENT
Value-based reforms have been proven to improve
outcomes and cost-effectiveness by aligning
incentives in numerous health systems. For
instance, a Swedish university hospital reduced
waiting times by half, increased patient
satisfaction from 85 to 91 percent, and reduced
complications by 20 percent.31 The American CMS
is also building on successful pilots to mandate
bundled payments for hip and knee replacements
in 75 major geographies.32 Leading providers,
such as Brigham and Women’s, have collaborated
with surgeons to agree on three low-cost knee
prostheses, with only a few, clinically-justified
exceptions, reducing knee-implant costs by half.33
To illustrate the potential benefits for Australians,
two examples are developed below. First, a
comparison of hip prosthesis selection, and
second, an analysis of stent usage in Australia
versus international benchmark. In both cases,
incentives could more effectively motivate
decisions that improve both outcomes and cost-
effectiveness to bring Australian performance in
line with clinical benchmarks on product
selection. It is important to note that these
examples are illustrative and the impact of such
unit cost-based reimbursement reforms would
depend on the local patient population and latest
evidence-based treatment standards.
Australia’s current system aims to maximise
quality of outcomes by eliminating cost
considerations from prosthesis selection.
However, the example of total hip arthroplasty
(see Figure 7) illustrates how misaligned
incentives may be leading to suboptimal quality
and cost-effectiveness performance.
19
FIGURE 7
A comparative assessment of joint registries found
that Australian surgeons favour uncemented hip
prostheses to an unusually high degree. While
these enable higher throughput by reducing
operating time by up 20 minutes34, they tend to
have significantly higher price points than
cemented prostheses: a 2013 study in the BMJ
found average costs in the UK of £739 for a
cemented prosthesis versus £1697 for a
cementless prosthesis.35 Furthermore, most
research has found higher rates of revision in
uncemented prostheses.36 This may contribute to
the measured outcomes: Australia has higher
revision rates than available peers.37 This may be
partly due to the current incentive system, which
rewards surgeons for increasing procedure
volume, but not for achieving lower revision rates
or optimising cost.
Researchers have found that increasing usage of
uncemented prostheses may be due to ‘intensive
marketing of more expensive uncemented
implants.’38 Hence, the frequent presence of
manufacturer reps in Australian theatres may
help explain the high usage rates of these devices.
While a scan of European countries indicates that
medical device reps traditionally attend the
majority of procedures, the United States is
notable for its recent efforts to limit the influence
of reps; most hospitals now only allow medical
device reps to interact with the purchasing
department.39
As a second example, drug-eluting stents are
significantly more prevalent in Australia than in
other countries that have different reimbursement
models.
Drug eluting stents are often two or three times
more expensive than bare metal stent alternatives.
20
When first introduced into the market, they
appeared to bring benefits that sometimes
justified the price difference, however more recent
evidence suggests that these benefits were at least
overstated, and that they may even be less
effective than bare metal stents in certain
situations. A 2006 UK study found that drug-
eluting stents were acceptable on a cost/utility
basis in only 4 percent of cases.40
However, drug-eluting stents account for
~76 percent of stents used in Australian private
hospitals – above the public domestic benchmark
of 50 percent, and almost double the NSW
Guidelines of 40 percent.41 Based on the weighted
average difference in benefits, private stent spend
could be reduced by 20 to 30 percent if price
signals were introduced into the private market
that brought stent usage in line with public
practice (see Figure 8).
FIGURE 8
21
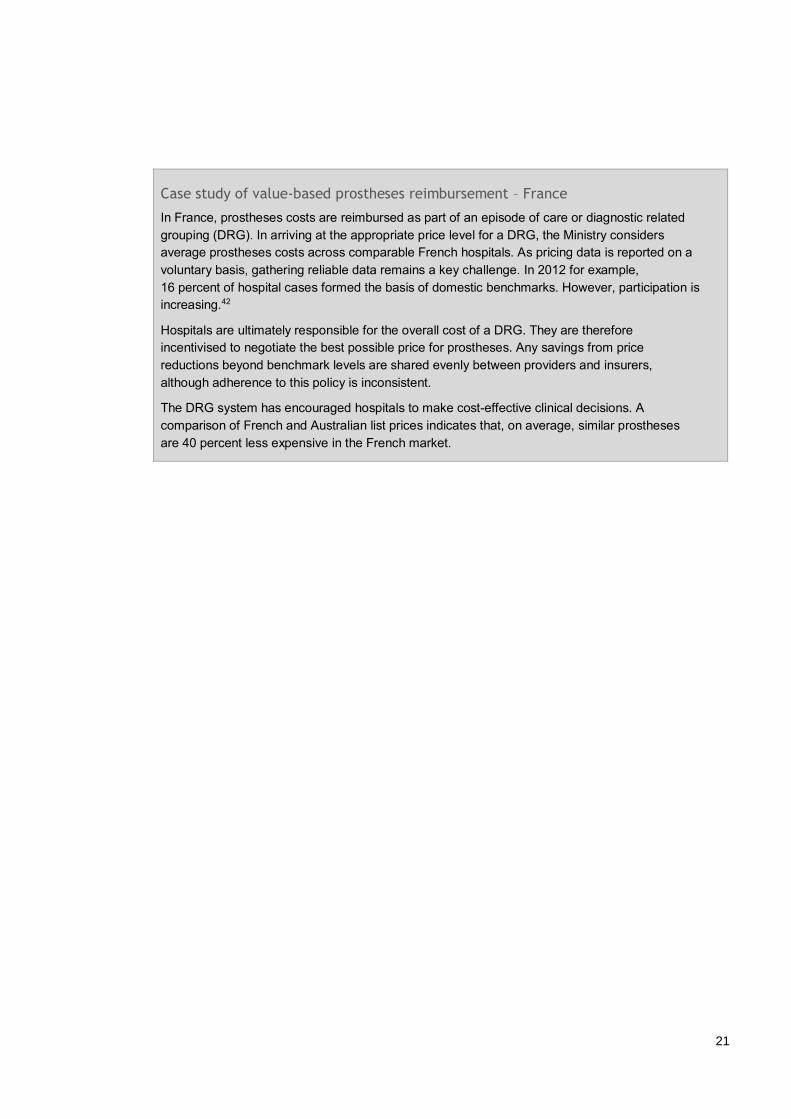
Case study of value-based prostheses reimbursement – France
In France, prostheses costs are reimbursed as part of an episode of care or diagnostic related grouping (DRG). In arriving at the appropriate price level for a DRG, the Ministry considers average prostheses costs across comparable French hospitals. As pricing data is reported on a voluntary basis, gathering reliable data remains a key challenge. In 2012 for example, 16 percent of hospital cases formed the basis of domestic benchmarks. However, participation is increasing.42
Hospitals are ultimately responsible for the overall cost of a DRG. They are therefore incentivised to negotiate the best possible price for prostheses. Any savings from price reductions beyond benchmark levels are shared evenly between providers and insurers, although adherence to this policy is inconsistent.
The DRG system has encouraged hospitals to make cost-effective clinical decisions. A comparison of French and Australian list prices indicates that, on average, similar prostheses are 40 percent less expensive in the French market.
22
Complementary recommendations
While this report focuses on mechanisms to
ensure benefit levels are set fairly and efficiently, a
cohesive reform package could also include the
following measures to improve clinical safety,
competition, and decision-making. Three
categories of complementary recommendations
are presented, addressing removal of
underperforming products, refining the scope of
the Prostheses List, and improving decision-
making processes, outlined below.
Remove underperforming products from the Prostheses List
Products with poor clinical outcomes should be
removed from the Prostheses List. However,
currently the list does not adequately safeguard
clinical safety and patient outcomes beyond the
initial listing stage. The following measures would
allow better assessment of the efficacy of
products:
■ Clinical effectiveness measures need to be
monitored, re-evaluated, and acted upon
– Items should be regularly reviewed to
ensure clinical safety and patient
outcomes
– A registry, similar to the National Joint
Replacement Registry, should be
established for high risk prosthesesvi
– Underperforming prostheses (e.g. those
with higher than acceptable revision
rates) should have their Australian
Register of Therapeutic Goods (ARTG)
certificate revoked
– Patients and surgeons should be better
informed through the establishment of
publicly-accessible comparative
effectiveness reviews
vi “High risk” refers to class 2A devices, class 3 devices, and active implantable cardiac devices.
■ Costs associated with product failures
should be met by manufacturers
– If a product fails or is recalled during the
guarantee or recall period, any
associated costs should be met by
manufacturers. Currently, hospitals have
little incentive to follow up product
guarantees and tend to bill insurers for
all revisions, regardless of failure reason.
– Manufacturers should be required to
have appropriate levels of insurance to
meet these costs in order to receive an
ARTG number or be registered on the
Prostheses List. This recommendation
responds to the recent high profile
example of the liquidation of Medical
Vision following the recall of PIP breast
implants.
Refine the scope of the Prostheses List
The Prostheses List needs to be better aligned
with its initial aim of regulating the benefit levels
for a specific category of medical products. It
should provide adequate information, on items
that are clearly defined as qualifying prosthesis
items (see Appendix C for suggested revisions to
the definition):
■ Commoditised items which are subject to
a high degree of competition should be
removed from the Prostheses List
– The current Prostheses List includes
over 10,000 items, many of which sit
outside the generally accepted definition
of ‘prostheses’
– The original intent of the List was to
regulate only those products which were
‘advancing the edge of their discipline’,
‘surgically implanted’, and ‘expensive’,
23
however the List has expanded to
include items that do not require strictly
regulated pricing
– As a result, market forces are constricted
for many commodity products (e.g.
gauze or sutures) that would benefit
from increased competition
– Furthermore, some products are already
included in theatre fees/episodic
payments/other hospital payments, yet
are also included on the Prostheses List.
This results in private health insurers
paying for the same item twice
■ All relevant information, including
catalogue numbers and warranties should
be included on the List to better identify the
prostheses covered by a billing code
– Manufacturer catalogue numbers would
be of particular utility in facilitating
reference pricing
– Hospitals should be able to identify
when product failure falls within
manufacturer warranty periods
Improve the decision making process
The structure and processes of PLAC decision-
making should be fair and efficient – it needs to
respond to changing markets and technological
innovation. Steps towards such improvement
could include:
■ The same clinical assessment process
should be applied to incremental changes to
currently listed items as to new items for
listing
– The current system creates unfair
advantages for established
manufacturers over manufacturers
attempting to create a generic version of
an existing product
■ Private health insurers’ representation on
the PLAC should be increased from two to
four members
– There are currently 16 PLAC members.
Alongside PHI representatives, there are
two hospital representatives, four
doctors, two sponsor representatives,
one consumer representative, two
Department of Veterans’ Affairs
representatives, two health economists
and the chair
– It is appropriate for private health
insurers to have greater input into the
pricing of prostheses given that they
ultimately bear the cost of PLAC
decisions
CONCLUSION
Now is the time to reform prostheses pricing.
Private health insurance is becoming increasingly
unaffordable in a challenging financial
environment, putting more pressure on the public
system. Australians are paying nearly twice the
benchmark price for prostheses, reducing
consumers’ disposable annual income by $800
million. Furthermore, setting efficient benefit
levels for prostheses could also alleviate up to
$276 million in financial pressure on the public
system by making private insurance more
affordable. All that is needed to unlock this
potential is to enhance the PLAC with a fair and
effective reference pricing scheme, bringing
Australia in line with other health systems.
In the longer term, Australians may also benefit
from the aligned incentives and increased
competition of a value-based reimbursement
model. Manufacturers, providers, surgeons,
insurers and patients alike could better partner to
ensure that the right prosthesis is being implanted
into the right patient at the right price. Embarking
on such a reform would require significant
consultation with all stakeholders, to ensure that
quality of care remains at the heart of clinical
decision-making and that the desired outcomes
are achieved.
By rapidly implementing an effective reference
pricing scheme in the short-term, and creating a
shared long-term vision for reform, the Australian
Government can take a significant and low-risk
step towards making healthcare more affordable
for all Australians.
24
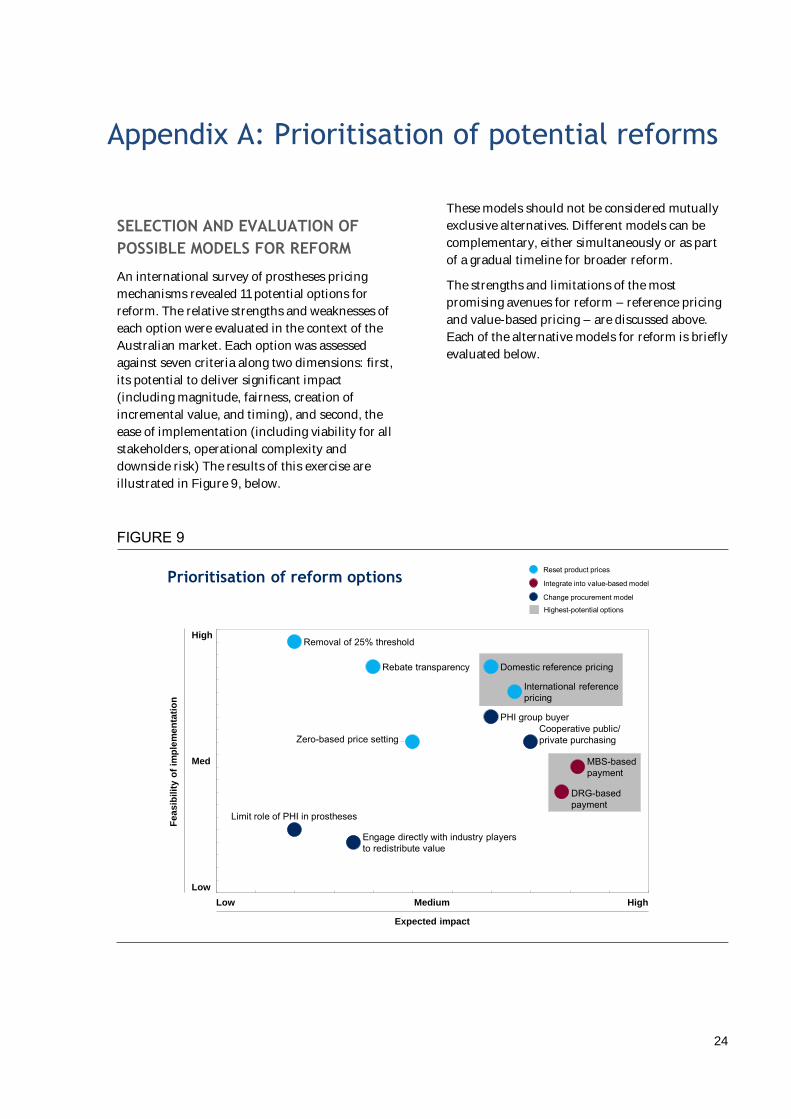
Appendix A: Prioritisation of potential reforms
SELECTION AND EVALUATION OF
POSSIBLE MODELS FOR REFORM
An international survey of prostheses pricing
mechanisms revealed 11 potential options for
reform. The relative strengths and weaknesses of
each option were evaluated in the context of the
Australian market. Each option was assessed
against seven criteria along two dimensions: first,
its potential to deliver significant impact
(including magnitude, fairness, creation of
incremental value, and timing), and second, the
ease of implementation (including viability for all
stakeholders, operational complexity and
downside risk) The results of this exercise are
illustrated in Figure 9, below.
These models should not be considered mutually
exclusive alternatives. Different models can be
complementary, either simultaneously or as part
of a gradual timeline for broader reform.
The strengths and limitations of the most
promising avenues for reform – reference pricing
and value-based pricing – are discussed above.
Each of the alternative models for reform is briefly
evaluated below.
FIGURE 9
Prioritisation of reform options
Expected impact
HighLow Medium
High
Med
Low
Fe
as
ibil
ity o
f im
ple
me
nta
tio
n
Zero-based price setting
Domestic reference pricing
Engage directly with industry playersto redistribute value
PHI group buyer
International referencepricing
DRG-basedpayment
Limit role of PHI in prostheses
Cooperative public/private purchasing
MBS-basedpayment
Removal of 25% threshold
Rebate transparency
Integrate into value-based model
Change procurement model
Reset product prices
Highest-potential options
25
ZERO-BASED PRICING
Zero-based pricing would retain the Prostheses
List while re-setting benefit levels based on a close
interrogation of manufacturer costs. This
mechanism has the potential to significantly
reduce prostheses benefit levels, limiting the
scope for rebates to providers and excess margins
for manufacturers.
However, this model would be difficult to
operationalise as it depends on manufacturers to
divulge their cost of production. The burden of
securing accurate cost data would primarily fall on
the PLAC which is already tasked with a
significant workload. Furthermore, there is a
significant downside risk to this proposal.
Manufacturers would have a strong incentive to
overstate costs, effectively ‘padding’ the minimum
benefit amount and concealing their actual cost
base to maximise profitability.
PRICE TRANSPARENCY
Price transparency requires providers to disclose
the actual prices paid for prostheses. Although
this model does not address inflated manufacturer
margins, hospitals would no longer be able retain
excess value in the form of rebates. If hospitals
regularly negotiated discounts on Prostheses List
benefit levels, the PLAC would be expected to use
this disclosed information to gradually reduce
minimum benefits.
In practice, providers would be unlikely to reveal
the full extent of discounts on minimum benefit
amounts. Due to the prevalence of block
purchasing arrangements, it would be difficult to
identify savings on any particular list item.
Furthermore, excess margins to providers may
take the form of non-cash incentives such as free
consumables and product representative support
in the operating room.
REMOVAL OF THE 25 PERCENT
MARKET SHARE THRESHOLD
Removing the 25 percent threshold would allow
reimbursement levels to reflect the prices of small,
low-cost manufacturers. Currently the PLAC uses
the prices of manufacturers with a minimum
25 percent market share to determine the
minimum insurer reimbursements. This threshold
is designed to ensure that benefits are set at a level
where the market will be supplied. However, the
threshold currently operates to entrench large,
incumbent manufacturers and prevent newer,
low-cost manufacturers from putting downward
pressure on benefit levels.
This measure may be a worthwhile complement,
but alone is unlikely to close the gap to
benchmark systems. Research and interviews
indicate that there are a limited number of
manufacturers who are attempting to compete on
price. The price impact of low cost manufacturers
entering the market would also be moderated by
the need to reliably supply the market and ensure
equivalent quality.
FORMATION OF COOPERATIVE
PURCHASING AGREEMENTS BETWEEN
PUBLIC AND PRIVATE HOSPITALS
Allowing public hospitals to purchase on behalf of
their private counterparts would allow private
patients to share in the discounts negotiated by
the public system. Given that prostheses
purchased by the public system are approximately
40 percent less expensive than Prostheses List
benefit levels, this would offer significant savings
to consumers. Additional savings could be driven
by the combined bargaining power of the public
and private system.
However, this course of action is unlikely to
garner the necessary support from the public
system. By adding high-price private volumes to
low-price public volumes, manufacturers could
demand higher average prices than current public
levels. One potential path forward would be for
motivated public buyers to explore the
incremental discounts that manufacturers would
be willing to offer for the additional volume of
private insurers.
FORMATION OF GPO BY PRIVATE
HEALTH INSURERS
The formation of a group purchasing organisation
(GPO) by private health insurers would better
26
align incentives by placing purchasing decisions in
the hands of payers. This proposal addresses the
core structural disadvantage of the current model,
which creates little incentive to reduce costs by
those who control purchasing decisions (clinicians
and hospitals).
There is, however, a sound rationale for the
current basic purchasing structure. First, hospitals
are better able to respond to the clinical needs of
doctors and negotiate appropriate product choice.
Product purchasing that is further removed from
practitioners may face resistance from doctors.
Secondly, there are potential legal complications
to this model. PHIs would need to mobilise their
combined purchasing power to avoid the rise in
benefit levels that occurred in 2001-2004 (where
PHIs negotiated individually with large multi-
national manufacturers). This would require
active collaboration with regulators to ensure that
Competition Law is fully respected.
LIMIT ROLE OF PRIVATE HEALTH
INSURANCE REIMBURSEMENT IN
PROSTHESES
Given that prostheses tend to be less expensive in
public hospitals, prostheses spending could be
reduced by shifting an increasing share of
prosthesis activities to the public system. However
this reform would likely have wide-reaching,
negative effects on the health system. Lengthy
waiting times for elective procedures would only
increase, private hospitals would lose a source of
revenue, public healthcare expenditure would
increase, and private insurance would become less
attractive for many consumers.
ENGAGE WITH OTHER INDUSTRY
PLAYERS FOR A MORE EQUITABLE
DIVISION OF VALUE
Cooperation between private health insurers and
manufacturers could reduce excess margins and
pass on savings to consumers. For example,
manufacturers could agree to pass on a proportion
of costs savings to insurers, rather than providing
rebates to hospitals.
However, any savings would be limited to excess
margins currently flowing to providers. There
would be little incentive for manufacturers to
voluntarily reduce their own margins. This is only
exacerbated by the fact that individual health
insurers with no control over product choice
would be in a weak bargaining position relative to
manufacturers.
27
Appendix B: Benchmarking methodology
Given the important consequence to the industry
and government of any price benchmarks
published in this report, every effort was made to
take a rigorous and data-driven approach. Further
detail is provided below on the sources and
methods used for each stage of the benchmarking
analysis.
AUSTRALIAN PRIVATE BENEFITS
Prices paid by private health insurers in Australia
were drawn from the August 2015 Australian
prostheses list, available online at:
http://www.health.gov.au/internet/main/publish
ing.nsf/content/prostheses-list-pdf.htm.
WEIGHTING BY SPEND
In order to arrive at an accurate comparison, each
item’s minimum benefit was weighted by the
overall spend on that item, as measured through
aggregated 2014 Australian private health insurer
claims data. This process ensured that items could
not be deliberately selected to bias the results
towards products with extreme price differentials.
DOMESTIC BENCHMARKS
Western Australia Health public hospital
procurement data was used as an indicator of
prostheses prices in Australian public hospitals.
Spend-weighted prices for a basket of
41 prostheses SKUs were compared, to arrive at
an average benchmark. Of the 41 SKUs,
Prostheses List process were lower for only two
SKUs and higher for the other 39 – ranging from
being 0.9 to 5.2 times the level of the Western
Australia Health price points. As publicly available
Western Australia data is limited to particular
categories, only cardiac, ophthalmic and
orthopaedic prostheses were examined. These
three categories represent approximately 34% of
overall private health insurance prostheses
expenditure. It should be noted that the data is
currently limited to Western Australia Health. It is
possible that public hospital buying groups in
more populous states (e.g. Health Purchasing
Victoria) have different - and potentially lower -
prices, but information is not yet publically
available for these groups.
INTERNATIONAL BENCHMARKS
Prostheses pricing data from the United States,
New Zealand, Spain, Japan, France and Italy was
used to determine an international benchmark of
prostheses prices. A spend-weighted basket of
50 prostheses SKUs from hip, cardiac, and general
miscellaneous categories was analysed,
representing 42% of total prostheses spend.
A rolling 12-month average was used to determine
each exchange rate used in the analysis. Of the
50 SKUs, Prostheses List prices were only lower
for one SKU and higher for the other 49 – ranging
from being 0.8 to 5.3 times the level of
international price points. Given the benchmarks
across the countries provided a wide range of data
points, a weighting was assigned to each based on
the number of items making up the sample, the
representation of prostheses categories in the
sample, and the country’s level of comparability
with Australia, to arrive at an overall benchmark.
Case example: Referencing the French Prostheses List
France provides both comparable and accessible data that could be used in international reference pricing. The French system employs a DRG model for financing medical devices, informed by a publically available benchmarked price list called the SPP. The list includes both general items (for commodities), and manufacturer-specific items (for products that are demonstrated to be materially distinct from the closest device in their category). It is available online - searchable by unique code and category - as well as being downloadable in full.
The SPP is divided into four overall sections, of which section 3 is a direct match to the Australian Prostheses List:
Title I: Medical devices for treatments and devices for life care, dietetic food and dressing articles
Title II: External prostheses and orthotics
Title III: Implantable medical devices & human tissue
Title IV: Physical handicap vehicles
Under Title III, items are first categorised by material type (ie. disposable synthetic; disposable derivatives and animal tissue; human tissue; active devices), then divided by area of medical specialty. This categorisation differs slightly from the Australian Prostheses List, which divides directly by area of medical specialty (see Figure 10), but is similar enough to enable relatively straightforward matching of items using the French online category sorting tool, and/or keyword searches. While neither the French nor the Australian list uses a common internationally recognised manufacturer code, once a match is found then the French and Australian unique codes can be linked, to enable continued tracking and comparison.
For any group looking to compare French and Australian item prices, the suggested process to follow would be:
1. Search for each item by manufacturer name and description in the French list. If a particular manufacturer item line is included, use this price.
2. If there is no manufacturer-specific item, search for only the generic description match, and use this price.
3. Once a match has been found, link the unique French code with the unique Australian billing code, to allow for continued tracking and comparison.
It is recommended that the initial matching process outlined above be completed by someone with both French and English skills, and medical knowledge (such as a bilingual physician)
29
FIGURE 10
Comparing the French and Australian Prostheses List structure
Australian List
Prostheses List
▪ Title III: implantable medical devices & human tissue– Chapter 1: Disposable - synthetic origin