21
© 2010 Pearson Addison- Wesley Chapter Eight Copyright 2009 Pearson Education, Inc. Publishing as 1 Chapter 8-A Pricing and Output Decisions: Perfect Competition and Monopoly
| Date post: | 03-Jan-2016 |
| Category: |
Documents |
| Upload: | stella-martin |
| View: | 213 times |
| Download: | 0 times |

© 2010 Pearson Addison-Wesley
Chapter Eight Copyright 2009 Pearson Education, Inc. Publishing as Prentice Hall.
1
Chapter 8-A
Pricing and Output Decisions:Perfect Competition
and Monopoly
© 2010 Pearson Addison-Wesley
What Is Perfect Competition?
Perfect competition is an industry in which
Many firms sell identical products to many buyers.
There are no restrictions to entry into the industry.
Established firms have no advantages over new ones.
Sellers and buyers are well informed about prices.

© 2010 Pearson Addison-Wesley
How Perfect Competition Arises
Perfect competition arises:
When firm’s minimum efficient scale is small relative to market demand so there is room for many firms in the industry.
And when each firm is perceived to produce a good or service that has no unique characteristics, so consumers don’t care which firm they buy from.
What Is Perfect Competition?

© 2010 Pearson Addison-Wesley
Price Takers
In perfect competition, each firm is a price taker.
A price taker is a firm that cannot influence the price of a good or service.
No single firm can influence the price—it must “take” the equilibrium market price.
Each firm’s output is a perfect substitute for the output of the other firms, so the demand for each firm’s output is perfectly elastic.
What Is Perfect Competition?
© 2010 Pearson Addison-Wesley
Economic Profit and Revenue
The goal of each firm is to maximize economic profit, which equals total revenue minus total cost.
Total cost is the opportunity cost of production, which includes normal profit.
A firm’s total revenue equals price, P, multiplied by quantity sold, Q, or P × Q.
A firm’s marginal revenue is the change in total revenue that results from a one-unit increase in the quantity sold.
What Is Perfect Competition?
© 2010 Pearson Addison-Wesley
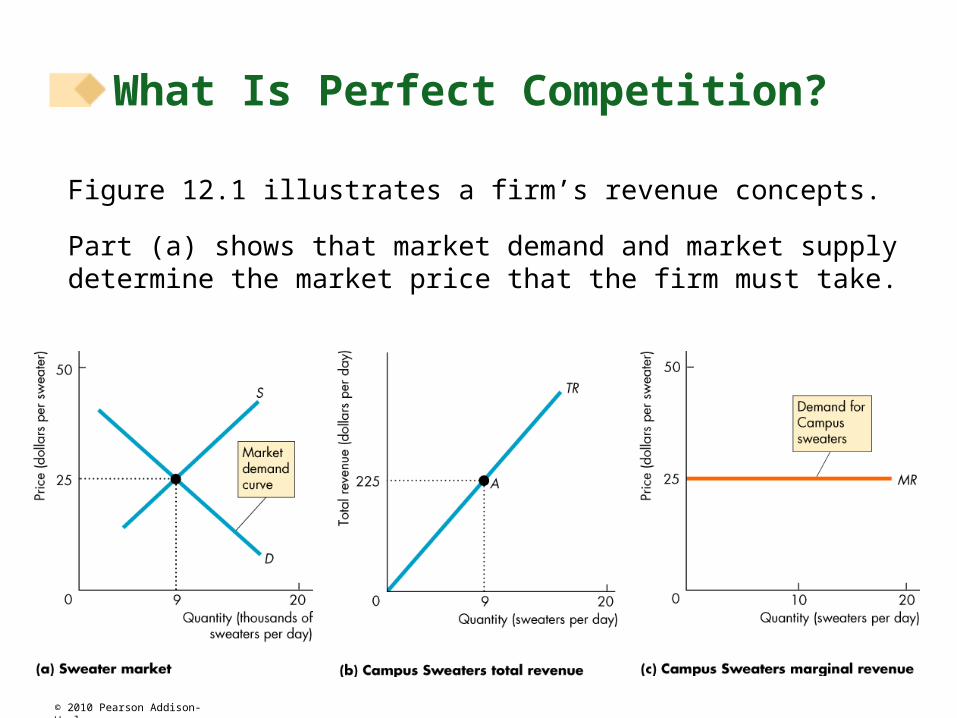
Figure 12.1 illustrates a firm’s revenue concepts.
Part (a) shows that market demand and market supply determine the market price that the firm must take.
What Is Perfect Competition?

© 2010 Pearson Addison-Wesley
Figure 12.1(b) shows the firm’s total revenue curve (TR)—the relationship between total revenue and quantity sold.
What Is Perfect Competition?

© 2010 Pearson Addison-Wesley
Figure 12.1(c) shows the marginal revenue curve (MR).
The firm can sell any quantity it chooses at the market price, so marginal revenue equals price and the demand curve for the firm’s product is horizontal at the market price.
What Is Perfect Competition?
© 2010 Pearson Addison-Wesley
The demand for a firm’s product is perfectly elastic because one firm’s sweater is a perfect substitute for the sweater of another firm.
The market demand is not perfectly elastic because a sweater is a substitute for some other good.
What Is Perfect Competition?

© 2010 Pearson Addison-Wesley
A perfectly competitive firm’s goal is to make maximum economic profit, given the constraints it faces.
So the firm must decide:
1. How to produce at minimum cost
2. What quantity to produce
3. Whether to enter or exit a market
We start by looking at the firm’s output decision.
What Is Perfect Competition?
© 2010 Pearson Addison-Wesley
Profit-Maximizing Output
A perfectly competitive firm chooses the output that maximizes its economic profit.
One way to find the profit-maximizing output is to look at the firm’s the total revenue and total cost curves.
Figure 12.2 on the next slide looks at these curves along with the firm’s total profit curve.
The Firm’s Output Decision
© 2010 Pearson Addison-Wesley
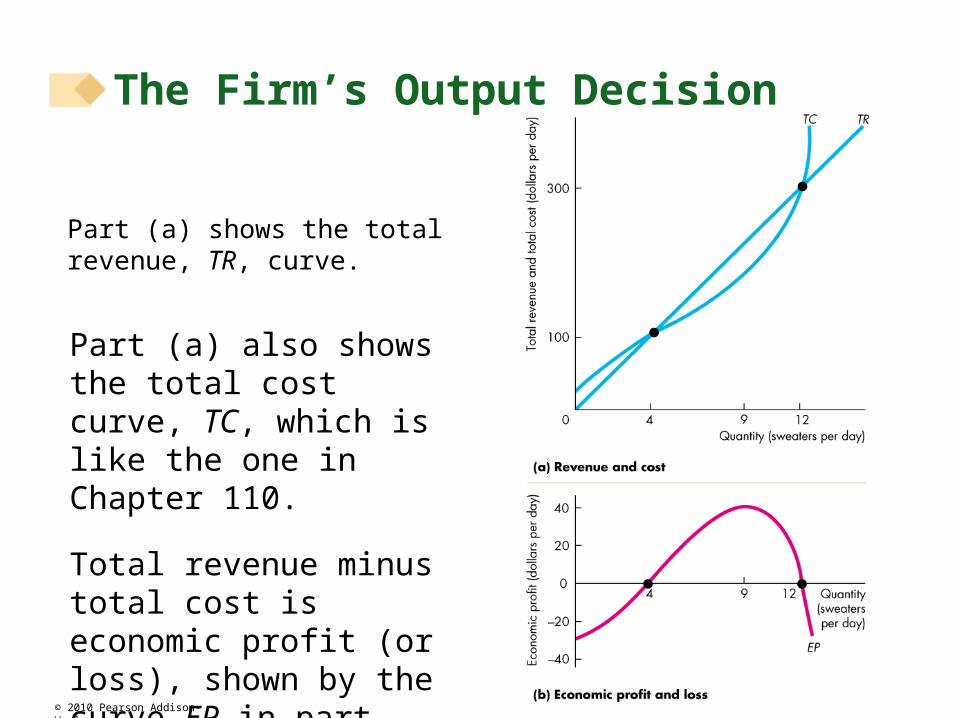
Part (a) shows the total revenue, TR, curve.
Part (a) also shows the total cost curve, TC, which is like the one in Chapter 110.
Total revenue minus total cost is economic profit (or loss), shown by the curve EP in part (b).
The Firm’s Output Decision
© 2010 Pearson Addison-Wesley
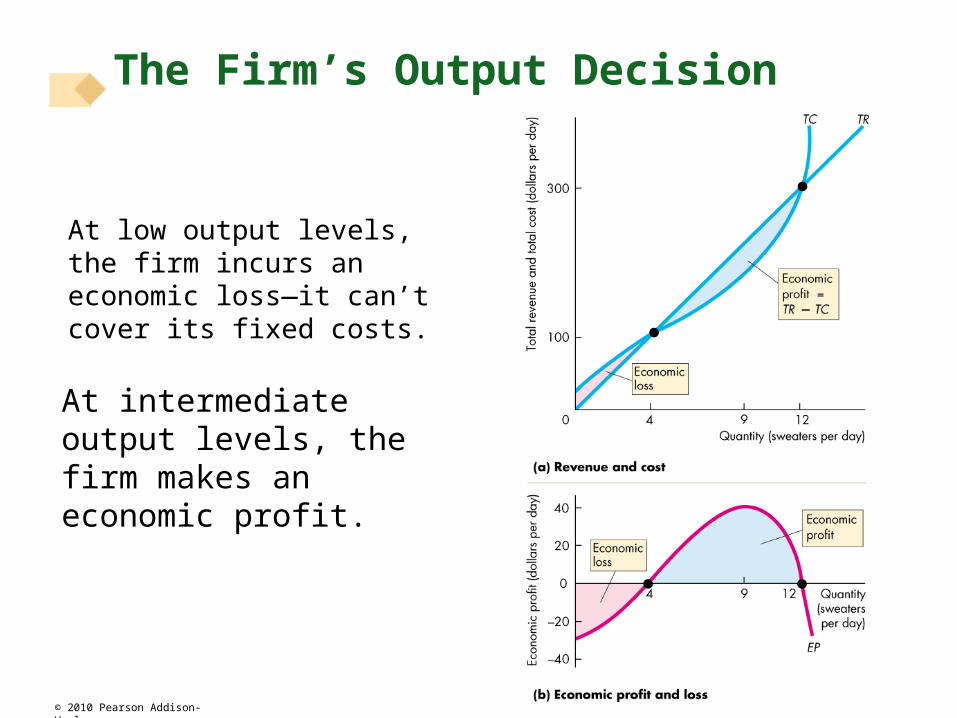
At low output levels, the firm incurs an economic loss—it can’t cover its fixed costs.
At intermediate output levels, the firm makes an economic profit.
The Firm’s Output Decision
© 2010 Pearson Addison-Wesley
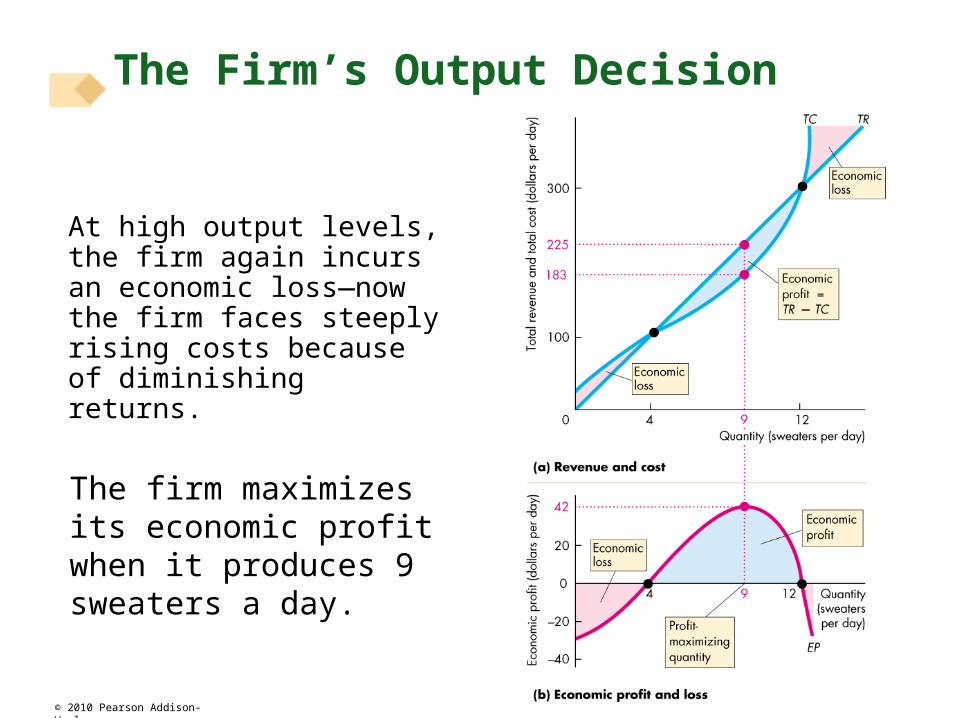
At high output levels, the firm again incurs an economic loss—now the firm faces steeply rising costs because of diminishing returns.
The firm maximizes its economic profit when it produces 9 sweaters a day.
The Firm’s Output Decision

© 2010 Pearson Addison-Wesley
If MR > MC, economic profit increases if output increases.
If MR < MC, economic profit decreases if output increases.
If MR = MC, economic profit decreases if output changes in either direction, so economic profit is maximized.
The Firm’s Output Decision

© 2010 Pearson Addison-Wesley
Temporary Shutdown Decision
If the firm makes an economic loss it must decide to exit the market or to stay in the market.
If the firm decides to stay in the market, it must decide whether to produce something or to shut down temporarily.
The decision will be the one that minimizes the firm’s loss.
The Firm’s Output Decision
© 2010 Pearson Addison-Wesley
Loss Comparison
The firm’s loss equals total fixed cost (TFC) plus total variable cost (TVC) minus total revenue (TR).
Economic loss = TFC + TVC TR
= TFC + (AVC P) × Q
If the firm shuts down, Q is 0 and the firm still has to pay its TFC.
So the firm incurs an economic loss equal to TFC.
This economic loss is the largest that the firm must bear.
The Firm’s Output Decision
© 2010 Pearson Addison-Wesley
A firm’s shutdown point is the price and quantity at which it is indifferent between producing and shutting down.
This point is where AVC is at its minimum.
It is also the point at which the MC curve crosses the AVC curve.
At the shutdown point, the firm is indifferent between producing and shutting down temporarily.
The firm incurs a loss equal to TFC from either action.
The Firm’s Output Decision
© 2010 Pearson Addison-Wesley
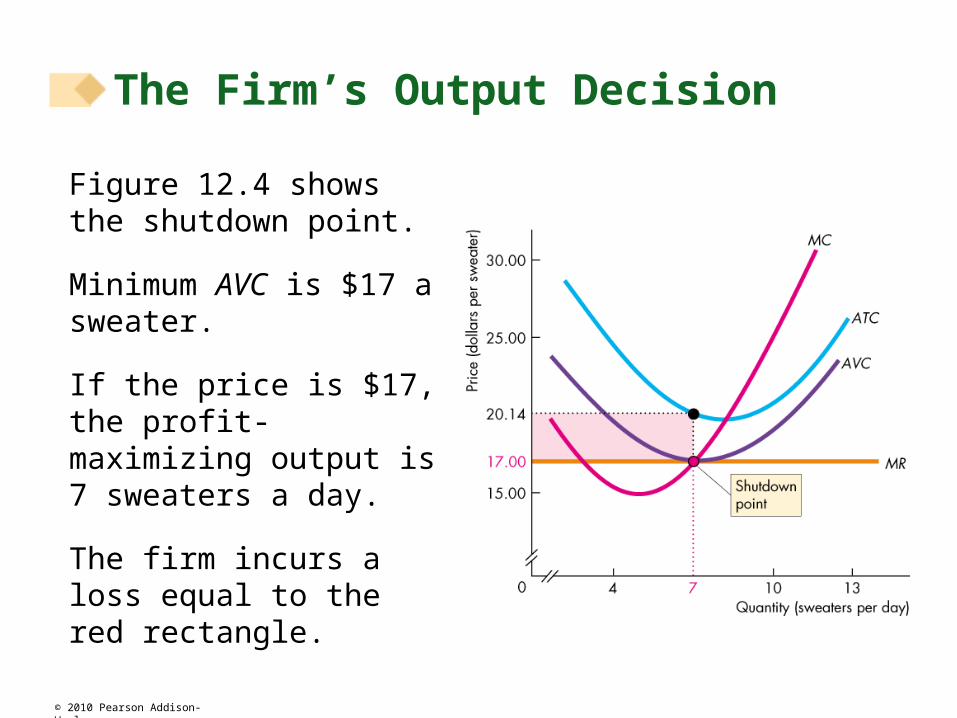
Figure 12.4 shows the shutdown point.
Minimum AVC is $17 a sweater.
If the price is $17, the profit-maximizing output is 7 sweaters a day.
The firm incurs a loss equal to the red rectangle.
The Firm’s Output Decision
© 2010 Pearson Addison-Wesley
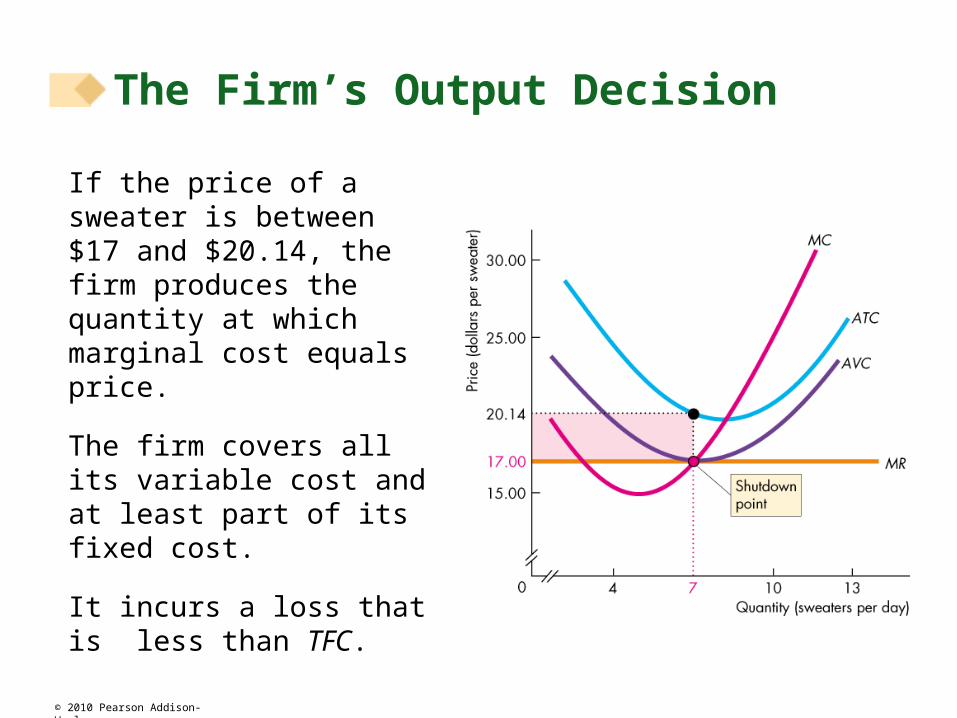
If the price of a sweater is between $17 and $20.14, the firm produces the quantity at which marginal cost equals price.
The firm covers all its variable cost and at least part of its fixed cost.
It incurs a loss that is less than TFC.
The Firm’s Output Decision

© 2010 Pearson Addison-Wesley
In part (c) price is less than average total cost and the firm incurs an economic loss—economic profit is negative.
Output, Price, and Profit in the Short Run


