Page 1
© 2013, Genentech
ReportingTools: an automated result processing toolkit for high throughput genomic analyses
Jessica Larson, PhD
Computational Biologist
Genentech, Inc.
[email protected]
July 19 2013
Page 2
Outline
(1) ReportingTools introduction and basics
(2) ReportingTools and microarray experiments
(3) ReportingTools and RNA-seq experiments
(4) ReportingTools and knitr
(5) ReportingTools and shiny
2
Page 4
Example output and code from the package vignettes
http://research-pub.gene.com/ReportingTools/
4
Page 5
Publishing a data.frame
5
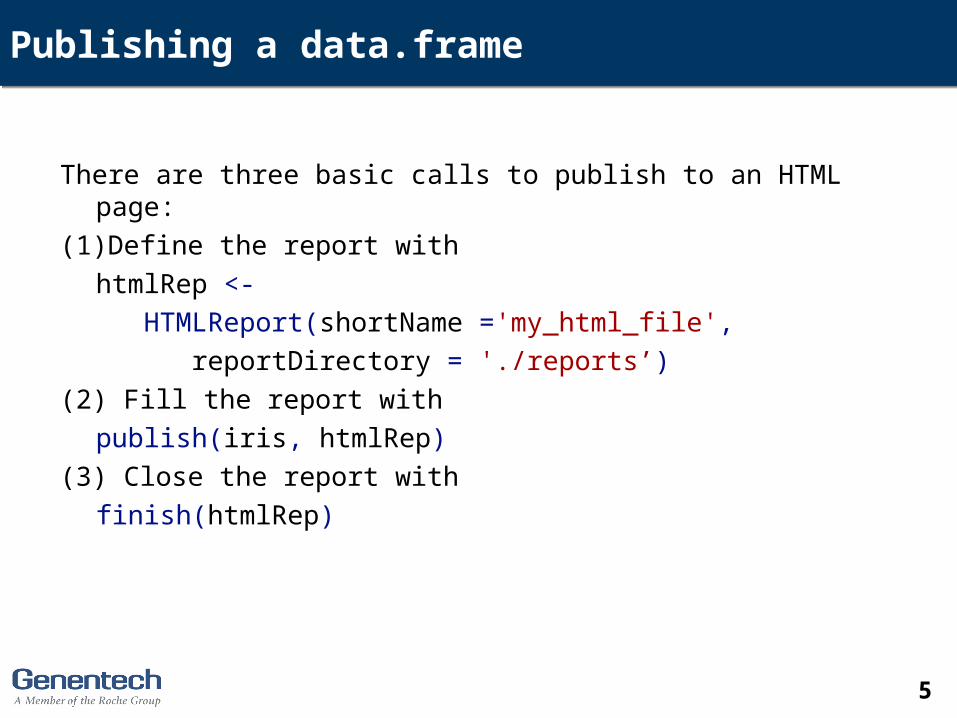
There are three basic calls to publish to an HTML page:
(1)Define the report with
htmlRep <-
HTMLReport(shortName ='my_html_file',
reportDirectory = './reports’)
(2) Fill the report with
publish(iris, htmlRep)
(3) Close the report with
finish(htmlRep)
Page 6
Publishing the Iris data
6
library(ReportingTools)
data(iris)
htmlRep <- HTMLReport(shortName = 'my_html_file',
reportDirectory = './reports')
publish(iris, htmlRep)
finish(htmlRep)
Page 7
More basics with the Iris data
I. Adding plots (including basic, lattice, .png, .pdf)
II. Adding text (including links to other pages)
III. Adding additional tables
IV. Modify data frames upon publication (.modifyDF)
V. Publishing to CSV files (CSVFile)
7
Page 8
Using .modifyDF
8
htmlRep <- HTMLReport(shortName = 'my_html_file_modify', title = 'Manipulating the data frame directly before
publishing’, reportDirectory = './reports')publish(iris, htmlRep, numdigits = 1, .modifyDF = list(roundLength, makeImages, addSpeciesLink, cleanUpDF))finish(htmlRep)
Page 9
Outline
(1) ReportingTools introduction and basics
(2) ReportingTools and microarray experiments
(3) ReportingTools and RNA-seq experiments
(4) ReportingTools and knitr
(5) ReportingTools and shiny
9
Page 10
Microarray examples
I. Publish output from limma (add new images and links)
II. Publish GO and PFAM analysis output
III. Publish gene sets
IV. Create index pages
10
Page 11
Outline
(1) ReportingTools introduction and basics
(2) ReportingTools and microarray experiments
(3) ReportingTools and RNA-seq experiments
(4) ReportingTools and knitr
(5) ReportingTools and shiny
11
Page 12
RNA-seq
Methods for:
I. edgeR exact tests
II. edgeR LRTs
III.DESeq
IV.DESeq2 (with .modifyDF and .toDF)
12
Page 13
Outline
(1) ReportingTools introduction and basics
(2) ReportingTools and microarray experiments
(3) ReportingTools and RNA-seq experiments
(4) ReportingTools and knitr
(5) ReportingTools and shiny
13
Page 14
knitr
Can easily integrate ReporingTools tables into knitr reports
Need to call ‘knit2html’ from report directory and specify the knitrHandlers in HTMLReport()
14
> setwd("reports")> library(knitr)> knit2html("/home/ubuntu/4BioCknitr.Rmd”)
Page 15
Updates to run the knitr example (due to permission issues)
15
(1) Open 4BioCknitr.Rmd
(2) Save to the /home/ubuntu directory
(3) setwd(“reports”)
(4) Then call knit2html("/home/ubuntu/4BioCknitr.Rmd")
Page 16
Outline
(1) ReportingTools introduction and basics
(2) ReportingTools and microarray experiments
(3) ReportingTools and RNA-seq experiments
(4) ReportingTools and knitr
(5) ReportingTools and shiny
16
Page 17
Shiny and ReportingTools
17
Page 18
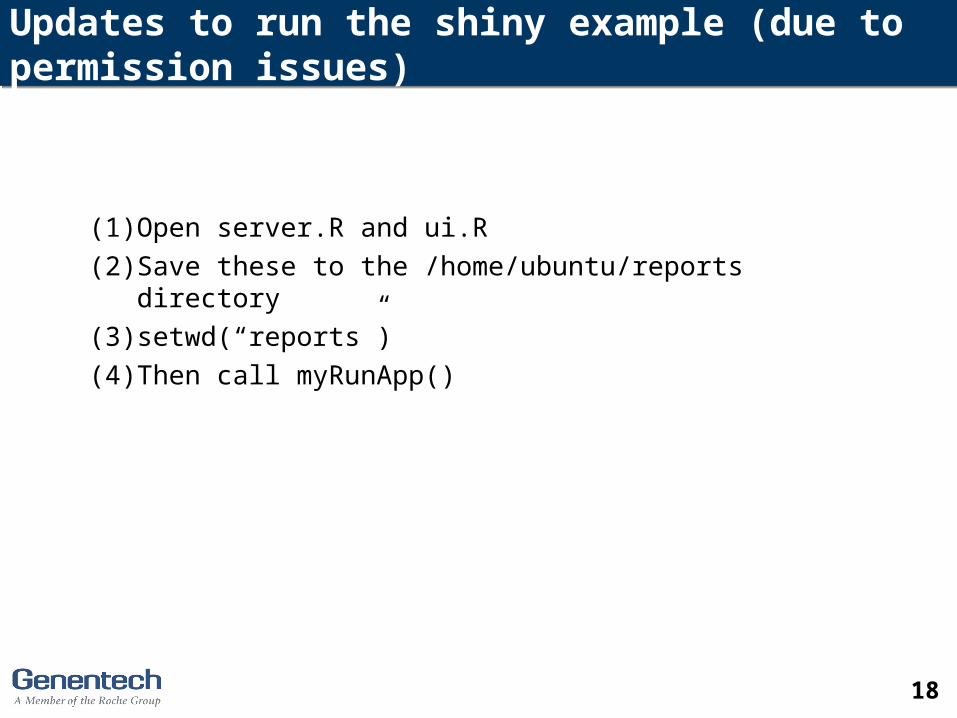
Updates to run the shiny example (due to permission issues)
18
(1) Open server.R and ui.R
(2) Save these to the /home/ubuntu/reports directory
(3) setwd(“reports”)
(4) Then call myRunApp()
Page 19
Changes to server.R
(1) Create a report with shinyHandlers to stream the HTML form of any elements added to our Report:
htmlrep <- HTMLReport(reportDirectory = "./", shortName="bigtest", handlers = shinyHandlers)
(2) Define a custom rendering function so that shiny can ‘hear’ elements being added to our report and insert them into the dynamic HTML:
renderRepTools <- function(expr, env=parent.frame(), quoted=FALSE) { func <- exprToFunction(expr, env, quoted) function(){ paste(capture.output(func()), collapse="\n") }
}
(3) Publish elements to our report within the expression passed to renderRepTools:
output$view2 <- renderRepTools({ publish(datasetInput(), htmlrep) })
19
Page 20
Changes to ui.R
(1) Include the JavaScript and CSS files so that the ReportingTools tables function properly via custHeaderPanel function:
##this function accepts the tile and window title arguments by shiny's headerpanel function##plus the js and cs argumentscustHeaderPanel = function(title, windowTitle =title, js= NULL, css=NULL){
mytlist = c(lapply(js, function(x) tags$script(HTML(paste(readLines(x), collapse="\n")))), lapply(css, function(x) tags$style(HTML(paste(readLines(x), collapse="\n"))))) tagList(tag("head",mytlist), div(class = "span12", style = "padding: 10px 0px;", h1(title)))
}
# Define UI for dataset viewer applicationshinyUI(pageWithSidebar(
custHeaderPanel("ReportingTools", js = list.files(system.file("extdata/jslib", package="ReportingTools"), full.names=TRUE), css = list.files(system.file("extdata/csslib", package="ReportingTools"), pattern="bootstrap.css", full.names=TRUE), ),
20
Page 21
Changes to ui.R
(2) Declare elements formated by ReportingTools as htmlOutput
mainPanel( verbatimTextOutput("summary"), htmlOutput("view2") )
This indicates to the shiny system that the output with be HTML code
21
Page 22
Future methods
DESeq2 methods
Return the decorated DF
More flexibility with annotations
22
Page 23
Acknowledgements
Jason Hackney
Josh Kaminker
Melanie Huntley
Christina Chaivorapol
Gabriel Becker
Michael Lawrence
Robert Gentleman
Martin Morgan
Dan Tenenbaum
23


![UNITED STATES DISTRICT COURT NORTHERN … · 398, 400 ] Before the Court are two motions filed by Defendant Genentech, Inc. (“Genentech”). The ... nia action against Genentech](https://static.documents.pub/doc/80x56/5bb0214f09d3f2b25c8dce07/united-states-district-court-northern-398-400-before-the-court-are-two-motions.jpg)


