DIFFERENT CHAIN LENGTH CONJUGATED POLYMERS: PHOTOPHYSICAL STUDIES AND DYE-SENSITIZED SOLAR CELL APPLICATIONS By ZHENXING PAN A DISSERTATION PRESENTED TO THE GRADUATE SCHOOL OF THE UNIVERSITY OF FLORIDA IN PARTIAL FULFILLMENT OF THE REQUIREMENTS FOR THE DEGREE OF DOCTOR OF PHILOSOPHY UNIVERSITY OF FLORIDA 2015
Transcript
DIFFERENT CHAIN LENGTH CONJUGATED POLYMERS: PHOTOPHYSICAL STUDIES AND DYE-SENSITIZED SOLAR CELL APPLICATIONS
By
ZHENXING PAN
A DISSERTATION PRESENTED TO THE GRADUATE SCHOOL OF THE UNIVERSITY OF FLORIDA IN PARTIAL FULFILLMENT
OF THE REQUIREMENTS FOR THE DEGREE OF DOCTOR OF PHILOSOPHY
Linear Conjugated Polymers ............................................................................ 20 Conjugated Dendrimers and Hyperbranched Conjugated Polymers ................ 21 Polymers with Interrupted Conjugation ............................................................. 22
Synthesis of Conjugated Polymers and Control of Molecular Weights ................... 23 Electropolymerization ....................................................................................... 23
Photophysical Process of Conjugated Polymers .................................................... 30
Excitation, Fluorescence and Phosphorescence .............................................. 30 Energy and Electron Transfer ........................................................................... 33
Energy transfer .......................................................................................... 33 Electron transfer ......................................................................................... 36
Energy and Electron Transfer in Conjugated Polymers .................................... 40 Conjugated Polyelectrolytes and Dye-sensitized Solar Cells .................................. 47
Selective Applications of CPEs ........................................................................ 48
Dye-Sensitized Solar Cells (DSSCs) ................................................................ 52 Operational principles of DSSCs ................................................................ 52 Solar cell characterization .......................................................................... 56 Materials used in DSSCs ........................................................................... 57
Scope of Present Study .......................................................................................... 63
2 CONJUGATED POLYELECTROLYTE SENSITIZED TIO2 SOLAR CELLS: CHAIN LENGTH AND AGGREGATION EFFECTS ON EFFICIENCY ................... 65
Background ............................................................................................................. 65 Results and Discussion........................................................................................... 67
Results and Discussion........................................................................................... 96 Synthesis and Characterization ........................................................................ 96
Energetics and Optical Properties .................................................................... 99 Charge Recombination Study ......................................................................... 104
Summary and Future Work ................................................................................... 109 Experiments and Materials ................................................................................... 109
Energy Transfer Kinetics ................................................................................ 131 Summary .............................................................................................................. 137 Experiments and Materials ................................................................................... 137
5 ENERGY TRANSFER IN “THROUGH-SPACE” CONJUGATED POLYMERS ..... 145
Background ........................................................................................................... 145 Results and Discussion......................................................................................... 146
Synthesis and Characterization ...................................................................... 146 Optical Properties in Solution ......................................................................... 148
Summary and Future Work ................................................................................... 151 Experiments and Materials ................................................................................... 152
4-1 Photophysical Properties of Polymer Samples ................................................. 126
4-2 Average Anisotropy and Angle Displacement .................................................. 131
4-3 Summary of lifetime measurements ................................................................. 136
5-1 Photophysical data summary............................................................................ 151
10
LIST OF FIGURES
Figure page
1-1 Examples of linear conjugated polymers ............................................................ 20
1-2 Examples of conjugated dendrimers .................................................................. 21
1-3 Structures and photophysical properties of conjugated small molecules and conjugated interrupted polymers ........................................................................ 23
1-5 Alkene and alkyne metathesis ............................................................................ 26
1-6 Examples of ploy(arylene-ethynylene)s synthesized by alkene metathesis ....... 27
1-7 Schematic representation of catalytic cycle of Pd-catalyzed cross-coupling reactions ............................................................................................................. 28
1-8 Jablonski diagram illustrating the basis photophysical processes ...................... 31
1-9 Schematic representation of electron spin in ground, singlet excited and triplet excited state .............................................................................................. 33
1-10 Schematic presentation of the mechanism of energy transfer ............................ 34
1-11 Schematic representation of electron transfer .................................................... 36
1-12 Potential energy surface diagram for electron transfer process ......................... 37
1-13 Energy diagram to illustrate splitting ................................................................... 38
1-14 Potential energy surface diagram for illustration of reorganization energy ......... 39
1-15 Schematic representation of molecular wire effect ............................................. 41
1-16 Comparison of polymer and small molecule fluorescence sensors .................... 41
1-17 Chemical structure of PPEAn and emission spectra of PPEAn in solution and film ...................................................................................................................... 43
1-18 Phtotophysical properties of PPElp .................................................................... 44
1-19 Structure of PIF and electronic coupling-distance plot ........................................ 46
1-20 Energy transfer in MEH-PPV .............................................................................. 47
1-21 Molecular structure of CPEs ............................................................................... 48
11
1-22 Schematic representation of simplified Jablonski diagram and quenching ......... 49
1-23 Detection of avidins with MPS-PPV via amplified quenching mechanism .......... 49
1-24 Mechanism of biocidal action.............................................................................. 50
1-25 Schematic illustration of drug release ................................................................. 51
1-26 Schematic representation of DSSC and film images .......................................... 53
1-27 Reactions in DSSCs ........................................................................................... 54
1-28 Energy level change with and without TBP ........................................................ 54
1-29 Regeneration of dyes and redox couples ........................................................... 55
1-30 A typical DSSC J-V curve ................................................................................... 57
1-31 Examples of TiO2 nanostructures ....................................................................... 59
1-32 Examples of Ruthenium dyes ............................................................................. 60
2-1 Structure of P1-O-n, P2-C-n and the Model compound ...................................... 67
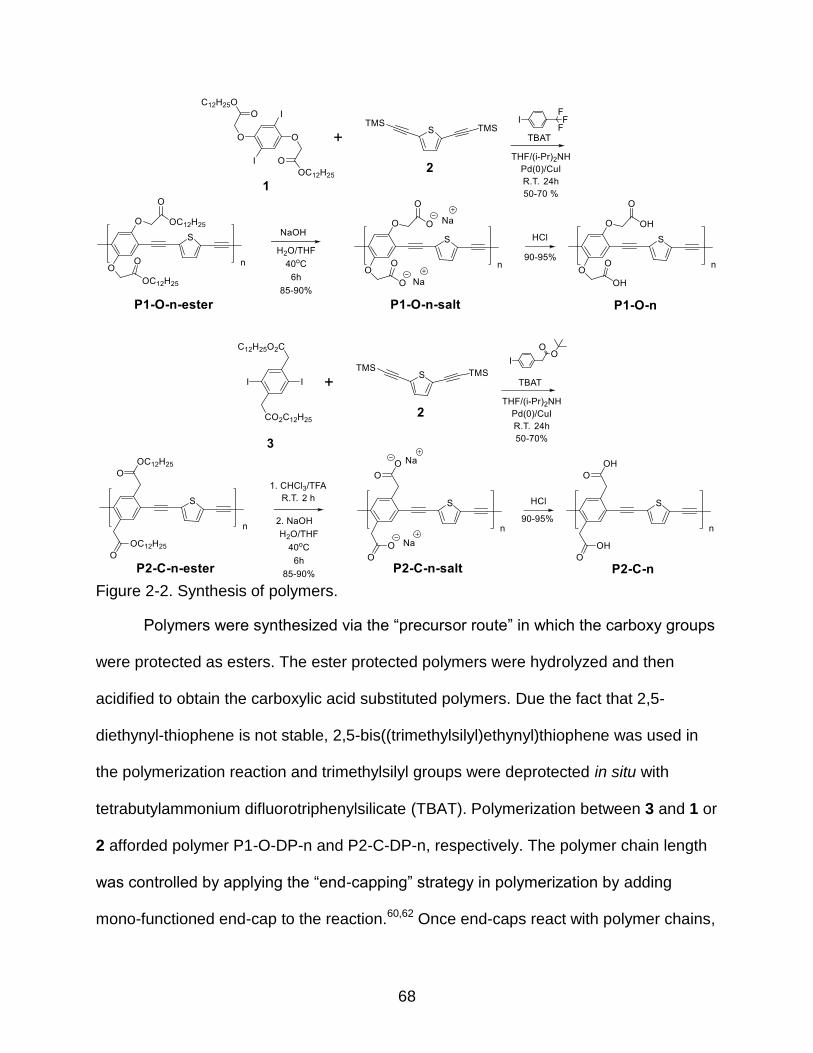
2-2 Synthesis of polymers ........................................................................................ 68
2-3 GPC analysis of polymers .................................................................................. 69
2-4 1H-NMR characterization of polymers ................................................................ 70
2-5 Synthesis scheme of model compound .............................................................. 71
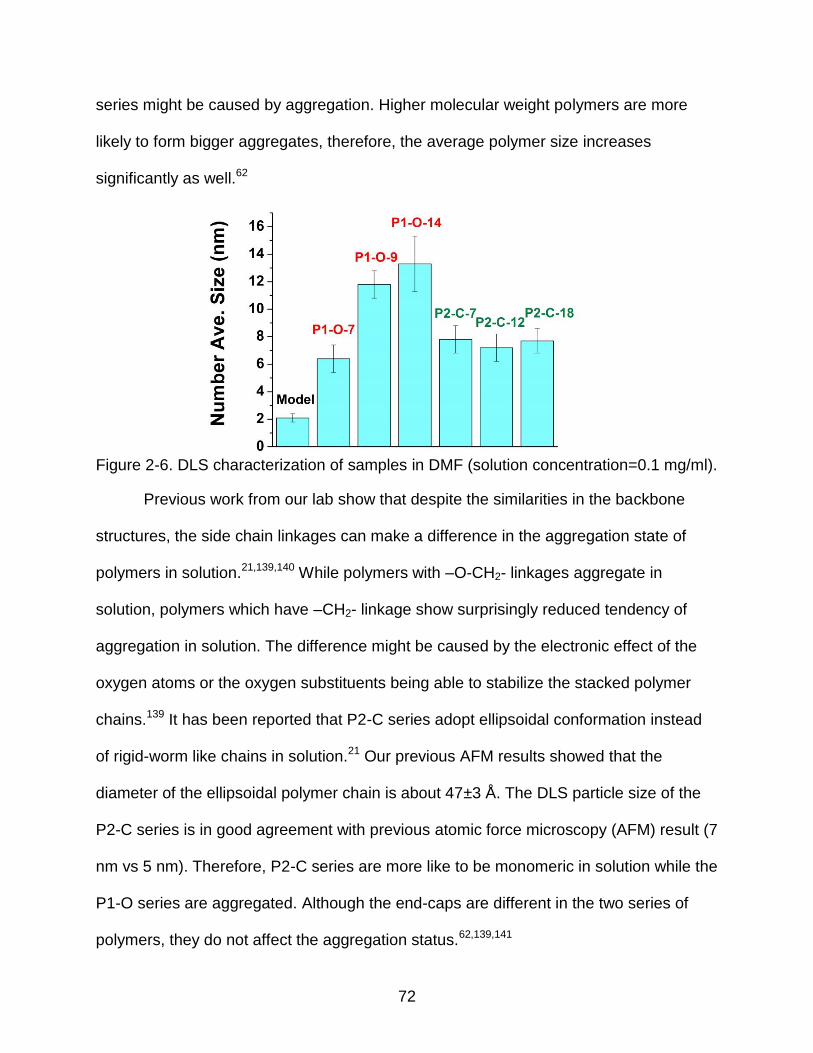
2-6 DLS characterization of samples in DMF ........................................................... 72
2-7 The ground state absorption and emission spectra ............................................ 74
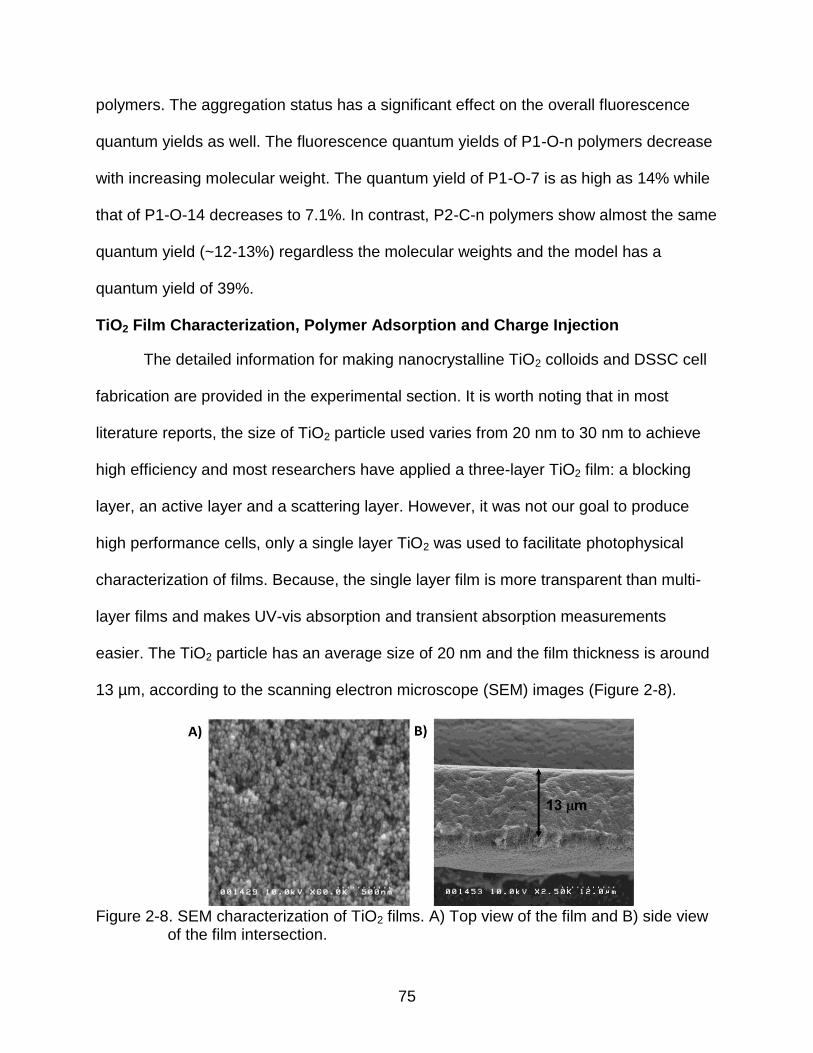
2-8 SEM characterization of TiO2 films ..................................................................... 75
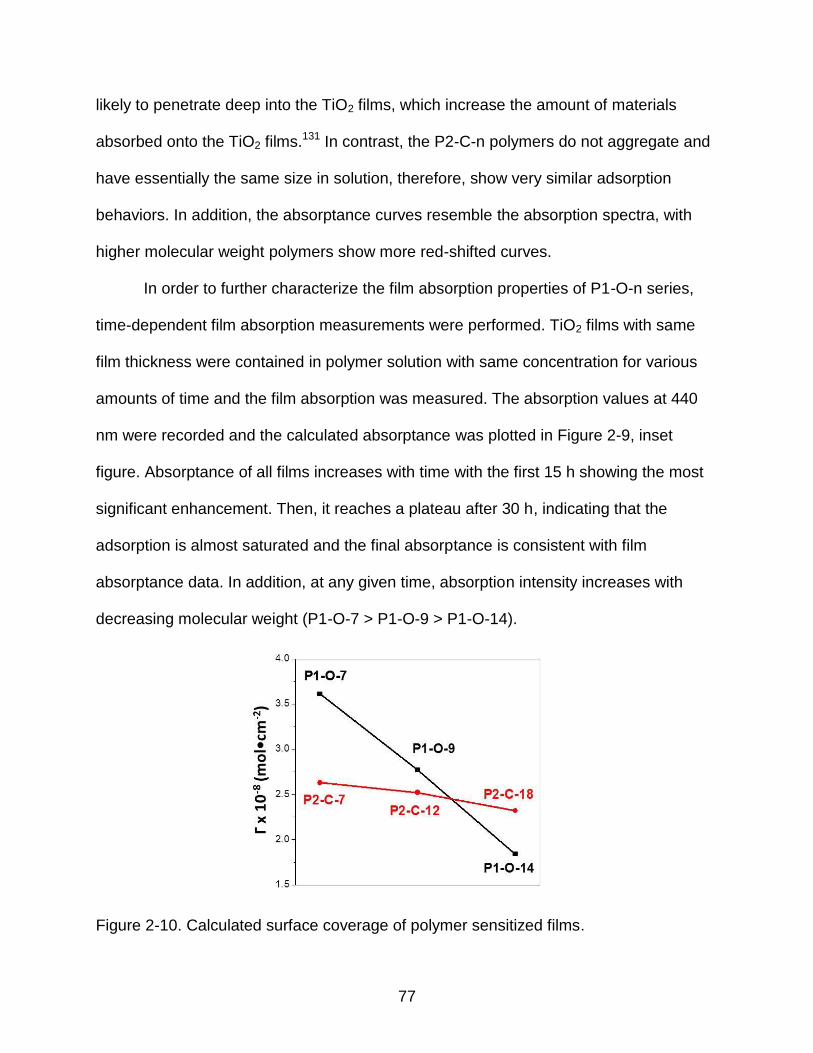
2-9 Absorptance of polymer sensitized films ............................................................ 76
2-10 Calculated surface coverage of polymer sensitized films ................................... 77
2-11 AFM images of dye-sensitized TiO2 films ........................................................... 78
2-12 Film transient absorption and kinetics of dye-sensitized TiO2 films .................... 79
2-13 IPCE and current-voltage (J-V) characters of polymer cells ............................... 81
3-1 Synthesis scheme of PPE-NDI-n ........................................................................ 96
12
3-2 GPC and NMR characterization of PPE-NDI-n ................................................... 98
3-3 A) Energetics and B) CV of PPE-NDI-8 ............................................................ 100
3-4 Uv-vis absorption and emission spectra in THF ............................................... 102
3-5 Transient spectra of the PPE and PPE-NDI-8 in DCM after 100 ps ................. 104
3-6 Time-resolved transient absorption spectra of PPE-NDI-n polymers ................ 105
3-7 Transient absorption spectra of PPE-NDI-n after 5 ns ...................................... 106
3-8 Transient kinetics from λ=480 nm ..................................................................... 107
3-9 Nasosecond TA spectra of PPE-NDI-n, PPE and NDI in THF .......................... 108
4-12 TA decay kinetics ............................................................................................. 134
4-13 Schematic representation of the energy transfer processes in conjugated polymers ........................................................................................................... 135
4-14 Comparison of ultrafast TA decay kinetics (circles) and time-resolved fluorescence (lines) data .................................................................................. 136
5-1 Molecular structures and synthesis procedures................................................ 147
13
5-2 GPC trace of polymers ..................................................................................... 148
5-3 Steady state optical properties of P0, PPE and OPE in THF ............................ 149
5-4 Steady state absorption and emission of P1-n and P0 ..................................... 150
Abstract of Dissertation Presented to the Graduate School of the University of Florida in Partial Fulfillment of the Requirements for the Degree of Doctor of Philosophy
DIFFERENT CHAIN LENGTH CONJUGATED POLYMERS: PHOTOPHYSICAL
STUDIES AND DYE-SENSITIZED SOLAR CELL APPLICATIONS
By
Zhenxing Pan
May 2015
Chair: Kirk S. Schanze Major: Chemistry
Conjugated polymers have drawn significant attention from the science
community due to their interesting photophysical and optoelectronic properties. The
polymer structure-property relationships have been well studied; however, the molecular
weight effects on polymer properties have been less explored. In this dissertation, we
focus on the synthesis of different molecular weight conjugated polymers using the end-
capping strategy, and the investigation of the energy/electron transfer behavior and
applications in dye-sensitized solar cells (DSSCs).
First, two families of conjugated polyelectrolytes (CPEs) featuring the same
backbone but with different side chain linkages were synthesized and applied as active
materials for DSSCs. CPEs bearing oxygen linkages (-O-) are more likely to aggregate
in solution, and the aggregation status depends strongly on the molecular weight. In
contrast, there is no obvious evidence showing that CPEs with methylene (-CH2-)
linkages aggregate in solution. The oxygen linkage family shows strong chain length
dependence on cell performance, while little difference can be observed in the
methylene linkage family.
18
Second, a series of poly(p-phenylene-ethynylene)s (PPEs) having different chain
length and naphthalene diimide derivative as end-caps were synthesized and their
photophysical properties were investigated. The overall quenching efficiency increases
with decreasing polymer chain length as evidenced by fluorescence quantum yields. In
addition, the charge recombination rate was investigated by ultra-fast transient
absorption. The charge recombination rate also depends strongly on the chain length:
as the chain length increases, the charge recombination rate decreases.
Third, a series of PPEs with different chain length and 4,7-di(thiophen-2-
yl)benzo[c][1,2,5]thiadiazole (TBT) end-caps were synthesized. Under light irradiation,
energy transfer from the PPE to TBT occurs via the Forster Resonance Energy Transfer
(FRET) mechanism. The overall energy transfer efficiency increases with decreasing
molecular weight. Ultra-fast transient absorption studies showed that the energy transfer
happens in the pico-second time scale for all the polymers, and the lowest molecular
weight polymer has fastest transfer rate.
Last, a series of “through-space” conjugated polymers with different chain length
and [2.2]paracyclophane moiety end-caps with TBT were synthesized. Despite the fact
that conjugation is interrupted, very efficient energy transfer can still be observed and
the overall energy transfer efficiency also depends on the molecular weight.
19
CHAPTER 1 INTRODUCTION
Conjugated Polymers
Conjugated polymers (CPs) feature polymer backbones with connected π-
orbitals, in which electrons are delocalized within many repeat units. The delocalization
of electrons narrows the band-gap between the highest occupied molecular orbital
(HOMO) and the lowest unoccupied molecular orbital (LUMO) and, therefore, lowers the
energy required to promote one electron to the conducting band and improves the
conductivity of CPs.
Iodine-doped polyacetylene with high conductivity was discovered by Nobel
laureates Alan J. Heeger, Alan MacDiamid and Hideki Shirakawa in 1977.1 Since then,
this research area has received significant attention from the science and engineering
communities. Research has mainly focused on the synthesis, functionalization and
application of new materials. Many synthetic strategies have been applied to tune the
properties of CPs, such as changing the polymer backbone architectures2-5 and
incorporating donor-acceptor units into the backbones6,7. These strategies help
researchers alter the band-gap, molar extinction efficient, electron/ hole mobility,
thermo/ photo stability, etc. The resulting polymers find applications in the fields of dye-
sensitized solar cells (DSSCs),8,9 bulk-heterojunction solar cells (BHJs),10-12 light
emitting diodes (LEDs),13,14 organic thin film transistors (OFETs),15 fixed p-n
junctions,16,17 chemo- and biosensors,18-20 cell imaging,21,22 antimicrobials,23,24
diagnosis, therapy,21,25 etc.
20
Linear Conjugated Polymers
Common types of conjugated polymers have linear backbones with fully
conjugated double bonds, triple bonds or aromatic rings. Some classic examples of
linear conjugated polymers are shown in Figure 1-1.26 The relative synthetic ease
makes them more readily accessible, and their properties can feasibly be tuned by
controlling the molecular weight, solubility, etc.
Figure 1-1. Examples of linear conjugated polymers. Figure was reprinted from Heeger
with permission.26 Copyright 2010 The Royal Society of Chemistry.
In linear of conjugated polymers, such as polyacetylene (PA), polythiophene (PT)
and poly(phenylene acetylene) (PPE), the linear polymer backbone provides the light
harvesting properties. Since the entire backbone is connected by conjugated π-bonds,
one may assume that the conjugation length will be equal to the chain length. However,
the π-conjugation is actually broken into smaller segments with different conjugation
21
lengths due to conformational disorder which limits the exciton migration length to ~ 10
nm.27-30 But, very efficient intra-/inter-chain energy/electron transfer can still happen via
a hopping mechanism.
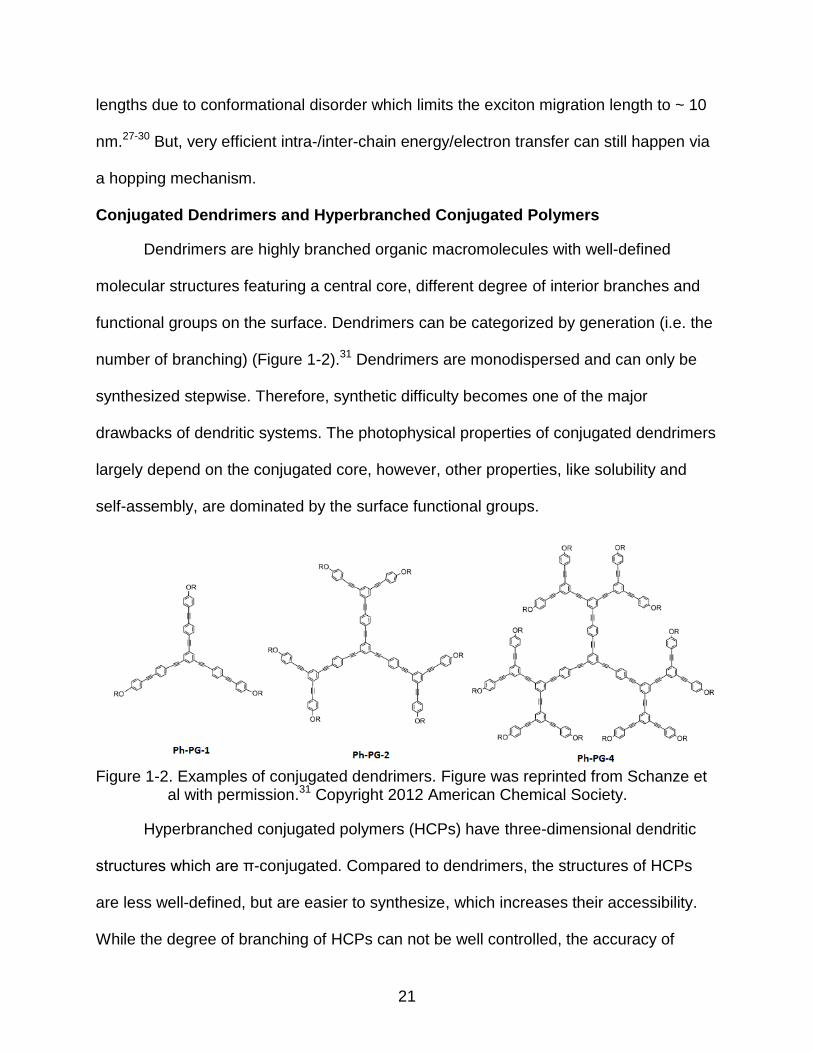
Conjugated Dendrimers and Hyperbranched Conjugated Polymers
Dendrimers are highly branched organic macromolecules with well-defined
molecular structures featuring a central core, different degree of interior branches and
functional groups on the surface. Dendrimers can be categorized by generation (i.e. the
number of branching) (Figure 1-2).31 Dendrimers are monodispersed and can only be
synthesized stepwise. Therefore, synthetic difficulty becomes one of the major
drawbacks of dendritic systems. The photophysical properties of conjugated dendrimers
largely depend on the conjugated core, however, other properties, like solubility and
self-assembly, are dominated by the surface functional groups.
Figure 1-2. Examples of conjugated dendrimers. Figure was reprinted from Schanze et
al with permission.31 Copyright 2012 American Chemical Society.
Hyperbranched conjugated polymers (HCPs) have three-dimensional dendritic
structures which are π-conjugated. Compared to dendrimers, the structures of HCPs
are less well-defined, but are easier to synthesize, which increases their accessibility.
While the degree of branching of HCPs can not be well controlled, the accuracy of
22
branching is difficult to be predicted. Like dendrimers, the optoelectronic properties are
largely controlled by the conjugated backbones, but other properties are provided by
terminal functional groups.
Polymers with Interrupted Conjugation
Although, much attention has been paid to the investigation of fully conjugated
systems, polymers with interrupted conjugation can be very interesting as well. There
are two common methods to construct such a system: one is to break the conjugation of
back-bones into smaller segments with non-conjugated groups/linkages32-34 and
another way is to graft π-conjugated chromophores onto non-conjugated polymer
backbones.35-37
The photophysical properties of fully conjugated polymers depend strongly on the
conjugation length.38,39 In interrupted conjugation systems, conjugation is limited to each
aromatic segment; therefore, the polymers inherit most of the optoelectronic properties
of the chromophores. However, due to the fact that all the chromophores are in the
vicinity of each other, they can still have very strong photophysical interaction among
polymer chains. For example (Figure 1-3), when oligo(phenylene-ethynylene) (OPE,
energy donor) and thiophene-benzothiadiazole (TBT, energy acceptor) are grafted onto
the polymer chain at the same time, ultra-fast energy transfer can occur from donors to
acceptors. And the overall energy transfer efficiency depends on the donor/acceptor
ratio.37
At the same time, conjugation-interrupted polymers also show some advantages
over small molecules because of their polymer properties, like stronger tendency to
form films, superior mechanical properties, et al. These polymers have already found
applications in the fields of transistors,40 OLEDs,41 DSSCs,36 and so forth.
23
Figure 1-3. Structures of conjugated small molecules and conjugated interrupted
polymers. Figure was reprinted from Chen et al with permission.36 Copyright 2012 American Chemical Society.
Synthesis of Conjugated Polymers and Control of Molecular Weights
Many synthetic methodologies have been applied to boost the facile synthesis of
conjugated polymers, such as electropolymerization,42 alkyne/alkene metathesis43,44
and transition metal catalyzed cross-coupling reactions.45
Electropolymerization
In the 1970s, when electropolymerization was first discovered, the application of
this technique was very limited, because the media used for this reaction was water,
which is a poor solvent for most aromatic molecules. It was Diaz and co-workers who
used acetonitrile (1% aqueous) which contained 0.1 M Et4NBF4 electrolyte as the
solvent for the electropolymerization of pyrrole in 1979 that opened the gate for mass
application of this polymerization method.46 Since then, many conducting polymers have
been synthesized in this way, such as polythiophene, poly(p-phenylene), polypyrene,
polyindole, polyazulene, polyfluorene, etc.47
In a typical electropolymerization, three steps are involved (Figure 1-4 (A)).42 1)
At the applied voltage, a molecule (RH2) is oxidized to its radical cation [RH2•+] efficiently
24
when it approaches the electrode surface. Because the electro-chemical reaction is very
fast, a large number of radical cations accumulate around the electrode. 2) Two
monomer radical cations [RH2•+] can form a dimer dication [H2R-RH2
2+] through a
coupling reaction and then lose two protons to yield a dimer [HR-RH]. 3) The newly
formed dimer [HR-RH] can undergo electrooxidation to generate a dimer radical (HR-
RH•+), which reacts with a monomer radical cation [RH2•+] to create a new dication [HR-
RH-RH22+], followed by losing two protons to produce a neutral trimer. The overall
reaction is repeated to generate polymers.
Figure 1-4. Electropolymerization A) General procedures for electropolymerization; B) Electropolymerization of polythiophene.
Depending on the stability of the radical cations, many other reactions can occur.
When the radical has a long lifetime (i.e. the radical is fairly stable), it can diffuse far
away from the electrode into the solution and react with other molecules to form
byproducts. However, when radicals are short-lived, they often react with solvent
molecules or other nearby molecules immediately after being generated. In order to
25
have the desired dimerization or polymerization reactions, radicals need to have
suitable stability, which depends strongly on the nature of the molecules. In addition,
there are many other factors that can affect the overall electrochemical reactions and,
therefore, the polymer molecular weight as well. These factors include, but are not
limited to, electrode materials, solvent, electrolytes and temperature.48
Alkene and Alkyne Metathesis
Alkene and alkyne metathesis has captured the attention of the polymer
synthesis community for a long time. Since its discovery, the application of this method
has gone way beyond the industrial manufacturing of polyolefins, and several
distinguishable processes have been identified: cross-metathesis (CM),49 ring-opening
metathesis (ROM),50 ring-closing metathesis (RCM)51 and acyclic diene metathesis
(ADMET) (Figure 1-5).52 A large variety of catalysts have been developed, most of
which are based on tungsten (W), molybdenum (Mo) or ruthenium (Ru) complexes.
Compared to the more water and air sensitive W and Mo catalysts (Shrock types), Ru-
based catalysts (Grubbs type) have more tolerance towards air, water and reaction
substrates, making them more useful in the construction of functional materials.
Because of their pioneering work in developing the synthetic methodology and various
catalysts, Grubbs, Schrock and Chauvin shared the Nobel Prize in Chemistry in the
year of 2005.
Besides being employed in the synthesis of non-conjugated polymers, alkene
metathesis has also been extensively used to synthesize ploy(arylene-vinylene)s
(PPVs) (Figure 1-6).43,45,53 The polymerization reaction follows a typical step-growth
mechanism: At the beginning of the reaction, the monomer conversion rate is high, and
large amount of oligomer formation is observed. Subsequently, polymer molecular
26
weights grow with time with the decrease in low molecular weight molecules. The
expected polydispersity index (PDI) is around 2 (Flory-Schulz distribution). However,
there are examples that polymers synthesized by the metathesis show narrow PDI,
although, the overall molecular weight is relatively low.54,55 By performing the
polymerization at optimized conditions (e.g., the right combination of catalyst, solvent,
temperature and monomer concentration), high molecular weight polymers can be
obtained.56,57
Figure 1-5. Alkene and alkyne metathesis A) Schematic representation of a general alkene metathesis reaction; B) examples of W, Mo and Ru based catalysts. Figure was reprinted from Bunz et al with permission.43 Copyright 2012 John Wiley & Sons.
In contrast to the application of alkene metathesis to build PPVs, there are fewer
reports concerning the synthesis of poly(phenylene ethynylene)s (PPEs) via alkyne
27
metathesis. However, compared to other synthetic methodologies, alkyne metathesis
can give very high molecular weight polymers.58
Figure 1-6. Examples of ploy(arylene-ethynylene)s synthesized by alkene metathesis. Figure was reprinted from Bunz et al with permission.43 Copyright 2012 John Wiley & Sons.
Pd Catalyzed Cross-coupling Reactions
The development of cross-coupling reactions, especially palladium-catalyzed
carbon-carbon bond formation reactions, facilitates the synthesis of CPs. Compared to
catalysts used in metathesis polymerization, most Pd catalysts have relatively higher
tolerance to different functional groups and reaction conditions, and they are less
sensitive to water, making them more popular choices for the synthesis of CPs. Due to
their significant contribution to the development of Pd-catalyzed reactions, Heck,
Negishi and Suzuki were awarded the Nobel Prize in Chemistry in 2010.
There are several milestone name reactions using Pd-catalysts and they are
listed in Table 1-1. Although, these reactions involve different catalytic systems and
substrates and have different application scopes, they share very similar catalytic cycles
(Figure 1-7). The catalytic cycle usually starts with oxidative addition of organic halides
(Reactant B, Ar-X, X= Cl, Br or I) onto the Pd catalyst to form a new complex, followed
28
by a transmetallation reaction of activated Reactant A (Nu-) with the newly generated
complex to put Nu on the same catalytic center. Then, trans-cis isomerization will take
place to put Ar and Nu at cis position. The final step is the production of the desired
coupling compound along with the regeneration of the catalyst by reductive elimination.
Table 1-1. Name reactions using palladium catalysts
Name Reaction
Reactant A Reactant B Catalyst
Substrate Hybridization Sbustrate Hybridization
Heck Alkene sp2 R-X sp2 Pd
Negishi R-Zn-X sp, sp2, sp3 R-X sp2, sp3 Pd or Ni
Suzuki R-B(OR)2 sp2 R-X sp2, sp3 Pd
Stille R-SnR3 sp, sp2, sp3 R-X sp2, sp3 Pd
Sonogashira Alkyne sp R-X sp2, sp3 Pd and Cu(I)
Figure 1-7. Schematic representation of catalytic cycle of Pd-catalyzed cross-coupling reactions. Figure was reprinted from Amatore and Jutand with permission.59 Copyright 2000 American Chemical Society.
Because the catalyst can dissociate from the reactant, the reaction has no living
polymerization characteristics. In fact, cross-coupling polymerizations are typical step-
29
growth reactions with PDI around 2. Furthermore, it’s possible to obtain high molecular
weight polymers by using 1:1 ratio of Reactant A and Reactant B. The molecular weight
is determined by degree of polymerization (DP), is given by:
DP=1/(1-p), where p is the extent of reaction
Polymer molecular weight can be tuned via the control of DPs by introducing a
stoichiometric imbalance of functional groups of Reactant A to that of Reactant B. The
resulted DP is given by:
DP=(1+r)/(1+r-2rp), where r is stoichiometric imbalance ratio.60
If the stoichiometric imbalance is caused by the addition of a mono-functioned end-cap,
the polymer molecular weight can be controlled, and the end-group function can be
introduced at the same time. This strategy has been successfully applied by many
research groups to synthesize CPs with different molecular weight with end-group
functionality.61-64
More recently, several groups developed a chain-growth process for controlled
synthesis of polythiophenes,65 polyfluorenes,66,67 polyphenylenes,68 and poly(phenylene
ethylene)s.69 The chain-growth reactions still undergo the same catalytic cycle as the
isomerization and reductive elimination. However, the oxidation addition happens in an
intra-chain manner due to the nature of the new catalytic systems, giving the
polymerization living characteristics. Due to the living polymerization nature, this method
can be used to control molecular weight, build di-block polymers and synthesize grafting
polymers using the “grafting-from” approach.
30
Photophysical Process of Conjugated Polymers
Conjugated molecules can interact with a large region of the solar spectrum, from
near-UV to near-IR, since the degree of π-conjugation differs in different conjugated
systems. Despite the difference in absorption wavelength, the absorption process of all
the molecules follows the same principle, the Stark-Einstein law, which says that each
absorbed photon will cause only one primary chemical or physical change. The Stark-
Einstein law is also called the photochemical equivalence law, for it can be rephrased
as: for every mole of quanta of light absorbed, one mole of substance will react. The
formula is given by:
ΔEmol=NAhν, where NA is Avogadro’s number.70
Molecules that can absorb light are called chromophores and they are responsible for
the colors of molecules. When light irradiates the molecule, a certain wavelength of light
is absorbed and the molecule shows the complementary color which is not absorbed. If
all the visible light is absorbed by a substance, it will appear to be black. After light is
absorbed, many interesting photophysical process can happen.
Excitation, Fluorescence and Phosphorescence
During the photoexcitation process, an electron is excited from the ground state
to an excited state and will remain in the excited states until the relaxation or transfer
process occurs. A schematic diagram, named in honor of Alexsander Jablonski, has
often been used to illustrate the photophysical process, as shown in Figure 1-8. A
Jablonski diagram portrays the relative electronic and vibrational energy levels of the
ground and excited states without any attempt to depict the nuclear and electronic
geometries.
31
Figure 1-8. Jablonski diagram illustrating the basis photophysical processes. Figure was reprinted from Lakowicz with permission.71 Copyright 2007 Springer.
When a molecule absorbs a photon with appropriate energy, an electron is
promoted to a vibronically excited level of electronic singlet state, S1, from the lowest
vibronic level of the electronic ground state, S0. This process is called ground state
excitation and occurs on the time scale of 10-16 – 10-14 s. There are many vibrational
levels within the S1 state, and the chance of an electron being promoted to a specific
energy level depends on the energy overlapping. However, the molecule will relax to the
lowest vibronic level of electronic state S1, because the extra energy is transferred to
solvent or lost due to molecule reorganization. The relaxation usually takes about 10-14
– 10-11 s. When a proper light source is applied (e.g. a high energy laser), it’s possible
that the molecules will be promoted to higher energy electronic singlet states, S2 – Sn.
Without external interactions, two possible follow-up conversions can occur for
the singlet excited state: decay to S0 or transfer to first excited triplet state, T1. There are
two possible pathways to decay to S0: radiative decay and non-radiative decay. In the
32
radiative decay, a photon is emitted to give fluorescence and the energy of the emitted
photon depends on the energy difference between S1 and S0. There is usually a shift,
called Stokes shift, to longer wavelength, between the absorption wavelength maximum
and emission wavelength maximum due to the energy difference between photon
absorbed and photon emitted. Radiative decay mostly happens in the time range of 10-9
– 10-7 s. On the other hand, the singlet excited state can relax to ground state without
emitting photons. Instead, the energy will be lost in the form of heat.
Alternatively, the excited state can undergo intersystem crossing (ISC) from
singlet excited state to triplet excited state. The intersystem crossing rate depends
strongly on the system and can vary in a large range. After intersystem crossing, the
system relaxes to the lowest triplet excited state, T1. Similar to the process in the singlet
excited state, the molecule will eventually decay to the ground state via either radiative
decay which produces phosphorescence or non-radiative day which generates heat.
However, in the singlet state, the electron spins are still paired the same as the
electrons pairs in the ground state. In contrast, in the triplet state, the electrons spins
are parallel (Figure 1-9). Because of the difference in electron spin orientation in the
ground state and triplet state, direct excitation of electrons from ground state to the
triplet state is quantum mechanically forbidden. An electron must be excited to its
singlet excited and undergo ISC to convert to the triplet excited state. For the same
reason, the radiative decay rate (from T1 to S0 (phosphorescence, usually 103 - 102 s-1)
is considerably slower compared to the rate of singlet emission (fluorescence,109 - 107
s-1).
33
Figure 1-9. Schematic representation of electron spin in ground, singlet excited and triplet excited state.
Energy and Electron Transfer
When a photo-excited molecule interacts with another substance, the excited
state molecule can be quenched. There are two distinct pathways for the quenching:
energy transfer when excited electron transfers its energy to interacting molecules and
returns back the ground state; electron transfer if the electron hops to the interacting
molecules. For each pathway, the molecule that gives energy or electron is called donor
(D) while the molecule that accepts energy or electron is called acceptor (A). The donor
has higher excited-state energy than the acceptor. The interaction mechanisms for
energy and electron transfer differ significantly and are discussed below.
Energy transfer
Energy transfer can occur via either a radiative or non-radiative process. In a
radiative energy transfer process, the excited donor molecules (D*) emit photons which
are directly absorbed by acceptors (A). Apparently, this requires that the emission
spectrum of D* must have some overlap with the absorption spectrum of A. The overall
energy transfer efficiency depends on the quantum yield of the donor molecules, the
overlap integral (J) of the emission and absorption spectra, the concentration of
acceptor and the molar extinction coefficiency. In general, the radiative energy transfer
efficiency is not very high.
34
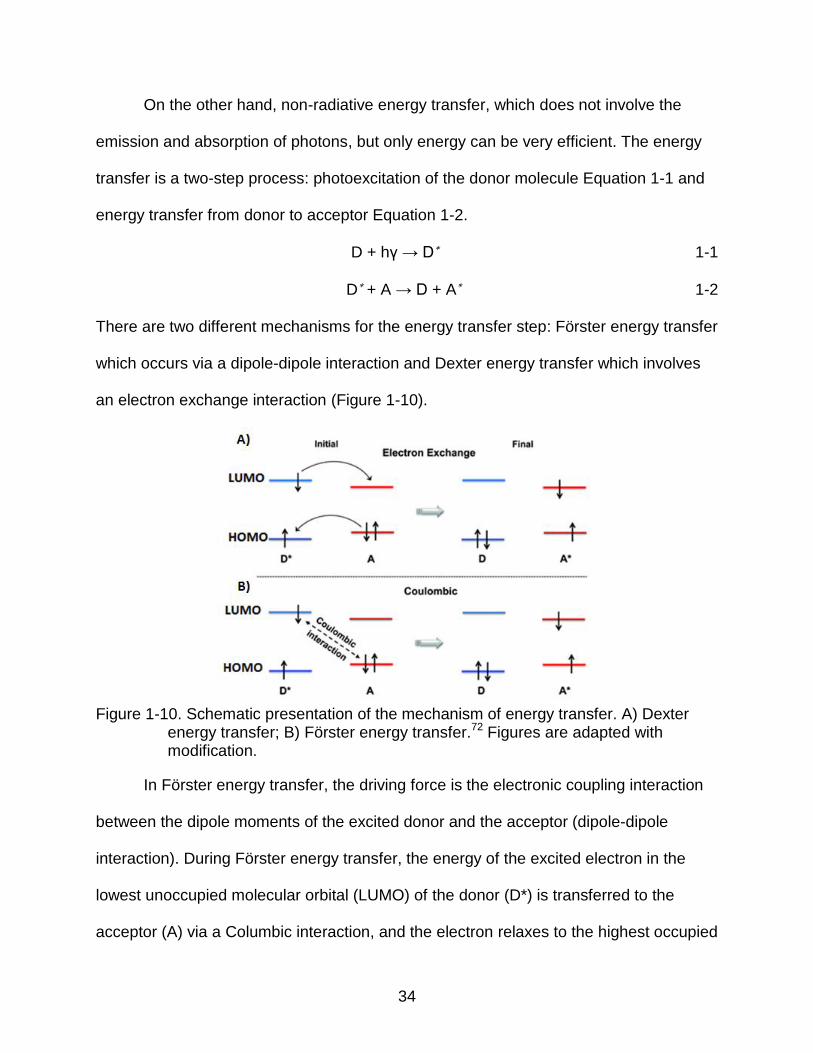
On the other hand, non-radiative energy transfer, which does not involve the
emission and absorption of photons, but only energy can be very efficient. The energy
transfer is a two-step process: photoexcitation of the donor molecule Equation 1-1 and
energy transfer from donor to acceptor Equation 1-2.
D + hγ → D* 1-1
D* + A → D + A* 1-2
There are two different mechanisms for the energy transfer step: Förster energy transfer
which occurs via a dipole-dipole interaction and Dexter energy transfer which involves
an electron exchange interaction (Figure 1-10).
Figure 1-10. Schematic presentation of the mechanism of energy transfer. A) Dexter
energy transfer; B) Förster energy transfer.72 Figures are adapted with modification.
In Förster energy transfer, the driving force is the electronic coupling interaction
between the dipole moments of the excited donor and the acceptor (dipole-dipole
interaction). During Förster energy transfer, the energy of the excited electron in the
lowest unoccupied molecular orbital (LUMO) of the donor (D*) is transferred to the
acceptor (A) via a Columbic interaction, and the electron relaxes to the highest occupied
35
molecular orbital (HOMO). At the same time, the acceptor acquires the energy and one
of its electrons is promoted from the HOMO to LUMO. This mechanism does not involve
the exchange of electrons and can occur over a long distance (30-100 Å).
The electrostatic interaction energy (E) between the two interacting dipoles is
directly proportional to the strength of both transition dipoles (µD and µA) and inversely
proportional to the cube of the distance between the donor and acceptor.
𝐸(𝑑𝑖𝑝𝑜𝑙𝑒 − 𝑑𝑖𝑝𝑜𝑙𝑒) ∝µ𝐷µ𝐴
𝑅𝐷𝐴3 (1-3)
The energy transfer rate (kET) can be derived from equation 1-3 and is proportional to
the square of the electrostatic interaction energy (E).
𝑘𝐸𝑇(𝑑𝑖𝑝𝑜𝑙𝑒 − 𝑑𝑖𝑝𝑜𝑙𝑒) ∝ 𝐸2 ≈ (µ𝐷µ𝐴
𝑅𝐷𝐴3 )
2
=µ𝐷
2 µ𝐴2
𝑅𝐷𝐴6 (1-4)
Energy transfer efficiency increases with the magnitude of dipole moments and
decreases significantly with increasing donor-acceptor separation, since the rate is
proportional to the inverse sixth power of the distance between donor and acceptor.72
In Dexter energy transfer, there is direct electron exchange between the donor
and acceptor via the overlapping orbitals of D* and A. The excited electron in the LUMO
of D* hops to the LUMO of A and one electron in the HOMO of A is transfered to the
HOMO of D*. Another key difference between Dexter and Förster energy transfer is that
both singlet-singlet and triplet-triplet energy transfer can take place in via Dexter energy
transfer while Förster theory can be applied in triplet-triplet energy transfer.
The energy transfer rate in the Dexter mechanism is given by:
𝑘𝐸𝑇 (𝑒𝑥𝑐ℎ𝑎𝑛𝑔𝑒) = 𝐾𝐽𝑒𝑥𝑝(−2𝑅𝐷𝐴
𝑅𝐷𝐴0 ) (1-6)
36
Where K is a parameter related to specific orbital interactions, J is the spectral overlap
integral, 𝑅𝐷𝐴0 is the separation of D* and A when they are in van der Waals contact and
𝑅𝐷𝐴 is the distance between D and A. Because the transfer rate is exponential
dependent of the distance of D and A (𝑅𝐷𝐴), energy transfer is efficient only when D and
A are very close to each other (5-10 Å).
Electron transfer
Electron transfer is a very important reaction in many biological processes73,74
and photo-electronic devices.75,76 Unlike energy transfer, electron transfer involves
actual electron transfers from a donor to an acceptor, which produces a charge
separated state (Figure 1-11). In photoinduced electron transfer, one electron in the
donor is excited to its LUMO and then transferred to the LUMO of the acceptor. As a
result, the donor is oxidized to D+, while the acceptor is simultaneously reduced to A-.
The electron transfer produces a charge separated state which may be deactivated to
the ground state by charge recombination or may undergo follow-up reactions if the
charge separated state is long-lived.
Figure 1-11. Schematic representation of electron transfer.
Rudolph A. Marcus developed a theory to explain electron transfer which treated
the electron transfer process as a transition state. In the Marcus theory the excited
donor and acceptor pair (DA*) and the charge separation state (D+A-) are treated as the
reactant and product, respectively (Figure 1-12).77
37
Figure 1-12. Potential energy surface diagram for electron transfer process. In the
figure, DA, DA*, TS and D+A- stand for the grand state, excited state, transition state and charge separation state, respectively; ∆G0 and λ are Gibbs free energy change and reorganization energy, respectively. Figure is adapted with modification.72
The electron transfer rate can be derived from the theory:
𝑘𝑖𝑓 =2𝜋
ℏ|𝑉𝑖𝑓|2√
1
4𝜋𝑘𝐵𝑇𝜆exp [−
(Δ𝐺0+𝜆)2
4𝜆𝑘𝐵𝑇] (1-7)
where, Vif is the electronic coupling matrix element, λ is the reorganization energy
induced by the electron transfer and ∆G0 is the Gibbs free energy variation during the
reaction. The electron transfer rate is controlled by two parameters: 1) the electronic
matrix element and 2) the reorganization energy. In order to have high electron transfer
rate, the electronic coupling needs to be maximized while the reorganization energy
should be minimized.
The electronic coupling can be understood as the tendency of the donor to
transfer an electron to the acceptor, and therefore, transfer integral can be assigned to
quantify the electron coupling matrix. The overall transfer integral depends on both the
interacting Frontier Molecule Orbitals (FMOs) of the donor and acceptor and the relative
positions of the interacting molecules. One method to estimate the transfer integral is to
38
apply Koopman’s theory, which use half the splitting of the HOMO to calculate the hole
transfer integral and half the splitting of the LUMO to calculate the electron transfer
integral (Figure 1-13).78 In general, the HOMO splitting is systematically larger than
LUMO splitting, because, the FMOs of the HOMO feature bonding characters while the
FMOs of the LUMO are mostly anti-bonding. When two molecules approach each other,
the FMOs start to interact with each other, splitting the HOMO and LUMO into two
energy levels. The splitting creates anti-bonding characters in HOMO and some
bonding in the LUMO and. The anti-bonding character greatly increases the energy
level of HOMO and, therefore, enlarges the magnitude of HOMO splitting. Because the
original LUMO has anti-bonding characters, the significance of the splitting is smaller.
In fact, most organic materials have higher hole mobility than electron mobility due to
larger HOMO splitting.
Figure 1-13. Energy diagram to illustrate splitting.
The relative position of the interacting molecules also affects the electronic
coupling. For example, co-facial displacement of the two molecules usually provides the
largest electronic interaction. However, lateral displacement can cause the splitting of
the LUMO even larger than that of the HOMO.79
39
The reorganization energy is the sum of the inner and outer contribution. Upon
electron gain/loss, the geometry of the donor/acceptor changes, and the energy
variation associated with the change is the inner reorganization energy. The
polarization, relaxation and stabilization effects of the surrounding environment on the
donor/acceptor also cause an energy change, which is assigned as the outer
reorganization energy. In many cases, the magnitudes of the inner and outer
reorganization energy are of the same order.
Figure 1-14. Potential energy surface diagram for illustration of reorganization energy.
A potential energy surface diagram can be used to illustrate the electron transfer
process (Figure 1-14). During an electron transfer reaction, the donor (D) is oxidized to
D+ and the acceptor (A) is reduced to A- simultaneously. This step does not involve any
geometry change. The following step is the relaxation of the product nuclear
geometries. The energy required to overcome the barrier for the transition is provided
by photon irradiation in the case of photo-induced electron transfer (See Figure 1-12).
The reorganization energy greatly affects the overall electron transfer efficiency since
the electron transfer rate is exponentially proportional to the sum of reorganization
energy and Gibbs free energy change.
40
Energy and Electron Transfer in Conjugated Polymers
Compared to small molecules and oligomers, energy and electron migration is
very efficient in conjugated polymers due to the molecular wire effect which is proposed
by Swager and co-workers (Figure 1-15).80 The conjugated polymer chains resemble
molecular wires along which the exciton can delocalize and migrate along the wire
efficiently. This effect contributes to the fact that the quenching efficiency of conjugated
polymers is several order of magnitude higher compared to small molecules. For
example, Zhou and Swager prepared a water-soluble conjugated polymer featuring
PPE backbone with a crown-ether side chain on each repeat unit (Figure 1-16).80 In
solution, the polymer shows strong emission which can be quenched by methyl viologen
(MV2+) about 50-100 fold greater efficiency compared to an oligomer with only three
benzene rings bearing the same crown-ether group. In the case of small molecules,
each quencher can quench the fluorescence of only one small molecule. In contrast, in
polymer emission quenching, all excitons generated by different chromophore units on a
polymer chain can be quenched, as long as they can migrate to the quenching site and
encounter a quencher. The molecule wire effect acts as an amplifier and greatly
enhances the quenching efficiency. Based on this strategy, many conjugated polymer
sensors have been developed.18,81
However, the photophysical process in conjugated polymers is very complicated.
In polymer assemblies, there can be both interchain and intrachain energy and/or
electron transfer competing with each other. Intrachain transfer refers to energy/electron
migration along a single polymer chain while interchain process means the exciton hops
among multiple polymer chains. The conformation and assembly status of polymers
depends on the solvent and temperature, which affect the energy and charge transfer
41
processes. Numerous researchers have continued to resolve the complexity and
understand the mechanisms and kinetics of energy/electron transfer in CPs.
Figure 1-15. Schematic representation of molecular wire effect. Figure was reprinted from Zhou and Swager with permission.80 Copyright 1995 American Chemical Society.
Figure 1-16. Comparison of polymer and small molecule fluorescence sensors. Green color indicates the molecule is emissive and grey color means the fluorescence is quenched. Figure was reprinted from Zhou and Swager with permission.80 Copyright 1995 American Chemical Society.
Swager and co-workers contributed significantly in this area.82 They
demonstrated that, in a pure rigid-rod system, like PPEs, the exciton hop along the
42
polymer backbone follows a 1D random-walk model. The exciton migration does not
have a preferred direction and will pass a certain portion of the polymer chain multiple
times when it travels back-and-forth. The exciton can be effectively quenched as long
as it reaches the quenching site before decaying to the ground state. The effective
migration length depends on the product of lifetime of excitation (𝜏) and transfer rate (v).
In order to determine the effective excitation migration length, Zhou and Swager
synthesized a series of PPEs with different chain lengths.80 In the quenching
experiments, they noticed that the quenching efficiency stopped increasing after the
number of repeating units reached ~ 140. Therefore, they concluded that in solution the
effective exciton migration length of PPEs is about 140 (Ph-CC-) units. Based on the
conclusion, they calculated the total exciton travel distance is about 20,000
phenylethynyl units. However, one thing that needs to be pointed out here is that PPEs
are not perfectly rigid-rods and the persistence length is about 15 nm.82
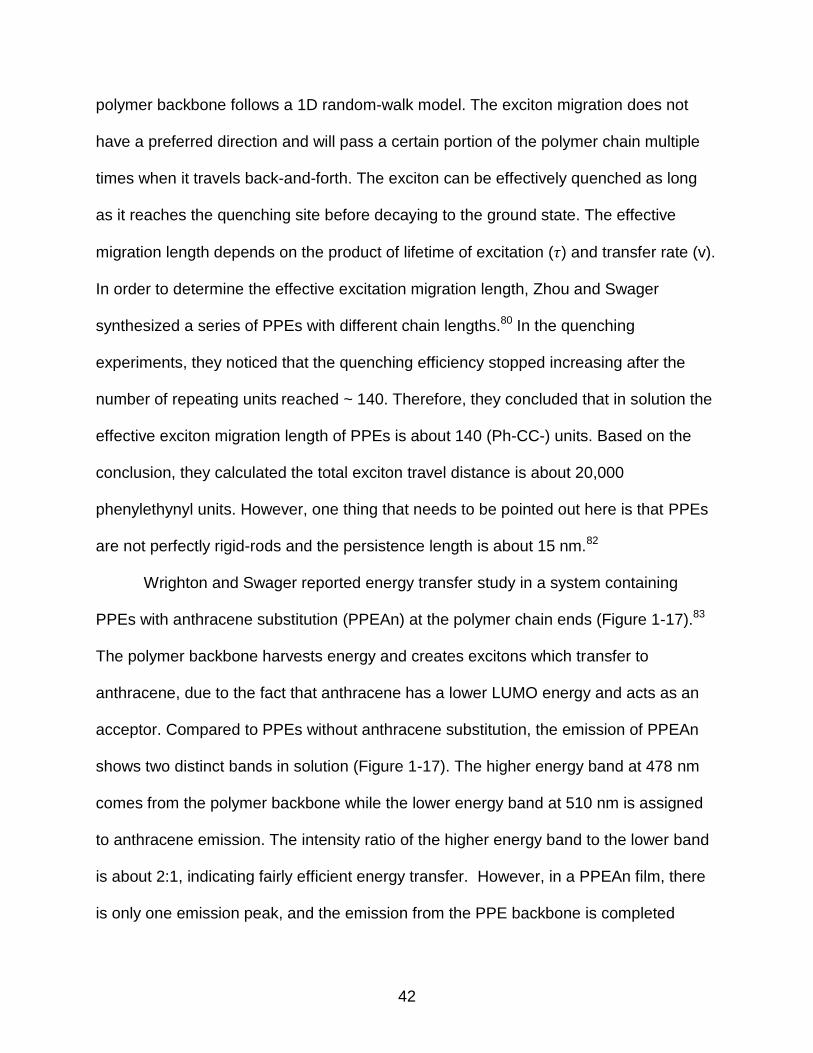
Wrighton and Swager reported energy transfer study in a system containing
PPEs with anthracene substitution (PPEAn) at the polymer chain ends (Figure 1-17).83
The polymer backbone harvests energy and creates excitons which transfer to
anthracene, due to the fact that anthracene has a lower LUMO energy and acts as an
acceptor. Compared to PPEs without anthracene substitution, the emission of PPEAn
shows two distinct bands in solution (Figure 1-17). The higher energy band at 478 nm
comes from the polymer backbone while the lower energy band at 510 nm is assigned
to anthracene emission. The intensity ratio of the higher energy band to the lower band
is about 2:1, indicating fairly efficient energy transfer. However, in a PPEAn film, there
is only one emission peak, and the emission from the PPE backbone is completed
43
quenched indicating the energy transfer efficiency is enhanced (Figure 1-17). The
authors stated that in solution, energy migration is only one-dimensional (e.g. the
exciton can only travel along the polymer chain). In contrast, polymer chains are closer
to each other in films making interchain energy hopping possible, making energy
transfer three-dimensions.
Figure 1-17. Chemical structure of PPEAn and emission spectra of PPEAn in solution and film. Figure was reprinted from Swager.82 Copyright 2011 John Wiley & Sons.
The effective conjugation length is also believed to affect the energy transfer
rate. Swager investigated the energy migration rate of PPEs containing iptycene units
(PPEIp) in liquid crystalline (LC) solvents.64 The effective conjugation length of PPE
type polymers in solution (like tetrahydrofuran (THF) or dichloromethane (DCM)) is
limited to around 9-10 repeating units. But, when the polymers are dissolved in a liquid
both absorption and emission spectra show significant bathochromic shifts indicating
increasing conjugation length in polymer (Figure 1-18 A & B). In addition, the fluoresce
anisotropy increases from ~0.3 in DCM to ~0.72 in 6CHBT (Figuire 1-18 D). The
possible reason is that the polymer chains are better aligned along the liquid crystalline
direction. As a result, the authors observed improved energy transfer efficiency and they
attributed it to increased conjugation length and better alignment.
Figure 1-18. Photophysical properties of PPElp. A) UV-vis absorption and B) emission of PPEIp in DCM, film and LC solution; C) schematic representation of extended polymer chain model; D) polarized emission spectra of PPEIp. Figure was reprinted from Swager.64 Copyright 2005 American Chemical Society.
Mullen and Bredas’ work helped explain the details of energy/electron transfer in
conjugated polymers.84,85 They studied the energy transfer in a donor-acceptor system
45
featuring a polyindenofluorene (PIF) backbone (donor) and perylene derivatives as end-
groups (acceptor) (Figure 1-19A). They stated that energy transfer in solution, which
does not involve much interchain interaction, can be viewed as a two-step process:
exciton migration along the backbone and energy transfer to the acceptor. The effective
conjugation length is shorter than the total polymer chain length, and the polymer chain
is “divided” into several conjugated segments. After excitation, the exciton hops among
these segments, which is a slow process due to the weak dipole coupling between
chain segments. Hopping means the exciton jumps to a nearby segment which is a
homomolecular self-exchange process and does not involve energy change. Once the
exciton reaches the segment which has close contact with the acceptor, ultrafast energy
transfer takes place, and the energy transfer rate is determined by the reorganization
energy and electronic coupling matrix (see previous section). Energy migration is more
efficient in rigid rods compared to flexible chains, due to smaller reorganization energy
loss, and the electronic coupling matrix is calculated to decrease with increasing D-A
distance (Figure 1-19B). Thus, the hopping process becomes the key step in
determining the overall transfer rate.
In films, the polymer chains stack together, and this favors interchain energy
transfer from the conjugated segments of one chain to the perylene unit in another
chain. As a result, the energy transfer efficiency is about 10 times higher in films
compared to in solution.
46
Figure 1-19. Structure of PIF and electronic coupling-distance plot. A) Chemical structure of PIF; B) D-A distance and electronic coupling matrix plot. Figure was reprinted from Bredas.86 Copyright 2002 United States National Academy of Sciences.
Energy and electron transfer in more flexible conjugated polymers are even
more complicated. Scholes, Tobert and Schwartz studied the energy transfer in poly[2-
methy-oxy-5-(2’-ethyl-hexyloxy)-1,4-phenylenevinylene] (MEH-PPV) in solution and in a
restricted matrix.87,88 MEH-PPV chain is more flexible compared to PPEs, and has both
tightly coiled and open chain conformations in solution (Figure 1-20 A). In the tightly
coiled conformation zone, conformational subunits (chain segments within which the
repeating units are conjugated) are close to each other, facilitating interchain energy
transfer. In the open chain conformation region, conformational subunits are in the
extended chain mode, which favors intrachain energy transfer. In a confined silica
composite matrix, where the polymer chain conformation is confined, most polymer
chains adapt the extended conformation (Figure 1-20 B). Interchain energy transfer is
inhibited and the energy transfer prefers to occur through the intrachain hopping
mechanism. Thus, the overall energy transfer efficiency is lower in films compared to in
solution.
47
Figure 1-20. Energy transfer in MEH-PPV. A) Schematic representation of inter and intra chain energy transfer in MEH-PPV; B) MEH-PPV in silica composite matrix. Figures were reprinted from Scholes, Tobert and Schwartz.87,88 Copyright Copyright 2001 John Wiley & Sons.
Conjugated Polyelectrolytes and Dye-sensitized Solar Cells
Conjugated polyelectrolytes (CPEs) are -conjugated polymers with ionic
pendant chains. Thy inherit the interesting electronic and optical properties of organic -
conjugated back bones and are soluble in polar solvents, such as water, ethanol, etc.
Many ionic side chains have been proven to endow this solubility to CPs, including
sulfonate (-SO3-), carboxylate (-CO2
-), phosphonate (-PO32-) and quaternary ammonium
(-NR3+) groups (Figure 1-21). The charged side groups can interact with many species,
such as metal ions, metal oxides, polyelectrolytes, proteins, oligo and polynucleic acids,
making CPEs outstanding platforms for a variety of applications.89,90 Charges also allow
direct deposition of CPEs on top of neutral semiconductor surface, making CPEs
applicable in device fabrications.91,92 In addition, the use of some polar solvents, like
methanol and water, to make CPE-based devices is more environmentally friendly, as
these solvents are regarded as green solvents.
48
Figure 1-21. Molecular structure of CPEs.
Selective Applications of CPEs
Chemo and bio-sensing are very important applications of CPEs. The working
principles of sensors are based on fluorescence quenching and/or recovery. There are
two quenching pathways, dynamic quenching and static quenching, which are shown in
the simplified Jablonski diagram (Figure 1-22).71 In a quenching process, a ground state
fluorophore (F) first absorbs light and is excited to the singlet excited state (F*). When
F* returns to the ground state via photon emission, it produces fluorescence. However,
quenching occurs when F* interacts with a species which causes the fluorescence
intensity or lifetime be reduced. In fact, quenching is a subcategory of energy/electron
transfer (refer to section 1.3.2) and the molecular wire effect makes CPEs superior
candidates for sensing applications compared to small dyes (see section 1.3.3).
One of the early CPE-based sensors exploiting the amplified quenching
mechanism was reported by Whitten and co-workers (Figure 1-23).93 Biotin-
functionalized viologens quench the emission of MPS-PPV very efficiently in aqueous
solution. But, the fluorescence is recovered by addition of avidins to the solution.
Avidins can bind very strongly with biotins and prevent the viologen quenchers to
approach the MPS-PPV chain. Therefore, the quenching is stopped which induces the
recovery of CPE emission. This system exhibits high sensitivity for the detection of
avidins.
49
Figure 1-22. Schematic representation of simplified Jablonski diagram and quenching. Figure was reprinted from Lakowicz with permission.71 Copyright 2007 Springer.
Figure 1-23. Detection of avidins with MPS-PPV via amplified quenching mechanism. Figure was reprinted from Whitten.93 Copyright 1999 United States National Academy of Sciences.
Polymer conformation change provides another useful mechanism for sensing
applications. Schanze and co-workers studied the Ca2+-induced aggregation of PPE-
CO2- and the quenching behavior by methyl viologen (MV2+).94 Divalent cation Ca2+
serves as a bridge between negatively charged polymers and causes the polymer
chains to aggregate. In the aggregated state, the overall quantum yields of CPEs
decreases. Quenching is more efficient, probably because the diffusion of the exciton is
three-dimensional within the aggregates, which increases the probability of quenching.
Another important application of CPEs is in antimicrobials. For several decades,
quinolones, gylcopeptides, and streptogramins, which were introduced in the mid- 20th
50
century, were the only options for antimicrobial applications. One serious crisis can
arise due to the bacterial resistance which limits the usefulness of these drugs.
Therefore, new antibacterial materials are needed to resolve the crisis. Photo-dynamic
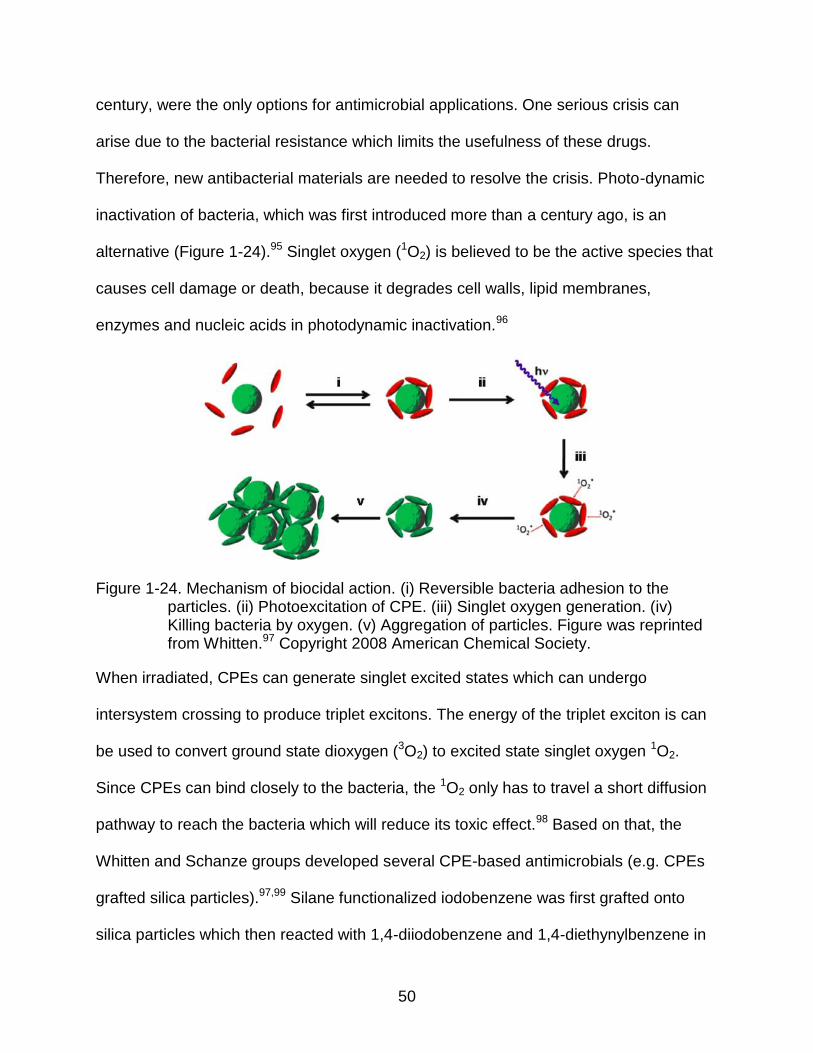
inactivation of bacteria, which was first introduced more than a century ago, is an
alternative (Figure 1-24).95 Singlet oxygen (1O2) is believed to be the active species that
causes cell damage or death, because it degrades cell walls, lipid membranes,
enzymes and nucleic acids in photodynamic inactivation.96
Figure 1-24. Mechanism of biocidal action. (i) Reversible bacteria adhesion to the particles. (ii) Photoexcitation of CPE. (iii) Singlet oxygen generation. (iv) Killing bacteria by oxygen. (v) Aggregation of particles. Figure was reprinted from Whitten.97 Copyright 2008 American Chemical Society.
When irradiated, CPEs can generate singlet excited states which can undergo
intersystem crossing to produce triplet excitons. The energy of the triplet exciton is can
be used to convert ground state dioxygen (3O2) to excited state singlet oxygen 1O2.
Since CPEs can bind closely to the bacteria, the 1O2 only has to travel a short diffusion
pathway to reach the bacteria which will reduce its toxic effect.98 Based on that, the
Whitten and Schanze groups developed several CPE-based antimicrobials (e.g. CPEs
grafted silica particles).97,99 Silane functionalized iodobenzene was first grafted onto
silica particles which then reacted with 1,4-diiodobenzene and 1,4-diethynylbenzene in
51
solution to give polymer coatings. When exposed to light, bacteria which were
accompanying or in in the vicinity of the particles were killed effectively.
Figure 1-25. Schematic illustration of drug release. A) PFO/PG complex and B) drug
release process. Figures was reprinted from Wang.100 Copyright 2010 American Chemical Society.
CPEs are also outstanding candidates for drug and gene delivery, because the
fluorescence change can be used to monitor the release process in vivo.21,25 Wang and
co-workers designed several drug delivery systems and one example is shown in Figure
1-25.100 Positively charged poly(9,9-dioctylfluorenyl-2,7-diyl) (PFO) forms a complex
with anionic poly(L-glutamic acid) which is conjugated with an anticancer drug through
electrostatic interaction. The PFO alone shows very strong fluorescence, but upon
interaction with drugs, the fluorescence is quenched by the drug via an electron-transfer
mechanism. However, upon hydrolysis of the poly(L-glutamic acid), the drug is
released, thereby stopping the electron-transfer process and recovering the
fluorescence of the PFO. The quenching and recovery of fluorescence make it very
convenient for monitoring drug release.
52
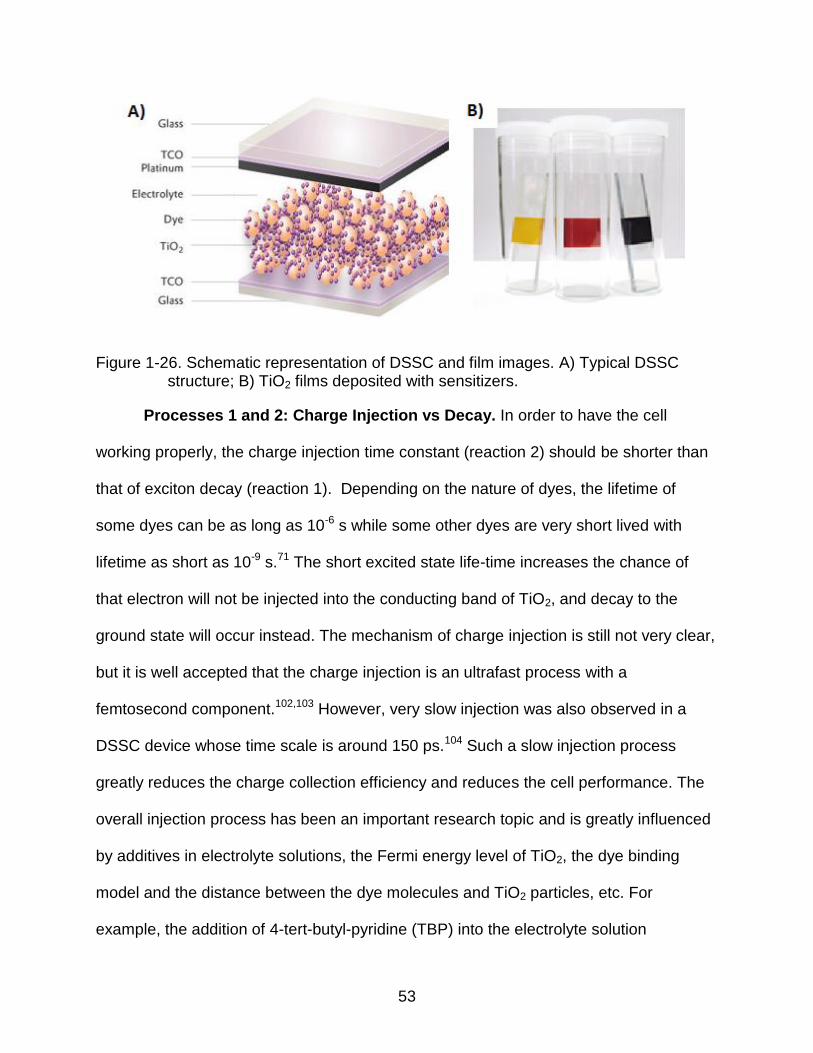
Dye-Sensitized Solar Cells (DSSCs)
Because of the increasing demand for energy, the depletion of fossil fuels and
the environmental impact associated with the use of non-renewable energy resources,
“green” energy technology has drawn significant attention recently. Dye-sensitized solar
cells (DSSCs) are among the most important emerging photovoltaic devices which can
be alternatives to traditional inorganic solid state solar cells. A typical DSSC structure is
shown schematically in Figure 1-26. It is made of a transparent nanoporous
semiconductor electrode on a transparent conducting optical glass (TCO), a thin layer of
light-harvesting materials on the surface of the semiconductor electrode (usually
titanium dioxide, TiO2), a counter electrode, and redox electrolyte solution (I-/I3-, for
example) filling the pores. Under working conditions, the light harvesting materials
(dyes) absorb sunlight and promote ground state electrons to the excited state. The
excited state electrons are injected into the conduction band of TiO2, leaving the
oxidized dyes behind. The electrons go through the circuit to deliver work. After losing
energy, electrons can reduce I3- to I-. The oxidized dyes are reduced by I- and the same
process is repeated.101
Operational principles of DSSCs
Under working conditions, many photo/electro-chemical reactions occur as
shown in a simplified energy diagram (Figure 1-27 (a)) with different time constant
(Figure 1-27 (b)). There are both desired reactions, such as reactions 0, 2, 3, 4 and 7,
and undesired reactions, listed as 1, 5 and 6, which need to be hindered.
53
Figure 1-26. Schematic representation of DSSC and film images. A) Typical DSSC structure; B) TiO2 films deposited with sensitizers.
Processes 1 and 2: Charge Injection vs Decay. In order to have the cell
working properly, the charge injection time constant (reaction 2) should be shorter than
that of exciton decay (reaction 1). Depending on the nature of dyes, the lifetime of
some dyes can be as long as 10-6 s while some other dyes are very short lived with
lifetime as short as 10-9 s.71 The short excited state life-time increases the chance of
that electron will not be injected into the conducting band of TiO2, and decay to the
ground state will occur instead. The mechanism of charge injection is still not very clear,
but it is well accepted that the charge injection is an ultrafast process with a
femtosecond component.102,103 However, very slow injection was also observed in a
DSSC device whose time scale is around 150 ps.104 Such a slow injection process
greatly reduces the charge collection efficiency and reduces the cell performance. The
overall injection process has been an important research topic and is greatly influenced
by additives in electrolyte solutions, the Fermi energy level of TiO2, the dye binding
model and the distance between the dye molecules and TiO2 particles, etc. For
example, the addition of 4-tert-butyl-pyridine (TBP) into the electrolyte solution
54
increases the energy level of conduction band edge and increases the energy overlap
of the excited state dyes and the TiO2 conducting band (Figure 1-28).75
Figure 1-27. Reactions in DSSCs. A) Energy diagram; B) time constant. Figures were reprinted from Hagfeld.101 Copyright 2010 American Chemical Society.
Figure 1-28. Energy level change with and without TBP. Figures were reprinted from
Hagfeld.101 Copyright 2010 American Chemical Society.
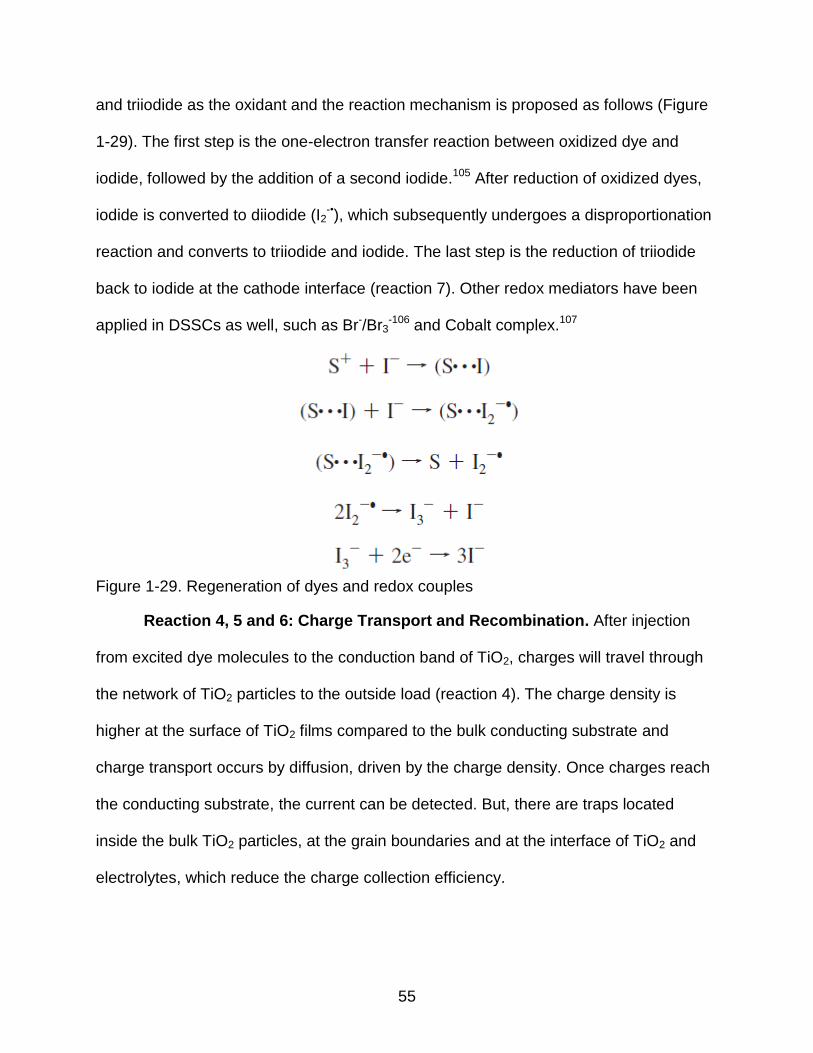
Reactions 3 & 7: Regeneration of Dyes and Redox Couples. In order to have
the cell working in a continuous manner, the oxidized dye has to be reduced to the
ground state (regeneration of dyes, reaction 3). The time constant in this reaction is
limited by the diffusion of the redox couple. For example, in a non-viscous solvent, like
dimethylformamide (DMF), the diffusion rate constant is around 109-1010 M-1s-1 and the
time constant of regeneration is about 1-10 ns with normal redox couple concentrations
(~0.1 M). Iodide/triiodide (I-/I3-) is a common redox couple with iodide as the reductant
55
and triiodide as the oxidant and the reaction mechanism is proposed as follows (Figure
1-29). The first step is the one-electron transfer reaction between oxidized dye and
iodide, followed by the addition of a second iodide.105 After reduction of oxidized dyes,
iodide is converted to diiodide (I2-•), which subsequently undergoes a disproportionation
reaction and converts to triiodide and iodide. The last step is the reduction of triiodide
back to iodide at the cathode interface (reaction 7). Other redox mediators have been
applied in DSSCs as well, such as Br-/Br3-106 and Cobalt complex.107
Figure 1-29. Regeneration of dyes and redox couples
Reaction 4, 5 and 6: Charge Transport and Recombination. After injection
from excited dye molecules to the conduction band of TiO2, charges will travel through
the network of TiO2 particles to the outside load (reaction 4). The charge density is
higher at the surface of TiO2 films compared to the bulk conducting substrate and
charge transport occurs by diffusion, driven by the charge density. Once charges reach
the conducting substrate, the current can be detected. But, there are traps located
inside the bulk TiO2 particles, at the grain boundaries and at the interface of TiO2 and
electrolytes, which reduce the charge collection efficiency.
56
Moreover, charge recombination with either oxidized dye or a redox couple is
another process which reduces charge collection efficiency. There are still debates on
the driving force of recombination. Some results show that, like charge transport, charge
recombination is also controlled by diffusion; i.e., the collision of electrons with oxidized
dyes or redox molecules.108 However, there are also studies showing that
recombination kinetics lies in the inverted Marcus region, where the driving force (∆G) is
smaller than the reorganization energy (λ) and an increase in driving force will decrease
the recombination rate (Equation 1-7).109 Redox couples have been found to have a
huge impact on charge recombination in DSSCs. One way to characterize
recombination is to determine the lifetime of electrons which can be obtained using
transient absorption technique. It has been found that the electron lifetime in a system
with iodide/triiodide is longer compared to most other systems which makes
iodide/triiodide a very successful redox couple in DSSCs.110
Solar cell characterization
There are several common parameters to characterize cell performance. The
incident photon-to-current efficiency (IPCE) indicates the efficiency of a device
converting photons to electricity at a certain wavelength, which is given by:
𝐼𝑃𝐶𝐸(𝜆) =𝑛𝑒𝑙𝑒𝑐𝑡𝑟𝑜𝑛𝑠
𝑛𝑝ℎ𝑜𝑡𝑜𝑛𝑠=
𝐼𝑒⁄
𝑃ℎ𝜈⁄
=𝐼
𝑃×
1240
𝜆(𝑛𝑚)
Where I is the photocurrent measured in A/m2, P is the incident light power with unit of
W/m2 and λ is the incident wavelength in nm. However, it is important to note that the
actual number of photons absorbed is almost impossible to measure due to light
scattering and transmission in the device. So the number calculated in the above
equation represents the lower limit.
57
The photocurrent density-voltage behavior (J-V) is another important criterion to
characterize solar cells (Figure 1-30). Short-circuit current density (Jsc) is the current for
unit area under short-circuit condition. The open-circuit potential (Voc) is the maximum
potential that can be obtained when a cell is under open circuit conditions. It is also the
energy difference between the Fermi level of the semiconductor electrode under
working conditions and the Nernst potential of the redox couple. The fill factor (FF) is
the ratio of the maximum output, JoptVopt, to JscVoc (FF=(JoptVopt)/(JscVoc)) and is affected
by many factors, such as internal resistance. Overall cell efficiency (η) is the ratio of the
maximum output to the incident light energy (η=( JoptVopt)/Pin).
Figure 1-30. A typical DSSC J-V curve. Figure was reprinted from Huang et al.111 Copyright 2007 Bentham Science Publishers Ltd.
Materials used in DSSCs
Metal Oxide Anode. The use of mesoporous TiO2 as anode is one of the most
important reasons for the high efficiency of DSSCs. In nature, there are three types of
TiO2 crystals: rutile, anatase and brookite. Although rutile is the most thermodynamically
stable form, anatase is the most used structure in DSSCs, due to larger bandgap and
higher conduction band edge, Ec, which increases the Fermi energy level and Voc. In
58
DSSC applications, mesoporous TiO2 is used instead of single crystals, because
mesoporous materials have larger surface area, which increases the amount of dyes
absorbed. For better cell performance, many improvements have been made on the
architectures of the TiO2 layer. A typical high performance DSSC device usually
employs multiple TiO2 layers, and each layer has a different thickness and the size of
TiO2 in each layer may vary. First, a blocking layer (~50 nm thick) is coated on the TCO
substrate to prevent direct contact of the redox couple with the substrate and reduce
charge recombination. Second, an active dye absorbing layer (~10-20 µm thick) is
deposited onto of the blocking layer. This layer utilizes mesoporous TiO2 with diameter
of ~20 nm, and offers a large surface area for efficient dye uptake. Third, a light
scattering layer (~3 µm thick) consisting of ~400 nm TiO2 particles is deposited to give
effective scattering and to increase the chance of incident light being harvested by dyes.
Last, the entire structure is treated with aqueous TiCl4 to obtain an ultrapure TiO2 shell
coating, which increase electron lifetime and lower the energy barrier for charge
injection.
In addtion, TiO2 nanostructures with well-defined morphology, such as nanorods,
nanotubes and nanowires, have been developed to improve the charge transport
efficiency.112 The highly oriented nanostructures are expected to better allow electrons
to reach the TCO-electrode surface. Some other materials are also used as DSSC
electrode materials, such as zinc oxide (ZnO), tin(II) dioxide (SnO2) and niobium
pentoxide (Nb2O5). Zinc oxide was initially used in DSSC and has gained significant
attention recently. Its bandgap and conduction band edge are similar to those of TiO2
59
and electron mobility is higher. However, the chemical stability hinders its application,
since ZnO decomposes under both acidic and basic condition.
Figure 1-31. Examples of TiO2 nanostructures. A) nano tubes, B) nano particles, C) nano rods, D) nano wires. Figure was reprinted from Chen et al.112 Copyright 2007 American Chemical Society.
Dyes. Development of novel dyes has been crucial in achieving high
performance DSSC and the number of publications concerning this topic increases
each year. The characteristics of ideal dyes should meet several requirements: (1) Dyes
should have high molar extinction coefficiency and broad absorption in the visible and
near-infrared (NIR) region to ensure efficient photon harvesting. (2) They have to be
able to bind strongly with the metal oxide electrode and usually this is achieved by
functionalizing the molecules with anchoring groups, such as -CO2H, -H2PO3 or -CN. (3)
Dyes must have suitable energy levels: the excited state energy level should be higher
60
than the conduction band edge of electrodes for electron injection purposes, and the
reduction potential of the oxidized dye has to be more positive than that of the redox
couple for dye regeneration. (4) The dyes need to be both photochemically and
thermally stable for long term applications. (5) The binding and aggregation behaviors
also need to be optimized to boost cell performance.
Organometallic compounds, especially ruthenium (Ru(II)) complexes (Figure 1-
32), have found great success in DSSC applications due to their superb properties:
broad absorption spectra, high extinction coefficient, suitable energy levels, long-lived
excited state, fast electron injection and good stability. The light harvesting properties
are largely attributed to the absorption in the visible region due to a metal-to-ligand
charge transfer (MLCT). Therefore, the electronic interaction between d orbitals of the
central metal and π* ligands (d(π)→π*) is the key to tune the absorption spectra.
Ruthenium compounds are dπ6 coordinated, which means the MLCT absorption can be
tuned by changing the substituents on the ligands or controlling the d(π)→π* back-
bonding donation.113 Anchoring groups are necessary to ensure strong binding of dyes
onto the TiO2 surface and efficient charge injection.
Figure 1-32. Examples of Ruthenium dyes.
Compared to organometallic compounds, pure organic dyes have many
advantages and are emerging as a class of competing materials for DSSC
61
applications.111 In general, organic dyes have higher molar extinction coefficient than
metal complexes, leading to increased light harvesting efficiency and reducing the
amount of dyes needed in the cell. In addition, the donor-acceptor structure can be
easily modified and the absorption spectra are easily tuned. With the development of
computational chemistry, the photophysical properties and energy levels of new dyes
can be more accurately predicted. Furthermore, the cost of organic dyes is less than
that of organometallics and the supply is abundant. One approach for dye design is to
construct donor-acceptor (D-A) structures and the charge transfer from donor to
acceptor accounts for the absorption in the long wavelength region. The absorption
spectra can be tuned by changing the relative strength of the donor/acceptor (i.e.
stronger D-A interaction will lead to more red-shifted absorption). Traditionally, organic
dyes have the disadvantage of having sharp absorption peaks instead of a broad
absorption across a large spectral region, decreasing light absorbing ability. However,
upon careful design of the D-A structure, black dyes which have strong absorption
across the entire visible region can be synthesized.114,115 Co-absorbing is another
approach to overcome the shortcomings of organic dyes. Mixtures of two or more dyes
with complementary absorption spectra are co-adsorbed onto TiO2, thereby broadening
the overall absorption spectrum.116
Electrolyte Solution. A typical electrolyte solution is made of a solvent, redox
couples and additives. Iodide/triiodide was the first redox couple used in DSSCs and is
still the most common redox couple. Iodide/triiodide couple has a suitable redox
potential, high diffusion co-efficiency and can undergo fast redox reaction. Research on
this combination is mainly focused on the effects of different cation on cell performance.
62
For example, it has been found that the Voc increases with cation size in the alkali metal
family: Li+<Na+<K+<Rb+<Cs+.117 However, the photochemical stability issue and
corrosive nature of iodide/triiodide triggered the search for alternative redox couples.
One approach is the use of pseudohalogens, such as SCN-/(SCN)3- and SeCN-
/(SeCN)3-, which can generate similar Voc, but they still have stability issue. Another
approach is to use transition metal mediators, such as Co2+/3+ systems, which undergo
rapid redox reactions but have the problem of increasing the probability of charge
recombination reactions.118
In the early days of DSSC development, liquid electrolyte solutions were
exclusively used. The general requirements of electrolyte solution are: (1) a good
solvent for the redox couple and other additives; (2) chemical stablity to maintain
reasonable cell lifetimes; (3) low viscosity to facilitate efficient materials transport and
electrochemical reactions; (4) no tendency to hydrolyze dyes or dissolve metal oxide
electrodes. For the purpose of sealing the cell, the electrolyte solution should be
compatible with sealing materials (i.e. not capable of dissolving the sealing materials,
otherwise solution leakage can be a problem). Polar organic solvents with high boiling
points have been the major choices, such as nitriles, DMF, carbonate, etc. There are
also attempts to use gels or polymers as the electrolytes. But, in general, cells applying
gel or polymer electrolytes show lower efficiency due to the lower mobility of the redox
couple in those matrixes.
Additives have been a key component in increasing the cell efficiency, but their
specific function is usually not clear. In most cases, the effects have been attributed to
suppressing of charge recombination or shifting of the conduction band edge. For
63
example, 4-tert-butylpyridine (TBT) has been widely used in DSSCs which usually
increases Voc significantly. Some investigation showed that TBP suppressed the dark
current on the TiO2 surface and improved the photovoltage,119 while others claimed that
TBP with the presence of lithium cations can increase the band edge of the TiO2
electrode.120
Scope of Present Study
The purposes of present study are to design and synthesize variable chain length
poly(phenylene ethynylene)s with end-caps, investigate their aggregation properties in
solution and ultrafast energy/electron transfer and apply these materials in dye-
sensitized solar cells.
Chapter 2 describes the synthesis of two families of conjugated polyelectrolytes
(CPEs) featuring the same backbone but different side chain linkages and demonstrates
their application as active materials for dye-sensitized solar cells (DSSCs). It is found
that CPEs bearing an oxygen linkage (-O-) are more likely to form aggregates in
solution, and that the aggregation status depends strongly on the molecular weights. In
contrast, there is no obvious evidence showing that CPEs with methylene (-CH2-)
linkages aggregate in solution. In addition, the two families of polymers show different
trends in adsorbing onto mesoporous TiO2 films and different overall cell efficiencies.
The oxygen linkage family shows strong chain length dependence on film adsorption
and, therefore, the cell performance. In contrast, little difference can be observed in the
methylene linkage family.
In Chapter 3, a series of different chain length poly(p-phenylene-ethynylene)s
(PPEs) with naphthalene diimide derivative end-caps were synthesized. When polymers
are photoexcited, the electron will transfer from the PPE backbones to naphthalene
64
diimide, thereby quenching the polymer fluorescence. The overall quenching efficiency
increases with decreasing polymer chain length, as evidenced by fluorescence quantum
yield measurement. And the charge recombination rate was investigated by ultra-fast
transient absorption spectroscopy. The charge recombination rate also depends
strongly on the chain length: as the chain length increases, the charge recombination
rate decreases.
In Chapter 4, a series of different chain length poly(p-phenylene-ethynylene)s
(PPEs) with 4,7-di(thiophen-2-yl)benzo[c][1,2,5]thiadiazole (TBT) end-caps were
synthesized. Under light irradiation, energy transfer from the PPE backbone to the TBT
end-groups occurs via the Forster Resonance Energy Transfer (FRET) mechanism. The
overall energy transfer efficiency increases with decreasing molecular weight while the
fluorescence lifetime remains almost the same. Ultra-fast transient absorption study
shows that the energy transfer happens in pico-second time scale for all the polymers
and the lower molecular weight samples show faster decay in the initial stage.
In Chapter 5, a series of different chain length “through-space” conjugated
polymers with [2.2]paracylophane moiety end-caped with TBT were synthesized.
Despite the fact that the conjugation is interrupted, very efficient energy transfer can still
be observed and the overall energy transfer efficiency also depends on the molecular
weight. Fluorescence lifetime study reveals that there is a rising time in the energy
transfer process for the sample with longest chain length, which indicates there is
distance limitation on exciton hopping.
65
CHAPTER 2 CONJUGATED POLYELECTROLYTE SENSITIZED TIO2 SOLAR CELLS: CHAIN
LENGTH AND AGGREGATION EFFECTS ON EFFICIENCY
Background
Dye-sensitized solar cells (DSSCs) are one of the most important low-cost
alternatives to conventional silicon based inorganic solar cells.101,121 Since the first
report of the technology, it has drawn significant attention from the scientific
community.122 A great deal of effort has been made to understand the fundamental
problems, improve the overall cell efficiency, and explore the possibility for
commercialization. And there are several advantages of the DSSC format compared to
the traditional solar cells, which include the use of low-cost materials, mechanical
flexibility and possibility of large scale manufacture. Originally, metal-organics, in
particular ruthenium and metal-porphyrin complexes, have been utilized as the
sensitizers and demonstrated power conversion efficiency (PCE) as high as 13% and
incident photon to current efficiency (IPCE) higher than 85%.123 Meanwhile, donor-π-
bridge-acceptor (D-π-A) type organic dyes are emerging as a new class of sensitizers
and upon careful structure design, they can also attain efficiencies matching that of
inorganic dyes.124,125 More recently, highly effective hybrid perovskite cells have been
made, achieving efficiency as high as 19.3%.126
Conjugated polyelectrolytes (CPEs) are -conjugated polymers with ionic
pendant chains. Some of the key advantages of CPEs are strong absorption in the
visible region, tunable bandgap, and processability from green solvents.90,92 Despite the
advantages, the application of CPEs as sensitizers in DSSCs has not been well studied.
Schanze and Reynold’s groups have conducted innovative research in CPE based
DSSCs.127-130 In most cases, the work has been focused on the design of novel D-A
66
structure CPEs, which are believed to facilitate intramolecular charge transfer (ICT)
from donor to acceptor resulting in lower bandgap. Such polymers show broad
absorption and large extinction coefficients, both of which are crucial to efficient light
harvesting. However, recently both Schanze and Ramakrishna groups noticed that
polymer chain length can also have a significant impact on the overall cell performance
when CPEs were used as the sensitizers for DSSCs.131,132 The authors attributed the
decreasing of cell efficiency of large molecular weight polymers to the fact they have
larger size which reduces the penetration ability into the TiO2 layers and total amount of
sensitizers absorbed. Very similar phenomenon has also been found in case of
dendrimers where overall cell efficiency decreases with increasing dendrimer size.133,134
In this work, we study the relationship between overall cell efficiency and
molecular weight of two series of CPEs which feature the same conjugated backbone
with alternating (1,4-phenylene) and (2,5-thienylene ethynylene) repeating units, but
different linkages between the backbone and carboxylic side chains, namely oxy-
methylene (-O-CH2-) (P1-O-n) and methylene (-CH2-) (P2-C-n), respectively. In addition,
a model compound was synthesized to compare its properties with the polymers. The
polymer backbone structure was chosen mainly due to the ease of synthesizing building
blocks and convenience of controlling molecular weight via the end-capping strategy.
The carboxylic side chains help the polymers adsorb onto the surface of TiO2 films and
ensure that polymers are in close proximity to the TiO2 film, which facilitates charge
injection. Steady state absorption and emission spectra of polymers were taken to
compare photophysical properties and dynamic light scattering was applied to
investigate polymer aggregation in solution. When used in DSSCs, the efficiencies of
67
P1-O series showed a strong dependence on molecular weight, while that of P2-C
series did not change regardless of chain length. The results showed here clearly
demonstrated that slight change in side chain could have a huge impact on the
aggregation behaviors of polymers and solar cell performance.
Results and Discussion
Synthesis
In this study, two families of polymers, P1-O and P2-C, were synthesized which
feature the same conjugated backbone with alternating (1,4-phenylene) and (2,5-
thienylene ethynylene) repeating units, but have different linkages between the
backbone and side chains, namely oxy-methylene (-O-CH2-) and methylene (-CH2-),
respectively. For comparison, a model oligomer which has similar structure to the
polymers was also prepared. The structures of the polymers and oligomer are shown in
Figure 2-1. All the samples feature carboxylic acid side groups which help improve
polymer solubility in solution and serve as anchoring groups for film adsorption.
Figure 2-1. Structure of P1-O-n, P2-C-n and the Model compound
68
Figure 2-2. Synthesis of polymers.
Polymers were synthesized via the “precursor route” in which the carboxy groups
were protected as esters. The ester protected polymers were hydrolyzed and then
acidified to obtain the carboxylic acid substituted polymers. Due the fact that 2,5-
diethynyl-thiophene is not stable, 2,5-bis((trimethylsilyl)ethynyl)thiophene was used in
the polymerization reaction and trimethylsilyl groups were deprotected in situ with
tetrabutylammonium difluorotriphenylsilicate (TBAT). Polymerization between 3 and 1 or
2 afforded polymer P1-O-DP-n and P2-C-DP-n, respectively. The polymer chain length
was controlled by applying the “end-capping” strategy in polymerization by adding
mono-functioned end-cap to the reaction.60,62 Once end-caps react with polymer chains,
69
polymerization process is terminated. Polymer molecular weight decreases with
increasing molar ratio of end-caps in the reaction. The molecular weights and degree of
polymerization (DP) of polymers were characterized by GPC using dodecyl ester
protected polymer precursors.
Figure 2-3. GPC analysis of polymers. A) P1-O-n-ester-n: P1-O-ester-7 (black square,
Proton NMR is also used to calculate the number of repeating units and
characterize the molecular weight. Chemical shift of the aromatic protons of 1-iodo-4-
(trifluoromethyl)-benzene appear at around 7.64 ppm while the thiophene aromatic
protons are at around 6.96 ppm in P1-O-n-esters polymers. Chemical shifts of tert-butyl
protons are at around 1.45 ppm while the methylene protons are at around 1.25 ppm in
P2-C-n-ester polymers. Proton signal integrations are used to calculate the molar ratio
of functional groups and the number of repeating units is derived from the calculation.
The results obtained by both methods are quite comparable and listed in Table 2-1.
70
Figure 2-4. 1H-NMR characterization of polymers. A) 1H-NMR of P1-O-n-ester at the
aromatic region; B) 1H-NMR of P2-C-n-ester at the alkane region.
Table 2-1. Molecular weight table of P1-O, P2-C and Model compound
Mn(g/mol)a Mw(g/mol)a PDI DP(GPC)b DP(NMR)c
P1-O-7-ester 5000 7700 1.55 7 6
P1-O-9-ester 6600 10200 1.53 9 8
P1-O-14-ester 9900 17200 1.74 14 13
Model-ester 866 866 \ \ \
P2-C-7-ester 5100 9500 1.87 7 7
P2-C-12-ester 8400 17000 2.00 12 11
P2-C-18-ester 13000 26000 1.98 18 17 a Narrow-dispersed polystyrenes were used as the standard. b Degree of polymerization was calculated using Mn obtained by GPC. c Degree of polymerization was calculated using signal intensity integration ratio from 1H-NMR.
The model compound was synthesized in a stepwise route (Figure 2-5). Reaction
of compound 4 with trimethylsilyl acetylene (TMSA), followed by deprotection, yielded
compound 5. And, compound 5 was reacted with 2,4-diiodothiophene to give compound
6, which was used to couple with compound 7 to get compound 8 (ester protected
model compound, Model-ester). Finally, compound 8 was hydrolyzed under basic
condition and acidified to afford the model compound.
Dynamic Light Scattering (DLS) has been widely used for the characterization of
polyelectrolyte samples.135,136 In this work, DLS measurements were performed to study
the size of the polymer chains in DMF and the concentration was set at 0.1 mg/ mL
which was the same used for adsorption on TiO2 films. As shown in Figure 2-6, the
model compound has smaller size (about 2 nm) compared to polymer samples. And,
the sizes of the P2-C series remain fairly the same (about 7 nm). It is well known that
the radius of gyration of polyelectrolytes stays constant in a wide range of different
molecular weight which explains the trend for the P2-C series.137,138 In contrast, the
particle size of P1-O increases (from ~6 nm for P1-O-7, ~12 nm for P1-O-9, to ~13 nm
for P1-O-14) with increasing molecular weight. The increasing particle size for P1-O
72
series might be caused by aggregation. Higher molecular weight polymers are more
likely to form bigger aggregates, therefore, the average polymer size increases
significantly as well.62
Figure 2-6. DLS characterization of samples in DMF (solution concentration=0.1 mg/ml).
Previous work from our lab show that despite the similarities in the backbone
structures, the side chain linkages can make a difference in the aggregation state of
polymers in solution.21,139,140 While polymers with –O-CH2- linkages aggregate in
solution, polymers which have –CH2- linkage show surprisingly reduced tendency of
aggregation in solution. The difference might be caused by the electronic effect of the
oxygen atoms or the oxygen substituents being able to stabilize the stacked polymer
chains.139 It has been reported that P2-C series adopt ellipsoidal conformation instead
of rigid-worm like chains in solution.21 Our previous AFM results showed that the
diameter of the ellipsoidal polymer chain is about 47±3 Å. The DLS particle size of the
P2-C series is in good agreement with previous atomic force microscopy (AFM) result (7
nm vs 5 nm). Therefore, P2-C series are more like to be monomeric in solution while the
P1-O series are aggregated. Although the end-caps are different in the two series of
polymers, they do not affect the aggregation status.62,139,141
73
Optical Properties in Solution
Steady-state UV-visible absorption and emission spectra of the samples were
measured in dimethylformamide (DMF) (Figure 2-7), and the concentration of the
samples was adjusted to 50 µg/ml (based on repeat units). Molar extinction coefficiency
and fluorescence quantum yield are listed in Table 2-2. As shown in Figure 2-7 a and c,
the absorption spectra are similar for both series and the absorption maximum is red-
shifted as the molecular weight increases, because of the increasing in the conjugation
length (424 nm, 425 nm and 432 nm for P1-O-7, P1-O-9, P1-O-14, respectively; 388
nm, 398 nm and 407 nm for P2-C-7, P2-C-12 and P2-C-18, respectively). The
absorption spectra of the P1-O series red-shift about 25 nm compared to the P2-C
series, due to the fact that oxy-methylene is a stronger donor than the methylene group,
which increases the HOMO energy level. Finally, the absorption maximum of the model
compound is blue-shifted about 20 nm compared to P1-O series, due the significant
decrease in conjugation length.
Table 2-2. GPC results and photophysical data
Mna PDI DP λabs(nm) ε(104 cm-1
M-1) λem(nm) φfl
b
P1-O-7 5000 1.6 7 424 3.1 528 0.14
P1-O-9 6600 1.5 9 425 3.5 531 0.091
P1-O-14 9900 1.7 14 432 3.8 542 0.071
Model 866 \ \ 408 9.9 470 0.39
P2-C-7 5100 1.9 7 388 5.1 456 0.12
P2-C-12 8400 2.0 12 398 5.5 456 0.12
P2-C-18 13000 2.0 18 407 5.9 457 0.13
a narrow dispersed polystyrene was used as the standard. b measurement was done in pH=8 water with the P1-O-n-salt and P2-C-n-salt samples, and Quinine Sulfate in 0.1 M H2SO4 as standard, φfl=0.545.
74
Figure 2-7. The ground state absorption and emission spectra. A) UV-vis absorption and B) emission spectra of P1-O-7 (black square), P1-O-9 (red circle), P1-O-14 (blue up triangle) and model compound (dark cyan down triangle); C) UV-vis absorption and D) emission spectra of P2-C-7 (black square), P2-C-12 (red circle) and P2-C-18 (blue triangle).
Figure 2-7 b and d show the fluorescence emission of P1-O and P2-C series
respectively. Despite the increasing chain length, the emission peak shows only a slight
change for the P2-C series with emission maximum at around 456 nm. In comparison,
the emission maximum of P1-O-14 is red-shifted 10 nm compared to P1-O-9 which
indicates the formation of aggregates of P1-O-14. In addition, P2-C series show more
structured emission compared to the P1-O series; this should also be due to the fact
that P2-C is more likely to be monomeric in solution.142 Moreover, the emission intensity
of the vibrational band of the P2-Cs increases with molecular weight. Finally, the model
compound has more blue shifted and narrower emission band compared to P1-O-n
75
polymers. The aggregation status has a significant effect on the overall fluorescence
quantum yields as well. The fluorescence quantum yields of P1-O-n polymers decrease
with increasing molecular weight. The quantum yield of P1-O-7 is as high as 14% while
that of P1-O-14 decreases to 7.1%. In contrast, P2-C-n polymers show almost the same
quantum yield (~12-13%) regardless the molecular weights and the model has a
quantum yield of 39%.
TiO2 Film Characterization, Polymer Adsorption and Charge Injection
The detailed information for making nanocrystalline TiO2 colloids and DSSC cell
fabrication are provided in the experimental section. It is worth noting that in most
literature reports, the size of TiO2 particle used varies from 20 nm to 30 nm to achieve
high efficiency and most researchers have applied a three-layer TiO2 film: a blocking
layer, an active layer and a scattering layer. However, it was not our goal to produce
high performance cells, only a single layer TiO2 was used to facilitate photophysical
characterization of films. Because, the single layer film is more transparent than multi-
layer films and makes UV-vis absorption and transient absorption measurements
easier. The TiO2 particle has an average size of 20 nm and the film thickness is around
13 µm, according to the scanning electron microscope (SEM) images (Figure 2-8).
Figure 2-8. SEM characterization of TiO2 films. A) Top view of the film and B) side view
of the film intersection.
76
UV-visible absorption spectroscopy was used to monitor the adsorption of the
P1-O-n and P2-C-n polymers. All the bare TiO2 films have little absorption beyond 380
nm due to light scattering and all the films have very similar thickness according to SEM
images. For film adsorption, a solution of 0.1 mg/mL of polymer in DMF was stirred for
24 h before the TiO2 electrodes were immersed into it and soaked for 36 h. The UV-vis
absorption of the resulting polymer coated film was measured and the film absorptance,
(which can be calculated as absorptance = 1 – 10-A, where A is the film absorption), was
plotted in Figure 2-9. It’s interesting that the peak absorptance of P1-O-n sensitized
films increases with decreasing molecular weight while the P2-C-n sensitized films show
almost identical peak absorptance.
Figure 2-9. Absorptance of polymer sensitized films. A) Absorptance of P1-O-n films and the time dependent absorption (inserted plot): P1-O-7 (black square), P1-O-9 (red circle) and P1-O-14 (blue triangle); B) Absorptance of P2-C-n films: P2-C-7 (black square), P2-C-12 (red circle) and P2-C-18 (blue triangle).
The absorptance is direct proportional to the amount of polymers adsorbed, because
each polymer within a polymer series has very similar molar extinction coefficient and
the amount of polymers adsorbed is only fact that changes the absorptance. For the P1-
O-n polymers, lower molecular weight samples form smaller aggregates and are more
77
likely to penetrate deep into the TiO2 films, which increase the amount of materials
absorbed onto the TiO2 films.131 In contrast, the P2-C-n polymers do not aggregate and
have essentially the same size in solution, therefore, show very similar adsorption
behaviors. In addition, the absorptance curves resemble the absorption spectra, with
higher molecular weight polymers show more red-shifted curves.
In order to further characterize the film absorption properties of P1-O-n series,
time-dependent film absorption measurements were performed. TiO2 films with same
film thickness were contained in polymer solution with same concentration for various
amounts of time and the film absorption was measured. The absorption values at 440
nm were recorded and the calculated absorptance was plotted in Figure 2-9, inset
figure. Absorptance of all films increases with time with the first 15 h showing the most
significant enhancement. Then, it reaches a plateau after 30 h, indicating that the
adsorption is almost saturated and the final absorptance is consistent with film
absorptance data. In addition, at any given time, absorption intensity increases with
Figure 2-10. Calculated surface coverage of polymer sensitized films.
78
The amount of polymers adsorbed can also be characterized by surface
coverage (𝛤, based on polymer repeat units), which can be calculated as:
Γ =𝐴
𝜀
where A is the film absorption and ε is the molar extinction coefficient. In the calculation,
there are two assumptions upon polymer adsorption onto TiO2 films: 1) the polymer
molar extinction coefficient does not change and 2) the changing of UV-vis absorption
spectrum of polymer is negligible. The unit of ε is converted to cm2/mol and Γ has the
unit of mol/cm2. The P1-O-7 has the largest surface coverage in the P1-O-n polymers
while the P2-C-n polymers are almost the same, which is consistent with the film
absorptance results. The amount of polymers adsorbed is about 1.5 x 1016 cm-2, which
is lower compared to small metal-organic or organic dyes (5~20 x 1016 cm-2).133,134,143
Figure 2-11. AFM images of dye-sensitized TiO2 films. AFM images of A) P2-C-18 sensitized TiO2 film; B) P1-0-14 sensitized TiO2 film; C) bare TiO2 film. Root mean square values (RMS) of P2-C-18, P1-0-14, and bare TiO2 are 18.6 nm, 20.5 nm and 17.4 nm, respectively.
The surface morphology of TiO2 films was characterized by AFM (Figure 2-11).
Upon dye deposition on top of TiO2 films, morphology will change which can be
characterized by the root mean square (RMS) roughness of the surface. Compared to
79
the RMS value of bare TiO2 (17.4 nm), that of P2-C-18 sensitized film increased slightly
(from 17.4 nm to 18.6 nm), indicating that P2-C-18 polymers successfully absorbed onto
the film and there is no obvious aggregation on the film surface. However, the RMS
value of film sensitized with P1-O-14 (20.5 nm) is significantly higher than that of bare
TiO2 which was caused by adsorbing of aggregated polymer particles. It has been
reported that dye aggregation reduced electron lifetime and lowered overall cell
performance.144,145 Considering the fact that P2-O-n series show lower absorptance
which means fewer materials absorbed (Figure 2-9), it’s proposed that the aggregated
P1-O-n polymers will cover the film surface and prevent more materials from
penetrating into the inside layer. It’s clear that the aggregation status determines the
film morphology and affect the total amount of materials can be absorbed which
ultimately affect the cell performance significantly.
Figure 2-12. Film transient absorption and kinetics of dye-sensitized TiO2 films. A) Transient Absorption spectra after initial 15 ns camera delay of P1-O-7 (black square), P1-O-9 (red circle), P1-O-14 (blue up triangle) and model compound (dark cyan down triangle) sensitized films; B) kinetic decay of P1-O-DP and Model compound sensitized TiO2 films: P1-O-7 (black), P1-O-9 (red), P1-O-14 (blue) and model compound (dark cyan).
80
Film transient absorption (TA) measurements (Figure 2-12) were performed on
P1-O-n sensitized films to have insight information on charge injection and
regeneration. Polymer sensitized films were contained in sealed cuvettes containing 0.1
M LiClO4 in acetonitrile and degassed for 30 min before measurements. Immediately
after subjection to 355 nm laser excitation pulses, strong transient absorption of polymer
radical cation was observed. Polymers became radical cations after losing electrons
due to charge injection to TiO2 conducting bands. The spectra of all investigated films
are very similar with the radical cation signal rises from approximately 500 nm and the
peak is around 675 nm. The signal intensity of P1-O polymers decreases with molecular
weight, which is consistent with the trend of the film absorptance. Charge recombination
occurs between the polymer cations and the TiO2 conducting band electrons and the
signal decay kinetics were measured at 650 nm and plotted in Figure 2-12 B. The
lifetime of polymers is about several hundred microseconds, which is generally shorter
than organic-metal complexes.146,147 However, a strong electronic coupling between the
polymer sensitizers and the TiO2 conducting band can facilitate the ultrafast electron
injection.148 All the sensitizers have very similar average lifetime (~200 μs), except P1-
O-14 which has the largest aggregation size (Table 2-3). The decreasing lifetime of the
excited electrons can decrease the overall cell performance.149
Model 0.55 6 0.30 80 0.19 927 203 a Exponential decay 2 or 3 was used for fitting and τave was calculated using 𝜏 = ∑𝐴𝑛 ∗ 𝜏𝑛.
81
Polymer Sensitized Solar Cells
The scope of this work is to understand the effects of polymer molecular weight
and aggregation on DSSCs performance rather than achieving high cell efficiency,
therefore, all the cells were fabricated and characterized under the same condition
without seeking to optimize overall performance (varying electrolyte, etc.). The active
areas of cells are 0.2 cm2. Three different batches of devices were prepared for each
sample and the results were consistent for all.
Figure 2-13. IPCE and current-voltage (J-V) characters of polymer cells. A) IPCE and B) J-V curves of P1-O-n and model compound: P1-O-7 (black square), P1-O-9 (red circle), P1-O-14 (blue up triangle) and model compound (magenta down triangle); C) IPCE and D) J-V curves of P2-C-n: P2-C-7 (black square), P2-C-12 (red circle) and P2-C-18 (blue triangle).
82
Incident photon to current efficiency (IPCE) of both P1-O-n and P2-C-n series
were plotted in Figure 2-13. A significant difference in the photovoltaic performance is
observed for the P1-O series while the P2-C-n polymers show little change despite the
difference in molecular weight (Figure 2-11 A). In the P1-O-n polymers, P1-O-7, which
has the lowest molecular weight polymer, shows the highest peak IPCE value (~50%)
and the IPCE value decreases with increasing molecular weight. The IPCE of P1-O-14
is only about half of P1-O-7 (~25%), indicating that the charge injection efficiency will
also be lower. In contrast, all P2-C-n polymers show very high peak IPCE (~48%),
indicating that photoinduced charge injection will be quite efficient at short-circuit
conditions. The trend in peak IPCE value is consistent with the film absorptance (Figure
2-9). The difference in current density of devices is also due to change in total amount
of polymers adsorbed. Although, the model compound shows highest peak IPCE value,
the IPCE response region is narrower.
The same trend can be observed in the J-V curve of the P1-O series (Figure 2-13
B & D), where P1-O-7 shows the highest open-circuit voltage value (Voc, 0.49 V) and
short-circuit current (Jsc, 2.70 mA/cm2), and P1-O-14 has the lowest Voc (0.45 V) and Jsc
(1.56 mA/cm2). This may also be caused by polymer aggregation which affects surface
coverage: less aggregated samples can better cover the TiO2 surface which will reduce
the charge recombination rate between electrons in the conducting band of TiO2 and I-
/I3- electrolytes or dye cations at the interface of TiO2 particle, and increase the open-
circuit voltage and short-circuit current.150,151 The P2-C-n polymers all have the same
Voc and Jsc, but have decreased Voc and Jsc compared to P1-O-7, which are probably
due to lower LUMO energy level and narrower photo response region, respectively.123
83
Although the model compound does not aggregate, the surface coverage is less
efficient than P1-O-n polymers and a slightly lower Voc is observed. The absorbed light
to photon to current efficiency was calculated and the trend is also consistent with film
P2-C-18 0.40 2.39 50.1 47.4 65.2 0.49 a Three cells for each polymer were made and the all the number reported were the average values; b was calculated using 𝐴𝑃𝐶𝐸 = 𝐼𝑃𝐶𝐸𝑚𝑎𝑥/𝐴𝑏𝑠𝑜𝑟𝑝𝑡𝑎𝑛𝑐𝑒.
Summary
Two series of conjugated polyelectrolytes featuring the same alternating (1,4-
phenylene) and (2,5-thienylene ethynylene) repeating units, but with different molecular
weight, were synthesized and utilized as light harvesting materials in DSSCs. DLS and
steady state photophysical studies showed that P1-O series which had oxy-methylene (-
O-CH2-) linkage between the backbone and carboxylic acid group were aggregated in
solution while P2-C series which had methylene (-CH2-) instead were in the monomeric
state in solution. The aggregation state determines the film morphology and affects the
total amount of materials can be absorbed. As a result, the cell efficiency of P1-O series
decreased with increasing molecular weight while cell performance of P2-C series was
independent of molecular weight. Although, the fact causing the difference between
alkyl and oxygen substituents are still not very clear, the results still provide us with
84
guidance of designing molecular structure and controlling molecular weight in achieving
high efficiency DSSCs.
Experiments and Materials
Materials
Unless specified, all compounds and solvents were purchased from commercial
sources (Aldrich, Acros, Strem Chemicals, et al) and used without further purification.
For all palladium-catalyzed reactions, the solvents were carefully degassed with argon
for at least 30 min. 1H and 13C-NMR spectra were recorded on either Inova2 (500 MHz)
or Varian Gemini-300 spectrometer (300 MHz). The chemical shifts (δ) are reported in
parts per million (ppm) using the residual solvent signals as internal standards.
Instrumentation
1H and 13C NMR spectra were measured on Varian Mercury 300, Gemini 300, or
Inova 500 spectrometers. Chemical shifts were referenced to the residual solvent
peaks. High resolution mass spectrometry was performed on a Bruker APEX II 4.7 T
Fourier Transform Ion Cyclotron Resonance mass spectrometer (Bruker Daltonics, MA).
Gel Permeation Chromatography (GPC) data was collected on a system composed of a
Shimadzu LC-6D pump, an Agilent mixed-D column, and a Shimadzu SPD-20A
photodiode array (PDA) detector, with THF as eluent at 1 ml/min flow rate. The system
was calibrated against linear narrow dispersed polystyrene standards in THF.
UV−visible absorption measurements were carried out on a Shimadzu UV-1800
dual beam absorption spectrophotometer. Photoluminescence spectra were recorded
on a spectrofluorimeter from Photon Technology International (PTI). Photo-
luminescence lifetimes were obtained by time-correlated single photon counting
85
(TCSPC) using a Fluo Time 100 (Picoquant), and excitation was provided using a PDL
800-B Picosecond Pulsed Diode Laser (375 nm).
Dynamic light scattering (DLS) characterization was performed on a Zetasizer
Nano (Malvern Instruments, Worcestershire, United Kingdom) at 25°C. The
concentration of the samples was adjusted to 0.1 mg/ml for this measurement. Three
measurement cycles were run for each sample. The data were averaged from 10 light
scattering periods of 10 s for each cycle. Average diameter values were calculated
using the Malvern Instruments DTS software.
Film transient absorption measurements were conducted on a home-built
apparatus. The excitation wavelength was generated by a Continuum Surelite OPO
Plus pumped with the third harmonic (355 nm) of a Continuum Surelite II-10 Nd:YAG
laser. Xenon arc lamp was used as a probe source. Triax 180 Monochromator and Si
amplified photodetector from Thorlabs (PDA8A) were used for detection at single
wavelength. Films were merged in sealed cuvettes containing 0.1 M LiClO4 in
acetonitrile and degassed with Ar for 30 min before measurements. Kinetic trace was
measured at a wavelength of 650 nm. Exponential decay 2 or 3 was used for fitting
(𝑦 = 𝑦0 + 𝐴1𝑒−𝑥
𝑡1 + 𝐴2𝑒−𝑥
𝑡2 or 𝑦 = 𝑦0 + 𝐴1𝑒−𝑥
𝑡1 + 𝐴2𝑒−𝑥
𝑡2 + 𝐴3𝑒−𝑥
𝑡3 ) and the average lifetime
was calculated as 𝜏 = ∑𝐴𝑛𝑡𝑛.
AFM images of polymer-coated TiO2 films and bare TiO2 films were obtained
using Digital Instruments (Vecco) in ambient atmosphere equipped with Nanoscope
controller (Bruker). Tapping mode by an integrated tip/cantilever (125 µm in length with
325 kHz resonant frequency, Mikromasch USA) was used at a scan rate of 1.2 µm/s
86
and 0.1 µm/s with a range of 3µm × 3µm and 0.5 µm × 0.5 µm, respectively, at room
temperature in air.
TiO2 Sol Preparation
The nanocrystalline titanium dioxide (TiO2) electrode and platinum counter-
electrode were prepared according to literature with modifications.152 Detailed
information is provided as below. Titanium isopropoxide (35.52 g) was added to a
separatory funnel containing 10 mL isopropanol. The Ti(i-OPr)4/isopropanol solution
was then added dropwise to acetic acid/H2O (80 mL acetic acid, 250 mL deionized H2O)
that had been pre-chilled to 0oC and was stirred rapidly. Ti(i-OPr)4/ isopropanol was
added over a period of ~20-30 minutes. The reaction solution was then heated to 80oC
using and rapidly stirred the entire time. Upon heating to this temperature, the reaction
solution becomes a thick gel and then later becomes a loose, white colloidal solution.
The reaction solution was heated at 80oC for 8 hours and stirred the entire time.
At the end of the 8 hours, the reaction solution was cooled to room temperature
and ultrasonicated (70% power, pulse on for 1 sec, off for 0.5 sec) for five minutes to
break up TiO2 aggregates. Upon ultrasonication, the colloidal solution becomes clearer
with hints of blue color. The total volume of the colloidal solution was measured at this
time to determine the amount of TiO2 per unit volume. A portion of the colloidal solution
was then placed in a Teflon cup which in turn was placed in an acid digestion bomb and
autoclaved for 13 h at 420 oC (ramp rate = 5 oC/minute). After cooling the bomb to room
temperature, the TiO2 colloid (white solid + colloidal solution) was transferred to a clean
100 mL beaker for ultrasonicating (5 minutes, see above conditions). The resulting
white solution was then concentrate the TiO2 to a final concentration of 12 wt%. For
example, if 80 mL out of a total 370 mL TiO2 colloid is autoclaved, it gives 2.16 g/80 mL
87
TiO2 post-autoclave. It is preferable to concentrate beyond then add deionized water to
give a final weight. It is important to minimize the amount of TiO2 that is “lost” along the
way. It is also important to avoid rotovapping to dryness or partial dryness (i.e. allowing
a significant amount of TiO2 to precipitate out of solution); this seems to significantly
affect DSSC performance.
After acquiring a 12 wt% colloidal solution, hydroxypropylcellulose (HPC) was
added slowly over ~1 minute to a rapidly stirred solution. The HPC concentration is 6
wt% (with respect to total weight of solution) and 50 wt% (with respect to TiO2 weight).
The solution is stirred well for 12-24 hours and then stirred less rapidly for 3-5 days (stir
rate is lowered to avoid “frothy” pastes that are difficult to make thin films with). The TiO2
paste is stored in a brown amber vial until use and stirred continuously. The paste
appears as a semi-viscous white fluid.
Device Fabrication
FTO substrates are cleaned by sonication in pH=13 water containg 2 wt%
sodium dodecyl sulfate (SDS), followed by isopropanol and acetone (20 minutes each).
For depositing thin films, tape-casting is performed using 50 μm scotch tape. The
thickness of the film depends on the number of tape stripes used on either side of the
exposed substrate surface. For example, two layers of tape stripes will give a TiO2 film
thickness of about 15 μm. TiO2 paste is applied to the substrate by pipette and spread
using a razor blade. The thin film is allowed to air dry at room temperature for 10-20
minutes; the films should be crack-free and fairly transparent. The films are then
sintered by slowly heating the films at a rate of 5 oC/min to a final temperature of 450 oC
and maintaining this temperature for 30 minutes. The films are then cooled at a rate of
10 oC/min.
88
And, two holes were drilled at the Pt cathode. A solution of 0.1 mg/ml of polymer
in DMF was stirred for 24 h before the TiO2 electrodes were immersed into it. After 36 h
of absorption, the electrodes were rinsed with dry DMF and acetone to remove the
unabsorbed dyes, and then placed under vacuum for 2 h for further drying. The
platinum cathode and TiO2 anode were sealed together with surlyn (Solaronix Meltonix
1170-25). Electrolyte solution containing 0.05 M I2, 0.1 M LiI, 0.6 M 1-methyl-3-(n-
propyl)imidazolium iodide (PMII), and 0.5 M 4-tert-butylpyridine (TBP) in butyronitrile
was injected into the sealed device from the holes on the platinum cathode. For incident
photon to current efficiency (IPCE) characterization, an Oriel Cornerstone
monochromator was used as light source, and the device current response was
recorded under short circuit conditions at 10 nm intervals using a Keithley 2400 source
meter. The light intensity at each wavelength was calibrated with an energy meter
(S350, UDT Instruments). The current-voltage characteristics of the cells were
measured with a Keithley 2400 source meter under AM1.5 (100 mW/cm2) solar
simulator. The active area of the TiO2 film is 0.5 cm * 0.5 cm for IPCE and current-
voltage measurements.
Synthetic Procedures
Tert-butyl 2-(4-iodophenyl)acetate140 and Compound 1,141 2,141 3,139 4153 and 7141
were synthesized accroding to reported method in literature.
Compound 5. Compound 4 (2.00 g, 6.90 mmol) was dissolved in a mixed
solvent of THF (20 ml) and (i-Pr)2NH (10 ml) in a round bottom flask and degased for
30 min. Then, Pd(PPh3)2Cl2 (28 mg, 0.4 mmol) and CuI (7.5 mg, 0.4 mmol) were added
the flask and degassed for another 30 min. Afterwards, trimethylsilyacetylene (0.75 g,
7.65 mmol) was injected into the solution and reacted at room temperature for
89
overnight. The solvent was evaporated and the residue was purified with a flash
column. The eluent was evaporated under vacuum and the solid was dissolved in THF
(10 ml) and TBAF (7 ml, 1 M in THF) was added to the solution. After two hours, 10 ml
water was added and the solution was extracted with dichloromethane. The organic
layer was washed with saturated ammonium chloride, water and brine, and then dried
over anhydrous sodium sulfate. The solvent was removed under vacuum and the crude
product was purified by silica chromatography to yield compound 5 (1.17g, 90%). 1H
NDI-22) < Mn (PPE-NDI-39)). In the 1H-NMR spectrum, both proton signals from the
naphthalene diimide and polymer backbone appear. Chemical shift at 8.82 ppm was
assigned to the aromatic protons on the naphthalene rings and shifts at 7.73 ppm and
6.98 ppm came from the phenyl ring next to the naphthalene unit. Aromatic protons of
the PPE backbone occur at 7.38 ppm and the methylene unit which was directly
connected to the phenyl ring had a chemical shift at around 2.84 ppm. Signal integration
of naphthalene protons and methylene protons were used to calculate the molar ratio of
naphthalene units to phenyl rings. Assuming there are two naphthalene groups on each
polymer chain, the number of phenyl rings and repeat units can be determined by
calculating the ratio of the signal integration at 7.38 ppm and 2.84 ppm.
Figure 3-2. GPC and NMR characterization of PPE-NDI-n. A) GPC and B) 1H-NMR of
PPE-NDI-8 (black), PPE-NDI-14 (red), PPE-NDI-22 (blue) and PPE-NDI-39 (dark cyan)
The number of repeat units calculated from NMR differs significantly from the that
derived from GPC when molecular weight is high (Table 3-1). And, the reason might be
a) that as the molecular weight gets too large, conjugated polymers tend to form π-π
10 11 12 13 14 15 16 17 10 8 6 4 2 0
Time (min)
Increasing Molecular Weight
A)
Chemical Shift (ppm)
a b
PPE-NDI-39
PPE-NDI-22
PPE-NDI-14
PPE-NDI-8
B)
99
stacking and aggregate in solution, shielding the NMR signal; or b) high molecular
weight polymers were obtained using a reduced amount of end-caps in the reaction
systems, which resulted in a decreased 1H-NMR signal of the end-cap protons and
cause more error in signal integration.
Table 3-1. Molecular weight characterization of PPE-NDI-n and PPE
GPCa NMR
Mn (g/mol) Mw (g/mol) PDI DPb Mn DPc
PPE-NDI-8 3100 4800 1.52 8 3100 8
PPE-NDI-14 4800 9000 1.87 14 6000 19
PPE-NDI-22 7300 1610 2.21 22 8700 29
PPE-NDI-39 11700 23800 2.03 39 17500 62
PPE 5400 8200 1.40 17 3700 12d a Narrow dispersed polystyrene was used as the standard. b Degree of polymerization was calculated using Mn obtained by GPC. c Degree of polymerization was calculated using signal intensity integration ratio from 1H-NMR. d Calculated using the 1H-NMR integration of the t-butyl and PPE backbone signals.
Energetics and Optical Properties
The objective of this project is to investigate the charge recombination in
conjugated polymers. It is essential to have the redox state information, in order to
understand the excited and charge-separated state energies. The singlet excited state
energy of PPE-NDI-n polymers is available from the fluorescence emission spectra. The
reduction and oxidation potentials of the NDI end-caps and PPE backbone are obtained
from cyclic voltammetry (CV), and the charge separated-state energy is calculated from
the difference in the PPE backbone oxidation and NDI reduction potentials. Cyclic
voltammetry was performed on all polymers, but reasonable results were obtained only
on the shortest chain length polymer, namely, PPE-NDI-8 (Figure 3-3), due to the
intrinsic difficulty of performing CV on high molecular weight polymers. However, the
energetics of other PPE-NDI-n polymers should be very similar to that of PPE-NDI-8,
100
because they have the same polymer structure and almost identical absorption and
emission (Figure 3-4).
Figure 3-3. A) Energetics and B) CV of PPE-NDI-8. Cyclic voltammagram of PPE-NDI-8
in methylene chloride with 0.1 M tetrabutylammonium hexafluorophosphate (TBAH) as electrolyte, vs. SCE.
The cyclic voltammagram of PPE-NDI-8 shows two quasi-reversible reduction
peaks with Ered = -0.61 V and Ered = -1.01 V, along with a single irreversible oxidation
peak with Eox = 1.49 V and onset at 1.22 V (potentials vs. SCE). One thing needs to be
pointed out here is that each reduction wave on the CV very likely corresponds to one
electron transfer to both NDI end-caps which is supported by previous studies.161,162
The charge-separated state energy is calculated using Ecs = Eox – Ered – 14.4/εRDA,
where Eox is the oxidation potential of the PPE backbone, Ered is the first reduction
potential of the NDI end-caps, ε is the dielectric constant and RDA is the distance
between the donor and acceptor units. The 14.4/εRDA term is the Coulombic
stabilization energy in the charge-separated state and is estimated to be 0.05 eV for
PPE-NDI-8 in DCM, assuming the average distance between the positive charge and
the NDI is about the length of 4 repeat units. In the case of PPE-NDI-8, the charge-
separated state energy (Ecs) is calculated to be ~1.90 eV and the singlet energy is
101
~2.94 eV. In PPE type conjugated polymers, the triplet state energy is found to be 0.7 ±
0.1 eV below the singlet state.163 Thus, the triplet state energy level in PPE-NDI-n
polymers is about 2.1 ± 0.1 eV, which is within the range of reported value for PPE type
polymers (1.95 – 2.26 eV).164,165 The triplet energy level of the NDI compound has been
estimated to be 2.03 eV, using the phosphorus emission unset wavelength (λ = 610
nm).166
Table 3-2. Table of energetics
Esinglet/eVc Ered/Vd Eox/Vd Ecs/eV
OPE8a 2.99 N.A. 1.31 N.A.
NDI-Hb 3.21 N.A. -0.53 N.A.
PPE-NDI-8 2.94 -0.65 1.27e 2.14 a Taken from our group’s unpublished results. b Taken from Ref 162. c Estimated from fluorescence emission. d Value reported vs. SCE. e Calculated using the average number of Eox(OPE8) and the onset of PPE-NDI-8 oxidation potential.
UV-visible absorption and emission spectra of the samples were measured in
THF, and the concentration of the samples was adjusted to 50 µM (based on repeating
unit for polymers) (Figure 3-4). The NDI has two major absorption peaks at 358 nm and
378 nm. The PPE backbone has a broad absorption from 300 nm to 425 nm, with the
absorption maximum at 377 nm. Although, the PPE and NDI absorption spectra have a
large overlap (300-395 nm), the absorption of the PPE-NDI-n polymers is still dominated
by the PPE backbone because the absorption coefficient of the PPE backbone (8.8*106
for PPE-NDI-39) is significantly higher than that of the NDI end-caps (~5*105 for NDI).
The NDI does not have any absorption beyond 395 nm while the emission of the PPE
backbone starts near 390 nm. The mismatch of the PPE emission and NDI absorption
ensures that the energy transfer in the PPE-NDI system is minimized. In addition, the
NDI is almost non-emissive in solution compared to the PPE polymer, with a quantum
102
yield of φ=0.18%, while the quantum yield of the PPE is about 76%. Therefore, the
emission of PPE-NDI-n polymers mostly comes from the PPE backbone.
Figure 3-4. UV-vis absorption and emission spectra in THF. A) UV-vis absorption of the PPE (black) and NDI (red), normalized according to the absorption coefficient. B) Fluorescence emission of the PPE (black) and NDI (red), normalized according to fluorescence quantum yields. C) UV-vis absorption and D) emission of PPE-NDI-8 (black square), PPE-BDI-14 (red circle), PPE-NDI-22 (blue up-triangle) and PPE-NDI-39 (dark cyan down-triangle), and the signals are normalized according to the quantum yields. The excitation wavelength for all samples is 375 nm. Absorption spectra in C are offset for clarity.
In the absorption spectra of PPE-NDI-n polymers, the NDI absorption band at
362 nm can be easily identified in PPE-NDI-8 and this feature becomes less
pronounced as the polymer molecular weight increases. However, despite overlapping
with the PPE backbone absorbance, the NDI absorption band at 379 nm can clearly be
distinguished even in longest chain length polymer. Meanwhile, the PPE backbone
absorption becomes stronger as molecular weight increases, due to the fact that the
103
molar extinction coefficient increases with molecular weight.140 The overall absorption
spectra increasingly resemble the PPE model polymer as the molecular weight
increases due to the increased contribution of the PPE backbone. Despite the changing
molecular weight, the absorption maximum remains essentially the same (at 379 nm),
indicating the conjugation length is saturated for all polymer samples. In many donor-
acceptor molecule systems, besides the π-π* transition band, a charge transfer
absorption band can also be observed. However, it was not the case for PPE-NDI-n
polymers, due to weak electronic coupling.
Table 3-3. Summary of the photophysical properties.
a With anthrathene as quantum yield standard, ϕ =0.27 in ethanol at room temperature. b Energy transfer efficiences (η) were calculated as η = 1 − ϕ(PPE380-525nm)/ϕ(PPE), in which ϕ(PPE) was the fluorescence quantum yield of donor-only polymer PPE.
All polymers have almost identical emission spectra with emission maxima at 422
nm which is the same as the PPE model polymer. However, the emission intensity is
significantly weaker compared PPE model due to charge transfer. Although there is only
5% NDI (molar ratio) in PPE-NDI-39, more than 80% of the emission of polymer
backbone is quenched. Further, the quenching is more efficient in PPE-NDI-22 and this
trend continues as NDI content increases (Table 3-3). The overall energy transfer
efficiency was calculated using the ratio of PPE-NDI-n polymer fluorescence quantum
yields to the PPE model polymer quantum yield, and the trend is clear that charge
transfer efficiency decreases with increasing Mn.
Polymers NDI Content
(molar %) λabs (nm) λem (nm)
ε (104 cm-1M-1)
Lifetime at 420
nm (ns)
Quantum Yielda
e-transfer Efficiency %b
PPE-NDI-39 4.9 379 422 2.25 0.18 0.15 80.5
PPE-NDI-22 8.3 379 422 2.14 0.15 0.093 87.9
PPE-NDI-14 12.5 379 422 2.16 0.15 0.044 94.3
PPE-NDI-8 20 379 422 2.24 0.13 0.013 98.3
PPE 0 380 422 2.12 0.38 0.77 N.A.
104
Charge Recombination Study
Femtosecond (fs) transient absorption (TA) spectroscopy was used to
characterize the intrachain charge recombination kinetics in PPE-NDI-n polymers.
Figure 3-5 compares the transient spectrum of the PPE and PPE-NDI-8. The transient
spectrum of PPE has negative signals (bleach) from 420 nm to 510 nm which are the
combination of ground state bleaching and stimulated emission. An intense excited
state absorption also is observed for λ > 510 nm. The transient spectrum of PPE-NDI-n
is very different compared to that of PPE. The spectrum is dominated by three strong
absorption bands with one at around 480 nm, which is attributed to the absorption of
naphthalene diimide radical anion (NDI•-), and a broad band from about 570 nm to 650
nm, which is attributed to a combination of NDI radical anion and PPE radical cation
(PPE•+) absorptions.161,166 The appearance of the 480 nm band clearly indicates the
formation of NDI radical anion which is generated by one electron transfer from the PPE
backbone to the NDI end group. In the spectrum of PPE-NDI-8, the bleaching from 420
nm to 510 nm, observed in the spectrum of the PPE, is completely covered by the NDI•-
absorption.
Figure 3-5. Transient spectra of the PPE and PPE-NDI-8 in DCM after 100 ps.
105
The time dependent transient absorption spectrum of PPE-NDI-n polymers is
plotted in Figure 3-6. As the molecular weight increases, the feature of NDI•- peak at
~480 nm becomes less structured due to the fact that the NDI content decreases with
increasing molecular weight and the NDI•- signal intensity, which is proportional to the
NDI content, decreases as well. In addition, charge transfer is less efficient in high
molecular weight polymer and the bleaching signal from the PPE backbone becomes
more significant. The broad peak from ~550 to 650 nm also starts to blend with the PPE
excited state absorption as molecular weight increases. Another interesting finding is
that absorption signals for PPE-NDI-8 and PPE-NDI-14 decay to zero after ~5 ns while
there are still signals at ~480 nm in the spectra of PPE-NDI-22 and PPE-NDI-39 which
means the NDI•- lives longer in high molecular weight polymers.
Figure 3-6. Time-resolved transient absorption spectra of PPE-NDI-n polymers.
106
Figure 3-7. Transient absorption spectra of PPE-NDI-n after 5 ns.
Detailed information of charge transfer kinetics can be obtained by monitoring
signals at specific wavelengths. Because the signal at 480 nm is dominated by NDI•-
absorption, this wavelength was exclusively used to probe the charge separated state.
In the TA spectrum, a rise in absorbance was not observed due to polymer relaxation
and reorganization and therefore, the charge transfer dynamics can not be
resolved.167,168 In general, the decay kinetics has two components: fast component (with
τ≈100 ps) which is attributed to polymer structure relaxation and reorganization and a
relatively slow component (withτon the order of several hundred ps) reflecting the
process of charge recombination. More careful review of the charge recombination
process shows that there is an increasing contribution from the slow recombination
process as the molecular weight increases (Table 3-4). One explanation is that the
holes generated by electron transfer from PPE to NDI end-groups can delocalize along
the conjugated backbone and become further removed from the end NDI•- as the
polymer chain length increases. The charge recombination is driven by the Coulomb
107
interaction between the cation and anion radicals, and the strength of which follows
Coulomb’s law which is proportional to the inverse square of the distance between the
interacting charges. The distance between the cation and anion radicals increases with
molecular weight as the hole delocalized further away from the NDI end-caps. Therefore,
Columbic interactions decrease dramatically. The residue signals in the kinetic trace
increase with molecular weight which is also consistent with the transient absorption
spectrum.
Table 3-4. Charge recombination kinetics
t1 (ps) A1 t2 (ps) A2 y0
PPE-NDI-8 100.00 0.65 436.00 0.27 0.05
PPE-NDI-14 64.00 0.41 414.00 0.36 0.10
PPE-NDI-22 155.00 0.57 764.00 0.24 0.13
PPE-NDI-39 121.00 0.37 676.00 0.30 0.20
Equation 𝑦 = 𝐴1 ∗ 𝑒−
𝑥
𝑡1 + 𝐴2 ∗ 𝑒−
𝑥
𝑡2 + 𝑦0 was used for fitting.
Figure 3-8. Transient kinetics from λ=480 nm.
Nano-second (ns) TA spectroscopy was used to further investigate the long-lived
charge-separated state of PPE-NDI-n polymers in THF (Figure 3-9). However, no PPE
108
radical cation or NDI radical anion signal is detected after an initial 15 ns camera delay,
because the lifetimes of the radicals are shorter than 15 ns. But interestingly, intense
PPE triplet absorption is detected.
Figure 3-9. Nasosecond TA spectra of PPE-NDI-n, PPE and NDI in THF. The optical density of all samples at 355 nm is adjusted to 0.6.
The triplet excited states can be generated by either intersystem crossing from the
singlet excited state or induced by charge recombination.169,170 Considering the fact that
more than 80% of the fluorescence is quenched in PPE-NDI-n polymers, charge
recombination should be the major contribution to induced triplet formation. However,
more careful investigation is needed for better understanding of the triplet formation. In
addition, the absorption intensity increases with molecular weight across the polymer
109
series. The PPE-NDI-8 does not show any PPE triplet absorption while that of the PPE-
NDI-39 is almost the same as the PPE model polymer.
Summary and Future Work
A series of polymers (PPE-NDI-n) with different molecular weight were
synthesized which featured the same poly-(phenylene ethynylene) (PPE) conjugated
backbone and naphthalene diimide derivative (NDI) substitution at the polymer chain
ends. The energetics of polymers were investigated by cyclic voltammetry and steady
state absorption and emission spectroscopy. Despite the increasing of molecular
weight, all PPE-NDI-n polymers show similar energy levels. But, the fluorescence
emission quantum yield measurements indicate very efficient electron transfer from the
PPE backbone to the NDI end-groups, and the transfer efficiency increases with
CHAPTER 4 ULTRAFAST ENERGY TRANSFER IN VARIABLE CHAIN LENGTH CONJUGATED
POLYMERS WITH ENERGY ACCEPTOR END-CAPS
Background
Since the discovery, conjugated polymers (CPs) have found numerous
applications, such as organic light emitting diodes (OLEDs),2,172 bulk-heterojunction
solar cells (BHJs),173-175 chemo-/ biosensors,18,81,89 cell imaging22,100 and etc. Compared
to small organic dyes, CPs have higher extinction coefficient, better stability and
superior processing properties. The synthetic ease of alternating the building blocks for
the construction of conjugated polymers makes it convenient to change polymer
architectures, modify functional groups and tune optical properties, such as the HOMO
and LUMO energy levels. More interestingly, ultrafast energy transfer in conjugated
polymer systems has been discovered, which is essential for the development of highly
efficient sensors, electroluminescent devices and photovoltaics.86 However, energy
transfer is very complicated in conjugated systems, in which both intrachain and
interchain energy migration processes can take place and the dominant process
depends strongly on the nature of the systems. In order to resolve the complexity, many
systems have been designed to investigate the energy transfer process. One approach
is to synthesize energy acceptor-capped CPs which incorporate chromophores with low
LUMO energy level (acceptors) onto the end of polymer backbone with high LUMO
(donor). In such a system, after selective excitation of the donor chromophores, energy
will transfer from the donors to the acceptors.
Swager and Wrighton reported studies investigating energy transfer in polymers
with poly-(phenylene ethynylene) (PPE) (donor) backbone and anthracene (acceptor)
substitution (PPEAn) at the polymer chain ends.83 In solution, the energy transfer from
118
the PPE backbone to the anthracene moieties is only modestly efficient, because
anthracene is not a strong acceptor and there is a mismatch of the PPE emission and
anthracene absorption spectra. Müllen and Brédas compared interchain and intrachain
energy transfer in acceptor-capped conjugated polymers.84,85 They found that electronic
matrix elements, which affects the energy transfer rate, decreased with increasing
donor-acceptor distance in both interchain and intrachain energy transfer. In addition,
the energy transfer was more efficient in film than in solution. Recently, we reported
very efficient energy transfer along flexible polymer chain with conjugated
oligo(phenylene ethynlene) (OPE) donor and thiophene-benzothiadiazole (TBT)
acceptor side pendants.37 The energy transfer rate varies from 0.02-0.5 ps-1 depending
on the distance between the acceptors and the initially formed donor excitons.
In this chapter, we present energy transfer study in a series of conjugated
polymers featuring PPE backbones end-capped with TBT. This system is chosen
because of the perfect match of the emission spectrum of the PPE with the absorption
spectrum of the TBT. The quantum yields of both the PPE and TBT moieties are
reasonably high. The intrachain energy transfer is very efficient, with dynamic and
overall efficiency comparable to similar systems.84,85 Femtosecond (fs) time-resolved
transient absorption (TA) spectroscopy is applied to investigate the rate of energy
transfer which provides insight information about the energy transfer kinetics. The
results of this work help us better understand the intramolecular energy transfer
processes in conjugated polymers and that the transfer rate depends on the D-A
distance in conjugated polymers.
119
Results and Discussion
Structures, Synthesis and Characterization
The structures of polymers investigated in this study all feature the PPE
backbone and are shown in Figure 4-1. The PPE-TBT-n polymers are all end-capped
with TBT units while the PPE polymer has phenyl end groups (the same polymer in
Chapter 3). The PPE backbone adopts a rod-like conformation in solution and there is
minimal structure distortion along the backbone. In diluted solution, the interchain
energy transfer is eliminated, which makes the intrachain energy transfer process easier
to investigate.82,86
Figure 4-1. Molecular structures.
In comparison, poly(p-phenylene vinylene) (PPV), whose chain is more flexible, has
both tightly coiled conformation and open chain conformation in solution. And, interchain
energy transfer dominates in the tightly coiled conformation zone while intrachain
energy transfer is favored in open chain conformation regain.87,88 In addition, the PPE
backbone and TBT moieties have distinct singlet excited state energy level: the singlet
energy level of the PPE backbone is relatively higher (~3.01 eV) which makes it a good
donor and the TBT serves as an acceptor which has lower singlet energy level (~2.07
eV). The emission spectrum of the PPE matches well with the absorption of the TBT
120
which facilitates the energy transfer. And the overlap of the PPE and TBT absorption is
minimal which allows selective photoexcitation of the PPE backbone. Moreover, both
PPE and TBT have high fluorescence quantum yields, which allows quantification of
energy transfer efficiency. In summary, polymers studied in this work are perfect
candidates for intramolecular energy transfer investigation and the molecular weights of
polymers are varied to study the chain length dependent behaviors.
Figure 4-2. Synthesis scheme of polymers.
The general synthesis route for the preparation of polymers is outlined in Figure
4-2. Palladium (Pd) catalyzed Sonogashira cross-coupling polymerization was applied
for the synthesis of polymers. Cross-coupling polymerization is a typical poly-
condensation reaction which proceeds via the step-growth mechanism. The molecular
weights of resulting polymers are determined by the degree of polymerization (DP),
which is given by DP=1/(1-p) (where p is the extent of reaction and assuming
stoichiometric balance of the reacting functional groups).60 Polymer molecular weight
can be tuned via the control of DPs by introducing stoichiometric imbalance ratio of
121
functional groups and DP is given by DP=(1+r)/(1+r-2rp) (where r is stoichiometric
imbalance ratio).60 Adding variable amount of mono-functionalized end groups to the
reaction mixture at the beginning has been widely applied to introduce stoichiometric
imbalance and end-group functionality.62 At the beginning of reaction, reactants 1 and 2
(1:1 molar ratio) and different amount of A1 (0.1-0.3 molar ratio) or B1 (0.3 molar ratio)
were added to the flask. After 24 h, certain amount of extra end groups A2 (0.1-0.3
molar ratio) or B2 (0.3 molar ratio) were added and the reaction continued for another
12 h in order to make sure polymers were end capped at both chain ends.64
Figure 4-3. Synthesis of OPE-TBT model compound.
The OPE-TBT model compound was synthesized stepwise. Reaction of 1,4-
diiodobenzene with 1 equivalent trimethylsilyl acetylene (TMSA) and 1 equivalent
triisopropylsilyl acetylene (TIPSA) afforded compound 3. Deprotection reaction was
performed on compound 3 with potassium carbonate to yield compound 4, which was
further reacted with compound 1 to make compound 5. Under Sonagashira reaction
conditions, the coupling of compound 5 with compound A1 yields compound 6.
Deprotection of the triisopropylsilyl group on compound 6 produces compound 7 with
high yield. The last step is to couple compound 7 with compound 5. The reaction yields
122
of compound 3 and 5 are relatively low due to the possibility of creating both di- and
mono-substituted products.
The polymer molecular weights and structure were characterized by gel
permeation chromatography (GPC) and 1H-NMR. It is known that GPC usually
overestimates the molecular weight of conjugated polymers, but it is still a well-accepted
method for relative molecular weight characterization in this field.80 The number average
molecular weights (Mn) of polymers vary from 5.7 to 14 kDa which correspond to 19 to
50 repeating units. Polymers are named after the number of repeating units, PPE-TBT-
19, PPE-TBT-30, PPE-TBT-37 and PPE-TBT-50, respectively. The PPE polymer has a
molecular weight of 5.4 kDa, which is comparable to the shortest chain length TBT end-
capped polymer, namely PPE-TBT-19.
Figure 4-4. GPC traces of PPE-TBT-n. PPE-TBT-19 (black squares, Mn=5.7 kDa, PDI=2.24), PPE-TBT-30 (red circle, Mn=8.7 kDa, PDI=2.57), PPE-TBT-37 (blue up triangle, Mn=10.6 kDa, PDI=2.55), PPE-TBT-50 (dark cyan down triangle, Mn=14.0 kDa, PDI=2.87) and PPE (left triangle magenta, Mn=5.4 kDa, PDI=1.70).
123
1H-NMR was used to confirm the chemical structure and molecular weight.
Resonances at δ = 8.15 ppm (labeled as T) belong to benzothiadiazole protons and the
resonance at δ = 2.85 ppm (labeled as M) is assigned to the methylene protons (-CH2-)
next to phenyl groups on the conjugated backbone (Figure 4-5). And, since there are
two TBT units on each polymer chain, the number of methylene groups can be
determined using the ratio of the peak integrations of T to M. Each repeat unit has
methylene groups and, therefore, the number of repeat is determined. However, as
molecular increases, the NMR signal integration method becomes less accurate.62
Figure 4-5. 1H-NMR spectra of PPE-TBT-n and PEE. A) Zoomed in area and B) whole spectra.
Optical Properties in Solution
The absorption and fluorescence spectra of the TBT-TIPS, OPE-TBT and PPE
polymer were measured in THF solutions and they are plotted in Figure 4-6. The PPE
polymer features a broad single absorption band at around 387 nm while the OPE-TBT
and TBT-TIPS have both π-π* transition and charge transfer absorption bands (Figure
8.5 8.0 7.5 7.0 9 8 7 6 5 4 3 2 1 0
A)
Chemical Shift (ppm) Chemical Shift (ppm)
TBT-PPE-19
TBT-PPE-30
TBT-PPE-37
TBT-PPE-50
PPE
Incre
asin
g T
BT
Co
nte
nt
zoom in
B)
124
4-6 A). Compared to TBT-TIPS, both absorption bands of OPE-TBT are red-shifted due
to increasing HOMO energy level.
Figure 4-6. Steady state photophysical properties in THF solutions. A) Normalized Uv-vis absorption and B) fluorescence emission spectra of PPE(black), TBT-TIPS (red) and OPE-TBT (blue); C) normalized Uv-vis absorption of and D) emission spectra of PPE-TBT-19 (black squares), PPE-TBT-30 (red circle), PPE-TBT-37 (blue up triangle), PPE-TBT-50 (dark cyan down triangle) and PPE (left triangle magenta); emission spectra were normalized according to the quantum yield. Inset plot in Figure C is the zoom in area of 425-600 nm. Inset plot in figure D shows the energy transfer efficiency. The excitation wavelength is 370 nm for all samples.
The PPE backbone and TBT moiety have a great mismatch in absorption spectra,
which allows selectively excitation of the PPE chromophore and study of the energy
transfer efficiency. The PPE backbone and TBT moiety also show distinct emissions
with the PPE emitting at 420 nm and the TBT featuring a broad emission peak at 590
125
nm (Figure 4-6 B). But, both chromophores have fairly high quantum yield (φPPE = 0.92
and φTBT-TIPS = 0.73). The OPE-TBT shows little donor emission due to very efficient
energy transfer (> 99.5%) and the acceptor emission also red-shifts compared to that of
TBT-TIPS.
The steady state absorption of PPE-TBT-n polymers was measured in THF and
the concentration is 50 μM (based on repeat units). And, the spectra were plotted in
Figure 4-6 (C) and normalized at absorption maximum (~390 nm). The PPE, which
doesn’t have TBT end-caps, has no absorption beyond 430 nm. But, an additional
absorption band, from 470 nm to 550 nm, shows up in the spectra of TBT-PPE
polymers, which is attributed to the TBT absorption. The intensity of the TBT absorption
increases with decreasing molecular weight, indicating increasing TBT content. But,
compared to the dominating absorption band 390 nm, which is attributed to the PPE
backbone absorption, the TBT absorption is still less intense. Since the effective
conjugation length of PPE type polymers in isotropic solvent (like THF or DCM) is
limited to be around 9-10 repeat units, the absorption maximum of PPE backbone
remains essentially the same.64
Steady state emission spectra of polymers (PPE-TBT-n and PPE) at the same
concentration (50 μM, based on repeating units) were plotted in Figure 4-6 (D) and
normalized according to their quantum yield. The PPE shows a single peak at around
420 nm and the PPE-TBT-n polymers have an additional band at about 600 nm, which
is attributed to the TBT emission. The emission intensity of the 420 nm peak decreases
with increasing TBT content while the 600 nm peak increases, which indicates more
energy transfer from the PPE backbone to the end TBT acceptors. Compared to the
126
PPE, more than 60% of the donor emission (420 nm) in PPE-TBT-50 is quenched and
the quenching is more significant in PPE-TBT-37 with efficiency reaching 70%. This
trend continues as the molecular weight of polymers decreases as evidenced in the
PPE emission fluorescence quantum yield (Table 4-1). The overall energy transfer
efficiency was calculated using the quantum yield of emission from 380 nm to 525 nm
(the donor emission) in PPE-TBT-n polymers over the quantum yield of PPE. The trend
is clear that energy transfer efficiency decreases with TBT content. The trend is
supported by the changing of fluorescence lifetime at 420 nm which decreases with
molecular weight: the average lifetime at 420 nm is about 357 ps, 299 ps, 290 ps and
222 ps for PPE-TBT-50, PPE-TBT-37, PPE-TBT-30 and PPE-TBT-19, respectively. The
decreasing in donor lifetime indicates more efficient quenching, which is caused by
energy transfer to the acceptors.
Table 4-1. Photophysical Properties of Polymer Samples
Polymer λabs
(nm) λem
(nm)
lifetime at 420
nm (ps)a
Lifetime at 600
nm (ns)a
quantum yieldb Energy Transfer
Efficiency %c
PPE (380 nm-525
nm)
TBT (525 nm-750
nm)
Overall (380 nm-750 nm)
TBT-PPE-19 389 423 222 4.45 0.082 0.52 0.6 91.1
TBT-PPE-30 393 423 290 4.45 0.16 0.55 0.71 82.6
TBT-PPE-37 393 423 299 4.45 0.27 0.4 0.67 70.7
TBT-PPE-50 396 423 357 4.45 0.34 0.39 0.72 63.0
PPE 397 423 462 N.A. 0.92 N.A. 0.92 N.A. a Data was collected on a streak camera. b With anthrathene as quantum yield standard, ϕ =0.27 in ethanol at room temperature. c Energy transfer efficiency (η) were calculated as η = 1 − ϕ(PPE(380-525nm))/ϕ(PPE), in which ϕ(PPE) was the fluorescence quantum yield of donor-only polymer PPE.
Fluorescence Polarization Investigation
Fluorescence polarization studies of polymers (PPE-TBT-n and PPE) were
performed at room temperature using THF as the solvent while the anisotropy of OPE-
TBT was measured in glycerin (Figure 4-7). A 380 nm excitation wavelength was
127
chosen to selectively excite the PPE chromophore. The fluorescence emission
polarization, which can be characterized by anisotropy (r), is calculated from the
emission intensity through a polarizer using equation:
𝑟 =𝐼𝑉𝑉−𝐼𝑉𝐻
𝐼𝑉𝑉+2𝐼𝑉𝐻 (4-1)
where IVV and IVH are the intensity observed when the emission polarizer is parallel and
perpendicular to the direction of the polarized excitation respectively.
Figure 4-7. Anisotropy characterization and simplified representation of polymer chain conformation. A) Anisotropy of PPE-TBT-19 (black), PPE-TBT-30 (red), PPE-TBT-37 (blue), PPE-TBT-50 (dark cyan) and PPE (magenta); B) anisotropy of PPE-TBT-19 in DCB (filled black square) and THF (hollow black square) and PPE-TBT-50 in DCE (filled blue circle) and THF (hollow blue circle); C) anisotropy of PPE (black), PPE-TBT-19 (red) and OPE-TBT (blue); D) simplified representation of polymer chain conformation and dipoles. Polymers are dissolved in THF while the OPE-TBT is dissolved in glycerin.
128
Two interesting trends can be observed in the emission anisotropy of PPE-TBT-n
polymers: 1) the emission polarization of PPE backbone (400-500 nm) increases with
decreasing molecular weight; 2) the donor emission (400-500 nm) polarization of the
OPE-TBT is higher than that of polymers and the acceptor emission (550-700 nm)
polarization is almost zero and 3) the acceptor emission polarization of the OPE-TBT is
lower compared to the polymers.
The emission anisotropy reveals the angular displacement of the polymers that
occur between absorption and emission of a photon, which depends strongly upon the
relative time scales of fluorescence emission lifetime and rotation diffusion of polymers.
When the time scales of the two are on the same order, an increase of emission lifetime
or decreasing of rotation diffusion rate will result a decreasing anisotropy.71 The lifetime
of PPE emission increases with molecular weight (Table 4-1), but, it should not be the
cause here. Because the model PPE polymer and PPE-TBT-19 have similar molecular
weights and they show very similar anisotropy value as well, despite the fact the lifetime
of the PPE is two-time longer compared to that of PPE-TBT-19. An increasing of
molecular weight will lower the rotation diffusion rate and increase the anisotropy, which
is the opposite of the observation. But, in order to rule out the possibility that the change
in anisotropy is caused by the changing of either fluorescence emission lifetime or
rotation diffusion, anisotropy of PPE-TBT-19 and PPE-TBT-50 were measured in ortho-
dichlorobenzene (DCB), which is a more viscous solvent and can slow down the
polymer rotation diffusion rate. It is obvious that the emission anisotropy does not
change with solvent, which demonstrates that the emission lifetime is way shorter
compared to the rotation diffusion rate. Therefore, the change of emission anisotropy
129
should not be caused by the changing of fluorescence lifetime or rotation diffusion,
which leads to the speculation that the change of PPE backbone emission anisotropy is
caused by the polymer chain conformation variation.
The anisotropy can be calculated according equation:
𝑟(𝛽) =2
5(
3
2𝑐𝑜𝑠2𝛽 −
1
2) (4-2)
In which (β) is the angle between the absorption and emission dipole moments. The
anisotropy is 0.4 when the dipoles are aligned with each other (β = 0) and a
misalignment reduces the overall anisotropy. And, the emission anisotropy of the
polymer backbone in PPE-T-n polymers is significantly lower than 0.4 and decreases
with increasing molecular weight. It has been demonstrated that in isotropic solutions,
PPEs adopt “worm-like” conformation and the polymer chains are broken into smaller
segments with different conjugation lengths, which have different segment orientation
(Figure 4-7 D).64 The “worm-like” conformation results in angular displacement variation
along the polymer backbones. After photoexcitation, the exciton migrates along the
polymer backbone before emitting and the migration follows a “random-walk” model.
There are more possible dipole orientations in longer chain-length polymers and a
greater possibility that the emission dipole is misaligned with the original excitation
polymerization direction. As a result, the anisotropy of the PPE backbone emission is
lower in high molecular polymers.
The anisotropy of the OPE-TBT donor emission is significantly higher, because
the structure of the OPE-TBT is more rigid and there is less conformation variation.
After energy transfer, the anisotropy of the TBT emission is almost zero, which is due to
the angular displacement between the OPE and the TBT dipoles. The molecular
130
structure of the OPE-TBT was simulated using DFT calculations (detailed information
can be found in the experimental part) and the result is shown in Figure 4-8. The dipole
angle is calculated by using the unit vectors, given in the output of a Gaussian 09
geometry optimization, and setting them in a right triangle. This triangle has the overall
dipole vector (0.4147 Debye) as the hypotenuse, and the unit vectors as the other sides
of the triangle. The x-vector (0.2521 Debye) runs along the oligo-phenylacetylide axis,
while the y-vector (0.3278 Debye) lies perpendicular, but still in the aromatic plane. The
acute dipole angle relative to the oligo-phenylacetylide axis is found by calculating the
angle using sin-1(y-vector/overall dipole) = sin-1(0.3278/0.4147) = sin-1(0.7905) = 52.2
degrees. The anisotropy is calculated to be 0.024 (Equation 4-2). And, the measured
anisotropy of the OPE-TBT acceptor emission is about 0.038 which agrees well with the
calculated result.
Figure 4-8. Structure simulation and calculated dipole of OPE-TBT.
The anisotropy of TBT emission in the polymer is significantly higher compared
to OPE-TBT compound, which is also very likely due to the polymer chain conformation
variation. In polymers, the conjugated segments have different orientation, which
increases the chance that the absorption and emission dipoles of TBT are aligned with
each other and increases the overall anisotropy. And the average angle, β, can also be
determined using the average anisotropy values according to equation 4-2 and are
listed in Table 4-2.
131
The energy transfer efficiency in conjugated polymers is affected by polymer
chain conformation. The less planarized polymer chains lead to less efficient exciton
migration due to reduced alignment of transition dipole moments.176 Therefore, the
change of energy transfer efficient in different chain-length polymers can be the results
of two factors: the increased distance between the effective donor and acceptors and
reduced exciton migration efficiency, which is caused by conformation disorder.
Table 4-2. Average Anisotropy and Angle Displacement
rave(400-500 nm) rave(550-700 nm) β(o)a
PPE-TBT-19 0.265 0.099 45.1
PPE-TBT-30 0.251 0.100 45.0
PPE-TBT-37 0.236 0.106 44.5
PPE-TBT-50 0.212 0.113 43.8
PPE 0.249 N.A. N.A.
OPE-TBT 0.346 0.038 50.8 a Calculated using 𝑟𝑎𝑣𝑒(550 − 700 𝑛𝑚) =
2
5(
3
2𝑐𝑜𝑠2𝛽 −
1
2)
Energy Transfer Kinetics
Time resolved fluorescence lifetime of the PPE-TBT-n polymers and PPE were
investigated to understand the relative long-time energy transfer behaviors, using the
streak camera. Figure 4-9 A compares the lifetime of the donor emission (PPE, 420 nm)
of the PPE-TBT-n polymers and the PPE. The fluorescence of the PPE-TBT-n polymers
decays faster than that the PPE, indicating that the energy transfer is still occurring
even at long-time scale. The decay rate depends on the chain length, with the shortest
chain decaying fastest (Table 4-1). The PPE decays slower and has a rising time. In
contrast, the fluorescence lifetime of the acceptor emission (TBT, 600 nm) remains the
same for the PPE-TBT-n polymers regardless of the chain length. But the life-time is
shorter compared to the TBT-TIPS compound and the reason should be that the
conjugation system of the TBT is disturbed in the PPE-TBT-n polymers. Close analysis
132
of early time fluorescence decays reveals that the majority of the energy transfer must
happen within the instrument response of the camera (~15 ps), since there is no
evidence of signal “growing in” (Figure 4-9 B, inset plot).
Figure 4-9. Fluorescence lifetime characterization in THF with streak camera. A) Donor emission lifetime (420 nm) of PPE-TBT-19 (black), PPE-TBT-30 (red), PPE-TBT-37 (blue), PPE-TBT-50 (dark cyan) and PPE (magenta); B) acceptor emission lifetime (600 nm) of PPE-TBT-19 (black), PPE-TBT-50 (dark cyan) and TBT-TIPS (magenta). Inset figure shows the early time of PPE-TBT-19 and PPE-TBT-50 decay.
Figure 4-10. Ultrafast transient absorption spectra of the PPE and PPE-TBT-30.
In order to further investigate the fast component of the energy transfer
dynamics, ultrafast transient absorption measurements were performed on polymers.
133
Figure 4-10 compares the transient absorption spectra of the PPE and PPE-TBT-30 at t
= 100 ps. The transient spectrum of the PPE (black line) shows negative band (bleach)
from 350 nm to 520 nm, which is the result of a combination of ground state bleaching
and stimulated emission. There are also indication of polymer relaxation in the
spectrum, evidenced by the subtle red-shift of stimulated emission (420 nm and 450
nm) compared to the steady state fluorescence emission (Figure 4-6). Both the transient
absorption spectra of the PPE and the PPE-TBT-30 also feature a strong broad induced
absorption band starting from 520 nm.
Figure 4-11. Time-resolved ultrafast transient absorption spectra. A) PPE and B) PPE-TBT-30.
The time-resolved ultrafast transient absorption spectra provide more evidence
on polymer relaxation, since the induced absorption is shifting to lower energy and
broadening as well (Figure 4-11 A). The ultrafast transient absorption spectrum of the
PPE-TBT-30 mostly resembles that of the PPE, indicating that laser pulse
predominantly excite the PPE backbone. But, there are additional peaks in the
spectrum, which indicates the energy transfer feature. The negative signal at 480 nm
corresponds to the bleaching of the TBT end-caps while the stimulated TBT emission
134
(negative signal, ~600 nm) is overlapping with the induced absorption of the PPE and
the TBT. The stimulated emission of TBT can be observed after 1 ns (Figure 4-11 B).
These features arise due to energy transfer from the PPE backbone to the TBT end-
caps, since only the PPE backbone is excited.
The energy transfer dynamics was examined at the wavelength of 428 nm and
plotted in Figure 4-12 A. The wavelength was chosen because it has the least
contribution from the TBT-related spectral features as well as minimal effects from the
PPE relaxation. This wavelength is also between the two PPE stimulated emission
peaks (~420 nm and ~440 nm), so the spectrum shifting does not have a significant
effect. The signal from the PPE polymer evolves slower and there is a slight growth at
the beginning of the decay, which is also observed in the time-resolved fluorescence
lifetime. The PPE-TBT-19 polymer decays much faster compared to the PPE and the
decay kinetics of the PPE-TBT-n polymers begin to resemble the PPE polymer as the
polymer chain gets longer.
Figure 4-12. TA decay kinetics. A) Kinetic trace and B) early time decay of PPE-TBT-19 (black), PPE-TBT-30 (red), PPE-TBT-37 (blue), PPE-TBT-50 (dark cyan) and PPE (magenta).
135
A careful examination of the decay kinetics reveals that there are ultrafast
components (< 2 ps) in the energy transfer process, which are attributed to the rapid
energy transfer from the excited PPE segments that are close to the TBT end-caps
(Figure 4-12 B). Therefore, the PPE-TBT-19 has greater amplitude to the fast time
component, since the chance of having an excited PPE segment close to the TBT end-
caps is higher. There are also relatively slow component in the energy transfer process,
which is attributed to the exciton hopping along the polymer backbone. For longer
chain-length polymer, the possibility of creating an exciton which is far away from the
acceptor is higher, thus, the exciton hopping is more likely to happen before the energy
transfer.
Figure 4-13. Schematic representation of the energy transfer processes in conjugated polymers. A) Direct energy transfer and B) exciton hopping and energy transfer.
A comparison of the time-resolved fluorescence data and ultrafast TA data
shows that these two data sets match up very well and they are plotted on top of each
other in Figure 4-14. The fluorescence experiment completely misses the ultrafast
component for the decay kinetics due to the instrument limitation. There are other
136
noticeable differences in the two, probably due to the fluorescence decay being the
integrated decay over the whole emission spectrum, whereas the ultrafast TA decay is
solely the signal of one wavelength. The calculated lifetime is listed in Table 4-3. The
lifetime for the “slow” components t2 and t3 were taken from fits to the time-resolved
fluorescence. The ultrafast components for the PPE-TBT-19, PPE-TBT-30 and PPE-
TBT-37 polymers are within 1 ps and the amplitude decreases with increasing polymer
chain-length. The PPE-TBT-50 has negative component (signal rising time) due to the
contribution of the PPE backbone fluorescence. The calculated average lifetime clearly
shows that the energy transfer rate decreases with increasing polymer chain-length.
Figure 4-14. Comparison of ultrafast TA decay kinetics (circles) and time-resolved fluorescence (lines) data. PPE-TBT-19 (black), PPE-TBT-30 (red), PPE-TBT-37 (blue), PPE-TBT-50 (dark cyan) and PPE (magenta).
Table 4-3. Summary of lifetime measurements.
a1 t1 (ps) a2 t2 (ps)a a3 t3 (ps)a tave (ps)b
PPE-TBT-19 0.4 0.47 0.31 55 0.29 348 117
PPE-TBT-30 0.25 0.46 0.29 73 0.46 374 193.4
PPE-TBT-37 0.15 0.64 0.31 78 0.53 378 225.7
PPE-TBT-50 -0.19 42.5 0.52 154 0.68 420 355.4 a Data taken from the fluorescence lifetime obtained via the steak camera. b Calculated as t = ∑an*tn.
137
Summary
Energy transfer in conjugated donor-acceptor polymers was studied in a system
consisting of poly-(phenylene ethynylene) (PPE) end-capped with thiophne-
benzothiadiazole (TBT). A series of polymers with different chain length were
synthesized by applying the “end-capping” strategy via Palladium catalyzed
Sonogashira polycondensation reaction. Highly efficient energy transfer from PPE donor
to TBT acceptor was observed by fluorescence emission measurements and the overall
energy transfer efficiency decreases with increasing polymer molecular weights, with
the lowest molecular weight polymer achieving an overall of more than 90% energy
transfer efficiency. The decreased energy transfer efficiency is most likely due to longer
distance between the donor and the acceptor, which has been observed in many FRET
energy transfer systems. Fluorescence emission anisotropy demonstrates that polymers
adopt “worm-like” conformation in isotopic solutions, which lower the energy migration
rate and the energy transfer efficiency. Ultrafast transient absorption and time-resolved
fluorescence lifetime investigations confirm that most of the energy transfer happens
with the first 10-20 ps and the energy transfer rate decreases with increasing polymer
chain-length. In addition, there is evidence showing energy transfer is also occurring on
long-time scale (~ns).
Experiments and Materials
Materials
Unless specified, all compounds and solvents were purchased from commercial
sources (Aldrich, Acros or Strem Chemicals) and used without further purification. For
all palladium-catalyzed reactions, the solvents were carefully degassed with argon for at
least 30 min.
138
Instrumentation
1H and 13C-NMR spectra were recorded on either Varian Inova2 (500 MHz) or
Gemini-300 spectrometer (300 MHz). The chemical shifts (δ) are reported in parts per
million (ppm) using the residual solvent signals as internal standards. High resolution
mass spectrometry was performed on a Bruker APEX II 4.7 T Fourier Transform Ion
Cyclotron Resonance mass spectrometer (Bruker Daltonics, MA). Gel Permeation
Chromatography (GPC) data was collected on a system composed of a Shimadzu LC-
6D pump, an Agilent mixed-D column, and a Shimadzu SPD-20A photodiode array
(PDA) detector, with THF as eluent at 1 ml/min flow rate. The system was calibrated
against linear narrow dispersed polystyrene standards in THF.
UV−visible absorption measurements were carried out on a Shimadzu UV-1800
dual beam absorption spectrophotometer. Photoluminescence spectra were recorded
on a spectrofluorimeter from Photon Technology International (PTI).
Computational calculation was carried out using DFT as implemented in
Gaussian 091 Rev. C.02.177 The geometry was optimized using the B3LYP functional
along with the 6-31G(d) basis set for all atoms. Silicon isopropyl groups and solubilizing
hexyl moieties were replaced with methyl groups for computational efficiency. This
model is designated by the addition of a prime (’) to its name, thus the model for OPE-
TBT is termed as OPE-TBT’. The optimization was started from an idealized geometry,
without symmetry constraints. The optimized structure was characterized by a
vibrational frequency calculation and was shown to be at a minimum by the absence of
imaginary frequencies.
Spectroscopy carried out at UNC-Chapel Hill by Robert J. Dillon. In the photo-
luminescence lifetimes experiments, light emanating from the sample is re-collected by
139
the objective, transmitted through a dichroic beam splitter (Semrock: FF670), and
focused onto the entrance slit of a streak camera (Hamamatsu: Streakscope). The
instrument response of the streak camera is approximately 17 ps. For transient
absorption spectroscopy, samples were dissolved in THF to an OD of between 0.4 and
0.5 in a 2 mm cuvette. Femtosecond pulses were derived from a Clark-MXR CPA 2210
Ti: Sapphire laser which produces ~ 150 fs pulses centered at 775 nm with a 1 kHz
repetition rate. A portion of the output was frequency doubled (to 388 nm) in a BBO and
used for photoexcitation of the donor. Low fluences (25 µJ/cm2) were necessary to
achieve linear behavior of the transients. Kinetics were monitored by a weak continuum
probe pulse generated by focusing a small portion of the 775 nm fundamental into a
translating CaF2 window. Spectra were collected at a rate of 1 kHz with pump on and
pump off spectra interleaved by mechanical chopping, are chirp corrected for delay
times Δt < 20 ps, and are each the average of 8000 individual pump on and pump off
spectra.
Synthetic Procedures
Tetrakis(triphenyl phosphine) palladium (Pd(PPh3)4) was from Strem Chemical
and triisopropylsilyl acetylene (TIPSA) was from TCI. Copper (I) iodide (CuI),
diisopropylamine ((i-Pr)2NH), tetrahydrofuran (THF) and all other chemicals were
purchased from either Sigma-Aldrich or Fisher Chemicals. All reagents were used
without further purification unless specified.
1,4-dihexyl-2,5-diiodobenzene (1), 1,4-diethynyl-2,5-dihexylbenzene (2) and PPE
were synthesized following the procedures detailed in the previous chapter. 4-(5-
The absorption and emission spectra of the P0, PPE and OPE were plotted in
Figure 5-3. The main absorption band of P0 is at 385 nm which is about 30 nm blue-
shifted compared to that of PPE (417 nm), indicating the effective conjugation length is
149
shorter in P0 and the “through-space” conjugation is less efficient than the completely
delocalized π-electrons in fully conjugated systems. However, the partially overlapped
π-electron in [2,2]paracyclophane unit does contribute to the conjugation, for the
absorption maximum of P0 is about 20 nm red-shifted compared to the OPE model
compound, whose absorption maximum is at 364 nm. The emission maximum of P0
resembles that of OPE, probably due to the fact that the state containing cyclophane
core has higher energy. Thus, the emission does not involve the “phane state” which is
consistent with literature report.191
Figure 5-3. Steady state optical properties of P0, PPE and OPE in THF. A) Absorption
and B) emission spectra of P0, PPE and OPE. P0 (black square), PPE (red circle) and OPE (blue triangle). Excitation wavelength has been set at the absorption maximum for each sample.
The steady state absorption spectra of P1-n and P0 at the same concentration
(50 μM, based on repeat units) were plotted in Figure 5-3 (A) and normalized at
absorption maximum (~387 nm). P0, which does not contain the TBT moiety, has no
absorption beyond 425 nm. An absorption band centered at 470 nm shows up in the
spectra of P1-n series and increases with decreasing molecular weight, which is
consistent with TBT content (Table 5-1). But, compared to the dominating absorption
150
band 387 nm which is attributed to backbone absorption, the 470 nm band is still less
intense. Since the effective conjugation length of [2,2]paracyclophane containing
polymers in solution is limited to be around 9 repeating units, the absorption maximum
of the backbone remains essentially the same.191
Figure 5-4. Steady state absorption and emission of P1-n and P0. A) Absorption and B)
emission spectra of P1-9 (black square), P1-19 (red circle), P1-39 (blue triangle) and P0 (dark cyan down-triangle).
Steady state emission spectra of P1-n polymers (50 μM, based on repeat units)
are plotted in Figure 5-4 (B) and normalized according to their quantum yield,
respectively. In addition to the polymer backbone emission (~420 nm), the P1-n
polymers have an additional peak at about 600 nm which is attributed to the TBT
emission. The intensity of the backbone emission (~420 nm) decreases with increasing
polymer chain-length while the 600 nm peak increases, which indicates more
efficientBBBBBBB energy transfer from the polymer backbone to the end TBT
acceptors. Compared to the P0 polymer, more than 80% of the donor emission (420
nm) in the P1-39 is quenched and the quenching efficiency of P1-19 is slightly higher
than P1-39. However, the quenching efficiency reaches ~95% in the P1-9 polymer. The
overall energy transfer efficiency was calculated using the quantum yield of emission
151
from 380 nm to 525 nm (the donor emission) over that of the P0 and the trend is clear
that energy transfer efficiency decreases with increasing polymer chain-length.
The trend of changing energy transfer efficiency is compared with the changing
of fluorescence lifetime at 420 nm which decreases with molecular weight: average
lifetime at 420 nm is about 910 ps, 491 ps, 308 ps and 163 ps for P0, P1-39, P1-19 and
P1-9, respectively. The decreasing in donor lifetime indicates more efficient quenching
which is caused by energy transfer to the acceptors. Compared to the fully conjugated
systems discussed in the Chapter 4, the presence of acceptors has a more significant
impact on the lifetime of donors. At the same time, the lifetime of acceptor remains
untouched.
Table 5-1. Photophysical data summary
TBT content
mol%
Lifetime at 420 nm
(ps)
Lifetime at 600 nm
(ns)
Fluorescence QY % a Energy tansfer
efficiency b
Donor (400-525
nm)
Acceptor (525-700
nm)
Overall (400-750
nm)
P1-9 18.2 163 3.08 4.41 25.3 29.7 93.9
P1-19 9.5 308 3.20 11.9 22.7 34.6 83.6
P1-39 4.9 491 3.22 14.3 22.1 36.4 80.3
P0 0 910 N.A. 72.6 N.A. 72.6 N.A. a With anthracene as quantum yield standard, ϕ = 0.27 in ethanol at room temperature. b Energy transfer efficiencies (η) were calculated as: η = 1 − ϕ(P1-n 400-525nm)/ϕ(P0), in which ϕ(P0) was the fluorescence quantum yield of donor-only polymer.
Summary and Future Work
A series of “through-space” conjugated polymers were synthesized and the
energy transfer properties were investigated. Polymers feature backbones containing
the [2,2]paracyclophane moieties, which serve the energy donor, and the TBT end-
caps, which serve as the energy acceptors. Polymers have different chain length which
were synthesized by applying the “end-capping” strategy in Palladium catalyzed
Sonogashira polycondensation reactions. Energy transfer from donor to acceptor was
152
investigated by fluorescence emission and time-correlated single photon counting
(TCSPC). Although the system does not have a completely delocalized π-system along
the polymer backbone, very efficient energy transfer was still observed. In order to
further investigate the energy transfer kinetics, ultrafast transient absorption study will
be conducted on the polymers.
Experiments and Materials
Materials
Unless specified, all compounds and solvents were purchased from commercial
sources (Aldrich, Acros, Strem Chemicals, et al) and used without further purification.
For all palladium-catalyzed reactions, the solvents were carefully degassed with argon
for at least 30 min. 1H and 13C-NMR spectra were recorded on either Inova2 (500 MHz)
or Varian Gemini-300 spectrometer (300 MHz). The chemical shifts (δ) are reported in
parts per million (ppm) using the residual solvent signals as internal standards.
Instrumentation
1H and 13C NMR spectra were measured on a Mercury 300, a Gemini 300, or an
Inova 500. Chemical shifts were referenced to the residual solvent peaks. High
resolution mass spectrometry was performed on a Bruker APEX II 4.7 T Fourier
Transform Ion Cyclotron Resonance mass spectrometer (Bruker Daltonics, MA). Gel
Permeation Chromatography (GPC) data was collected on a system composed of a
Shimadzu LC-6D pump, an Agilent mixed-D column, and a Shimadzu SPD-20A
photodiode array (PDA) detector, with THF as eluent at 1 ml/min flow rate. The system
was calibrated against linear narrow dispersed polystyrene standards in THF.
UV−visible absorption measurements were carried out on a Shimadzu UV-1800
dual beam absorption spectrophotometer. Photoluminescence spectra were recorded
153
on a spectrofluorimeter from Photon Technology International (PTI). Photo-
luminescence lifetimes were obtained by time-correlated single photon counting
(TCSPC) using a Fluo Time 100 (Picoquant), and excitation was provided using a PDL
800-B Picosecond Pulsed Diode Laser (375 nm).
Synthetic Procedures
Tetrakis(triphenyl phosphine) palladium (Pd(PPh3)4) was from Strem Chemical
and triisopropylsilyl acetylene (TIPSA) was from TCI. Copper (I) iodide (CuI),
diisopropylamine ((i-Pr)2NH), tetrahydrofuran (THF) and all other chemicals were
purchased from either Sigma-Aldrich or Fisher Chemicals. All reagents were used
Conjugated polymers are among the most promising materials for applications in
fields of organic photoelectronic devices. The investigation of this category of materials
attracts a lot of attention from the science community. The studies detailed in this
dissertation focus on the investigation of molecular weight effects on energy/electron
transfer efficiency in conjugated polymers and the application in dye-sensitized solar
cells.
In Chapter 2, two families of conjugated polyelectrolytes (CPEs) featuring the
same backbone but different side chain linkages were synthesized and their application
as light harvesting materials for dye-sensitized solar cells (DSSCs) was investigated.
CPEs bearing an oxygen linkage (-O-) (P1-O-n) are more likely to aggregate in solution
and, the aggregate status depends strongly on the molecular weights. In contrast, there
is no obvious evidence showing that CPEs with methylene (-CH2-) (P2-C-n) linkage
aggregate in solution. In addition, the two families of polymer also show different
behaviors in adsorbing onto mesoporous TiO2 films. The resulting films show different
overall cell efficiency when applied in DSSCs. The P1-O-n TiO2 films show strong chain
length dependence in the absorption and, therefore, the cell performance. In contrast,
little difference can be observed in the P2-C-n TiO2 films. Once the aggregated P1-O-n
polymers adsorbed onto the surface of TiO2 films, they block the pores in the film and
prevent more materials from penetrating into the inside layer. As a result, it slows down
the kinetics of dye-adsorbing and total amount of dyes that are absorbed which
ultimately lowers the overall cell efficiency.
158
In Chapter 3, a series of different chain length poly(p-phenylene-ethynylene)s
(PPEs) end-capped by naphthalene diimide derivatives were synthesized. When
polymers are excited, electrons transfer from the PPE backbones to the naphthalene
diimide end-caps, and the polymer fluorescence is quenched. The overall quenching
efficiency increases with decreasing polymer chain length as evidenced by fluorescence
quantum yield measurements. And, the charge recombination rate is investigated by
femtosecond transient absorption. The charge recombination rate also depends strongly
on the chain length: as the chain length increases, the charge recombination rate
decreases. In addition, the formation of the PPE triplet absorption was detected in the
polymers. The overall triplet absorption intensity increases with molecular weights. More
careful investigation is needed to understand the origin of the triplet formation.
In Chapter 4, a series of different chain length poly(p-phenylene-ethynylene)s
(PPEs) end-capped by 4,7-di(thiophen-2-yl)benzo[c][1,2,5]thiadiazole (TBT) were
synthesized. Under light irradiation, energy transfer from the PPE to TBT occurs mainly
via the Forster Resonance Energy Transfer (FRET) mechanism. The overall energy
transfer efficiency increases with decreasing molecular weight. The overall lifetime of
PPE backbones, which is the donor, decreases with molecular weight while the lifetime
of acceptors, which are TBT, remains constant. Ultra-fast transient absorption study
shows that the energy transfer happens in pico-second time scale for all the polymers
and the lower molecular weight samples show faster decay in the initial stage. An
interesting trend in steady state fluorescence anisotropy was also discovered that
fluorescence anisotropy in the donor emission is significantly higher than that of
acceptors. It has been proposed that polymers are not perfect rigid-rods, but are “worm-
159
like” structures in solution which consist different rigid conjugation segments. The
segments can have some degree of free rotation which slows down the energy transfer
processes.
In Chapter 5, a series of different chain length “through-space” conjugated
polymers with [2.2]paracylophane moieties end-caped with TBT were synthesized.
Despite the fact that the conjugation is partially interrupted, very efficient energy transfer
was observed and the overall energy transfer efficiency decreased with increasing
molecular weight.
160
LIST OF REFERENCES
(1) Shirakawa, H.; Louis, E. J.; MacDiarmid, A. G.; Chiang, C. K.; Heeger, A. J. Synthesis of electrically conducting organic polymers: halogen derivatives of polyacetylene,(CH) x. J. Chem. Soc., Chem. Commun. 1977, 578-580.
(2) Kraft, A.; Grimsdale, A. C.; Holmes, A. B. Electroluminescent conjugated polymers - Seeing polymers in a new light. Angew. Chem. Int. Ed. 1998, 37, 402-428.
(3) Wang, J. L.; Yan, J.; Tang, Z. M.; Xiao, Q.; Ma, Y. G.; Pei, J. Gradient shape-persistent pi-conjugated dendrimers for light-harvesting: Synthesis, photophysical properties, and energy funneling. J. Am. Chem. Soc. 2008, 130, 9952-9962.
(4) Ye, L.; Zhang, S.; Huo, L.; Zhang, M.; Hou, J. Molecular Design toward Highly Efficient Photovoltaic Polymers Based on Two-Dimensional Conjugated Benzodithiophene. Acc. Chem. Res. 2014.
(5) Zhu, Q.; Qiu, F.; Zhu, B. S.; Zhu, X. Y. Hyperbranched polymers for bioimaging. Rsc Advances 2013, 3, 2071-2083.
(6) Ajayaghosh, A. Donor-acceptor type low band gap polymers: polysquaraines and related systems. Chem. Soc. Rev. 2003, 32, 181-191.
(7) Beaujuge, P. M.; Amb, C. M.; Reynolds, J. R. Spectral Engineering in pi-Conjugated Polymers with Intramolecular Donor-Acceptor Interactions. Acc. Chem. Res. 2010, 43, 1396-1407.
(8) Nogueira, A. F.; Longo, C.; De Paoli, M. A. Polymers in dye sensitized solar cells: overview and perspectives. Coord. Chem. Rev. 2004, 248, 1455-1468.
(9) Zhang, W.; Cheng, Y. M.; Yin, X. O.; Liu, B. Solid-State Dye-Sensitized Solar Cells with Conjugated Polymers as Hole-Transporting Materials. Macromol. Chem. Phys. 2011, 212, 15-23.
(10) Brabec, C. J.; Gowrisanker, S.; Halls, J. J. M.; Laird, D.; Jia, S. J.; Williams, S. P. Polymer-Fullerene Bulk-Heterojunction Solar Cells. Adv. Mater. 2010, 22, 3839-3856.
(11) Peet, J.; Heeger, A. J.; Bazan, G. C. "Plastic" Solar Cells: Self-Assembly of Bulk Heterojunction Nanomaterials by Spontaneous Phase Separation. Acc. Chem. Res. 2009, 42, 1700-1708.
(12) Wang, E. G.; Mammo, W.; Andersson, M. R. 25th Anniversary Article: Isoindigo- Based Polymers and Small Molecules for Bulk Heterojunction Solar Cells and Field Effect Transistors. Adv. Mater. 2014, 26, 1801-1826.
161
(13) Moons, E. Conjugated polymer blends: linking film morphology to performance of light emitting diodes and photodiodes. J. Phys.: Condens. Matter 2002, 14, 12235.
(14) Gong, S. L.; Yang, C. L.; Qin, J. G. Efficient phosphorescent polymer light-emitting diodes by suppressing triplet energy back transfer. Chem. Soc. Rev. 2012, 41, 4797-4807.
(15) Resendiz, L.; Estrada, M.; Cerdeira, A.; Iniguez, B.; Deen, M. J. Effect of active layer thickness on the electrical characteristics of polymer thin film transistors. Org. Electron. 2010, 11, 1920-1927.
(16) Zhao, X. G.; Zhan, X. W. Electron transporting semiconducting polymers in organic electronics. Chem. Soc. Rev. 2011, 40, 3728-3743.
(17) Inganas, O. Hybrid electronics and electrochemistry with conjugated polymers. Chem. Soc. Rev. 2010, 39, 2633-2642.
(18) McQuade, D. T.; Pullen, A. E.; Swager, T. M. Conjugated polymer-based chemical sensors. Chemical Reviews 2000, 100, 2537-2574.
(19) Liu, B.; Bazan, G. C. Homogeneous fluorescence-based DNA detection with water-soluble conjugated polymers. Chem. Mater. 2004, 16, 4467-4476.
(20) Feng, X. L.; Liu, L. B.; Wang, S.; Zhu, D. B. Water-soluble fluorescent conjugated polymers and their interactions with biomacromolecules for sensitive biosensors. Chem. Soc. Rev. 2010, 39, 2411-2419.
(21) Feng, L. H.; Zhu, C. L.; Yuan, H. X.; Liu, L. B.; Lv, F. T.; Wang, S. Conjugated polymer nanoparticles: preparation, properties, functionalization and biological applications. Chem. Soc. Rev. 2013, 42, 6620-6633.
(22) Menjoge, A. R.; Kannan, R. M.; Tomalia, D. A. Dendrimer-based drug and imaging conjugates: design considerations for nanomedical applications. Drug Discov. Today 2010, 15, 171-185.
(23) Siedenbiedel, F.; Tiller, J. C. Antimicrobial Polymers in Solution and on Surfaces: Overview and Functional Principles. Polymers 2012, 4, 46-71.
(24) Wang, Y.; Chi, E. Y.; Schanze, K. S.; Whitten, D. G. Membrane activity of antimicrobial phenylene ethynylene based polymers and oligomers. Soft Matter 2012, 8, 8547-8558.
(25) Zhu, C. L.; Liu, L. B.; Yang, Q.; Lv, F. T.; Wang, S. Water-Soluble Conjugated Polymers for Imaging, Diagnosis, and Therapy. Chem. Rev. 2012, 112, 4687-4735.
162
(26) Heeger, A. J. Semiconducting polymers: the third generation. Chem. Soc. Rev. 2010, 39, 2354-2371.
(27) Markov, D. E.; Amsterdam, E.; Blom, P. W. M.; Sieval, A. B.; Hummelen, J. C. Accurate measurement of the exciton diffusion length in a conjugated polymer using a heterostructure with a side-chain cross-linked fullerene layer. J. Phys. Chem. A 2005, 109, 5266-5274.
(28) Mikhnenko, O. V.; Cordella, F.; Sieval, A. B.; Hummelen, J. C.; Blom, P. W. M.; Loi, M. A. Temperature dependence of exciton diffusion in conjugated polymers. J. Phys. Chem. B 2008, 112, 11601-11604.
(29) Wells, N. P.; Boudouris, B. W.; Hillmyer, M. A.; Blank, D. A. Intramolecular exciton relaxation and migration dynamics in poly(3-hexylthiophene). J. Phys. Chem. C 2007, 111, 15404-15414.
(30) Shaw, P. E.; Ruseckas, A.; Samuel, I. D. Exciton diffusion measurements
in poly (3‐hexylthiophene). Adv. Mater. 2008, 20, 3516-3520.
(31) Feng, F.; Lee, S. H.; Cho, S. W.; Komürlü, S.; McCarley, T. D.; Roitberg, A.; Kleiman, V. D.; Schanze, K. S. Conjugated polyelectrolyte dendrimers: aggregation, photophysics, and amplified quenching. Langmuir 2012, 28, 16679-16691.
(33) Morisaki, Y.; Chujo, Y. Through-space conjugated polymers consisting of [2.2] paracyclophane. Polym. Chem. 2011, 2, 1249-1257.
(34) Wu, F.-I.; Dodda, R.; Reddy, D. S.; Shu, C.-F. Synthesis and characterization of spiro-linked poly (terfluorene): a blue-emitting polymer with controlled conjugated length. J. Mater. Chem. 2002, 12, 2893-2897.
(35) Webber, S. E. Photon-harvesting polymers. Chem. Rev. 1990, 90, 1469-1482.
(36) Sun, Y.; Chen, Z.; Puodziukynaite, E.; Jenkins, D. M.; Reynolds, J. R.; Schanze, K. S. Light Harvesting Arrays of Polypyridine Ruthenium(II) Chromophores Prepared by Reversible Addition-Fragmentation Chain Transfer Polymerization. Macromolecules 2012, 45, 2632-2642.
(37) Chen, Z.; Grumstrup, E. M.; Gilligan, A. T.; Papanikolas, J. M.; Schanze, K. S. Light-Harvesting Polymers: Ultrafast Energy Transfer in Polystyrene-Based Arrays of pi-Conjugated Chromophores. J. Phys. Chem. B 2014, 118, 372-378.
163
(38) Barford, W.; Lidzey, D. G.; Makhov, D. V.; Meijer, A. J. H. Exciton localization in disordered poly(3-hexylthiophene). J. Chem. Phys. 2010, 133, 044504.
(39) Kitamura, C.; Tanaka, S.; Yamashita, Y. Design of narrow-bandgap polymers. Syntheses and properties of monomers and polymers containing aromatic-donor and o-quinoid-acceptor units. Chem. Mater. 1996, 8, 570-578.
(40) Lin, J.; Li, W.; Yu, Z.; Yi, M.; Ling, H.; Xie, L.; Li, S.; Huang, W. π-Conjugation-interrupted hyperbranched polymer electrets for organic nonvolatile transistor memory devices. J. Mater. Chem. C 2014, 2, 3738-3743.
(41) Furuta, P. T.; Deng, L.; Garon, S.; Thompson, M. E.; Fréchet, J. M. Platinum-functionalized random copolymers for use in solution-processible, efficient, near-white organic light-emitting diodes. J. Am. Chem. Soc. 2004, 126, 15388-15389.
(42) Waltman, R.; Bargon, J. Electrically conducting polymers: a review of the electropolymerization reaction, of the effects of chemical structure on polymer film properties, and of applications towards technology. Can. J. Chem. 1986, 64, 76-95.
(43) Bunz, U. H.; Mäker, D.; Porz, M. Alkene Metathesis–A Tool for the Synthesis of Conjugated Polymers. Macromol. Rapid Commun. 2012, 33, 886-910.
(44) Bunz, U. H. Poly (p-phenyleneethynylene) s by alkyne metathesis. Acc. Chem. Res. 2001, 34, 998-1010.
(45) Bunz, U. H. Poly (aryleneethynylene) s: syntheses, properties, structures, and applications. Chem. Rev. 2000, 100, 1605-1644.
(46) Diaz, A.; Kanazawa, K. K.; Gardini, G. P. Electrochemical polymerization of pyrrole. J. Chem. Soc., Chem. Commun. 1979, 635-636.
(47) Waltman, R. J.; Diaz, A.; Bargon, J. Electroactive properties of polyaromatic molecules. J. Electrochem. Soc. 1984, 131, 740-744.
(48) Heinze, J.; Frontana-Uribe, B. A.; Ludwigs, S. Electrochemistry of Conducting Polymers-Persistent Models and New Concepts. Chem. Rev. 2010, 110, 4724-4771.
(49) Connon, S. J.; Blechert, S. Recent developments in olefin cross-metathesis. Angew. Chem. Int. Ed. 2003, 42, 1900-1923.
(50) Sutthasupa, S.; Shiotsuki, M.; Sanda, F. Recent advances in ring-opening metathesis polymerization, and application to synthesis of functional materials. Polym. J. 2010, 42, 905-915.
(51) Villar, H.; Frings, M.; Bolm, C. Ring closing enyne metathesis: A powerful tool for the synthesis of heterocycles. Chem. Soc. Rev. 2007, 36, 55-66.
164
(52) Mutlu, H.; de Espinosa, L. M.; Meier, M. A. R. Acyclic diene metathesis: a versatile tool for the construction of defined polymer architectures. Chem. Soc. Rev. 2011, 40, 1404-1445.
(53) Bunz, U. H. Poly (aryleneethynylene) s. Macromol. Rapid Commun. 2009, 30, 772-805.
(54) Thorn‐Csányi, E.; Kraxner, P. Synthesis of soluble, all‐trans poly (2,
5‐diheptyl‐p‐phenylenevinylene) via metathesis polycondensation. Macromol.
Rapid Commun. 1995, 16, 147-153.
(55) Herzog, O.; Narwark, O.; Thorn-Csányi, E. Synthesis and properties of monoheptyl substituted PV oligomers. Synth. Met. 2001, 119, 141-142.
of high molecular weight trans‐poly (9, 9‐di‐n‐octylfluorene‐2, 7‐vinylene) by
the acyclic diene metathesis polymerization using molybdenum catalysts. J. Polym. Sci., Part A: Polym. Chem. 2001, 39, 2463-2470.
(57) Yamamoto, N.; Ito, R.; Geerts, Y.; Nomura, K. Synthesis of All-Trans High Molecular Weight Poly (N-alkylcarbazole-2, 7-vinylene) s and Poly (9, 9-dialkylfluorene-2, 7-vinylene) s by Acyclic Diene Metathesis (ADMET) Polymerization Using Ruthenium− Carbene Complex Catalysts. Macromolecules 2009, 42, 5104-5111.
(58) Kloppenburg, L.; Jones, D.; Bunz, U. H. High molecular weight poly (p-phenyleneethynylene) s by alkyne metathesis utilizing “instant” catalysts: a synthetic study. Macromolecules 1999, 32, 4194-4203.
(59) Amatore, C.; Jutand, A. Anionic Pd (0) and Pd (II) intermediates in palladium-catalyzed Heck and cross-coupling reactions. Acc. Chem. Res. 2000, 33, 314-321.
(60) Odian, G.: Principles of Polymerization; Wiley, 2004.
(61) Robb, M. J.; Montarnal, D.; Eisenmenger, N. D.; Ku, S.-Y.; Chabinyc, M. L.; Hawker, C. J. A One-Step Strategy for End-Functionalized Donor–Acceptor Conjugated Polymers. Macromolecules 2013, 46, 6431-6438.
(62) Zhao, X.; Jiang, H.; Schanze, K. S. Polymer chain length dependence of amplified fluorescence quenching in conjugated polyelectrolytes. Macromolecules 2008, 41, 3422-3428.
(63) Yin, S.; Leen, V.; Jackers, C.; Van der Auweraer, M.; Smet, M.; Boens, N.; Dehaen, W. The synthesis and spectroscopic characterization of poly (< i> p</i>-phenylene ethynylene) with 3-connected BODIPY end groups. Dyes and Pigments 2011, 88, 372-377.
165
(64) Nesterov, E. E.; Zhu, Z.; Swager, T. M. Conjugation enhancement of intramolecular exciton migration in poly (p-phenylene ethynylene) s. J. Am. Chem. Soc. 2005, 127, 10083-10088.
(65) Osaka, I.; McCullough, R. D. Advances in molecular design and synthesis of regioregular polythiophenes. Acc. Chem. Res. 2008, 41, 1202-1214.
(66) Yokoyama, A.; Suzuki, H.; Kubota, Y.; Ohuchi, K.; Higashimura, H.; Yokozawa, T. Chain-growth polymerization for the synthesis of polyfluorene via Suzuki-Miyaura coupling reaction from an externally added initiator unit. J. Am. Chem. Soc. 2007, 129, 7236-7237.
(67) Zhang, H.-H.; Xing, C.-H.; Hu, Q.-S. Controlled Pd (0)/t-Bu3P-Catalyzed Suzuki Cross-Coupling Polymerization of AB-Type Monomers with PhPd (t-Bu3P) I or Pd2 (dba) 3/t-Bu3P/ArI as the Initiator. J. Am. Chem. Soc. 2012, 134, 13156-13159.
(68) Yokozawa, T.; Kohno, H.; Ohta, Y.; Yokoyama, A. Catalyst-Transfer Suzuki− Miyaura Coupling Polymerization for Precision Synthesis of Poly (p-phenylene). Macromolecules 2010, 43, 7095-7100.
(69) Kang, S.; Ono, R. J.; Bielawski, C. W. Controlled Catalyst Transfer Polycondensation and Surface-Initiated Polymerization of ap-Phenyleneethynylene-Based Monomer. J. Am. Chem. Soc. 2013, 135, 4984-4987.
(70) Wiley: Fundamentals of Photochemistry; John Wiley & Sons Canada, Limited, 1986.
(71) Lakowicz, J. R.: Principles of Fluorescence Spectroscopy; Springer, 2007.
(72) Turro, N. J.; Ramamurthy, V.; Scaiano, J. C.: Principles of Molecular Photochemistry: An Introduction; University Science Books, 2009.
(73) Lewis, F. D.; Letsinger, R. L.; Wasielewski, M. R. Dynamics of photoinduced charge transfer and hole transport in synthetic DNA hairpins. Acc. Chem. Res. 2001, 34, 159-170.
(74) Schuster, G. B. Long-range charge transfer in DNA: Transient structural distortions control the distance dependence. Acc. Chem. Res. 2000, 33, 253-260.
(75) Ardo, S.; Meyer, G. J. Photodriven heterogeneous charge transfer with transition-metal compounds anchored to TiO2 semiconductor surfaces. Chem. Soc. Rev. 2009, 38, 115-164.
(76) Yuan, W. Z.; Gong, Y.; Chen, S.; Shen, X. Y.; Lam, J. W. Y.; Lu, P.; Lu, Y.; Wan, Z.; Hu, R.; Xie, N.; Kwok, H. S.; Zhang, Y.; Sun, J. Z.; Tang, B. Z. Efficient Solid Emitters with Aggregation-Induced Emission and Intramolecular Charge Transfer Characteristics: Molecular Design, Synthesis, Photophysical Behaviors, and OLED Application. Chem. Mater. 2012, 24, 1518-1528.
166
(77) Marcus, R. A. On the Theory of Oxidation‐Reduction Reactions Involving
Electron Transfer. I. J. Chem. Phys. 1956, 24, 966-978.
(78) Li, X.-Y.; Tang, X.-S.; He, F.-C. Electron transfer in poly (< i> p</i>-phenylene) oligomers: effect of external electric field and application of Koopmans theorem. Chem. Phys. 1999, 248, 137-146.
(79) Cornil, J.; Beljonne, D.; Calbert, J.-P.; Brédas, J.-L. Interchain interactions in organic π-conjugated materials: impact on electronic structure, optical response, and charge transport. Adv. Mater. 2001, 13, 1053-1067.
(80) Zhou, Q.; Swager, T. M. Fluorescent chemosensors based on energy migration in conjugated polymers: The molecular wire approach to increased sensitivity. J. Am. Chem. Soc. 1995, 117, 12593-12602.
(81) Thomas, S. W.; Joly, G. D.; Swager, T. M. Chemical sensors based on amplifying fluorescent conjugated polymers. Chemical Reviews 2007, 107, 1339-1386.
(82) Andrew, T. L.; Swager, T. M. Structure—Property relationships for exciton transfer in conjugated polymers. J. Polym. Sci., Part B: Polym. Phys. 2011, 49, 476-498.
(83) Swager, T. M.; Gil, C. J.; Wrighton, M. S. Fluorescence studies of poly (p-phenyleneethynylene) s: the effect of anthracene substitution. J. Phys. Chem. 1995, 99, 4886-4893.
(84) Hennebicq, E.; Pourtois, G.; Scholes, G. D.; Herz, L. M.; Russell, D. M.; Silva, C.; Setayesh, S.; Grimsdale, A. C.; Müllen, K.; Brédas, J.-L. Exciton migration in rigid-rod conjugated polymers: an improved Förster model. J. Am. Chem. Soc. 2005, 127, 4744-4762.
(85) Beljonne, D.; Pourtois, G.; Silva, C.; Hennebicq, E.; Herz, L.; Friend, R.; Scholes, G.; Setayesh, S.; Müllen, K.; Brédas, J. Interchain vs. intrachain energy transfer in acceptor-capped conjugated polymers. Proc. Natl. Acad. Sci. U.S.A. 2002, 99, 10982-10987.
(86) Brédas, J.-L.; Beljonne, D.; Coropceanu, V.; Cornil, J. Charge-transfer and energy-transfer processes in π-conjugated oligomers and polymers: a molecular picture. Chem. Rev. 2004, 104, 4971-5004.
(87) Nguyen, T.-Q.; Wu, J.; Doan, V.; Schwartz, B. J.; Tolbert, S. H. Control of energy transfer in oriented conjugated polymer-mesoporous silica composites. Science 2000, 288, 652-656.
(88) Nguyen, T.-Q.; Wu, J.; Tolbert, S. H.; Schwartz, B. J. Control of energy transport in conjugated polymers using an ordered mesoporous silica matrix. Adv. Mater. 2001, 13, 609-611.
167
(89) Feng, X.; Liu, L.; Wang, S.; Zhu, D. Water-soluble fluorescent conjugated polymers and their interactions with biomacromolecules for sensitive biosensors. Chem. Soc. Rev. 2010, 39, 2411-2419.
(90) Jiang, H.; Taranekar, P.; Reynolds, J. R.; Schanze, K. S. Conjugated polyelectrolytes: synthesis, photophysics, and applications. Angew. Chem. Int. Ed. 2009, 48, 4300-4316.
(91) Hoven, C. V.; Garcia, A.; Bazan, G. C.; Nguyen, T. Q. Recent applications of conjugated polyelectrolytes in optoelectronic devices. Adv. Mater. 2008, 20, 3793-3810.
(92) Duarte, A.; Pu, K.-Y.; Liu, B.; Bazan, G. C. Recent Advances in Conjugated Polyelectrolytes for Emerging Optoelectronic Applications†. Chem. Mater. 2010, 23, 501-515.
(93) Chen, L.; McBranch, D. W.; Wang, H.-L.; Helgeson, R.; Wudl, F.; Whitten, D. G. Highly sensitive biological and chemical sensors based on reversible fluorescence quenching in a conjugated polymer. Proc. Natl. Acad. Sci. U.S.A. 1999, 96, 12287-12292.
(94) Jiang, H.; Zhao, X.; Schanze, K. S. Amplified fluorescence quenching of a conjugated polyelectrolyte mediated by Ca2+. Langmuir 2006, 22, 5541-5543.
(95) Maisch, T.; Szeimies, R.-M.; Jori, G.; Abels, C. Antibacterial photodynamic therapy in dermatology. Photoch. Photobio. Sci. 2004, 3, 907-917.
(96) Ji, E.; Corbitt, T. S.; Parthasarathy, A.; Schanze, K. S.; Whitten, D. G. Light and dark-activated biocidal activity of conjugated polyelectrolytes. ACS Appl. Mater. Inter. 2011, 3, 2820-2829.
(97) Chemburu, S.; Corbitt, T. S.; Ista, L. K.; Ji, E.; Fulghum, J.; Lopez, G. P.; Ogawa, K.; Schanze, K. S.; G. Whitten, D. Light-induced biocidal action of conjugated polyelectrolytes supported on colloids. Langmuir 2008, 24, 11053-11062.
(98) Kenawy, E.-R.; Worley, S.; Broughton, R. The chemistry and applications of antimicrobial polymers: a state-of-the-art review. Biomacromolecules 2007, 8, 1359-1384.
(99) Ogawa, K.; Chemburu, S.; Lopez, G. P.; Whitten, D. G.; Schanze, K. S. Conjugated polyelectrolyte-grafted silica microspheres. Langmuir 2007, 23, 4541-4548.
(100) Feng, X.; Lv, F.; Liu, L.; Tang, H.; Xing, C.; Yang, Q.; Wang, S. Conjugated polymer nanoparticles for drug delivery and imaging. ACS Appl. Mater. Inter. 2010, 2, 2429-2435.
(101) Hagfeldt, A.; Boschloo, G.; Sun, L.; Kloo, L.; Pettersson, H. Dye-sensitized solar cells. Chem. Rev. 2010, 110, 6595-6663.
168
(102) Ramakrishna, G.; Jose, D. A.; Kumar, D. K.; Das, A.; Palit, D. K.; Ghosh, H. N. Strongly coupled ruthenium-polypyridyl complexes for efficient electron injection in dye-sensitized semiconductor nanoparticles. J. Phys. Chem. B 2005, 109, 15445-15453.
(103) Kuang, D.; Ito, S.; Wenger, B.; Klein, C.; Moser, J.-E.; Humphry-Baker, R.; Zakeeruddin, S. M.; Grätzel, M. High molar extinction coefficient heteroleptic ruthenium complexes for thin film dye-sensitized solar cells. J. Am. Chem. Soc. 2006, 128, 4146-4154.
(104) Koops, S. E.; O’Regan, B. C.; Barnes, P. R.; Durrant, J. R. Parameters influencing the efficiency of electron injection in dye-sensitized solar cells. J. Am. Chem. Soc. 2009, 131, 4808-4818.
(105) Clifford, J. N.; Palomares, E.; Nazeeruddin, M. K.; Gratzel, M.; Durrant, J. R. Dye dependent regeneration dynamics in dye sensitized nanocrystalline solar cells: Evidence for the formation of a ruthenium bipyridyl cation/iodide intermediate. J. Phys. Chem. C 2007, 111, 6561-6567.
(106) Ferrere, S.; Zaban, A.; Gregg, B. A. Dye sensitization of nanocrystalline tin oxide by perylene derivatives. J. Phys. Chem. B 1997, 101, 4490-4493.
(107) Feldt, S. M.; Gibson, E. A.; Gabrielsson, E.; Sun, L.; Boschloo, G.; Hagfeldt, A. Design of organic dyes and cobalt polypyridine redox mediators for high-efficiency dye-sensitized solar cells. J. Am. Chem. Soc. 2010, 132, 16714-16724.
(108) Kelly, C. A.; Farzad, F.; Thompson, D. W.; Stipkala, J. M.; Meyer, G. J. Cation-controlled interfacial charge injection in sensitized nanocrystalline TiO2. Langmuir 1999, 15, 7047-7054.
(109) Kuciauskas, D.; Freund, M. S.; Gray, H. B.; Winkler, J. R.; Lewis, N. S. Electron transfer dynamics in nanocrystalline titanium dioxide solar cells sensitized with ruthenium or osmium polypyridyl complexes. J. Phys. Chem. B 2001, 105, 392-403.
(110) O'Regan, B. C.; Bakker, K.; Kroeze, J.; Smit, H.; Sommeling, P.; Durrant, J. R. Measuring charge transport from transient photovoltage rise times. A new tool to investigate electron transport in nanoparticle films. J. Phys. Chem. B 2006, 110, 17155-17160.
(111) Chen, Z.; Li, F.; Huang, C. Organic d-pi-a dyes for dye-sensitized solar cell. Curr. Org. Chem. 2007, 11, 1241-1258.
(112) Chen, X.; Mao, S. S. Titanium dioxide nanomaterials: synthesis, properties, modifications, and applications. Chem. Rev. 2007, 107, 2891-2959.
(113) Ardo, S.; Meyer, G. J. Photodriven heterogeneous charge transfer with transition-metal compounds anchored to TiO 2 semiconductor surfaces. Chem. Soc. Rev. 2009, 38, 115-164.
169
(114) Beaujuge, P.; Ellinger, S.; Reynolds, J. The donor–acceptor approach allows a black-to-transmissive switching polymeric electrochrome. Nature materials 2008, 7, 795-799.
(115) Shi, P.; Amb, C. M.; Knott, E. P.; Thompson, E. J.; Liu, D. Y.; Mei, J.; Dyer, A. L.; Reynolds, J. R. Broadly absorbing black to transmissive switching electrochromic polymers. Adv. Mater. 2010, 22, 4949-4953.
(116) Kimura, M.; Nomoto, H.; Masaki, N.; Mori, S. Dye Molecules for Simple
Co‐Sensitization Process: Fabrication of Mixed‐Dye‐Sensitized Solar Cells. Angew.
Chem. Int. Ed. 2012, 51, 4371-4374.
(117) Liu, Y.; Hagfeldt, A.; Xiao, X.-R.; Lindquist, S.-E. Investigation of influence of redox species on the interfacial energetics of a dye-sensitized nanoporous TiO< sub> 2</sub> solar cell. Sol. Energy Mater. Sol. Cells 1998, 55, 267-281.
(118) Nusbaumer, H.; Moser, J. E.; Zakeeruddin, S. M.; Nazeeruddin, M. K.; Gratzel, M. Co-II(dbbiP)(2)(2+) complex rivals tri-iodide/iodide redox mediator in dye-sensitized photovoltaic cells. J. Phys. Chem. B 2001, 105, 10461-10464.
(119) Hara, K.; Dan-Oh, Y.; Kasada, C.; Ohga, Y.; Shinpo, A.; Suga, S.; Sayama, K.; Arakawa, H. Effect of additives on the photovoltaic performance of coumarin-dye-sensitized nanocrystalline TiO2 solar cells. Langmuir 2004, 20, 4205-4210.
(120) Schlichthorl, G.; Huang, S. Y.; Sprague, J.; Frank, A. J. Band edge movement and recombination kinetics in dye-sensitized nanocrystalline TiO2 solar cells: A study by intensity modulated photovoltage spectroscopy. J. Phys. Chem. B 1997, 101, 8141-8155.
(121) Grätzel, M. Dye-sensitized solar cells. Journal of Photochemistry and Photobiology C: Photochemistry Reviews 2003, 4, 145-153.
(122) O’regan, B.; Grfitzeli, M. A low-cost, high-efficiency solar cell based on dye-sensitized. Nature 1991, 353, 737-740.
(123) Yella, A.; Lee, H.-W.; Tsao, H. N.; Yi, C.; Chandiran, A. K.; Nazeeruddin, M. K.; Diau, E. W.-G.; Yeh, C.-Y.; Zakeeruddin, S. M.; Grätzel, M. Porphyrin-sensitized solar cells with cobalt (II/III)–based redox electrolyte exceed 12 percent efficiency. Science 2011, 334, 629-634.
(124) Wu, Y.; Zhu, W. Organic sensitizers from D-pi-A to D-A-pi-A: effect of the internal electron-withdrawing units on molecular absorption, energy levels and photovoltaic performances. Chem. Soc. Rev. 2013, 42, 2039-2058.
(125) Mishra, A.; Fischer, M. K.; Bäuerle, P. Metal‐free organic dyes for dye‐sensitized solar cells: From structure: Property relationships to design rules. Angew. Chem. Int. Ed. 2009, 48, 2474-2499.
(127) Mwaura, J. K.; Zhao, X.; Jiang, H.; Schanze, K. S.; Reynolds, J. R. Spectral broadening in nanocrystalline TiO2 solar cells based on poly (p-phenylene ethynylene) and polythiophene sensitizers. Chem. Mater. 2006, 18, 6109-6111.
(128) Taranekar, P.; Qiao, Q.; Jiang, H.; Ghiviriga, I.; Schanze, K. S.; Reynolds, J. R. Hyperbranched conjugated polyelectrolyte bilayers for solar-cell applications. J. Am. Chem. Soc. 2007, 129, 8958-8959.
(129) Jiang, H.; Zhao, X.; Shelton, A. H.; Lee, S. H.; Reynolds, J. R.; Schanze, K. S. Variable-Band-Gap Poly (arylene ethynylene) Conjugated Polyelectrolytes Adsorbed on Nanocrystalline TiO2: Photocurrent Efficiency as a Function of the Band Gap. ACS Appl. Mater. Inter. 2009, 1, 381-387.
(130) Duan, C.; Zhang, K.; Zhong, C.; Huang, F.; Cao, Y. Recent advances in water/alcohol-soluble π-conjugated materials: new materials and growing applications in solar cells. Chem. Soc. Rev. 2013, 42, 9071-9104.
(131) Fang, Z.; Eshbaugh, A. A.; Schanze, K. S. Low-Bandgap Donor-Acceptor Conjugated Polymer Sensitizers for Dye-Sensitized Solar Cells. J. Am. Chem. Soc. 2011, 133, 3063-3069.
V. J.; Ramakrishna, S. Application of Poly (3‐hexylthiophene) Functionalized with an
Anchoring Group in Dye‐sensitized Solar Cells. Macromol. Rapid Commun. 2011, 32,
1190-1194.
(133) An, B.-K.; Mulherin, R.; Langley, B.; Burn, P.; Meredith, P. Ruthenium complex-cored dendrimers: Shedding light on efficiency trade-offs in dye-sensitised solar cells. Org. Electron. 2009, 10, 1356-1363.
(134) Thongkasee, P.; Thangthong, A.; Janthasing, N.; Sudyoadsuk, T.; Namuangruk, S.; Keawin, T.; Jungsuttiwong, S.; Promarak, V. Carbazole-Dendrimer-Based Donor-pi-Acceptor Type Organic Dyes for Dye-Sensitized Solar Cells: Effect of the Size of the Carbazole Dendritic Donor. ACS Appl. Mater. Inter. 2014, 6, 8212-8222.
(135) Liu, T.; Rulkens, R.; Wegner, G.; Chu, B. Laser light scattering study of a rigid-rod polyelectrolyte. Macromolecules 1998, 31, 6119-6128.
(136) Yang, R.; Garcia, A.; Korystov, D.; Mikhailovsky, A.; Bazan, G. C.; Nguyen, T.-Q. Control of interchain contacts, solid-state fluorescence quantum yield, and charge transport of cationic conjugated polyelectrolytes by choice of anion. J. Am. Chem. Soc. 2006, 128, 16532-16539.
171
(137) Sedlak, M.; Amis, E. J. Dynamics of Moderately Conjugated Salt-Free Polyelectrolyte Solutions-Molecular-Weight Dependence. J. Chem. Phys. 1992, 96, 817-825.
(138) Li, Y.; Xia, J.; Dubin, P. L. Complex formation between polyelectrolyte and oppositely charged mixed micelles: static and dynamic light scattering study of the effect of polyelectrolyte molecular weight and concentration. Macromolecules 1994, 27, 7049-7055.
(139) Koenen, J.-M.; Zhu, X.; Pan, Z.; Feng, F.; Yang, J.; Schanze, K. S. Enhanced Fluorescence Properties of Poly (phenylene ethynylene)-Conjugated Polyelectrolytes Designed to Avoid Aggregation. ACS Macro Letters 2014, 3, 405-409.
(140) Feng, F.; Yang, J.; Xie, D.; McCarley, T. D.; Schanze, K. S. Remarkable Photophysics and Amplified Quenching of Conjugated Polyelectrolyte Oligomers. J. Phys. Chem. Lett. 2013, 4, 1410-1414.
(141) Zhao, X.; Pinto, M. R.; Hardison, L. M.; Mwaura, J.; Muller, J.; Jiang, H.; Witker, D.; Kleiman, V. D.; Reynolds, J. R.; Schanze, K. S. Variable band gap poly(arylene ethynylene) conjugated polyelectrolytes. Macromolecules 2006, 39, 6355-6366.
(142) Tan, C.; Pinto, M. R.; Schanze, K. S. Photophysics, aggregation and amplified quenching of a water-soluble poly (phenylene ethynylene). Chem. Commun. 2002, 446-447.
(143) Chen, K. S.; Liu, W. H.; Wang, Y. H.; Lai, C. H.; Chou, P. T.; Lee, G. H.;
Chen, K.; Chen, H. Y.; Chi, Y.; Tung, F. C. New Family of Ruthenium‐Dye‐Sensitized
Nanocrystalline TiO2 Solar Cells with a High Solar‐Energy‐Conversion Efficiency.
Adv. Funct. Mater. 2007, 17, 2964-2974.
(144) Wang, Z.-S.; Cui, Y.; Dan-oh, Y.; Kasada, C.; Shinpo, A.; Hara, K. Thiophene-functionalized coumarin dye for efficient dye-sensitized solar cells: Electron lifetime improved by coadsorption of deoxycholic acid. J. Phys. Chem. C 2007, 111, 7224-7230.
(145) Lu, H.-P.; Tsai, C.-Y.; Yen, W.-N.; Hsieh, C.-P.; Lee, C.-W.; Yeh, C.-Y.; Diau, E. W.-G. Control of Dye Aggregation and Electron Injection for Highly Efficient Porphyrin Sensitizers Adsorbed on Semiconductor Films with Varying Ratios of Coadsorbate. J. Phys. Chem. C 2009, 113, 20990-20997.
(146) Zhang, C.; Chen, S.; Tian, H.; Huang, Y.; Huo, Z.; Dai, S.; Kong, F.; Sui, Y. Experimental Investigation of Back Electron Transfer and Band Edge Shift in Dyed TiO2 Electrodes. J. Phys. Chem. C 2011, 115, 8653-8657.
(147) Koops, S. E.; O'Regan, B. C.; Barnes, P. R. F.; Durrant, J. R. Parameters Influencing the Efficiency of Electron Injection in Dye-Sensitized Solar Cells. J. Am. Chem. Soc. 2009, 131, 4808-4818.
172
(148) Rehm, J. M.; McLendon, G. L.; Nagasawa, Y.; Yoshihara, K.; Moser, J.; Gratzel, M. Femtosecond electron-transfer dynamics at a sensitizing dye-semiconductor (TiO2) interface. J. Phys. Chem. 1996, 100, 9577-9578.
(149) Wang, Z.-S.; Koumura, N.; Cui, Y.; Takahashi, M.; Sekiguchi, H.; Mori, A.; Kubo, T.; Furube, A.; Hara, K. Hexylthiophene-functionalized carbazole dyes for efficient molecular photovoltaics: Tuning of solar-cell performance by structural modification. Chem. Mater. 2008, 20, 3993-4003.
(150) Marinado, T.; Nonomura, K.; Nissfolk, J.; Karlsson, M. K.; Hagberg, D. P.; Sun, L.; Mori, S.; Hagfeldt, A. How the nature of triphenylamine-polyene dyes in dye-sensitized solar cells affects the open-circuit voltage and electron lifetimes. Langmuir 2009, 26, 2592-2598.
(151) Lu, H.-P.; Tsai, C.-Y.; Yen, W.-N.; Hsieh, C.-P.; Lee, C.-W.; Yeh, C.-Y.; Diau, E. W.-G. Control of dye aggregation and electron injection for highly efficient porphyrin sensitizers adsorbed on semiconductor films with varying ratios of coadsorbate. J. Phys. Chem. C 2009, 113, 20990-20997.
(152) Lee, S.-H. A.; Abrams, N. M.; Hoertz, P. G.; Barber, G. D.; Halaoui, L. I.; Mallouk, T. E. Coupling of Titania Inverse Opals to Nanocrystalline Titania Layers in Dye-Sensitized Solar Cells. J. Phys. Chem. B 2008, 112, 14415-14421.
(153) Fattorusso, C.; Gemma, S.; Butini, S.; Huleatt, P.; Catalanotti, B.; Persico, M.; De Angelis, M.; Fiorini, I.; Nacci, V.; Ramunno, A.; Rodriquez, M.; Greco, G.; Novellino, E.; Bergamini, A.; Marini, S.; Coletta, M.; Maga, G.; Spadari, S.; Campiani, G. Specific targeting highly conserved residues in the HIV-1 reverse transcriptase primer grip region. Design, synthesis, and biological evaluation of novel, potent, and broad spectrum NNRTIs with antiviral activity. J. Med. Chem. 2005, 48, 7153-7165.
(154) Kline, R. J.; McGehee, M. D.; Kadnikova, E. N.; Liu, J.; Frechet, J. M.; Toney, M. F. Dependence of regioregular poly (3-hexylthiophene) film morphology and field-effect mobility on molecular weight. Macromolecules 2005, 38, 3312-3319.
(155) Coffin, R. C.; Peet, J.; Rogers, J.; Bazan, G. C. Streamlined microwave-assisted preparation of narrow-bandgap conjugated polymers for high-performance bulk heterojunction solar cells. Nat. Chem. 2009, 1, 657-661.
(156) Bijleveld, J. C.; Zoombelt, A. P.; Mathijssen, S. G.; Wienk, M. M.; Turbiez, M.; de Leeuw, D. M.; Janssen, R. A. Poly (diketopyrrolopyrrole− terthiophene) for ambipolar logic and photovoltaics. J. Am. Chem. Soc. 2009, 131, 16616-16617.
(157) Fujitsuka, M.; Ito, O.; Yamashiro, T.; Aso, Y.; Otsubo, T. Solvent polarity dependence of photoinduced charge separation in a tetrathiophene-C-60 dyad studied by pico- and nanosecond laser flash photolysis in the near-IR region. J. Phys. Chem. A 2000, 104, 4876-4881.
173
(158) Fujitsuka, M.; Masuhara, A.; Kasai, H.; Oikawa, H.; Nakanishi, H.; Ito, O.; Yamashiro, T.; Aso, Y.; Otsubo, T. Photoinduced charge separation and recombination processes in fine particles of oligothiophene-C-60 dyad molecules. J. Phys. Chem. B 2001, 105, 9930-9934.
(159) Wiberg, J.; Guo, L.; Pettersson, K.; Nilsson, D.; Ljungdahl, T.; Martensson, J.; Albinsson, B. Charge recombination versus charge separation in donor-bridge-acceptor systems. J. Am. Chem. Soc. 2007, 129, 155-163.
(160) Kilsa, K.; Kajanus, J.; Macpherson, A. N.; Martensson, J.; Albinsson, B. Bridge-dependent electron transfer in porphyrin-based donor-bridge-acceptor systems. J. Am. Chem. Soc. 2001, 123, 3069-3080.
(161) Greenfield, S. R.; Svec, W. A.; Gosztola, D.; Wasielewski, M. R. Multistep photochemical charge separation in rod-like molecules based on aromatic imides and diimides. J. Am. Chem. Soc. 1996, 118, 6767-6777.
(162) Keller, J. M.; Schanze, K. S. Synthesis of Monodisperse Platinum Acetylide Oligomers End-Capped with Naphthalene Diimide Units. Organometallics 2009, 28, 4210-4216.
(163) Kohler, A.; Wilson, J. S.; Friend, R. H.; Al-Suti, M. K.; Khan, M. S.; Gerhard, A.; Bassler, H. The singlet-triplet energy gap in organic and Pt-containing phenylene ethynylene polymers and monomers. J. Chem. Phys. 2002, 116, 9457-9463.
(164) Vella, J. H.; Parthasarathy, A.; Schanze, K. S. Triplet Sensitization in an Anionic Poly(phenyleneethynylene) Conjugated Polyelectrolyte by Cationic Iridium Complexes. J. Phys. Chem. A 2013, 117, 7818-7822.
(165) Walters, K. Triplet state photophysics in an aryleneethynylene π-conjugated polymer. Chem. Commun. 1998, 1115-1116.
(166) Keller, J. M.; Glusac, K. D.; Danilov, E. O.; McIlroy, S.; Sreearuothai, P.; Cook, A. R.; Jiang, H.; Miller, J. R.; Schanze, K. S. Negative Polaron and Triplet Exciton Diffusion in Organometallic "Molecular Wires". J. Am. Chem. Soc. 2011, 133, 11289-11298.
(167) Sluch, M. I.; Godt, A.; Bunz, U. H. F.; Berg, M. A. Excited-state dynamics of oligo(p-phenyleneethynylene): Quadratic coupling and torsional motions. J. Am. Chem. Soc. 2001, 123, 6447-6448.
(168) Duvanel, G.; Grilj, J.; Schuwey, A.; Gossauer, A.; Vauthey, E. Ultrafast excited-state dynamics of phenyleneethynylene oligomers in solution. Photoch. Photobio. Sci. 2007, 6, 956-963.
(169) Staerk, H.; Kuhnle, W.; Treichel, R.; Weller, A Magnetic-Field Dependence of Intramolecular Exciplex Formation in Polymethylene-Linked A-D Systems. Chem. Phys. Lett. 1985, 118, 19-24.
174
(170) Weller, A.; Staerk, H.; Treichel, R. Magnetic-Field Effects on Geminate Radical-Pair Recombination. Faraday Discuss. 1984, 78, 271-278.
(171) El-Ballouli, A. a. O.; Alarousu, E.; Bernardi, M.; Aly, S. M.; Lagrow, A. P.; Bakr, O. M.; Mohammed, O. F. Quantum Confinement-Tunable Ultrafast Charge Transfer at the PbS Quantum Dot and Phenyl-C61-butyric Acid Methyl Ester Interface. J. Am. Chem. Soc. 2014, 136, 6952–6959.
(172) Guo, X.; Baumgarten, M.; Muellen, K. Designing pi-conjugated polymers for organic electronics. Prog. Polym. Sci. 2013, 38, 1832-1908.
(173) Guenes, S.; Neugebauer, H.; Sariciftci, N. S. Conjugated polymer-based organic solar cells. Chem. Rev. 2007, 107, 1324-1338.
(174) You, J.; Dou, L.; Hong, Z.; Li, G.; Yang, Y. Recent trends in polymer tandem solar cells research. Prog. Polym. Sci. 2013, 38, 1909-1928.
(175) Scharber, M. C.; Sariciftci, N. S. Efficiency of bulk-heterojunction organic solar cells. Prog. Polym. Sci. 2013, 38, 1929-1940.
(176) Levitus, M.; Garcia-Garibay, M. A. Polarized electronic spectroscopy and photophysical properties of 9,10-bis(phenylethynyl)anthracene. J. Phys. Chem. A 2000, 104, 8632-8637.
(177) Frisch, M.; Trucks, G.; Schlegel, H. B.; Scuseria, G.; Robb, M.; Cheeseman, J.; Scalmani, G.; Barone, V.; Mennucci, B.; Petersson, G. Gaussian 09, revision A. 02; Gaussian, Inc. Wallingford, CT 2009, 19, 227-238.
(178) Boas, U.; Dhanabalan, A.; Greve, D. R.; Meijer, E. W. Synthesis of thiophene-based building blocks via facile alpha-monoiodination. Synlett 2001, 634-636.
(179) Gust, D.; Moore, T. A.; Moore, A. L. Molecular Mimicry of Photosynthetic Energy and Electron-Transfer. Acc. Chem. Res. 1993, 26, 198-205.
(180) Lewis, N. S.; Nocera, D. G. Powering the planet: Chemical challenges in solar energy utilization. Proc. Natl. Acad. Sci. U. S. A. 2006, 103, 15729-15735.
(181) Fleming, C. N.; Brennaman, M. K.; Papanikolas, J. M.; Meyer, T. J. Efficient, long-range energy migration in Ru-II polypyridyl derivatized polystyrenes in rigid media. Antennae for artificial photosynthesis. Dalton Transactions 2009, 3903-3910.
(182) Friend, R. H.; Gymer, R. W.; Holmes, A. B.; Burroughes, J. H.; Marks, R. N.; Taliani, C.; Bradley, D. D. C.; Dos Santos, D. A.; Bredas, J. L.; Logdlund, M.; Salaneck, W. R. Electroluminescence in conjugated polymers. Nature 1999, 397, 121-128.
175
(183) Hagen, R.; Bieringer, T. Photoaddressable polymers for optical data storage. Adv. Mater. 2001, 13, 1805-1810.
(184) Moller, S.; Perlov, C.; Jackson, W.; Taussig, C.; Forrest, S. R. A polymer/semiconductor write-once read-many-times memory. Nature 2003, 426, 166-169.
(185) Porel, S.; Singh, S.; Harsha, S. S.; Rao, D. N.; Radhakrishnan, T. P. Nanoparticle-embedded polymer: In situ synthesis, free-standing films with highly monodisperse silver nanoparticles and optical limiting. Chem. Mater. 2005, 17, 9-12.
(186) Qureshi, F. M.; Martin, S. J.; Long, X.; Bradley, D. D. C.; Henari, F. Z.; Blau, W. J.; Smith, E. C.; Wang, C. H.; Kar, A. K.; Anderson, H. L. Optical limiting properties of a zinc porphyrin polymer and its dimer and monomer model compounds. Chem. Phys. 1998, 231, 87-94.
(187) Xie, D.; Parthasarathy, A.; Schanze, K. S. Aggregation-Induced Amplified Quenching in Conjugated Polyelectrolytes with Interrupted Conjugation. Langmuir 2011, 27, 11732-11736.
(188) Ito, A.; Stewart, D. J.; Fang, Z.; Brennaman, M. K.; Meyer, T. J. Sensitization of ultra-long-range excited-state electron transfer by energy transfer in a polymerized film. Proc. Natl. Acad. Sci. U. S. A. 2012, 109, 15132-15135.
(190) Morisaki, Y.; Chujo, Y. Through-space conjugated polymers based on cyclophanes. Angew. Chem. Int. Ed. 2006, 45, 6430-6437.
(191) Morisaki, Y.; Ueno, S.; Saeki, A.; Asano, A.; Seki, S.; Chujo, Y. pi-Electron-System-Layered Polymer: Through-Space Conjugation and Properties as a Single Molecular Wire. Chem. Eur. J. 2012, 18, 4216-4224.
(192) Dai, F. R.; Zhan, H. M.; Liu, Q.; Fu, Y. Y.; Li, J. H.; Wang, Q. W.; Xie, Z.;
Wang, L.; Yan, F.; Wong, W. Y. Platinum (II)–Bis (aryleneethynylene) Complexes for
Solution‐Processible Molecular Bulk Heterojunction Solar Cells. Chem. Eur. J. 2012,
18, 1502-1511.
(193) Morisaki, Y.; Fujimura, F.; Chujo, Y. Synthesis and properties of novel σ-π-conjugated polymers with alternating organosilicon and [2.2] paracyclophane units in the main chain. Organometallics 2003, 22, 3553-3557.
(194) Pawle, R. H.; Agarwal, A.; Malveira, S.; Smith, Z. C.; Thomas III, S. W. Bandgap Engineering of Conjugated Materials with Nonconjugated Side Chains. Macromolecules 2014, 47, 2250-2256.
176
BIOGRAPHICAL SKETCH
Zhenxing Pan was born in 1987 in Sihong, Jiangsu, China, where he grew up
and finished junior high school. At the age of 15, he went to Nanjing and stayed there
for 3 years for senior high school. Then, at the age of 18, he attended Soochow
University and received a bachelor of engineering degree in material science and
engineering in the year of 2010. Immediately after graduation, he continued his
graduate school work at the University of Florida, pursuing a Doctor of Philosophy
degree in chemistry. Under the supervision of Dr. Kirk S. Schanze, he focused his
research on conjugated polymers and optoelectronic devices. After his graduation, he
will go back to China and pursue a career in chemical industry.