208
© 2016 Kanak Anant Kuwelkar ALL RIGHTS RESERVED

© 2016
Kanak Anant Kuwelkar
ALL RIGHTS RESERVED

CHEMICAL AND STRUCTURAL CHARACTERIZATION OF BORON
CARBIDE POWDERS AND CERAMICS
by
KANAK ANANT KUWELKAR
A dissertation submitted to the
Graduate School – New Brunswick
Rutgers, The State University of New Jersey
In partial fulfillment of the requirements
For the degree of
Doctor of Philosophy
Graduate Program in Materials Science and Engineering
Written under the direction of
Professor Richard A. Haber
And approved by
____________________________
____________________________
____________________________
____________________________
____________________________
____________________________
New Brunswick, New Jersey
OCTOBER, 2016

ii
ABSTRACT OF THE DISSERTATION
Chemical and Structural Characterization of Boron Carbide Powders and Ceramics
By Kanak Anant Kuwelkar
Dissertation Director:
Richard A. Haber. PhD
Boron carbide is the material of choice for lightweight armor applications due to its
extreme hardness, high Young’s modulus and low specific weight. The homogeneity range
in boron carbide extends from ~9 to ~20 at% carbon with the solubility limits not uniquely
defined in literature. Over this homogeneity range, the exact lattice positions of boron and
carbon atoms have not been unambiguously established, and this topic has been the
consideration of significant debate over the last 60 years. The atomic configuration and
positions of the boron and carbon atoms play a key role in the crystal structure of the boron
carbide phases. Depending on the atomic structure, boron carbide exhibits different
mechanical properties which may alter its ballistic performance under extreme dynamic
conditions. This work focusses on refinement and development of analytical and chemical
methods for an accurate determination of the boron carbide stoichiometry. These methods
were then utilized to link structural changes of boron carbide across the solubility range to
variations in mechanical properties.
After an extensive assessment of the currently employed characterization
techniques, it was discerned that the largest source of uncertainty in the determination of
the boron carbide stoichiometry was found to arise from the method utilized to evaluate

iii
the free carbon concentration. To this end, a modified spiking technique was introduced
for free carbon determination where curve fitting techniques were employed to model the
asymmetry of the 002 free carbon diffraction peak based on the amorphous, disordered and
graphitic nature of carbon. A relationship was then established between the relative
intensities of the carbon and boron carbide peaks to the percentage of added carbon and the
free-carbon content was obtained by graphical extrapolation.
Samples with varying chemistry and high purity were synthesized across the
solubility range by hot pressing mixtures of amorphous boron and boron carbide.
Vibrational mode frequencies and lattice parameter measurements from Rietveld
refinement were correlated to the respective B:C ratios calculated using the developed
characterization techniques. An expansion of the unit cell and change in slope in the lattice
parameter-stoichiometry relationship were observed at more boron rich stoichiometries.
These observations were justified through the proposal of a simplified structural model
considering preferential substitution of boron atoms for carbon atoms in the icosahedra
from 20 at% to 13.3 at% carbon, followed by formation of B-B bonds from 13.3 at % C to
~9 at% C. Hardness measurements uncovered decreased hardness values in boron rich
boron carbide which was attributed to the formation of weaker unit cells. Load induced
amorphization was also detected in all the indented materials.
Finally, experimental observations have shown that failure in boron carbide may
be governed by a mechanism other than amorphization and synthesizing boron carbide with
a modified microstructure at stoichiometries close to B4C may be the way forward to attain
improved ballistic performance.

iv
ACKNOWLEDGEMENTS
I am very thankful to everyone who has helped and guided me throughout my time
at Rutgers University. In particular, my thesis advisor Dr. Haber for taking me in from
chemical engineering and giving me the opportunity to work in the material science and
engineering department. Thank you Rich for all the help through the years, not just with
my research, but everything else. A special thanks to Dr. Domnich for mentoring me
throughout my PhD. This work would not have been possible without your invaluable
advice, guidance and countless hours spent answering all my questions. It has been a joy
working with you. Equally important is Dr. Rafaniello for the direction given to me with
regards to my research and professional development.
I want to acknowledge Dr. LaSalvia and Dr. Behler for help with hot pressing at
the Army Research Laboratory (ARL). I would also like to recognize my committee
members, Dr. Matthewson and Dr. Chhowalla. I am also grateful for financial support from
the Army Research Laboratory and National Science Foundation (NSF) which enabled me
to complete this dissertation.
I would also like to thank Michelle and Laura, without whom Haber group would
not function and my colleagues Metin, Azmi, Zeynep, Fatih, Minh, Fabio, Sukhanya,
Tyler, Vince, Mustafa, Bruce, Anthony and Chawon. It has been fun working with you
guys. It has also been an absolute pleasure to collaborate with Jamie and Kelvin at Johns
Hopkins University.
Finally, I would like to thank my parents for the tremendous support given to me
and for the constant words of encouragement when I have needed them the most. Without
you, this would never have been possible and I hope I have made you proud.

v
TABLE OF CONTENTS
ABSTRACT OF THE DISSERTATION ....................................................................... ii
ACKNOWLEDGEMENTS ........................................................................................... iv
TABLE OF CONTENTS ................................................................................................ v
LIST OF TABLES .......................................................................................................... x
LIST OF FIGURES ...................................................................................................... xiii
1 Introduction and Literature Review of Boron Carbide ................................................ 1
1.1 History of Boron Carbide ..................................................................................... 1
1.2 Crystal Structure and Phase Diagram................................................................... 1
1.3 Synthesis of Boron Carbide................................................................................ 10
1.3.1 Carbothermal Reduction ............................................................................. 10
1.3.1.1 Arc Furnace Process ............................................................................ 11
1.3.1.2 Acheson Type Process ......................................................................... 11
1.3.2 Magnesothermal Reduction ........................................................................ 12
1.3.3 Chemical Vapor Deposition ........................................................................ 12
1.4 Physical Properties of Boron Carbide ................................................................ 13
1.4.1 Density ........................................................................................................ 13
1.4.2 Coefficient of Thermal Expansion .............................................................. 13
1.4.3 Thermal Capacity ........................................................................................ 14
1.5 Neutron Absorbing Capability ........................................................................... 14

vi
1.6 Mechanical Properties ........................................................................................ 15
1.7 Elastic Properties ................................................................................................ 19
1.8 Chemical Properties ........................................................................................... 22
1.9 Microstructural Response to Dynamic Loading................................................. 25
1.10 Electrical and Optical Properties ........................................................................ 30
2 Goal of Thesis ............................................................................................................ 32
3 Assessment of Current Analytical Techniques for Determination of the Boron Carbide
Stoichiometry .................................................................................................................... 33
3.1 Introduction ........................................................................................................ 33
3.2 Experimental Procedure ..................................................................................... 36
3.2.1 X-ray Diffraction (XRD) and Rietveld Refinement ................................... 36
3.2.2 X-ray Fluorescence (XRF) .......................................................................... 39
3.2.3 Raman Analysis .......................................................................................... 40
3.2.4 Chemical Analysis ...................................................................................... 41
3.2.4.1 Boron Titration .................................................................................... 41
3.2.4.2 Total Carbon Analysis ......................................................................... 42
3.2.4.3 Total Oxygen and Nitrogen Analysis .................................................. 44
3.2.5 Powder Cleaning ......................................................................................... 45
3.2.6 Particle Size Analysis ................................................................................. 45
3.3 Results and Discussion ....................................................................................... 46

vii
3.3.1 Phase Identification and Quantitative Analysis .......................................... 46
3.3.2 Impurity Detection ...................................................................................... 54
3.3.3 Stoichiometric Measurements ..................................................................... 56
3.3.4 Effect of Powder Cleaning on the Stoichiometry ....................................... 62
3.3.5 Lattice Parameter Measurements ................................................................ 64
3.3.6 Raman Analysis .......................................................................................... 68
3.3.7 Database of Commercial Boron Carbide Powders and Ceramics .............. 75
3.4 Summary ............................................................................................................ 77
4 Development of an Improved Methodology for Free Carbon Analysis .................... 78
4.1 Introduction ........................................................................................................ 78
4.2 Experimental Procedure ..................................................................................... 82
4.2.1 Free Carbon Analysis .................................................................................. 82
4.2.2 Wet Chemical Oxidation............................................................................. 85
4.3 Results and Discussion ....................................................................................... 86
4.3.1 Modified Spiking Technique ...................................................................... 86
4.3.1.1 Heat Treatment of Amorphous Carbon ............................................... 86
4.3.1.2 Peak Deconvolution and Curve Fitting ............................................... 89
4.3.1.3 Background Subtraction ...................................................................... 98
4.3.1.4 Free Carbon Analysis ........................................................................ 100
4.3.2 Wet Chemical Oxidation........................................................................... 102

viii
4.3.3 Stoichiometric Measurements ................................................................... 105
4.3.4 Reference Sample ..................................................................................... 105
4.4 Summary .......................................................................................................... 107
5 Investigation of the Structural and Mechanical Properties of Boron Carbide Across the
Solubility Range.............................................................................................................. 108
5.1 Introduction ...................................................................................................... 108
5.2 Experimental Procedure ................................................................................... 115
5.2.1 Sample Preparation ................................................................................... 115
5.2.2 Sample Analysis........................................................................................ 120
5.2.3 Polishing ................................................................................................... 125
5.2.4 Nanoindentation ........................................................................................ 126
5.2.5 Scanning Electron Microscopy ................................................................. 130
5.3 Results and Discussion ..................................................................................... 131
5.3.1 Structural Properties.................................................................................. 131
5.3.1.1 Phase Identification ........................................................................... 131
5.3.1.2 Lattice Parameters vs Carbon Concentration .................................... 134
5.3.1.3 Raman Spectra Variations ................................................................. 138
5.3.1.4 Proposed Structural Model ................................................................ 143
5.3.2 Mechanical Properties ............................................................................... 148
5.3.2.1 Hardness vs Stoichiometry ................................................................ 148

ix
5.3.2.2 Amorphization ................................................................................... 151
5.4 Summary .......................................................................................................... 154
6 Applicability of Developed Techniques .................................................................. 157
6.1 Introduction ...................................................................................................... 157
6.2 Experimental Procedure ................................................................................... 158
6.2.1 Compression Experiments ........................................................................ 158
6.2.2 Sample Preparation and Characterization of Fragments ........................... 159
6.3 Results and Discussion ..................................................................................... 160
6.3.1 Baseline Boron Carbide Tile ..................................................................... 160
6.3.2 Characterization of Fragmented Material ................................................. 164
6.3.3 Raman Mapping ........................................................................................ 169
6.3.4 SEM/EDS Mapping .................................................................................. 171
6.4 Summary .......................................................................................................... 173
7 Conclusions ............................................................................................................. 174
8 Recommendations for Future Work ........................................................................ 176
9 References ............................................................................................................... 178

x
LIST OF TABLES
Table 1. Knoop hardness values of carbides and borides at 100 g load46. ........................ 15
Table 2. Mechanical Properties of Boron Carbide49. ........................................................ 16
Table 3. Effect of anisotropy on the elastic properties of boron carbide58. ...................... 20
Table 4. Poisson’s ratio of boron carbide and other solids58. ........................................... 20
Table 5. Dependence of the Elastic Moduli and the Poisson’s ratio on the stoichiometry6.
........................................................................................................................................... 21
Table 6. Indexing, theoretical reflections and relative intensities of boron carbide31. ..... 47
Table 7. Summary of the results of phase identification of selected powders by X-ray
diffraction. ......................................................................................................................... 52
Table 8. Impurities detected using X-ray fluorescence of selected commercial boron
carbide samples. ................................................................................................................ 54
Table 9. Chemical analysis of select commercial boron carbide samples. ....................... 57
Table 10. Soluble boron values determined by titration analysis. .................................... 61
Table 11. Comparison of the stoichiometry of the boron carbide powders assuming the
absence and presence of soluble boron. ............................................................................ 61
Table 12. Summary of the chemical composition and stoichiometry of unwashed Vajrabor
samples with variable particle sizes. ................................................................................. 63
Table 13. Summary of the chemical composition and stoichiometry of washed Vajrabor
samples with variable particle sizes. ................................................................................. 63
Table 14. Summary of hexagonal lattice parameters and corresponding carbon
concentration as determined by Aselage et al.13. .............................................................. 65

xi
Table 15. Summary of lattice parameters and the corresponding carbon concentration from
XRD depending on the fit used for the data. .................................................................... 66
Table 16. Summary of average carbon concentration and the corresponding stoichiometry
obtained from lattice parameter – stoichiometry relationships. ........................................ 68
Table 17. Raman peak positions for selected locations on a commercial boron carbide
sample ATD-2012-6-41 produced by Ceradyne Inc. ........................................................ 72
Table 18. Summary of Raman peak parameters of the typical boron carbide sample ATD-
2012-6-41 produced by Ceradyne Inc............................................................................... 72
Table 19. Summary of the stoichiometry of boron carbide from the difference in the peak
positions of the Raman bands. .......................................................................................... 74
Table 20. Summary of developed database detailing commercial powder and ceramic
properties........................................................................................................................... 76
Table 21. Theoretical peak positions and corresponding d-spacing of the amorphous and
graphitic carbon used for curve fitting of the 002 carbon peak in the modified spiking
technique. .......................................................................................................................... 92
Table 22. Summary of the correlation between degree of graphitization and the
corresponding2θ value. ..................................................................................................... 93
Table 23. Comparison of the free carbon values of boron carbide powders obtained using
the modified spiking technique ....................................................................................... 100
Table 24. Comparison of the free carbon values of boron carbide powders using the
modified spiking technique and wet chemical oxidation method. .................................. 103
Table 25. Summary of the stoichiometric values using the modified spiking technique and
chemical analysis. ........................................................................................................... 105

xii
Table 26. Methods used and reported values of the European Reference Material (ED-102)
produced by ESK. ........................................................................................................... 106
Table 27. Methods used and measured values of the European Reference Material (ED-
102) produced by ESK. ................................................................................................... 106
Table 28. Summary of the excess amorphous boron needed during hot pressing to produce
boron carbide with an expected stoichiometry of B13C2. ................................................ 116
Table 29. Summary of the cycle used to hot press mixtures of amorphous boron and boron
carbide. ............................................................................................................................ 120
Table 30. Polishing cycle used for the boron carbide samples ....................................... 126
Table 31. Hexagonal lattice parameters, unit cell volumes and carbon concentrations of the
synthesized boron carbide samples. ................................................................................ 135
Table 32. Comparison of the calculated and referenced values of the stoichiometry of the
ED-102 sample produced by ESK. ................................................................................. 138
Table 33. Bond Lengths as a function of carbon concentration12, 15, 20 ........................... 144

xiii
LIST OF FIGURES
Figure 1. Boron carbide with 12 atom icosahedra located at the vertices of a rhombohedral
and hexagonal lattice of trigonal symmetry and 3-atom linear chain linking the icosahedra6.
............................................................................................................................................. 2
Figure 2. Possible structural units of boron carbide across homogeneity range. ................ 3
Figure 3. Boron-Carbon phase diagram proposed by Meerson et al.4 ................................ 7
Figure 4. Boron-Carbon phase diagram proposed by Dolloff30. ......................................... 7
Figure 5. Boron-Carbon phase diagram proposed by Beauvy8........................................... 9
Figure 6. Boron-Carbon phase diagram proposed by Schwetz9. ........................................ 9
Figure 7. Variation of the thermal expansion coefficient of boron carbide with temperature.
........................................................................................................................................... 13
Figure 8. Variation of the Vickers hardness as a function of the B/C ratio at different
temperatures and load of 0.98 N56. ................................................................................... 17
Figure 9. Effect of stoichiometry on the hardness of hot pressed boron carbide at a load of
0.3 Kg57. ............................................................................................................................ 18
Figure 10. Variation of the fracture toughness (KIC) as a function of the B/C ratio56. .... 18
Figure 11. Young’s modulus dependence on the orientation for a B5.6C single crystal6, 58.
........................................................................................................................................... 19
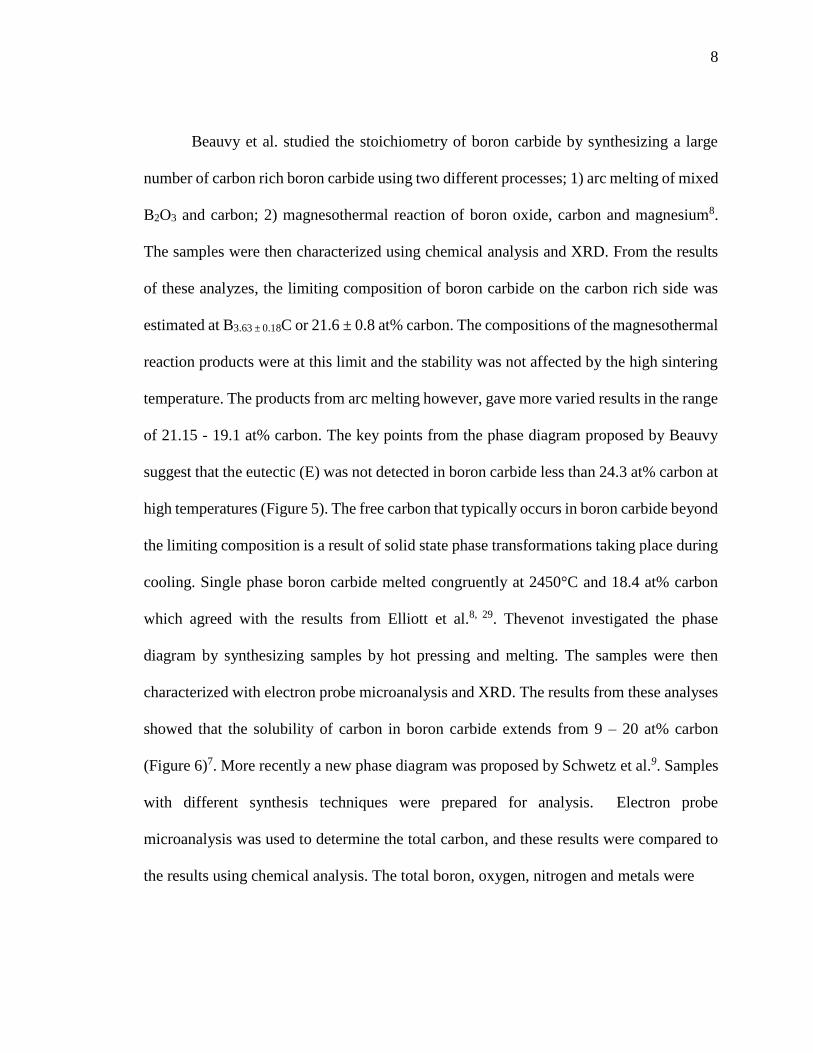
Figure 12. Dependence of the elastic moduli on the carbon concentration. ..................... 22
Figure 13. Kinetic curves for the oxidation of boron carbide62. ....................................... 23
Figure 14. Oxidation of boron carbide in dry air64. .......................................................... 24
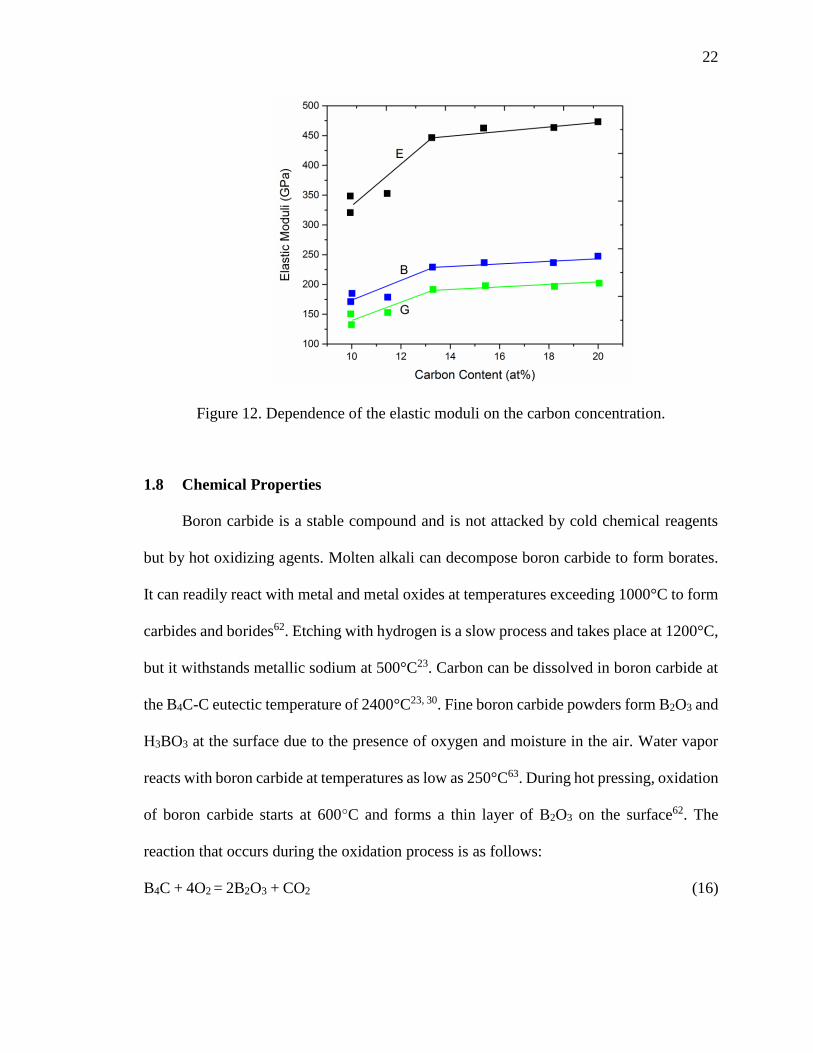
Figure 15. Oxidation of boron carbide in an air-water system64. ...................................... 25
Figure 16. Energy vs time curve for an impact at 2800 ft/sec of a sharp projectile65. ...... 26

xiv
Figure 17. Ballistic impact data from independent experiments conducted at the Army
Research Laboratory and Sandia National Laboratory depicting the drastic decrease in the
shear strength of boron carbide above the HEL of 20 GPa49, 68. ....................................... 27
Figure 18. Shock compression data of boron carbide6. .................................................... 27
Figure 19. Left : Ballistically impacted boron carbide. Right : HR TEM of a fragment
showing the loss of lattice fringes in the band indicating localized amorphization67. ...... 28
Figure 20. Left : (a) Plan view of TEM micrograph of a 100 mN Berkovich indent, (b)
Magnified image showing amorphous bands along the (113) and (003) directions, (c) and
(d) HR lattice images on (a) and (b). Right : Raman spectra of a (a) Pristine single crystal
B4.3C, (b) Indented single crystal, (c) Indented hot-pressed polycrystalline material, (d)
Scratch debris of a single crystal and (e) Annealed scratch debris in air by using an argon
ion laser with excitation wavelength of 514.4 nm79. ........................................................ 29
Figure 21. Energy band scheme of boron carbide26 .......................................................... 30
Figure 22. Panalytical X’Pert powder X-ray Diffractometer............................................ 37
Figure 23. Left: Quanx X-ray Fluroscence Spectrometer. Right: Sample holder used for
XRF measurements. .......................................................................................................... 39
Figure 24. Renishaw InVia Reflex Raman Microscope. .................................................. 40
Figure 25. Metrohm Titrando 907 used for boron titration. ............................................. 41
Figure 26. LECO C/S 230 (Carbon/Sulphur Analyzer). ................................................... 43
Figure 27. LECO TC 600 (Oxygen/Nitrogen Analyzer). ................................................. 44
Figure 28. Malvern Mastersizer 2000 Light Scattering Particle Sizer.............................. 46
Figure 29. Phase identification of boron carbide samples produced by Ceradyne Inc. .... 50
Figure 30. Phase identification of boron carbide samples produced by H.C.Starck. ....... 50

xv
Figure 31. Phase identification of boron carbide samples produced by Vajrabor. ........... 51
Figure 32. Top: Phase identification of boron carbide samples produced by ESK
Bottom: Phase identification of boron carbide samples produced by Coorstek. .............. 51
Figure 33. XRF spectra at low Za for boron carbide powders manufactured by ESK. .... 55
Figure 34. XRF spectra at mid Za for boron carbide powders manufactured by ESK. .... 55
Figure 35. XRF spectra at high Za for boron carbide powders manufactured by ESK. ... 56
Figure 36. Comparison of the Hexagonal lattice parameters and the corresponding carbon
concentration utilizing multiple linear regression fits of the Aselage data13. Fit 1, : SG-
010813 (Superior Graphite),: ST-HD20 (H.C.Starck), : ATD-2012-6-41 (Ceradyne
Inc.). Fit 2, : SG-010813 (Superior Graphite),: ST-HD20 (H.C.Starck), : ATD-
2012-6-41 (Ceradyne Inc.), ............................................................................................... 67
Figure 37. Characteristic Raman spectra from boron carbide powder produced by Ceradyne
Inc (red lines). Individual bands used in the curve fitting procedure are shown in green, and
the simulated spectrum in blue. ........................................................................................ 69
Figure 38. Structure of boron carbide at 20 at% carbon showing C-B-C chains and the B11C
icosahedra with the carbon atom at the polar sites105. ...................................................... 70
Figure 39. Characteristic Raman spectra of commercial boron carbide powders. The bands
below 1200 cm-1 originate from vibrations in boron carbide, whereas bands above 1200
cm-1 are attributed to amorphous/graphitic carbon. .......................................................... 73
Figure 40. Dependence of the narrow bands centered at 500 cm-1 on the carbon
concentration (at%) ........................................................................................................... 74
Figure 41. Determination of the free-graphite content in various boron carbide powders by
the spiking technique117. ................................................................................................... 81

xvi
Figure 42. Effect of particle size distribution of boron carbide on the free carbon content
calculated using the Spiking technique117. ........................................................................ 81
Figure 43. Spex mill used to develop mechanical mixtures of carbon and boron carbide.
........................................................................................................................................... 83
Figure 44. XRD pattern of the ST-HD20 boron carbide powder doped with varying
quantities of carbon and mixed with alumina media. ....................................................... 84
Figure 45. XRD pattern of the ST-HD20 boron carbide powder doped with varying
quantities of carbon and mixed with alumina media showing alumina contamination and
overlap of the alumina peaks with the 002 carbon peak. .................................................. 84
Figure 46. Analysis of free carbon in boron carbide from the CO2 vs time plot116. ......... 85
Figure 47. Structure of graphite119 .................................................................................... 87
Figure 48. Effect of heat treatment on carbon lampblack on the XRD pattern. ............... 88
Figure 49. (a) XRD patterns of ST-HD20 boron carbide powder mixed with varying
quantities of added carbon. (b) Variation of the intensity of the (002) carbon peak with the
increase in the added carbon. (c) Variation in the intensity of the (021) boron carbide peak
with the increase in the added carbon. .............................................................................. 90
Figure 50. Curve fitting of the 002 carbon and 021 boron carbide peaks of the XRD pattern
of the ST-HD20 powder with 0.5% added carbon. ........................................................... 96
Figure 51. Curve fitting of the 002 carbon and 021 boron carbide peaks of the XRD pattern
of the ATD-2012-6-41 powder 0.5% added carbon. ........................................................ 96
Figure 52. Curve fitting of the 002 carbon and 021 boron carbide peaks of the XRD pattern
of the SG-010813 powder 0.5% added carbon. ................................................................ 97

xvii
Figure 53. Curve fitting of the 002 carbon peak in pure graphite from Industrial Graphite
Sales. ................................................................................................................................. 97
Figure 54.Variation in the integrated intensity/area during background subtraction using a
cubic spline curve ............................................................................................................. 99
Figure 55. Linear approximation during background removal. ........................................ 99
Figure 56. Determination of the free carbon content in the ST-HD20 powder by the
modified spiking technique. The free carbon concentration was estimated at 0.96%. ... 101
Figure 57. Determination of the free carbon content in the ATD-2012-6-41 powder by the
modified spiking technique. The free carbon concentration was estimated at 2.38%. ... 101
Figure 58. Determination of the free carbon content in the SG-010813 powder by the
modified spiking technique. The free carbon concentration was estimated at 1.83%. ... 102
Figure 59. XRD pattern of the ST-HD20 powder manufactured by H.C. Starck. .......... 104
Figure 60. XRD pattern of the ATD-2012-6-41 powder manufactured by Ceradyne Inc.
......................................................................................................................................... 104
Figure 61. Comparison of the Hexagonal lattice parameters of boron carbide and the carbon
concentration as determined by previous authors. : Yakel15, : Allen55, : Aselage et
al.98 (Hot Pressing), : Bouchacourt et al.40 (E-beam), : Bouchacourt et al. (Hot
Pressing), : Robson99, : Aselage et al.13 (Solid State Reaction) : Gosset et al.96 (Hot
Pressing). ......................................................................................................................... 110
Figure 62. Diffusion barriers in consolidated boron carbide synthesized using spark plasma
sintering........................................................................................................................... 117
Figure 63. Schematic of the assembly used during hot pressing of the boron carbide and
amorphous boron mixtures. ............................................................................................ 118

xviii
Figure 64. Oxy-gon High Temperature Vacuum Furnace System used to hot press mixtures
of amorphous boron and boron carbide. ......................................................................... 119
Figure 65. Schematic of the hot pressed boron carbide. (a): Core of the sample used for
analysis. (b): Boron nitride spacers ground off with coarse polishing pads. (c): Schematic
of the sectioned tile showing the thickness of each cut. ................................................. 121
Figure 66. Variation in the carbon concentration from cut 1 to cut 4 in a sample that has an
expected carbon content of 14 at%. ................................................................................ 122
Figure 67. Carbon content on both the cross sectional faces of cut 4 from X-ray diffraction.
......................................................................................................................................... 123
Figure 68. Raman spectra variations at regular intervals from the edge towards the center
across the right cross sectional face. ............................................................................... 124
Figure 69. (a) Buehler Simplimet 100 mounting machine. (b) Buehler Ecomet 250 polisher
with Automet 250 powder heads. ................................................................................... 125
Figure 70. NanoTest Vantage nanoindenter manufactured by Micro Materials. ........... 127
Figure 71. Sample stub for mounting the polished sample. ............................................ 127
Figure 72. Load vs displacement curves monitored by the nanoindentation system141. . 129
Figure 73. Zeiss Σigma Field Emission Scanning Electron Microscope. ....................... 130
Figure 74. X-ray diffraction patterns of selected boron carbide samples across the solubility
range showing the absence of free carbon and presence of phase pure boron carbide. .. 131
Figure 75. Shift in the (021) boron carbide peak towards lower 2θ values indicating an
increase in the lattice parameters. ................................................................................... 133

xix
Figure 76. Dependence of the Hexagonal lattice parameters and unit cell volume on the
carbon concentration. (a) aH lattice parameter (Å), (b) cH lattice parameter (Å) and (c) Unit
cell volume (Å3). ............................................................................................................. 136
Figure 77. The most representative Raman spectra for boron carbide samples of varying
stoichiometries. The 375 cm-1 band that appears only in the most boron-rich samples is
marked by a star. ............................................................................................................. 139
Figure 78. (a) Intensity of the 375 cm-1 band normalized to the intensity of the 320 cm-1
band, as a function of bound carbon concentaration in boron carbide. Frequency position
dependence on bound carbon content for (b) the 1090 cm-1 band, (c) the 480 cm-1 band,
and (d) the 530 cm-1 band. Lines serve as guides to the eye. .......................................... 141
Figure 79. Frequency separation between the 485 and 530 cm-1 Raman bands, as a function
of bound carbon concentration in boron carbide. Line serves as guide to the eye. ........ 142
Figure 80. Interatomic separations (Å) based on single crystal studies conducted by
Aselage et al.13, 146, Kirfel et al.12, and Morosin et al.145. Top: 20 at% C, Middle: 16 at% C
and Bottom: 13.3 at% C. (Image reproduced from Ref 14.) ........................................... 143
Figure 81. Concentration of the structural units of boron carbide across the solubility range.
B11C(C-B-C)-Black, B12(C-B-C)-Blue and B12(B-B)-Red. Y axis has arbitrary units... 145
Figure 82. Atomic configurations of boron carbide at (a) 20 at%, (b) 13.3 at% and (c) ~9
at% carbon. ..................................................................................................................... 146
Figure 83. SEM micrograph showing the area of the 500 mN indent in the sample with a
carbon concentration of 12.6 at% carbon. ...................................................................... 148
Figure 84. Hardness vs Load curves of the sample with a carbon concentration of 16.4 at%
(B5C). .............................................................................................................................. 149

xx
Figure 85. Effect of stoichiometry on the hardness of boron carbide at constant loads. 150
Figure 86. Raman spectra acquired from the pristine regions and center of the 500 mN
indents showing the development of amorphous boron carbide in samples at (a) B5C (16.7
at% carbon) (b) B5.7C (14.9 at% carbon) (c) B6.9C (12.6 at% carbon) (d) B9.4C (9.6 at%
carbon) ............................................................................................................................ 152
Figure 87. Raman mapping of the 500 mN indent showing the amorphous boron carbide
phase contained within the indentation contact area....................................................... 152
Figure 88. (a) Raman spectra from pristine regions of boron carbide samples at varying
stoichiometries. (b) Variation in the Raman spectra from the centers of the 500 mN indents
showing the splitting of the amorphous peak at ~1300 cm-1. ......................................... 153
Figure 89.Schematic of Kolsky bar apparatus used at Johns Hopkins University157. .... 158
Figure 90. Schematic of biaxial confinement setup157. ................................................... 159
Figure 91. Schematic of the XRD zero background sample holder consisting of boron
carbide fragments and a NIST silicon line position standard. ........................................ 160
Figure 92. Schematic of hot pressed PAD-tile 8 manufactured by CoorsTek. ............... 161
Figure 93. Phase identification of the original tile. (a) XRD pattern taken in the hot pressed
showing preferred orientation of the 002 carbon peak. (b) and (c) XRD pattern taken in the
in plane direction showing the reduced intensity of the 002 carbon peak. Here, : Boron
Carbide, : Graphite, : Boron Nitride and : Aluminum Nitride. ........................... 162
Figure 94. Electron energy loss spectrum of the boron carbide matrix159. ..................... 163
Figure 95. Variation of the a (Å) lattice parameter with the fragment size before crushing.
......................................................................................................................................... 165

xxi
Figure 96. Variation of the c (Å) lattice parameter with the fragment size before crushing.
......................................................................................................................................... 165
Figure 97. Variation of the a (Å) lattice parameter with the fragment size after crushing.
......................................................................................................................................... 166
Figure 98. Variation of the c (Å) lattice parameter with the fragment size after crushing.
......................................................................................................................................... 166
Figure 99. Variation of the fragment size and the residual volumetric strain from
compression experiments.after crushing. ........................................................................ 168
Figure 100. Hydrostatic compression of the boron carbide unit cell. ............................. 168
Figure 101. Raman maps showing the presence of graphitic carbon (red), h-BN (cyan),
amorphous boron carbide (blue) and organic impurities (green) in the a) uniaxial, b) biaxial
and c) quasi-static fragments. ......................................................................................... 170
Figure 102. Typical Raman spectra from the ground (a and c) and fracture surfaces (b and
d) of the fragments subjected to high strain rate compression tests. .............................. 171
Figure 103. SEM micrograph and EDS maps showing, (a) and (b): Presence of graphitic
sheets on the surface of the boron carbide and (c) and (d): Carbon rich fracture surfaces.
......................................................................................................................................... 172
Figure 104 (a) SEM micrograph showing the fracture surfaces in boron nitride grains. (b)
Elemental mapping of the fracture surfaces in the boron nitride grains. ........................ 172

1
1 Introduction and Literature Review of Boron Carbide
1.1 History of Boron Carbide
Boron Carbide was first discovered in the late part of the 19th century as a by-product
of reactions with metal borides. Initially non-stoichiometric boron carbide (B3C and B6C)
was synthesized by Joly and Moissan in the last decade of the 19th century1. In 1934,
Ridgway suggested that boron carbide had a stable stoichiometry of B4C2. Following
Ridgway’s identification of “stoichiometric” boron carbide, Russian scientists proposed
different stoichiometric formulae for boron carbide1, 3, 4, 5, but none of these formulae have
been confirmed by other authors. More recently, a number of different stoichiometries have
been proposed as the stable boron carbide phase. It is accepted that single phase carbon has
a solubility range varying from ~9 at% to ~20 at% carbon1, 6. The most important properties
of boron carbide are its high melting point, low specific weight, chemical inertness and
neutron absorption capability. These properties permit boron carbide to be used in the
armor, abrasives and nuclear industries.
1.2 Crystal Structure and Phase Diagram
The crystallographic structure of boron carbide consists of a 12-atom icosahedra
located at the vertices of the rhombohedral unit cell with an R3m space group and a 3-atom
chain that connects the icosahedra along the (111) direction (Figure 1). Due to similarities
and mutual substitutions between boron and carbon atoms, it is widely accepted that the
homogeneity range in boron carbide extends from ~8 at% to ~20 at% carbon7, 8, 9, 10. But
Konovalikhin et al. have also reported synthesis of a single crystal with a carbon
concentration of ~24 at%8. Over the boron carbide homogeneity range, the exact positions

2
Figure 1. Boron carbide with 12 atom icosahedra located at the vertices of a
rhombohedral and hexagonal lattice of trigonal symmetry and 3-atom linear chain linking
the icosahedra6.
of boron and carbon atoms in the unit cell have not been unambiguously established and a
number of theories exist that consider preferential boron substitutions for carbon in the
icosahedra, intericosahedral chains, or alternatively, formation of vacancies in the chain
center position. An example of possible atomic configurations that would help
accommodate the structural variations across the solubility range is shown in (Figure 2)11,
12. In the literature, these different atomic configurations of boron carbide are sometimes
referred to as "polytypes". Based on the solubility range of boron carbide, multiple atomic
configurations have been proposed over the years. Because of the fourfold coordination,
carbon is generally preferred at the end of the 3 atom chain13. Paramagnetic defects have
been observed in boron carbide due to the presence of small amount of carbon atoms
present at the center of the chains13, 14. The results by Yakel et al. revealed that at
“stoichiometric” compositions, the structural configurations could be either a B11C, B12 or

3
B10C2 icosahedra and C-B-C intericosahedral chain15. Following the same work, at 13.3
at% carbon, substitution of the boron atoms for carbon atoms occur in the icosahedra
resulting in a B12 (C-B-C) structure. Beyond 13.3 at%, the C-B-C chains would be replaced
by B4 groups which would result in an increase in the angle of the unit cell with minimal
effect on the cell edge. Other authors have proposed that at 20 at% carbon, the structural
configuration consists of C-C-C chains and B12 clusters16 or C-B-C chains and B11C
clusters17, 18. Boron carbide at 13.3 at% carbon was described as having a configuration
with either a B12 icosahedra with a C-B-C chain or B11C icosahedra and with a C-B-B
chain.
Figure 2. Possible structural units of boron carbide across homogeneity range.
Due to the similarities in the electronic and nuclear scattering cross sections of
boron and carbon, the characterization techniques cannot easily distinguish between these
two atoms. Based on the study of the free energy as a function of the carbon concentration,
it was concluded that entropic and energetic considerations favor replacement of the carbon
atoms with boron atoms within the interisocahedral chains, in the 20 – 13.3 at% carbon
range. At low carbon concentrations, below 13.3 at%, the boron substitution for carbon
occurs within the icosahedra19. Structural refinement using X-ray diffraction (XRD) by

4
Will et al. depicted B12 units which are joined to C-B-C chains and B-B bonds leading to
the B13C2 formula with 15 atoms per unit cell17, 18. The structural model proposed by
Larson20 is in alignment with that of Yakel15. At lower carbon concentrations below 13.3
at% carbon, 1/6 of the carbon atoms in the icosahedra are replaced by boron atoms without
any evidence of interstitial atoms. Matkovich proposed that the wide homogeneity range
could be a result of three possible mechanisms: 1) B and C substitution at the atomic sites;
2) deficient occupancy of some of the atomic sites; 3) occupancy in addition to the 15
established sites9, 10. Morosin et al. performed single crystal X-ray diffraction on several
boron carbide specimens21. Based on the results from least square refinement and the
assessment of the electron density maps, it was concluded that for carbon rich boron
carbides, the carbon is located in the C-B-C chain and in the icosahedra. The icosahedral
boron is distributed in a statistically disordered manner and is predominantly present on
either of the two crystallographic boron sites. This result was in accordance with energy
band calculations where the B11C(C-B-C) structure seemed to be the most energetically
preferred. It was also in agreement with the results from other authors. The B11C(C-B-C)
configuration is widely accepted as the structure for boron carbide at the “stoichiometric”
composition7, 18, 21, 22, 23. Aselage and Emin proposed an alternative model of the boron
carbide solid solution; a) the saturated carbon composition near the carbon rich limit close
to 20 at% has a B11C icosahedra and a C-B-C intericosahedral chain; b) between B4C and
B13C2, substitution of carbon by boron occurs primarily in the chains and c) beyond B13C2,
boron rich boron carbide is formed by replacement of some carbon atoms in the B11C
icosahedra by boron atoms to B12 icosahedra24, 25. An increase in the thermal factors of the
chain disappearance in the Raman band linked to the chain with the increase in the B:C

5
ratio was provided as direct evidence to support this structural model. But questions are
raised regarding the validity of this structural model, due to the varied interpretation of the
results.
Werheit et al. proposed that boron carbide structure consists of distorted B12 or B11C
icosahedra and C-B-C, C-B-B, B-Va-B and C-C-C chains26. From IR absorption spectra
and phonon oscillator strength analysis, “stoichiometric” boron carbide was deemed to
consist of B11C icosahedra (100%), C-B-C (81%) and B-B-C chains (19%)26, 27. At B13C2,
the B11C structural units are replaced by B12 icosahedra and concentration of the structural
elements comprised of B12 icosahedra (42%), B11C icosahedra (58%), C-B-C (62%), C-B-
B (19%) and B-Va-B (19%). Beyond the critical 13.3 at% carbon concentration, an
increase in the B-B-C chains is observed with a further increase in the concentration of the
B12 icosahedra. Saal et al. used an ab initio approach to predict the crystal structure of boron
carbide across the solubility range to develop a better understanding of the disordering
mechanisms present across the single phase regime28. At the carbon rich solubility limit,
theoretical calculations based on the enthalpy of formation and infrared mode calculations
pointed towards the B11C (C-B-C) structure to be the stable atomic configuration.
Preferential substitution of the boron atoms occur in the icosahedra towards 13.3 at%
resulting in B12 (C-B-C) structures. At carbon concentrations beyond 13.3 at%, boron
atoms replace the carbon atoms of the 3 atom chain which is coupled by simultaneous
removal of the central boron atom resulting in the formation of a B12 (B-Va-C) type
structure. Based on the enthalpy of formation, this structure is the preferred atomic
configuration among the different ordered structures. Further validation of the proposed
structural model was also conducted by investigating the vibrational properties through ab

6
initio phonon calculations. The shift in the mode from 13.3 to 20 at% was precisely
reproduced using the proposed structural model28.
Multiple phase diagrams of boron carbide have been proposed and the solubility range
of carbon in boron carbide is a much disputed issue. One of the first B-C phase diagrams
was published by Meerson et al.3 (Figure 3). The results included the presence of a carbon
rich BC2 and boron rich B12C phase in addition to B13C2 and B4C over a wide homogeneity
range. It was concluded that the boron carbide that was formed, did so in accordance to the
peritectic reaction L+B B4C at 2250°C. A eutectic reaction L B4C + Graphite at
2150°C and 30.2 wt% carbon was also reported3, 29. Based on the phase diagram by Dolloff,
rhombohedral B13C3 had a wide solubility range above 1800°C30 (Figure 4). Clark et al.
pointed out that boron carbide could exist from B4.67 to B4C due to the interstitial
substitution of boron in the boron carbide holes31. Different Russian authors showed that
the formation of various boron carbide solid solutions occurred by substitution with
covalent bonding5. In the phase diagram advocated by Elliott, the carbon solubility limits
of the boron carbide phase ranged from 9 at% to 20 at% from room temperature to 2450°C.
The melting of the carbide phase occurs congruently at 18.5 at% carbon and 2450°C29. The
eutectic reaction occurs at 29 at% carbon and 2375°C. Various other phase diagrams have
been presented in the literature32, 33, 34, 35. A large number of boron carbide phases have
been reported over the years. B6C, BC, B2C2, B3C B7C, B12C, B50C2, B12C3 and B13C2 are
only a few of the reported phases that have been published2, 4, 8, 32, 36, 37, 38. BnC solid
solutions has also been proposed with n ranging from 2.57 - 248, 10, 29, 34, 39, 40. Hence there
is disagreement among the boron carbide community as to the actual carbon limits for
boron carbide.

7
Figure 3. Boron-Carbon phase diagram proposed by Meerson et al.4
Figure 4. Boron-Carbon phase diagram proposed by Dolloff30.
8
Beauvy et al. studied the stoichiometry of boron carbide by synthesizing a large
number of carbon rich boron carbide using two different processes; 1) arc melting of mixed
B2O3 and carbon; 2) magnesothermal reaction of boron oxide, carbon and magnesium8.
The samples were then characterized using chemical analysis and XRD. From the results
of these analyzes, the limiting composition of boron carbide on the carbon rich side was
estimated at B3.63 ± 0.18C or 21.6 ± 0.8 at% carbon. The compositions of the magnesothermal
reaction products were at this limit and the stability was not affected by the high sintering
temperature. The products from arc melting however, gave more varied results in the range
of 21.15 - 19.1 at% carbon. The key points from the phase diagram proposed by Beauvy
suggest that the eutectic (E) was not detected in boron carbide less than 24.3 at% carbon at
high temperatures (Figure 5). The free carbon that typically occurs in boron carbide beyond
the limiting composition is a result of solid state phase transformations taking place during
cooling. Single phase boron carbide melted congruently at 2450°C and 18.4 at% carbon
which agreed with the results from Elliott et al.8, 29. Thevenot investigated the phase
diagram by synthesizing samples by hot pressing and melting. The samples were then
characterized with electron probe microanalysis and XRD. The results from these analyses
showed that the solubility of carbon in boron carbide extends from 9 – 20 at% carbon
(Figure 6)7. More recently a new phase diagram was proposed by Schwetz et al.9. Samples
with different synthesis techniques were prepared for analysis. Electron probe
microanalysis was used to determine the total carbon, and these results were compared to
the results using chemical analysis. The total boron, oxygen, nitrogen and metals were

9
Figure 5. Boron-Carbon phase diagram proposed by Beauvy8.
Figure 6. Boron-Carbon phase diagram proposed by Schwetz9.

10
determined using various other chemical techniques. The results from these analyses
revealed that the rhombohedral boron carbide phase could only accommodate 19.2 at%
carbon at the eutectic temperature of 2380°C. At room temperature, the limit of the boron
carbide homogeneity range on the carbon rich side was established at 18.8 at%. These
results indicate that the stoichiometry of the boron carbide on the carbon rich side is B4.3C
irrespective of the starting synthesis method9. Hence, it is very evident that there is large
disagreement in the boron carbide community about the true solubility limits and this thesis
will aim at trying to rectify some of the underlying questions relating to these results.
1.3 Synthesis of Boron Carbide
1.3.1 Carbothermal Reduction
Carbothermal reduction is a highly economical method to produce boron carbide
with commercially available raw materials. The source of boron is typically boron oxide
or boric acid with petroleum coke or coal providing the source of carbon. Carbothermal
reduction is highly endothermic (ΔH = 1812 kJ/mol) and follows the reaction:
2 B2O3 + 7 C B4C + 6 CO (1)
This process takes place with boron oxide undergoing reduction in the first stage
followed by the reaction of the pure boron with carbon to form boron carbide.
B2O3 + 3 CO 2 B + 3 CO2 (2)
4 B + C B4C (3)
The difficulties typically encountered in boron carbide arise from the fact that for each kg
of boron carbide about 3 kg more carbon monoxide is produced as compared to any other
carbide. Hence boric acid could also be used as a source of boron. If boric acid is used as
a starting material for the boron source then the equations proceed as follows:

11
4 H3BO3 2 B2O3 + 6 H2O (4)
B2O3 + 3 CO 2 B + 3 CO2 (5)
4 B + C B4C (6)
In addition to the above equations other secondary reactions also occur which
influence the product due to the water vapor. Hence the effect of the volatility of water
vapor needs to be taken into consideration during the production of boron carbide.
1.3.1.1 Arc Furnace Process
The arc furnace process for the synthesis of boron carbide has been patented by
Vogt et al.41. In this method, boric acid and carbon are melted and the melt is then crushed
and mixed with the same amount of boric acid. The mixture is then effectively melted again
by heating it in an electric arc furnace to the melting point. There is heavy loss of boron
due to the formation and evaporation of oxides. The localized regions near the electrodes
reach extremely high temperatures. A typical furnace run could take between 18 - 20 hrs.
The mixture in the furnace will usually be of sufficient depth to minimize the spitting out
of molten globules42. The final product consists of an ingot with several areas consisting
of reacted and unreacted material. Generally the material closer to the electrode consists
of fully reacted boron carbide. The material then undergoes various crushing and grinding
operations.
1.3.1.2 Acheson Type Process
Acheson furnaces use electrical resistance heating to produce silicon carbide and
boron carbide. The yield of the product is highly dependent on the length of the furnace
and rate of power input. Most Acheson furnaces are shaped like a trough with graphite
electrodes situated on each end of the furnace. At the beginning of each run the trough is

12
filled with the partially reacted mix followed by installation of the graphite core. After this
the furnace is again mixed with a new mix containing the carbon and boron source for the
formation of the boron carbide. During the heating process boron oxide melts and forms a
glassy layer on the surface of the mix. Bubbles are formed due to the gases which causes
the mix to spurt out, thus decreasing the efficiency of the procedure. After completion of
the reaction the boron carbide collects around the graphite rod in the center and the reacted
boron carbide is then typically separated from the unreacted boron carbide manually43.
1.3.2 Magnesothermal Reduction
Boron carbide can also be produced by the addition of magnesium to boron oxide
in the presence of a carbon source. This synthesis method of boron carbide takes place by
the following method:
2 B2O3 + C + Mg 2 B4C + 6 MgO (7)
The mechanism for this reaction can be explained by the following two reactions:
2 B2O3 + 6 Mg 4 B + 6 MgO (8)
4 B + C B4C (9)
One drawback with this method is that the final product of boron carbide contains
magnesium oxide and magnesium borides as impurities. The final particle size of the
product is controlled by the preliminary reactants used. This process is commercially
unviable due to the high cost of the magnesium43.
1.3.3 Chemical Vapor Deposition
Chemical vapor deposition (CVD) is a very common technique used in laboratories
for the synthesis of boron carbide. This method allows significant control of the
microstructure and the stoichiometry of boron carbide due to the carbon source used and

13
the mass transfer and surface kinetics44. Various techniques have been developed for the
formation of boron carbide films such as plasma enhanced CVD, hot filament CVD, laser
CVD etc.
1.4 Physical Properties of Boron Carbide
1.4.1 Density
The theoretical density of boron carbide (B4C) at 20°C is 2.52 g/cm3. The density
follows a linear relationship with the carbon content and increases with the increase in the
carbon content according to the following equation7.
Density (d), g/cm3 = 2.4224 + 0.00489 C at% ,(r=0.998), where 8.8 at% ≤ C ≤ 20 at%.
The density of B13C2 was measured as 2.488 g/cm3 and B10.4C as 2.465 g/cm3.
1.4.2 Coefficient of Thermal Expansion
The ratio of the degree of expansion to the change in the temperature of the material
is called the coefficient of thermal expansion.
Figure 7. Variation of the thermal expansion coefficient of boron carbide with
temperature.

14
The coefficient of thermal expansion varies with the change in the temperature (Figure 7)
according to the equation:
α = (3.016 x 10⁻⁶) + (4.30 x 10⁻⁹) T – (9.18 x 10⁻¹³) T2 where T is in °C (10)
α = 5.79 x 10⁻⁶ K-1 (300°K to 1970°K) (11)
α = 4-8 x 10⁻⁶ K-1 (25°C to 800°C) (12)
1.4.3 Thermal Capacity
Thermal capacity or the specific heat is the ratio of the heat added to an object to
the change in the temperature due to the heat added. The variation of the thermal capacity
of boron carbide with the temperature is determined by the equation below:
Cp (J/g) = 1.714 + 39.8 x 10⁻⁵ – 97 x 103T-2 + 488 + 1010 T-2 exp (-33 x 103/T) where T is
in Kelvin.
1.5 Neutron Absorbing Capability
Boron carbide is a neutron absorber and can be used to control the reactivity of
nuclear reactors due to the nuclear reactions that take place between B10 and n1 45.
B10 + n1 Li7 (0.84 MeV) + He4 (1.47 MeV) + γ (0.48 MeV) 94% 45 (13)
B10 + n1 Li7 (1.02 MeV) + He4 (1.78 MeV) 6% 45 (14)
Boron has a high neutron capture cross section. The isotope of boron with atomic
mass of 10, is generally found in natural boron at 18.8% and in boron carbide at 14.7%. It
provides an absorption cross section for thermal neutrons of 4000 barns46. Boron carbide
at “stoichiometric” composition exhibits a capture cross section of 600 barns. Secondary
gamma radiation for boron is low as compared to other rare earth elements. Boron carbide
is thus extensively used in nuclear reactors because of its high melting point and good
chemical and physical stability as compared to other elements like cadmium. Moreover the

15
use of boron carbide is more economical for use in neutron protection as compared to other
rare and expensive elements like gadolinium, europium, samarium and dysprosium46.
Boron carbide is also utilized with natural isotope distributions as considerable quantities
of He can be trapped in the boron carbide lattice as most of the boron atoms are the B11
isotope.
1.6 Mechanical Properties
Boron carbide is an extremely hard ceramic and only diamond and boron nitride
are harder at room temperature. Most other carbides and borides have much lower hardness
values as compared to boron carbide as shown in Table 146. The hardness of boron carbide
surpasses them at temperatures exceeding 1100°C47, 48. This high hardness and low density
of boron carbide enable it to be used in a variety of applications. Hardness measurements
in boron carbide are difficult due to the inhomogeneity and the presence of free carbon.
The results of the hardness values for boron carbide are also scattered due to different
sample preparation techniques and measurement conditions7. Typically, Knoop hardness
is used as a reference for boron carbide and varies linearly with the carbon content1.
Table 1. Knoop hardness values of carbides and borides at 100 g load46.
Material Hardness (kg/mm2) Material Hardness (kg/mm2)
B4C 2900 - 3100 TiB2 2500 - 2600
SiC 2300 - 2600 B 2400 - 2500
TiC 2100 - 2200 BeB2 2100 - 2300
WC 2050 - 2150 ZrB2 1800 - 1900
ZrC 2000 - 2100 CaB4 1600 - 1700

16
After polishing, the Knoop hardness was estimated at 2910 ± 90 kg/mm2 for 10.6 at%
carbon1. With the increase in the carbon content to 20 at% carbon, the Knoop hardness
value increases to 3770 ± 90 kg/mm2 1. Variations in the mechanical properties of boron
carbide can be traced back to microstructural variations in the carbon content, grain size,
inhomogeneity and residual porosity45. The yield strength of boron carbide is directly
related to the hardness. Values of the yield strength σ have been reported to be in the 300-
370 MPa range. An overview of the mechanical properties of boron carbide are detailed in
Table 249.
Table 2. Mechanical Properties of Boron Carbide49.
The strength and hardness of boron carbide decreases with the increase in the
porosity and grain size by the Hall-Petch relation1, 50, 51, 52. Based on this relation, yield
strength increases with the decrease in the grain size. When the grain size is decreased, the
ratio of the grain boundaries to the grain increases, resulting in more frequent dislocations
occurring at the grain boundaries. The Hall-Petch equation is denoted as follows:
σ𝑌 = σ0 + 𝐾𝑌
𝐷0.5 (15)
where σY is the yield stress, σ0 is the friction stress, kY is the material property strengthening
coefficient and d is the diameter of the grains. This dependence of the hardness and the
Mechanical Properties
Hardness – Knoop (kgf/mm2) 1400 - 3400
Hardness – Vickers (kgf/mm2) 2800 - 3500
Compressive strength (MPa) 3200
Tensile Modulus (GPa) 440 - 470

17
fracture toughness to the grain size was observed by Hyukjae et al. in pressureless sintered
boron carbide53.
Conflicting reports have been published as to the effect of the stoichiometry on the
mechanical properties. There is no clear indication about the effect of stoichiometry on
hardness46, 54, 55. Kieffer et al.54 proposed that hardness values increase in the B4+xC
direction. Niihara et al. prepared 1-3 mm thick boron carbide plates by chemical vapor
deposition and performed hardness measurements using a Vickers indenter at a load of
0.98 N56. The maximum hardness and fracture toughness was observed at “stoichiometric”
compositions. The hardness values decrease with the increase in the B/C ratio at
temperatures ranging from 1400°C to 1900°C as shown in Figure 856.
Consolidated boron carbide tiles were prepared by Ceradyne Inc. by hot pressing
mixtures of amorphous boron and boron carbide57. Hardness measurements were then
performed using a Knoop indenter at a load of 0.3 kg57. The report published by Ceradyne
Inc. suggested that the hardness values followed an opposite trend to the Niihara data as
Figure 8. Variation of the Vickers hardness as a function of the B/C ratio at different
temperatures and load of 0.98 N56.

18
Figure 9. Effect of stoichiometry on the hardness of hot pressed boron carbide at a load of
0.3 Kg57.
Figure 10. Variation of the fracture toughness (KIC) as a function of the B/C ratio56.
seen in Figure 956, 57. The maximum Knoop hardness was obtained at stoichiometries close
to B13C2 or B6.5C suggesting that the hardness increases with the increase in the B/C ratio.
Boron carbide has a very low fracture toughness (KIC) and values extend from 3 - 4 MPa

19
m1/2. The fracture toughness remains relatively constant at higher temperatures. Figure 10
shows the variation of KIC with the B/C ratio for chemically vapor deposited boron
carbide56. Maximum fracture toughness values were observed at “stoichiometric”
compositions similar to the hardness results. At elevated temperatures, wear resistance and
coefficient of friction decreases due to the formation of boron oxide and boric acid on the
surface of the boron carbide46. The fracture toughness remains relatively constant at higher
temperatures.
1.7 Elastic Properties
Boron carbide with its rhombohedral symmetry has anisotropic elastic properties.
Based on B5.6C single crystal data using resonant ultrasound spectroscopy, the Young’s
Modulus (E) has values ranging from 523 GPa on c = [0001] to 63 GPa in the orthogonal
direction, thus having an anisotropy ratio of 8.16, 58. The Young’s Modulus was determined
to be independent of the orientation along the (111) plane, but variations existed on the
prismatic and basal planes6, 58 (Figure 11). The Young’s Modulus was estimated at 470
GPa for isotropic determination. The maximum Young’s Modulus aligned with the [111]
Figure 11. Young’s modulus dependence on the orientation for a B5.6C single crystal6, 58.

20
direction indicates higher stiffness of the crystal along the chain axis. Table 3 shows the
elastic anisotropic factors of the B5.6C single crystal which signify substantial anisotropic
elasticity58. Comparing the Poisson’s ratio of this crystal with other solids, it is evident
that the bonding in boron carbide is dependent on the orientation as depicted in Table 458.
Table 3. Effect of anisotropy on the elastic properties of boron carbide58.
Table 4. Poisson’s ratio of boron carbide and other solids58.
The elastic properties of boron carbide depend on the B:C ratio and decreases with
the increase in the boron content1, 51 as evidenced by Table 5 . The Bulk Modulus (K) and
Shear Modulus (G) are approximated at 243 GPa and 197 GPa1. The Poisson’s ratio of
boron carbide is low and can be estimated at 0.181. Gieske et al. produced high quality hot
pressed boron carbide samples free from secondary phases for elastic property
investigations59. The absence of secondary phases, eliminated any inconsistencies in the
elastic properties data. Carbon rich areas which were typically seen during hot pressing
due to the contact of the sample with the die were ground off. Ultrasonic techniques were
used in the elastic property measurements. Experimental results revealed that the elastic
moduli decreases with the decrease in the carbon concentration (Figure 12)59. The
maximum value of the Young’s Modulus was obtained at a carbon concentration close to
Anisotropy Factors c33/c11 c13/c12 2c44/(c11-c12)
B5.6C 0.98 0.49 0.8
Poisson's Ratio B5.6C Ti Zr
ν31 = - s13/s33 0.0940 0.265 0.300
ν12 = - s12/s11 0.2297 0.486 0.396
ν13 = - s13/s11 0.0912 0.188 0.238

21
20 at%. A distinct feature of the data is observed at a carbon concentration of ~13.3 at%.
A kink is observed at this carbon concentration in the Elastic, Bulk and Shear moduli
curves. This kink in the curve is similar to the kink seen in the correlation of the lattice
parameters and the carbon content. This is indicative of the distinct mechanism of
substitution of the boron atoms in the 12 atom icosahedra and the chain units. Longitudinal
and shear velocities also decrease when the carbon content drops below 13.3 at%59. At
carbon concentrations below 13.3 at%, boron carbide become highly compressible.
Manghnani et al.60 found that a linear relationship existed between the elastic moduli and
the pressure up to 21 GPa. The Bulk moduli results obtained by Manghnani et al. were
consistent with the values reported by Nelmes et al.61.
Table 5. Dependence of the Elastic Moduli and the Poisson’s ratio on the stoichiometry6.
Stoichiometry at% Carbon Bulk Modulus
Young's
Modulus
[GPa]
exp
Shear
Modulus
[GPa]
exp
Poisson's
Ratio
[GPa]
exp Exp Cal
B4C 20 247e 246e 472c 200c 0.18c
235e 234g 462e 197e 0.17e
199d 248h 448b 188a 0.21b
239i 441a
220d
B4.5C 18.2 237c 463c 197c 0.17c
B5.6C 15.2 236c 462c 197c 0.17c
237f 460r 195f 0.18f
B6.5C 13.3 231c 217g 446c 189c 0.18c
227i
B7.7C 11.5 178c 352c 150c 0.17c
B9C 10 183c 319c 150c 0.21c
130c 348c 132c 0.16c
22
Figure 12. Dependence of the elastic moduli on the carbon concentration.
1.8 Chemical Properties
Boron carbide is a stable compound and is not attacked by cold chemical reagents
but by hot oxidizing agents. Molten alkali can decompose boron carbide to form borates.
It can readily react with metal and metal oxides at temperatures exceeding 1000°C to form
carbides and borides62. Etching with hydrogen is a slow process and takes place at 1200°C,
but it withstands metallic sodium at 500°C23. Carbon can be dissolved in boron carbide at
the B4C-C eutectic temperature of 2400°C23, 30. Fine boron carbide powders form B2O3 and
H3BO3 at the surface due to the presence of oxygen and moisture in the air. Water vapor
reacts with boron carbide at temperatures as low as 250°C63. During hot pressing, oxidation
of boron carbide starts at 600°C and forms a thin layer of B2O3 on the surface62. The
reaction that occurs during the oxidation process is as follows:
B4C + 4O2 = 2B2O3 + CO2 (16)

23
Figure 13. Kinetic curves for the oxidation of boron carbide62.
From Figure 13, it is evident that there is a weight gain in the samples up to 1100°C
and from 1200°C there is a loss in the weight of the sample indicating that the boron oxide
formed on the surface of the boron carbide vaporizes at temperatures up to 1100°C. Above
this temperature the oxidation is dependent on the rate of the reaction. The glassy B2O3
layer formed cracks during cooling62. High temperature oxidation studies were also
conducted by Steinbruck et al64. Multiple boron carbide specimens were investigated under
different atmospheres at temperatures ranging from 800°C to 1600°C. In these
measurements, change in the mass was not measured, but the release rates of the gaseous
reaction products were considered. The oxidation kinetics of boron carbide in steam were
the result of two processes; 1) formation of liquid B2O3 which acts as a diffusion barrier
for the raw materials and products. This process is dependent on the temperature and
follows parabolic kinetics; 2) the second process involves evaporation of the B2O3 and the
concurrent products with steam and is highly dependent on the temperature and
surrounding conditions and follows linear kinetics64. Figure 14 shows the oxidation

24
behavior of boron carbide in dry air64. At lower temperatures, the rate of weight change
remains relatively constant. With the increase in the temperature, a linear weight gain is
observed which is due to the formation of a glassy layer of boron oxide on the surface of
the boron carbide particles. Conversely, in an air-water system, at temperatures ranging
from 200-340°C, the weight change remains constant as seen in Figure 1564. With a further
increase in temperature to 600°C, weight loss is observed. This weight loss is because of
the formation of a gaseous molecule of boric acid from the reaction of boron oxide and
water vapor. At 700°C, weight gain occurs followed by a subsequent weight loss. The
weight gain is due to the boron oxide formation. Once the maximum weight gain has been
achieved, the boric acid formation supersedes the boron oxide formation resulting in a
weight loss of the resultant oxidized material.
Figure 14. Oxidation of boron carbide in dry air64.
25
Figure 15. Oxidation of boron carbide in an air-water system64.
1.9 Microstructural Response to Dynamic Loading
The low density and high hardness of boron carbide make it a prime candidate for
armor applications. Understanding the physical process of armor penetration is important
to obtain a clearer picture of development of the material system in armor applications.
This is shown in Figure 16. Initially when the projectile strikes the plate, the tip of the
projectile is destroyed initiating an axial crack in the ceramic. The ceramic then erodes the
projectile which causes it to be turned into rubble from coalescing cracks in the fracture
conoid. Almost half of the projectile mass and the initial projectile energy is transferred to
the eroded projectile material. Generally, erosion is caused because the stress levels on the
projectile are greater than the strength of the material of the projectile. The projectile yields
and starts to flow perpendicular to the impact. This process of erosion of the projectile will
continue until the stress levels achieved fall below the yield strength of the projectile. Soon

26
this erosion of the projectile stops. The total energy of the system is 60% of the original
energy and this is then absorbed by the backup plate. This occurs due to the loss in the
mass of the projectile. Hence boron carbide is a good candidate for armor applications as
it can potentially withstand longer dwell times and erode the projectile as a result of its
high hardness49, 65, 66.
Figure 16. Energy vs time curve for an impact at 2800 ft/sec of a sharp projectile65.
Boron carbide, inspite of its high hardness shows anomalous fracture behavior at
stresses approaching the Hugoniot Elastic Limit (HEL). This is due to its low density, low
fracture toughness and the activation of an unidentified damage mechanism at high strain
rates and pressures67. There is an abrupt drop in the shear strength at loading pressures of
20 GPa. One of the reasons for the drop in the strength could be due to the change in the
fragmentation behavior. Literature on the shock response of boron carbide suggests that
localized softening or melting occurs under shock wave loading and release. When the
HEL is breached, boron carbide deforms plastically and experiences brittle failure (Figure
17)49, 68. From the shock compression data (Figure 18) reported by different authors65, 69, 70,
71, 72, 73, 74, 75, 76, phase transformations might be occurring under loading. High resolution

27
Figure 17. Ballistic impact data from independent experiments conducted at the Army
Research Laboratory and Sandia National Laboratory depicting the drastic decrease in the
shear strength of boron carbide above the HEL of 20 GPa49, 68.
Figure 18. Shock compression data of boron carbide6.

28
electron microscopy (HREM) was used to identify the damage mechanism in hot pressed
boron carbide (Figure 19)67. Armor piercing rounds at velocities from 750 – 1000 m/s were
used for ballistic testing with impact pressures varying from 19 to 25 GPa causing complex
loading states. HREM showed the damage zones exhibited a loss of lattice fringes
indicating the occurrence amorphization. Due to the planarity of the amorphous bands, the
amorphous zones align along particular crystallographic planes. Based on low
magnification HREM observations the overall orientation of these bands was parallel to
the (113) and (213) planes.
Figure 19. Left : Ballistically impacted boron carbide. Right : HR TEM of a fragment
showing the loss of lattice fringes in the band indicating localized amorphization67.
In addition to contact loading, indentation and scratch tests also caused
amorphization. Nanoindentation provides hardness or elastic moduli information of the
material that is being investigated and also gives an understanding of the variation of these
properties with the depth of penetration of the indenter based on load displacement
curves77, 78. Nanoindentation is a powerful tool that has direct relevance to realistic loading
conditions while reaching pressures in the range of 40 – 45 GPa. In nanoindentation,
typically a spherical or Berkovich diamond indenter is utilized resulting in deviatoric

29
stresses at the contact area. Nanoidentation studies conducted on (0001) and (1011) faces
of a B4.3C single crystal showed changes in the Raman spectra of the indented areas
suggesting that structural changes, such as stress-induced amorphization occur in boron
carbide under static contact loading (Figure 20)79. High and low temperature Raman
spectroscopy of pressure induced amorphous boron carbide demonstrated that
amorphization of B4C was associated with the breaking of the C-B-C chain80. The absence
of the boron phases in the Raman spectra of the pressure induced boron carbide indicated
that the B11C icosahedra of boron carbide remained intact during loading.
Figure 20. Left : (a) Plan view of TEM micrograph of a 100 mN Berkovich indent, (b)
Magnified image showing amorphous bands along the (113) and (003) directions, (c) and
(d) HR lattice images on (a) and (b). Right : Raman spectra of a (a) Pristine single crystal
B4.3C, (b) Indented single crystal, (c) Indented hot-pressed polycrystalline material, (d)
Scratch debris of a single crystal and (e) Annealed scratch debris in air by using an argon
ion laser with excitation wavelength of 514.4 nm79.
HRTEM on scratch debris of single crystal and polycrystalline boron carbide
showed the formation of nanocrystals and nanoscale lattice distortion77. Random grain

30
distribution was observed which could either be due to the breakage of lattice bonds or a
result of solid-state phase transformation occurring under high contact pressures77.
The effect of the stoichiometry on the mechanical properties of icosahedral boron
carbide under loading was studied theoretically by Taylor et al. using density functional
theory and quantum molecular dynamic simulations81. Placement of carbon atoms in the
icosahedra resulted in monoclinic distortion of the structure which reduced the crystal
symmetry. B12(C-B-C) showed a reduction in the final stiffness results. All materials
exhibited softening of the C44 modulus regardless of the final stoichiometry.
1.10 Electrical and Optical Properties
Boron carbide is a p-type semiconductor with a much smaller band gap as compared
to other semiconductor ceramics. Due to the wide compositional range of boron carbide,
varying band gaps have been reported by a number of authors over the years6, 26.
Figure 21. Energy band scheme of boron carbide26
Values ranging from 0.8 eV to 2.09 eV have been reported based on experimental
data (Figure 21)26, 82, 83, 84. Based on electronic band structure calculations stoichiometric
B4C was confirmed to be a semiconductor6, 85.

31
It was suggested that this semiconducting nature of boron carbide is due to the
structural disorder that exists across the homogeneity range. According to Werheit, this
semiconductor behavior could be attributed to the role of Jahn-Teller distortion of the 12
boron atom icosahedra causing a separation of occupied and unoccupied electronic states.
Valence electron deficiencies in boron rich compounds enabled them to be characterized
as metallic in nature. The energy band scheme based on the optical absorption,
luminescence, XRS and transport properties as shown in Figure 2126.

32
2 Goal of Thesis
Boron Carbide has a wide compositional range, varying from ~9 at% to ~20 at%
carbon and the stoichiometric formula of boron carbide is a much disputed area.
Understanding the “true” carbon limits of boron carbide at room temperature and
refinement of the analytical methods for the determination of the boron carbide
stoichiometry is of primary importance as dynamic response of boron carbide varies with
stoichiometry57. Furthermore, using these developed techniques to investigate the variation
in the structural properties of boron carbide across the compositional range would provide
insight regarding the variability of the atomic configurations at different B:C ratios.
Additionally, understanding how the presence of a particular polytype affects the
mechanical properties would shed some light on the preferred composition and purity of
boron carbide required for extreme dynamic environments. This goal will be achieved by
examining and then refining existing characterization techniques with the aid of X-ray
diffraction (XRD), chemical analyses and Raman spectroscopy. The results from the
structural and mechanical characterization could then be applied to boron carbide ceramics
to understand and control dynamic failure processes in order to improve performance.

33
3 Assessment of Current Analytical Techniques for Determination of the Boron
Carbide Stoichiometry
3.1 Introduction
The first objective of this thesis is to assess the current analytical and chemical
techniques used for the characterization of boron carbide and to evaluate the possible
sources of error associated with the reported stoichiometry. This work on boron carbide
will be performed by characterizing commercial boron carbide samples with the focus on
understanding purity and stoichiometric variations. For this task, the comparative analysis
of boron carbide produced by H.C. Starck (Germany), Ceradyne Inc. (Germany), Superior
Graphite (US), UK Abrasives (US) and Vajrabor (India) will be performed by means of X-
ray diffraction, Raman spectroscopy and chemical methods.
X-ray diffraction (XRD) will be performed on these commercial samples to
determine the typical primary and secondary phases present. Different Powder Diffraction
Files (PDF) will be examined for phase identification. The stoichiometry from these PDF
cards will be compared to the stoichiometric results obtained using lattice parameter
measurements and chemical analysis. A major problem with the existing International
Crystal Structure Database (ICSD) is the lack of accuracy of the different PDF cards for
boron carbide. This is due to inconsistencies in the boron carbide chemistry of the PDF
cards and the corresponding line positions and unit cell data. Quantitative analysis on the
samples will be performed using Rietveld Refinement86. The peak fitting functions which
include the Gaussian, Lorentzian, Pseudo-Voight and Pearson VII functions will be
extensively examined to determine the appropriate function required to provide accurate
quantitative analysis. X-ray fluorescence (XRF) scans will help identify the metallic

34
impurities present which would further aid in determining the trace phases present that
cannot be easily identified using XRD. The total boron present in the boron carbide samples
will be evaluated using boron titration. LECO CS230 will be used to obtain the total carbon
present and the total oxygen and nitrogen present will be determined using LECO TC600.
The data from these analyses will then be used to calculate the final stoichiometry of the
boron carbide samples. An assumption made during the determination of the final
stoichiometry is that the total oxygen and nitrogen present in the resulting samples are
present either as boron oxide or boron nitride. The assumptions made here portrays the
existing thought process of most authors with regards to the determination of the
stoichiometry. Little importance is given to the soluble boron and boric acid measurements
which can affect the boron available for boron carbide, which in turn further alters the B:C
ratio. Hence, in addition to the chemical analyses performed at Rutgers, samples will also
be sent to an external analytical company (Washington Mills, USA) for the determination
of the soluble boron content and the boric acid present.
The lattice parameters of these samples will be measured by applying the Rietveld
Refinement procedure to the XRD data. Initially, the lattice constant-stoichiometry
relationship developed by Aselage et al.13 would serve as a basis to measure the bound
carbon concentration. Owing to the scatter of this data, multiple fits will be evaluated to
assess the effect of the fit on the stoichiometric results. A further detailed analysis on other
lattice constant-stoichiometry relationships will be thoroughly evaluated in Section 5. A
comparative study on the stoichiometric results from the unit cell constants and chemical
analysis will be conducted. After the completion of this comparative study, comments will

35
be made about the possible sources of error associated with the chemical analysis and
lattice parameter-stoichiometry calibration curves.
Following a detailed analysis of the commercial powders mentioned above, boron
carbide samples with varying particle sizes from Vajrabor (India) will be investigated to
determine the effect of washing and particle size on the final stoichiometry. The powders
will be exposed to atmospheric air for a period of 2-3 weeks. Following the exposure
period, these powders would then be characterized using the different analytical and
chemical characterization techniques mentioned earlier. The next step would involve
washing the powders to eliminate any surface oxides and boric acid which may have
accumulated on the surface of the particles as a result of prolonged atmospheric exposure.
This step will be followed by determination of the stoichiometry and comparison of these
results to those obtained prior to washing. Furthermore, assessing the particle size
distribution would aid in comprehending the effect of particle size on the O/N accumulation
levels and more importantly, the resultant stoichiometry.
Raman spectroscopy will be performed to help complement the chemical and
structural results obtained using x-ray diffraction and chemical analysis on a microscopic
level. The Raman spectra will be acquired from randomly selected areas in order to obtain
statistically significant results. Data analysis will be performed using the curve fitting
algorithms available in the Renishaw Wire software package. Statistical analysis will be
conducted on the Raman spectra, taking into consideration the peak center, width, height,
area, low edge and high edge, in order to obtain the most representative spectrum for each
of the powders. To alleviate possible atomic and microstructural variations across the
surface of each sample, curve fitting procedure will be applied to all data and the results

36
will be treated statistically assuming normal distributions. It is essential to note whether
the carbon concentrations obtained by Raman measurements are commensurate with those
obtained from the XRD data, which could suggest that Raman spectra could also be used
for evaluation of the boron carbide stoichiometry.
Finally, more commercial powders will be acquired from various boron carbide
manufacturers to help understand the commercial variability in powders and ceramics. The
results from XRD, chemical analysis and Raman spectroscopy will be tabulated to form a
database which will serve as a basis for any future work done in this area.
3.2 Experimental Procedure
3.2.1 X-ray Diffraction (XRD) and Rietveld Refinement
X-ray diffraction was performed using a single crystal silicon wafer. The powder
was dispersed on the wafer surface using methanol and flattened with a glass slide to ensure
the specimen remained within the cavity of the holder to prevent sample displacement
errors. Utilizing a silicon wafer over a bulk holder is advantageous as a result of reduced
peak asymmetry, which typically occurs in materials with low atomic numbers because of
reduced absorption of x-rays. The zero background holder is also preferred over a bulk
holder because of the low background of the monocrystal holder and ability to use
considerably smaller quantities of samples87. For high quality data and Rietveld refinement,
it is essential that the powder diffraction data were collected appropriately. Various factors
were considered prior to data collection such as diffractometer geometry, quality of
alignment of the instrument, suitable radiation, wavelength, sample preparation, thickness,
slit sizes and counting time88. For high resolution and for easy deconvolution of the
complex diffraction pattern of boron carbide, care was taken to achieve the optimal

37
conditions for the XRD scans. The XRD scans were then taken using a Panalytical X'Pert
system (Figure 22) with a Cu x-ray source at 45 kV and 40 mA over a continuous scan
range of 10° to 90° 2θ; at a virtual step size of 0.0131° and counting time of 198.645
seconds. In the incident beam path, an anti-scatter slit of 1° and divergent slit of 1/2° were
used. The diffracted beam path had an anti-scatter slit of 9.1 mm. The sample was rotated
at a speed of 4 seconds per rotation in order to randomize particle orientation. Similar
conditions will be used throughout this thesis. Minor deviations in the standard sample
preparation techniques will be discussed in the appropriate section.
Figure 22. Panalytical X’Pert powder X-ray Diffractometer.
Phase analysis was conducted using MDI Jade version 9.0 software followed by
quantitative analysis by whole pattern fitting and Rietveld refinement. An accurate
description of the peak shape was critical to the results from Rietveld refinement88. Before
structural or profile refinement is conducted, the positions of the observed and calculated
peaks should agree. This was controlled by refining the global parameters. These include,
the zero offset and 2θ correction which account for errors due to sample displacement
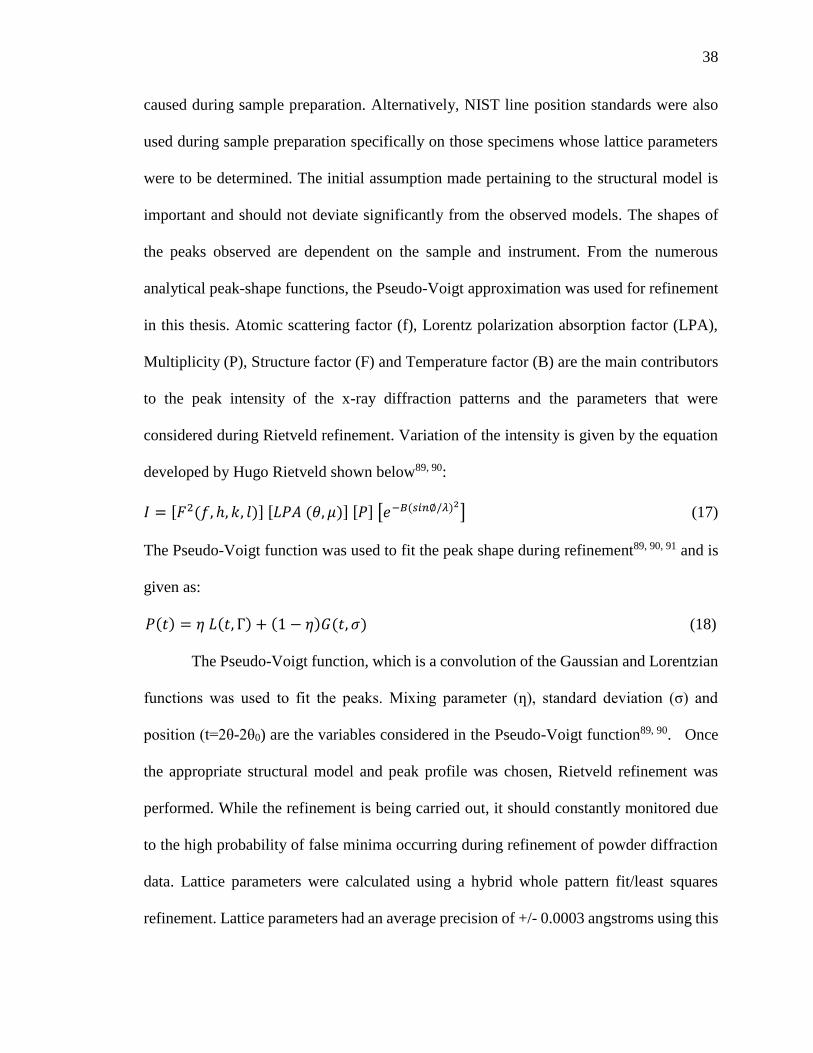
38
caused during sample preparation. Alternatively, NIST line position standards were also
used during sample preparation specifically on those specimens whose lattice parameters
were to be determined. The initial assumption made pertaining to the structural model is
important and should not deviate significantly from the observed models. The shapes of
the peaks observed are dependent on the sample and instrument. From the numerous
analytical peak-shape functions, the Pseudo-Voigt approximation was used for refinement
in this thesis. Atomic scattering factor (f), Lorentz polarization absorption factor (LPA),
Multiplicity (P), Structure factor (F) and Temperature factor (B) are the main contributors
to the peak intensity of the x-ray diffraction patterns and the parameters that were
considered during Rietveld refinement. Variation of the intensity is given by the equation
developed by Hugo Rietveld shown below89, 90:
𝐼 = [𝐹2(𝑓, ℎ, 𝑘, 𝑙)] [𝐿𝑃𝐴 (𝜃, 𝜇)] [𝑃] [𝑒−𝐵(𝑠𝑖𝑛∅/𝜆)2] (17)
The Pseudo-Voigt function was used to fit the peak shape during refinement89, 90, 91 and is
given as:
𝑃(𝑡) = 𝜂 𝐿(𝑡, Γ) + (1 − 𝜂)𝐺(𝑡, 𝜎) (18)
The Pseudo-Voigt function, which is a convolution of the Gaussian and Lorentzian
functions was used to fit the peaks. Mixing parameter (ƞ), standard deviation (σ) and
position (t=2θ-2θ0) are the variables considered in the Pseudo-Voigt function89, 90. Once
the appropriate structural model and peak profile was chosen, Rietveld refinement was
performed. While the refinement is being carried out, it should constantly monitored due
to the high probability of false minima occurring during refinement of powder diffraction
data. Lattice parameters were calculated using a hybrid whole pattern fit/least squares
refinement. Lattice parameters had an average precision of +/- 0.0003 angstroms using this

39
method. The difference between the calculated and observed patterns was defined in terms
of the residual error or R value obtained. During Rietveld refinement, it was ensured that
the R values were between 3-5% to attain significant agreement between the calculated and
observed XRD patterns. In the case of consolidated boron carbide ceramics, sample
preparation was done using a dense sample holder which consisted of a cavity within which
the dense ceramic was placed using putty. During sample preparation, it is imperative to
align the dense ceramic with the holder to prevent errors due to specimen displacement.
3.2.2 X-ray Fluorescence (XRF)
The X-ray fluorescence (XRF) scans were taken using a QuanX X-Ray
fluorescence spectrometer (Figure 23) with an excitation voltage of 20KV, live time of 100
sec and a Paladium filter. XRF scans were taken under vacuum rather than in argon
atmosphere to ensure minimal contamination in the resultant XRF spectra. The scans were
run at a low, medium and high atomic number to detect the full range of mainly metallic
impurities present in most commercial and Rutgers University boron carbide powders. The
typical XRF sample holder consists of two parts; a double open-ended cup and snap ring
as shown in Figure 23. An Ultralene polymer film is placed over the ring and held taught
to remove any wrinkles. The ring is then placed on top of the film and snapped into place
Figure 23. Left: Quanx X-ray Fluroscence Spectrometer. Right: Sample holder used for
XRF measurements.

40
ensuring no tears are present in the film. The powder or dense material is added into the
cup and a second film and snap ring are put onto the top of the cup to prevent any spillage
incase the powder is to be analyzed. XRF spectra were analyzed using KLM markers which
superimpose the screen lines corresponding to the expected position of the emission lines
for each element.
3.2.3 Raman Analysis
Vibrational properties were probed by Raman Spectroscopy. Raman spectroscopy
analysis was performed using a Renishaw InVia® unit (Figure 24) equipped with a 633 nm
wavelength laser and a 1200/mm diffraction grating. 20x to 100x objective lenses were
used which permitted the laser beam to be focused onto a 4 µm2 to 1 µm2 area on the sample
surface. On each sample, spectra were acquired from several selected areas in order to
obtain statistically significant results. Data analysis was then performed using curve fitting
algorithms available in the Renishaw Wire software package. Statistical analysis was also
conducted on the Raman spectra, taking into consideration the peak center, width, height,
area, low edge and high edge to obtain the most representative spectrum for each of the
powders.
Figure 24. Renishaw InVia Reflex Raman Microscope.

41
3.2.4 Chemical Analysis
3.2.4.1 Boron Titration
Boron titration was performed using a Metrohm Titrando 907 with multiple dosing
units for mannitol, acid and base solutions (Figure 25). The Tiamo software enables the
detection of multiple inflection points accurately. The total boron content in the powder
was determined according to ASTM C791-0492. This method involves fusing a mixture of
boron carbide powder and alkaline reagent. The resultant melt was dissolved in water,
filtered to remove the insoluble residue, acidified and heated to remove the carbon dioxide.
The boron was then measured after titration with sodium hydroxide. First, 2 g of Na2CO3
were added to a 30 ml platinum crucible along with 0.13 to 0.15 g of boron carbide powder.
100 mg of potassium nitrate were then added to the crucible and thoroughly mixed with
the help of a short length of wire. An additional 2 g of Na2CO3 were added to completely
cover the above mixture. The crucible was then placed in a muffle furnace and heated to
600°C at 10°C/ min. Once this temperature was attained, the crucible was further
Figure 25. Metrohm Titrando 907 used for boron titration.

42
heated to 1000°C at 3°C/min and held at this temperature for 20 min. The crucible was
removed from the furnace and placed in a boron free beaker on cooling. Nitric acid (3.5 N)
was added along the rim of the crucible to dissolve the melt. The beaker was filled with
distilled water up to the level of the crucible, covered with parafilm and allowed to sit
overnight for complete dissolution of the melt. After the fused residue had completely
dissolved in the melt, the solution was boiled gently for 15 min to remove carbon dioxide.
Nitric acid was added to attain a pH of 3 ± 0.1 in the solution. This solution was titrated
with 0.25 N NaOH to find the first potentiometric end point. Then, 20 g of mannitol was
added and after the mannitol had completely dissolved, the solution was titrated again with
0.25 N NaOH to determine the second potentiometric end point. Based on these results,
weight of the boron carbide initially added, normality of the NaOH and reagent blanks, the
total boron was calculated using the relationship detailed below:
Boron, weight % =(TS−R)NA
WS X 100 (19)
where Ts is the ml of NaOH used in the titration of the sample, R is the reagent blank, N is
the normality of the NaOH solution, A is the atomic weight of the boron computed for the
sample based upon the measured isotopic composition and WS is the sample weight (mg).
Soluble boron was determined by Washington Mills using ASTM C791-1292.
3.2.4.2 Total Carbon Analysis
The total carbon was determined using combustion techniques with a LECO CS230
instrument (Figure 26). This method evaluates the total carbon content in the specimen by
oxidation of the sample followed by infrared detection93. In this method, the blank was first
determined by adding one scoop of LECOCELL II (502-294) and Iron chips (502-231) into
a preheated crucible followed by combustion in the instrument furnace and infrared

43
analysis of the resultant gases. A total of 4 blanks were run and this was then followed by
running 3 standard samples. The standards were run by adding one scoop of LECOCELL
II (502-294), Iron chips (502-231) and 0.25 g of LECO (501-123) into a preheated crucible
followed by analysis in a similar manner to the blanks. The blanks and standards were run
to calibrate the system to ensure accurate results of unknown powders.
Figure 26. LECO C/S 230 (Carbon/Sulphur Analyzer).
Following calibration of the instrument, the carbon content of the powders were
determined by adding one scoop of LECOCELL II (502-294), Iron chips (502-231) and
0.08 g of boron carbide into a preheated crucible. These chips serve as accelerators to
enhance the oxidation of the sample. Internally, the sample was oxidized to carbon dioxide
which absorbs IR energy at a particular wavelength within the IR spectrum. The total
carbon was then measured as a function of the reduction at that energy level. A total of 5
readings for each boron carbide sample were run in order to obtain statistically significant
results.

44
3.2.4.3 Total Oxygen and Nitrogen Analysis
Similarly, LECO TC600 instrument was used to determine total oxygen and
nitrogen present by combustion (Figure 27). Oxygen analysis was performed when the
oxygen in the sample reacted with the carbon crucible resulting in the formation of carbon
monoxide and carbon dioxide. The oxygen was then detected by IR detection of CO and
CO2 in the IR cell94. Nitrogen values were obtained by measuring the change in the thermal
conductivity of the gas before and after combustion94. The boron carbide blank required a
Nickel capsule (LECO: 502-822) and graphite crucible containing 0.45 g Nibble Nickel
(LECO: 501-598) and 0.05 g graphite powder (LECO 502-822). Typically 4 blanks are
used for analysis followed by calibration standards.
Figure 27. LECO TC 600 (Oxygen/Nitrogen Analyzer).
Three oxygen standards were run using 0.14 g (LECO: 502-399) according to the
procedure detailed above. In addition to the oxygen standards, three runs of 0.5 g of
nitrogen standards (LECO: 502-102) were also run to complete the calibration of the
instrument. The next step involved running the unknown boron carbide samples in a similar
manner to the blanks and standards. Boron carbide powder was weighed (~0.1 g) and
placed in the nickel capsule followed by analysis using the LECO software. The final

45
results of the oxygen and nitrogen were obtained as a weight percentage. A total of 5
readings were taken for each boron carbide sample to attain statistically significant results.
3.2.5 Powder Cleaning
The cleaning procedure entailed mixing the powder (10 - 15 g) with hydrochrolic
acid (3.5 pH) in an ultrasonicator for 15 minutes and heating the solution at 150°C. After
the powder settled to the bottom, the excess acid was decanted. This residue was washed
twice with distilled water and the excess water was decanted each time after the powder
settled to the bottom of the beaker. The remaining slurry was then washed with ethanol and
the excess ethanol was decanted in a similar manner to the hydrochloric acid and distilled
water. The beaker was placed in a drying oven at 100°C to allow for evaporation of the
moisture and residual alcohol. After the powder was dried, analysis was conducted to
determine the stoichiometry of the powder after washing.
3.2.6 Particle Size Analysis
Particle size analysis was conducted using a Malvern Mastersizer 2000 with the
Hydro 2000S cell (Figure 28). This instrument uses a laser diffraction technique to measure
the size of the particles. The sample was analyzed by dispersing the powder in a solvent.
The solvent used in the particle size analysis for boron carbide powders was deionized
water. This solution was fed to the Hydro S dispersion cell after ultrasonication for 45 – 50
seconds. Ultrasonication is primarily done to break up aggregates that have agglomerated
due to cohesion. This would prevent a typical bimodal distribution due to agglomeration.

46
Figure 28. Malvern Mastersizer 2000 Light Scattering Particle Sizer.
3.3 Results and Discussion
3.3.1 Phase Identification and Quantitative Analysis
Phase identification and quantitative analysis were performed on commercial boron
carbide samples produced by H.C. Starck (Germany), Ceradyne Inc. (Germany), Superior
Graphite (US), ESK (Germany) and Vajrabor (India). Phase identification on the samples
revealed a major and minor phase of boron carbide and carbon respectively. Multiple
Powder Diffraction Files (PDF), each with a varying B:C ratio were used to match the
boron carbide phase. PDF cards are basically datasets of diffraction patterns and properties
of elements and compounds. The database employed for the PDF cards was the
International Crystal Structure Database (ICSD). This information was used for a basic
estimation of the boron carbide stoichiometry. Based on the fit with the experimental data,
it was established that the stoichiometry of the major boron carbide phase was ~B4C (97-
065-4971). Table 6 presents the theoretical 2ϴ positions, relative intensities, d-spacing
and indexing of boron carbide as established by Clark et al.31. Other PDF cards B0.8C0.2
(97-008-1961), B6.5C (97-000-0446) and B4C (97-002-9093) showed deviations from the
experimental 2θ positions. Exclusively using PDF cards to calculate the stoichiometry of

47
Table 6. Indexing, theoretical reflections and relative intensities of boron carbide31.
2-Theta
(Deg) d(Å) I(f) ( h k l) Theta (Deg) 1/(2d) 2pi/d n^2
19.701 4.5027 5.3 ( 1 0 1) 9.85 0.111 1.3954
21.983 4.0400 17.3 ( 0 0 3) 10.992 0.1238 1.5552
23.476 3.7865 83.9 ( 0 1 2) 11.738 0.132 1.6594
31.937 2.8000 15.7 ( 1 1 0) 15.968 0.1786 2.244
34.886 2.5697 49.6 ( 1 0 4) 17.443 0.1946 2.4451
37.805 2.3778 100 ( 0 2 1) 18.903 0.2103 2.6425
39.111 2.3013 8.7 ( 1 1 3) 19.555 0.2173 2.7303
40.016 2.2513 <1 ( 2 0 2) 20.008 0.2221 2.7909
41.619 2.1683 <1 ( 0 1 5) 20.809 0.2306 2.8978
44.833 2.0200 0.2 ( 0 0 6) 22.416 0.2475 3.1105
48.016 1.8932 0.1 ( 0 2 4) 24.008 0.2641 3.3187
50.302 1.8124 6.7 ( 2 1 1) 25.151 0.2759 3.4667
52.084 1.7545 0.1 ( 1 2 2) 26.042 0.285 3.5811
53.401 1.7143 11.8 ( 2 0 5) 26.700 0.2917 3.6651
56.096 1.6382 0.6 ( 1 1 6) 28.048 0.3052 3.8354
56.379 1.6306 2.9 ( 1 0 7) 28.19 0.3066 3.8532
56.914 1.6166 0.5 ( 3 0 0) 28.457 0.3093 3.8867
58.831 1.5684 1.1 ( 2 1 4) 29.416 0.3188 4.0062
61.758 1.5009 9.5 ( 0 3 3) 30.879 0.3331 4.1863
63.586 1.4621 15.7 ( 1 2 5) 31.793 0.342 4.2975
64.373 1.4461 15.6 ( 0 1 8) 32.186 0.3458 4.345
66.276 1.4091 3.6 ( 0 2 7) 33.138 0.3548 4.459
66.763 1.4000 15.3 ( 2 2 0) 33.381 0.3571 4.488
69.780 1.3467 0.5 ( 0 0 9) 34.890 0.3713 4.6657
70.366 1.3369 10.8 ( 1 3 1) 35.183 0.374 4.6999
71.226 1.3228 10.3 ( 2 2 3) 35.613 0.378 4.7498
71.834 1.3131 11.9 ( 3 1 2) 35.917 0.3808 4.7849
73.671 1.2848 3.4 ( 2 0 8) 36.836 0.3892 4.8902
75.222 1.2622 5.7 ( 0 3 6) 37.611 0.3961 4.9781
75.466 1.2587 9.9 ( 2 1 7) 37.733 0.3972 4.9918
77.595 1.2294 0.2 ( 1 3 4) 38.797 0.4067 5.1108
78.798 1.2136 2.4 ( 1 1 9) 39.399 0.412 5.1773
79.360 1.2064 2.3 ( 4 0 1) 39.68 0.4145 5.2081
80.770 1.1889 5.2 ( 0 4 2) 40.385 0.4206 5.285
81.830 1.1761 1.8 ( 3 1 5) 40.915 0.4251 5.3422
81.855 1.1758 1.3 (1 0 10) 40.927 0.4252 5.3436
82.543 1.1678 4.6 ( 1 2 8) 41.271 0.4282 5.3805
84.047 1.1507 2.9 ( 2 2 6) 42.024 0.4345 5.4605
86.362 1.1257 0.9 ( 4 0 4) 43.181 0.4442 5.5818
88.093 1.1080 <1 ( 3 2 1) 44.047 0.4513 5.671
89.482 1.0943 1.1 ( 2 3 2) 44.741 0.4569 5.7416

48
unknown samples proves unreliable due to the lack of agreement in the stoichiometries and
line positions reported in the PDF cards. This is a direct consequence of inaccuracies with
regards to the chemical techniques previously employed and the assumption that boron
carbide only existed at a stoichiometry of B4C or B6.5C. Hence using certain PDF cards to
ascertain the stoichiometry leads to uncertainty in the results. The secondary phases present
in the powders differed in terms of the type of carbon present. Differences in the nature of
the carbon identified by XRD can be gleaned from the peak positions, FWHM and
asymmetric nature of the 002 carbon peaks as will be discussed in Section 4. The absence
of additional secondary phases of boric acid in certain powders were a result of the
dispersion of the powder in methanol during XRD sample preparation. This can be
rationalized from the reaction of the boron oxide with methanol resulting in a B-OCH3
species which was washed away. However, in certain commercial powders, boron oxide
and boric acid diffraction peaks are observed as in these cases boric acid is present in large
quantities and hence is not completely washed away. Nonetheless, the boron oxide and
boric acid amounts were considered based on the oxygen values obtained from chemical
analysis as will be discussed in Section 3.3.3.
Figure 29 shows the phase identification of the XRD patterns in boron carbide
samples manufactured by Ceradyne Inc. The typical primary and secondary phases present
include boron carbide and carbon. Boric acid is also observed in the ATD-2012-6-20 and
ATD-2012-6-58 samples which could potentially be attributed to the presence of residual
reactants during synthesis of the boron carbide. Alternatively, in submicron boron carbide
powders, prolonged exposure to the atmosphere may cause the residual amorphous boron
to be converted to boron oxide and subsequently boric acid on contact with moisture from

49
the air. Moreover, the absence of significant quantities of metallic impurities provide
insight regarding the purity of boron carbide samples manufactured by Ceradyne Inc.
Powders manufactured by H.C. Starck on the other hand show considerably lower
quantities of carbon, although impurities such as tungsten carbide are observed in trace
amounts specifically in the ST-HD05 powder (Figure 30). Generally, in commercial
powders grinding media is used to obtain a uniform particle size distribution. But, as a
result of the high hardness of boron carbide, the ceramic media employed will inevitably
lead to contamination in the resultant powder. Powders manufactured by Vajrabor are
similar in terms of the primary and secondary phases to the Ceradyne samples (Figure 31).
No evidence of impurities were observed within the detection limits of XRD. This could
indicate that the manufacturing techniques utilized by these companies were similar in
terms of the raw materials used and synthesis methods employed. Powders synthesized by
ESK (ED-102) were analogous to the Ceradyne and Vajrabor samples as evidenced by
Figure 32 (Top).

50
Figure 29. Phase identification of boron carbide samples produced by Ceradyne Inc.
Figure 30. Phase identification of boron carbide samples produced by H.C.Starck.

51
Figure 31. Phase identification of boron carbide samples produced by Vajrabor.
Figure 32. Top: Phase identification of boron carbide samples produced by ESK
Bottom: Phase identification of boron carbide samples produced by Coorstek.
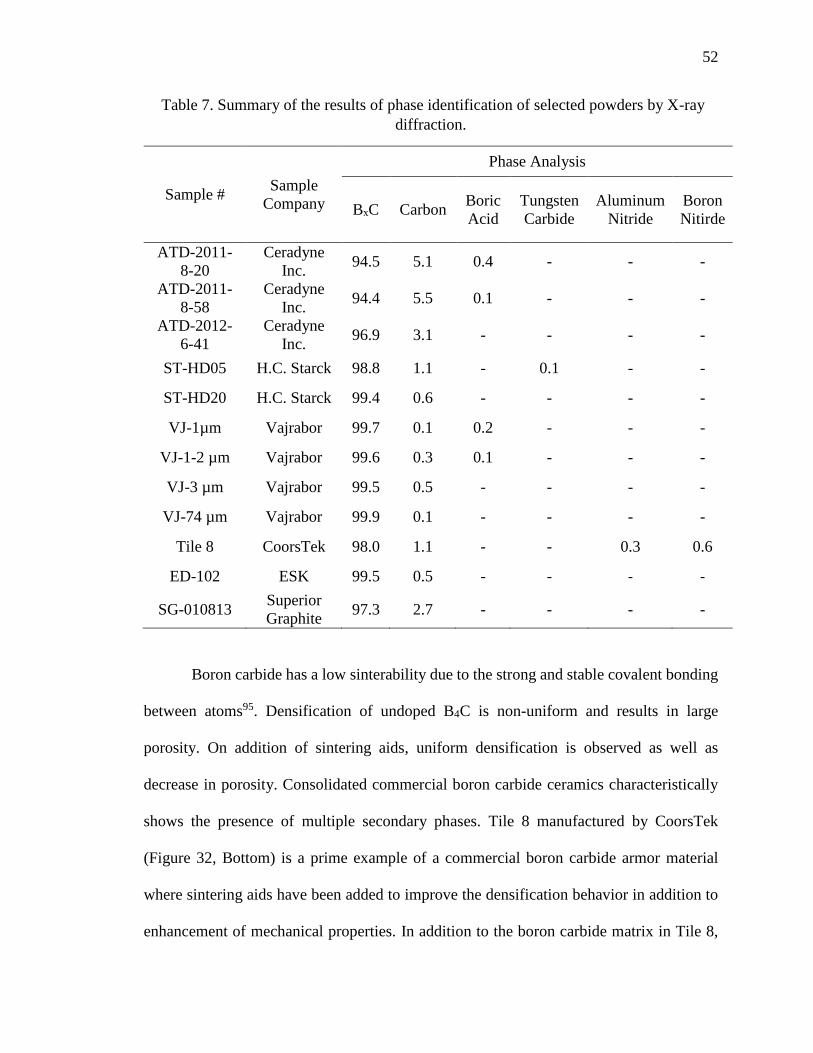
52
Table 7. Summary of the results of phase identification of selected powders by X-ray
diffraction.
Sample # Sample
Company
Phase Analysis
BxC Carbon Boric
Acid
Tungsten
Carbide
Aluminum
Nitride
Boron
Nitirde
ATD-2011-
8-20
Ceradyne
Inc. 94.5 5.1 0.4 - - -
ATD-2011-
8-58
Ceradyne
Inc. 94.4 5.5 0.1 - - -
ATD-2012-
6-41
Ceradyne
Inc. 96.9 3.1 - - - -
ST-HD05 H.C. Starck 98.8 1.1 - 0.1 - -
ST-HD20 H.C. Starck 99.4 0.6 - - - -
VJ-1µm Vajrabor 99.7 0.1 0.2 - - -
VJ-1-2 µm Vajrabor 99.6 0.3 0.1 - - -
VJ-3 µm Vajrabor 99.5 0.5 - - - -
VJ-74 µm Vajrabor 99.9 0.1 - - - -
Tile 8 CoorsTek 98.0 1.1 - - 0.3 0.6
ED-102 ESK 99.5 0.5 - - - -
SG-010813 Superior
Graphite 97.3 2.7 - - - -
Boron carbide has a low sinterability due to the strong and stable covalent bonding
between atoms95. Densification of undoped B4C is non-uniform and results in large
porosity. On addition of sintering aids, uniform densification is observed as well as
decrease in porosity. Consolidated commercial boron carbide ceramics characteristically
shows the presence of multiple secondary phases. Tile 8 manufactured by CoorsTek
(Figure 32, Bottom) is a prime example of a commercial boron carbide armor material
where sintering aids have been added to improve the densification behavior in addition to
enhancement of mechanical properties. In addition to the boron carbide matrix in Tile 8,

53
secondary phases of carbon, aluminum nitride and boron nitride were observed in the XRD
pattern. The secondary phases were typically present as nano-precipitates within boron
carbide grains as well as along grain boundaries. An important point to note about Tile 8
is the fact that it was used as a baseline tile within the Materials in Extreme Dynamic
Environments (MEDE) program which is a collaborative research alliance between
Rutgers University, U.S. Army Research Laboratory, Johns Hopkins University and
California Institute of Technology. Specific observations regarding the tile will be
discussed throughout this thesis dissertation.
Quantitative analysis of the commercial powders and dense ceramics was
performed using whole pattern fitting and refinement. To attain good agreement between
the observed and calculated diffraction patterns, Rietveld refinement was conducted
accounting for sample displacement, peak intensity and other parameters detailed in
Section 3.2.1. The results from these analyses are shown in Table 7. Significantly higher
levels of carbon were noticed in powders manufactured by Ceradyne and Superior Graphite
probably owing to the incomplete reaction of the boron and carbon source. Another
possibility for the high carbon levels could be attributed to the addition of carbon to boron
carbide to serve as sintering aids during consolidation of the synthesized powders. Powders
manufactured by H.C. Starck, ESK and Vajrabor show free carbon values in the 0.5 – 1.1%
range. Although Rietveld refinement serves as a useful tool for quantitative analysis, the
accuracy of the free carbon results are questionable because of the existence of varying
forms of carbon which cannot be accurately quantified using this method. Further
examinations of methods used to determine the free carbon concentrations will be
discussed in Section 4.

54
3.3.2 Impurity Detection
Initial elemental results from x-ray fluorescence gives an insight into the possible
trace phases present in the commercial powders which are not possible to detect using x-
ray diffraction. The trace elements present in the commercial samples were then
determined by x-ray fluorescence based on their respective atomic number. The x-ray
fluorescence spectra were acquired at low, mid and high atomic numbers (Za) and analyzed
using KLM markers. Examples of peak locations for the identified elements in the ED-102
sample manufactured by ESK are shown in Figure 33, Figure 34 and Figure 35. For XRF
analysis, only particular samples were chosen from each company as a representation of
the entire range of powders manufactured by the company. These impurities were present
in such low quantities that their presence did not significantly affect the stoichiomertry of
boron carbide. Identification of these impurities provides insight into the synthesis methods
used and the grinding media typically employed during processing. The most common
contaminants evaluated in commercial powders were found to be Calcium, Titanium,
Nickel, Iron, Copper and Zirconium.
Table 8. Impurities detected using X-ray fluorescence of selected commercial boron
carbide samples.
Sample Company Impurities Present
SG-010813 Superior Graphite Ca, Ti, Fe, Ni, Cu, Zr
ATD-2012-6-41 Ceradyne Inc. Ca, Ti, Cr, Fe, Ni, Cu, Zr, W
ST-HD20 H.C. Starck Ca, Ti, Cr, Mn, Fe, Ni, Cu, Zr, W, Ta
ED-102 ESK Ca, Ti, Mn, Fe, Ni, Zr
VJ-3 µm Vajrabor Fe, Ca, Ni, Cu, Zr, W
Tile 8 CoorsTek Fe, Ti, Cr, Ni, Al,

55
Figure 33. XRF spectra at low Za for boron carbide powders manufactured by ESK.
Figure 34. XRF spectra at mid Za for boron carbide powders manufactured by ESK.

56
Figure 35. XRF spectra at high Za for boron carbide powders manufactured by ESK.
3.3.3 Stoichiometric Measurements
The stoichiometry of the commercial samples was determined based on the x-ray
diffraction and chemical analysis results. The stoichiometry was evaluated based on
specific assumptions made during calculations. Total boron present was assumed to be
bound to boron carbide, boron oxide and boron nitride. The total carbon in boron carbide
was assumed to consist of free carbon and carbon bound to boron carbide. The total
nitrogen and oxygen present were assumed to be in the form of boron nitride and boron
oxide respectively. Titration and combustion methods were used for elemental analysis
following which stoichiometric measurements were conducted on selected boron carbide
powders, namely ATD-2012-6-41, ST-HD20 and SG-01081. The results from the chemical

57
analysis are shown in Table 9 and the steps involved in the determination of the final
stoichiometry are detailed below.
Table 9. Chemical analysis of select commercial boron carbide samples.
Sample #
Total Boron
(Titration)
(wt%)
Total Carbon
(LECO)
(wt%)
Total Oxygen
(LECO)
(wt%)
Total Nitrogen
(LECO)
(wt%)
SG-010813 76.21 ± 0.05 22.33 ± 0.25 1.37 ± 0.03 0.10 ± 0.01
ST-HD20 75.82 ± 0.05 22.38 ± 0.18 1.60 ± 0.01 0.20 ± 0.01
ATD-2012-6-41 77.41 ± 0.28 20.93 ± 0.25 1.07 ± 0.02 0.59 ± 0.01
Based on the calculations of the stoichiometry (see steps involved in the
determination of the boron carbide stoichiometry), the stoichiometries of ST-HD20, ATD-
2012-6-41 and SG-010813 were estimated at B3.81C, B4.72C and B4.27C respectively. Most
commercial powders are typically made at stoichiometries close to ~B4C due to the
improved properties at this stoichiometry. From the stoichiometric calculations, it is
discernable that the experimental error associated with the free carbon content was the
highest. The methods used to determine the boron, oxygen and nitrogen values have lower
experimental errors. Moreover, the accuracy of these methods is high as compared to the
techniques used to determine the free carbon concentration. The different techniques
employed to determine the free carbon concentration will be detailed in Section 4. The
powders used for analysis were washed before the stoichiometry was determined to
minimize the impact of surface oxygen on the analysis. A further detailed analysis on the
effect of powder cleaning will also be discussed in Section 3.3.4.

58
Steps involved in the Determination of the Boron Carbide
Stoichiometry
1) SG-010813 (Superior Graphite)
1) Total Carbon (LECO) = 22.33 ± 0.25 4) Total Nitrogen (LECO) = 0.1 ± 0.01
Moles of Total Carbon = 1.86 ± 0.02 Moles of Nitrogen = 0.01 ± 0.000
2) Total Boron (LECO) = 76.21 ± 0.05 5) Free Carbon (XRD) = 2.72 ± 0.16
Moles of Total Boron = 7.05 ± 0.005 Moles of free Carbon = 0.23 ± 0.01
3) Total Oxygen (LECO) = 1.37 ± 0.03
Moles of Oxygen = 0.09 ± 0.002
Moles of Boron in = Moles of Total Moles of Boron in Moles of Boron in
Boron Carbide Boron Boron Oxide Boron Nitride
= (7.05 ± 0.005) (0.06 ± 0.001) (0.01 ± 0.000)
= 6.99
Moles of Carbon in = Moles of Total Moles of Free
Boron Carbide Carbon Carbon
= (1.86 ± 0.02) (0.23 ± 0.01)
= 1.64 ± 0.03
Stiochiometry of BxC = Moles of Boron in Boron carbide
Moles of Carbon in Boron carbide
Stiochiometry of BxC = B4.27 ± 0.06C
The bound carbon content based on chemical analysis is thus 18.98 at%.

59
2) ST-HD20 (H.C. Starck)
1) Total Carbon (LECO) = 22.39 ± 0.18 4) Total Nitrogen (LECO) = 0.20 ± 0.005
Moles of Total Carbon = 1.86 ± 0.01 Moles of Nitrogen = 0.01 ± 0.000
2) Total Boron (LECO) = 75.82 ± 0.05 5) Free Carbon (XRD) = 0.55 ± 0.05
Moles of Total Boron = 7.01 ± 0.004 Moles of free Carbon = 0.05 ± 0.004
3) Total Oxygen (LECO) = 1.60 ± 0.01
Moles of Oxygen = 0.10 ± 0.000
Moles of Boron in = Moles of Total Moles of Boron in Moles of Boron in
Boron Carbide Boron Boron Oxide Boron Nitride
= (7.01 ± 0.004) (0.07 ± 0.000) (0.01 ± 0.000)
= 6.93
Moles of Carbon in = Moles of Total Moles of Free
Boron Carbide Carbon Carbon
= (1.86 ± 0.01) (0.05 ± 0.004)
= 1.81 ± 0.03
Stiochiometry of BxC = Moles of Boron in Boron carbide
Moles of Carbon in Boron carbide
Stiochiometry of BxC = B3.81 ± 0.03 C
The bound carbon content based on chemical analysis is thus 20.8 at%

60
3) ATD-2012-6-41 (Ceradyne)
1) Total Carbon (LECO) = 20.93 ± 0.25 4) Total Nitrogen (LECO) = 0.59 ± 0.01
Moles of Total Carbon = 1.74 ± 0.02 Moles of Nitrogen = 0.04 ± 0.001
2) Total Boron (LECO) = 77.41 ± 0.28 5) Free Carbon (XRD) = 2.96 ± 0.18
Moles of Total Boron = 7.16 ± 0.03 Moles of free Carbon = 0.25 ± 0.02
3) Total Oxygen (LECO) = 1.07 ± 0.02
Moles of Oxygen = 0.07 ± 0.001
Moles of Boron in = Moles of Total Moles of Boron in Moles of Boron in
Boron Carbide Boron Boron Oxide Boron Nitride
= (7.16 ± 0.03) (0.04 ± 0.000) (0.04 ± 0.001)
= 7.10
Moles of Carbon in = Moles of Total Moles of Free
Boron Carbide Carbon Carbon
= (1.74 ± 0.02) (0.25 ± 0.02)
= 1.50 ± 0.03
Stiochiometry of BxC = Moles of Boron in Boron carbide
Moles of Carbon in Boron carbide
Stiochiometry of BxC = B4.72 ± 0.08 C
The bound carbon content based on chemical analysis is thus 17.48 at%

61
Table 10. Soluble boron values determined by titration analysis.
Powder Company Soluble or Free Boron
(Titration) (wt%)
SG-010813 3.10
ST-HD20 5.48
ATD-2012-6-41 0.93
Another factor which affects the stoichiometry of boron carbide is the soluble boron
content. Previous work done in this area, namely analysis by Schwetz et al. 9 disregard the
soluble boron content which may give an incorrect evaluation of the final B:C ratio. As a
result of the limited equipment capability at Rutgers University, selected powders were
analyzed externally at Washington Mills (USA). The soluble boron content in the ST-
HD20 and SG-010813 powder showed large quantities of elemental boron which were not
observed using XRD (Table 10). Increased quantities of soluble boron lead to a decrease
in the boron content available for boron carbide, which in turn reduces the stoichiometric
value. Table 11 shows the modified values of the stoichiometry considering the soluble
boron contents.
Table 11. Comparison of the stoichiometry of the boron carbide powders assuming the
absence and presence of soluble boron.
Powder
Company
Stoichiometry
Without Soluble Boron With Soluble Boron
SG-010813 4.27 ± 0.05 3.92 ± 0.05
ST-HD20 3.81 ± 0.04 3.60 ± 0.05
ATD-2012-6-41 4.72 ± 0.07 4.58 ± 0.08

62
3.3.4 Effect of Powder Cleaning on the Stoichiometry
Washing powders before analysis is of prime importance particularly in powders in
the micron-submicron regime. To study the effect of powder cleaning on the stoichiometry,
4 powders manufactured by Vajrabor (India) were considered. Particle size analysis on the
powders resulted in mean particle values of 1 µm, 1-2 µm, 3 µm and 74 µm. These powders
had a diverse particle size distribution and effectively served as a suitable basis to examine
particle size effect on the oxygen/nitrogen content and stoichiometry. Chemical analysis
on the unwashed Vajrabor samples (Table 12) showed higher values of oxygen and
nitrogen and low amounts of free carbon. In particular, the 1 µm powder had significantly
higher oxygen and nitrogen contents. On prolonged exposure to the atmosphere, boron
carbide powders in the micron-submicron regime amass oxygen/nitrogen from
atmospheric air. Oxide layers are typically formed on the surface of the powders owing to
their increased surface area and decreased particle size. Furthermore, boron oxide present
in the material may react with the atmospheric moisture forming boric acid. These factors
affect analysis and provide a false estimation of the boron carbide stoichiometry. The effect
of increased oxygen/nitrogen contents gradually decreased with the increase in the particle
size and decrease in the surface area of the powders. Results from chemical analysis on the
cleaned powders are detailed in Table 13. The washing procedure entails removal of the
surface oxides, boron oxide and boric acid, accumulated on the surface of the boron carbide
particles over time. Post washing, a drastic drop in the oxygen and nitrogen values was
seen in the 1 µm and 1-2 µm powders. With the reduction in the oxygen/nitrogen values,
understandably the total boron, carbon and free carbon quantities increased. The results
from the 3 µm and 74 µm powders deviated marginally before and after powder cleaning

63
because of its higher particle size and reduced surface area which prevented increased
accumulation of oxygen/nitrogen. The B:C ratio of the 3 µm and 74 µm powders remained
at similar levels as a result of consistent oxygen/nitrogen amounts. But, the final
stoichiometry of low particle size powders deviated by ~5-7%. For a true estimation of the
chemistry of boron carbide, powders should be cleaned before analysis and stored in
temperature and humidity controlled dryboxes to prevent oxygen/nitrogen buildup.
Table 12. Summary of the chemical composition and stoichiometry of unwashed
Vajrabor samples with variable particle sizes.
Table 13. Summary of the chemical composition and stoichiometry of washed Vajrabor
samples with variable particle sizes.
Sample # B
(wt%)
C
(wt%)
O
(wt%)
N
(wt%)
Free
Carbon Stoichiometry
VJ-1 µm 78.62 19.98 0.83 0.57 0.40 B4.3C
VJ-1-2 µm 80.57 18.87 0.43 0.12 0.20 B4.8C
VJ-3 µm 80.31 19.34 0.19 0.15 0.40 B4.7C
VJ-74 µm 78.97 20.80 0.08 0.15 0.10 B4.2C
Sample # B (wt%) C (wt%) O
(wt%)
N
(wt%)
Free
Carbon Stoichiometry
VJ-1 µm 70.94 17.83 5.07 6.16 0.10 B4.0C
VJ-1-2 µm 77.90 18.25 2.03 1.82 0.30 B4.6C
VJ-3 µm 80.01 18.94 0.16 0.89 0.49 B4.7C
VJ-74 µm 78.91 20.80 0.14 0.14 0.10 B4.2C

64
3.3.5 Lattice Parameter Measurements
Lattice parameter-stoichiometry relationships were used to determine the bound carbon
concentration of boron carbide, the results of which were compared to those calculated
from chemical analysis. Evaluating the carbon concentration from the lattice parameters,
provides a convenient and non-destructive method in obtaining the stoichiometry of boron
carbide. Over the years, a number of conflicting and sometimes contradictory reports have
been published that detail the lattice parameter dependence on the carbon concentration in
boron carbide. These reports have been found to exhibit large scatter13, 15, 33, 96, 97, 98, 99. The
scatter in the data is presumably a consequence of large discrepancies in chemical analysis.
Additional factors contributing to the unreliable data could be inconsistencies in
experimental techniques i.e. wavelength choice, mis-indexed powder lines and incorrect
centering of the specimen in the diffractometers. The most consistent work on the lattice
parameter dependence on the stoichiometry was done by Bouchacourt et al. 33, Aselage et
al. 13 and Gosset et al.96. In this sub-section, only the results from Aselage et al.13 will be
reviewed. A further detailed investigation of other lattice parameter carbon concentration
relationships will be discussed in Section 5. Based on the Aselage data ( Table 14), the
lattice parameters increase with the decrease in the carbon content. The large range of
lattice parameters reported near 20 at% carbon exemplify the difficulty associated with
analysis of the stoichiometry and lattice parameters near the carbon rich solubility limit.
With further boron addition, the c lattice parameter levels out at ~13 at% carbon and
remains constant towards the boron rich solubility limit. This abrupt break in the slope
around 13.3 at% carbon (corresponding to B13C2) denotes the change in the mechanism of
substitution of boron and carbon atoms either side of B13C2. Due to the scatter in the

65
Aselage et al. data, the lattice constant-stoichiometry relationship it can be fitted using
different linear fits (Figure 36). Depending on the type of fit used, the stoichiometric results
can differ significantly. The lattice parameters of three representative boron carbide
powders were determined and overlaid on the Aselage et al. data as seen in Figure 36. The
corresponding carbon concentration from the lattice parameters are reported in Table 14.
The largest deviations in the results were seen in the stoichiometric values using the c
lattice parameter. This was primarily related to the change in the slope at 13.3 at% carbon.
Although the change in the slope at ~13 at% carbon has been previously established, a
linear dependence of the c lattice parameter on the carbon concentration across the entire
solubility range can also be assumed which would drastically alter the results. As the
stoichiometry of the sample is dependent on the fit used, minimizing the scatter in the
lattice parameter data would effectively lead to improved results for the B:C ratio.
Table 14. Summary of hexagonal lattice parameters and corresponding carbon
concentration as determined by Aselage et al.13.
a(Å) c(Å) Carbon Concentration (at%)
5.5991 12.0740 20.2
5.5980 12.0707 19.4
5.5995 12.0707 19.2
5.5993 12.0655 19.6
5.6030 12.0802 19.6
5.6030 12.0909 18.8
5.6032 12.0909 18.7
5.6071 12.1032 17.4
5.6152 12.1411 16
5.6244 12.1727 12.8
5.6286 12.1748 12.3
5.6344 12.1793 10.4
5.6438 12.1750 9.3
5.6440 12.1730 8.1

66
Variations in the estimated carbon concentrations existed depending on whether a
or c lattice parameters were considered. In certain cases, as in the ATD-2012-6-41 powder,
the carbon concentrations deviated by ~1 at% carbon. The differences in the carbon content
results were attributed to inaccurate lattice parameter data. Additionally, relatively small
amounts of impurities substantially alter the lattice parameters and increase the unit cell
volume of the boron carbide crystal. Furthermore, particular elemental impurities such as
Si or Al, could preferentially alter the lattice parameter results along either the x or y
direction. To account for variable sources of error, the stoichiometry of boron carbide
powders was determined from the average values of the carbon concentration acquired
from the lattice parameters (Table 16). The chemistry of the SG-010813 powder was closer
to the “stoichiometric” value of boron carbide as compared to the ST-HD20 and ATD-
2012-6-41 powder which were boron rich. On comparing these results with those from
chemical analysis, significant deviations were noticed. This is the primary source of the
problem with regards to the accuracy of chemical techniques employed as well as the errors
Table 15. Summary of lattice parameters and the corresponding carbon
concentration from XRD depending on the fit used for the data.
Powder # Powder
Company a(Å) c(Å)
Carbon Concentration (at%)
Fitting 1 Fitting 2
Based
on a
Based
on c
Based
on a
Based
on c
SG-010813 Superior
Graphite 5.6006 12.0750 19.4 19.5 19.4 20.1
ST-HD20 H.C.Starck 5.5995 12.0774 19.7 19.3 18.3 19.8
ATD-2012-
6-41
Ceradyne
Inc. 5.6071 12.0907 17.7 18.6 17.7 18.5

67
Figure 36. Comparison of the Hexagonal lattice parameters and the corresponding carbon
concentration utilizing multiple linear regression fits of the Aselage data13. Fit 1, : SG-
010813 (Superior Graphite),: ST-HD20 (H.C.Starck), : ATD-2012-6-41 (Ceradyne
Inc.). Fit 2, : SG-010813 (Superior Graphite),: ST-HD20 (H.C.Starck), : ATD-
2012-6-41 (Ceradyne Inc.).

68
Table 16. Summary of average carbon concentration and the corresponding stoichiometry
obtained from lattice parameter – stoichiometry relationships.
Powder # Powder Company Average Carbon
Concentration (at%) Chemistry
SG-010813 Superior Graphite 19.4 B4.15C
ST-HD20 H.C.Starck 18.8 B4.32C
ATD-2012-6-41 Ceradyne Inc. 18.1 B4.52C
associated with the lattice parameter-stoichiometry relationship. Previously developed
methodologies provide an estimation of the stoichiometry of unknown samples, but these
results exhibited large deviations and disagreement depending on the method used to
evaluate the final stoichiometry. Therefore, there is a need for the development of improved
testing techniques, especially for the free carbon determination as this method provides the
largest source of error. Furthermore, the true relationship of the lattice parameters and the
carbon concentration needs to be investigated and effectively correlated to the final B:C
ratio.
3.3.6 Raman Analysis
The Raman spectra of boron carbides are characterized by a combination of narrow
and broad Raman bands extending from 200 to 1200 cm-1 (Figure 37). In literature, there
are conflicting allocations of the Raman peaks to vibrations of the principal structural
elements of boron carbide i.e. icosahedra and three-atom chain100, 101, 102, 103, 104. But the
general consensus is bands extending from 600 to 1200 cm-1 are attributed to vibrations
caused in the icosahedral units. The B11C icosahedra experiences anisotropy as a result of

69
Figure 37. Characteristic Raman spectra from boron carbide powder produced by Ceradyne Inc (red lines). Individual bands
used in the curve fitting procedure are shown in green, and the simulated spectrum in blue.

70
the distribution of carbon atoms between the icosahedral sites. This results in broadening
of icosahedral vibrational bands of boron carbides105. The narrow peak at ~480 cm-1 was
assigned to the vibrations of C-B-C chains. As the C-B-C chains bond to the equatorial
boron sites (Figure 38), these three-atom chains have similar chain-icosahedral bonding
and orientational symmetry. The 520 cm-1 band was linked to the icosahedral libration
mode. The occurrence of the two broad bands at ~300 cm-1 has not been completely
understood. Werheit et al. studied carbon isotope and carbon content dependencies of
boron carbide using a 1070 nm laser104, 106, 107, 108. At these wavelengths, similar bands are
observed at 300 cm-1 which were attributed to librational modes in C-B-B and C-B-C
chains. From first-principle calculations of Vast et al, these features were linked to
disorder-activated acoustic phonons109, 110. But this may not be the case as similar bands
are seen in single crystal and hot pressed boron carbide samples.
Figure 38. Structure of boron carbide at 20 at% carbon showing C-B-C chains and the
B11C icosahedra with the carbon atom at the polar sites105.

71
Raman spectra were acquired from different locations on commercial boron carbide
samples manufactured by Ceradyne Inc. The Raman spectra from different locations were
statistically treated based on the peak center, width, height, area, low edge and high edge
to obtain the most representative spectrum for the commercial powders. The results of the
peak parameters for the most representative mean peak position of a selected Ceradyne
powder is provided in Table 17 and Table 18. Similar analysis was performed on other
samples based on peak areas, peak half-widths and peak shapes. Similar observations to
the characteristic Raman spectrum in Figure 37 were made in the current study, as
evidenced by the representative Raman spectra for commercial boron carbide powders
shown in Figure 39. However, due to the presence of free carbon in commercial powders,
characteristic D (~1360 cm-1) and G (~1580 cm-1) bands for amorphous/graphitic carbon
were observed. The D band arises from breathing vibrations of sixfold aromatic rings in
finite graphitic domains6. The D band is formed as a result of the formation of an electron-
hole pair caused by laser excitation followed by one-phonon emission6. The G band is a
direct consequence of in-plane stretching vibration of C=C bonds. Depending on the
intensity of the D band with respect to G, an inversely proportional relationship exists with
the size of the graphite particles as shown below6, 111, 112:
I(D)
I(G)= (
C(λ)
L)
1/2 L<20 Å (20)
I(D)
I(G)=
C(λ)
L L>20 Å (21)
Here, C(λ) depends on the wavelength of the laser, and L is the diameter of the sp2 domain.

72
Table 17. Raman peak positions for selected locations on a commercial boron carbide
sample ATD-2012-6-41 produced by Ceradyne Inc.
Location Peak 1
(cm-1)
Peak 2
(cm-1)
Peak 3
(cm-1)
Peak 4
(cm-1)
Peak 5
(cm-1)
Peak 6
(cm-1)
Peak 7
(cm-1)
1 273.8 321.5 470.7 522.6 1060.3 1329.0 1565.1
2 256.4 324.9 471.6 521.8 1063.7 1345.3 1585.0
3 271 324.7 470.6 521.6 1063.1 1319.6 1580.1
4 267.5 316.9 470.4 522.1 1063.9 1312.7 1586.9
5 253.5 321.4 470.9 523.1 1066.8 1338.1 1584.5
6 255.3 327.3 470.8 522.5 1065.8 1329.4 1573.6
7 260.1 314.5 471.7 522.5 1064.7 1332.7 1567.2
8 269.2 315.5 470.0 521.9 1063.4 1324.7 1585.3
9 273.2 309.0 470.9 521.6 1060.7 1334.5 1585.3
Table 18. Summary of Raman peak parameters of the typical boron carbide sample ATD-
2012-6-41 produced by Ceradyne Inc.
Peak Center
(cm-1)
Height
(Counts)
Width
(cm-1)
Area
(Counts)2
Absolute
Intensity
(Counts)2
Low Edge
(cm-1)
High
Edge
(cm-1)
1 260.11 - - - 0.17 - -
2 314.55 0.04 23.22 18.84 0.16 288.45 378.54
3 471.76 0.22 11.47 8.61 0.33 460.73 489.63
4 522.58 0.13 11.10 4.79 0.21 511.65 531.92
5 1064.72 - - - 0.42 - -
6 1332.72 0.03 2.80 7.02 0.61 1326.41 1329.43
7 1567.26 0.47 22.86 58.86 0.99 1535.94 1585.51

73
Figure 39. Characteristic Raman spectra of commercial boron carbide powders. The
bands below 1200 cm-1 originate from vibrations in boron carbide, whereas bands above
1200 cm-1 are attributed to amorphous/graphitic carbon.
An alternate explanation for the occurrence of the band near 1580 cm-1 was
provided by Kuhlmann et al.101, 113. It was suggested that the peak near 1580 cm-1 was
linked to the replacement of C-B-C chains by B-B-C chains because of the activation of
the stretching vibrations of boron carbide. As the carbon concentration in boron carbide
decreases, downshift of the peak at 530 cm-1 was observed (Figure 40). Conversely, the
band at 485 cm-1 shifts towards higher frequencies with the decrease in the carbon
concentration. Based on the results by Domnich et al.114, the separation between the 485
cm-1 and the 530 cm-1 Raman bands was used for the determination of the boron carbide
stoichiometry of the three commercial powders manufactured by Ceradyne, H.C.Starck

74
10 12 14 16 18 20
480
485
490
525
530
535
514 nm
633 nm
780 nm
Ram
an b
an
d p
ositio
n (
cm
-1)
% C
Figure 40. Dependence of the narrow bands centered at 500 cm-1 on the carbon
concentration (at%)
and Superior Graphite as shown in Table 19. The stoichiometric results from the calibration
curves served as another indicator of the disagreement in the stoichiometry of boron
carbide using different methodologies. This calibration curve was constructed using
minimal data points which contributes to the error in analysis. For a precise determination
of the stoichiometry of boron carbide, further data points will need to be investigated to
understand the nature of the calibration curve. This curve will be further refined and
discussed in Section 5.
Table 19. Summary of the stoichiometry of boron carbide from the difference in the peak
positions of the Raman bands.
Powder # Powder
Company
Difference
between 480 cm-1
and 530 cm-1
Raman Bands
Carbon
Concentration
(at%)
Stoichiometry
SG-010813 Superior
Graphite 52.5 18.2 B4.5C
ST-HD20 H.C.Starck 52.8 18.7 B4.3C
ATD-2012-6-41 Ceradyne
Inc. 51.2 16.6 B5.0C

75
3.3.7 Database of Commercial Boron Carbide Powders and Ceramics
Additional commercial powders were acquired from different boron carbide manufacturers
and the techniques discussed above were employed to evaluate variability in commercial
boron carbide powders and consolidated ceramics. These results provided insights into the
type of materials manufactured by different companies and the particular stoichiometry of
the specimens. This database also serves as a reference point for any information needed
regarding powder and ceramic characteristics within the Materials for Extreme Dynamic
Environments (MEDE) program (Collaborative program involving John’s Hopkins
University (JHU), Army Research Laboratory (ARL), California Institute of Technology
(CALTECH) and Rutgers University (RU)). Furthermore, depending on the chemical and
structural properties of different commercially manufactured ceramics, particular
specimens can be chosen as a baseline for impact fragmentation and ballistic tests. Table
20 shows an excerpt from the database that was developed. In addition to the phase
identification, lattice parameters and stoichiometric measurements, the XRD patterns and
Raman spectra were also provided for different powders in the event future analysis needs
to be conducted on these specimens.

76
Table 20. Summary of developed database detailing commercial powder and ceramic properties.
Sample # Powder
Company
Total
carbon
from
chemical
analysis
(wt%)
Phase analysis
from XRD (wt.%) Lattice parameters
Carbon
content
based
on c/a
(at.%)
Carbon
content
based
on a
(at.%)
Carbon
content
based
on c
(at.%)
Carbon
content
from
Raman
analysis
(at.%) B4-xC C
(Graphite) a (Å) c (Å)
c/a
ratio
ATD-
2011-8-58
Ceradyne
Inc. 21.3 94.8 5.2 5.6091 12.092 2.1558 20.0 17.2 18.4 17.3
ATD-
2011-6-20
Ceradyne
Inc. 21.3 95.9 4.1 5.6068 12.0866 2.1557 20.1 17.8 18.8 19.0
UK-Reg Uk
Abrasives 21.8 90.0 10.0 5.5985 12.0661 2.1552 20.2 19.4 20.1 -
VJ-15 Vajrabor 18.6 99.4 0.4 5.619 12.119 2.1568 14.6 18.4 19.4 -
ESK-Proc ESK - 99.0 <0.1 5.606 12.096 2.1577 18.0 17.1 18.2 -
BCSF-10 Rutgers
University - 99.8 0.2 5.6035 12.089 2.1574 18.7 18.7 18.6 -
Cer-4-144 Ceradyne
Inc. 13.7 99.5 0.5 5.5999 12.0832 2.1578 19.6 19.4 19.0 18.4

77
3.4 Summary
In this objective, currently used analytical techniques have been examined to assess
the inaccuracies associated with the determination of the boron carbide stoichiometry.
Current PDF cards cannot be employed exclusively to estimate the final B:C ratio,
primarily because of inconsistensies in experimental techniques and earlier misconceptions
that boron carbide existed at a stoichiometry of B4C or B6.5C rather than a wide
homogeneity range. Boron carbide powders manufactured commercially and at Rutgers
University typically show the presence of a two phase material of boron carbide and free
carbon. The stoichiometric measurements indicate the largest error associated with the
determination of the B:C ratio, arises from the method employed for free carbon evaluation.
Other techniques such as Raman spectroscopy and lattice parameter calibration curves
were used in conjunction with chemical analysis to supplement the stoichiometric results.
But these results were not commensurate with each other. A comparative study of
numerous boron carbide powders and consolidated ceramics was also conducted to
ascertain the typical characteristics of commercially available powders and ceramics.
Various factors affecting the final stoichiometric results have also been discussed and a
better understanding of the analytical and chemical techniques employed to determine the
stoichiometry of boron carbide has been gleaned. Based on the observations in this section,
the free carbon methodology requires refinement and improved lattice parameter and
Raman calibration curves need to be developed. These improved methodologies would
provide further insight into the structural and mechanical variations at different
stoichiometries.

78
4 Development of an Improved Methodology for Free Carbon Analysis
4.1 Introduction
In boron carbide powders and ceramics, carbon may be present either as bound to
boron or free carbon. Quantitative determination of the free carbon content presents a
difficult problem in analytical chemistry of non-metallic hard materials. The free carbon in
boron carbide is very difficult to determine due to its low atomic number and similarities
in chemical properties to boron carbide. As discussed in the previous section, the
experimental uncertainties involved in the determination of the total boron, carbon, oxygen
and nitrogen are negligible as compared to the accuracy of the methodology used to
evaluate the free carbon content. This objective aims at developing an improved technique
for accurate free carbon measurements. Over the years, different methods have been
proposed to assess the free carbon levels; combustion methods, wet chemical oxidation,
Reitveld refinement and Spiking technique.
The combustion method developed by Alizadeh et al.115 determine the free carbon
by heating the boron carbide at 700°C in air for 30 minutes. The free carbon is then obtained
by measuring the weight of the sample before and after heat treatment and subsequent
washing to remove B2O3. Two major assumptions are made in the combustion method;
free carbon and part of the boron carbide are oxidized during the initial heat treatment and
washing in hot water removes the oxidized part of the boron carbide i.e. B2O3. Certainly,
these assumptions may be partially true for certain boron carbide powders. But studying
the oxidation behavior of boron carbide undermines the assumptions made by Alizadeh et
al. Oxidation of boron carbide in an air water system leads to an initial weight gain due to
the formation of boric acid. This is followed by a weight loss as the boron oxide formation
79
supersedes the boric acid formation. This phenomenon is appropriately evidenced in Figure
15. Hence, the initial oxidation of boron carbide will result in the formation of boron oxide
as stated by Alizadeh, but this will also be accompanied by boric acid formation. The next
step in the analysis involves washing the oxidized material with hot water to remove boron
oxide. But this will leave behind residual boric acid as boric acid is only leached by nitric
acid. This means the results of the free carbon finally obtained will be underestimated. The
oxidation behavior in literature also suggests that the oxidation of the free carbon, boron
carbide and boric acid is highly dependent on the particle size of the powder and would
lead to inconsistent data depending on the particle size of the boron carbide powders63, 64.
The wet chemical oxidation method developed by Schwetz et al.116 is commonly used in
analytical laboratories and research companies across the world. Hence, assessing the
pitfalls and inaccuracies of this method becomes very critical. In the wet chemical method,
boron carbide is subjected to heat treatment along with a chromic-iodic-sulphuric acid
mixture. The CO2 concentration versus time graph is plotted and the free carbon is obtained
by graphical extrapolation. But the wet chemical oxidation method, similarly to the
combustion method, is highly dependent on the particle size and morphology of the powder
as will be discussed in Section 4.3.2.
As mentioned above, due to the similar chemical properties of carbon and boron
carbide, it becomes evident that the free carbon has to be determined using a non-
destructive x-ray method. Rietveld refinement was used to assess the free carbon
concentration, but the accuracy of this method is compromised in the presence of
amorphous materials. Another technique known as the Spiking technique117 proves to be
the most promising method. This method was developed by Beauvy117 in the 1980’s and

80
can be used to determine the free carbon less than 10% in a crystal matrix from the ratio
of the intensities of the two diffraction lines corresponding to free carbon and boron
carbide. There is a proportionality relationship between this ratio and the quantities of the
two components when: (1) the phases are uniformly distributed; (2) grains are randomly
oriented; (3) good X-ray diffraction lines are observed117. These conditions were fulfilled
using the XRD parameters detailed in Section 3.2.1 which result in XRD scans with
significantly high resolution and random particle orientation. In the method developed by
Beauvy, boron carbide powders were mixed with various amounts of graphite powder and
the resulting specimens of mixed powders were analyzed by XRD to evaluate the ratio of
intensities between diffraction lines of graphite (102) and boron carbide (111) as illustrated
in Figure 41117. A linear relationship exists between the amount of added graphite and the
relative intensity of the diffraction lines up to about 4 wt% added graphite. The free carbon
concentration is then obtained by graphical extrapolation on the negative y axis. Particle
size effect on the free carbon content was also investigated by Beauvy. The major
advantage of the Spiking technique is its independence on the particle size of the boron
carbide (Figure 42) and its ability to detect small quantities of graphite owing to the
penetration of X-rays. But a major drawback with the Spiking technique is that the correct
amount of free carbon can only be calculated if it is present as graphite. This condition is
normally satisfied in boron carbide owing to the high synthesis temperatures involved
which completely crystallize carbon to graphite. These synthesis methods include
carbothermal reduction using an electric arc furnace and Acheson type process where
boron carbide powders are synthesized at temperatures >2200°C. When other synthesis

81
Figure 41. Determination of the free-graphite content in various boron carbide powders
by the spiking technique117.
Figure 42. Effect of particle size distribution of boron carbide on the free carbon content
calculated using the Spiking technique117.
82
methods such as magnesiothermal reduction and rapid carbothermal reduction are used,
the temperatures involved are much lower. This may lead to the development of partially
crystallized carbon which cannot be correctly evaluated using the Spiking technique
developed by Beauvy et al.117. In order to address this shortcoming and owing to the
promising nature of the Spiking technique, an improved method known as the Modified
Spiking technique has been developed in the course of this work to ensure its applicability
to different forms of carbon. For this objective, three powders with a wide variability in
particle size and free carbon were chosen for analysis i.e. ST-HD20 (H.C.Starck), ATD-
2012-6-41 (Ceradyne) and SG-010813 (Superior Graphite). A reference boron carbide
powder (ED 102) manufactured by ESK was also used to test the validity of the developed
characterization techniques.
4.2 Experimental Procedure
4.2.1 Free Carbon Analysis
Amorphous carbon (Carbon Lampblack, Fisher Scientific) was heat treated in air at
varying temperatures to study the effect of temperature on its crystallization behavior. The
free carbon analysis on the samples was then conducted using the modified spiking
technique. In this method, graphite from Industrial Graphite Sales (USA) ranging from
0.01 g to 0.07 g was added to 2 g of commercial boron carbide powders. A mechanical
mixture was then developed using a high energy Spex Sample Prep Mixer/The Mill®
(8000M) and run for 30 min (Figure 43) to develop a uniform mixture of the two
components. Alumina grinding media was initially utilized to obtain a uniform particle size
distribution of the mixture and ensure a homogenous mix of carbon and boron carbide. But,

83
Figure 43. Spex mill used to develop mechanical mixtures of carbon and boron carbide.
preliminary XRD patterns revealed the presence of alumina contaminants as shown in
(Figure 44 and Figure 45). Further, the positions of the alumina peaks overlapped with
those of free carbon affecting the intensity of the free carbon peaks and deconvolution of
the 100% intensity (002) carbon peak located at 2θ of ~26.6°. The material used as the
grinding media should be chosen such that its XRD pattern does not overlap with that of
free carbon. Consequently, subsequent mixtures of boron carbide and graphite were mixed
using spherical zirconia media. X-ray diffraction was performed on the resultant carbon-
boron carbide mixtures using similar sample preparation techniques and conditions
discussed in Section 3.2.1. A graph with the ratio of the relative intensity of the (021) (2θ
= ~37.5°) boron carbide and (002) (2θ = 24.5° - 26.6°) carbon peak was plotted against the
percentage of added graphite. The value of the free carbon content in the resultant powder
was determined by graphical extrapolation onto the negative y axis. Due to the varying
forms of carbon that can be present, evaluation of the “true” intensity of the 002 carbon
peak was very challenging. In order to clearly distinguish between the various forms of
free carbon that contribute to the intensity of the major 002 carbon peak, the XRD patterns

84
Figure 44. XRD pattern of the ST-HD20 boron carbide powder doped with varying
quantities of carbon and mixed with alumina media.
Figure 45. XRD pattern of the ST-HD20 boron carbide powder doped with varying
quantities of carbon and mixed with alumina media showing alumina contamination and
overlap of the alumina peaks with the 002 carbon peak.
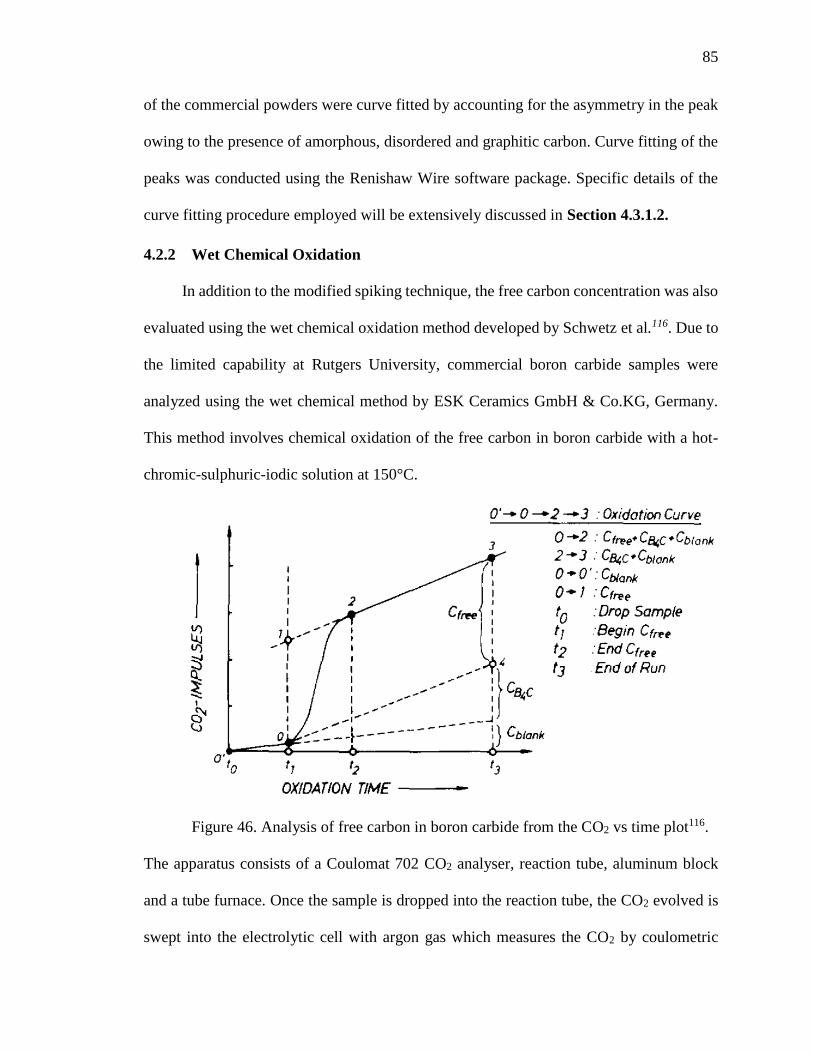
85
of the commercial powders were curve fitted by accounting for the asymmetry in the peak
owing to the presence of amorphous, disordered and graphitic carbon. Curve fitting of the
peaks was conducted using the Renishaw Wire software package. Specific details of the
curve fitting procedure employed will be extensively discussed in Section 4.3.1.2.
4.2.2 Wet Chemical Oxidation
In addition to the modified spiking technique, the free carbon concentration was also
evaluated using the wet chemical oxidation method developed by Schwetz et al.116. Due to
the limited capability at Rutgers University, commercial boron carbide samples were
analyzed using the wet chemical method by ESK Ceramics GmbH & Co.KG, Germany.
This method involves chemical oxidation of the free carbon in boron carbide with a hot-
chromic-sulphuric-iodic solution at 150°C.
Figure 46. Analysis of free carbon in boron carbide from the CO2 vs time plot116.
The apparatus consists of a Coulomat 702 CO2 analyser, reaction tube, aluminum block
and a tube furnace. Once the sample is dropped into the reaction tube, the CO2 evolved is
swept into the electrolytic cell with argon gas which measures the CO2 by coulometric

86
titration. The wet chemical method makes use of the rate of oxidation of free carbon and
carbon bound to the boron carbide crystal structure as well as the fact that the oxidation
rate of bound carbon is not a function of the reaction time. The oxidation of the free and
bound carbon in boron carbide is monitored based on the concentration of the carbon
dioxide formed. The free carbon concentration is then calculated from the CO2
concentration vs time plot by graphical extrapolation. The oxidation reaction takes place
in two stages as depicted in Figure 46. In the first stage (curve between points 0 and 2),
only the free carbon reacts and a small quantity of combined carbon. The second stage
(straight line between points 2 and 3) involves the incomplete oxidation of boron
carbide116. The free carbon concentration is then calculated using the equation below:
Corrected Impulses X 2
Sample Weight X 100= % Free Carbon (22)
4.3 Results and Discussion
4.3.1 Modified Spiking Technique
4.3.1.1 Heat Treatment of Amorphous Carbon
Carbon in its primary form can exist as either amorphous, disordered (turbostratic)
or graphite. Amorphous carbon and graphite are composed of essentially parallel planes,
with each layer consisting of a number of benzene rings118. Graphite has a layered structure
with an interplanar spacing of 3.35 Å where each layer is systematically oriented about the
layer normal119. Each carbon atom in a layer is bonded to 3 neighboring carbon atoms at
1.42 Å to form a two dimensional hexagonal net as shown in Figure 47. Half the atoms lie
directly over atoms in the previous layer and the other half are over the centers of the
hexagons. Amorphous carbon on the other hand consists of stacked layer planes that are

87
Figure 47. Structure of graphite119
randomly oriented about the layer normal. The spacing of the layers is larger than that of
graphite and dimensions of the parallel layer groups are called Lc and La and have values
of the order of 12 Å and 20 Å respectively119. Intermediate carbon shows a degree of three
dimensional ordering and is referred to as disordered carbon or turbostratic carbon.
Turbostratic carbon is regarded as a variant of graphite. Both graphite and turbostratic
carbon are stacked up with layers with the main difference being the different ordering
degrees. Typical powder diffraction patterns of carbon lampblack and heat treated carbon
lampblack are shown in Figure 48. Carbon lampblack typically consists of graphite layers
which are parallel to each other, but are randomly oriented about the normal119. The XRD
pattern of carbon exhibits a high background and weak intensity with a (002) and (hk) peak.
This indicated the carbon lampblack is amorphous in nature. The diffraction profile of
amorphous carbon shows the occurrence of a highly asymmetric (002) peak at ~24.5° 2θ.
Within this asymmetric carbon peak, existence of another band to the left could be present.
In the literature, this band is called the ɤ band and is attributed to the presence of saturated
structures such as aliphatic side chains120, 121, 122. But these bands are typically present in
coals and were not considered during curve fitting. As the carbon lampblack was heat
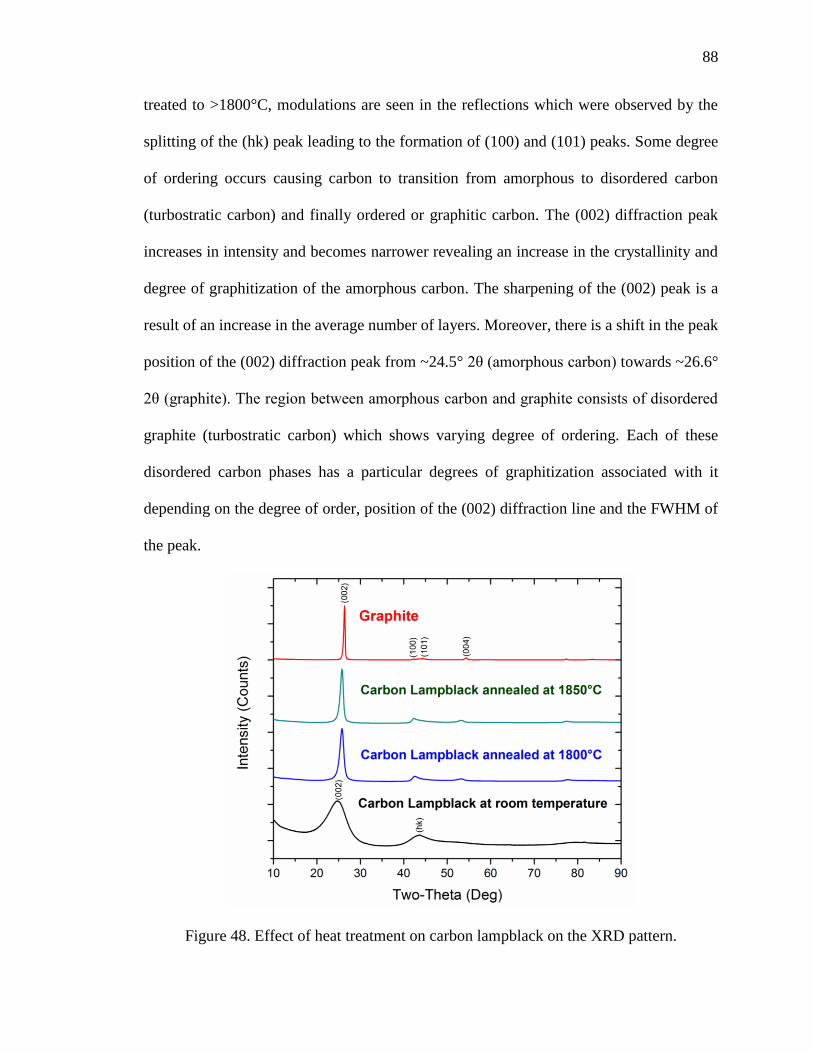
88
treated to >1800°C, modulations are seen in the reflections which were observed by the
splitting of the (hk) peak leading to the formation of (100) and (101) peaks. Some degree
of ordering occurs causing carbon to transition from amorphous to disordered carbon
(turbostratic carbon) and finally ordered or graphitic carbon. The (002) diffraction peak
increases in intensity and becomes narrower revealing an increase in the crystallinity and
degree of graphitization of the amorphous carbon. The sharpening of the (002) peak is a
result of an increase in the average number of layers. Moreover, there is a shift in the peak
position of the (002) diffraction peak from ~24.5° 2θ (amorphous carbon) towards ~26.6°
2θ (graphite). The region between amorphous carbon and graphite consists of disordered
graphite (turbostratic carbon) which shows varying degree of ordering. Each of these
disordered carbon phases has a particular degrees of graphitization associated with it
depending on the degree of order, position of the (002) diffraction line and the FWHM of
the peak.
Figure 48. Effect of heat treatment on carbon lampblack on the XRD pattern.
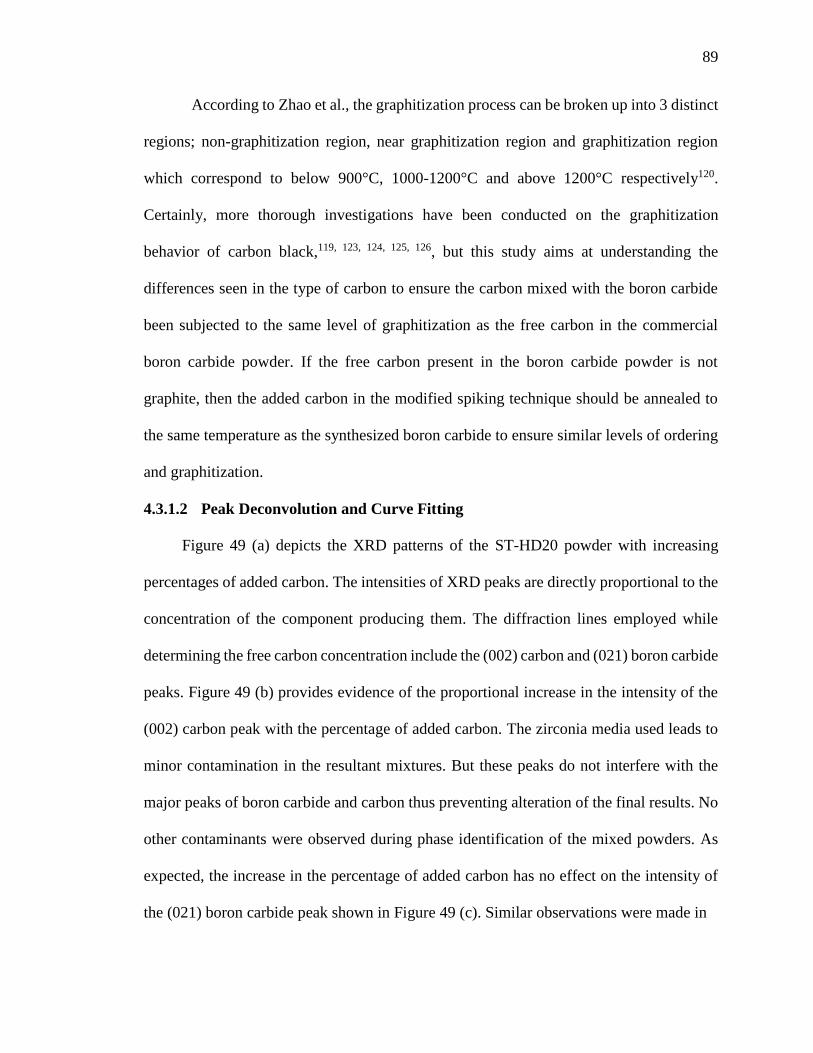
89
According to Zhao et al., the graphitization process can be broken up into 3 distinct
regions; non-graphitization region, near graphitization region and graphitization region
which correspond to below 900°C, 1000-1200°C and above 1200°C respectively120.
Certainly, more thorough investigations have been conducted on the graphitization
behavior of carbon black,119, 123, 124, 125, 126, but this study aims at understanding the
differences seen in the type of carbon to ensure the carbon mixed with the boron carbide
been subjected to the same level of graphitization as the free carbon in the commercial
boron carbide powder. If the free carbon present in the boron carbide powder is not
graphite, then the added carbon in the modified spiking technique should be annealed to
the same temperature as the synthesized boron carbide to ensure similar levels of ordering
and graphitization.
4.3.1.2 Peak Deconvolution and Curve Fitting
Figure 49 (a) depicts the XRD patterns of the ST-HD20 powder with increasing
percentages of added carbon. The intensities of XRD peaks are directly proportional to the
concentration of the component producing them. The diffraction lines employed while
determining the free carbon concentration include the (002) carbon and (021) boron carbide
peaks. Figure 49 (b) provides evidence of the proportional increase in the intensity of the
(002) carbon peak with the percentage of added carbon. The zirconia media used leads to
minor contamination in the resultant mixtures. But these peaks do not interfere with the
major peaks of boron carbide and carbon thus preventing alteration of the final results. No
other contaminants were observed during phase identification of the mixed powders. As
expected, the increase in the percentage of added carbon has no effect on the intensity of
the (021) boron carbide peak shown in Figure 49 (c). Similar observations were made in

90
Figure 49. (a) XRD patterns of ST-HD20 boron carbide powder mixed with varying quantities of added carbon. (b) Variation
of the intensity of the (002) carbon peak with the increase in the added carbon. (c) Variation in the intensity of the (021) boron
carbide peak with the increase in the added carbon.

91
the SG-010813 and ATD-2012-6-41 boron carbide-carbon mixtures. Characteristically, the
accuracy of the method for measuring the diffraction intensities is dependent on the number
of counts at the required angles. As the counts obtained in these mixtures range from 250K-
500K, the accuracy of quantitative analysis is reduced to 1%127. While measuring the
intensity of these peaks for free carbon analysis, the integrated peak area is preferred to the
maximum intensity as the presence of microstrain or grain size effects in the specimen may
lead to significant deviations in the line shape128. Diffraction lines can also suffer from
peak broadening because of small particle size which will influence the line intensity. The
integrated area is estimated by measuring the area enclosed by the peak and the
background. Accurate assessment of the peak area is key in reducing the error associated
with the determination of the free carbon values and eventually the final B:C ratio. As
mentioned earlier, the type of carbon present affects the peak profile of the carbon peaks,
particularly the symmetric or asymmetric nature of the (002) carbon diffraction line. To
account for the asymmetry in the peak shape of the (002) carbon diffraction peak based on
the amorphous, disordered and graphitic nature of carbon, data analysis was conducted
using curve fitting algorithms available in the Renishaw Wire software package. This
technique is known as the peak separation method and is used to process assymmetrical
profiles. Care must be taken to ensure the superimposed profile is close to the original one.
Powder Diffraction Files (PDF) were used to ascertain the theoretical peak positions of
highly amorphous and graphitic carbon as shown in Table 21.

92
Table 21. Theoretical peak positions and corresponding d-spacing of the amorphous and
graphitic carbon used for curve fitting of the 002 carbon peak in the modified spiking
technique.
The region between these two peaks was fitted with disordered carbon peaks with
each peak having a particular degree of graphitization. The interlayer spacing d(002) and the
corresponding 2θ for these disordered carbon peaks can be calculated from the model
proposed by Maire and Mering using the following equation130, 131, 132:
Degree of Graphitization (%) =d(amorphous carbon) − d(002)
d(amorphous carbon) − d(Graphite)
(23)
Here, d(Amorphous) = Interlayer spacing of amorphous carbon
d(Graphite) = Interlayer spacing of graphite
d(002) = Interlayer spacing of particular graphitized peak.
Table 22 details the degree of graphitization, d-spacing and 2θ values of the curves
used to fit the asymmetry of the carbon peak. In total, 25 peaks were used during the curve
fitting process. The increments in the peaks used near the graphite peak were decreased to
improve the fit near the maximum intensity peak. Initial observations showed that an
improved fit near the maximum intensity peak, lead to a decrease in the least squared error
during curve fitting. While a finite number of peaks were used during curve fitting, a
continuous disorder exists between amorphous and graphitic carbon which can only be
Type of Carbon 2θ (°) d-spacing (Å)
Amorphous Carbon 24.266 3.665
Graphitic129 26.611 3.347

93
quantified using an appropriate theoretical model, development of which is beyond the
scope of the present work.
Table 22. Summary of the correlation between degree of graphitization and the
corresponding2θ value.
The major 002 carbon peak was deconvoluted and curve fitted based on the
amorphous, disordered and graphitic nature of carbon. Amorphous carbon and graphitic
carbon were fixed at 24.5° 2θ and 26.6° 2θ which are the theoretical positions of amorphous
and graphitic carbon respectively. Minimization of the normalized value of the difference
between the experimental and derived patterns was paramount during the curve fitting
Degree Of Graphitization
% d-spacing (Å) 2θ (°)
0 3.665 24.27
5 3.649 24.37
10 3.633 24.48
15 3.617 24.59
20 3.601 24.70
25 3.586 24.81
30 3.570 24.92
35 3.554 25.04
40 3.538 25.15
45 3.522 25.27
50 3.506 25.38
55 3.490 25.50
60 3.474 25.62
65 3.458 25.74
70 3.442 25.86
75 3.427 25.98
80 3.411 26.11
82.5 3.403 26.17
85 3.395 26.23
87.5 3.387 26.29
90 3.379 26.36
92.5 3.371 26.42
95 3.363 26.48
97.5 3.355 26.55
100.0 3.347 26.61

94
process. From Figure 50, it is evident that the carbon present in the H.C. Starck powder is
predominantly disordered owing to the asymmetric nature of the 002 carbon diffraction
peak. In addition to disordered carbon (5-97.5% graphitization), minor quantities of pure
graphite and amorphous carbon are also present. Conversely, the 021 boron carbide peak
exhibited symmetry and only a single symmetric peak was employed during curve fitting.
The experimental and derived patterns in both cases showed good agreement with each
other. All the peaks used in the deconvolution process contribute to the total intensity of
the derived pattern. This intensity was calculated as a summation of the profiles used to fit
the asymmetry of the 002 carbon diffraction profile. The peaks used during the curve fitting
process were assigned specific peak positions as depicted in Table 22 and constraints of ±
0.1° were defined to prevent the peaks from deviating significantly from their allocated
peak positions. Curve fitting using the Renishaw Wire software was done using the
Levenberg-Marquardt method which is typically used to solve nonlinear least square
problems133.
The 002 carbon peak in ATD-2012-6-41 was resolved into predominantly graphitic
and partially disordered carbon peaks as illustrated in Figure 51. No presence of amorphous
carbon was observed. Furthermore, the disordered carbon peaks with a degree of
graphitization ranging from 5-55% were virtually non-existent providing evidence of the
dissimilarity in the overall nature of carbon as compared to the ST-HD20 specimen. The
major carbon peak in the Ceradyne sample showed the presence of a Kα2 peak caused by
Kα2 radiation which is an artifact of the XRD instrumentation. This peak contributed to the
overall intensity of the major carbon diffraction profile and was disregarded while
calculating the integrated intensity of the deconvoluted peaks. The curve fitting results
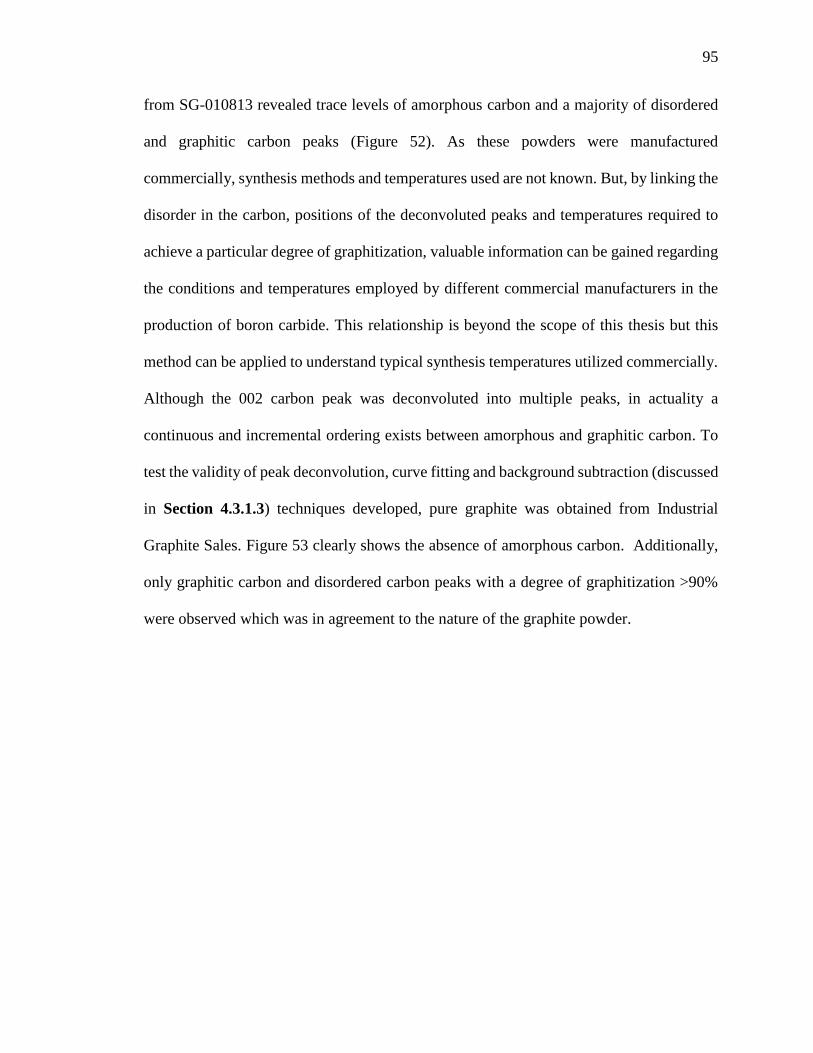
95
from SG-010813 revealed trace levels of amorphous carbon and a majority of disordered
and graphitic carbon peaks (Figure 52). As these powders were manufactured
commercially, synthesis methods and temperatures used are not known. But, by linking the
disorder in the carbon, positions of the deconvoluted peaks and temperatures required to
achieve a particular degree of graphitization, valuable information can be gained regarding
the conditions and temperatures employed by different commercial manufacturers in the
production of boron carbide. This relationship is beyond the scope of this thesis but this
method can be applied to understand typical synthesis temperatures utilized commercially.
Although the 002 carbon peak was deconvoluted into multiple peaks, in actuality a
continuous and incremental ordering exists between amorphous and graphitic carbon. To
test the validity of peak deconvolution, curve fitting and background subtraction (discussed
in Section 4.3.1.3) techniques developed, pure graphite was obtained from Industrial
Graphite Sales. Figure 53 clearly shows the absence of amorphous carbon. Additionally,
only graphitic carbon and disordered carbon peaks with a degree of graphitization >90%
were observed which was in agreement to the nature of the graphite powder.

96
Figure 50. Curve fitting of the 002 carbon and 021 boron carbide peaks of the XRD
pattern of the ST-HD20 powder with 0.5% added carbon.
Figure 51. Curve fitting of the 002 carbon and 021 boron carbide peaks of the XRD
pattern of the ATD-2012-6-41 powder 0.5% added carbon.

97
Figure 52. Curve fitting of the 002 carbon and 021 boron carbide peaks of the XRD
pattern of the SG-010813 powder 0.5% added carbon.
Figure 53. Curve fitting of the 002 carbon peak in pure graphite from Industrial Graphite
Sales.

98
4.3.1.3 Background Subtraction
The level of the background is the most uncertain factor in the calculation of the
integrated intensity of the diffraction peaks. The background can either be estimated by
linear interpolation between selected points, between peaks, or modelled using an empirical
function. For a relatively simple pattern where the peaks can be easily resolved, both
methods work well. But for complex patterns like that of boron carbide, which have a large
degree of overlap, the estimation of the background becomes critical. Minor variations in
the subtraction of the background lead to large differences in the ratio of the relative
intensities of carbon and boron carbide and eventually the free carbon values. Hence the
approach used for background subtraction becomes vital. Polynomial functions used for
background subtraction are empirical in nature 88. Polynomial functions would work well
only if they correctly describe the background, but this is very rarely achieved in complex
patterns. After considering these factors, the background was subtracted using linear
interpolation. But this method is highly dependent on the user’s interpretation of the peak
overlap and deconvolution of peaks, and thus requires some level of judgement on the part
of the operator. Figure 54 illustrates the background subtraction from an XRD pattern with
the use of a cubic spline curve which is the most common methodology for background
subtraction in XRD analytical work. Here, two different curves are used for background
subtraction. Depending on the user’s interpretation of the tail of the 002 carbon peak and
its overlap region with neighboring peaks, different integrated peak areas were calculated.
This discrepancy directly affected the relative intensity of the carbon and boron carbide
peaks which in turn influenced and alter the free carbon results. In lieu of the erraticity in
the results, an alternate approach was devised.

99
Figure 54.Variation in the integrated intensity/area during background subtraction using a
cubic spline curve
Figure 55. Linear approximation during background removal.

100
The background curve is approximated to be linear from ~18.5° 2θ to ~ 29.6° 2θ and ~30°
2θ to ~ 43.4° 2θ as depicted in Figure 55. It was assumed that the individual diffraction
peaks have a profile of a tailed triangle and each peak has an approximately linear function.
This methodology proved to give accurate results and minimized the dependence of
background subtraction on the user. A similar approach has been used in literature to model
the background of individual peaks134, 135.
4.3.1.4 Free Carbon Analysis
After curve fitting and background subtraction was completed, the integrated
intensity of the 002 carbon peak was calculated as a summation of the deconvoluted peaks
based on the amorphous, disordered and graphitic nature of carbon. The graph of the
relative intensities of the 002 carbon and 021 boron carbide peaks to the percent of added
carbon shows a linear relationship. Through graphical extrapolation of this linear
relationship onto the negative y axis, the free carbon content is calculated in the original
boron carbide powder as shown in Figure 56, Figure 57 and Figure 58. The free carbon
contents of the three powders discussed in this section are provided in Table 23. A total of
3 separate mixtures at each composition were prepared and subsequent curve fitting was
conducted to evaluate the standard deviations and the error associated with the modified
spiking technique. These standard deviations ranged from ~4% - ~8%.
Table 23. Comparison of the free carbon values of boron carbide powders obtained using
the modified spiking technique
Sample # Sample Company Free Carbon (wt%) Standard Deviation
ST-HD20 H.C.Starck 0.96 ± 0.04
ATD-2012-6-41 Ceradyne Inc. 2.38 ± 0.20
SG-010813 Superior Graphite 1.83 ± 0.08

101
Figure 56. Determination of the free carbon content in the ST-HD20 powder by the
modified spiking technique. The free carbon concentration was estimated at 0.96%.
Figure 57. Determination of the free carbon content in the ATD-2012-6-41 powder by the
modified spiking technique. The free carbon concentration was estimated at 2.38%.

102
Figure 58. Determination of the free carbon content in the SG-010813 powder by the
modified spiking technique. The free carbon concentration was estimated at 1.83%.
4.3.2 Wet Chemical Oxidation
Comparison of the free carbon results using the wet chemical oxidation method and
modified spiking technique are shown in Table 24. The carbon values using the wet
chemical method in the ST-HD20 powder were almost twice the results obtained from the
modified spiking technique. However, visual examination of the XRD pattern of the ST-
HD20 powder was inconsistent with the 1.82% free carbon assessment from the wet
chemical method. This was immediately evident by evaluating the intensity ratios of the
002 carbon and 021 boron carbide peaks from Figure 59.
Overestimated free carbon values typically occurs in powders with low particle
sizes. In a submicron particle size powder, due to the increased surface area and similarity
in chemical properties of carbon and boron carbide, oxidation of boron carbide occurs

103
concurrently with that of free carbon. The wet chemical method is highly dependent on the
difference in the rate of oxidation of free carbon and carbon bound to boron carbide. But,
in superfine powders, this assumption no longer holds any validity and the free carbon
value extrapolated (Figure 46) contains significant levels of CO2 from oxidized boron
carbide, thus overestimating the final results. The results of the wet chemical analysis of
ATD-2012-6-41 powder on the other hand differed from the values obtained by the
modified spiking technique on the same sample by a factor of ~2. Visual examination of
the XRD pattern (Figure 60) and the intensity ratio of the carbon and boron carbide peak
profiles proved that the 1.25% assessment by the wet chemical method was not plausible.
SEM micrographs revealed the coarse nature of the ATD-2012-6-41 powder with
carbonaceous inclusions trapped within the boron carbide grains. These inclusions are not
completely oxidized thus leading to an underestimation of the free carbon concentration.
XRD detects these inclusions because of the increased penetration depth of the x-rays in
light elements. The free carbon in the SG-010813 sample agreed quite well with results
from the modified spiking technique as a result of the increased particle size and powder
morphology. This imposes limitations on the wet chemical oxidation method as it provided
accurate results only in specific cases.
Table 24. Comparison of the free carbon values of boron carbide powders using the modified
spiking technique and wet chemical oxidation method.
Sample # Sample Company Modified Spiking
Technique (wt%)
Wet Chemical
Oxidation (wt%)
ST-HD20 H.C.Starck 0.96 1.82
ATD-2012-6-41 Ceradyne Inc. 2.38 1.25
SG-010813 Superior Graphite 1.83 2.01

104
Figure 59. XRD pattern of the ST-HD20 powder manufactured by H.C. Starck.
Figure 60. XRD pattern of the ATD-2012-6-41 powder manufactured by Ceradyne Inc.

105
4.3.3 Stoichiometric Measurements
Utilizing the free carbon results from the modified spiking technique detailed in the
preceding sections and the values from the chemical analysis in Table 9, the stoichiometry
of the commercial powders was recalculated as shown in Table 25. The accuracy and
precision of these values has been increased as a result of an improved method to determine
the free carbon concentrations. The ST-HD20 and SG-010813 powders had stoichiometric
compositions close to that of B4C while the ATD-2012-6-41 powder was boron rich. Even
though the standard deviations associated with the stoichiometry are comparable to the
results obtained in Table 11, the accuracy and precision of these values has been increased
as a result of an improved method to determine the free carbon values.
Table 25. Summary of the stoichiometric values using the modified spiking technique
and chemical analysis.
Sample # Sample Company Stoichiometry
ST-HD20 H.C.Starck 3.88 ± 0.04
ATD-2012-6-41 Ceradyne Inc. 4.62 ± 0.07
SG-010813 Superior Graphite 4.09 ± 0.05
4.3.4 Reference Sample
A reference material (ED-102) manufactured by ESK was obtained from Germany
to test the validity of the developed characterization techniques. This powder was
extensively characterized by analytical companies and research institutes across the world
and was accepted as a European reference material. Good agreement was observed in the

106
reported and measured values of the reference sample (Table 26 and Table 27. The free
carbon concentration using the modified spiking technique was within the expected
standard deviation of ± 0.12 reported in the reference sample. Furthermore, the
stoichiometric values attained using the developed characterization techniques were
commensurate with those reported in the reference sample. These results provided further
evidence that the developed characterization techniques were accurate and precise.
Table 26. Methods used and reported values of the European Reference Material (ED-
102) produced by ESK.
Parameter
Certified
Value
(wt%)
Standard
Deviation Method
Total Carbon 21.01 ± 0.28 Combustion –Coulometric
Total Oxygen 0.10 ± 0.04 Carrier Hot Gas –Infrared Detection
Total Nitrogen 0.21 ± 0.03 Carrier Hot Gas –Thermal Conductivity
Detection
Total Boron 78.47 ± 0.31 Potentiometric
Free Carbon 0.51 ± 0.12 Wet Chemical Oxidation
Stoichiometry 4.23 ± 0.06
Table 27. Methods used and measured values of the European Reference Material (ED-
102) produced by ESK.
Parameter Measured Value Standard
Method (wt%) Deviation
Total Carbon 20.83 ± 0.07 Combustion – Infrared Detection
Total Oxygen 0.10 ± 0.01 Carrier Hot Gas –Infrared Detection
Total Nitrogen 0.24 ± 0.01 Carrier Hot Gas –Thermal Conductivity
Detection
Total Boron 78.10 ± 0.28 Potentiometric
Free Carbon 0.58 ± 0.03 Modified Spiking Technique
Stoichiometry 4.27 ± 0.02

107
4.4 Summary
In this objective, a novel method to determine the free carbon concentration has
been proposed which has shown an increased accuracy and reliability as compared to
previously used analytical techniques. The modified spiking technique can be applied to
evaluate the free carbon values in boron carbide, irrespective of the nature of the carbon
present. This technique is also applicable to boron carbide powders synthesized at low
temperatures where the amorphous carbon has not completely crystallized to graphite. This
technique overcame the drawbacks of the wet chemical method which depended on powder
morphology and particle size. Furthermore, the modified spiking technique can be used to
calculate free carbon concentrations as low as 0.1 wt% which is the detection limit of the
XRD.
Although specific peaks were employed in the modified spiking technique to
account for amorphous, disordered and graphitic carbon, in actuality, a continuous disorder
exists from amorphous carbon to graphite. Therefore, the carbon peak can be fitted with an
infinite number of disordered carbon peaks to attain the best fit. Ideally, a structural model
is required which would describe the level of disorder and integrated intensity. This would
not alter the integrated area measurements and free carbon results, but would serve as a
theoretical model to predict the free carbon values from experimental observations of the
XRD patterns. In the future, the structural model developed by Shi136 coupled with the
results from the modified spiking technique can be employed to not only evaluate the free
carbon values but also examine the nature of the disorder present in carbonaceous
inclusions.

108
5 Investigation of the Structural and Mechanical Properties of Boron Carbide
Across the Solubility Range
5.1 Introduction
So far, an in-depth understanding of the currently used analytical and chemical
techniques has been attainted and a new method to determine the free carbon concentration
has been proposed. These techniques have reduced the errors associated with the
determination of the boron carbide stoichiometry. This objective aims at investigation of
the structural variations in boron carbide across the solubility range through the
development of the lattice parameter-stoichiometry calibration curve. This will be achieved
through the synthesis of boron carbide samples over a range of controlled stoichiometries.
Additionally, the changes in the mechanical properties will also be investigated to evaluate
the preferred composition and purity of boron carbide for extreme dynamic conditions.
Due to the structural variations of boron carbide across the solubility range, there is
a direct dependence of the hexagonal and rhombohedral lattice parameters on the carbon
concentration. However, the exact nature of this relationship is ambiguous and has been
the consideration of significant debate over the last 60 years13, 15, 20, 33, 40, 96, 97, 98, 99, 137.
Identifying the stoichiometry from measured lattice parameters, provides a convenient and
nondestructive technique in obtaining the final composition of boron carbide. From XRD,
it is possible to get the lattice parameters with an accuracy less than 30 ppm as compared
to TEM which is 1000 ppm. A detailed study on the assessment of the characterization
techniques for the determination of the boron carbide stoichiometry has underlined the
importance of the method used to evaluate the free carbon concentration. The uncertainly
involved with the determination of the free carbon is negated by using the lattice parameter

109
and stoichiometry relationship. Assessing the stoichiometric value accurately is of prime
importance, especially since the physical, mechanical, elastic, electronic and optical
properties of boron carbide appear to be dependent on the boron to carbon stoichiometry6,
7, 11, 56, 57, 59, 85, 138. Further, the microstructural and ballistic response of boron carbide could
also be affected by the B:C ratio due to the change in the mechanical properties and elastic
properties.
The available literature data on the correlation between the width and height of the
unit cell and B:C ratio shows significant scatter (Figure 61) primarily due to the limitations
of the previous analytical techniques and a long standing misconception that B4C was the
only stoichiometric composition of boron carbide. Yakel’s15 and Robson’s99 data are
reasonably in agreement with each other. But there seems to be a systematic shift of
Robson’s lattice parameters towards higher values. Furthermore, questions remain
regarding the chemical techniques used and the accuracy of their measurements9,33. The
model developed for the single crystal by Yakel had a chemical composition of nearly 50%
more than his measured values for the synthesized bulk specimens. This discrepancy was
present at low carbon concentrations. Due to the significant error associated with these
samples, ion beam analysis was conducted which only reduced the error by 10%.
Additionally, a clear trend between the lattice parameters and carbon content could not be
observed due to the wide distribution of data. Higher lattice parameters reported by Allen
could be a direct consequence of the presence of impurities34. Aselage et al.13, 98 used three
approaches to prepare samples: 1) solid-state reaction; 2) hot pressing; and 3) solution
growth from metallic fluxes. Initially, only the results from hot pressing will be discussed.
A detailed

110
Figure 61. Comparison of the Hexagonal lattice parameters of boron carbide and the carbon
concentration as determined by previous authors. : Yakel15, : Allen55, : Aselage et
al.98 (Hot Pressing), : Bouchacourt et al.40 (E-beam), : Bouchacourt et al. (Hot
Pressing), : Robson99, : Aselage et al.13 (Solid State Reaction) : Gosset et al.96 (Hot
Pressing).

111
examination of the results from solid state reaction will be explained later. Aselage et al.98
used uniaxial hot pressing to prepare consolidated materials from mixtures of boron and
high purity graphite. To prevent contamination of boron carbide from the graphite die, a
high purity BN liner was used with an inner diameter of 3/8 in or 1/2 in. But this
experimental setup will not completely prevent boron carbide from graphite contamination
from the grafoil (graphitic sheet present between the die and sample) and die.
Contamination of graphite from the die and grafoil leads to the formation of
“stoichiometric” boron carbide, rather than boron carbide with the expected B:C ratio. This
diffusion of graphite into boron carbide causes a gradient of B:C ratios in the densified
material. Thus, the analysis conducted after hot pressing would result in an incorrect
assessment of the stoichiometry. An effort was made by Aselage to investigate the graphite
contamination from the grafoil using Raman spectroscopy, but this method only served as
a semi-quantitative technique to evaluate the carbon concentration in boron carbide. Based
on these assessments, 500 μm was removed from the top and bottom of the hot pressed
specimen so that the Raman spectra from the surface matched the one taken from the
interior of the sample. But the variations seen in the Raman spectra from 20 at% to 13.3
at% are not as significant as compared to those spectra taken beyond 13.3 at% carbon, as
will be discussed later in this paper. Consequently, even if specimens differ by a carbon
concentration of 1-2%, these subtle variations cannot be deciphered through the changes
seen in the Raman spectra. The BN lining that was also used may not have completely
isolated the boron and carbon mixture, thus leading to a further gradient in the B:C ratio
across the sample. This phenomenon remained unexamined in this paper. Hence questions
are raised regarding the homogeneity of the samples used for analysis and the accuracy of

112
the stated stoichiometry. This work also reported higher lattice constant values, when
compared to the other results available in the literature. The high hexagonal lattice
parameters could be a consequence of residual strains in the samples which would cause a
shift in the XRD peak positions. The densified materials were not crushed prior to
analyzing the samples. Crushing serves a dual purpose: 1) relieves the residual strain; and
2) improve the accuracy of chemical analysis by working with finer materials.
A more comprehensive analysis to measure the lattice parameter-carbon concentration
relationship was conducted by Bouchacourt et al.33, 97 using sample preparation techniques
similar to the hot pressed samples produced by Aselage13. The major difference in the
sample preparation involved the absence of BN lining along the inner circumference of the
graphite die. The entire crushed hot pressed samples with varying B:C ratios was used for
analyses. This approach presents a problem as detailed above: it leads to graphite
contamination and the presence of a gradient with varying stoichiometries across the
sample size that was more pronounced than in the samples produced by Aselage. The boron
and carbon contents were determined using analytical chemistry, quantitative electron
microprobe analysis and activation analysis. Based on the reported data, the a lattice
parameter depends linearly on the carbon concentration, but exhibits an increase in the
slope beyond 13.3 at% carbon. The values of the c lattice parameter on the other hand
decreased towards the boron rich limit after the critical composition of 13.3 at% was
achieved. These observations in the trend of the lattice constants from 13.3 – 20 at% carbon
were attributed to the increase in the length of the C-B-C chain with the decrease in the
carbon concentration and pointed towards the possibility of a substitution phenomenon in
the B12 icosahedra. From 8 – 13.3 at%, the changes seen in the lattice parameters with the

113
carbon concentration were interpreted as a result of substitution of the C-B-C chain by the
B4 group. Due to the large scatter associated with these results and the possible inaccuracies
with regards to the chemical composition of the resultant samples, the trends seen in the
Bouchacourt lattice parameter curves are highly debatable. Additionally, the absolute
values of the c lattice parameters are higher as compared to the values reported by other
researchers. Possible reasons for this could be due to incorrect sample preparation or
misalignment of the diffractometer. The absolute errors in the lattice parameters
measurements ranged from a = 0.001 Å and c = 0.005 Å which translates to an
inaccuracy of 0.3 at% and 1.3 at% carbon respectively.
The more widely accepted correlation of the lattice parameters to the bound carbon
content was proposed by Aselage et al.13 where boron carbide samples were made by solid
state reaction between amorphous boron and graphite. The a lattice parameter increased
linearly from 20 at% to the boron rich phase limit of 9 at%. The c lattice parameter flattened
out at 13.3 at% carbon. The results reported by Aselage differ when compared to
Bouchacourt’s hot pressed samples. Significant scatter is observed in the lattice parameters
and the carbon concentration throughout the solubility range, but especially close to the
carbon rich solubility limit. The major reason for this scatter is because of uncertainties
associated with the determination of the free carbon concentration which in turn increased
the error associated with final stoichiometry. The scatter is responsible for the increased R
value during linear regression which affects the fit used to develop an empirical
relationship between the lattice parameters and the carbon content. As a result of the
increased error in this relationship, the carbon concentration of unknown samples may not
be completely accurate. To test the accuracy of the Aselage data, lattice parameters of a
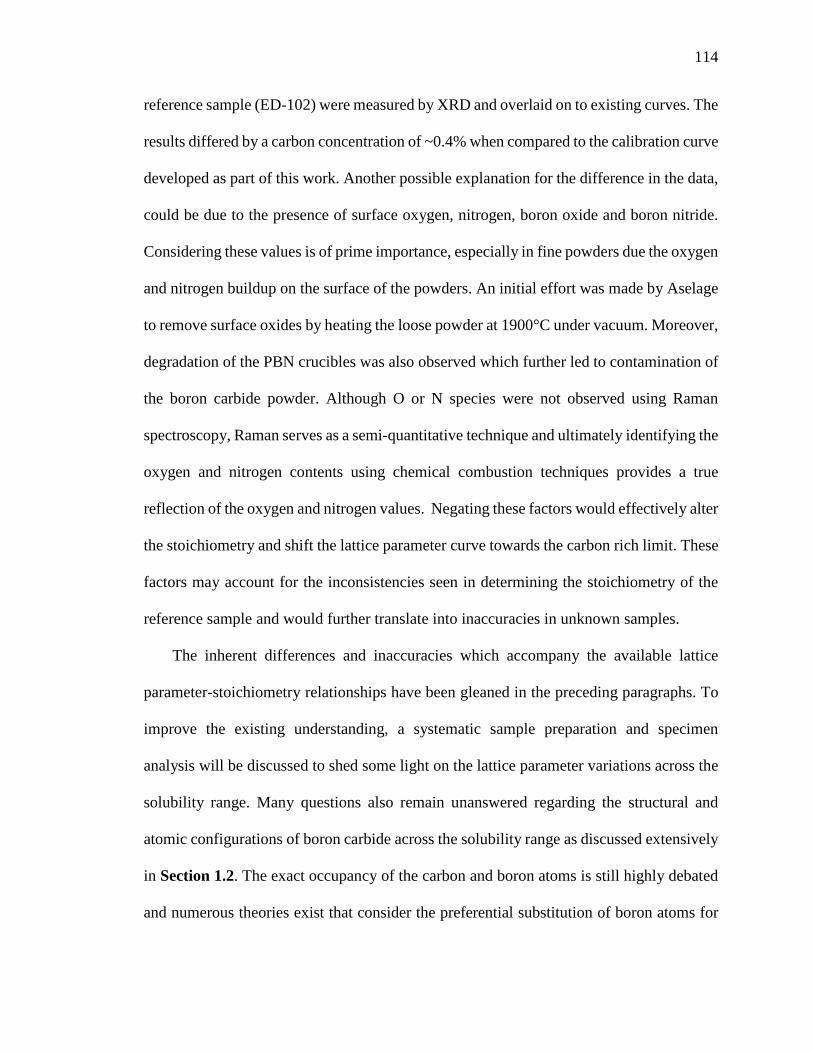
114
reference sample (ED-102) were measured by XRD and overlaid on to existing curves. The
results differed by a carbon concentration of ~0.4% when compared to the calibration curve
developed as part of this work. Another possible explanation for the difference in the data,
could be due to the presence of surface oxygen, nitrogen, boron oxide and boron nitride.
Considering these values is of prime importance, especially in fine powders due the oxygen
and nitrogen buildup on the surface of the powders. An initial effort was made by Aselage
to remove surface oxides by heating the loose powder at 1900°C under vacuum. Moreover,
degradation of the PBN crucibles was also observed which further led to contamination of
the boron carbide powder. Although O or N species were not observed using Raman
spectroscopy, Raman serves as a semi-quantitative technique and ultimately identifying the
oxygen and nitrogen contents using chemical combustion techniques provides a true
reflection of the oxygen and nitrogen values. Negating these factors would effectively alter
the stoichiometry and shift the lattice parameter curve towards the carbon rich limit. These
factors may account for the inconsistencies seen in determining the stoichiometry of the
reference sample and would further translate into inaccuracies in unknown samples.
The inherent differences and inaccuracies which accompany the available lattice
parameter-stoichiometry relationships have been gleaned in the preceding paragraphs. To
improve the existing understanding, a systematic sample preparation and specimen
analysis will be discussed to shed some light on the lattice parameter variations across the
solubility range. Many questions also remain unanswered regarding the structural and
atomic configurations of boron carbide across the solubility range as discussed extensively
in Section 1.2. The exact occupancy of the carbon and boron atoms is still highly debated
and numerous theories exist that consider the preferential substitution of boron atoms for

115
carbon atoms in the icosahedra, intericosahedral chains or formation of vacancies13, 15, 20,
21, 28, 33, 107, 139, 140. Understanding the changes seen in the lattice parameters as a function of
the carbon concentration could shed some light regarding the preferred structural model of
boron carbide across the solubility range.
Variations in mechanical properties can be traced back to microstructural variations in
the carbon content, grain size, inhomogenieties and porosity. However, in this work, only
the effect of stoichiometry on the mechanical properties will be investigated to evaluate the
preferred composition and purity of boron carbide for extreme dynamic environment
applications. The effect of stoichiometry on the hardness of boron carbide has been an area
that has not been well documented. Contradictory reports have been published regarding
the effect of the B:C ratio on the hardness of boron carbide56, 57. Furthermore, linking the
results from the structural variations to the change in the hardness as a function of the B:C
ratio would help supplement understanding of the specific atomic configurations
contributing to an improvement or diminishment in the hardness.
5.2 Experimental Procedure
5.2.1 Sample Preparation
Consolidated boron carbide samples were prepared by hot pressing mixtures of Ultra
High Purity amorphous boron (ABCR GmbH &Co. KG, Germany) and boron carbide
(H.C. Starck). In the first step of the sample preparation procedure, the boron carbide
powder was cleaned to remove surface oxides, excess boron oxide and boric acid that had
accumulated due to prolonged exposure to the atmosphere. The washing procedure entailed
mixing the powder with hydrochrolic acid (3.5 pH) in an ultrasonicator for 15 minutes and
heating the solution at 150°C. The solution was allowed to sit overnight and post the

116
sedimentation process, excess acid was decanted. The residual powder was then mixed
with distilled water and decanted as described above. The mixing, sedimentation and
decantation procedures were carried out twice with distilled water and ethanol. After the
sample had been cleaned with ethanol, it was placed in a drying oven (Thermolynn Drying
Oven) at 100°C.
The stoichiometry of the principal H.C Starck (ST-HD20) boron carbide powder was
estimated at B3.88C as calculated in Section 4.3.3. Based on this value of the B:C ratio,
consolidated boron carbide samples across the compositional range were then prepared by
mixing precise amounts of amorphous boron with the washed boron carbide powder, to
first eliminate the free carbon in the parent boron carbide and then to attain boron carbide
at a particular stoichiometry. Addition of amorphous boron to “stoichiometric” boron
Table 28. Summary of the excess amorphous boron needed during hot pressing to
produce boron carbide with an expected stoichiometry of B13C2.
Calculations for Boron Rich Samples Amount of
Powder (g)
Total boron carbide (ST-HD20) 4.00
Total boron required to get B13C2 5.00
Excess boron added to eliminate the free carbon present in the boron
carbide
(Assumption: Reaction between graphite and excess boron Takes
place according to B4C)
0.15
Excess boron added to get B13C2 2.15
Summation of excess boron and boron carbide (H.C. Starck) added
to get B13C2 6.15

117
carbide would result in the boron entering the boron carbide crystal lattice, thus forming
boron rich boron carbide. An example of the specific calculations used to make one such
consolidated boron carbide tile are shown in Table 28. An assumption made during
calculations was that part of the amorphous boron reacted with the free carbon in the boron
carbide to form B4C. This mixing methodology was used to make boron carbide specimens
at variable B:C ratios. Amorphous boron and dried boron carbide powders were mixed in
a high energy Spex mill for 10 minutes in the absence of grinding media to prevent any
external contamination. Initially, dense boron rich samples with controlled stoichiometries
were produced using spark plasma sintering at
Figure 62. Diffusion barriers in consolidated boron carbide synthesized using spark
plasma sintering.

118
1900 °C for 10 min. But this approach proved unsuccessful based on analysis of densified
samples. The boron carbide diffraction pattern showed the presence of asymmetric peaks
which indicated possible presence of multiple polytypes of boron carbide within the same
sample. Additionally, the stoichiometry of the densified tiles was significantly lower when
compared to the expected values. This deviation from the expected results can be explained
on the basis of an incomplete reaction during sintering and contamination of graphite from
the grafoil and graphite punches as shown in Figure 62. Thermodynamically,
stoichiometric boron carbide (B4-xC) is the stable phae. During sintering, the amorphous
boron reacted with graphite from the die to form stoichiometric boron carbide rather than
Figure 63. Schematic of the assembly used during hot pressing of the boron carbide and
amorphous boron mixtures.

119
boron carbide at the expected stoichiometry. To overcome the complications associated
with spark plasma sintering, an alternate approach was utilized where mixtures of
amorphous boron and boron carbide weighing 6 to 6.5 g were isolated with boron nitride
plates and a boron nitride coating (ZYP Coating) as shown in Figure 63. Boron nitride
plates were preferred as these acted as more effective barriers when compared to BN tape
or BN coating. Isolating the mixtures proved to be of particular importance to prevent
graphite contamination from the graphite spacers and die. In the absence of the isolation
chamber, amorphous boron reacted with graphite resulting in the formation of
“stoichiometric” boron carbide and eventually altered the final stoichiometry. This
assembly was prepressed at 5000 psi and then hot pressed using an Oxy-gon High
Temperature Vacuum Furnace System (Figure 64). The densification cycle employed
during hot pressing is detailed in Table 29. Hot pressing was also preferred over spark
Figure 64. Oxy-gon High Temperature Vacuum Furnace System used to hot press
mixtures of amorphous boron and boron carbide.

120
plasma sintering as temperatures in excess of 2000°C could be used which served as a
sufficient driving force for producing boron rich boron carbide. Moreover due to the longer
hold times and absence of localized hot zones, potentially more homogenous samples were
formed. All the hot pressing work was done at the Army Research Laboratory (ARL) in
Aberdeen, MD.
Table 29. Summary of the cycle used to hot press mixtures of amorphous boron and
boron carbide.
Segment Number Temperature Pressure
Segment 1 Ramp: 1000°C at 10°C/min under
vacuum Ramp: 1000 lbf
Segment 2 Dwell: 1000°C for 10 min under
vacuum Ramp: 2000 lbf
Segment 3 Ramp: 2000°C at 10°C/min under
argon Dwelve: 2000 lbf
Segment 4 Dwell: 2000°C for 120 min under
argon
Dwelve: 2000 lbf for
120 min
Segment 5 Cool Down Cool Down: 1000 lbf
5.2.2 Sample Analysis
Characterizing homogenous bodies was a main emphasis in this effort. Despite efforts
to isolate carbon intrusion, some amount of carbon diffused from the graphite die due to
volatilization of the BN lining. Hence, the core of the samples was analyzed exclusively,
as shown in Figure 65 (a). The boron nitride plates adhered to the densified tiles were
ground off with coarse polishing pads (125 μm and 70 μm) to minimize boron nitride
contamination (Figure 65 (b)). The samples were subsequently sectioned according to the
dimensions specified in Figure 65 (c) and XRD analysis was performed on the center of

121
the cross sectional faces. Figure 66 presents an illustration of the variation of the carbon
concentration from XRD results from cut 1 to cut 4 in a densified sample that has an
expected carbon content of 14 at%. These results show that the carbon content in cuts 1
and 2 are slightly higher than the expected values. As one moves towards the central core,
the carbon concentration approached expected results. Similar analysis on all the prepared
boron carbide samples revealed that a gradient existed from the outer rim towards the inner
core to ~5 mm towards the center because of graphite infiltration from the die. This
phenomenon as discussed earlier was attributed to the volatilization of the boron nitride
Figure 65. Schematic of the hot pressed boron carbide. (a): Core of the sample used for
analysis. (b): Boron nitride spacers ground off with coarse polishing pads. (c): Schematic
of the sectioned tile showing the thickness of each cut.

122
coating which resulted in graphite reacting with the amorphous boron forming
“stoichiometric” boron carbide rather than boron carbide with the expected B:C ratio. As
cut 3 and cut 4 had B:C ratio’s similar to the expected values, these samples were used for
subsequent chemical, x-ray diffraction and Raman analysis for the determination of the
lattice parameters and the corresponding stoichiometry. Cut 3 was mounted in an epoxy
with a Buehler Simpliment 100 mounting machine and the surface of cut 3 facing cut 4
was polished. The polishing procedure employed is detailed in Section 5.2.3. After the
polishing procedure was completed, Raman spectroscopy was performed to complement
x-ray diffraction results. Additionally, hardness measurements were performed to examine
the effect of stoichiometry on the hardness as described in Section 5.2.4.
Figure 66. Variation in the carbon concentration from cut 1 to cut 4 in a sample that has
an expected carbon content of 14 at%.

123
In order to evaluate the compositional variation across cut 4, XRD was performed at
regular intervals and the corresponding lattice parameters and B:C ratios were evaluated
using Aselage’s data as shown in Figure 67. The literature data served as a reference point
and provided insight into the compositional variations across the sample13. Due to the large
scan area of the x-ray diffractometer and presence of overlap regions during scanning,
Raman spectra were acquired from both the cross-sectional faces with the aim of achieving
better spectral resolution due to its significantly lower spot size. The Raman spectra
attained at regular intervals from the edge towards the center, exhibited variations in the
peak positions and intensities. Beyond 6 mm from the edge, the spectra remained
qualitatively unchanged, indicating the central region consisted of boron carbide with
constant stoichiometries (Figure 68). Owing to the presence of consistent B:C ratios in the
central region, the inhomogeneous regions of the samples were cut at 6 mm from the edges.
Figure 67. Carbon content on both the cross sectional faces of cut 4 from X-ray
diffraction.

124
These samples were then crushed using a diamond embedded motor, pestle and
hammer. The crushed powders were washed using the cleaning procedure (Sections 3.2.5)
to remove iron contaminants entering the system during crushing. X-ray diffraction data
from the crushed powders was collected using a Panalytical X'Pert system utilizing
conditions similar to those detailed in Sections 3.2.1. The crushed powders were mixed
with methanol to form a slurry and this then formed a thin layer of powder on the zero
background silicon wafer XRD holder. A line position NIST silicon standard (SRM 640e)
for powder diffraction was mixed with the crushed powders during sample preparation.
Phase analysis and lattice parameter refinement was conducted using MDI Jade version 9.0
Figure 68. Raman spectra variations at regular intervals from the edge towards the center
across the right cross sectional face.

125
with a hybrid whole pattern fit/least squares refinement. The lattice parameters were
calculated to average precisions of +/- 0.0003 angstroms. Sample compositions were then
assessed using various chemical techniques. A LECO CS230 was used to obtain the total
carbon present in the boron carbide samples. Oxygen and nitrogen analysis was performed
using a LECO TC600 instrument. Boron titration was conducted using ASTM C791-04.
This method involved mannitol titration after fusing the boron carbide, Na2CO3 and KNO3
in a platinum crucible. For further details about the boron, carbon and oxygen/nitrogen
methods used, please refer to Section 3.2.4.1, Section 3.2.4.2 and Section 3.2.4.3,
respectively.
5.2.3 Polishing
Cut 3 was mounted in an epoxy with a Buehler Simplimet 100 mounting machine
and the surface of cut 3 facing cut 4 was polished as previously mentioned (Figure 69 (a)).
Polishing was performed using a Buehler Ecomet 250 polisher with Automet 250 powder
Figure 69. (a) Buehler Simplimet 100 mounting machine. (b) Buehler Ecomet 250
polisher with Automet 250 powder heads.

126
heads (Figure 69 (b)). The first step in the polishing procedure involved using the 125 µm
diamond embedded pad to remove excess epoxy from the surface of the sample. The next
steps involved using the 70 and 45 um pads to remove pullouts occurring during the
polishing procedure. Fine polishing was then conducted using the 9, 6, 1, and 0.25 µm
cloth pad with the appropriate diamond suspensions. Table 30 provides specific details of
the polishing procedure employed.
Table 30. Polishing cycle used for the boron carbide samples
Size of
Polishing
Pad (μm)
PAD Type Cycle-Time
(min) Rotation & Speed
Pressure
(lbs per sample)
125 Embedded 4x10 Contra - 180 5
70 Embedded 3x10 Contra - 180 5
45 Embedded 3x10 Contra - 150 5
15 Embedded 2x10 Contra - 150 5
9 Suspension 2x6 Contra - 150 4
6 Suspension 4x6 Contra - 120 4
1 Suspension 3x6 Same - 120 4
0.25 Suspension 3x6 Same - 100 4
5.2.4 Nanoindentation
Nano-indentation was performed using a NanoTest Vantage nanoindenter
manufactured by Micro Materials as shown in Figure 70. The polished sample was
mounted on the stub (Figure 71) using a small quantity of adhesive and left in the
instrument enclosure for 20 minutes for it to thermally stabilize. The temperature inside
the nanoindenter enclosure was maintained at ~25°C as higher or lower temperatures could

127
affect the hardness results. The indenter area function was calibrated with fused silica
following the approach detailed by Oliver and Pharr141.
Figure 70. NanoTest Vantage nanoindenter manufactured by Micro Materials.
Figure 71. Sample stub for mounting the polished sample.

128
The indenter used for calibration and subsequent indentation was a Berkovich
diamond tip which is a three-sided pyramidal indenter commonly used to measure
nanoindentation hardness and modulus. Select samples of boron carbide from the
compositional range were chosen for nanoindentation. The applied loads ranged from 50 –
500 mN and 20 indents were made at each load. A limit stop load of 0.15 mN, indenter
contact velocity of 0.5 µm/s, initial load of 0.05 mN and loading/unloading rate of 2.5 mN/s
were used. The indents were separated by a distance of 20 µm to prevent interaction
between cracks generated from the indents which could potentially affect the hardness
values. The major advantage of nanoindentation over regular microhardness is the
relatively small size of the indents. Specific locations within the samples for analysis were
picked away from the pores, thus preventing porosity from affecting the hardness results.
Once indentation was completed, the load vs displacement curves and optical images of
the indents were critically analyzed and those indents hitting pores were disregarded from
analysis.
Load displacement curves can be used to evaluate the hardness where the indenter
displacement is continuously monitored as load is being applied to an indenter in contact
with a specimen (Figure 72)141. The load displacement relationship for simple punch
geometries can be written as141:
𝑃 = A (h − h𝑓)𝑚 (24)
Where P is the indenter load, h-hf is the elastic displacement of the indenter and A and m
are constants.
Oliver and Pharr141 suggested an analysis technique which accounted for the
curvature in the unloading data and provided a physically justifiable procedure for

129
evaluating the contact depth and the indenter shape function to establish the contact area at
peak load. The slope of the unloading curve provides a measure for the elastic modulus.
Figure 72. Load vs displacement curves monitored by the nanoindentation system141.
The area of contact at peak load is determined by the geometry of the indenter and
depth of contact. The geometry of the indenter is given by the cross-sectional area of the
indenter to the distance from its tip and the projected area at maximum load is given by:
𝐴 = 𝐹(ℎ𝑐) (25)
Where F is the functional form evaluated before experiments are carried out.
The area of the contact is calculated based on the indenter displacement and
indenter geometry. Hardness is then defined as the maximum applied load divided by the
contact area at maximum load. However, the hardness measurements using the load
displacement curve are highly dependent on the applicability of the model proposed by
Oliver and Pharr141. Instead, conventional hardness was obtained from the ratio of the
hmax
Load (
P)
Displacement (h)
loading
P = (h - hf)m
unloading
S
hc hmax
Load (
P)
Displacement (h)
loading
P = (h - hf)m
unloading
S
hc

130
maximum load applied to the area of the residual imprint determined using scanning
electron microscopy. Furthermore the nanoindentations hardness number was calculated
from the results of the Berkovich hardness using the relationship detailed below:
H = 1.1 HB (26)
Where H is the true hardnes and HB is the Berkovich hardness number.
5.2.5 Scanning Electron Microscopy
The SEM micrographs of the indents were taken using a Zeiss Σigma Field
Emission Scanning Electron Microscope (Figure 73) with inlens (IL) and secondary
electron (SE) detectors. The conditions utilized included a voltage of 5 kV, working
distance of 2-5 mm, aperture of 30 µm and magnifications of 18 k, 25 k, 30 k, 45 k, 50 k
and 75 k. Samples were prepared using an aluminum scanning electron microscopy (SEM)
stud with a 1/2" slotted head and a 1/8" pin from Ted Pella Inc. This was covered with
carbon tape to prevent charging of the sample.
Figure 73. Zeiss Σigma Field Emission Scanning Electron Microscope.
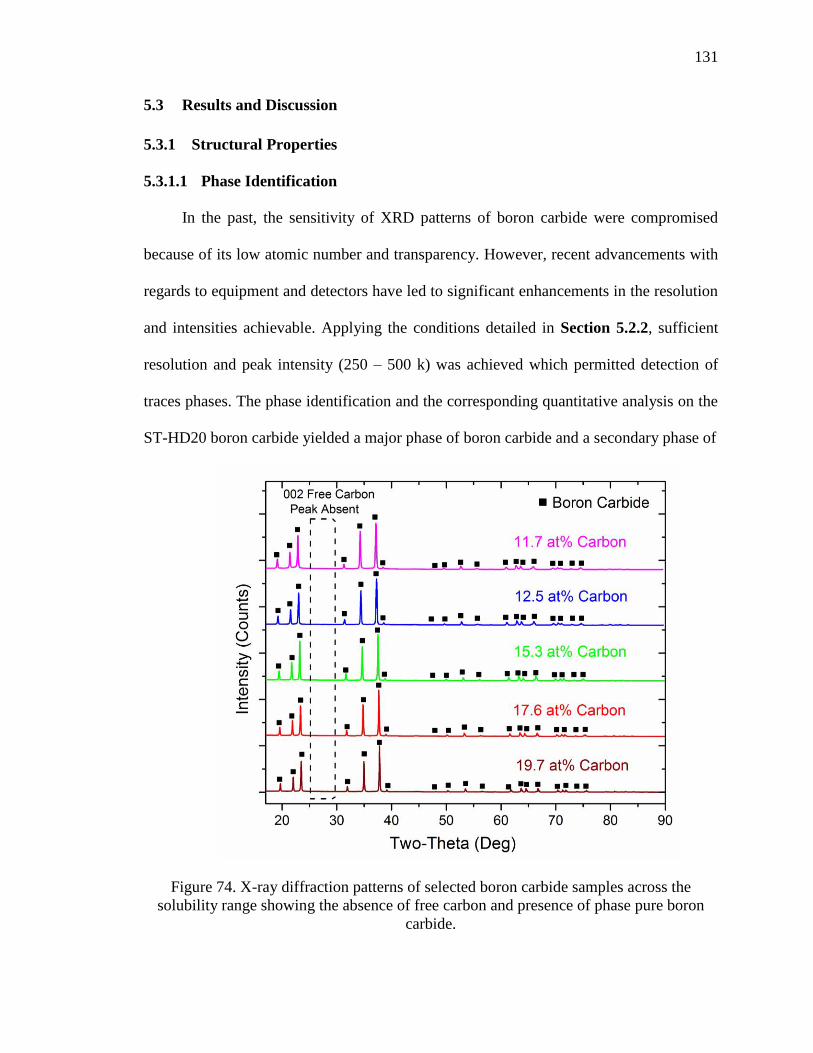
131
5.3 Results and Discussion
5.3.1 Structural Properties
5.3.1.1 Phase Identification
In the past, the sensitivity of XRD patterns of boron carbide were compromised
because of its low atomic number and transparency. However, recent advancements with
regards to equipment and detectors have led to significant enhancements in the resolution
and intensities achievable. Applying the conditions detailed in Section 5.2.2, sufficient
resolution and peak intensity (250 – 500 k) was achieved which permitted detection of
traces phases. The phase identification and the corresponding quantitative analysis on the
ST-HD20 boron carbide yielded a major phase of boron carbide and a secondary phase of
Figure 74. X-ray diffraction patterns of selected boron carbide samples across the
solubility range showing the absence of free carbon and presence of phase pure boron
carbide.

132
free carbon as discussed in Section 3.3.1. PDF cards for different polytypes of boron
carbide were utilized during phase identification to determine the best fit for the primary
phase. Based on the results from chemical analysis and x-ray diffraction, the stoichiometry
of the boron carbide was estimated at ~B4C. Figure 74 shows the XRD patterns and phase
identification of select boron carbide samples made across the solubility range. Indexing
of the peaks was conducted using similar reflections to Table 6. There was an absence of
secondary (002) free carbon peaks at 2θ values of ~26.6°. This indicated that there was no
graphite infiltration from the graphite punches and the amorphous boron added during
densification completely reacted with the free carbon in the original powder. Additionally,
no evidence of the free carbon peak was observed in the sample with a carbon concentration
of 19.7 at% demonstrating that the solid solution solubility range of boron carbide could
possibly extend beyond 18.8 at% carbon (B4.3C) proposed by Schwetz9 and Werheit142.
According to Werheit, it was suggested that the chemical compound B4C did not exist
when prepared by high temperature methods such as hot pressing or melting at
temperatures exceeding ~2027°C. But direct observations of the phase identification of the
prepared samples near B4C dispute this claim. Boron nitride contaminants were also not
observed in the XRD patterns allowing us to believe that the boron nitride plates used for
the isolation chamber did not infiltrate into the consolidated tile. Metallic impurities were
not detected within the detection limits of XRD demonstrating the formation of phase pure
boron carbide samples within the homogeneity range. Hence the washing procedure
employed serves as an effective tool for cleaning the crushed powder from contaminants
entering the system during crushing. Any trace contaminants present in the crushed powder

133
could only be present at ppm levels which would not be sufficient enough to cause
deviation in the lattice parameters.
There was a systematic shift of the maximum intensity (021) boron carbide peaks
towards lower 2θ values as seen in Figure 75. This provides visual evidence of the increase
in the lattice parameters due to the addition of boron into the boron carbide crystal structure
resulting in the formation of boron rich boron carbide at a specific stoichiometry. The boron
carbide diffraction profile exhibited symmetric peaks without the presence of peak
splitting. This signified that the boron carbide formed consisted of a single phase of boron
carbide rather than multiple phases with differing stoichiometries.
Figure 75. Shift in the (021) boron carbide peak towards lower 2θ values indicating an
increase in the lattice parameters.

134
5.3.1.2 Lattice Parameters vs Carbon Concentration
The XRD patterns possessed a sufficient signal to noise ratio for lattice parameter
estimation using Rietveld Refinement. Owing to the use of the NIST line position standard
(640 (e)), the presence of systematic errors in the diffraction patterns was eliminated. The
results of the hexagonal lattice parameters, unit cell volumes and the corresponding carbon
contents are listed in Table 31. The bound carbon contents were determined after
calculation of the boron carbide stoichiometry based on the chemical techniques described
in the Section 5.2.2. In total, 17 samples were prepared at varying B:C ratios and
characterized using the developed techniques. The standard deviations of the unit cell
parameters and volume results are also reported in Table 31. The variation of the hexagonal
lattice parameters and unit cell volume as a function of the bound carbon contents are
plotted in Figure 76 (a), (b) and (c). The lattice constants and the unit cell volume increase
linearly from ~20 at% to 13.3 at% carbon. This was in agreement with previously
developed relationships of the lattice parameters and the carbon concentrations13, 33, 96. The
results below ~13.3 at% carbon exhibit a linear dependence on the carbon concentration.
But, beyond this critical composition, the lattice constants and the unit cell volume show a
further increase in their absolute values at decreasing B:C ratios, albeit with a different
slope. Previously published lattice parameter calibration curves showed that the lattice
parameters were linearly dependent on the carbon content and cH remained constant beyond
13.3 at% carbon. But the results reported in this paper exhibit a different trend when
compared to previously reported lattice constant-carbon concentration relationships13, 33, 96.
Due to the certainty associated with the analysis and the care taken in utilizing homogenous
powders for analysis, sufficient confidence is affiliated with these results. The effect of

135
Table 31. Hexagonal lattice parameters, unit cell volumes and carbon concentrations of
the synthesized boron carbide samples.
aH (Å) cH (Å) VolumeH
(Å3)
Carbon Concentration (at%)
from Chemical Analysis
Stoichiometry of
Analyzed Samples
5.5993 ±
9.00E-5
12.0738 ±
2.05E-4
327.82 ±
9.30E-3 19.7 4.09
5.6016 ±
1.10E-4
12.0854 ±
2.57E-4
328.41 ±
1.15E-2 19.1 4.24
5.5998 ±
1.60E-4
12.0814 ±
3.80E-4
328.09 ±
1.68E-2 18.8 4.32
5.6056 ±
9.40E-5
12.1030 ±
2.20E-4
329.35 ±
9.84E-3 17.8 4.62
5.6062 ±
8.40E-5
12.1082 ±
2.00E-4
329.58 ±
8.85E-3 17.6 4.68
5.6136 ±
9.60E-5
12.1208 ±
2.30E-4
330.78 ±
1.02E-2 16.7 4.99
5.6191 ±
1.99E-4
12.1473 ±
2.63E-4
332.16 ±
1.81E-2 15.3 5.54
5.6211 ±
1.05E-4
12.1457 ±
2.45E-4
332.35 ±
1.10E-2 14.9 5.71
5.6252 ±
1.98E-4
12.1542 ±
4.55E-4
333.07 ±
2.07E-2 14.5 5.90
5.6259 ±
2.29E-4
12.1570 ±
5.15E-4
333.23 ±
2.31E-2 14.4 5.94
5.6223 ±
2.29E-4
12.1469 ±
5.26E-4
332.52 ±
2.40E-2 14.4 5.94
5.6332 ±
2.20E-4
12.1696 ±
5.09E-4
334.44 ±
2.32E-2 12.6 6.94
5.6336 ±
1.37E-4
12.1730 ±
3.25E-4
334.58 ±
1.46E-2 12.5 7.00
5.6344 ±
1.50E-4
12.1669 ±
3.53E-4
334.51 ±
1.59E-2 12.4 7.06
5.6329 ±
2.48E-4
12.1760 ±
5.77E-4
334.58 ±
2.62E-2 11.7 7.55
5.6363 ±
2.79E-4
12.1816 ±
7.18E-4
335.14 ±
3.07E-2 9.9 9.10
5.6377 ±
4.65E-4
12.1733 ±
1.12E-3
335.08 ±
4.98E-2 9.6 9.42

136
Figure 76. Dependence of the Hexagonal lattice parameters and unit cell volume on the carbon concentration. (a) aH lattice parameter
(Å), (b) cH lattice parameter (Å) and (c) Unit cell volume (Å3).

137
systematic errors and presence of impurities was also negated by utilizing the silicon
standard and cleaning procedure respectively. The standard deviations of the lattice
parameters and the scatter associated with this experimental data provide additional
evidence of the general trend in the lattice parameter and carbon concentration
relationships. This change in the slope at ~13.3 at% carbon was indicative of the distinct
mechanism of substitution occurring on either side of B6.5C. The steeper gradients of the
cH lattice parameter as compared to the aH lattice parameter is indicative of the non-uniform
increase of the volume of the unit cell along the c-axis from 20 at% to 13.3 at% carbon.
But from 13.3 at% carbon to 9.6 at% carbon, the gradient of the lattice parameters are
relatively similar. This is demonstrative of the uniform increase in the volume of the unit
cell along the a and c axis providing further insight regarding the substitution mechanisms
occurring at varying stoichiometries. The a lattice parameter shows an increase of ~0.04 Å
from the carbon rich end of the phase diagram towards the boron rich solubility limit.
Similarly, the c lattice parameter increased by 0.26 Å and volume by 7.46 Å3, across the
single phase solubility range of boron carbide. The lattice parameter and volume data were
fitted using linear regression to evaluate the best fit possible using the available data points.
Due to the discontinuity in the data either side of B13C2, the results were fitted with two
distinct curves to account for the change in the slope at ~13.3 at% carbon. Using the
developed relation of the aH lattice parameter and carbon concentration, the stoichiometry
of the ED-102 reference sample was determined from the lattice parameters as shown in
Table 32. There was agreement between the calculated and reference stoichiometry which
signified that the developed lattice parameter carbon concentration relationship could be

138
used to evaluate the stoichiometry of unknown samples with a high degree of accuracy.
Additionally, the aH lattice parameter proves to be more precise as compared to cH.
Table 32. Comparison of the calculated and referenced values of the stoichiometry of the
ED-102 sample produced by ESK.
Powder
#
Powder
Company a(Å) c(Å)
Carbon
Content
(at%) Calculated
Stoichiometry
Reference
Stoichiometry Based
on a
ED-102 ESK 5.6006 12.0742 19.1 B4.22C B4.23C
As discussed earlier, phase pure boron carbide was observed in samples beyond
18.8 at% carbon (B4.3C) offering confirmation that the solubility limit of boron carbide
extended past the carbon contents proposed by Schwetz9 and Werheit142. These
observations were further confirmed from the lattice parameter results. From 18.8 at% to
~20 at% carbon, aH and cH decreased and constant values were not attained. However, the
precise value of the carbon rich solubility is not known but based on these results it can be
estimated to be ~20 at% carbon or B4C. Additional work will be done in the future to
ascertain the single phase solubility limit on the carbon rich side by making a series of
samples from 19.5 to 22 at% carbon.
5.3.1.3 Raman Spectra Variations
The typical Raman spectra of the synthesized boron carbide samples with varying
B:C ratios are shown in Figure 77. It must be noted that although the spectra shown in
Figure 77 are the most representative for a particular sample, small variations in peak
positions and relative peak intensities were observed when spectra were acquired from
different areas on each sample. To incorporate these point-to-point variations in the

139
Figure 77. The most representative Raman spectra for boron carbide samples of varying
stoichiometries. The 375 cm-1 band that appears only in the most boron-rich samples is
marked by a star.
analysis, the acquired Raman spectra were deconvolved using the Levenberg–Marquardt
algorithm143. The curve fitted data were interpreted statistically assuming normal
distributions.
It was established that changing stoichiometry had several effects on the Raman
spectra of boron carbide. In particular, the position of the major icosahedral mode at 1088
cm-1 (the icosahedral breathing mode, IBM) was found to shift towards lower frequencies
with increasing boron content (Figure 78 (b)). Similar downshift was also observed for the
530 cm-1 band (Figure 78 (d)). Conversely, a narrow band at 485 cm-1 was found to shift

140
to higher frequencies with increasing boron content (Figure 78 (c)). This observation
suggests the different nature of the latter two bands. Indeed, since the 530 cm-1 band has
been attributed to atomic displacements within the icosahedron110, it is expected to
downshift for higher boron concentrations, similar to the IBM, due to the growing size of
the icosahedra leading to softening of the intericosahedral bonds. The band at 485 cm-1, on
the other hand, has been assigned to vibrations among the atoms in the CBC chain100, 110,
and its upshift would indicate stronger inter-chain bonding at higher boron concentrations.
The dependency in the frequency position of the above bands on stoichiometry
becomes much less pronounced for carbon concentrations below ~13.5 at.% (Figure 78).
Conversely, as evident from Figure 77, a new sharp band at 375 cm-1 appears in the Raman
spectra of the most boron-rich samples. The intensity of this band normalized with respect
to the band at 320 cm-1 is shown in Figure 78 (a). In the literature, the 320 cm-1 band has
been assigned to disorder-induced acoustic phonons110. As follows from the examination
of Figure 78 (a), starting with carbon concentrations of ~13.5 at.%, the intensity of the 375
cm-1 band shows gradual increase towards most boron-rich stoichiometries. Further, this
increase in the intensity appears to follow a linear relation, suggesting a connection with
the structural changes as boron atoms start substituting carbon in the chain units. This
observation is in agreement with the structural model that assumes formation of B12(B-B)
units at higher boron concentrations104, 144. Indeed, the bond length for the two-atomic B-
B chain would constitute 1.92 Å for the 13.3 at.% C composition. This is the longest bond
available among the possible atomic configurations in boron carbide, and the
corresponding vibrational mode is expected to have a low frequency. In a similarly bonded
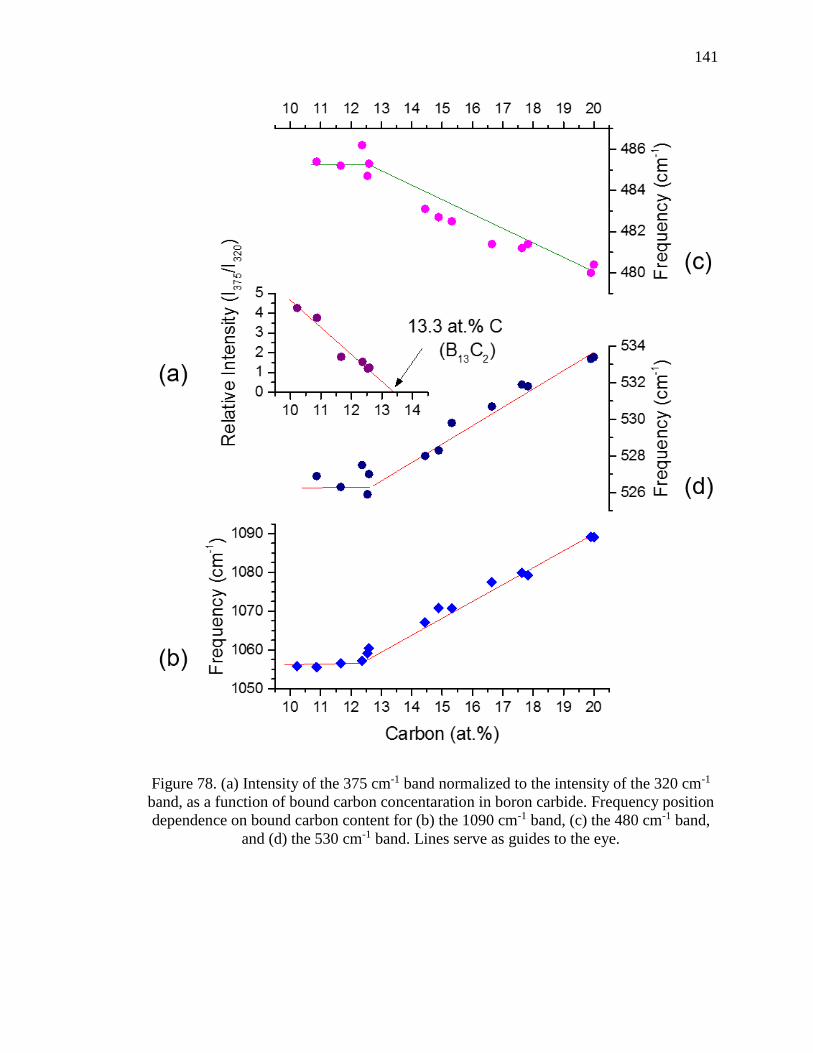
141
Figure 78. (a) Intensity of the 375 cm-1 band normalized to the intensity of the 320 cm-1
band, as a function of bound carbon concentaration in boron carbide. Frequency position
dependence on bound carbon content for (b) the 1090 cm-1 band, (c) the 480 cm-1 band,
and (d) the 530 cm-1 band. Lines serve as guides to the eye.

142
SiB3 structure, the Raman band corresponding to stretching vibration of the two-atomic Si-
Si units is found at ~400 cm-1, bearing close resemblance to the 375 cm-1 band observed in
boron-rich boron carbide.
The sharpness of the two Raman bands around 500 cm-1, together with the mutual
convergence of their frequencies for the more boron-rich compositions, offer a convenient
and instrument-independent tool for measuring the boron carbide stoichiometry based on
the Raman spectra. This is illustrated in Figure 79, where the frequency separation between
the bands at 485 and 530 cm-1 is plotted as a function of the bound carbon concentration in
boron carbide. Assuming linear relationship for separation dependence on stoichiometry,
the bound carbon concentration can be reliably deduced for an arbitrary sample in the range
of ~13.5 to 20 at.% C. As the separation data show no variation for carbon concentrations
below ~13 at.% C, the intensity of the 375 cm-1 band (Figure 78 (a)) may be used in this
range as stoichiometry indicator.
Figure 79. Frequency separation between the 485 and 530 cm-1 Raman bands, as a
function of bound carbon concentration in boron carbide. Line serves as guide to the eye.
10 12 14 16 18 20
40
42
44
46
48
50
52
54
Ra
man
Pe
ak S
ep
ara
tio
n (
cm
-1)
Carbon (at.%)

143
5.3.1.4 Proposed Structural Model
From the XRD and Raman results, an attempt was made to rationalize the changes
seen in the lattice parameters as a function of the carbon concentration through the proposal
of a simplified structural model. The addition of boron atoms into the boron carbide crystal
structure affects the interatomic separations between B1-B1 (equatorial), B1-B2
(diagonal), B1-B2’ (diagonal), B2-B2” (polar triangle), B2-B2”’ (intericosahedra) and B1-
C lattice positions (B-C icosahedra to chain bond). The interatomic separations at varying
stoichiometries compiled by Aselage are depicted in Figure 8012, 13, 145, 146. The inter and
intraicosahedral bonds increase in length with the decrease in the carbon concentration.
The largest increase in the bond lengths was observed in the intericosahedral B2-B2”’ and
B1-B2’ bond which resulted in the greater increase of cH as compared to aH towards the
Figure 80. Interatomic separations (Å) based on single crystal studies conducted by
Aselage et al.13, 146, Kirfel et al.12, and Morosin et al.145. Top: 20 at% C, Middle: 16 at% C
and Bottom: 13.3 at% C. (Image reproduced from Ref 14.)

144
boron rich solubility range. The interatomic separation between the carbon and boron
atoms in the 3 atom chain (C-B3) remained relatively constant from 20 at% to 13.3 at%.
Larson performed crystal structure refinements on boron carbide at 20 at% carbon.
The results were compared with those by Yakel15 and Kirfel et al.12 to ascertain the effect
of stoichiometry on the bond lengths as shown in Table 33. An increase in most of the bond
lengths was observed from 20 at% to 13.3 at% which was in agreement with the results in
Figure 80. As discussed previously, at the carbon rich limit of the solubility range, it is
widely accepted that the B11C (C-B-C) structure is the preferred atomic configuration. The
increase in the lattice constants and volume from 20 at% - 13.3 at% carbon can be attributed
to the replacement of the shorter intericosahedral C-B bonds by longer B-B bonds. This is
a direct consequence of the preferential substitution of boron atoms in the icosahedra
resulting in an increase in the B12 cages which leads to expansion of the icosahedra and
increase in the lattice parameters. The largest increase in the bond length was observed in
the B2-B2”’ intericosahedral bond providing further evidence of the preferential
substitution of boron atoms for carbon atoms occurring within the icosahedra.
Table 33. Bond Lengths as a function of carbon concentration12, 15, 20
Bond ~9 at% Carbon ~13.3 at% Carbon ~20 at% Carbon
B1-B1 1.781 1.773 1.762
B1-B2 1.803 1.797 1.786
B1-B2’ 1.805 1.806 1.800
B2-B2” 1.822 1.821 1.807
B2-B2”’ 1.744 1.732 1.719
B1-C 1.632 1.617 1.606
C-B3 1.438 1.429 1.431

145
From 13.3 at% - ~9 at% carbon, B2-B2”’, B1-C, B1-B1 and C-B3 bonds show an
increase in the length. The largest growth in the bond length was observed in the B1-C
separation. This can be explained by the change in the mechanism of boron substitution
beyond 13.3 at% carbon. The 3-atom C-B-C chains are replaced by shorter B-B chains as
discussed in Section 5.3.1.3. Although the B-B chains are shorter as compared to
equivalent C-B-C bonds, there is still an overall increase in the lattice parameters owing to
the increase in B1-B1, B2-B2’” and B1-C bonds. Therefore, this expansion of the unit cell
occurs with a decreased slope as compared to the region between 13.3 at% carbon and 20
at% carbon.
Over the solid solution homogeneity range, various structural configurations have
been identified; B12 icosahedra, B11C icosahedra with the C atom accommodated in one of
the 6 polar sites, C-B-C chains, C-B-B chains and BB ( - vacancy)142. However, it
appears plausible that boron carbide cannot be described by a single unit cell at any
Figure 81. Concentration of the structural units of boron carbide across the solubility
range. B11C(C-B-C)-Black, B12(C-B-C)-Blue and B12(B-B)-Red. Y axis has arbitrary
units.
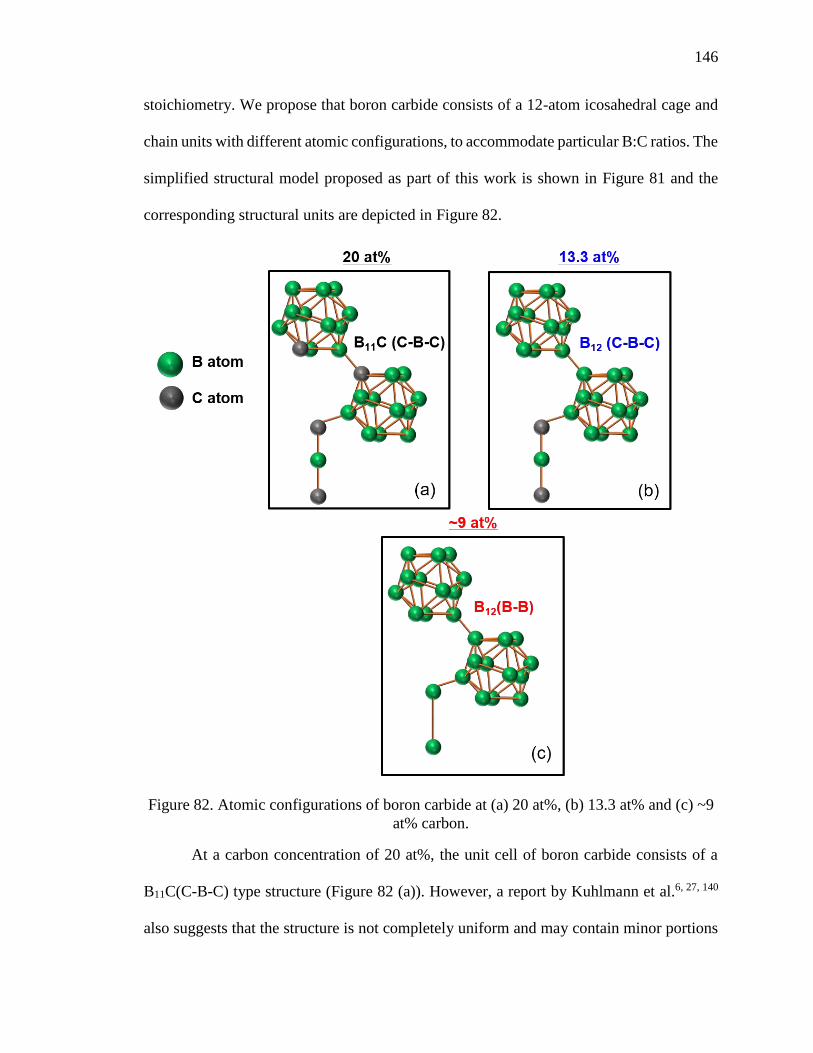
146
stoichiometry. We propose that boron carbide consists of a 12-atom icosahedral cage and
chain units with different atomic configurations, to accommodate particular B:C ratios. The
simplified structural model proposed as part of this work is shown in Figure 81 and the
corresponding structural units are depicted in Figure 82.
Figure 82. Atomic configurations of boron carbide at (a) 20 at%, (b) 13.3 at% and (c) ~9
at% carbon.
At a carbon concentration of 20 at%, the unit cell of boron carbide consists of a
B11C(C-B-C) type structure (Figure 82 (a)). However, a report by Kuhlmann et al.6, 27, 140
also suggests that the structure is not completely uniform and may contain minor portions
147
of C-B-B chains. But, it is generally accepted that at a carbon content of 20 at%, B11C(C-
B-C) is the true representation of the B4C stoichiometry6, 28, 147. From 20 at% -13.3 at%
carbon, the structure of boron carbide is disordered. As the carbon concentration decreases,
boron atoms preferentially substitute for carbon atoms in the icosahedral cage. This
continues until most of the carbon atoms are removed from the icosahedra. The B12(C-B-
C) configuration in the material increases and at 13.3 at% carbon, boron carbide consists
of predominantly B12(C-B-C) units (Figure 82 (b)) with the remaining amount comprising
of B11C(C-B-C) structures. Similar conclusions were also drawn by Saal et al. through
quantum simulations using an ab initio approach28. Beyond 13.3 at% carbon, further
replacement of the carbon atoms in the B11C icosahedra is accompanied by the formation
of B-B bonds resulting in B12(B-B) structures (Figure 82 (c)). Consequently, towards the
boron rich solubility limit, the structural model was comprised of primarily B12(C-B-C)
and B12(B-B). Moreover, trace amounts of B11C(C-B-C) and B11C(B-B) units may also be
present with complete depletion of these B11C structural units occurring at the boron rich
limit of ~9 at% carbon. The formation of B-B was corroborated by the Raman spectra
variations. These results were commensurate with single crystal XRD studies performed
by Sologub et al.148 where the boron carbide crystal with a nominal B6.5C stoichiometry
was found to contain B12 (96%), B11 (4%) icosahedra and C-B-C (87%) and B-B (13%)
chains.
This proposed atomic configurations was deduced based on lattice parameter and
Raman results in addition to previously published work. In order to confirm these
observations, single crystal diffraction will need to be performed to identify the location of
the boron and carbon atoms.

148
5.3.2 Mechanical Properties
5.3.2.1 Hardness vs Stoichiometry
Nanoindentation on the boron carbide samples was performed to determine the
effect of stoichiometry on hardness. Since, the density of the consolidated materials ranged
from 94-96% using the Archimedes method, indents were placed away from the pores to
minimize the effect of porosity on the hardness value. However, despite careful positioning
of the indents, microporosity and pores beneath the sample surfaces resulted in skewed
hardness values. The results from these indents were discarded owing to the bias in the
analysis after examining the load displacement curves and the SEM micrographs post
indentation. Figure 83 provides an illustration of an indented area considered to determine
the hardness of the densified material. All the boron carbide samples exhibited radial
cracking from the tips of the indenter surface.
Figure 83. SEM micrograph showing the area of the 500 mN indent in the sample with a
carbon concentration of 12.6 at% carbon.

149
Figure 84. Hardness vs Load curves of the sample with a carbon concentration of 16.4
at% (B5C).
The results of the hardness vs load curves for the B5C (16.8 at% carbon) sample are
shown in Figure 84. An indentation size effect was observed with an increase in the load149.
The maximum hardness value of 42.2 GPa was attained at a load of 50 mN. As expected,
with an increase in the load from 50 mN to 400 mN, there was a drop in the hardness.
Beyond 400 mN the hardness values remained relatively constant. The 14.9, 12.6 and 9.6
at% carbon samples exhibited similar behavior as a function of the carbon concentration.
Figure 85 shows the effect of the stoichiometry on the hardness values at constant loads of
50 mN, 300 mN and 500 mN. With an increase in the B:C ratio there is a drop in the
hardness values of boron carbide. A consistent drop in the hardness was reported across all
loads.

150
Figure 85. Effect of stoichiometry on the hardness of boron carbide at constant loads.
The mechanical properties of boron carbide are affected by atomic bonding,
iconicity and bond covalence and electron density in inter-atomic regions6, 150, 151. Higher
stiffness and hardness result from increased inter-atomic electron density and localized
covalent bonds. From Figure 80 and Table 33, it is discernable that the shortest bond length
was seen in the C-B3 (intrachain) bonds. This was followed by the B1-C (B-C icosahedra
to chain bond), B2-B2”’ (intericosahedra) and intraicosahedral bonds. The interatomic
separation is directly proportional to the bond strength which in turn varies inversely with
the mechanical properties, particularly hardness of boron carbide. The drop in the hardness
of boron carbide at higher B:C ratios can be explained in terms of the bond length, iconicity
and inter-atomic electron density. The lattice parameter data insinuates that the volume of
the unit cell and bond lengths increase towards the boron rich solubility range. This creates

151
lower inter-atomic electron density and decreased bond strength. The softer interatomic
bonds make the 12 atom icosahedra more compressible leading to a reduction in the
hardness at a higher stoichiometry. The hardness results are in alignment with Nihara et
al.56 data which also show a reduction in the hardness with an increase in the B:C ratio.
Density Functional Theory (DFT) calculations on B11C icosahedra and C-B-C chain
performed by Guo et al.151 show increased theoretical hardness and reduced bond length as
compared to results on a B12 icosahedra and C-B-C chain conducted by Gao et al.152 which
were commensurate with the hardness observations as part of this work. These results are
also contradictory to a recent theoretical report by Taylor et al.81 where an increase of 10
GPa was predicted for the shear strength at boron rich configurations.
5.3.2.2 Amorphization
The Raman spectra on the pristine regions of the boron carbide samples extend
from 200 to 1600 cm-1 which was in accordance with the typical Raman spectra of boron
carbide as illustrated in Figure 86 (a), (b), (c) and (d). However, the Raman spectra obtained
from the centers of the 500 mN indents were different and the presence of peaks at 1330
cm-1, 1520 cm-1 and 1810 cm-1 was observed. These bands are different as compared to the
band frequencies, band widths and relative intensities of the D and G graphitic peaks. These
bands in the literature were attributed to amorphization of boron carbide6, 77. Hence,
indentation induced amorphization was observed at all stoichiometries. Moreover, Raman
mapping also revealed that the amorphous boron carbide phase was contained within the
indentation contact area as depicted in Figure 87.

152
Figure 86. Raman spectra acquired from the pristine regions and center of the 500 mN
indents showing the development of amorphous boron carbide in samples at (a) B5C
(16.7 at% carbon) (b) B5.7C (14.9 at% carbon) (c) B6.9C (12.6 at% carbon) (d) B9.4C (9.6
at% carbon)
Figure 87. Raman mapping of the 500 mN indent showing the amorphous boron carbide
phase contained within the indentation contact area.

153
Figure 88. (a) Raman spectra from pristine regions of boron carbide samples at varying
stoichiometries. (b) Variation in the Raman spectra from the centers of the 500 mN
indents showing the splitting of the amorphous peak at ~1300 cm-1.
Figure 88 shows the effect of stoichiometry on the amorphous boron carbide phase.
With an increase in the B:C ratio, splitting of the broad feature at ~ 1300 cm-1 was observed
which suggests a shift in the short range order of the amorphous phase. The indentation
induced amorphized material in more boron rich samples appeared to have a lower density.
As mentioned previously, at higher B:C ratios, there is a mixture of different polytypes of
boron carbide with varying atoms present in the unit cell. The deformation of these
structures could result in the formation of two distinct forms of amorphous boron carbide.
The possibility of the existence of two differing forms of boron carbide have also been
reported by Ivashchenko et al.153 where amorphous boron carbide was predicted to contain
disordered icosahedra connected by B-C and C-C networks as well as an a-120
configuration with a less random network.

154
The precise mechanism governing the amorphization behavior is not clear despite
extensive experimental and theoretical efforts. Varying theories have been proposed where
amorphization could be a consequence of changes in the C-B-C chains80 or collapse of the
B12(C-C-C) structure154. Another theory proposed by Qi et al.155 intimate the shear-induced
amorphous band formation through breakage of the B-C intericosahedral B-C bonds.
Taylor et al. performed density functional theory calculations (DFT) to investigate the
effect of stoichiometry on the mechanical properties of icosahedral boron carbide under
loading81. The results of Taylor’s work suggest that bending of the 3-atom chain is
responsible for failure in boron carbide and the yield strength of the B12(C-B-C) under a
shear strain is twice that of other structures. This alluded to B12(C-B-C) being the most
stable structure under shear loading. However, the present work has shown a drop in the
hardness as a function of stoichiometry because of increased interatomic separation. Hence,
the B12(C-B-C) structure which occurs at boron rich compositions may not have a higher
strength. Indentation induced amorphization was also observed across the entire solubility
range. Hence failure in boron carbide may be governed not by amorphization but by
another mechanism such as softer interatomic bonds at increased B:C ratios.
5.4 Summary
In this objective, investigations of the variations in the structural and mechanical
properties of boron carbide have been conducted. A modified method was developed for
the synthesis of high purity and varying chemistry consolidated boron carbide through the
use of a BN isolation chamber which permitted minimal graphite diffusion from the
surrounding die and plates. Careful analysis of the hot pressed tiles ensured the calculated
stoichiometry of the resultant materials was precise and accurate.

155
From phase identification, lattice parameter and Raman spectroscopy results,
conclusions can be made regarding the carbon rich solubility range. The solubility range
on the carbon rich side extends beyond 18.8 at% carbon proposed by Schwetz et.al9.
Certainly, stoichiometries lower than B4.3C (18.8 at% carbon) can exist if synthesized using
preparation methods below 2300 K. However, the precise value of the carbon rich
solubility limit is still not known. Additional samples will have to be synthesized at small
increments from ~19.5 at% carbon to 22 at% carbon to examine the carbon rich limiting
composition.
A new lattice parameter-carbon concentration calibration curve was also developed
which shows the dependence of the unit cell constants on the stoichiometry. This lattice
parameter calibration curve provides a convenient and nondestructive method to evaluate
the stoichiometry of unknown boron carbide samples with a relatively high degree of
accuracy. Utilizing the information gained from the variations in the lattice parameters and
Raman spectra as a function of the stoichiometry a simplified structural model was
proposed that considers the preferential substitution of boron and carbon atoms across the
solubility range. A change in the slope of the lattice parameter data was observed at ~13.3
at% carbon denoting the change in the mechanism of substitution of boron and carbon
atoms at the critical composition of 13.3 at% carbon or stoichiometry of B13C2. At the
carbon solubility limit of boron carbide, the preferred atomic configuration if B11C(C-B-
C). From 20 at% - 13.3 at% carbon, boron atoms substitute in the icosahedral cage resulting
in the formation of B12(C-B-C) structures. At ~ 13.3 at% carbon, formation of B-B bonds
initiate and the B12(B-B) units increase in number towards the boron rich solubility limit.

156
The hardness of boron carbide decreased towards the boron rich solubility limit. This was
attributed to the reduced inter-atomic density and increased bond length at higher
stoichiometries which makes the icosahedra more compressible under high strain rates.
These results were in contradiction to those proposed by Taylor et al.81 where B12(C-B-C)
was assumed to have higher hardness. Amorphization of boron carbide was also observed
at all stoichiometries and from reduced hardness results, failure of boron carbide may not
be governed by amorphization but by another mechanism such as softer interatomic bonds
at increased B:C ratios. Finally, synthesizing boron carbide samples near 20 at% carbon
could be desirable for improved performance under high strain rate conditions
157
6 Applicability of Developed Techniques
6.1 Introduction
Over the course of this thesis, novel methods have been developed to characterize
boron carbide and an improved understanding of the structural and mechanical properties
across the solubility range has been established. The impact of a projectile into a target
results in the activation of failure mechanisms originating from defects, including
plasticity, phase transformations and fracture156. Extending the developed characterization
techniques to understand the crystal structure response of boron carbide subjected to
extreme dynamic conditions would pave the way to the advancement of the performance
of commercial armor grade boron carbide. In particular, this objective focuses on
understanding the effect of stress and strain rates on the crystal structure of boron carbide
during static and dynamic loading conditions. Additionally, the stress and strain rates
experienced by the impacted consolidated ceramic will be linked to the particle size and
the effect of these stresses on the defect population and chemistry will also be explored.
Investigations of the possible changes in the stoichiometry and phase transformations
conducted on the fragments could provide insight into the possible deformation modes.
Connecting these results to the failure mechanisms could help explain the factors that affect
ballistic performance. The characterization tools utilized to achieve this objective include
XRD, Raman spectroscopy and SEM.

158
6.2 Experimental Procedure
6.2.1 Compression Experiments
Quasi-static and dynamic uniaxial and biaxial confined compression experiments were
performed on a hot-pressed boron carbide plate manufactured by CoorsTek (Vista, CA)
and the impact of the projectile was conducted in the hot pressing direction. The hot-
pressed plate had a Young’s Modulus of 430 GPa, density of 2490 kg/m3 and a Poisson’s
ratio of 0.16 as provided by the manufacturer. Cuboidal specimens were used for static and
dynamic loading experiments. Quasi-static experiments were performed using a MTS
servo-hydraulic test machine at a nominal strain rate of 10-3 s-1. Dynamic compression
experiments were performed at Johns Hopkins University (JHU) using a Kolsky bar
apparatus (Figure 89) at rates of 500 s-1. The Kolsky bar apparatus consists of a striker
projectile, and incident and transmitted bars made of C-350 steel157. Biaxial compression
tests were conducted at a confining pressure of 500 MPa using the schematic shown in
Figure 90. For further details regarding the Kolsky bar setup refer to Hogan et al.157 and
Kimberley et al.158.
Figure 89.Schematic of Kolsky bar apparatus used at Johns Hopkins University157.

159
Figure 90. Schematic of biaxial confinement setup157.
6.2.2 Sample Preparation and Characterization of Fragments
The fragments from the static and dynamic loading tests were collected and sieved
through different mesh sizes. The fragments were separated into >710 µm, >250 µm and
>45 µm fragments. Sample preparation of the fragments proved very challenging owing to
the nature of the fragments. Traditional methods involving dispersion with methanol could
not be employed. Instead, an alternate method was used which involved the use of hair
spray which served as a viscid medium and enabled the fragments to remain within the
cavity of the zero background holder as shown in Figure 91. A NIST silicon standard
(NIST-640 (e)) was also used to minimize specimen displacement errors during sample
preparation and to account for peaks shifts occurring as a result of possible misalignment
of the XRD diffractometer. To ensure the fragments were in alignment with the upper
surface of the silicon wafer, a glass slide was utilized to flatten the mixture of silicon and
boron carbide fragments. XRD scans were taken using a Panalytical X’Pert system using
similar conditions to those detailed in Section 3.2.1.

160
Figure 91. Schematic of the XRD zero background sample holder consisting of boron
carbide fragments and a NIST silicon line position standard.
A Renishaw InVia Raman microspectrometer equipped with a 633 nm laser and a
50x objective lens was used for Raman analysis of fracture surface. The spatial dimensions
of the analyzed volume at each position of the laser probe were ~2 µm laterally and ~1 µm
axially. Raman measurements were done at ambient conditions. For Raman imaging, sets
of Raman spectra were collected over the selected areas with a 1 µm step size. Peak
deconvolution was performed using the Renishaw Wire 3.2 software and Raman maps
created based on the intensity of the peaks corresponding to the phase of interest. Lastly,
SEM/EDS analysis on the fragments was performed using a Zeiss Sigma field emission
SEM. The fragments were mounted on an aluminum stud with a 1/2" slotted head and a
1/8" pin from Ted Pella Inc. The analysis was conducted at an excitation voltage of 5 KV
and working distance of 8.5 mm with the help of the secondary electron detector.
6.3 Results and Discussion
6.3.1 Baseline Boron Carbide Tile
Phase analysis and quantitative analysis on the commercial hot pressed boron
carbide armor plate yielded a major phase of boron carbide and minor phases of graphite,
boron nitride and aluminum nitride. Figure 92 shows the schematic of the hot pressed boron
carbide tile. The carbon inclusions present in the tile consisted of circular graphitic discs
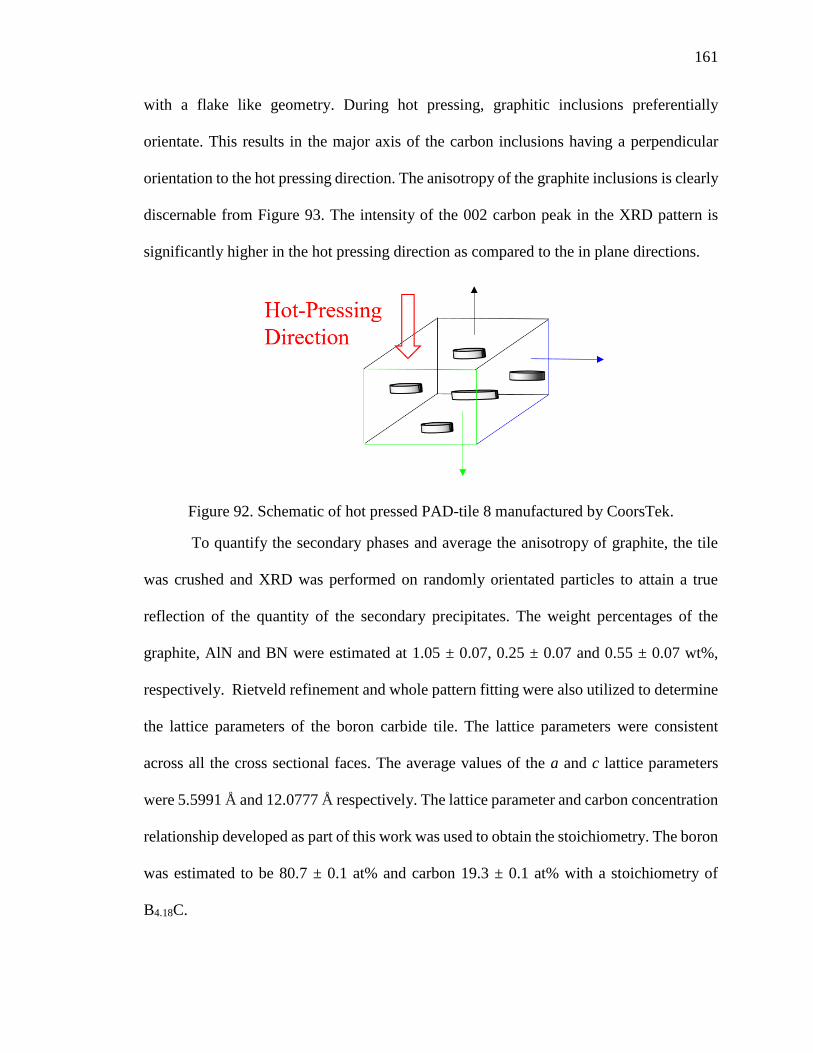
161
with a flake like geometry. During hot pressing, graphitic inclusions preferentially
orientate. This results in the major axis of the carbon inclusions having a perpendicular
orientation to the hot pressing direction. The anisotropy of the graphite inclusions is clearly
discernable from Figure 93. The intensity of the 002 carbon peak in the XRD pattern is
significantly higher in the hot pressing direction as compared to the in plane directions.
Figure 92. Schematic of hot pressed PAD-tile 8 manufactured by CoorsTek.
To quantify the secondary phases and average the anisotropy of graphite, the tile
was crushed and XRD was performed on randomly orientated particles to attain a true
reflection of the quantity of the secondary precipitates. The weight percentages of the
graphite, AlN and BN were estimated at 1.05 ± 0.07, 0.25 ± 0.07 and 0.55 ± 0.07 wt%,
respectively. Rietveld refinement and whole pattern fitting were also utilized to determine
the lattice parameters of the boron carbide tile. The lattice parameters were consistent
across all the cross sectional faces. The average values of the a and c lattice parameters
were 5.5991 Å and 12.0777 Å respectively. The lattice parameter and carbon concentration
relationship developed as part of this work was used to obtain the stoichiometry. The boron
was estimated to be 80.7 ± 0.1 at% and carbon 19.3 ± 0.1 at% with a stoichiometry of
B4.18C.

162
Figure 93. Phase identification of the original tile. (a) XRD pattern taken in the hot
pressed showing preferred orientation of the 002 carbon peak. (b) and (c) XRD pattern
taken in the in plane direction showing the reduced intensity of the 002 carbon peak.
Here, : Boron Carbide, : Graphite, : Boron Nitride and : Aluminum Nitride.

163
Electron energy loss spectroscopy (EELS) was also used to evaluate the
stoichiometry of the boron carbide grain before impact159. This work was done at Johns
Hopkins using a Phillips CM420 and CM300FEG TEM. EELS spectra were acquired from
multiple grains and the stoichiometry was calculated by integrating the background
corrected K-edges of boron and carbon as depicted in Figure 94. Boron was estimated at
79.3 ± 1.9 at% and carbon at 20.7 ± 1.9 at% which was in good agreement with the results
from XRD. TEM observations also revealed the grains were equiaxed and only a few
defects were present. Carbon inclusions were typically accompanied by mircocracks in
adjacent boron carbide grains and these microcracks could be introduced during sample
preparation. The secondary precipitates of AlN and BN were micrometers to
submicrometer in size, however nanoprecipitaes of AlN were also observed. For a further
detailed discussion of the microstructural characterization of the commercial hot pressed
tile, refer to the paper by Kelvin et al.159
Figure 94. Electron energy loss spectrum of the boron carbide matrix159.

164
6.3.2 Characterization of Fragmented Material
Phase identification of the fragments showed no signs of phase transformations
occurring within the detectability limits of the XRD. Lattice parameter results of the
uniaxial, biaxial and quasi-static fragments revealed that the lattice parameters of the >710
µm fragments had smaller values than those of the original unimpacted tile. Furthermore,
decrease in the particle size of the fragments from >710 µm to >250 µm and >45 µm
resulted in an decrease in the corresponding lattice parameters as depicted in Figure 95 and
Figure 96. The >710 µm and >250 µm fragments showed significantly lower lattice
parameter values than the original tile, while the >45 µm results were comparable. These
variations in the unit cell constants of the fragments could only occur because of two
phenomena: 1) decrease in the B:C ratio post fragmentation; 2) reduction in the lattice
parameter values owing to the presence of residual strain. Investigation of the underlying
reason for the changes seen in the lattice parameters was carried out by performing
combustion tests to evaluate the total carbon concentration and examining the lattice
parameters pre and post crushing. LECO combustions tests on the >710 µm uniaxial
fragments provided total carbon contents of 22.27 wt% and 22.31 wt% pre and post
crushing respectively. This indicates that the change in the unit cell constants were not a
result of a decreased B:C ratio. Similar observations were made in the >250 µm and >45
µm uniaxial, biaxial and quasi-static fragments. Additionally, the lattice parameters post
crushing were similar to the original tile as illustrated in Figure 97 and Figure 98. Based
on these results, it is discernable that the difference in the unit cell constants of the
fragments were a direct consequence of the presence of residual strain.

165
Figure 95. Variation of the a (Å) lattice parameter with the fragment size before
crushing.
Figure 96. Variation of the c (Å) lattice parameter with the fragment size before
crushing.

166
Figure 97. Variation of the a (Å) lattice parameter with the fragment size after
crushing.
Figure 98. Variation of the c (Å) lattice parameter with the fragment size after
crushing.

167
The resultant volumetric residual strain in the fragments was calculated from the
change in the volume of the unit cell before and after compression tests using the formula
below:
Ɛv = VB− VA
VB (27)
Where, VB= Volume of hexagonal unit cell of boron carbide before compression tests
VA= Volume of hexagonal unit cell of boron carbide after compression tests
ƐV = Residual volumetric strain
From the results in Figure 99, larger fragments showed the presence of a higher residual
volumetric strain as compared to smaller fragments. As the fragment size decreased,
residual strain was alleviated as a result of crack propagation from the graphitic inclusions
and increased surface area of the fragments. The >45 µm fragments exhibited a marginal
value of the residual volumetric strain. Based on these observations, it can be concluded
that the boron carbide was subjected to hydrostatic compression which results in a
shrinkage of the unit cell. This could lead to a deduction of the presence of elastic strain
resulting in the distortion of the lattice. The largest distortion of the lattice occurs in the
larger fragments. Furthermore, hydrostatic compression is the root cause for the shrinkage
in the crystal lattice of boron carbide as illustrated in Figure 100. Preliminary conclusions
have been made based on the XRD results, however, the precise mechanism explaining
these observations has not completely been understood. Further work needs to be done to
link these observations to the performance of boron carbide under extreme dynamic
conditions.

168
Figure 99. Variation of the fragment size and the residual volumetric strain from
compression experiments.after crushing.
Figure 100. Hydrostatic compression of the boron carbide unit cell.

169
6.3.3 Raman Mapping
Raman spectroscopy was also performed on the fragmented material to explore
evidence of amorphization. Figure 101 shows Raman mapping of the fragments obtained
from uniaxial, biaxial and quasi-static compression tests. Carbon defects (red), boron
nitride (cyan) and amorphized (blue) phases were mapped on the fracture surfaces.
Carbonaceous defects were typically present on the fracture surfaces of the impacted
material. Amorphous boron carbide zones were also observed especially in the biaxial and
quasi-static fragments. But these amorphous zones were not a result of stress induced
amorphization that characteristically appears in boron carbide subjected to high strain rate
impact tests. These were a direct consequence of shear as a result of surface grinding of
the original hot pressed tile. Further, the presence of organic impurities was also seen in
the boron carbide fragments. These impurities were due to the backing material
(Styrofoam) used to collect the fragments during Kolsky bar tests.
Figure 102 (a) and (c) are the representative Raman spectra and the corresponding
optical images from the locations from which the Raman spectra were acquired. Only
Raman bands linked to boron carbide were observed from Raman analysis on the ground
surfaces. However, focusing the beam on the fracture surfaces of the fragments (Figure
102 (b) and (d)) resulted in the formation of peaks corresponding to carbonecous defects
and boron nitride. This provided further evidence of the important role carbon defects play
in the failure of boron carbide during extreme dynamic conditions. Hence minimizing these
defects could theoretically improve the performance of consolidated boron carbide under
static and dynamic loading conditions.

170
Figure 101. Raman maps showing the presence of graphitic carbon (red), h-BN (cyan),
amorphous boron carbide (blue) and organic impurities (green) in the a) uniaxial, b)
biaxial and c) quasi-static fragments.

171
Figure 102. Typical Raman spectra from the ground (a and c) and fracture surfaces (b and
d) of the fragments subjected to high strain rate compression tests.
6.3.4 SEM/EDS Mapping
SEM micrographs and EDS maps on the ground surfaces showed the carbon
inclusions were present as graphitic sheets on the surface of boron carbide as shown in
Figure 103 (a) and (b). The typical fracture surfaces of the fragments collected after
compression tests are shown in Figure 103 (c) and (d). Generally, transgranular cleavage
was the primary crack propagation mode160. Crack initiation occurs from carbon inclusions
with the fracture surfaces showing predominantly carbon rich areas. Characteristically,
flaky carbonaceous inclusions cause crack deflection with the crack propagating from one
carbon inclusion to another through the boron carbide grains. Similar observations for the
same material under analogous loading conditions were made by Farbaniec et al160. Figure
104 shows a fractured boron nitride grain with an aluminum nitride grain boundary. These
observations agreed with the results from Raman spectroscopy and indicated that graphite
was not the sole actor in the failure of boron carbide. Boron nitride and aluminum nitride
were also responsible for failed ballistic response in commercial grade consolidated boron
carbide.

172
Figure 103. SEM micrograph and EDS maps showing, (a) and (b): Presence of graphitic
sheets on the surface of the boron carbide and (c) and (d): Carbon rich fracture surfaces.
Figure 104 (a) SEM micrograph showing the fracture surfaces in boron nitride grains. (b)
Elemental mapping of the fracture surfaces in the boron nitride grains.

173
6.4 Summary
In this section, the developed chemical and analytical techniques were applied to
investigate the crystal structure response of boron carbide following high strain rate
compression tests. Fragments with the largest particle size contained the highest residual
volumetric strain and as the fragments decreased in size, the strain was relieved through
crack propagation and increase in the surface area of the fragments. The precise
mechanisms resulting in these observations were not completely understood and this work
will be done in the future.
Failure of boron carbide is dependent on the defect population (carbonaceous
inclusions) and the defect spacing. Crack propagation typically originated from the carbon
inclusions. Moreover, the observed fracture surfaces from Raman and SEM mapping were
commensurate with each other showing that the fracture surfaces were carbon rich
indicating the role played by free carbon in the failure of boron carbide. Additionally, the
presence of boron nitride and aluminum nitride also affected the performance of boron
carbide as was observed in the Raman map. Further studies will have to be conducted to
understand how these observations translate to the performance of boron carbide.

174
7 Conclusions
The objective of this thesis was to develop an improved methodology for the chemical
and structural characterization of boron carbide. Utilizing the developed techniques, an
improved understanding of the variations in the structural and mechanical properties across
the solubility range was gleaned. The work done as part of the thesis can be used to
establish the preferred composition and purity of boron carbide for extreme dynamic
conditions which would then aid in controlling dynamic failure processes to improve the
performance of boron carbide.
Currently used analytical and chemical techniques were assessed to determine the
sources of inaccuracies associated with the determination of the boron carbide
stoichiometry. Currently available Powder Diffraction Files (PDF) cannot be exclusively
used to detect the precise stoichiometry owing to the inconsistencies with previously
developed analysis techniques and earlier misconceptions regarding the absence of a wide
homogeneity range of boron carbide. Boron carbide powders should be thoroughly cleaned
before analysis using the cleaning procedure highlighted in Section 3.2.5 to prevent surface
oxides altering the stoichiometric results.
Critical examination of existing characterization techniques indicated the method
employed to calculate the free carbon concentration provided the largest source of error. In
lieu of these inspections, a method known as the modified spiking technique was
introduced for the determination of the free carbon concentration in boron carbide. This
method showed an increased reliability as compared to previously used analytical
techniques. This method can be employed for free carbon determination, irrespective of
175
the nature of carbon present in the boron carbide. Additional testing against a reference
boron carbide powder revealed results which were commensurate with the reported values.
An improved dependence of the lattice parameters on the carbon concentration was
also presented through the synthesis and characterization of high purity and varying
chemistry boron carbide. As the carbon concentration was decreased, the unit cell volume
of boron carbide increased and a change in the slope was observed at ~13.3 at% carbon.
The observed trend in the lattice parameter data was explained through the proposal of a
simplified structural model. From 20 at% - 13.3 at% carbon, preferential substitution of
boron for carbon atoms occurs in the icosahedra resulting in the formation of a B12(C-B-
C) structure from B11C(C-B-C). The B12(C-B-C) configuration had increased bond lengths
and interatomic separations leading to an expansion of the unit cell. Additional boron
enrichment caused the formation of B12(B-B) units which grew in number towards the
boron rich solubility range.
The developed lattice parameter calibration curve also provides a convenient and
non-destructive method to calculate the stoichiometry of boron carbide. From the results
of phase identification, lattice parameters and Raman spectroscopy, knowledge of the
single phase solubility range has also been garnered. It has been shown that the carbon rich
limit of boron carbide could extend beyond 18.8 at% carbon or a stoichiometry of B4.3C.
Although the precise value of this limit was not discerned, preliminary estimation pointed
to a limiting stoichiometry of B4C or 20 at% carbon.
Hardness measurements as a function of stoichiometry also uncovered decreased
hardness values with an increase in the B:C ratio. These results were attributed to reduced
interatomic separation and increased bond length leading to a weaker unit cell.

176
Amorphization of boron carbide was also seen on all the indented boron carbide samples.
From the lattice parameter, hardness and amorphization data, there is a possibility that
failure in boron carbide may be a consequence of another mechanism such as softer bonds
at higher B:C ratios. These results indicate synthesizing boron carbide with modified
microstructures at stoichiometries close to 20 at% carbon may be the way forward to attain
improved ballistic performance.
Finally, the work done as part of this thesis is essential as the lattice parameters-carbon
concentration relationship, atomic configurations at different stoichiometries, single phase
solubility limits and effect of stoichiometry on mechanical properties have been the
consideration of significant debate in the boron carbide community. The atomic
configuration and positions of the boron and carbon atoms play a key role in the structure
of the boron carbide phases. Depending on the atomic structure, boron carbide exhibits
different mechanical properties. Hence by understanding how the atomic configuration
changes as a function of the stoichiometry, boron carbide with a preferred atomic
configuration and consequently properties can be synthesized to attain improved
performance under extreme dynamic conditions.
8 Recommendations for Future Work
Based on the results from this thesis, there are still areas in the research on boron
carbide that have not been completely understood and could be explored further. The
precise carbon and boron rich solubility limit can be determined by synthesizing a series
of samples at regular intervals across both the solubility limits of B and C. These materials
can then be analyzed using the developed characterization procedures and techniques

177
detailed in this work. These results could potentially shed some light on the single phase
solubility range of boron carbide.
The simplified structural model proposed in this work has been based on deductions
from the lattice parameter and Raman spectroscopy results. To confirm the proposed
atomic model, single crystal X-ray refinement should be performed on boron carbide
samples with varying stoichiometries to discern the boron and carbon atomic positions.
Finally, consolidated boron carbide can be synthesized with reduced porosity by
increasing the temperatures and pressures used during hot pressing. Further, utilization of
a BN sleeve during densification would ensure no graphite contamination occurs from the
graphite dies. These samples can then be tested using high strain rate experiments to discern
the ballistic response of boron carbide at varying stoichiometries.

178
9 References
1. F. Thévenot, "Boron carbide - A comprehensive review," J. Eur. Ceram. Soc., 6 205-25
(1990).
2. R.R.Ridgway, J.Am.Electrochem.Soc, 66 (1934).
3. G. N. Samsonov, N. N. Zhuravlev, and I. G. Amnuel, "Physicochemical properties of
boron-carbon alloys," Fiz. Met. Metalloved., 3[2] 309-13 (1956).
4. N. N. Zhuravlev, G. Makarenko, and G. N. Samsonov, Izv. Akad. Nauk SSSR, OTN, 1
133 (1961).
5. G. S. Zhdanov and N. G. Sevastyanov, "Crystal structure of boron carbide (B4C)," Dokl.
Akad. Nauk SSSR, 32 832 (1941).
6. V. Domnich, S. Reynaud, R. A. Haber, and M. Chhowalla, "Boron carbide: Structure,
properties, and stability under stress," J. Am. Ceram. Soc., 94[11] 3605-28 (2011).
7. F. Thévenot, "Boron carbide - A comprehensive review," pp. 2.1-2.25. in Properties of
Ceramics, Vol. 2. Euro-ceramics 1, Proc. 1st Eur. Ceram. Soc. Conf. Edited by G.
de With, R. A. Terpstra, and R. Metselaar. Elsevier Appl. Sci., London and New
York, 1989.
8. M. Beauvy, "Stoichiometric limits of carbon-rich boron carbide phases," J. Less-
Common Met., 90[2] 169-75 (1983).
9. K. A. Schwetz and P. Karduck, "Investigations in the boron-carbon system with the aid
of electron probe microanalysis," pp. 405-13. in Boron-Rich Solids. Edited by D.
Emin, T. Aselage, C. L. Beckel, A. C. Switendick, and B. Morosin. American
Institute of Physics, New York, 1991.
10. V. I. Matkovich, "Extension of the boron-carbon homogeneity range," J. Less-Common
Met., 47 39 (1976).
11. D. M. Bylander, L. Kleinman, and S. B. Lee, "Self-consistent calculations of the energy
bands and bonding properties of B12C3," Phys. Rev. B, 42[2] 1394-403 (1990).
12. A. Kirfel, A. Gupta, and G. Will, "The nature of the chemical bonding in boron carbide,
B13C2. I. Structure refinement," Acta Cryst. B, 35 1052 (1979).
13. T. L. Aselage and R. G. Tissot, "Lattice constants of boron carbide," J. Am. Ceram.
Soc., 75[8] 2207-12 (1992).
14. L. J. A. E.L. Venturini, D. Emin and C. Wood, "Electronic Spin Resonance Study of
Hot-Pressed Boron Carbide," pp. 292-304. in Boron Rich Solids, AIP Conference
Proceedings, Vol. 140. Edited by T. A. D.Emin, C.L Beckel, I.A. Howard and
C.Wood. American Institute of Physics, New York, 1986.
15. H. L. Yakel, "The crystal structure of a boron-rich boron carbide," Acta Cryst. B, 31
1797-806 (1975).
16. D.W.Bullet, "Boron Rich Solids," Proceedings of an International Conference on the
Physics and Chemistry of Boron and Boron-Rich Borides (1985).
17. C. Wood and D. Emin, "Conduction mechanism in boron carbide," Phys. Rev. B, 29[8]
4582-87 (1984).
18. M. Van Schilfgaarde and W. A. Harrison, "Electronic structure of boron," J. Phys.
Chem. Solids, 46[9] 1093-100 (1985).
19. D. Emin, "Structure and single-phase regime of boron carbides," Physical Review B,
38[9] 6041 (1988).

179
20. A. C. Larson, "Comments concerning the crystal structure of B4C," pp. 109-13. in
Boron-Rich Solids. AIP Conf. Proc. Edited by D. Emin, T. Aselage, C. L. Beckel,
I. A. Howard, and C. Wood. American Institute of Physics, New York, 1986.
21. B. Morosin, A. W. Mullendore, D. Emin, and G. A. Slack, "Rhombohedral crystal
structure of compounds containing boron-rich icosahedra," pp. 70-86. in Boron-
Rich Solids. AIP Conf. Proc. Edited by D. Emin, T. Aselage, C. L. Beckel, I. A.
Howard, and C. Wood. American Institute of Physics, New York, 1986.
22. T. L. Aselage and D. Emin, "Structural model of the boron carbide solid solution," pp.
177-85. in Boron-Rich Solids. AIP Conf. Proc. Edited by D. Emin, T. Aselage, C.
L. Beckel, A. C. Switendick, and B. Morosin. American Institute of Physics, New
York, 1991.
23. K. A. Schwetz and A. Lipp, "Boron carbide, boron nitride, and metal borides," pp. 265.
in Ullmann's Encyclopedia of Industrial Chemistry, Vol. 4A. Verlag Chemie,
Weinheim, 1985.
24. T.Aselage and D.Emin, "Structural Model of the Boron Carbide Solid Solution," pp.
177-85. in Structure. American Institute of Physics, AIP Conference Proceedings,
Albuquerque, New Mexico, 1990.
25. K. A. Schwetz and P. Karduck, "Investigations in the boron-carbon system with the aid
of electron probe microanalysis," J. Less-Common Met., 175[1] 1-11 (1991).
26. H. Werheit, "On excitons and other gap states in boron carbide," J. Phys.: Condens.
Mat., 18[47] 10655-62 (2006).
27. U. Kuhlmann and H. Werheit, "On the microstructure of boron carbide," Solid State
Commun., 83[11] 849-52 (1992).
28. J. E. Saal, S. Shang, and Z. K. Liu, "The structural evolution of boron carbide via ab
initio calculations," Appl. Phys. Lett., 91[23] 231915 (2007).
29. R. P. Elliott, "The boron-carbon system," pp. 50. in. Armour Research Foundation of
Illinois Institute of Technology, Chicago, IL, 1961.
30. R. Dolloff, "Air Force Report." in. WADD, Tech. Rep. 60-143, 1960.
31. H. K. Clark and J. L. Hoard, "The crystal structure of boron carbide," J. Am. Chem.
Soc., 65 2115-19 (1943).
32. G. Will and K. H. Kossobutzki, "X-ray diffraction analysis of B50C2 and B50N2
crystallizing in the "tetragonal" boron lattices," J. Less-Common Met., 47 33-38
(1976).
33. M. Bouchacourt and F. Thévenot, "Analytical investigations in the BC system," J. Less-
Common Met., 82 219-26 (1981).
34. M. Bouchacourt and F. Thévenot, "The melting of boron carbide and the homogeneity
range of the boron carbide phase," J. Less-Common Met., 67 327-31 (1979).
35. L. B. Ekbom and C. O. Amundin, "Microstructural evaluations of sintered boron
carbides with different compositions," pp. 237-43. in Science of Ceramics, Vol. 11.
Edited by R. Carlsson and S. Karlsson. Swedish Ceramic Society, Stockholm,
1981.
36. F.Wolher and H. S. C. Deville, Annales de chimie et de physique, 52[3] 63 (1958).
37. G. Will and K. H. Kossobutzki, "An x-ray structure analysis of boron carbide, B13C2,"
J. Less-Common Met., 44 87 (1976).
38. G. Will, A. Kirfel, and A. Gupta, "Is the concept of boron icosahedra in boron carbide
correct?," J. Less-Common Met., 67 13-18 (1979).

180
39. F.W.Glaser, D.Moskowitz, and B.Post, J.Appl.Phys, 24[6] (1953).
40. M. Bouchacourt and F. Thévenot, "Etudes sur le carbure de bore. I. Métallographie et
microdureté Knoop du carbure de bore," J. Less-Common Met., 59 119-30 (1978).
41. A. Vogt and F. Schroll, "Electrothermic production of boron carbide." in. Google
Patents, 1939.
42. W. S. Wilson and P. J. Guichelaar, "Electric Arc Furnace Processes," pp. 131-36. in
Carbide, Nitride and Boride Materials Synthesis and Processing. Springer, 1997.
43. A. K. Suri, C. Subramanian, J. K. Sonber, and T. Murthy, "Synthesis and consolidation
of boron carbide: a review," Int. Mater. Rev., 55[1] 4-40 (2010).
44. W. Yang, L. Zhang, L. Cheng, Y. Liu, and W. Zhang, "Preparation and Comparision
of Two Typical CVD Films from CH4 and C3H6 as Carbon Resources," Ceramic
Materials and Components for Energy and Environmental Applications: Ceramic
Transactions, 210 47 (2010).
45. R. Riedel and I.-W. Chen, "Ceramics Science and Technology, Materials and
Properties," Vol. 2. John Wiley & Sons, (2011).
46. A. Lipp, "Boron carbide: Production, properties, application," Tech. Rundsch., 58[7] 1-
47 (1966).
47. H. Salimijazi, T. Coyle, J. Mostaghimi, and L. Leblanc, "Characterization of Vacuum
Plasma Sprayed Boron Carbide," Thermal Spray (2004).
48. O. Conde, A. Silvestre, and J. Oliveira, "Influence of carbon content on the
crystallographic structure of boron carbide films," Surface and Coatings
Technology, 125[1] 141-46 (2000).
49. D. W. Maiorano, "The evolution and implication of boron carbide microstructural
variations and transformations during powder processing." in. Rutgers University-
Graduate School-New Brunswick, 2011.
50. B. Champagne and R. Angers, "Mechanical Properties of Hot‐Pressed B‐B4C
Materials," Journal of the American Ceramic Society, 62[3‐4] 149-53 (1979).
51. M. Beauvy, "Properties mechaniques du carbide de bore'Fritte'," Rev. Int. Hautes
(1982).
52. A. Osipov, I. Ostapenko, V. Slezov, R. Tarasov, V. Podtykan, and N. Kartsev, "Effect
of porosity and grain size on the mechanical properties of hot-pressed boron
carbide," Soviet Powder Metallurgy and Metal Ceramics, 21[1] 55-58 (1982).
53. H. Lee and R. F. Speyer, "Hardness and Fracture Toughness of Pressureless‐Sintered
Boron Carbide (B4C)," Journal of the American Ceramic Society, 85[5] 1291-93
(2002).
54. Kieffer-Benesovsky, Hartsoffe, 42 (1963).
55. R. D. Allen, "The solid solution series boron - boron carbide," J. Am. Chem. Soc., 75
3582 (1953).
56. K. Niihara, A. Nakahira, and T. Hirai, "The effect of stoichiometry on mechanical
properties of boron carbide," J. Am. Ceram. Soc., 67[1] C13-C14 (1984).
57. M. Chheda, J. Shih, C. Gump, and A. Weimer, "Synthesis and processing of boron-rich
boron carbide." in. Ceradyne Inc., Costa Mesa, CA, 2008.
58. K. J. McClellan, F. Chu, J. M. Roper, and I. Shindo, "Room temperature single crystal
elastic constants of boron carbide," J. Mater. Sci., 36[14] 3403-07 (2001).
59. J. H. Gieske, T. L. Aselage, and D. Emin, "Elastic properties of boron carbides," pp.
376-79. in Boron-Rich Solids. AIP Conf. Proc. Edited by D. Emin, T. Aselage, C.

181
L. Beckel, A. C. Switendick, and B. Morosin. American Institute of Physics, New
York, 1991.
60. M. H. Manghnani, Y. Wang, F. Li, P. Zinin, and W. Rafaniello, "Elastic and vibrational
properties of B4C to 21 GPa," pp. 945-48. in Science and Technology of High
Pressure. Edited by M. H. Manghnani, W. J. Nellis, and M. F. Nicol. Universities
Press, Hyderabad, India, 2000.
61. R. J. Nelmes, J. S. Loveday, R. M. Wilson, W. G. Marshall, J. M. Besson, S. Klotz, G.
Hamel, T. L. Aselage, and S. Hull, "Observation of inverted-molecular
compression in boron carbide," Phys. Rev. Lett., 74[12] 2268-71 (1995).
62. R. Vojtovich, "Oxidation of carbides and nitrides," (1981).
63. L. M. Litz and R. Mercuri, "Oxidation of Boron Carbide by Air, Water, and Air‐Water
Mixtures at Elevated Temperatures," Journal of the Electrochemical Society,
110[8] 921-25 (1963).
64. M. Steinbrück, A. Meier, U. Stegmaier, and L. Steinbock, "Experiments on the
oxidation of boron carbide at high temperatures," Vol. 6979. FZKA, (2004).
65. M. L. Wilkins, "Third progress report of light armor program." in. Lawrence Livermore
National Laboratory, University of California, CA, 1968.
66. M. V. Demirbas, "Microstructure-property relationship in silicon carbide armor
ceramics," (2008).
67. M. Chen, J. W. McCauley, and K. J. Hemker, "Shock-induced localized amorphization
in boron carbide," Science, 299 1563-66 (2003).
68. J. W. Mccauley, "Summary of hugoniot elastic limit findings," (2005).
69. T. J. Vogler, W. D. Reinhart, and L. C. Chhabildas, "Dynamic behavior of boron
carbide," J. Appl. Phys., 95[8] 4173-83 (2004).
70. R. G. McQueen, S. P. Marsh, J. W. Taylor, J. N. Fritz, and W. J. Carter, "The equation
of state of solids from shock wave studies," pp. 239-417. in High-Velocity Wave
Phenomena. Edited by R. Kinslow. Academic Press, New York, 1970.
71. M. N. Pavlovskii, "Shock compressibility of six very hard substances," Sov. Phys. Solid
State, 12 1736-37 (1971).
72. W. H. Gust, A. C. Holt, and E. B. Royce, "Dynamic yield, compressional, and elastic
parameters for several lightweight intermetallic compounds," J. Appl. Phys., 44[2]
550-60 (1973).
73. D. E. Grady, "Analysis of shock and high-rate data for ceramics: Equation of state
properties and fragmentation in the ballistic environment." in. Applied Research
Associates, Inc., Albuquerque, NM, 2009.
74. D. E. Grady, "Analysis of shock and high-rate data for ceramics: Application to boron
carbide and silicon carbide." in. Applied Research Associates, Inc., Albuquerque,
NM, 2002.
75. D. E. Grady, "Shock-wave strength properties of boron carbide and silicon carbide," J.
Phys. IV, 4 385-91 (1994).
76. Y. Zhang, T. Mashimo, Y. Uemura, M. Uchino, M. Kodama, K. Shibata, K. Fukuoka,
M. Kikuchi, T. Kobayashi, and T. Sekine, "Shock compression behaviors of boron
carbide (B4C)," J. Appl. Phys., 100[11] 113536 (2006).
77. D. Ge, V. Domnich, T. Juliano, E. A. Stach, and Y. Gogotsi, "Structural damage in
boron carbide under contact loading," Acta Mater., 52[13] 3921-27 (2004).

182
78. J. Hay, "Introduction to instrumented indentation testing," Experimental Techniques,
33[6] 66-72 (2009).
79. V. Domnich, Y. Gogotsi, M. Trenary, and T. Tanaka, "Nanoindentation and Raman
spectroscopy studies of boron carbide single crystals," Appl. Phys. Lett., 81[20]
3783-85 (2002).
80. X. Q. Yan, W. J. Li, T. Goto, and M. W. Chen, "Raman spectroscopy of pressure-
induced amorphous boron carbide," Appl. Phys. Lett., 88 131905 (2006).
81. D. Taylor, E., J. McCauley, W., and T. W. Wright, "The effects of stoichiometry on the
mechanical properties of icosahedral boron carbide under loading," J. Phys.:
Condens. Mat., 24[50] 505402 (2012).
82. H. Werheit, H. Binnenbruck, and A. Hausen, "Optical properties of boron carbide and
comparison with b-rhombohedral boron," Phys. Status Solidi B, 47 153-58 (1971).
83. J. Lagrenaudie, "A study of the properties of boron," J. Phys.-Paris, 14 14-18 (1953).
84. M. Yamazaki, "Electronic band structure of boron carbide," The Journal of Chemical
Physics, 27[3] 746-51 (1957).
85. H. Dekura, K. Shirai, and A. Yanase, "Metallicity of boron carbides at high pressure "
J. Phys.: Conf.Ser., 215 012117 (2010).
86. H. Rietveld, "A profile refinement method for nuclear and magnetic structures,"
Journal of applied Crystallography, 2[2] 65-71 (1969).
87. R. Jenkins, "An introduction to X-ray powder diffractometry." Philips
Gloeilampenfabrieken, (1970).
88. L. McCusker, R. Von Dreele, D. Cox, D. Louër, and P. Scardi, "Rietveld refinement
guidelines," Journal of Applied Crystallography, 32[1] 36-50 (1999).
89. G. Will, "Powder diffraction: The Rietveld method and the two stage method to
determine and refine crystal structures from powder diffraction data." Springer
Science & Business Media, (2006).
90. S. K. Chatterjee, "X-ray diffraction: Its theory and applications." PHI Learning Pvt.
Ltd., (2010).
91. P. Thompson, D. Cox, and J. Hastings, "Rietveld refinement of Debye–Scherrer
synchrotron X-ray data from Al2O3," Journal of Applied Crystallography, 20[2]
79-83 (1987).
92. "Standard Test Methods for Chemical, Mass Spectrometric, and Spectrochemical
Analysis of Nuclear-Grade Boron Carbide." in. ASTM International, 2012.
93. LECO, "Carbon Determinator - C/S 230," pp. 7.1-7.3. in., 2008.
94. LECO, "Oxygen/Nitrogen Determinator - TC 600," 7.1-7.3 (2008).
95. K. Y. Xie, M. F. Toksoy, K. Kuwelkar, B. Zhang, J. A. Krogstad, R. A. Haber, and K.
J. Hemker, "Effect of alumina on the structure and mechanical properties of spark
plasma sintered boron carbide," Journal of the American Ceramic Society, 97[11]
3710-18 (2014).
96. D. Gosset and M. Colin, "Boron carbides of various compositions: an improved method
for x-ray characterization," J. Nucl. Mater., 183 161-73 (1991).
97. M. Bouchacourt and F. Thévenot, "The properties and structure of the boron carbide
phase," J. Less-Common Met., 82 227-35 (1981).
98. T. L. Aselage, D. R. Tallant, J. Gieske, S. Van Deusen, and R. Tissot, "Preparation and
properties of icosahedral borides," pp. 97-111. in The Physics and Chemistry of
Carbides, Nitrides and Borides. Springer, 1990.

183
99. H.E.Robson. in, Vol. PHD. University of Kansas, 1959.
100. D. R. Tallant, T. L. Aselage, A. N. Campbell, and D. Emin, "Boron carbide structure
by Raman spectroscopy," Phys. Rev. B, 40[8] 5649-56 (1989).
101. U. Kuhlmann and H. Werheit, "Raman effect of boron carbide (B4.3C to B10.37C)," J.
Alloy. Compd., 205 87-91 (1994).
102. T. L. Aselage, D. R. Tallant, and D. Emin, "Isotope dependencies of Raman spectra
of B12As2, B12P2, B12O2, and B12+xC3-x: Bonding of intericosahedral chains," Phys.
Rev. B, 56[6] 3122-29 (1997).
103. F. Demangeot, P. Puech, V. Paillard, V. Domnich, and Y. G. Gogotsi, "Spatial
distribution of strain and phases in Si nano-indentation analysed by Raman
mapping," pp. 777-82. in Gettering and Defect Engineering in Semiconductor
Technology, Vol. 82-84. Solid State Phenomena. Edited by V. Raineri, F. Priolo,
M. Kittler, and H. Richter. Trans Tech Publications Ltd, Zurich-Uetikon, 2002.
104. H. Werheit, H. W. Rotter, F. D. Meyer, H. Hillebrecht, S. O. Shalamberidze, T. G.
Abzianidze, and G. G. Esadze, "FT-Raman spectra of isotope-enriched boron
carbide," J. Solid State Chem., 177 569-74 (2004).
105. D. R. Tallant, T. L. Aselage, and D. Emin, "Structure of icosahedral borides by Raman
spectroscopy," pp. 301-11. in Boron-Rich Solids. AIP Conf. Proc. Edited by D.
Emin, T. Aselage, C. L. Beckel, A. C. Switendick, and B. Morosin. American
Institute of Physics, New York, 1991.
106. H. Werheit, U. Kuhlmann, M. Laux, and R. Telle, "Solid solutions of silicon in boron-
carbide-type crystals," J. Alloys Compd., 209 181-87 (1994).
107. R. Schmechel and H. Werheit, "Correlation between structural defects and electronic
properties of icosahedral boron-rich solids," J. Phys.: Condens. Mat., 11 6803-13
(1999).
108. H. Werheit, A. Leithe-Jasper, T. Tanaka, H. Rotter, and K. Schwetz, "Some properties
of single-crystal boron carbide," Journal of Solid State Chemistry, 177[2] 575-79
(2004).
109. R. Lazzari, N. Vast, J. M. Besson, S. Baroni, and A. Dal Corso, "Atomic structure and
vibrational properties of icosahedral B4C boron carbide," Phys. Rev. Lett., 83[16]
3230-33 (1999).
110. N. Vast, R. Lazzari, J. M. Besson, S. Baroni, and A. Dal Corso, "Atomic structure and
vibrational properties of icosahedral α-boron and B4C boron carbide," Comp.
Mater. Sci., 17 127-32 (2000).
111. A. C. Ferrari and J. Robertson, "Interpretation of the Raman spectra of disordered and
amorphous carbon," Phys. Rev. B, 61[20] 14095-107 (2000).
112. F. Tuinstra and J. L. Koenig, "Raman spectrum of graphite," J. Chem. Phys., 53 1126-
30 (1970).
113. U. Kuhlmann and H. Werheit, "Improved Raman effect studies on boron carbide
(B4.3C)," Phys. Status Solidi B, 175 85-92 (1993).
114. V. Domnich, D. W. Maiorano, R. A. Haber, and J. W. McCauley, "Raman
spectroscopy and X-ray diffraction studies of boron carbide with variable
stoichiometries," pp. in preparation. in., 2011.
115. A. Alizadeh, E. Taheri-Nassaj, and N. Ehsani, "Synthesis of boron carbide powder by
a carbothermic reduction method," J. Eur. Ceram. Soc., 24[10–11] 3227-34 (2004).

184
116. K. A. Schwetz and J. Hassler, "A wet chemical method for the determination of free
carbon in boron carbide, silicon carbide and mixtures thereof," J. Less-Common
Met., 117[1–2] 7-15 (1986).
117. M. Beauvy and R. Angers, "Method for the determination of free graphite in boron
carbide," J. Less-Common Met., 80[2] 227-33 (1981).
118. P. Walker, J. Rakszawsiki, and A. Amington, "Distinguishing between graphitic and
amorphous carbon," ASTM Bulletin, 208 52-54 (1955).
119. C. Houska and B. Warren, "X‐Ray Study of the Graphitization of Carbon Black,"
Journal of Applied Physics, 25[12] 1503-09 (1954).
120. J. Zhao, L. Yang, F. Li, R. Yu, and C. Jin, "Structural evolution in the graphitization
process of activated carbon by high-pressure sintering," Carbon, 47[3] 744-51
(2009).
121. H. Takagi, K. Maruyama, N. Yoshizawa, Y. Yamada, and Y. Sato, "XRD analysis of
carbon stacking structure in coal during heat treatment," Fuel, 83[17] 2427-33
(2004).
122. B. K. Saikia, R. K. Boruah, and P. K. Gogoi, "A X-ray diffraction analysis on
graphene layers of Assam coal," Journal of chemical sciences, 121[1] 103-06
(2009).
123. Z. Q. Li, C. J. Lu, Z. P. Xia, Y. Zhou, and Z. Luo, "X-ray diffraction patterns of
graphite and turbostratic carbon," Carbon, 45[8] 1686-95 (2007).
124. A. Austin and W. Hedden, "Graphitization processes in cokes and carbon blacks,"
Industrial & Engineering Chemistry, 46[7] 1520-24 (1954).
125. H. Pinnick, "X‐Ray Diffraction of Heat‐Treated Carbon Blacks," The Journal of
Chemical Physics, 20[4] 756-57 (1952).
126. L. E. Alexander and E. C. Sommer, "Systematic analysis of carbon black structures,"
The Journal of Physical Chemistry, 60[12] 1646-49 (1956).
127. K. Norrish and R. M. Taylor, "Quantitative analysis by X-ray diffraction," Clay Miner.
Bull, 5[28] 98-109 (1962).
128. B. D. Cullity and J. W. Weymouth, "Elements of X-ray Diffraction," American
Journal of Physics, 25[6] 394-95 (1957).
129. H. Lipson and A. Stokes, "The structure of graphite," pp. 101-05 in Proceedings of
the Royal Society of London A: Mathematical, Physical and Engineering Sciences.
Vol. 181.
130. J. Méring and J. Maire, "Aspects structuraux de la graphitation," Les Carbones, Le
Groupe Français dÉtude des Carbones, 1 129-75 (1965).
131. J. Maire and J. Mering, "Graphitization of soft carbons," Chemistry and physics of
carbon, 6 125-90 (1970).
132. L. Zou, B. Huang, Y. Huang, Q. Huang, and C. a. Wang, "An investigation of
heterogeneity of the degree of graphitization in carbon–carbon composites,"
Materials Chemistry and Physics, 82[3] 654-62 (2003).
133. H. Gavin, "The Levenberg-Marquardt method for nonlinear least squares curve-fitting
problems." in., 2011.
134. R. Couture, "Intelligent Interpolation for Background Subtration-A Hybrid Approach
For Trace-Element Analysis," (2001).

185
135. P. S. Prevéy, "X-ray diffraction characterization of crystallinity and phase
composition in plasma-sprayed hydroxyapatite coatings," Journal of Thermal
Spray Technology, 9[3] 369-76 (2000).
136. H. Shi, J. Reimers, and J. Dahn, "Structure-refinement program for disordered
carbons," Journal of applied crystallography, 26[6] 827-36 (1993).
137. G. Will and K. Kossobutzki, "An X-ray diffraction analysis of boron carbide, B 13 C
2," Journal of the Less Common Metals, 47 43-48 (1976).
138. D. R. Armstrong, J. Balland, P. G. Pukins, and A. Kirfel, "The nature of the chemical
bonding in boron barbide. IV. Electronic band structure of boron carbide, B13C2,
and three models of the structure B12C3 " Acta Cryst. B, 39 324-29 (1983).
139. H. Werheit, T. Au, R. Schmechel, S. O. Shalamberidze, G. I. Kalandadze, and A. M.
Eristavi, "IR-active phonons and structure elements of isotope-enriched boron
carbide," J. Solid State Chem., 154 79-86 (1999).
140. U. Kuhlmann, H. Werheit, and K. A. Schwetz, "Distribution of carbon atoms on the
boron carbide structure elements," J. Alloy. Compd., 189 249-58 (1992).
141. W. C. Oliver and G. M. Pharr, "An improved technique for determining hardness and
elastic modulus using load and displacement sensing indentation experiments," J.
Mater. Res., 7[6] 1564-83 (1992).
142. H. Werheit, "On microstructure and electronic properties of boron carbide," pp. 87-
102 in Advances in Ceramic Armor X: A Collection of Papers Presented at the 38th
International Conference on Advanced Ceramics and Composites January 27-31,
2014.
143. J. Nocedal and S. Wright, "Numerical optimization." Springer Science & Business
Media, (2006).
144. K. Kuwelkar, V. Domnich, W. Rafaniello, R. A. Haber, K. Behler, and J. LaSalvia,
"Investigation of the Structural Properties of Boron Carbide Across the Solubility
Range," In Preparation (2016).
145. B. Morosin, T. Aselage, and R. Feigelson, "Crystal structure refinements of
rhombohedral symmetry materials containing boron-rich icosahedra," pp. 145 in
MRS Proceedings. Vol. 97.
146. T. Aselage, S. Van Deusen, and B. Morosin, "Solution growth, structure and
composition of boron carbide crystals," Journal of the Less Common Metals, 166[1]
29-44 (1990).
147. D. Emin, "Structure and single-phase regime of boron carbides," Phys. Rev. B, 38[9]
6041-55 (1988).
148. O. Sologub, Y. Michiue, and T. Mori, "Boron carbide, b13-xc2-y (x= 0.12, y= 0.01),"
Acta Crystallographica Section E: Structure Reports Online, 68[8] i67-i67 (2012).
149. D. Hallam, A. Heaton, B. James, P. Smith, and J. Yeomans, "The correlation of
indentation behaviour with ballistic performance for spark plasma sintered armour
ceramics," Journal of the European Ceramic Society, 35[8] 2243-52 (2015).
150. S. Aydin and M. Simsek, "Hypothetically superhard boron carbide structures with a
B11C icosahedron and three-atom chain," Phys. Status Solidi B, 246[1] 62-70
(2009).
151. X. J. Guo, J. L. He, Z. Y. Liu, Y. J. Tian, J. Sun, and H. T. Wang, "Bond ionicities
and hardness of B13C2-like structured ByX crystals (X=C,N,O,P,As)," Phys. Rev.
B, 73[10] 104115 (2006).

186
152. F. Gao, L. Hou, and Y. He, "Origin of superhardness in icosahedral B12 materials," J.
Phys. Chem. B, 108[35] 13069-73 (2004).
153. V. I. Ivashchenko, V. I. Shevchenko, and P. E. A. Turchi, "First-principles study of
the atomic and electronic structures of crystalline and amorphous B4C," Phys. Rev.
B, 80[23] 235208 (2009).
154. G. Fanchini, J. W. McCauley, and M. Chhowalla, "Behavior of disordered boron
carbide under stress," Phys. Rev. Lett., 97[3] 035502 (2006).
155. Q. An, W. A. Goddard III, and T. Cheng, "Atomistic explanation of shear-induced
amorphous band formation in boron carbide," Physical review letters, 113[9]
095501 (2014).
156. J. D. Hogan, D. Mallick, V. Domnich, K. Kuwelkar, J. W. McCauley, L. Farbaniec,
and K. T. Ramesh, "Fragmentation of an Advanced Ceramic under Ballistic
Impact:Mechanisms and Microstructure." in., 2016.
157. J. D. Hogan, L. Farbaniec, M. Shaeffer, and K. Ramesh, "The Effects of
Microstructure and Confinement on the Compressive Fragmentation of an
Advanced Ceramic," Journal of the American Ceramic Society (2014).
158. J. Kimberley, K. Ramesh, and N. Daphalapurkar, "A scaling law for the dynamic
strength of brittle solids," Acta Materialia, 61[9] 3509-21 (2013).
159. K. Y. Xie, K. Kuwelkar, R. A. Haber, J. C. LaSalvia, and K. J. Hemker,
"Microstructural Characterization of a Commercial Hot‐pressed Boron Carbide
Armor Plate," Journal of the American Ceramic Society (2016).
160. L. Farbaniec, J. Hogan, and K. Ramesh, "Micromechanisms associated with the
dynamic compressive failure of hot-pressed boron carbide," Scripta Materialia,
106 52-56 (2015).


