http://www.diva-portal.org This is the published version of a paper published in The Prostate. Citation for the original published paper (version of record): Häggström, J., Cipriano, M., Plym Forshell, L., Persson, E., Hammarsten, P. et al. (2014) Potential upstream regulators of cannabinoid receptor 1 signaling in prostate cancer: A Bayesian network analysis of data from a tissue microarray. The Prostate, 74(11): 1107-1117 http://dx.doi.org/10.1002/pros.22827 Access to the published version may require subscription. N.B. When citing this work, cite the original published paper. Permanent link to this version: http://urn.kb.se/resolve?urn=urn:nbn:se:umu:diva-91251
Transcript
http://www.diva-portal.org
This is the published version of a paper published in The Prostate.
Citation for the original published paper (version of record):
Häggström, J., Cipriano, M., Plym Forshell, L., Persson, E., Hammarsten, P. et al. (2014)
Potential upstream regulators of cannabinoid receptor 1 signaling in prostate cancer: A Bayesian
network analysis of data from a tissue microarray.
The Prostate, 74(11): 1107-1117
http://dx.doi.org/10.1002/pros.22827
Access to the published version may require subscription.
N.B. When citing this work, cite the original published paper.
Permanent link to this version:http://urn.kb.se/resolve?urn=urn:nbn:se:umu:diva-91251
PotentialUpstreamRegulators of CannabinoidReceptor1Signaling in ProstateCancer: ABayesianNetworkAnalysis
ofData FromaTissueMicroarrayJenny H€aggstr€om,1 Mariateresa Cipriano,2 Linus Plym Forshell,2 Emma Persson,3
Peter Hammarsten,4 Nephi Stella,5 and Christopher J. Fowler2*1Departmentof Statistics,Umea
BACKGROUND. The endocannabinoid system regulates cancer cell proliferation, and inprostate cancer a high cannabinoid CB1 receptor expression is associated with a poorprognosis. Down-stream mediators of CB1 receptor signaling in prostate cancer are known,but information on potential upstream regulators is lacking.RESULTS. Data from a well-characterized tumor tissue microarray were used for a Bayesiannetwork analysis using the max-min hill-climbing method. In non-malignant tissue samples, adirectionality of pEGFR (the phosphorylated form of the epidermal growth factor receptor) !CB1 receptors were found regardless as to whether the endocannabinoid metabolizing enzymefatty acid amide hydrolase (FAAH) was included as a parameter. A similar result was found inthe tumor tissue, but only when FAAH was included in the analysis. A second regulatorypathway, from the growth factor receptor ErbB2 ! FAAH was also identified in the tumorsamples. Transfection of AT1 prostate cancer cells with CB1 receptors induced a sensitivity tothe growth-inhibiting effects of the CB receptor agonist CP55,940. The sensitivity was notdependent upon the level of receptor expression. Thus a high CB1 receptor expression alonedoes not drive the cells towards a survival phenotype in the presence of a CB receptor agonist.CONCLUSIONS. The data identify two potential regulators of the endocannabinoid systemin prostate cancer and allow the construction of a model of a dysregulated endocannabinoidsignaling network in this tumor. Further studies should be designed to test the veracity ofthe predictions of the network analysis in prostate cancer and other solid tumors. Prostate 74:1107–1117, 2014. # 2014 The Authors. The Prostate published by Wiley Periodicals, Inc. This is an openaccess article under the terms of the Creative Commons Attribution-NonCommercial-NoDerivs License,which permits use and distribution in any medium, provided the original work is properly cited, the use isnon-commercial and no modifications or adaptations are made.
Grant sponsor: The Swedish Research Council; Grant number:12158; Grant sponsor: The Swedish Cancer Society; Grant number:CAN2010/437; Grant sponsor: NIH; Grant number: DA014486;Grant sponsor: The Swedish Research Council Formas;Grant sponsor: The Kempe Foundations; Grant sponsor: Lion’sCancer Research Foundation, Umea
�University; Grant sponsor: The
Research Funds of the Medical Faculty, Umea�University.
Jenny H€aggstr€om, Mariateresa Cipriano, and Linus Plym Forshellcontributed equally to the study.
Conflict of interest: none.
The present address of Linus Plym Forshell is the Swedish Patentand Registration Office, Stockholm, Sweden�Correspondence to: Professor Christopher J. Fowler, Department ofPharmacology and Clinical Neuroscience, Umea
In 1975, Munson and colleagues reported that ~9-tetrahydrocannabinol, the main psychoactive constitu-ent of cannabis, reduced tumor growth, and increasedlife span in a xenograft model of lung cancer [1]. Sincethen, a large number of studies have demonstrated thatthe endocannabinoid system, defined here as cannabi-noid CB1 and CB2 receptors, their endogenous ligandsanandamide (AEA) and 2-arachidonoylglycerol (2-AG),and their synthetic and metabolic enzymes, controlcancer cell proliferation, and migration [2–5]. Theprostate gland expresses a functional epithelial CB1
receptor, which in the rat is involved in the control ofthe contraction of the gland [6,7], and its expression isincreased in prostate cancer (Pca) cells [8,9], as is theexpression of several endocannabinoid metabolizingenzymes, such as fatty acid amide hydrolase (FAAH)[10,11], cyclooxygenase-2 [12], and acylglycerol kinase[13]. Data from cell cultures and animal models areconsistent with the hypothesis that the circulatingendocannabinoid system can dampen the proliferationand invasivity of Pca cells [14–17], although mitogeniceffects of low concentrations of CB1 receptor agonistssecondary to activation of the Akt signaling pathwayhave been described [18]. In Pca tumor samples, CB1
receptor scores and pAkt scores are correlated andshow a significant interaction term in ordinal regres-sion analyses with the Gleason score as the dependentvariable [19].
Whilst down-stream mediators of CB1 receptorsignaling in Pca have been well-investigated (review,see [4]), little is known concerning potential upstreamregulators of this receptor. One way of identifyingpotential candidates is to undertake a Bayesian net-work analysis of available tissue microarray data, tocreate a directed acyclic graph. This method usesprobabilistic theory to create a map of the nodes (thevariables chosen) and edges (shown as arrows) withdirectionality, and where cyclicity is not allowed (forreview, see [20]). It has been used successfully in anumber of very different biological situations rangingfrom mapping the evolution of Thoracian barnaclesto delineating signaling networks in human primaryna€ıve CD4þ T cells [21,22]. In the present study, wehave utilized this approach and identified the activat-ed (phosphorylated) form of the epidermal growthfactor receptor (pEGFR) as a potential upstreamregulator of CB1 receptors in Pca.
MATERIALSANDMETHODS
PatientMaterial and Immunochemistry
The tissue material (formalin-fixed, paraffin-embeddedsamples) was collected at the Regional Hospital,
V€astera�s, Sweden, between 1975 and 1991 from a total
of 419 patients consecutively diagnosed with Pcafollowing transurethral resection for lower urinary tractsymptoms [23,24]. The patients had not received anti-cancer therapy before undergoing the transurethralresection procedure. The distribution of Gleason scores(number [%] of cases) in the material was 4–5, 98(23%); 6, 110 (26%); 7, 72 (17%); 8–10, 139 (33%). Thetumor stage (when given in the database) was 1a–1b,210 (51%); 2, 107 (26%); 3, 81 (20%); 4, 13 (3%). A totalof 48 (15%) of 322 cases were found to have metastases(bone scan) at diagnosis. The patients were followeduntil 2003 (for further details, see [23] [for the first 305cases] and [24] [for the entire dataset]). Tissue micro-arrays were constructed and in general between 1 and8 cores (usually 5, including both primary and second-ary Gleason grade areas; tumor tissue) could be scoredfor the parameter in question. The mean % of thespecimen that was tumor associated (% ca) variedfrom 5% to 100%, with cases >5% showing a poorerprognosis than those �5% [23]. The number (%) ofcases at % ca levels of 5, 10–25, 30–50, 55–75, and 80–100, were 81 (19%), 125 (30%), 56 (13%), 46 (11%), and111 (26%), respectively. Immunoreactive scores for theepithelial CB1 receptor (CB1R), EGFR, pEGFR, ErbB2,LRIG1, platelet-derived growth factor receptor ß(PDFRß), androgen receptor (AR), von Willebrandfactor (vWf), endoglin, hyaluronan, mast cell, andFAAH used in the present study were taken from ourdatabase (see [11,19,25–32] for published data anddetails of the methodologies). For the main parametersused here with the exception of LRIG1, the cores werescored on the basis of intensity and distribution to givea composite value. Thus, for example, a core scored at25% intensity 1, 25% intensity 2, and 50% intensity 3for the biomarker in question would score 0.25�1þ 0.25� 2þ 0.5� 3¼ 2.25. The intensity ranges forCB1R and ErbB2 were 0–4, pEGFR 0–5, LRIG1 0–2, andFAAH 0–3. The composite score thus represents ameasure of the “loading” of the tumor for the parame-ter in question. For some parameters (e.g., FAAH [11]),the scores were made upon microscopic evaluation ofthe cores. This was also the case for the CB1 receptorsin our initial study using an intensity range of 0–3 [33].However, we rescored digital images of the samplesusing a range 0–4 and two investigators, who returnedscores with a very high inter-rater reliability (Chron-bach’s alpha of 0.94 for an intra-class correlation analysisusing a mixed model and testing for consistency [19])and we used these values here. In both these examples,the investigators were blind to the clinical data, otherthan the obvious morphological characteristics of thesamples, when scoring the cores. The antibodies usedfor the main parameters were: CB1R, AbCam cat. no.23703, lot no. 280229; pEGFR, Cell Signaling TYR845
1108 H€aggstr€omet al.
The Prostate
lot 4; FAAH, an antibody raised against the last 102amino acids of rat FAAH and kindly provided by Prof.Ken Mackie, Indiana University, USA; LRIG1, Agriserarabbit polyclonal LRIG1-151; ErbB2, mouse c-erbB-2Prediluted Cocktail Antibody, Biocare ([11,27,30,33]and unpublished data). The Ventana system was usedfor high-throughput immunostaining of the samples(see the above papers for details).
The research ethical committee at Umea�university
hospital (Regional Ethical Review Board in Umea�,
Sweden) approved of the study and waived the needfor informed consent. In the database used for theanalyses, the tissue samples were given a case numberand year, and the patient names were not indicated inthe database.
CB1Receptor-TransfectedAT1Cells
R3327-AT1 rat Dunning prostate cancer cells(ATCC, Manassas, VA; hereafter called AT1 cells) werecultured in RPMI medium (10% FBS, 1% penicillin-streptomycin, 2mM glutamine, 250 nM dexametha-sone). The cells were seeded out at 250,000–300,000cells per well in 6-well plates. The next day, the cellswere transfected either with the control plasmid(pIRES2-eGFP) or the murine CB1 receptor-containingplasmid (pIRES2-mCB1-eGFP) using the TransIT1-prostate transfection kit and protocol supplied by theMirus Corporation (Madison, WI). For details of theplasmids, see [34]. Initial experiments indicated thatthe ratio of DNA: TransIT1-reagent: Prostate Boostreagent (supplied in the kit) of 3mg: 10ml: 10ml gavethe best transfections. After incubation with theprostate boost reagent for 20min, chloroquine (25mMfinal concentration) was added and the samples wereincubated for 150min. Thereafter, the transfectionmedia was replaced by media containing 10% (v/v)glycerol, the cells were incubated for 3min at roomtemperature followed by two washes with warmphosphate-buffered saline. Finally, the culture mediawas added and the cells were allowed to grow for 48–72 hr prior to assessing the number of eGFP-positivecells by FACS analysis. Cells were selected in growthmedium containing G418 (400mg/ml). This protocolprovided cells with a very large range of fluorescenceintensity on FACS. Initial experiments indicated thatincubation with a low concentration of CP55,940((�)-cis-3-[2-hydroxy-4-(1,1-dimethylheptyl)phenyl]-trans-4-(3-hydroxypropyl)cyclohexanol; Tocris Cookson, Bristol,UK), resulted in a loss of the highest intensity cells forboth the eGFP- and CB1/eGFP-transfected cells, sug-gesting that at this level of transfection, the plasmidload is detrimental to cell survival regardless of theabsence or presence of the murine CB1 receptors. Inconsequence, these cells were removed by a 6-day
incubation of both eGFP- and CB1/eGFP-transfectedcells with 10nM CP55,940 after which the cells werecultured for 2 weeks to amplify the stocks. In theexperiments reported here, the cells, in six-well cultureplates, were then incubated with test compounds for3 days, and cell proliferation and fluorescence intensi-ties were determined by FACS using a Guava easy-CyteTM Flow Cytometer (Merck Millipore).
Statistics
Three statistical software programmes were used.Two-way ANOVA and Spearman’s correlation coeffi-cients were determined using the statistical packagebuilt into the GraphPad Prism 5 and 6 computerprogrammes for the Macintosh (GraphPad SoftwareInc., San Diego, CA). Univariate regressions using thegeneral linear model were undertaken using SPSSsoftware (IBM SPSS statistics version 22 for the Macin-tosh, IBM Corporation, Armonk, NY). The directedacyclic graphs and bootstrap analyses were calculatedusing the function mmhc in the bnlearn package of theR computer programme [35].
RESULTS
Interconnection between CB1R, pEGFR, ErbB2,LRIG1, and FAAH in prostate tumor tissue.
To identify potential components of a network thatencompasses CB1 receptors and is involved in Pca celltumourigenesis, we undertook a simple bivariatecorrelation analysis with a number of different bio-chemical markers that have been scored in a well-characterized Pca tumor microarray (see [11,19,23–33]for hitherto published data). Using a cut-off Spear-man’s rho value of 0.2, four parameters were identi-fied: pEGFR, FAAH (as reported previously, [11,32]),the growth factor receptor ErbB2, and the EGFRregulatory protein LRIG1 (leucine-rich and immuno-globulin-like domains protein 1) (Fig. 1). These associ-ations were not seen in the non-malignant tissue(Fig. 1).
Although the sample set were consecutive cases,the nature of their accruement (diagnosis followingtransurethral resection) means that they are not anunselected set of all Pca cases, since cases with Pca butnot in the resected region will have been missed.Further, there has been a shift over time in the severityof the disease (i.e., relative incidence of the differenttumor stages and Gleason scores) at diagnosis sincethe introduction of PSA testing [36]. In order to gaininformation as to whether this could be a limitingfactor in our study, we conducted univariate regres-sions using the general linear model with the tumorCB1 receptor scores as the dependent variables, the
Cannabinoid Receptors in Prostate Cancer 1109
The Prostate
Gleason scores (grouped as 4–6, 7, and 8–10) and thetumor stages (grouped as 1a–1b, 2, 3, and 4) as fixedfactors, and each of the four parameters identifiedabove as co-variates. In each case, the co-variatescontributed significantly to the regression. The unstan-dardized beta weights (with 95% confidence intervalsin brackets) for the four co-variates were: pEGFR,0.125 (0.039–0.210), P< 0.005; FAAH, 0.224 (0.091–0.356), P< 0.001; ErbB2, 0.212 (0.117–0.306),P< 0.0001; LRIG1, 0.345 (0.161–0.530), P< 0.0005. Inall cases, the Levene’s test of equality of error varian-ces was satisfied (P> 0.3). This indicates that theassociations between the four parameters and the CB1
receptor score in the tumor tissue remain even whencontrolled for the severity of the disease at diagnosis.
For the non-malignant samples, the data availablein the database was used to construct two directedacyclic graphs, one with three variables (CB1R, luminalepithelial pEGFR and LRIG1), and one with fourvariables (CB1R, luminal epithelial pEGFR, LRIG1,and luminal epithelial FAAH; non-malignant ErbB2was not scored in a sufficient number of cores to beused). The method used to conduct the analysis wasthe max-min hill-climbing algorithm, which givesevery possible network a score, and outlines a networkwith the highest score that best fits the data [37].
Further, the datasets were subjected to a bootstrapanalysis and the process was repeated 1,000 times toestimate the uncertainty in the analyses. A bootstrapdataset of the same size as the original dataset isobtained by random sampling with replacementfrom the observations in the original data. For eachbootstrap sample, a directed acyclic graph was con-structed, and then the frequency of the possiblecombinations was obtained. This information wasthen incorporated in the directed acyclic graphs forthe original complete dataset where the thickness ofthe edges indicates the reliability of the measure. Themethod requires that, for a given sample, there are nomissing values. Thus, for example, if a networkcomprising three parameters is constructed, then everycase must have scores for the parameters in question.This means that the optimal network size will be atrade-off between the number of parameters compris-ing the network and the number of cases scored for allthe parameters. Sample sizes used here are given inthe figure legends.
For the three-variable analysis, an edge pEGFR !CB1R was found for the non-malignant tissue samples,the directionality of the line being much greater thanfor CB1R ! pEGFR in the bootstrap analyses (Fig. 2A).An edge LRIG1 ! pEGFR was also found for the
Fig. 1. Bivariate correlations between CB1 receptor scores and other parameters in the database. Shown are the Spearman rho valuesand the95%confidencelimits.Valueswhere theSpearmanrhovaluewas>0.2 are shadedgray.Note that for thenon-malignant scores,FAAHand pEGFR are available for both basal and luminal epithelial cells. The luminal scores were used here. Note also that the sample size fornon-phosphorylated EGFR ismuch smaller than for pEGFR andmost of the other parameters, thereby precluding its use in the subsequentBayesiannetworkanalyses.
1110 H€aggstr€omet al.
The Prostate
complete dataset, but this was deemed to be unreliablein the bootstrap analysis, since its frequency was lowerthan that for no preference. The addition of FAAH tothe dataset did not change the observed patternpEGFR ! CB1R >> CB1R ! pEGFR and suggestedan additional edge pEGFR ! FAAH (Fig. 2B).
For the tumor samples, the networks obtained for athree-variable analysis (CB1R, pEGFR, and ErbB2, i.e.,the three receptors in the sample), two four-variableanalyses (the receptors and LRIG1; the receptors andFAAH), and a five-variable analysis (the receptors,LRIG1 and FAAH) are shown in Figure 3 for the wholepatient sample (“original data”) and the bootstrapanalyses shown in Figure 4. In this case, the observeddirection of the edges was highly dependent upon theinclusion, or not, of FAAH. When FAAH was excludedfrom the analyses, the directionality of the edges wasfrom CB1R to the growth factor receptors and not viceversa (Fig. 3A, B), whereas when FAAH was includedas a parameter, the directionality of the associationbetween pEGFR and CB1R was reversed, that is, to bethe same as seen in the non-malignant tissue (Fig. 3C, D).
Two other edges, LRIG1 ! ErbB2 and ErbB2 ! FAAHwere seen in the tumor samples (Fig. 3B–D). There issome dispute as to the level of expression of ErbB2 inPca, not the least due to the use of different anti-bodies [38]. In consequence, we reanalyzed the tumordata excluding this parameter, and found that for bothCB1R, pEGFR and LRIG1 as variables (n¼ 271), andfor CB1R, pEGFR, LRIG1, and FAAH as variables(n¼ 268), the directed acyclical graphs gave the edgepEGFR ! CB1R with a frequency of 65% and 62%,respectively, in the bootstrap analyses (data notshown).
A high CB1 receptor expression per se is insuffi-cient to confer a selective survival of Pca cells to CB1
receptor stimulation.The network analysis identifies CB1 receptors as
down-stream of the EGFR, but does not provide anyinformation as to whether a high CB1 receptor expres-sion directly biases tumor cells towards survival in thepresence of a CB receptor agonist, such as has beenseen in astrocytoma clones transfected with this recep-tor [34]. In order to shed light on this possibility, AT1
Fig. 2. Bayesian network inference analyses of CB1R, pEGFR, LRIG1, and FAAH immunoreactive scores for prostate non-malignanttissue samples obtainedatdiagnosis.The functionmmhc in thebnlearnpackage of theRcomputerprogrammewasused.Thepanels show thedirected acyclic graphs for the complete datasets for the fully visible variables shown in the figure: (A) CB1R, luminal epithelial pEGFR andLRIG1 (n¼ 263) (B)CB1R, luminal epithelialpEGFR,LRIG1andluminal epithelial FAAH(n¼ 221).Bootstrap analyses of theBayesiannetworkinference analyses are shown underneath the directed acyclic graphs.The graphs show the percentage of times, out of1,000 trials, that thedirectionA!B(dark grey),B!A(lightgrey),ornopreference(white)was found.Thedottedlineis setat50%toaidthereader.Thisinforma-tion was then incorporated into the graphs for the complete datasets, whereby the thicknesses of the arrows indicate the confidenceof the edges (i.e., howoften itwas found in the bootstrap analyses), divided into two groups:>65% (pEGFR!CB1R in panelA) and>50%(pEGFR!CB1RandpEGFR!FAAHinpanelB).ThedottedarrowinPanelA showswhere theedgefor thewholedatasetwasnotsupportedby thebootstrapanalyses.
Cannabinoid Receptors in Prostate Cancer 1111
The Prostate
prostate cancer cells were transfected with either eGFPor CB1/eGFP plasmids (the same plasmids usedin [34]). This cell line is one of the R3327 Dunning ratprostatic tumor sublines, which show different meta-static abilities when injected into syngenic Copenha-gen rats [39]. It has been used in vivo in orthotopicstudies to characterize tumor growth in the ventralprostate after different interventions [40,41], and isthus a rather useful rodent cell line. We have previous-ly characterized it with respect to its ability to accumu-late and metabolize endocannabinoids [42,43], but toour knowledge the effect of CB1 receptor activationupon AT-1 cell survival has not been studied.
Successful transfection with the receptor was con-firmed by RT-PCR, where the level of mRNA signalfor the CB1 receptor was in the ratio 1: 2.6: 750 foruntransfected, eGFP- and CB1/eGFP-transfected cellpopulations (data not shown). Rather than selectindividual clones with different receptor expressionlevels, we elected to utilize the variation in transfectionefficiency of the unselected cells to mimic the largevariation in CB1 receptor expression seen in the Pcatumor arrays [19]. In the cells transfected with thereporter protein eGFP alone, the CB receptor agonistCP55,940 produced a weak mitogenic effect, whereasin the cells transfected with the plasmid encoding CB1
receptors and eGFP, nanomolar concentrations of
CP55,940 reduced the cell density (Fig. 5). Thus,introduction of the CB1 receptor into the cells con-ferred a changed sensitivity to CP55,940. Notably, thesensitivity to this agonist was the same for cells withexpression levels above the median for the cell popula-tion as for those with expression levels below themedian (Fig. 5). This result suggests that in the modelsystem used, cells expressing levels of CB1 receptorthat are above the median value do not exhibit anadvantage in terms of cell proliferation and resistanceto the anti-proliferative effects of CP55,940.
DISCUSSION
In the present study, Bayesian network analyseswere undertaken on Pca tissue microarray data toidentify potential upstream regulators of CB1 recep-tors. The strength of the study lies in the nature of thesamples used, in that they were taken prior to diagno-sis, and thus the parameters under study are notinfluenced by anti-cancer treatment of the patients.Further, the Bayesian methodology has proven usefulin identifying potential biological networks [21,22].This notwithstanding, at the outset, several potentiallimitations to the approach used in the present studyshould be considered. First, the model used assumesthe data are continuous, whereas in fact they are
Fig. 3. BayesiannetworkinferenceanalysesofCB1R,pEGFR,ErbB2,LRIG1,andFAAHimmunoreactive scores forprostate tumour samplesobtainedatdiagnosis.The functionmmhcin thebnlearnpackageof theRcomputerprogrammewasused.Thepanels show thedirectedacyclicgraphs for the original datasets for the fully visible variables shown in the figure: (A) CB1R, pEGFR, and ErbB2 (n¼ 274); (B) LRIG1,CB1R,pEGFR, and ErbB2 (n¼ 270); (C) FAAH,CB1R, pEGFR, and ErbB2 (n¼ 271); and (D) FAAH,LRIG1,CB1R, pEGFR, and ErbB2 (n¼ 267).Thethicknesses of the arrows indicate the confidence of the edges (i.e., howoften itwas found in thebootstrap analyses shown in Fig. 4), dividedinto four groups:>85% (e.g.,CB1R! pEGFR in panelA);>65% (e.g., pEGFR!CB1R in panelC);>50% (e.g.,CB1R! ErbB2 in panel B);and<50%butmore frequent thanB!Aor fornopreference (e.g., pEGFR!CB1RinpanelD).Thedottedarrows showwhere theedges forthewholedatasetwerenot supportedby thebootstrapanalyses.
1112 H€aggstr€omet al.
The Prostate
Fig. 5. Effectof theCBreceptor agonistCP55,940upon thedensityofAT1cells transfectedwithCB1receptors.PanelA shows arepresen-tativeFACSforAT1cells transfectedwith theCB1/eGFPplasmidandtreated for3dayswith0,10, or100nMCP55,940.PanelB shows thenum-ber of cells and Panel C the % of cells above the cut-off chosen (shown as a dashed horizontal line marked with the arrow in Panel A)followingCP55,940 treatment.PanelsB andC showmeans ands.e.m. values, n¼ 6.Thenumbernrefers to thenumberof seriesrun for FACSfrom each six well plate; in some experiments two series were run on the same day. In PanelA, a two-way ANOVA for repeatedmeasures(matching for CP55,940) gave a significant interaction (F2,20¼ 24.86, P< 0.0001). ��P< 0.01, ���P< 0.001, Sidak’s multiple comparison testversus the corresponding value in the absence of CP55,940. In PanelC, therewas no significant interaction (F2,20¼1.56, P¼ 0.23) or maineffect of CP55,940 (P2,20¼1.50, P¼ 0.25) although therewas a significant effect of the transfectionwith respect to the proportion of cellsabove thecut-off for theeGFP-transfectedcells thanfor theCB1/eGFP-transfectedcells (P1,10¼159,P< 0.0001).
Fig. 4. Bootstrap analyses of the Bayesian network inference analyses shown in Figure 3.The graphs show thepercentage of times, outof1,000 trials, that the directions A! B (dark grey), B! A (light grey), or no preference (white) was found.The graphs are: top left,CB1R,pEGFR, and ErbB2; top right, LRIG1, CB1R, pEGFR, and ErbB2; bottom right, FAAH,CB1R, pEGFR, and ErbB2; bottom left, FAAH,LRIG1,CB1R,pEGFR,andErbB2.Thedottedlineis setat50%toaidthereader.
Cannabinoid Receptors in Prostate Cancer 1113
The Prostate
ordinal. However, given that the score is a compositemeasure of intensity�distribution, that is, the relativeload in the tissue, it takes on a large number ofdifferent values. For tumor CB1R, for example, thecases scored for this parameter are distributed among52 different scores between 0.25 and 4. Treating such avariable as continuous in the analysis is not unusual.Second, the data are from a single cohort, andalthough we have used bootstrapping as a measure ofthe robustness of the data, it would be well worthreplicating the study in a second cohort. Third, thenetwork only considers the available data and doesnot consider other potential regulatory elements. Onesuch element known to be involved in the pathogene-sis of Pca is interleukin-4 [44], which influences bothCB1 receptor and FAAH expression in cells [11,45,46].However, as pointed out in the results, inclusion ofadditional parameters, when available, will reduce thenumber of cases scored for all parameters. Fourth, thedirected acyclic graphs do not allow bidirectionalsignaling. This is relevant, given the finding in cul-tured Pca cells that cannabinoids reduce the prolifer-ative response to EGF by down-regulating EGFR [15](in contrast to the situation in cell lines from someother cancer forms (squamous cell carcinoma, bladdercarcinoma, astrocytoma and kidney cancer) wherecannabinoids increase both EGFR phosphorylationand cell proliferation [47]). Finally, the data are only asgood as the antibodies used. There has been, forexample, debate as to the usefulness of some of theCB1 receptor antibodies available [48]. However, weestablished that the CB1R antibody used in the tissuemicroarray showed the appropriate pattern of immu-noreactivity in the brain, and that staining was absentin both the brain and prostate of CB1R knockoutmice [33]. Thus, although the methodology is notwithout issues and the results should be considered inthis light, they do form the basis for hypothesis testingin relevant biological systems.
In non-malignant tissue, the analyses indicated thatthe CB1 receptor expression was down-stream ofpEGFR, rather than vice versa, and that this patternwas seen regardless of whether FAAH was included inthe analyses. In the malignant tissue, the same rela-tionship between pEGFR and CB1 receptor expressionwas seen, but only when FAAH was included. Thedifference in “FAAH-dependency” between the non-malignant and tumor sample is in addition to beexpected, given the greater expression level of FAAHin the tumor samples than in the non-malignantluminal tissue [11]. A second novel observation wasthe edge ErbB2 ! FAAH in the tumor samples. To ourknowledge, EGFR- and ErbB2-receptor mediated regu-lation of CB1 receptor and FAAH expression, respec-tively, have not been reported for prostate tissue, and
thus the current study identifies potential novelregulatory pathways. With respect to the former, wehave preliminary data suggesting that long-term treat-ment with EGF indeed increased the mRNA for CB1
receptors in Pca cells in culture in a manner dependentupon the basal CB1 receptor expression, which was notstable in the cells (M. Cipriano and C. J. Fowler,unpublished data), but more systematic data is need-ed. The ability of ErbB2 to regulate FAAH has notbeen studied, although conceptually it is highly possi-ble, given that in rat hippocampal slices, treatmentwith the ErbB receptor tyrosine kinase ligand neuro-regulin-1 for 8–11 days increases the expression ofmonoacylglycerol lipase, the main hydrolytic enzymefor the endocannabinoid 2-AG [49].
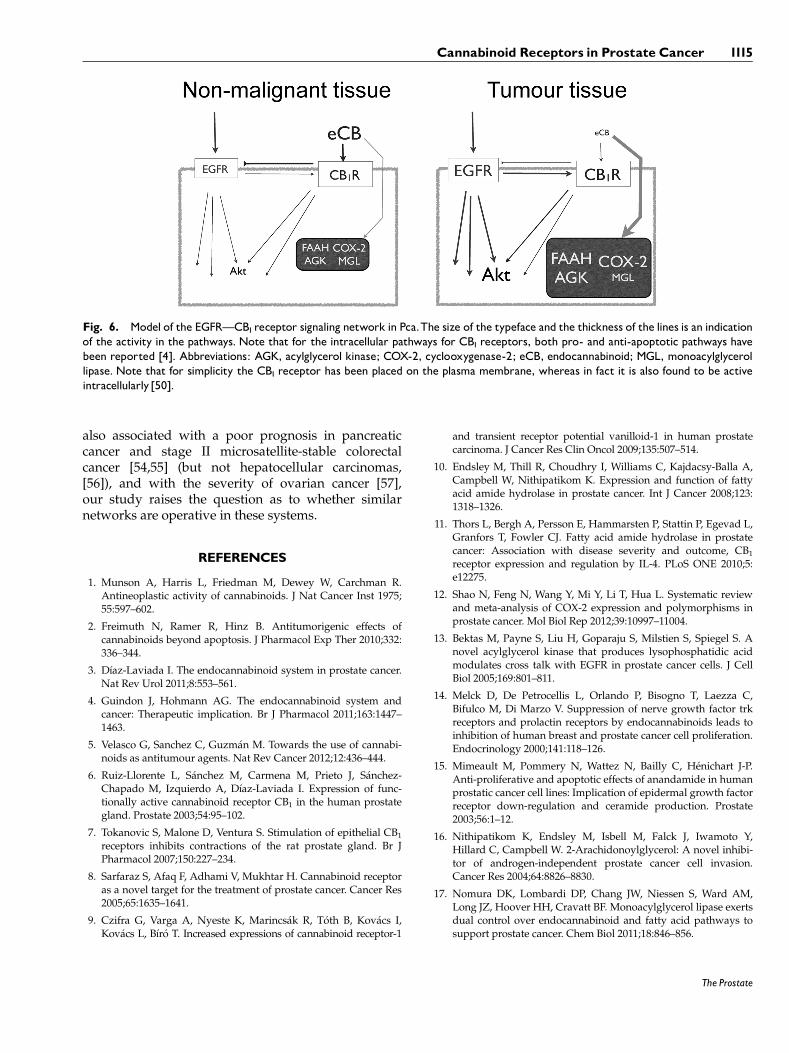
In addition to identifying potential upstream modu-lators of endocannabinoid signaling, the networkanalysis can provide conceptual data for formulationof novel hypotheses. In the present context, it allowsus to suggest a way in which the CB1 receptor isinvolved in the pathogenesis of Pca. Our workingmodel is based on the network analysis, the study ofCB1 agonist effects upon EGF-stimulated Pca cells [15],the observations of down-stream activation ofAkt [18,19], and the transfected AT1 cell data pre-sented here which suggest that a high CB1 receptorexpression alone is not sufficient to drive the cellstowards a survival phenotype in the presence of a CBreceptor agonist. The model is summarized in Figure 6.In non-malignant tissue, normal EGF signaling pro-duces both an array of cellular responses [51] andincreases CB1 receptor expression. These then respondto the circulating levels of endocannabinoids anddecrease EGFR expression [15], thus operating as anegative feedback regulatory mechanism. The findingsthat the 2-AG metabolizing enzyme acylglycerol kinaseis expressed in Pca tumors to a higher levelthan in matched non-malignant tissue, and its down-regulation inhibits the motility of Pca cells in responseto EGF [13] also support this model. In the tumortissue, EGF-mediated signaling is overactive [27,52]and FAAH, acylglycerol kinase and other enzymesknown to metabolize endocannabinoids (such as cyclo-oxygenase-2) are up-regulated [10–13], in the case ofFAAH perhaps due in part to aberrant ErbB2 signalingthat has been reported in some Pca cases [38,53]. Thiswould result in a reduction in the levels of circulatingendocannabinoids, thus weakening the feedback regu-latory pathway.
It should be stressed that the model as shown inFigure 6 is theoretical rather that proven, althoughsupported by current data. Clearly, it is important todetermine in experimental models, cell cultures andtumor samples whether the model is valid. Addition-ally, given that a high tumor CB1 receptor expression is
1114 H€aggstr€omet al.
The Prostate
also associated with a poor prognosis in pancreaticcancer and stage II microsatellite-stable colorectalcancer [54,55] (but not hepatocellular carcinomas,[56]), and with the severity of ovarian cancer [57],our study raises the question as to whether similarnetworks are operative in these systems.
REFERENCES
1. Munson A, Harris L, Friedman M, Dewey W, Carchman R.Antineoplastic activity of cannabinoids. J Nat Cancer Inst 1975;55:597–602.
2. Freimuth N, Ramer R, Hinz B. Antitumorigenic effects ofcannabinoids beyond apoptosis. J Pharmacol Exp Ther 2010;332:336–344.
3. D�ıaz-Laviada I. The endocannabinoid system in prostate cancer.Nat Rev Urol 2011;8:553–561.
4. Guindon J, Hohmann AG. The endocannabinoid system andcancer: Therapeutic implication. Br J Pharmacol 2011;163:1447–1463.
5. Velasco G, Sanchez C, Guzm�an M. Towards the use of cannabi-noids as antitumour agents. Nat Rev Cancer 2012;12:436–444.
6. Ruiz-Llorente L, S�anchez M, Carmena M, Prieto J, S�anchez-Chapado M, Izquierdo A, D�ıaz-Laviada I. Expression of func-tionally active cannabinoid receptor CB1 in the human prostategland. Prostate 2003;54:95–102.
7. Tokanovic S, Malone D, Ventura S. Stimulation of epithelial CB1
receptors inhibits contractions of the rat prostate gland. Br JPharmacol 2007;150:227–234.
8. Sarfaraz S, Afaq F, Adhami V, Mukhtar H. Cannabinoid receptoras a novel target for the treatment of prostate cancer. Cancer Res2005;65:1635–1641.
9. Czifra G, Varga A, Nyeste K, Marincs�ak R, T�oth B, Kov�acs I,Kov�acs L, B�ır�o T. Increased expressions of cannabinoid receptor-1
and transient receptor potential vanilloid-1 in human prostatecarcinoma. J Cancer Res Clin Oncol 2009;135:507–514.
10. Endsley M, Thill R, Choudhry I, Williams C, Kajdacsy-Balla A,Campbell W, Nithipatikom K. Expression and function of fattyacid amide hydrolase in prostate cancer. Int J Cancer 2008;123:1318–1326.
11. Thors L, Bergh A, Persson E, Hammarsten P, Stattin P, Egevad L,Granfors T, Fowler CJ. Fatty acid amide hydrolase in prostatecancer: Association with disease severity and outcome, CB1
receptor expression and regulation by IL-4. PLoS ONE 2010;5:e12275.
12. Shao N, Feng N, Wang Y, Mi Y, Li T, Hua L. Systematic reviewand meta-analysis of COX-2 expression and polymorphisms inprostate cancer. Mol Biol Rep 2012;39:10997–11004.
13. Bektas M, Payne S, Liu H, Goparaju S, Milstien S, Spiegel S. Anovel acylglycerol kinase that produces lysophosphatidic acidmodulates cross talk with EGFR in prostate cancer cells. J CellBiol 2005;169:801–811.
14. Melck D, De Petrocellis L, Orlando P, Bisogno T, Laezza C,Bifulco M, Di Marzo V. Suppression of nerve growth factor trkreceptors and prolactin receptors by endocannabinoids leads toinhibition of human breast and prostate cancer cell proliferation.Endocrinology 2000;141:118–126.
15. Mimeault M, Pommery N, Wattez N, Bailly C, H�enichart J-P.Anti-proliferative and apoptotic effects of anandamide in humanprostatic cancer cell lines: Implication of epidermal growth factorreceptor down-regulation and ceramide production. Prostate2003;56:1–12.
16. Nithipatikom K, Endsley M, Isbell M, Falck J, Iwamoto Y,Hillard C, Campbell W. 2-Arachidonoylglycerol: A novel inhibi-tor of androgen-independent prostate cancer cell invasion.Cancer Res 2004;64:8826–8830.
Fig. 6. Model of the EGFRçCB1receptor signaling network in Pca.The size of the typeface and the thickness of the lines is an indicationof the activity in the pathways. Note that for the intracellular pathways for CB1 receptors, both pro- and anti-apoptotic pathways havebeen reported [4]. Abbreviations: AGK, acylglycerol kinase; COX-2, cyclooxygenase-2; eCB, endocannabinoid; MGL, monoacylglycerollipase. Note that for simplicity the CB1 receptor has been placed on the plasma membrane, whereas in fact it is also found to be activeintracellularly [50].
Cannabinoid Receptors in Prostate Cancer 1115
The Prostate
18. S�anchez M, Ruiz-Llorente L, S�anchez A, D�ıaz-Laviada I. Activa-tion of phosphoinositide 3-kinase/PKB pathway by CB1 andCB2 receptors expressed in prostate PC-3 cells. Involvement inRaf-1 stimulation and NGF induction. Cell Signal 2003;15:851–859.
19. Cipriano M, H€aggstr€om J, Hammarsten P, Fowler CJ. Associa-tion between cannabinoid CB1 receptor expression and Aktsignalling in prostate cancer. PLoS ONE 2013;8:e65798.
21. P�erez-Losada M, Høeg JT, Crandall KA. Unraveling the evolu-tionary radiation of the thoracican barnacles using molecularand morphological evidence: A comparison of several diver-gence time estimation approaches. Syst Biol 2004;53:244–264.
22. Sachs K, Perez O, Pe’er D, Lauffenburger DA, Nolan GP. Causalprotein-signaling networks derived from multiparameter single-cell data. Science 2005;308:523–529.
23. Egevad L, Granfors T, Karlberg L, Bergh A, Stattin P. Prognosticvalue of the Gleason score in prostate cancer. BJU Int 2002;89:538–542.
24. Josefsson A, Wikstr€om P, Granfors T, Egevad L, Karlberg L,Stattin P, Bergh A. Tumor size, vascular density and proliferationas prognostic markers in GS6 and GS7 prostate tumors inpatients with long follow-up and non-curative treatment. EurUrol 2005;48:577–583.
25. Wikstr€om P, Marusic J, Stattin P, Bergh A. Low stroma androgenreceptor level in normal and tumor prostate tissue is related topoor outcome in prostate cancer patients. Prostate 2009;69:799–809.
26. H€aggl€of C, Hammarsten P, Josefsson A, Stattin P, Paulsson J,Bergh A, €Ostman A. Stromal PDGFRß expression in prostatetumors and non-malignant prostate tissue predicts prostatecancer survival. PLoS ONE 2010;5:e10747.
27. Hammarsten P, Karalija A, Josefsson A, Rudolfsson SH,Wikstr€om P, Egevad L, Granfors T, Stattin P, Bergh A. Lowlevels of phosphorylated epidermal growth factor receptor innonmalignant and malignant prostate tissue predict favorableoutcome in prostate cancer patients. Clin Cancer Res 2010;16:1245–1255.
28. Johansson A, Rudolfsson S, Hammarsten P, Halin S, Pietras K,Jones J, Stattin P, Egevad L, Granfors T, Wikstr€om P, Bergh A.Mast cells are novel independent prognostic markers in prostatecancer and represent a target for therapy. Am J Pathol 2010;177:1031–1041.
29. Josefsson A, Adamo H, Hammarsten P, Granfors T, Stattin P,Egevad L, Laurent AE, Wikstr€om P, Bergh A. Prostate cancerincreases hyaluronan in surrounding nonmalignant stroma, andthis response is associated with tumor growth and an unfavor-able outcome. Am J Pathol 2011;179:1961–1968.
30. Thomasson M, Wang B, Hammarsten P, Dahlman A, Persson JL,Josefsson A, Stattin P, Granfors T, Egevad L, Henriksson R,Bergh A, Hedman H. LRIG1 and the liar paradox in prostatecancer: A study of the expression and clinical significance ofLRIG1 in prostate cancer. Int J Cancer 2011;128:2843–2852.
31. Josefsson A, Wikstr€om P, Egevad L, Granfors T, Karlberg L,Stattin P, Bergh A. Low endoglin vascular density and Ki67index in Gleason score 6 tumours may identify prostate cancerpatients suitable for surveillance. Scand J Urol Nephrol 2012;46:247–257.
32. Fowler CJ, Hammarsten P, Bergh A. Tumour cannabinoid CB1
receptor and phosphorylated epidermal growth factor receptor
expression are additive prognostic markers for prostate cancer.PLoS ONE 2010;5:e15205.
33. Chung SC, Hammarsten P, Josefsson A, Stattin P, Granfors T,Egevad L, Mancini G, Lutz B, Bergh A, Fowler CJ. A highcannabinoid CB1 receptor immunoreactivity is associated withdisease severity and outcome in prostate cancer. Eur J Cancer2009;45:174–182.
34. Cudaback E, Marrs W, Moeller T, Stella N. The expression levelof CB1 and CB2 receptors determines their efficacy at inducingapoptosis in astrocytomas. PLoS ONE 2010;5:e8702.
35. R Core Team: R. A language and environment for statisticalcomputing. R Foundation for Statistical Computing, Vienna,Austria. ISBN 3-900051-07-0. http://www.R-project.org/. 2012.
36. Shao Y-H, Demissie K, Shih W, Mehta AR, Stein MN, RobertsCB, Dipaola RS, Lu-Yao GL. Contemporary risk profile ofprostate cancer in the United States. J Natl Cancer Inst 2009;101:1280–1283.
37. Tsamardinos I, Brown LE, Aliferis CF. The max-min hill-climbingBayesian network structure learning algorithm. Mach Learn2006;54:31–78.
38. Minner S, Jessen B, Stiedenroth L, Burandt E, K€ollermann J,Mirlacher M, Erbersdobler A, Eichelberg C, Fisch M, Br€ummen-dorf TH, Bokemeyer C, Simon R, Steuber T, Graefen M, HulandH, Sauter G, Schlomm T. Low level HER2 overexpression isassociated with rapid tumor cell proliferation and poor progno-sis in prostate cancer. Clin Cancer Res 2010;16:1553–1560.
39. Isaacs J, Isaacs W, Feitz F, Scheres J. Establishment andcharacterization of seven Dunning rat prostatic cancer cell linesand their use in developing methods for predicting metastaticabilities of prostatic cancers. Prostate 1986;9:261–281.
40. Halin S, Rudolfsson SH, Van Rooijen N, Bergh A. Extra-tumoral macrophages promote tumor and vascular growth inan orthotopic rat prostate tumor model. Neoplasia 2009;11:177–186.
41. McCullough DJ, Nguyen LM, Siemann DW, Behnke BJ. Effectsof exercise training on tumor hypoxia and vascular function inthe rodent preclinical orthotopic prostate cancer model. J ApplPhysiol 2013;115:1846–1854.
42. Thors L, Eriksson J, Fowler CJ. Inhibition of the cellular uptakeof anandamide by genistein and its analogue daidzein in cellswith different levels of fatty acid amide hydrolase-drivenuptake. Br J Pharmacol 2007;152:744–750.
43. Fowler CJ, Ghafouri N. Does the hydrolysis of 2-arachidonoyl-glycerol regulate its cellular uptake? Pharmacol Res 2008;58:72–76.
44. Conticello C, Pedini F, Zeuner A, Patti M, Zerilli M, Stassi G,Messina A, Peschle C, De Maria R. IL-4 protects tumor cells fromanti-CD95 and chemotherapeutic agents via up-regulation ofantiapoptotic proteins. J Immunol 2004;172:5467–5477.
45. B€orner C, Bedini A, H€ollt V, Kraus J. Analysis of promoterregions regulating basal and interleukin-4-inducible expressionof the human CB1 receptor gene in T lymphocytes. MolPharmacol 2008;73:1013–1019.
46. Maccarrone M, Valensise H, Bari M, Lazzarin N, Romanini C,Finazzi-Agrò A. Progesterone up-regulates anandamide hydro-lase in human lymphocytes: Role of cytokines and implicationsfor fertility. J Immunol 2001;166:7183–7189.
47. Hart S, Fischer O, Ullrich A. Cannabinoids induce cancer cellproliferation via tumor necrosis factor a-converting enzyme(TACE/ADAM17)-mediated transactivation of the epidermalgrowth factor. Cancer Res 2004;64:1943–1950.
48. Grimsey N, Goodfellow C, Scotter E, Dowie M, Glass M,Graham E. Specific detection of CB1 receptors; cannabinoid CB1
receptor antibodies are not all created equal. J Neurosci Meth2008;171:78–86.
49. Du H, Kwon I-K, Kim J. Neuregulin-1 impairs the long-termdepression of hippocampal inhibitory synapses by facilitatingthe degradation of endocannabinoid 2-AG. J Neurosci 2013;33:15022–15031.
50. Rozenfeld R, Devi LA. Regulation of CB1 cannabinoid receptortrafficking by the adaptor protein AP-3. FASEB J 2008;22:2311–2322.
51. Lurje G, Lenz H-J. EGFR signaling and drug discovery. Oncolo-gy 2009;77:400–410.
52. De Miguel P, Royuela Bethencourt R, Ruiz A, Fraile B, PaniaguaR. Immunohistochemical comparative analysis of transforminggrowth factor a, epidermal growth factor, and epidermal growthfactor receptor in normal, hyperplastic and neoplastic humanprostates. Cytokine 1999;11:722–727.
53. Neto AS, Tobias-Machado M, Wroclawski ML, Fonseca FLA,Teixeira GK, Amarante RDM, Wroclawski ER, Del Giglio A.
Her-2/neu expression in prostate adenocarcinoma: A systematicreview and meta-analysis. J Urol 2010;184:842–850.
54. Michalski C, Oti F, Erkan M, Sauliunaite D, Bergmann F, PacherP, Batkai S, M€uller M, Giese N, Friess H, Kleeff J. Cannabinoidsin pancreatic cancer: Correlation with survival and pain. Int JCancer 2008;122:742–750.
CB1 receptor immunoreactivity negatively impacts disease-specific survival in stage II microsatellite stable colorectal cancer.PLoS ONE 2011;6:e23003.
56. Xu X, Liu Y, Huang S, Liu G, Xie C, Zhou J, Fan W, Li Q, WangQ, Zhong D, Miao X. Overexpression of cannabinoid receptorsCB1 and CB2 correlates with improved prognosis of patientswith hepatocellular carcinoma. Cancer Gen Cytogen 2006;171:31–38.
57. Messalli EM, Grauso F, Luise R, Angelini A, Rossiello R.Cannabinoid receptor type 1 immunoreactivity and diseaseseverity in human epithelial ovarian tumors. Am J ObstetGynecol 2014; in press doi: 10.1016/j.ajog.2014.04.004