AASHTO T-3 TRIAL DESIGN BRIDGE DESCRIPTION State: California Trial Design Designation: CA-1 Bridge Name: Typical California Bridge used by the Caltrans Design Academy Superstructure Type: Continuous prestressed reinforced concrete box girder Span Length(s): Three span 126ft.-168ft.-118ft. Substructure Type: Two 6.ft. dia. reinforced concrete columns per bent Foundation: Piles Abutments: Seat type supported on piles Seismic Design Category (SDC): Seismic Design Strategy (Type 1, 2 or 3): _______________________________________ Design Spectral Acceleration at 1-second Period (S D1 ): __________________________________________ Additional Description (Optional):
Transcript
AASHTO T-3 TRIAL DESIGN BRIDGE DESCRIPTION
State: California Trial Design Designation: CA-1 Bridge Name: Typical California Bridge used by the Caltrans Design Academy Superstructure Type: Continuous prestressed reinforced concrete box girder Span Length(s): Three span 126ft.-168ft.-118ft. Substructure Type: Two 6.ft. dia. reinforced concrete columns per bent Foundation: Piles Abutments: Seat type supported on piles Seismic Design Category (SDC): Seismic Design Strategy (Type 1, 2 or 3): _______________________________________ Design Spectral Acceleration at 1-second Period (SD1):__________________________________________ Additional Description (Optional):
SDC EXAMPLE # B (Bridge Design Academy Prototype Bridge) Page 1 of 148
I. INTRODUCTION I.A. Background/Problem Statement This prototype bridge is used by various groups teaching the Caltrans Design Academy to illustrate the principles of bridge design including those of seismic design. This is a three span Prestressed Reinforced Concrete Box Girder bridge. The span lengths are 126 ft, 168 ft and 118 ft. The column height varies from 44 ft at Bent 2 to 47 ft at Bent 3. Both bents have a skew angle of 20 deg. The columns on pinned at the bottom. Figure 1 shows the General Plan for this structure. I.B. Bridge Site Conditions This hypothetical structure crosses a roadway and railroad tracks. Because of poor soil conditions, the footing is supported on piles. The ground motion at the bridge site is assumed to be:
Soil Profile: Type C Magnitude: 8.0± 0.25 Peak Rock Acceleration: 0.5g.
Figure 2 shows the ARS curve based upon 5% damping as taken from Appendix B of the SDC. II. Analysis and Design Procedure II.A. Preliminary Member and Span Configuration Determination Bridge design is inherently an iterative process. It is common practice to design bridges for service loading and then, if necessary, to refine the design of various components to satisfy seismic performance requirements. In reality however, one needs to keep certain seismic requirements in mind even during a service design. This is especially true while selecting the span configuration, column size, column reinforcement requirements, and bent cap width. Sizing the Column and Bent Cap • Column Size According to the SDC (Section 7.6.1), selected column size should satisfy the following criterion
00.170.0 <<s
c
DD
SDC Eqn. (7.24)
Where
SDC EXAMPLE # B (Bridge Design Academy Prototype Bridge) Page 2 of 148
Figure 1 General Plan (Bridge Design Academy Prototype Bridge)
SDC EXAMPLE # B (Bridge Design Academy Prototype Bridge) Page 3 of 148
Figure 2 Response Spectrum Curves For Soil Profile C (M = 8.0±0.25) (See SDC Figure B.6)
SDC EXAMPLE # B (Bridge Design Academy Prototype Bridge) Page 4 of 148
=cD Column diameter =sD Superstructure depth
If sc DD > , it may be difficult to meet the joint shear, superstructure capacity, and ductility requirements. Given =sD 6.75 ft from the service design, we select a column with 00.6=cD ft so that
.89.0/ =sc DD Max. Longitudinal Reinforcement Area, gs AA ×≤ 04.0max SDC Eqn.(3.28) Min. Longitudinal Reinforcement Area, gs AA ×≥ 01.0min SDC Eqn.(3.29) where gA is the gross cross sectional area. Normally choosing 1.5% main steel is a good starting point.
( ) 07.611200.64
015.0015.0 2 =××=×=π
gs AA in2
Either spirals or hoops can be used as transverse (lateral) reinforcement in the column. However, according to Memo-To-Designers 20-6, hoops are preferred because of their discrete nature in case of local failure. The amount of transverse reinforcement expressed as volumetric ratio
sD
Abs ×
×= '
4ρ for circular columns SDC Eqn. (3.31)
=bA Area of transverse reinforcing hoop/spiral rebar ='D Concrete section core diameter
=s Transverse reinforcement spacing
shall be sufficient to ensure that the column meets the performance requirements as specified in SDC Section (4.1). Additionally, such reinforcement should also meet the volumetric ratio requirements of BDS Equation (8-62) and the column shear requirements as specified in SDC section (3.6.3). The selected bar layout should satisfy the following spacing requirements for effectiveness and for constructability: • Longitudinal Reinforcement
Maximum Spacing = 8 in BDS Section (8.21.1.2) Minimum Spacing requirements are summarized in BDS Section (8.21.1)
SDC EXAMPLE # B (Bridge Design Academy Prototype Bridge) Page 5 of 148
• Transverse Reinforcement
According to the SDC Section (8.2.5) and BDS Section (8.21.1.1), the maximum spacing in the plastic hinge region shall not exceed the smaller of:
• 1/5 of the column dimension (14.4 in), for confinement. • 6 times the diameter of the longitudinal bars (10.2 in), to prevent
longitudinal bar buckling. • 8 in.
Keeping these requirements in mind, let us use the following reinforcement:
• #14 bars for longitudinal reinforcement • #8 hoops @ 5 in c/c for the plastic hinge region. Outside this region, the hoop
spacing can be and should be increased to economize the design. Assume a concrete cover of 2 in (BDS Table 8.22.1) dM = Dia. of the longitudinal reinforcement loop
= 86.63288.1
288.113.122272 =−−×−×− in
Number of #14 bars = 1.2725.207.61
=
Let us use 26, #14 bars (1.44%) so that
Spacing = 7.726
=× Mdπ in
which meets the maximum spacing requirements outlined above. If the provided spacing turns out to be more that the maximum spacing allowed, then a smaller bar size can be used. Selecting Bent Cap Width This prototype bridge has an integral bent cap. The depth of such a bent cap is the same as the depth of the superstructure. According to SDC ( Section 7.4.2.1), the minimum cap width that is required for adequate joint shear transfer is specified as
2+= ccap DB (ft) SDC Eqn. (7.10) For our case, the bent cap width shall be 6 + 2 = 8 ft.
SDC EXAMPLE # B (Bridge Design Academy Prototype Bridge) Page 6 of 148
II.B Balanced Stiffness Check and Preliminary Demand Assessment For an acceptable seismic response, a structure with well-balanced mass and stiffness across various frames is highly desirable. Such a structure is likely to respond to a seismic activity in a simple mode of vibration and any structural damage will be well distributed among all the columns. The best way to increase the likelihood that the structure responds in its simplest fundamental mode is to balance its stiffness and mass distribution. To this end, the SDC recommends that the ratio of effective stiffness between any two bents within a frame or between any two columns within a bent satisfy:
5.0≥×
×
iej
jei
mkmk
SDC Eqn.(7.1b)
The SDC further recommends that the ratio of effective stiffness between adjacent bents within a frame or between adjacent columns within a bent satisfy SDC equation 7.2:
75.0≥×
×
iej
jei
mkmk
SDC Eqn. (7.2b)
=e
ik Smaller effective bent or column stiff. =im Tributary mass on column or bent i.
=ejk Larger effective bent or column stiff. =jm Tributary mass on column or bent j.
Bent stiffness should also include the effects of foundation flexibility if it is determined to be significant by the geotechnical engineer. It should be noted that SDC Equations (7.1a) and (7.2a) are just special cases of Equations (7.2b) and (7.1b) and are used when the mass distribution across bents and columns is uniform. Most of the time, because of variable-width superstructures this is not the case. Therefore, it is suggested that the more general equations should be used. If these requirements of balanced effective stiffness are not met, some of the consequences include:
• The stiffer bent or column will attract more force and hence will be susceptible to increased damage.
• The inelastic response will be distributed non-uniformly across the structure. • Increased column torsion demands will be generated by rigid body rotation of the
superstructure.
SDC EXAMPLE # B (Bridge Design Academy Prototype Bridge) Page 7 of 148
In order to apply this check, we need to calculate the effective stiffness and tributary mass at each bent. Balanced Frame Geometry It is strongly recommend that the ratio of fundamental periods of vibration for adjacent
frames in the longitudinal and transverse direction satisfy equation 7.3.
7.0≥j
iT
T SDC Eqn (7.3)
Ti = Natural period of the stiffer frame Tj = Natural period of the flexible frame The consequences of not meeting the fundamental period requirements of equation 7.3
include a greater likelihood of out-of-phase response between adjacent frames leading to large relative displacements that increase the probability of longitudinal unseating and collision between frames at the expansion joints.
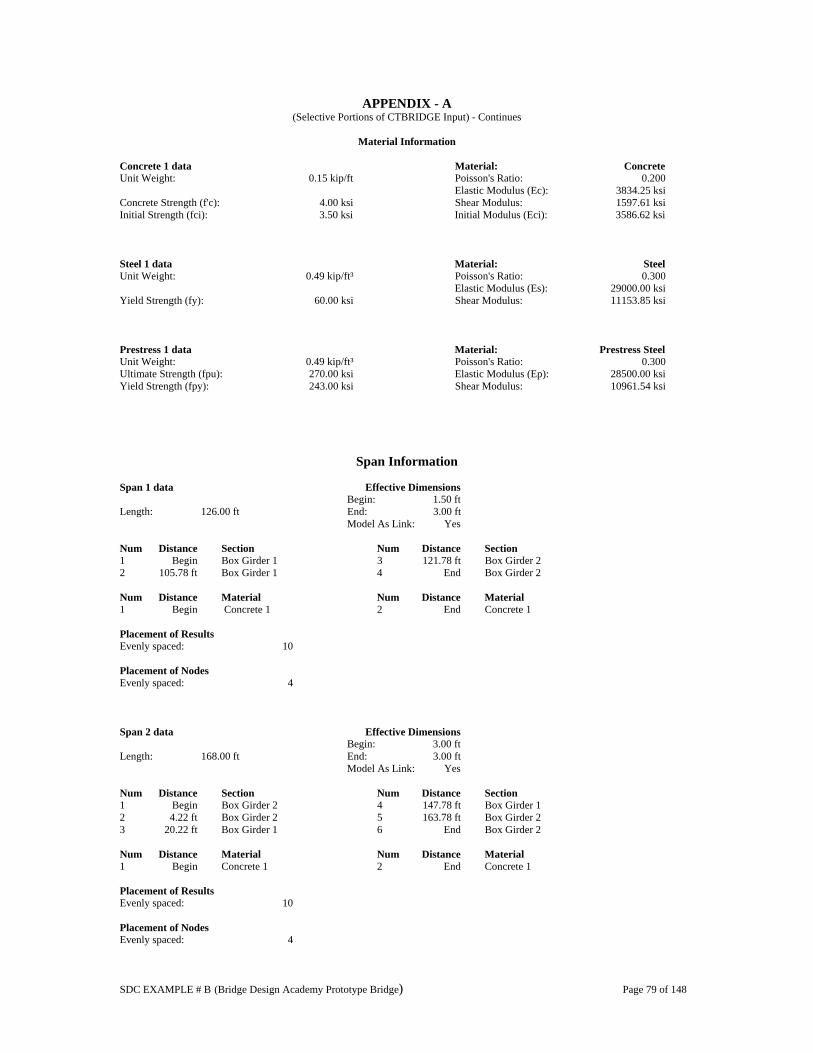
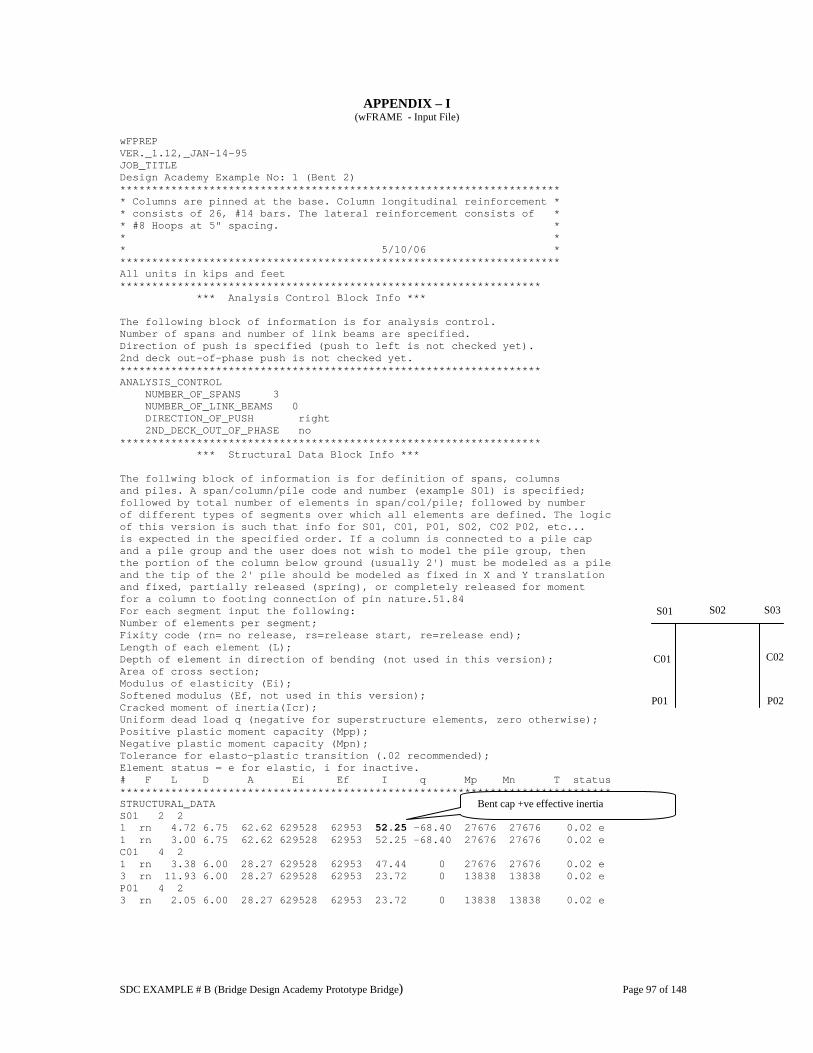
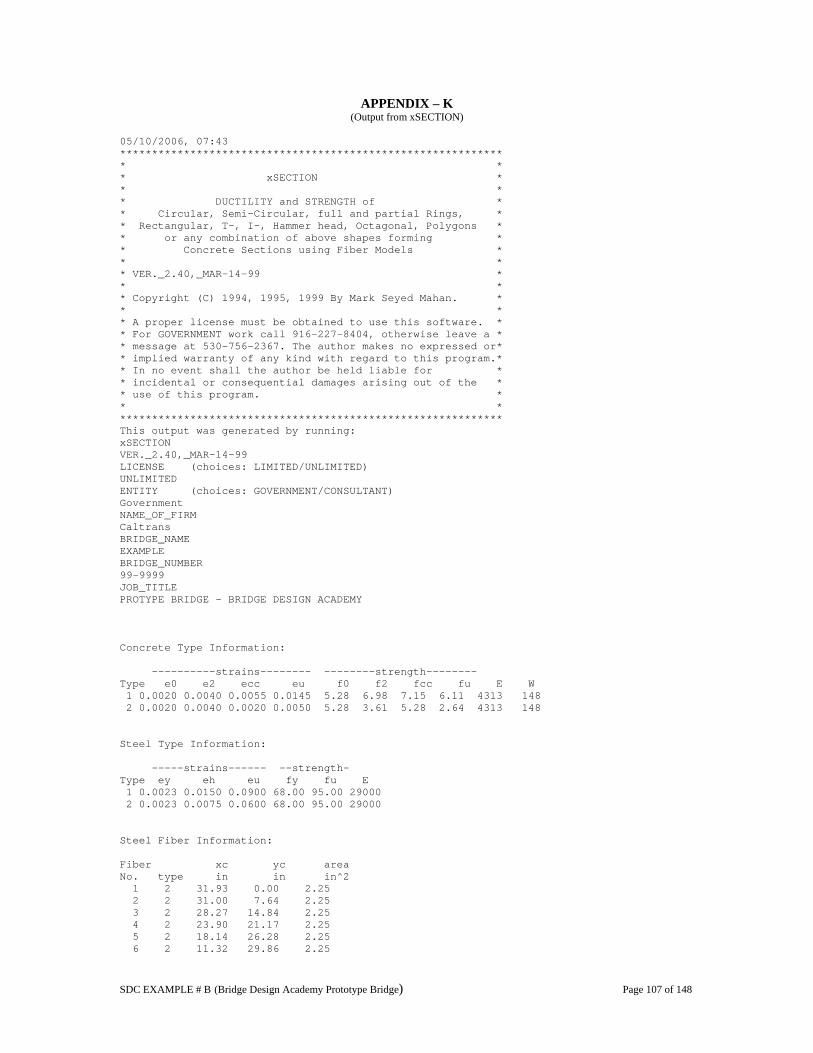
The computer program, xSECTION is used to estimate the column effective section properties as well as the Moment-Curvature ( φ−M ) relationship that will be needed later on to estimate member ductility. As a first step towards calculating effective section properties for the column, the dead load axial force at column top (location of potential plastic hinge) is calculated. These column axial forces are obtained from the CTBridge output. Appendix A lists selective CTBridge input data. Selective output from this CTBridge run is given in Appendix B. These dead load axial forces include self-weight of the box girder, Type 732 concrete barrier, and weight of the future wearing surface (35 psf). The concrete unit weight used is 150 lb/ft3. It should also be noted that these loads do not include weight of the integral bent cap. The CTBridge model has the regular superstructure cross-section with flared bottom slab instead of solid cap section. To be exact, only the weight of extra concrete should be added to the CTBridge output values to account for the full bent cap weight. The weight of whole solid cap was added to the CTBridge results (conservative). As read from the CTBridge output results, the column dead load axial forces are:
Column 1 Column 2 Bent 2 (Pc) 1,489 kips 1,494 kips Bent 3 (Pc) 1,425 kips 1,453 kips
Average Bent Cap Length =)cos(
12 AngleSkew
WidthSoffitWidthDeck×
+
Average Bent Cap Length = ft44.49)20cos(
12
08.4383.490 =×
+ .
Bent Cap Weight = kips400150.044.4975.68 =××× Adding this bent cap weight, total axial force in each column becomes:
SDC EXAMPLE # B (Bridge Design Academy Prototype Bridge) Page 8 of 148
Column 1 Column 2
Bent 2 (Pc) 1,689 kips 1,694 kips Bent 3 (Pc) 1,625 kips 1,653 kips
Efforts should be made to keep the dead load axial forces in columns around 10% of their ultimate compressive capacity, 'cgu fAP ×= . This is recommended to make sure that column does not experience brittle compression failure and also that any potential
Δ−P effects remain within acceptable limits. In our case, axial forces are about 10% of such ultimate compressive capacity. When this ratio starts approaching 15%, increasing column size or adding extra column should be considered. Material and Effective Column Section Properties (Ie) Material Properties • Concrete
As per Caltrans common design practice, psifc 000,4' = is used for superstructure, columns, piers, and pile shafts. For other components like abutments, wingwalls, and footings, use of psifc 600,3' = is specified. As per SDC Section (3.2), expected material properties are to be used to calculate section capacities for all ductile members. To be consistent between the demand and capacity, expected materials will also be used to calculate member stiffness. For concrete, the expected yield strength, '
cef , is taken as
⎟⎟⎠
⎞⎜⎜⎝
⎛ ×=
psif
ofGreaterf cce 000,5
3.1 '' SDC Eqn. (3.13)
In our case,
psifce 200,5000,43.1' =×= > psi000,5 will be used. Other concrete properties used are listed in SDC section (3.2.6). • Steel Grade A706/A706M will be used for reinforcing bar steel. The material properties for such steel are given in SDC Section (3.2.3). It is well known that concrete cover spalls off at very low ductility levels. Therefore, the effective (cracked) moment of inertia values will be used to assess the seismic response of all ductile members.
SDC EXAMPLE # B (Bridge Design Academy Prototype Bridge) Page 9 of 148
Currently, xSECTION works in English Units only. The following equivalent English Unit values for the column section, and the concrete and steel properties are used as input to this program:
• Column Dia. = 72.0 in • Concrete Cover = 2 in • Main Reinforcement: #14 bars, tot. 26. • Lateral Reinforcement: #8 hoops @ 5 in c/c. • psifce 200,5' = • The program calculates the modulus of elasticity of concrete internally.
• ksif
ksifksiE
ue
ye
s
95
68000,29
=
==
• ⎟⎟⎠
⎞⎜⎜⎝
⎛=
06.009.0R
suε alLongitudin
TransverseSteelSteel
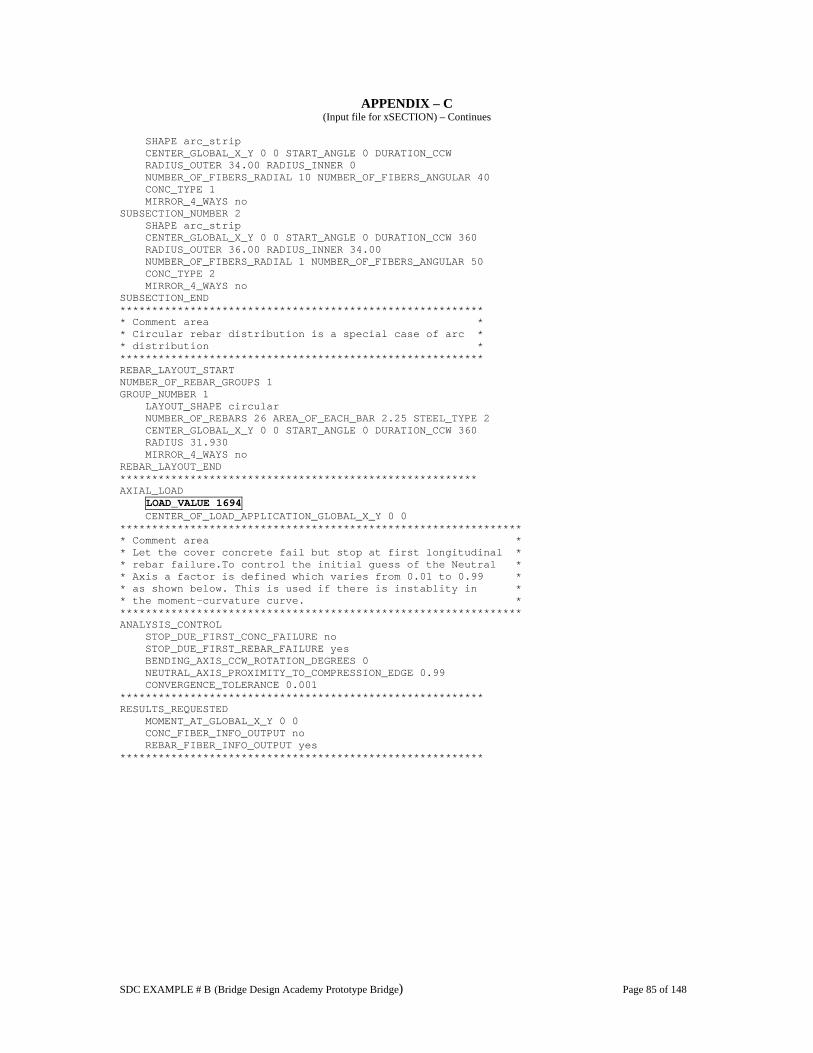
Bent 2 Column Axial Force, Pc=1,694 kips. Bent 3 Column Axial Force, Pc=1,653 kips. Using these section and material properties, a section analysis is now performed using xSECTION program.
• An input file to xSECTION for the Bent 2 Column is shown in Appendix C. An input file for Bent 3 Column will be similar except for different column axial loads.
• Output for this xSECTION run is shown in Appendix D. • Moment-Curvature ( φ−M ) diagram for Bent 2 Column is shown in Appendix
E. For a single pinned-fixed column, the lateral bending stiffness is given as
323
LIEk ece ××
=
L = Column height, measured from the pin at top of footing to the soffit of the bridge (SDC 3.1.3)
SDC EXAMPLE # B (Bridge Design Academy Prototype Bridge) Page 10 of 148
The concrete modulus of Elasticity, Ec, is given by
( ) )(33 '5.1 psifwE ccc ××= SDC Eqn. (3.11) where cw is the unit weight of concrete in Kg/m3. Using expected value of '
cf ,
( )
ksiEc 372,4000,1
200,515033 5.1
=⎥⎥⎦
⎤
⎢⎢⎣
⎡ ××=
• Bent 2 Stiffness From the φ−M analysis results, the cracked moment of inertia, =eI 23.717 ft4 (See Appendices D and E).
⎥⎦
⎤⎢⎣
⎡×
×××= 3
4
2 )1244()12()717.23()372,4()3()2( Columnsk e
or 64.872 =ekink
• Bent 3 Stiffness Again from φ−M analysis results, =eI 23.612 ft4
⎥⎦
⎤⎢⎣
⎡×
×××= 3
4
3 )1247()12()612.23()372,4()3()2( Columnsk e
or 59.713 =ekink
Total tributary mass at Bent 2 = inskipsColumns /77.8)12()2.32(
)694,1()2( 2−=××
Total tributary mass at Bent 3 = inskipsColumns /56.8)12()2.32(
)653,1()2( 2−=××
84.0)56.8()64.87()77.8()59.71(=
××
=×
×
iej
jei
mkmk
OK
SDC EXAMPLE # B (Bridge Design Academy Prototype Bridge) Page 11 of 148
Therefore, the current span layout configuration satisfies the SDC balanced stiffness criteria for adjacent bents in a frame. The columns within each bent are of the same height and they support equal gravity loads, thus SDC Equation (7.1) is automatically satisfied. As mentioned earlier, if foundation flexibility is significant, its effect must be considered while performing these checks. In case the bents/frames do not meet the SDC requirements for balanced stiffness, one or more of the following techniques (SDC 7.1.3 ) can be considered for adjusting the fundamental period of vibration:
• Use of oversized shafts. • Adjust the effective column length. Examples include lowering footings, using
• Add or relocate columns. • Modify the hinge/expansion joint layout, if applicable. • Use isolation bearings or dampers.
If the column reinforcement exceeds the preferred maximum, the following additional revisions as outlined in MTD 6-1 may help:
• Pin columns in multi-column bents and selected single columns at base adjacent to abutments.
• Use higher strength column concrete. • Shorten spans and add bents. • Use pile shafts in lieu of footings.
• Add more additional columns per bent.
SDC EXAMPLE # B (Bridge Design Academy Prototype Bridge) Page 12 of 148
Before we proceed with a comprehensive analysis to consider the effects of change in columns axial forces due to seismic overturning moments and also the effects of soil overburden on column footings, let us now check the component ductility capacity requirements for ductile members to make sure that basic SDC ductility requirements are met. These ductility calculations are based upon section 3.1 of the SDC. It is Caltrans practice to use an idealized bilinear φ−M curve to estimate the idealized yield displacement and deformation capacity of ductile members. Bent 2 L=44 ft.
000078.0=Yφ inrad / as read from the φ−M data listed in Appendix D. The analytical plastic length, pL , is estimated using SDC Eqn. (7.25) as
blyep dfLL ××+×= 15.008.0 blye df ××≥ 3.0 With L=528 in, yef =68 ksi, and bld =1.693 in,
54.34)693.1683.0(51.59693.16815.052808.0 =××>=××+×= inLp in.
51.59=∴ pL in. The idealized column yield displacement is now calculated
25.7000078.0)528(31 2 =××=ΔY in.
Plastic curvature, 000747.0=pφ rad/in as read from the φ−M data shown in Appendices D and E. Plastic rotation, 044454.0000747.051.59 =×=×= ppp L φθ rad.
Plastic displacement, 15.22251.59528044454.0 =⎟⎠⎞
⎜⎝⎛ −×=Δ p in.
Total Displacement Capacity, 40.2915.2225.7 =+=Δ c in. Local Displacement Ductility Capacity for Bent 2 Columns is now calculated as
Y
cc Δ
Δ=μ = 1.4
25.740.29
=⎟⎠⎞
⎜⎝⎛ 3> SDC Eqn. (3.6) OK.
Similarly, for Bent 3 Columns
SDC EXAMPLE # B (Bridge Design Academy Prototype Bridge) Page 13 of 148
Y
cc Δ
Δ=μ = 0.4
27.820.33
=⎟⎠⎞
⎜⎝⎛ 3> SDC Eqn. (3.6) OK.
Thus, the column section size and reinforcement meets the local displacement ductility capacity requirements of the SDC. Displacement Demand As a preliminary step, the seismic demand can be estimated using Elastic Static Analysis (ESA). This method is most suitable for structures with well balanced spans and uniformly distributed stiffness where the response can be captured by a simple predominantly translational mode of vibration: For Bent 2 The period of fundamental mode of vibration, T2, is calculated as
99.164.87
77.8222
22 === ππ ek
mT sec.
Similarly, for Bent 3,
17.23 =T sec. The longer period is expected because the Bent 3 columns are taller and support more gravity load. From the ARS curve shown in Figure 2, the values of spectral acceleration for two bents are read to be
gaga
33.036.0
3
2
==
The displacement demand can now be estimated as
eD k
am×=Δ
For Bent 2 Columns,
The displacement demand, 92.1364.87
122.3236.077.8=
×××=ΔD in.
The displacement demand ductility, 9.125.792.13
==Dμ 5≤ OK SDC Section (2.2.4)
Also inin CD 40.2992.13 =Δ<=Δ OK SDC Equation (4.1)
SDC EXAMPLE # B (Bridge Design Academy Prototype Bridge) Page 14 of 148
Similarly, for Bent 3 Columns,
The displacement demand, 25.1559.71
122.3233.056.8=
×××=ΔD in.
The displacement demand ductility, 8.127.825.15
==Dμ 5≤ OK SDC Section (2.2.4)
Also inin CD 20.3325.15 =Δ<=Δ OK SDC Equation (4.1)
SDC EXAMPLE # B (Bridge Design Academy Prototype Bridge) Page 15 of 148
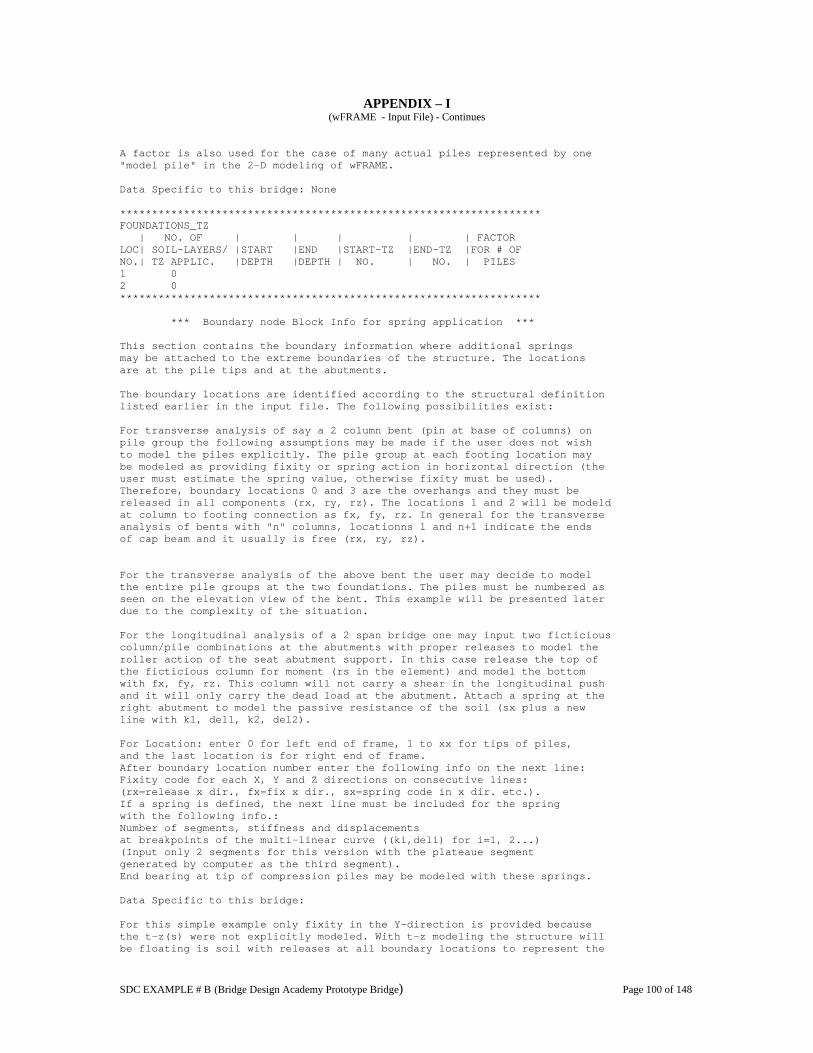
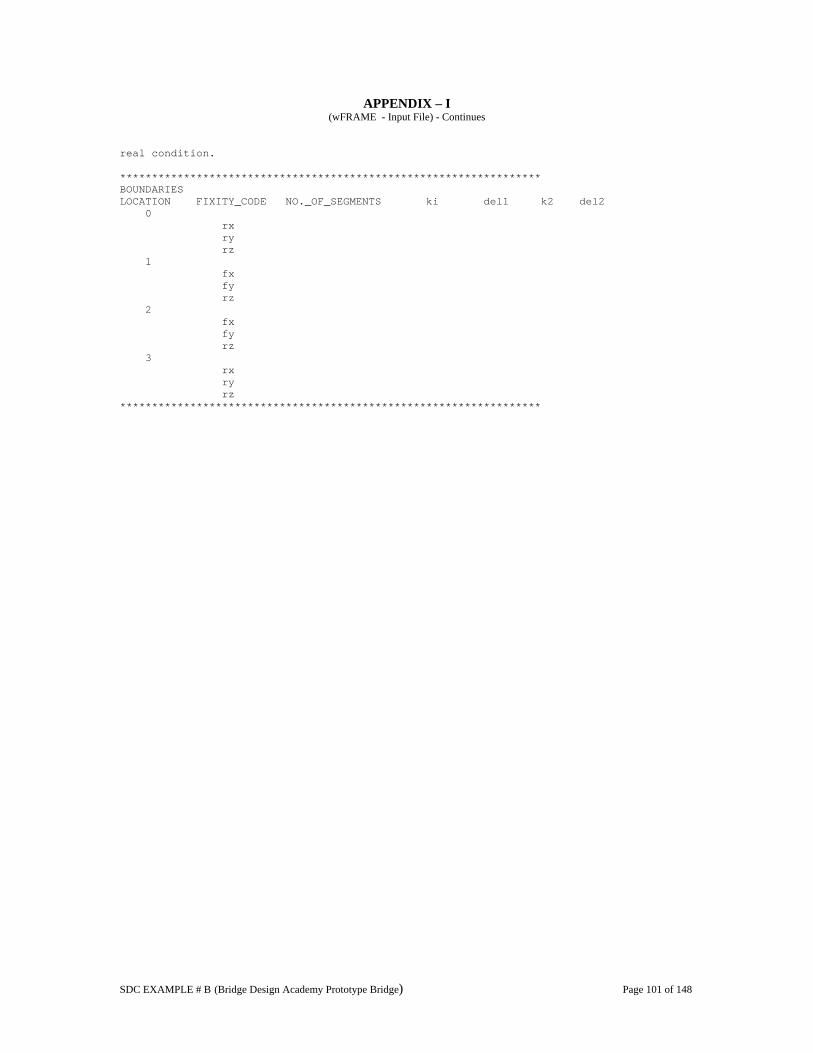
II.C. Transverse Pushover Analysis and Design II.C.1 Modeling Assumptions Including Soil Springs During the transverse movement of a multi-column frame, a strong cap beam provides a framing action. As a result of this framing action, the column axial force can vary significantly from the dead load state. If the seismic overturning forces are large, the top of the column might even go into tension. The cap beam is not infinitely rigid. The flexibility provided by the bent cap alters the column end condition. Also, the effect of soil-structure interaction can be included . Such effect can be significant in the case where footings are buried deep in the ground. Push over is mainly a capacity estimating procedure but it can also be used to estimate demand for structures having characteristics outlined previously. The computer program wFRAME is used to perform pushover analysis with the following conventions: • The model is two dimensional with beam elements along the center of cap beam and
columns. • The dead load of superstructure, bent cap, and of columns, if desired, is applied as a
uniformly distributed load along the length of the bent cap. • The element connecting the superstructure c.g. to the column end point at the soffit
level is modeled as a super stiff element with stiffness that is two times higher than the regular column section. The moment capacity used for such element is also two times the plastic moment capacity of the column. This is done to ensure that for a column-to-superstructure fixed connection, the plastic hinge forms at top of the column but below the soffit.
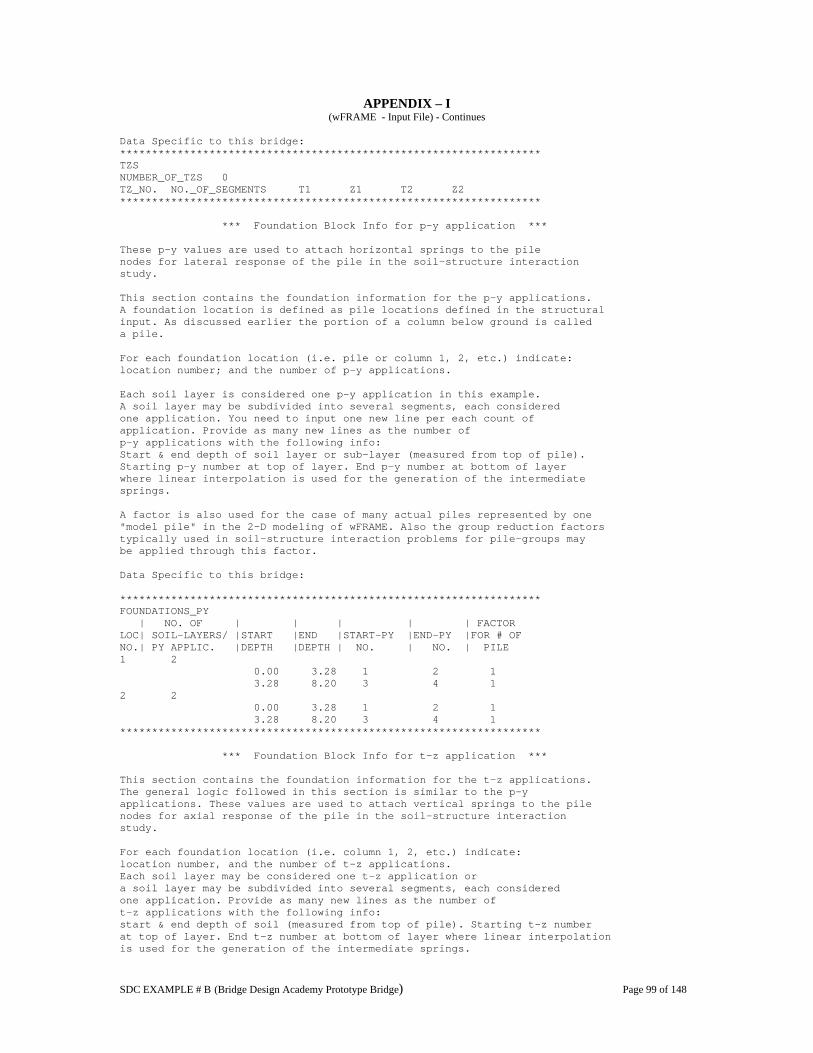
• The soil effect is included as yp − springs applied to the column portion below
the ground. The data used for this site is shown in Appendix F. Figure 3 on the following page schematically shows such a model. The following values of effective section properties and idealized column plastic moment capacity (under dead loads only) are used as input to wFRAME program for pushover analysis.
SDC EXAMPLE # B (Bridge Design Academy Prototype Bridge) Page 16 of 148
Figure 3 Transverse Pushover Analysis Model The effective bent cap width is calculated as per SDC 7.3.1.1. The Appendix G shows the xSECTION model of the bent cap. The Appendices H1 and H2 show selective portions of xSECTION output showing cap section properties for positive and negative bending. The following section properties are used
262.62 ftA =
35.80 ft
8.20 ft
3.38 ft
Rigid Links
34 ft*
7.72 ft* 7.72 ft*
* Dimensions along the skewed bent line.
Loose Sand N=10, φ=30 degrees
K=25 pci
Medium Dense Sand N=20, φ=33 degrees
K=150 pci
3.28 ft
SDC EXAMPLE # B (Bridge Design Academy Prototype Bridge) Page 17 of 148
457.55 ftI veeff =+
494.48 ftI veeff =−
As required by the SDC, capacity protected concrete components such as the bent cap, superstructure and footing shall be designed to remain essentially elastic when the column reaches its overstrength capacity. This is required in order to make sure that no plastic hinge forms in these components. The SDC requires that the bent cap flexure and shear capacity equals or exceeds the demand imposed by the column overstrength moment. Appendix I lists wFRAME input file. As the frame is pushed toward the right, the resulting overturning moment causes redistribution of the axial forces in the columns. This overturning causes an additional axial force on the front side column which will experience additional compression. The column on the back side experiences the same value in tension, reducing the net axial load. Based upon their behavior, these columns are usually known as compression and tension columns, respectively. At the instant when the first plastic hinge forms (in this case at the top of the compression column), the superstructure displacement and corresponding lateral force values are obtained from wFRAME output. Appendix J shows wFRAME output.
iny 49.8=Δ kipsFy 578)382,3(171.0 =×=
where 3,382 lb is the total tributary weight on the bent. At this stage, the axial forces in tension and compression columns as read from the wFRAME analysis output are 907 kips and 2,474 kips, respectively. These values can be quickly checked using simple hand calculations as described below:
.432,2544578 kipsftM goverturnin −=×= The axial compression corresponding to such overturning is given as
kipsP 74834432,25
=±=Δ
The axial force in the compression column will increase to kips442,2748694,1 =+ . The tension column will see its axial compression drop to kips946748694,1 =− . These values compare very well with the wFRAME results. Small differences are probably due to the presence of soil in the more realistic wFRAME model. Now we know that the overturning caused by seismic forces results in significant change in the column axial forces. We also know that the effective section properties and column yield moments are influenced by the level of axial force. Therefore, for these updated
SDC EXAMPLE # B (Bridge Design Academy Prototype Bridge) Page 18 of 148
axial forces, the section properties are calculated again using xSECTION. See Appendix K for these results. Column Type )(kipsPc )( kipftM p − )( 4ftIe )/( inradYφ )/( inradpφ
Note that higher compression produces a higher value of PM but a reduction in Pφ . This trend occurs in all columns and is a reminder that PM is not the only indicator of column performance. The effect of change in the axial force in a column section due to overturning moments can be summarized as below: • PM changes • The tension column has become more ductile while the compression column has
become less ductile. • The required flexural capacity of cap beam that is needed to make sure that the hinge
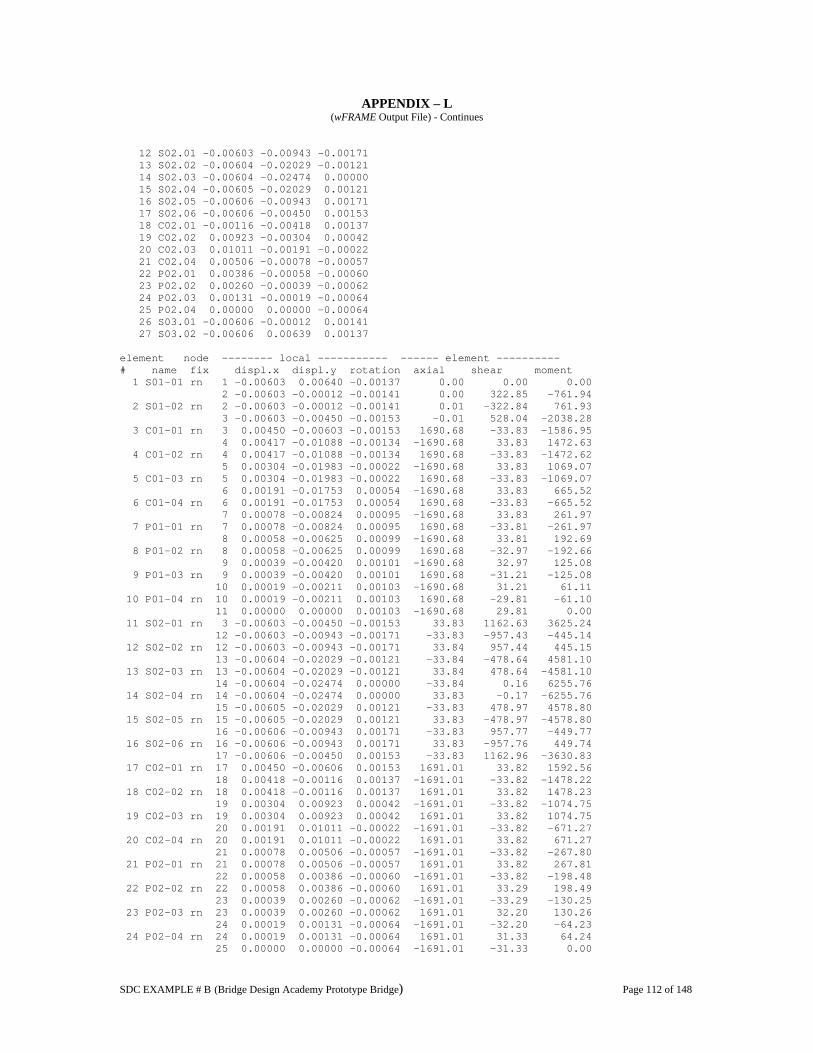
forms at column top is now obviously larger. With updated values of PM and eI , we run a second iteration of the wFRAME model. As the frame is pushed laterally, the compression column yields at the top. The tension column has not reached its capacity yet. See Appendix L for these results. At this moment,
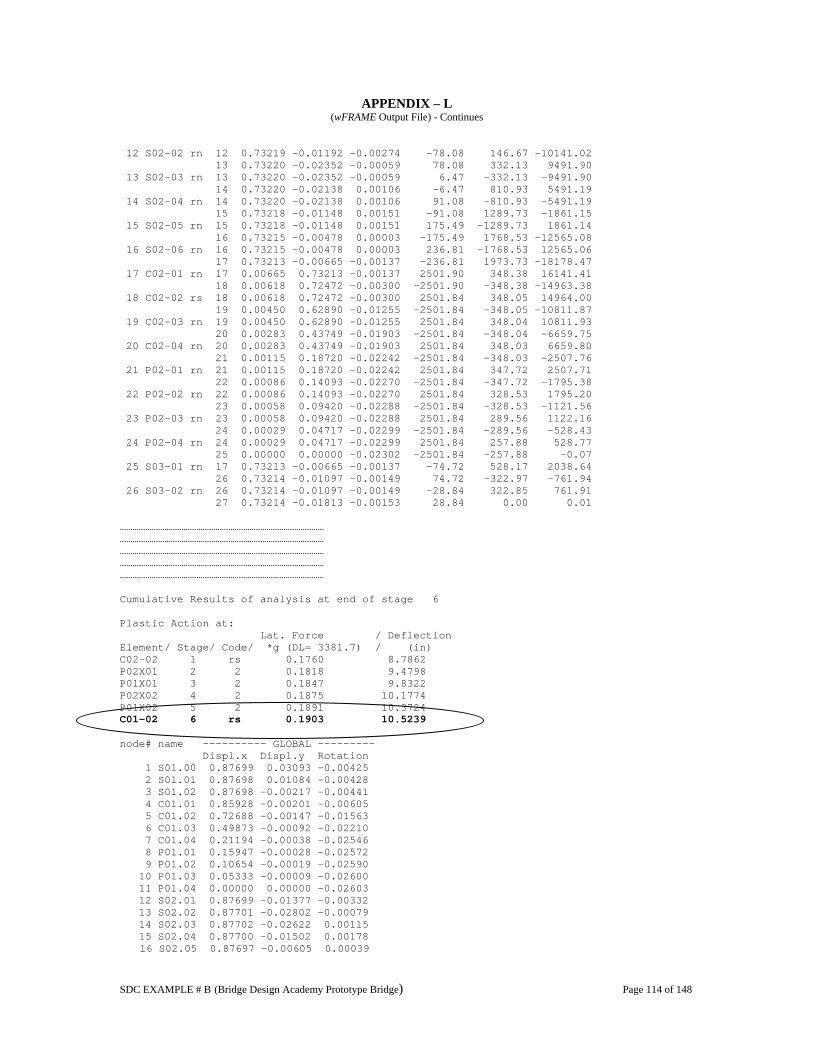
iny 79.8)1( =Δ At this stage, the column axial forces are read to be 880 kips, 2,502 kips for tension and compression columns, respectively. Since, the change in column axial load is now less than 5%, there is no need for further iteration. As iteration 2 is pushed further, the already yielded compression column is able to undergo additional displacement because of its plastic hinge rotational capacity. As the bent is pushed further, the top of the tension column yields. At this point the effective bent stiffness approaches zero and will not attract any additional force if pushed further. The bent, however, will be able to undergo additional displacement until the rotational capacity of one of the hinges is reached. Appendix L shows selective portions of the wFRAME output file. The Force-Displacement relationship is shown in Appendix M.
.52.10)2( iny =Δ This is an updated value of the idealized yield YΔ which was calculated previously based upon the assumption that cap beam is infinitely rigid.
kipsFy 643)382,3(190.0)2( =×=
SDC EXAMPLE # B (Bridge Design Academy Prototype Bridge) Page 19 of 148
II.C.2.i Displacement Capacity and Demand Using the procedure already described on page 12 to calculate the plastic deformation and using the section properties listed above, the section capacities for both columns are calculated to be Tension Column Compression Column
4.352.1031.35
31.3579.2452.10
79.24
51.59
==
=+=Δ
=Δ
=
c
c
p
p
in
in
inL
μ
3.379.801.29
01.2922.2079.8
22.20
51.59
==
=+=Δ
=Δ
=
c
c
p
p
in
in
inL
μ
For bents having a larger number of columns or more locations for potential hinging, tabulation of these results provides a quick way to determine the critical hinge.
Hinge Location
Yield Displacement (in)
Plastic Deformation (in)
Total Displacement Capacity (in)
Compression Column Top 8.79 20.22 29.01*
Tension Column Top 10.52 24.79 35.31
* Critical bent displacement capacity, CΔ . The bent capacity calculated previously on page 12 was to size up the members before proceeding with more realistic and comprehensive analysis that includes the effects of bent cap flexibility. Estimating the Seismic Demand The effective bent stiffness is estimated as
inkF
ky
ye 12.6152.10
6432 ==
Δ=
and the period of vibration, T, is calculated to be
sec4.212.61
77.82 =×= πT
SDC EXAMPLE # B (Bridge Design Academy Prototype Bridge) Page 20 of 148
From the ARS curve, the spectral acceleration 2a is read to be 0.30 g. The maximum seismic displacement demand is estimated as
ind 63.1612.61
)122.3230.0(77.8=
×××=Δ
6.152.1063.16
==dμ < 5 SDC Section (2.2.4)
and also .01.2963.16 inin cd =Δ<=Δ SDC Equation (4.1) Note that the bent is forced well beyond its yield displacement but that collapse is prevented because of ductile capacity. This is what we expect out of the Caltrans “No Collapse” Performance Criteria. Based upon these checks one might conclude that the column is over designed for the anticipated seismic demand. However, as shown little bit later in section II.C.2.ii, the so-called Δ−P controls the column flexural design. The same procedure is then repeated to perform transverse pushover analysis for Bent 3. The results from such analysis are summarized as below: Tension Column Compression Column
4.348.1147.39
47.3999.2748.11
99.27
39.62
==
=+=Δ
=Δ
=
c
c
p
p
in
in
inL
μ
3.371.948.32
48.3277.2271.9
77.22
39.62
==
=+=Δ
=Δ
=
c
c
p
p
in
in
inL
μ
Estimating the Seismic Demand
inkF
ky
ye 11.55
48.11278,3193.03 =
×=
Δ=
and the period of vibration, T, is calculated to be
sec5.211.55
56.82 =×= πT
From ARS curve, the spectral acceleration 3a is read to be 0.29 g. The maximum seismic displacement demand is estimated as
SDC EXAMPLE # B (Bridge Design Academy Prototype Bridge) Page 21 of 148
ind 41.1711.55
)122.3229.0(56.8=
×××=Δ
Therefore,
55.148.1141.17
<==dμ
and also .48.3241.17 inin cd =Δ<=Δ II.C.2.ii Δ−P Check We have relatively heavily loaded tall columns. Δ−P effects could be significant for this type of situation. Instead of requiring that such effects be calculated, the Seismic Design Criteria recommends that such effects can be ignored if these are limited to 20% of column capacity i.e. col
pDdl MP ×≤Δ× 20.0 SDC Eqn. (4.3) where
=dlP Dead load axial force. =ΔD The lateral offset between the base of the plastic hinge and the point of
contra-flexure. For Bent 2 Columns
Column Axial Dead Load = 1,694 kips. Plastic Moment Capacity = 13,838 ft-kips. Maximum Seismic Displacement = 16.73 in.
20.017.0)12838,13(
73.16694,1<=
××
=Δ×
p
rdl
MP
OK
For Bent 3 Columns
Column Axial Dead Load = 1,653 kips. Plastic Moment Capacity = 13,777 ft-kips. Maximum Seismic Displacement = 17.51 in.
20.018.0)12777,13(
51.17653,1<=
××
=Δ×
p
rdl
MP
OK
SDC EXAMPLE # B (Bridge Design Academy Prototype Bridge) Page 22 of 148
Now we can see that although the selected column section has more than enough ductility capacity, the column sections meet the Δ−P requirements only by a small margin. II.C.2.iii Minimum Lateral Strength Capacity (0.1g) According to the SDC (Section 3.5), the minimum lateral strength of each column shall be 0.1g. From the force deflection data shown in Appendix M, the minimum lateral strength of Bent 2 is 0.19g or 0.095g for each column (close to 0.1g ok). II.C.3. Column Shear and Bent Cap Capacity Check II.C.3.i Column Shear Check According to the SDC, the seismic demand shall be based upon the overstrength shear,
0V , associated with the column overstrength moment 0M (SDC Sec 4.3.1). Since shear failure tends to be brittle, shear capacity for ductile members shall be conservatively determined using nominal material properties. According to SDC
0VVn ≥×φ 85.0=φ SDC Eqn. (3.14) where nominal shear capacity, nV , is given as summation of concrete and steel shear capacities i.e.
scn VVV += SDC Eqn. (3.15)
• Shear Demand 0V For Bent 2, kipsftMM p −=×=×= 957,17964,142.12.10 This overstrength moment includes the effects of overturning. Shear demand associated with overstrength moment,
kipsL
MV 408
44957,170
0 ===
Alternately, the maximum shear demand can also be determined from wFRAME results. The maximum column shear demand reported by such analysis is multiplied by a factor of 1.2 to obtain the shear demand associated with the overstrength moment. From
SDC EXAMPLE # B (Bridge Design Academy Prototype Bridge) Page 23 of 148
wFRAME output, the maximum column shear demand equals .4193492.1 kips=× See wFRAME output results in Appendix L. The presence of soil around the footing results in a slightly shorter effective column length which in turn causes slightly higher column shear demand in wFRAME output. • Concrete Shear Capacity
ecc AV ×=ν SDC Eqn. (3.16) where
=cν Allowable concrete shear stress
ge AA ×= 8.0 SDC Eqn. (3.17) Now
''21 4 ccc ffff ≤××=υ SDC Eqn. (3.18)
As one can see from the equations for concrete shear capacity, the plastic hinge region is more critical as the capacity will be lower in the this region. Further, the shear capacity will be smallest when the axial load is low. The controlling shear capacity will be found in the tension column. Now
367.3150.0
3.01 <−+×
≤= dyhs f
f μρ
SDC Equation (3.20)
where for circular column, the confinement reinforcement ratio is given as
sDAb
s ××
= '
4ρ
For our case,
279.0 inAb =
inD 87.66213.1
213.12272' =−−−−=
ins 5= Making these substitutions in above equation yields
009451.0=sρ From the pushover analysis results, the displacement ductility, 6.1=dμ . Using ksif yh 60= and 6.1=dμ , the shear capacity factor 1f is calculated to be 5.85.
SDC EXAMPLE # B (Bridge Design Academy Prototype Bridge) Page 24 of 148
However, as limited by above equation, use 31 =f . Similarly
5.111.1)126(
4000,2
109071000,2
12
3
2 <=×××
×+=
×+=
πg
c
AP
f SDC Equation (3.21)
The maximum allowable concrete shear stress is calculated as
psipsic 253000,44211000,411.13 =<=××=υ Use psic 211=υ .
kipsVc 687000,1
)126(4
8.0211 2
=××××
=∴
π
• Transverse Reinforcement Shear Capacity
⎟⎟⎠
⎞⎜⎜⎝
⎛ ××=
sDfA
V yhvs
' where bv AnA
2π
×=
where n=number of individual interlocking spiral or hoop core sections. As specified in the SDC Sec. 3.6.5.2, the minimum shear reinforcement in column should not be less than
2'
min, 14.0025.0 inf
sDAyh
v =×≥=
2, 79.0 inA providedv = (The area of #8 hoop rebar). OK
kipsVs 9965
87.666079.02
=××
×=∴π
But according to SDC Sec. (3.6.5.1), the maximum shear strength, sV , provided by steel
shall not exceed =×× ec Af '8 1,648 kips. Therefore,
.419431,1)996687(85.0 0 kipsVkipsVn =>=+×=×φ OK. Similarly for Bent 3 columns, the shear demand corresponding the overstrength moment is estimated as
SDC EXAMPLE # B (Bridge Design Academy Prototype Bridge) Page 25 of 148
kipsL
MV 380
47893,142.10
0 =×
==
From the wFRAME analysis results, the maximum column shear demand =
.4093412.1 kips=× Going through similar calculations, we determine that
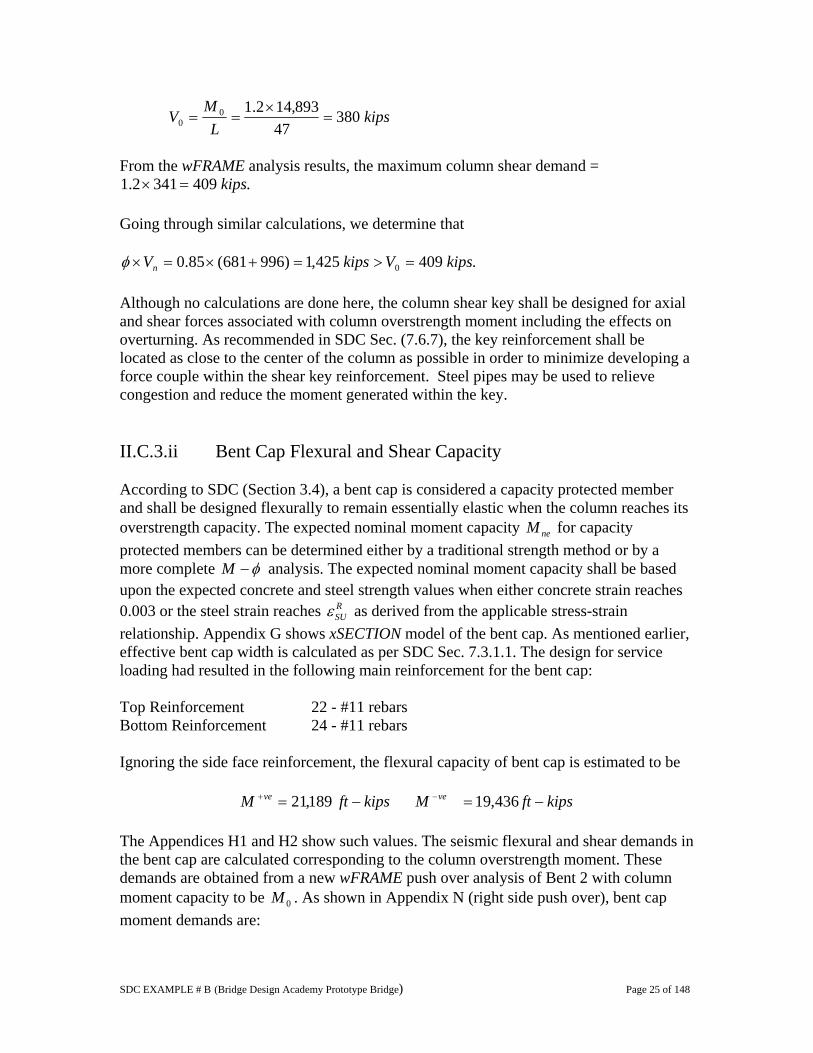
.409425,1)996681(85.0 0 kipsVkipsVn =>=+×=×φ Although no calculations are done here, the column shear key shall be designed for axial and shear forces associated with column overstrength moment including the effects on overturning. As recommended in SDC Sec. (7.6.7), the key reinforcement shall be located as close to the center of the column as possible in order to minimize developing a force couple within the shear key reinforcement. Steel pipes may be used to relieve congestion and reduce the moment generated within the key. II.C.3.ii Bent Cap Flexural and Shear Capacity According to SDC (Section 3.4), a bent cap is considered a capacity protected member and shall be designed flexurally to remain essentially elastic when the column reaches its overstrength capacity. The expected nominal moment capacity neM for capacity protected members can be determined either by a traditional strength method or by a more complete φ−M analysis. The expected nominal moment capacity shall be based upon the expected concrete and steel strength values when either concrete strain reaches 0.003 or the steel strain reaches R
SUε as derived from the applicable stress-strain relationship. Appendix G shows xSECTION model of the bent cap. As mentioned earlier, effective bent cap width is calculated as per SDC Sec. 7.3.1.1. The design for service loading had resulted in the following main reinforcement for the bent cap: Top Reinforcement 22 - #11 rebars Bottom Reinforcement 24 - #11 rebars Ignoring the side face reinforcement, the flexural capacity of bent cap is estimated to be
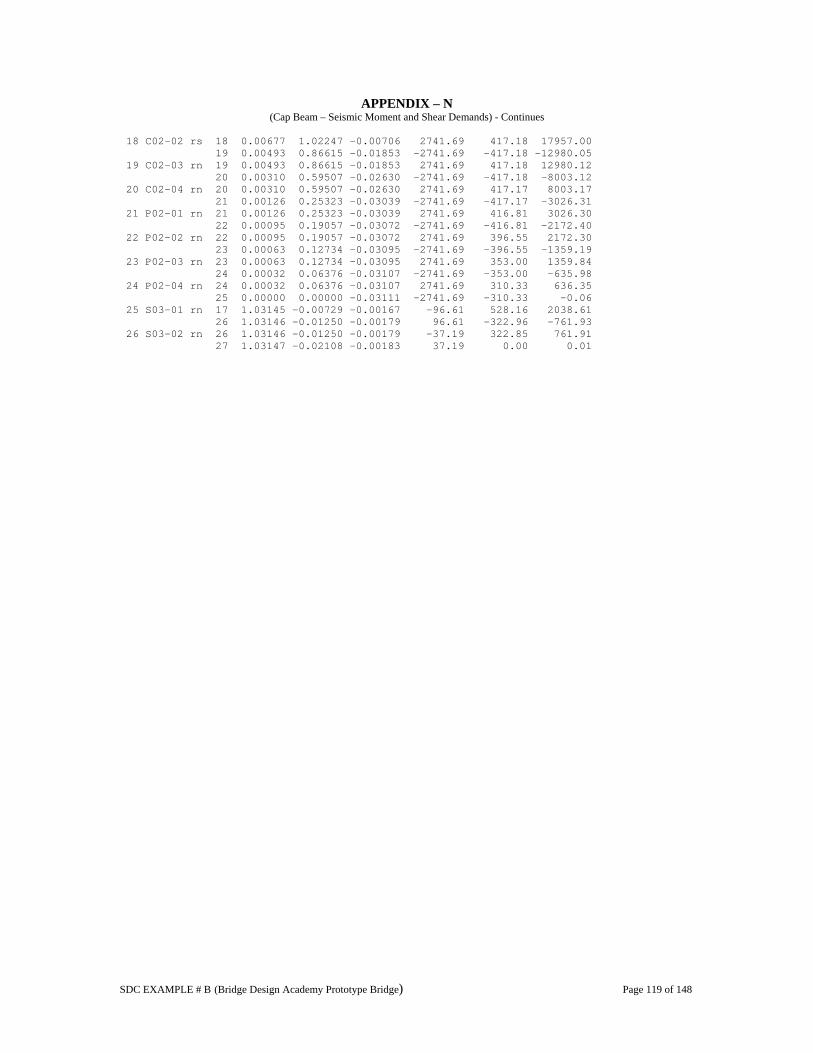
kipsftMkipsftM veve −=−= −+ 436,19189,21 The Appendices H1 and H2 show such values. The seismic flexural and shear demands in the bent cap are calculated corresponding to the column overstrength moment. These demands are obtained from a new wFRAME push over analysis of Bent 2 with column moment capacity to be 0M . As shown in Appendix N (right side push over), bent cap moment demands are:
SDC EXAMPLE # B (Bridge Design Academy Prototype Bridge) Page 26 of 148
kipsftMkipsftM veve −=−= −+ 072,15350,14 Next the maximum seismic shear demand that corresponds to the column overstrength moment is compared with the available shear capacity of the bent cap. The maximum demand, 0V , as read from the above pushover analysis is .009,2 kips The shear capacity of bent cap at the face is calculated as below:
0VVn ≥×φ 85.0=φ
scn VVV += The shear capacity of bent cap is calculated as per Bridge Design Specifications (BDS) Sec. 8.16.6.2. Conservatively, dbfV wcc
'2×= (lbs,in) BDS Eqn. (8-49) Using
.4000' psifc = .00.96 inbw =
.99.75263.12.481 ind =−−=
.923 kipsVc = Now
sdfA
V yhvs
××= BDS Eqn. (8-53)
As shown in Figure 16, the shear reinforcement in this region of maximum shear consists of 6-legged, #6 stirrups @ 8 in c/c giving total shear capacity of
kipslegsVs 505,18
99.756044.0)6( =××
×=∴
.009,2064,2)505,1923(85.0 0 kipsVkipsVn =>=+×=×φ OK.
SDC EXAMPLE # B (Bridge Design Academy Prototype Bridge) Page 27 of 148
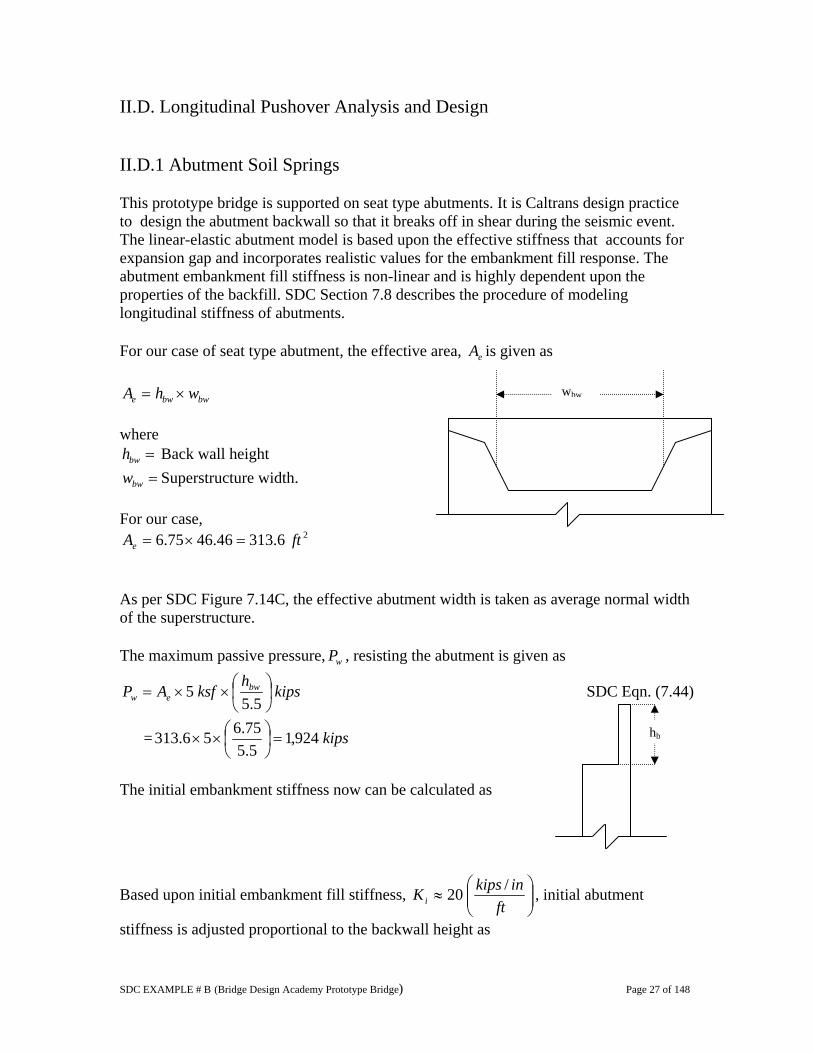
II.D. Longitudinal Pushover Analysis and Design II.D.1 Abutment Soil Springs This prototype bridge is supported on seat type abutments. It is Caltrans design practice to design the abutment backwall so that it breaks off in shear during the seismic event. The linear-elastic abutment model is based upon the effective stiffness that accounts for expansion gap and incorporates realistic values for the embankment fill response. The abutment embankment fill stiffness is non-linear and is highly dependent upon the properties of the backfill. SDC Section 7.8 describes the procedure of modeling longitudinal stiffness of abutments. For our case of seat type abutment, the effective area, eA is given as
bwbwe whA ×= where
=bwh Back wall height =bww Superstructure width.
For our case,
26.31346.4675.6 ftAe =×= As per SDC Figure 7.14C, the effective abutment width is taken as average normal width of the superstructure. The maximum passive pressure, wP , resisting the abutment is given as
kipsh
ksfAP bwew ⎟
⎠⎞
⎜⎝⎛××=
5.55 SDC Eqn. (7.44)
= kips924,15.575.656.313 =⎟
⎠⎞
⎜⎝⎛××
The initial embankment stiffness now can be calculated as
Based upon initial embankment fill stiffness, ⎟⎟⎠
⎞⎜⎜⎝
⎛≈
ftinkipsKi
/20 , initial abutment
stiffness is adjusted proportional to the backwall height as
hb
wbw
SDC EXAMPLE # B (Bridge Design Academy Prototype Bridge) Page 28 of 148
K1
K2
0.249 ft 1.0 ft
⎟⎠⎞
⎜⎝⎛××=
5.5hwKK iabut 1,924 k
inkK abut 140,1
5.575.646.4620 =⎟
⎠⎞
⎜⎝⎛××= 643 k/in
inKF 69.1
140,1924,1
===Δ 1.30 in 1.69 in
.99.230.169.1 ingapeffective =+=Δ+Δ=Δ See Appendix O for calculations for gapΔ , the combined effect of thermal movement and anticipated shortening. Average contributory length is used for this purpose.
inkipsK Abutinitial /643
99.2924,1
==
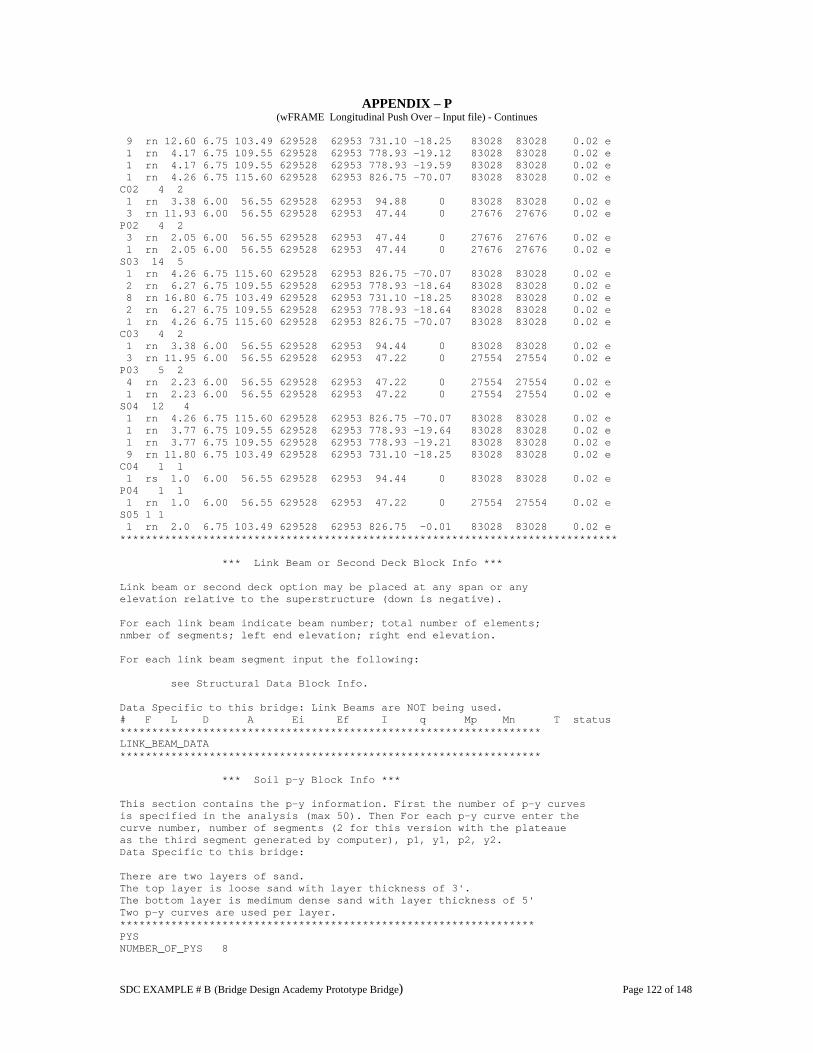
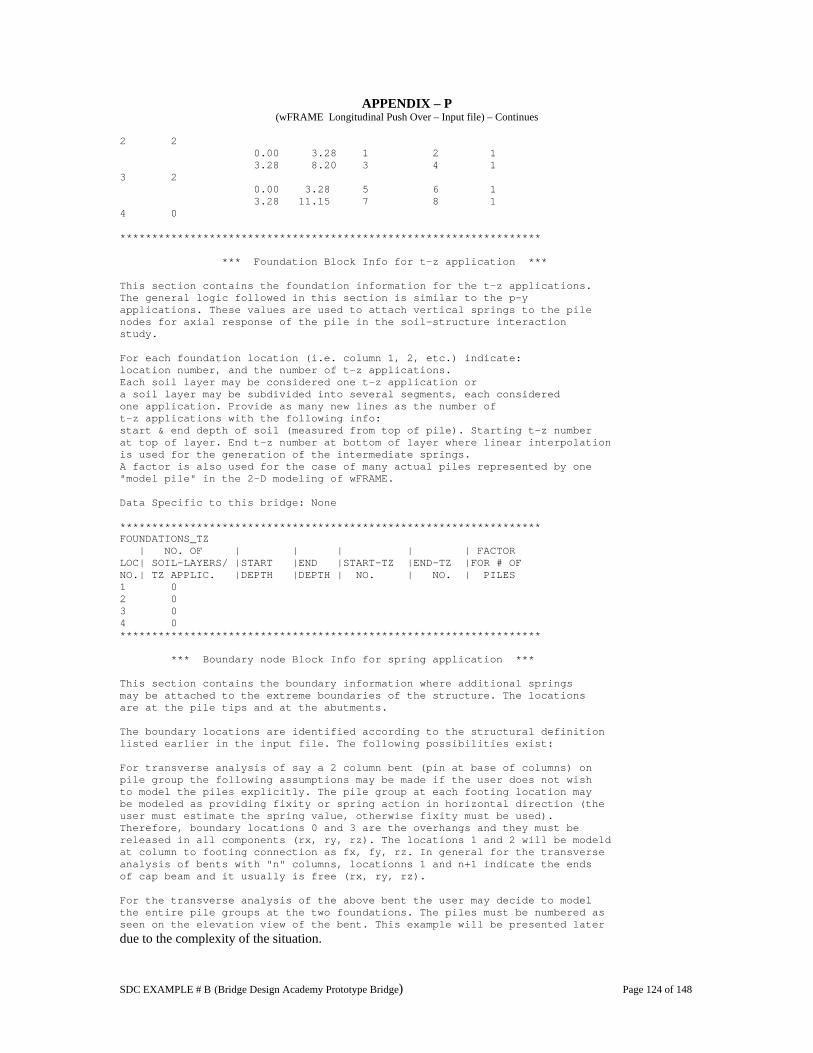
This value is used as the starting abutment stiffness for the longitudinal push over analysis. The Appendix P lists wFRAME input file. When the structure has reached its plastic limit state, we calculate the longitudinal bridge stiffness as
./35113.9
430,838.0 inkipsklong =×
= See Appendix Q1.
Mass, inskipsg
Wm /82.21122.32
430,8 2−=×
==
sec57.1351
82.2122 =××=××= ππlongkmT
gSa 48.0=
inK
amKF
D 53.11351
122.3248.082.21=
×××=
×==Δ
86.399.253.11
==ΔΔ
=effective
DAR
According to SDC Sec. 7.8.1,
⎥⎦
⎤⎢⎣
⎡×⎟⎠⎞
⎜⎝⎛
−−
−×= 9.0242
0.1 AAbutinitial
Abutfinal
RKK
./105)163.0(6439.024
286.30.1643 inkips=×=⎥⎦
⎤⎢⎣
⎡×⎟⎠⎞
⎜⎝⎛
−−
−×=
The following stiffness values shall be used for all subsequent wFRAME longitudinal analyses:
ftkipsK /260,11 = and ft249.01 =Δ and
02 =K and ft0.12 =Δ
SDC EXAMPLE # B (Bridge Design Academy Prototype Bridge) Page 29 of 148
II.D.2 Ductility Analysis II.D.2.i Ductility Capacity and Ductility Demand Check Although the process of calculating the section capacity and the estimated seismic demand is similar to that for the transverse direction, there are some significant differences:
• Columns are lumped together. • Because superstructure is prestressed, gross moment of inertia is used for the
superstructure. • Bent overturning is ignored. • The abutment is modeled as a linear spring whose stiffness is calculated as
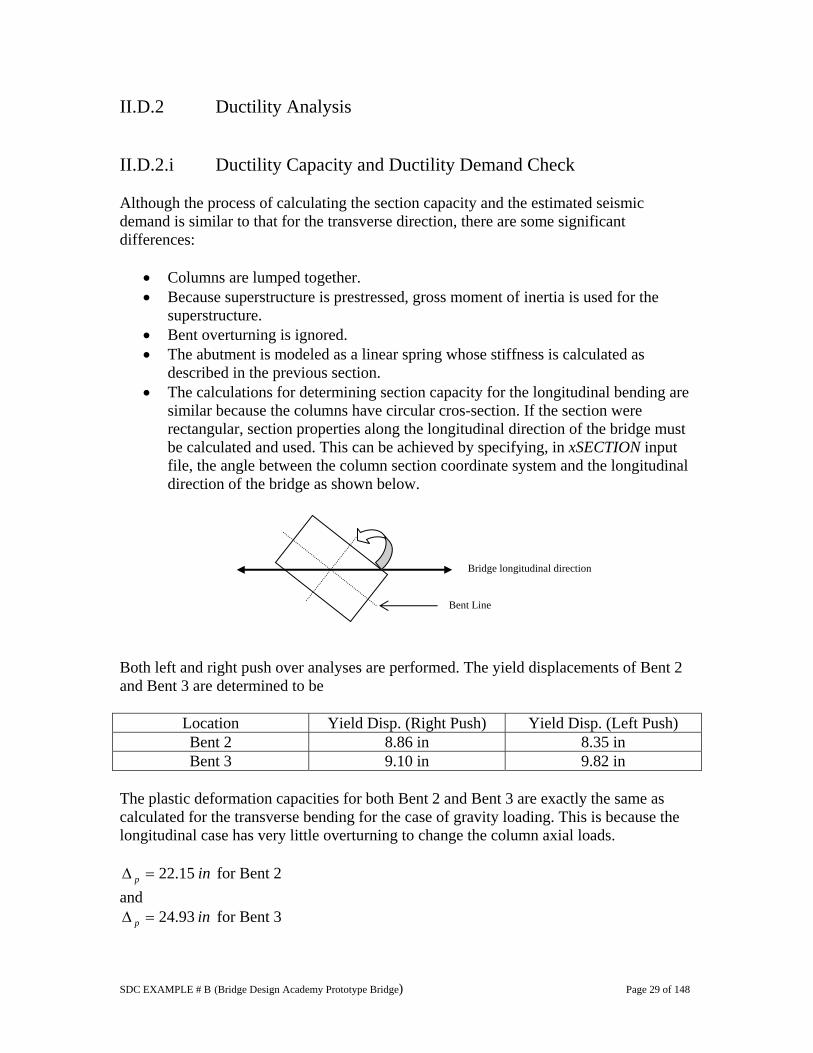
described in the previous section. • The calculations for determining section capacity for the longitudinal bending are
similar because the columns have circular cros-section. If the section were rectangular, section properties along the longitudinal direction of the bridge must be calculated and used. This can be achieved by specifying, in xSECTION input file, the angle between the column section coordinate system and the longitudinal direction of the bridge as shown below.
Both left and right push over analyses are performed. The yield displacements of Bent 2 and Bent 3 are determined to be
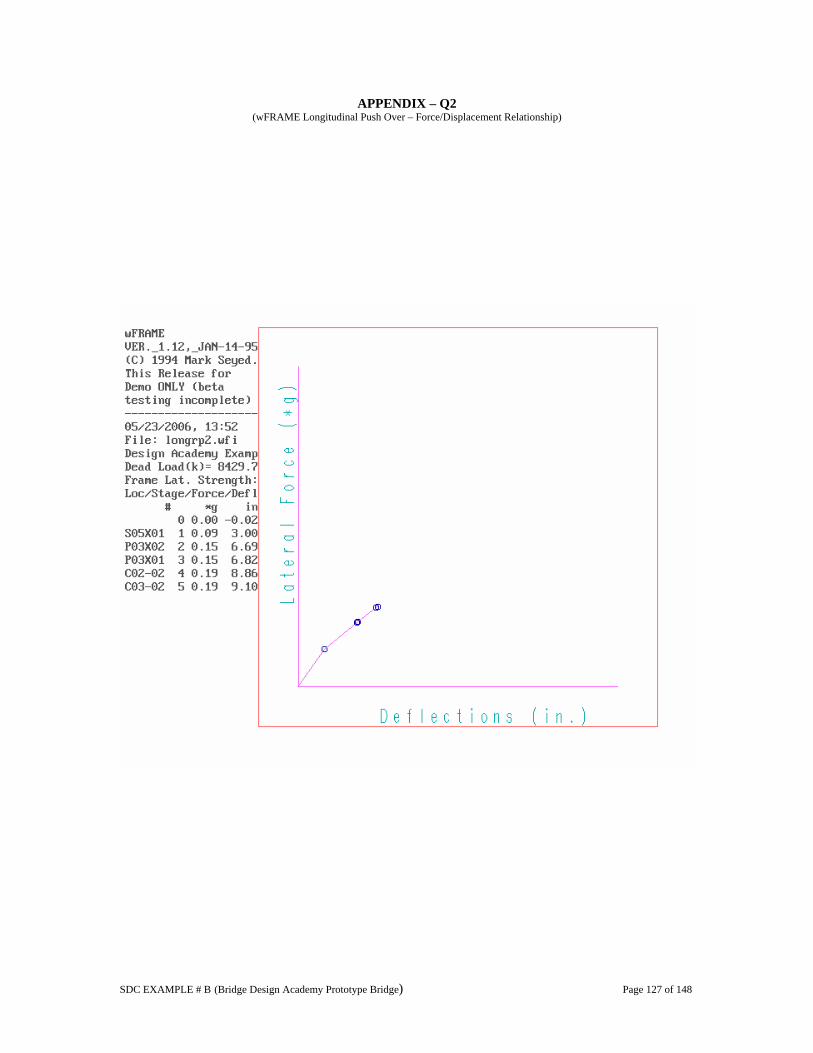
Location Yield Disp. (Right Push) Yield Disp. (Left Push) Bent 2 8.86 in 8.35 in Bent 3 9.10 in 9.82 in
The plastic deformation capacities for both Bent 2 and Bent 3 are exactly the same as calculated for the transverse bending for the case of gravity loading. This is because the longitudinal case has very little overturning to change the column axial loads.
inp 15.22=Δ for Bent 2 and
inp 93.24=Δ for Bent 3
Bent Line
Bridge longitudinal direction
SDC EXAMPLE # B (Bridge Design Academy Prototype Bridge) Page 30 of 148
Now With PYc Δ+Δ=Δ For Bent 2
Y
ccMin
ΔΔ
=μ = 5.386.8
15.2286.8=⎟
⎠⎞
⎜⎝⎛ + 3> SDC Sec. 3.1.4 OK.
Similarly, for Bent 3 Column,
Y
ccMin
ΔΔ
=μ = 5.382.9
93.2482.9=⎟
⎠⎞
⎜⎝⎛ + 3> SDC Sec. 3.1.4 OK.
Appendix Q2 lists force-displacement relationship from wFRAME analysis. The bridge (frame) longitudinal stiffness is calculated from this plot when both columns have yielded. This stage represents the collapse mechanism.
./17310.9
430,8187.0 inkipsklong =×
=
sec2.2=T for which gSa 31.0= .11.15 inD =Δ This demand is the same at Bents 2 and 3 because the superstructure
constrains the bents to move together. This might not be the case when the bridge has significant foundation flexibility, which can result from rotational and/or translational foundation movements. Check Displacement Ductility
8.135.811.15
==DMax μ for Bent 2 < 5 OK
6.110.911.15
==DMax μ for Bent 3 < 5 OK
II.D.2.ii Check Δ−P (SDC Sec 4.2) For Bent 2 Columns
20.015.0)12838,13(
11.15694,1<=
××
=Δ×
p
rdl
MP
OK
For Bent 3 Columns
20.015.0)12777,13(
11.15653,1<=
××
=Δ×
p
rdl
MP
OK
SDC EXAMPLE # B (Bridge Design Academy Prototype Bridge) Page 31 of 148
II.D.2.iii Minimum Lateral Strength The minimum lateral strength, as read from Appendix Q2, is 0.19g. It meets the requirement of SDC section 3.5. II.D.3 Column Shear Check As per SDC, the maximum shear demand corresponds to 0V . Note that wFRAME output numbers represent total shear for both columns at each bent. The column shear capacity is calculated following the procedures outlined in the transverse bending case on pages 21-23. Bent 2
.3882.10 kipsVV P =×= It corresponds to max shear value of PV =323 kips/column obtained from the wFRAME push over analysis. For 8.1=Dμ , factor1=5.65 > 3. Use factor1=3 For dead load axial force, factor2=1.21
.3782.10 kipsVV P =×= It corresponds to max shear value of 315 kips/column obtained from the wFRAME push over For 7.1=Dμ , factor1=5.85 > 3. Use factor1=3 For dead load axial force, factor2=1.20
psic 228=ν which gives kipsVc 743= .996 kipsVs = which has been calculated earlier.
kipsVkipsVV sc 378478,1)( 0 =>=+×φ OK
SDC EXAMPLE # B (Bridge Design Academy Prototype Bridge) Page 32 of 148
II.D.4 Seismic Strength of Concrete Bridge Superstructures We often seem to forget that when moment-resisting superstructure-to-column details are used, seismic forces of significant magnitude are induced into the superstructure. If the superstructure does not have adequate capacity to resist such forces, unexpected and unintentional hinge formation can occur in the superstructure leading to potential failure of the superstructure. According to the Seismic Design Criteria, a capacity design approach is adopted to ensure that the superstructure must have an appropriate strength reserve above demands generated from probable column plastic hinging. Memo to Designers (MTD) 20-6 describes the philosophy, design criteria and a procedure for determining the seismic demands in the superstructure and also recommends a method for determining the flexural capacity of the superstructure at all critical locations. II.D.4.i General Assumptions As discussed in MTD 20-6, the following are some of the assumptions that are made for simplifying the process of calculating the seismic demands in the superstructure: • The superstructure demands are based upon complete plastic hinge formation in all
columns or piers within the frame. • Effective section properties shall be used for modeling columns or piers while gross
section properties may be used for superstructure elements. • Superstructure dead load and secondary prestress demands are assumed to be
uniformly distributed to each girder, except in case of highly curved or highly skewed structures.
• While assessing the superstructure member demands and available section capacities,
an effective width as defined in the SDC Section 7.2.1.1 will be used. II.D.4.ii Determining Seismic Demand in the Superstructure The force demand in the superstructure corresponds to its Collapse Limit State. The Collapse Limit State is defined as the condition when all the potential plastic hinges in columns and/or piers have been formed. When a bridge reaches such a state during a seismic event, the following loads are present:
• Dead Loads • Secondary Prestress Loads • Seismic Loads
It should be noted that since the prestress tendon is treated as an internal component of the superstructure and is included in the member strength calculation, only the secondary
SDC EXAMPLE # B (Bridge Design Academy Prototype Bridge) Page 33 of 148
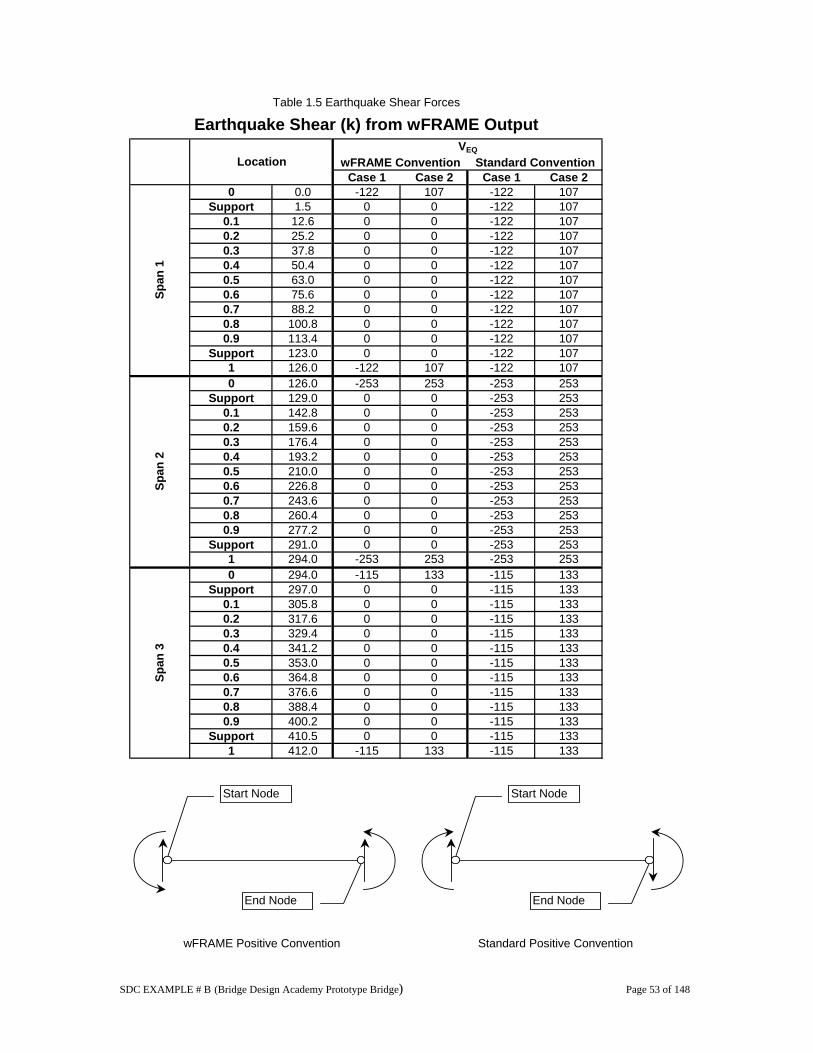
effects which are caused by the support constraints in a statically indeterminate prestressed frame, are considered to contribute to the member demand. The procedure to determine extreme seismic demands in the superstructure considers each of these load cases separately and the final member demand is obtained by the superposition of the individual load cases. Since we shall be using different tools to calculate these demands, it is very important to use a consistent sign convention while interpreting results. We shall adopt the following sign convention for positive moments and positive shears. The CTBridge program uses a similar sign convention. It should be kept in mind that the wFRAME program uses a sign convention that is different to this adopted sign convention.
Figure 4 Sign Convention for Positive Moment and Positive Shear for Various Programs Prior to the application of seismic loading, the columns are “pre-loaded” with moments and shears due to dead loads and secondary prestress effects. At the Collapse Limit State, the “earthquake moment” applied to the superstructure may be greater or less than the overstrength moment capacity of the column or pier depending upon the direction of these “pre-load” moments and the direction of the seismic loading under consideration. The load and secondary prestress effects to reach its overstrength moment capacity of the columns. Figure 5 shows schematically this approach of calculating columns seismic forces.
wFRAME
Beam
Column
Standard
Beam
Column
Beam
Column
CTBridge
SDC EXAMPLE # B (Bridge Design Academy Prototype Bridge) Page 34 of 148
dlM psM eqM ( ) ( ){ } ( )eqpsdl MMMM +++++=0
dlM psM eqM ( ) ( ){ } ( )eqpsdl MMMM −++++=− 0
Figure 5 Column Forces Corresponding to Two Seismic Loading Cases Once the column moment, Meq, is known at each potential plastic hinge location below the joint regions, the seismic moment demand in the superstructure can be determined using currently available Caltrans analysis tools by either of the following approaches. In the first method, these moments are applied at the column-superstructure joints and the SAP2000 program can be used to compute the moment demand in the superstructure members. The second method involves using the wFRAME program to perform a longitudinal push over analysis by specifying the required seismic moments in the columns as the plastic hinge capacities of the column ends which are moment-connected to the superstructure. The push over is continued until all the plastic hinges have been formed. In our case, we shall use this method to compute the distribution of seismic moments in the superstructure members. Note that CTBridge is a three-dimensional analysis program where force results are oriented in the direction of each member’s local axis. Since we will be using wFRAME, a two-dimensional frame analysis program, to determine the distribution of seismic forces to the superstructure, we need to make sure the dead load and secondary prestress moments lie in the same plane prior to using them in any calculations. This must be done especially when horizontal curves or skews are involved. Consequently for this prototype bridge, the top of bent support results from CTBridge will need to be transformed to a consistent planar coordinate system (i.e. the plane formed by the centerline of bridge and the vertical axis). To do so, the following coordinate transformation will be applied to the top of column moments from CTBridge:
When earthquake forces add to dead load and secondary prestress forces.
When earthquake forces counteract dead load and secondary prestress forces.
Collapse Limit State
+
+ + + =
= + -
SDC EXAMPLE # B (Bridge Design Academy Prototype Bridge) Page 35 of 148
DL ADL Sec. PS Bent Location Skew Mz My Mlong Mz My Mlong Mz My Mlong
It should be kept in mind that the above values are for both columns in each bent. As recommended in MTD 20-6, due to the uncertainty of the magnitude and distribution of secondary prestress moments and shears at the extreme seismic limit state, it is conservative to consider such effects only when their inclusion results in increased demands in the superstructure. Now these methodologies are applied to our bridge to calculate the extreme seismic forces in the superstructure corresponding to the Collapse Limit State of the bridge.
SDC EXAMPLE # B (Bridge Design Academy Prototype Bridge) Page 36 of 148
II.D.4.iii Determine Dead Load and Additional Dead Load Moments These dead load moments are readily available from the CTBridge output. Table 1.1 lists these moments at every 1/10th point of the span length and at the face of supports. These moments are assumed to be uniformly distributed along each girder. At Bent 2 Column moment at base, kipftM bottomcol
dl −= 0, (CTBridge Output) Column moment at deck soffit, ( ) ( ){ } kipftM jotopcol
dl −−=−+−= 355,1207148,1int@, Figure 6 Free Body Diagram Showing Equilibrium of Dead Loading at Bent 2
Deck Soffit
1355 ft-kip
30.8 kip
30.8 kip
Column
SDC EXAMPLE # B (Bridge Design Academy Prototype Bridge) Page 37 of 148
At Bent 3 Column moment at base, kipftM jotopcol
dl −= 0int@, (CTBridge Output) Column moment at deck soffit, ( ) ( ){ } kipftM jotopcol
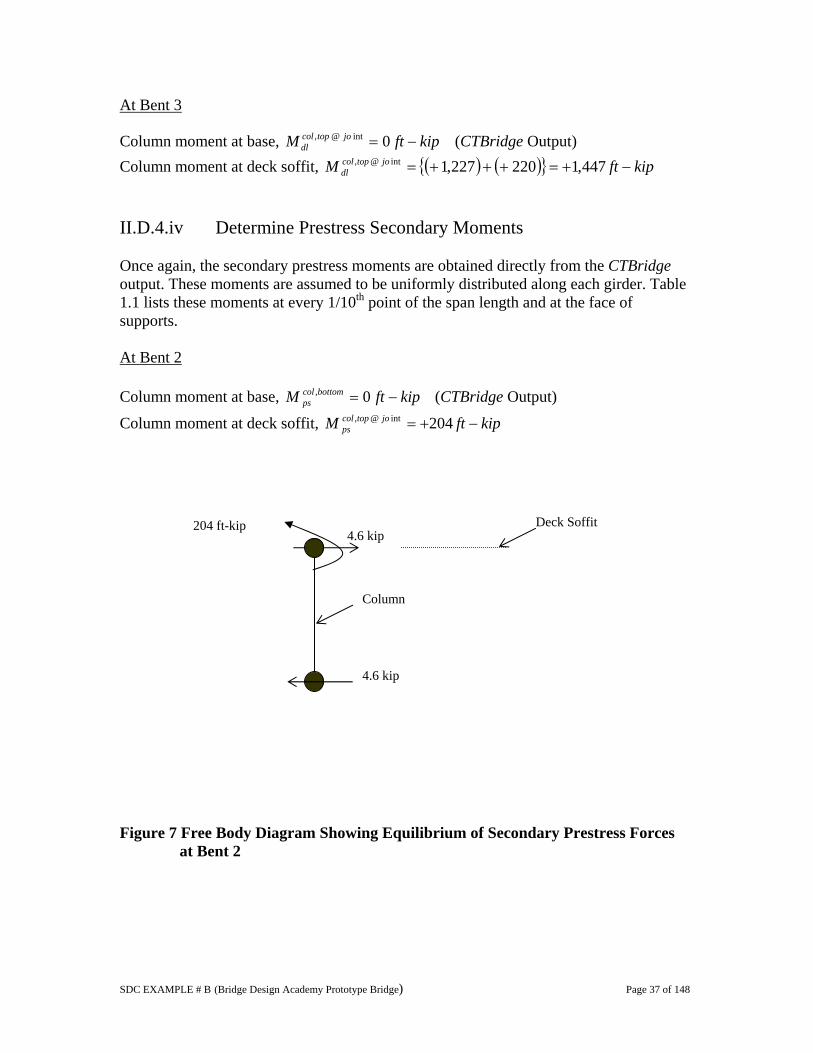
dl −+=+++= 447,1220227,1int@, II.D.4.iv Determine Prestress Secondary Moments Once again, the secondary prestress moments are obtained directly from the CTBridge output. These moments are assumed to be uniformly distributed along each girder. Table 1.1 lists these moments at every 1/10th point of the span length and at the face of supports. At Bent 2 Column moment at base, kipftM bottomcol
ps −= 0, (CTBridge Output)
Column moment at deck soffit, kipftM jotopcolps −+= 204int@,
Figure 7 Free Body Diagram Showing Equilibrium of Secondary Prestress Forces
at Bent 2
Deck Soffit 204 ft-kip 4.6 kip
4.6 kip
Column
SDC EXAMPLE # B (Bridge Design Academy Prototype Bridge) Page 38 of 148
At Bent 3 Column moment at base, kipftM bottomcol
ps −= 0, (CTBridge Output) Column Moment at deck soffit, kipftM jotopcol
ps −−= 218int@, II.D.4.v Determine Earthquake Moments II.4.D.v.a Determine the amount of seismic loading needed to ensure that
potential plastic hinges have formed in all the columns of the framing system
To form a plastic hinge in the column, the seismic load needs to produce a moment at the potential plastic hinge location of such a magnitude that, when combined with the “pre-loaded” dead load and prestress moments, the column will reach an overstrength plastic moment capacity, colM 0 .
soffitcoleq
soffitcolps
soffitcoldl
soffitcol MMMM @@@@0 ++=
It should be kept in mind that dead load moments will have positive or negative values depending upon the location along the span length. Also, the direction of seismic loading will determine the nature of the seismic moments. The column seismic load moments, col
eqM , are calculated from this equation based upon the principle of superposition as follows:
( )soffitcolps
soffitcoldl
soffitcolsoffitcoleq MMMM @@@
0@ +−=
In these equations, the overstrength column moment as given as
colp
colo MM ×= 2.1 SDC Equation (4.4)
Two cases of longitudinal earthquake loading are considered.
SDC EXAMPLE # B (Bridge Design Academy Prototype Bridge) Page 39 of 148
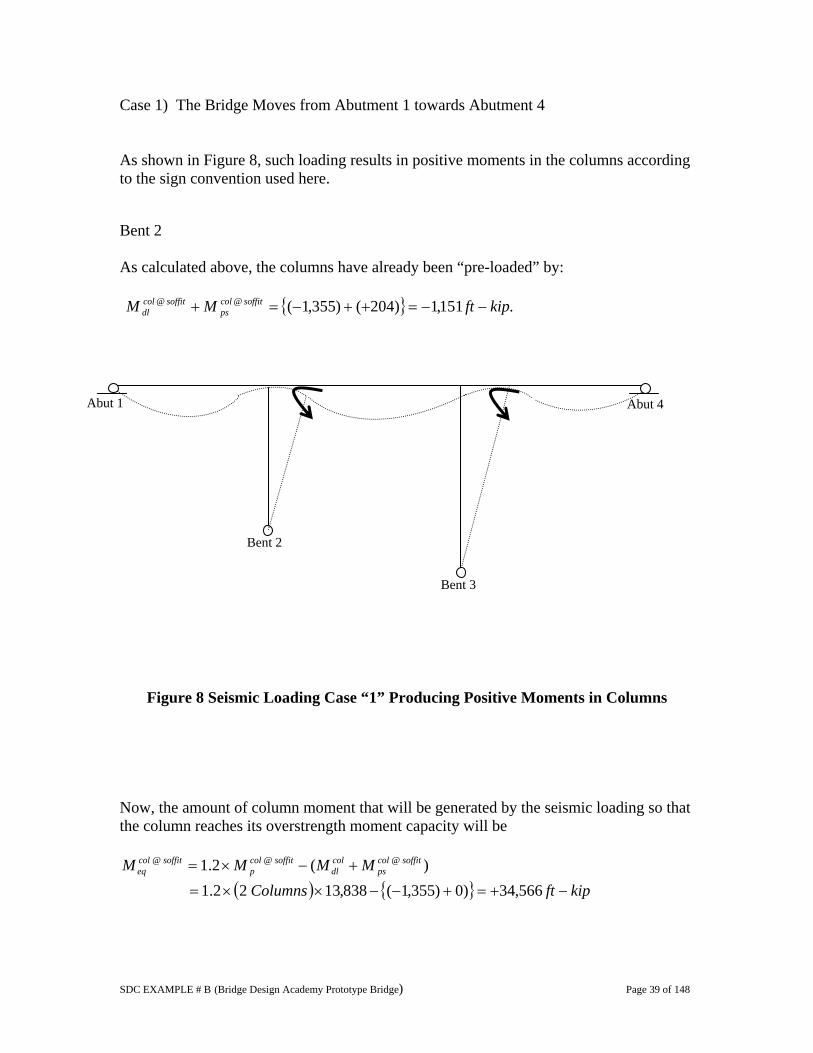
Case 1) The Bridge Moves from Abutment 1 towards Abutment 4 As shown in Figure 8, such loading results in positive moments in the columns according to the sign convention used here. Bent 2 As calculated above, the columns have already been “pre-loaded” by: { } .151,1)204()355,1(@@ kipftMM soffitcol
pssoffitcol
dl −−=++−=+
Figure 8 Seismic Loading Case “1” Producing Positive Moments in Columns Now, the amount of column moment that will be generated by the seismic loading so that the column reaches its overstrength moment capacity will be
SDC EXAMPLE # B (Bridge Design Academy Prototype Bridge) Page 40 of 148
It should be noted that the secondary prestress moment is neglected because doing so results in increased seismic demand on the column and hence in the superstructure. As recommended in MTD20-6 and discussed earlier, this practice is considered conservative because of the uncertainty associated with the magnitude and distribution of prestress secondary moments. Figure 9 schematically explains this superposition approach. col
eqV
coleqM
col
eqV
kipftMM col
Pcol −=×= 211,332.10
Figure 9 Superposition of Column Forces at Bent 2 for Loading Case “1” Bent 3 Following a similar approach, the amount of column moment that will be generated by the seismic loading so that the column reaches its overstrength moment capacity will be
SDC EXAMPLE # B (Bridge Design Academy Prototype Bridge) Page 41 of 148
It should be noted that in this case, the effect of secondary prestress moments is included because doing so results in increased seismic moment in the columns and hence in the superstructure. Case 2) The Bridge Moves from Abutment 4 toward Abutment 1 As shown in Figure 10, such loading results in negative moments in the columns according to our sign convention.
Figure 10 Seismic Loading Case “2” Producing Negative Moments in Columns
Following the same procedure as outlined earlier, the maximum column seismic moments at bents 2 and 3 are calculated to be
SDC EXAMPLE # B (Bridge Design Academy Prototype Bridge) Page 42 of 148
Please note the negative sign associated with the column overstrength moment capacity., indicating that the seismic loading being considered here produces negative column moments according to our sign convention. col
eqV col
eqM col
eqV
kipftMM colP
col −=×= 211,332.10 Figure 11 Superposition of Column Forces at Bent 2 for Loading Case “2” Figure 11 schematically shows the Free Body Diagram at Bent 2 for this seismic loading case. Now that we know the extreme seismic moments in columns, let us find distribution of these moments in the superstructure
Seismic State
1,355 ft-kip
Limit State
4.6 kip Deck Soffit
30.8 kip
204 ft-kip
4.6 kip
+ +
=
Column
Dead Load and Additional Dead Load State
Secondary Prestress State
755 kip
755 kip
30.8 kip
SDC EXAMPLE # B (Bridge Design Academy Prototype Bridge) Page 43 of 148
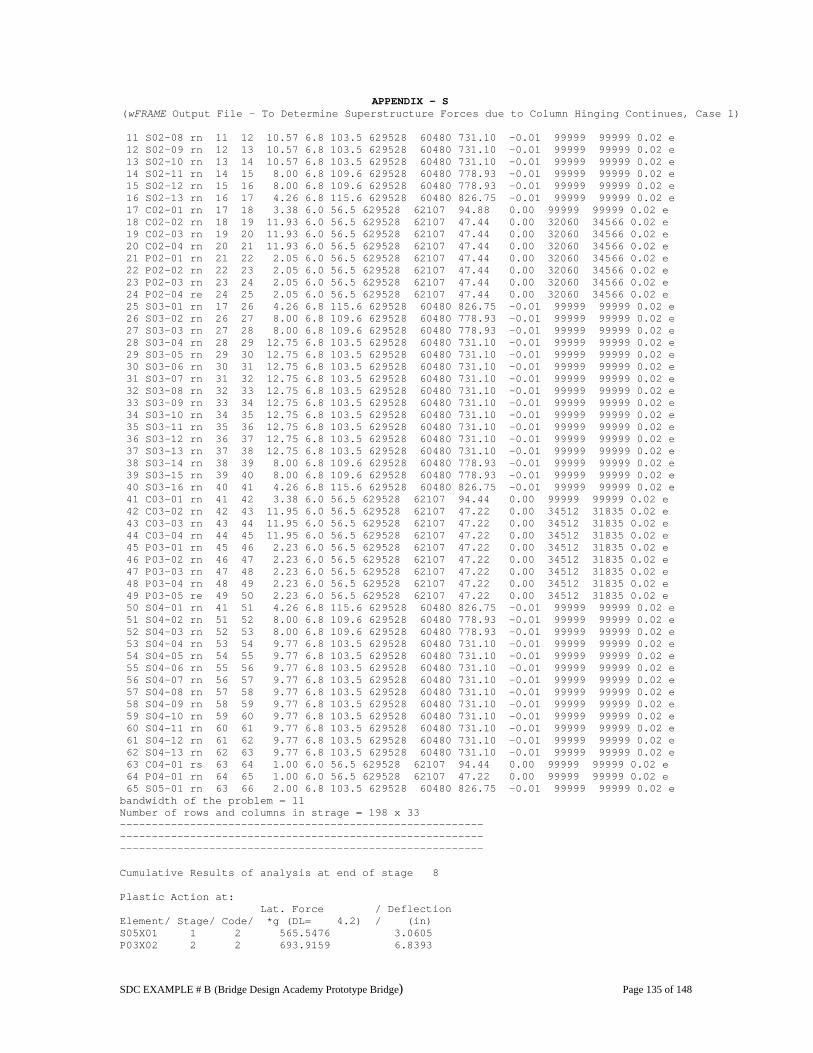
II.4.v.b Determine the earthquake moment in the superstructure The static non-linear “push-over” frame analysis program wFRAME will now be used to distribute the column earthquake moments and shears into the superstructure. The sign convention for positive moment and shear forces used in wFRAME is opposite to the one being used here. Appendix R shows the input file to the wFRAME program. Note that the superstructure dead load has been removed from the wFRAME model. As can be seen from this input file the positive column earthquake moments corresponding to “Case 1” loading are used as negative column moment capacities for “push-over” analysis while the negative column earthquake moments corresponding to “Case 2” are modeled as positive column moment capacities. Table 1.2 lists the distribution of earthquake moments in the superstructure as obtained from these “push-over” analyses. See Appendix S for Case 1 results in Table 1.2. II.D.4.vi Compute Moment and Shear Demand at Location of Interest The extreme seismic moment demand in the superstructure is now calculated as the summation of all the moments calculated in steps 3.1 through 3.3, taking into account the proper direction of bending in each case as well as the effective section width. The superstructure demand moments are defined as
Leq
Lps
Ldl
LD MMMM ++=
and Req
Rps
Rdl
RD MMMM ++=
at the left and right sides of the column, respectively. Dead load and prestress moment demands in the superstructure are proportioned based upon the number of girders falling within the effective section width. The earthquake moment imparted by column is also assumed to act within the same effective section width. Let us calculate superstructure moment demand at the face of the cap on each side of the column. Bent 2: At the left face of Bent Cap The effective section width, ftDDb sce 50.1975.6200.62 =×+=×+= Based upon the column location and the girder spacing, it can easily be concluded that the girder aligned along the centerline of the bridge lies outside the effective width. Therefore, at the face of bent cap, four girders are within the effective section.
SDC EXAMPLE # B (Bridge Design Academy Prototype Bridge) Page 44 of 148
The per girder values used below have been listed in Table 1.1. Case 1)
* The prestressing secondary effect is ignored as doing so results in a conservatively higher seismic demand in the superstructure. The superstructure moment demands around Bent 3 are calculated to be:
⎩⎨⎧
−−−−
=2Case002,31Case702,49
kipftkipft
M LD
SDC EXAMPLE # B (Bridge Design Academy Prototype Bridge) Page 45 of 148
and
⎩⎨⎧
−−−−
=2Case914,431Case431,9
kipftkipft
M RD
The seismic moment demands along the superstructure length have been summarized in the form of moment envelope values tabulated in Table 1.3 Now a similar procedure can be followed to calculate the seismic shear force demand in the superstructure. Once again the shear forces in the superstructure member due to dead load, additional dead load, and secondary prestress are readily available from the CTBridge output. Table 1.4 lists these values. The superstructure seismic shear forces due to seismic moments can be obtained directly from the wFRAME output or calculated by using the previously computed values of the superstructure seismic moments, R
eqLeq MandM , for each span. In our case, the values of
eqV for Span 1 are calculated to be: Case 1) Seismic Moment at Abutment 1, kipftM eq −= 0)1(
Seismic Moment at Bent 2, kipftM eq −−= 381,15)2(
Shear force in Span , ( )
1SpanofLength
)1()2(eqeq
eq
MMV
−= = ( ) kip122
1260381,15
−=−−
Case 2) Seismic Moment at Abutment 1, kipftM eq −= 0)1(
Seismic Moment at Bent 2, kipftM eq −= 523,13)2(
Shear force in Span , ( )
1SpanofLength
)1()2(eqeq
eq
MMV
−= = ( ) kip107
1260523,13
=−
Similarly, the seismic shear forces for the remaining spans are calculated to be:
Span 2, ⎩⎨⎧+−
=2Case2531Case253
kipkip
Veq
SDC EXAMPLE # B (Bridge Design Academy Prototype Bridge) Page 46 of 148
Span 3, ⎩⎨⎧+−
=2Case1331Case115
kipkip
Veq
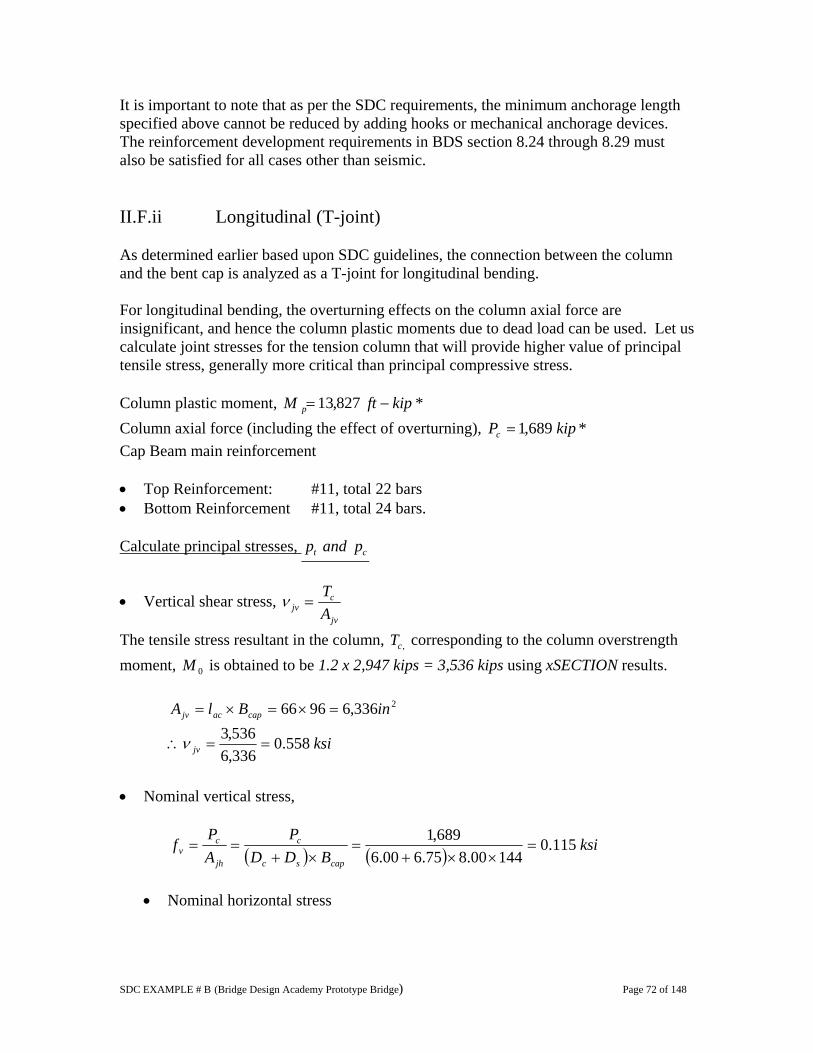
Table 1.5 lists these values. Once again, the extreme seismic shear force demand in the superstructure is now calculated as the summation of shear forces due to dead load, secondary prestress effects and the seismic loading, taking into account the proper direction of bending in each case and the effective section width. The superstructure demand shear forces are defined as R
eqR
psR
dlR
DL
eqL
psL
dlL
D VVVVVVVV ++=++= and at the left and right side of the column, respectively. Once again, the effect due to the secondary prestress will be considered only when doing so results in increased seismic demand. Table 1.6 lists the maximum shear demand summarized as a shear envelope. II.D.4.vii Superstructure Section Capacity Now that we have calculated the extreme moment and shear seismic demands, let us calculate the corresponding section capacity to make sure that the superstructure has sufficient capacity to resist the demands. II.D.4.vii.a Superstructure Flexure Capacity MTD 20-6 describes the philosophy behind the flexural section capacity calculations. The member strength and curvature capacities are assessed using a stress-stain compatibility analysis. Failure is reached when either the ultimate concrete, mild steel or prestressing ultimate strain is reached. Figure 12 shows such equilibrium:
Figure 12 Superstructure Capacity Provided by Internal Couple As stated in MTD20-6, the empirical relationships in AASHTO LRFD Section 5.7.3 do not accurately reflect prestress member strength or address the issue of bonded tendon ductility, and therefore, are not used in this example. The computer program PSSECx is used to calculate the section flexural capacity. The program has the option to use either a
MRne
V colo
Mcolo
Note: Axial forces not shown
ε’s
Cs
Cp/s Cc
N/A d’s
εs εc
εp/s εsa
εse
As Ap/s
ε’s C’Cc
N/A
ds
εp/s
εc
εs
εsa εse
dp/s
Ts Tp/s
A’s Stress Strain Strain Stress
φs
φs
d’c
MLne
dp/s
T’s
dc
c
c
SDC EXAMPLE # B (Bridge Design Academy Prototype Bridge) Page 47 of 148
“simple” model or “Mander’s unconfined” model to represent the unconfined concrete stress-strain relationship. The material properties used for 270ksi prestressing strands are given in SDC Section 3.2.4. According to MTD20-6, at locations where additional longitudinal mild steel is not required by analysis, as a minimum, an equivalent of #8 @12 (maximum spacing not to exceed 12”) should be placed in the top and bottom slabs at the bent cap. Such reinforcement will extend beyond the inflection points for the seismic moment demand envelope. For A706 reinforcing steel , the material properties are given in SDC Section 3.2.3. As specified in SDC Section 3.4, the expected nominal moment capacity, neM for capacity protected concrete components shall be determined by either φ−M or strength design. Also, expected material properties are to be used. Expected nominal moment capacity for these capacity-protected concrete members shall be based upon the expected concrete and steel strengths when either the concrete strain reaches its ultimate value based upon the stress-strain model or the reduced ultimate prestress steel strain, R
suε =0.03, as specified in SDC 3.2.4. Besides these material properties, the following additional information also needs to be supplied: Prestressing Steel • Eccentricity of Prestressing Steel - Obtained from the CTBridge output file. This
value is referenced from the CG of the section. • Prestressing Force - Obtained from the CTBridge output file under the
“P/S Response After Long Term Losses” tables. • Prestressing Steel Area, psA Calculated for 270ksi steel as
270)75.0( ×
= jackps
PA
Mild Steel • Amount of Top Slab Steel Known as per design including #8 @12 that is
put in a priori. • Location of Top Slab Steel Referenced from CG of section. Known from
section depth, assumed cover, etc. • Amount of Bottom Slab Steel Known as per design including #8 @12 that is
put in a priori. • Location of Bottom Slab Steel Referenced from CG of section. Known from
section depth, assumed cover, etc. Table 1.7 lists these data that will be used to calculate the flexural section capacity. The computer program PSSECx was run repeatedly to calculate superstructure flexural capacities at various points along the span length. Both negative (tension at the top) and positive (tension at the bottom) capacities were calculated at various sections along the length of the bridge. Table 1.8 lists these capacities and also compares them with the
SDC EXAMPLE # B (Bridge Design Academy Prototype Bridge) Page 48 of 148
maximum moment demands. As can be seen from these results, the superstructure has sufficient flexural capacity to meet the anticipated seismic demands. It is suggested that
0.1=flexureφ be used as we are dealing with extreme conditions corresponding to column overstrength. Appendix T lists the PSSECx input for the superstructure section that lies just left of Bent 2. The model is shown in Appendix U. The results for negative capacity calculations are shown in Appendix W. As stated earlier, the flexural capacity is determined when either the steel or concrete strain reaches its respective maximum value. In this case, the maximum allowable value of steel strain is reached before concrete reaches its maximum. The worst ratio D/C ratio of 0.63 suggests overdesign. If such case is found across a broad spectrum of various Caltrans bridges, perhaps the requirement of #8 @12 may be revised in the future. II.D.4.vii.b Superstructure Shear Capacity According to MTD 20-6, the superstructure shear capacity is calculated as per AASHTO LRFD. As shear failure is a brittle, nominal rather than expected material properties are used to calculate the shear capacity of the superstructure using 90.0=shearφ . Table 1.9 compares the seismic shear demands with the available section shear capacity.
SDC EXAMPLE # B (Bridge Design Academy Prototype Bridge) Page 49 of 148
* Area of mild steel based on minimum seismic requirement only (Remaining limit state requirements need to be satisfied; Ast,top = 56.6 in2 at right face of Bent 2)
Span
3
Table 1.7 Section Flexural Capacity Calculation Data
For Effective Section
Location
Span
1Sp
an 2
CG(+)
(--)Aps
Ast,top
Ast,bot
eps
yst,top
yst,bot
SDC EXAMPLE # B (Bridge Design Academy Prototype Bridge) Page 56 of 148
*Shear demand base on governing limit state requirement as determined by CTBridge
Table 1.9 Shear Demand Vs. Capacity
Location
Shear Capacity CheckSp
an 3
Span
1Sp
an 2
Shear DemandShear Capacity = Governing Shear
Demand*D/C Ratio
SDC EXAMPLE # B (Bridge Design Academy Prototype Bridge) Page 58 of 148
II.E Final Displacement Demand Assessment The displacement demands are calculated in transverse and longitudinal direction using push over analyses. No additional global analysis is required to estimate the demand for this bridge for this per SDC section 2.2.1 and 5.2.1.
SDC EXAMPLE # B (Bridge Design Academy Prototype Bridge) Page 59 of 148
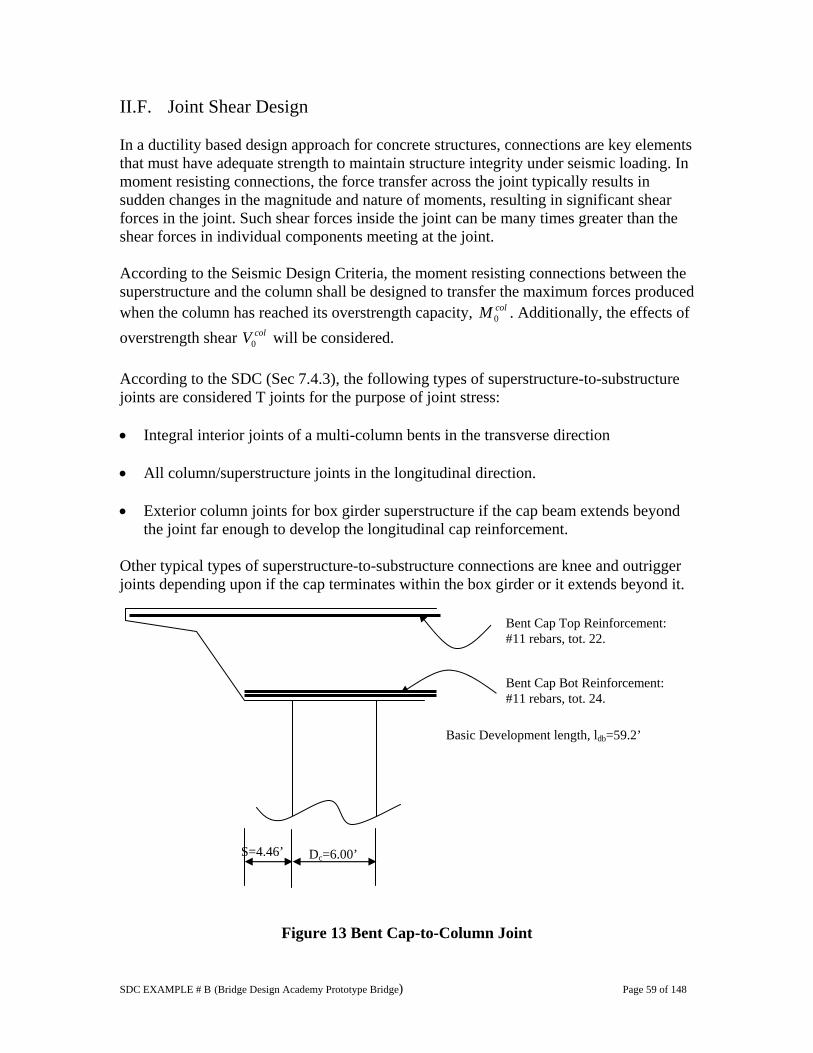
II.F. Joint Shear Design In a ductility based design approach for concrete structures, connections are key elements that must have adequate strength to maintain structure integrity under seismic loading. In moment resisting connections, the force transfer across the joint typically results in sudden changes in the magnitude and nature of moments, resulting in significant shear forces in the joint. Such shear forces inside the joint can be many times greater than the shear forces in individual components meeting at the joint. According to the Seismic Design Criteria, the moment resisting connections between the superstructure and the column shall be designed to transfer the maximum forces produced when the column has reached its overstrength capacity, colM 0 . Additionally, the effects of overstrength shear colV0 will be considered. According to the SDC (Sec 7.4.3), the following types of superstructure-to-substructure joints are considered T joints for the purpose of joint stress: • Integral interior joints of a multi-column bents in the transverse direction • All column/superstructure joints in the longitudinal direction. • Exterior column joints for box girder superstructure if the cap beam extends beyond
the joint far enough to develop the longitudinal cap reinforcement. Other typical types of superstructure-to-substructure connections are knee and outrigger joints depending upon if the cap terminates within the box girder or it extends beyond it.
Figure 13 Bent Cap-to-Column Joint
Bent Cap Bot Reinforcement: #11 rebars, tot. 24.
Dc=6.00’ S=4.46’
Bent Cap Top Reinforcement: #11 rebars, tot. 22.
Basic Development length, ldb=59.2’
SDC EXAMPLE # B (Bridge Design Academy Prototype Bridge) Page 60 of 148
Since the cap main reinforcement does not extend beyond the diameter of the column, Dc, the column to cap joint cannot be characterized as T-joint for transverse bending. Instead, it will be analyzed as knee-joint. II.F.1. Transverse Direction (Knee Joint) The procedure and guidelines used herein are based on SDC recommendations for T-joints along with additional recommendations from the SDC Joint Shear Work Team and the paper entitled, “Knee-Joint Shear Design Guidelines – DRAFT”. A knee joint is defined as any exterior column joint where the cap beam short stub length, S, is less than the diameter of the column, cD , or less than the development length of the main bent cap reinforcement, dl .
cDS < or dlS < In general, there are two cases that need to considered:
Case1: 2
cDS <
Case2: dcc lorDSD
<<2
In our case2
'00.6'42.4 >=S , therefore it is classified as Case 2 knee joint.
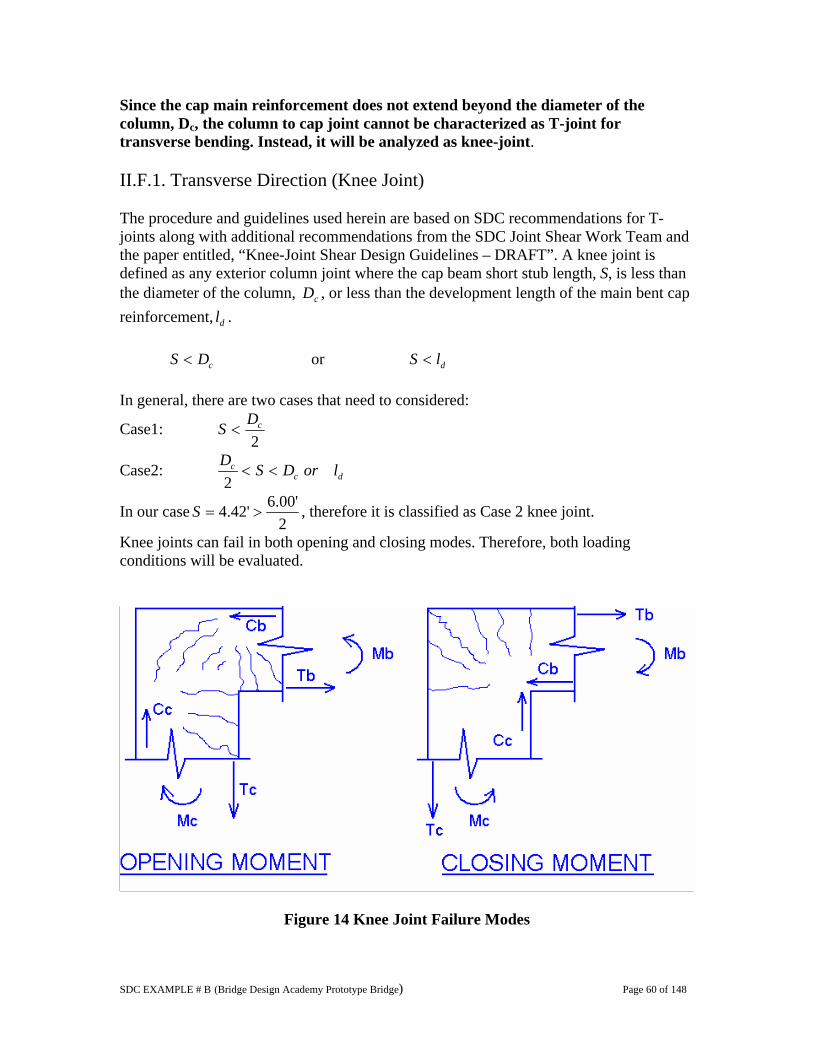
Knee joints can fail in both opening and closing modes. Therefore, both loading conditions will be evaluated.
Figure 14 Knee Joint Failure Modes
SDC EXAMPLE # B (Bridge Design Academy Prototype Bridge) Page 61 of 148
In the opening moment, a series of arch-shaped cracks tends to form between the compression zones at the outside of the column and top of the beam. The intersection of the arch strut and the flexural compression zones at the top of the beam create outward-acting resultant forces. If the beam bottom reinforcement is anchored only by straight bar extension, there is nothing to resist the horizontal resultant tensile force. It will cause vertical splitting, reducing competence of the anchorage of the outer column rebars and beam top rebars. Under the closing moment, a fan –shaped pattern of cracks develops, radiating from the outer surfaces of beam and column toward the inside. If there is no vertical reinforcement, clamping the beam top reinforcement into the joint, the entire beam tension, bT , is transferred to the back of the joint as there is no mechanism to resist the moment at the base of the wedge shaped concrete elements caused by tension transfer to the concrete by bond. Let us consider Bent 2 Knee Joint Closing Mode Failure. Given: Concrete compressive strength, psifc 000,4'= Superstructure depth, ftDs 75.6= Column diameter, ftDc 6= Column reinforcement:
• Main reinforcement: #14 bars, total 26 giving 250.58 inAst = . • Transverse reinforcement: #8 hoops at 5” c/c.
Concrete cover= in2 Column main reinforcement embedment length into the bent cap, inlac 66= Bent cap width, inBcap 96= Column plastic moment, kipftM p −= 964,14 * Column axial force (including the effect of overturning), kPc 474,2= * Cap Beam main reinforcement
• Top:#11 bars, total 22. • Bottom: #11 bars, total 24.
*These values are obtained from the xSECTION and wFRAME pushover analysis of Bent 2 and are listed on page 17.
SDC EXAMPLE # B (Bridge Design Academy Prototype Bridge) Page 62 of 148
Calculate principal stresses, ct pandp
• Vertical shear stress, jv
cjv A
T=ν
capacjv BlA ×= where =acl Anchorage of column rebars into the bent cap. =capB Bent Cap Width. The tensile stress resultant in the column, ,cT corresponding to the column overstrength moment, 0M is obtained to be 1.2 x 2862 kips = 3,434 kips using xSECTION results. See Appendix W.
2336,69666 inBlA capacjv =×=×=
ksijv 542.06336
434,3==∴ν
• Nominal vertical stress,
ksiB
DD
PAP
f
caps
c
c
jh
cv 168.0
144/00.8)275.62(00.6
1000/474,2
)2
2(=
×⎟⎠⎞
⎜⎝⎛ ×+
=×⎟⎠⎞
⎜⎝⎛ ×+
==
• Nominal horizontal stress
00.075.600.8
0=
×=
×=
scap
bh DB
Pf
Since no prestressing is specifically designed to provide horizontal joint
compression, it is assumed that 0=bP .
Now the principal stresses are calculated.
( ) ksipt 464.0542.02
168.000.02
168.000.0 22
−=+⎟⎠⎞
⎜⎝⎛ −
−+
=
The negative sign indicates that the joint is under nominal principal tensile stresses.
SDC EXAMPLE # B (Bridge Design Academy Prototype Bridge) Page 63 of 148
( ) ksipc 632.0542.02
168.000.02
168.000.0 22
=+⎟⎠⎞
⎜⎝⎛ −
++
=
Check the Joint Size Adequacy According to SDC (Section 7.4.2), all superstructure to column moment resisting joints shall be proportioned so that the principal stresses satisfy the following requirements: Principal compression, )('25.0 ksifp cc ×≤ SDC Equation (7.8) Principal tension, )('12 psifp ct ×≤ SDC Equation (7.9) In our case, Principal compression, ksiksipc 0.10.425.0632.0 =×≤= OK
Principal tension, ksiksipt 76.01000/400012464.0 =×<= OK Therefore, the bent cap-to-column joint satisfies the SDC joint proportioning requirements. Check the Need for Additional Joint Requirement According to the SDC, if the principal tensile stress, )('5.3 psifp ct ×≤ , no additional joint reinforcement is required. If no additional joint reinforcement is needed, then the volumetric ratio of transverse column reinforcement sρ continued into the cap shall not be less that
)('5.3
min, psif
f
yh
cs
×=ρ SDC Equation (7.18)
Since in our case ksiksipt 221.01000/40005.3464.0 =×>= , additional joint reinforcement will be necessary. Similar calculations can be performed for Bent 3. Let us now evaluate the same Bent 2 Knee Joint for the Opening Mode Failure. Given: From the wFRAME push-over analysis results, Column plastic moment, kipftM p −= 636,12 *
SDC EXAMPLE # B (Bridge Design Academy Prototype Bridge) Page 64 of 148
Column axial force (including the effect of overturning), kipPc 907= * Cap Beam main reinforcement
• Top:#11 bars, total 22. • Bottom: #11 bars, total 24.
Calculate principal stresses, ct pandp
• Vertical shear stress, jv
cjv A
T=ν
The tensile stress resultant in the column, ,cT corresponding to the column overstrength moment, 0M is obtained to be 1.2 x 3,148 kips = 3,778 kips using xSECTION results.
263369666 inAjv =×=
ksijv 596.0336,6778,3
==∴ν
• Nominal vertical stress,
ksiB
DD
PAP
f
caps
c
c
jh
cv 062.0
14400.8)275.62(00.6
907
)2
2(=
××⎟⎠⎞
⎜⎝⎛ ×+
=×⎟⎠
⎞⎜⎝
⎛ ×+==
• Nominal horizontal stress
00.075.600.8
0=
×=
×=
scap
bh DB
Pf
Since no prestressing is specifically designed to provide horizontal joint
compression, we can assume that 0=bP . Now the principal stresses are calculated substituting these data.
( ) ksipt 566.0596.02
062.000.02
062.000.0 22
−=+⎟⎠⎞
⎜⎝⎛ −
−+
=
The negative sign indicates that the joint is under nominal principal tensile stresses.
SDC EXAMPLE # B (Bridge Design Academy Prototype Bridge) Page 65 of 148
( ) ksipc 628.0596.02
062.000.02
062.000.0 22
=+⎟⎠⎞
⎜⎝⎛ −
++
=
Check the Joint Size Adequacy Principal compression, ksiMPapc 0.10.425.0628.0 =×≤= OK
Principal tension, ksiksipt 760.01000/400012566.0 =×<= OK Therefore, the bent cap-to-column joint satisfies the SDC joint proportioning requirements. Check the Need for Additional Joint Reinforcement According to the SDC, if the principal tensile stress, )('5.3 psifp ct ×≤ , no additional joint reinforcement is required. If no additional joint reinforcement is needed, then the volumetric ratio of transverse column reinforcement sρ continued into the cap shall not be less that
)('5.3
min, psif
f
yh
cs
×=ρ SDC Equation (7.18)
Since in our case ksiksipt 221.01000/40005.3566.0 =×>= , additional joint reinforcement will be necessary. Therefore, based upon joint stress condition evaluation for both closing and opening modes of failure, the joint needs additional joint reinforcement. Now refer to Figure 15. Joint Shear Requirement a.0) Continuous U-Bars (Refer to Figures 16 and 20) The top and bottom main bent cap reinforcement shall be in the form of continuous U-bars. The minimum area of this type of reinforcement shall be 33% of the area of the main column reinforcement anchored into the bent cap. The splices in U-bars shall not be allowed within a distance dl beyond the interior face of the column.
SDC EXAMPLE # B (Bridge Design Academy Prototype Bridge) Page 66 of 148
Figure 15 Regions of Additional Joint Shear Reinforcement
23.195.5833.033.0 inAA strequiredBarU
s =×=×=− The bent cap reinforcement based upon service and seismic loading consists of: Top Reinforcement #11, total 22 bars giving 232.34 inAst = Bottom Reinforcement #11, total 24 bars giving 244.37 inAst = 22 3.1972.1856.112 ininA provided
BarUs ≈=×=− OK
See Figure 16 for rebar layout.
SDC EXAMPLE # B (Bridge Design Academy Prototype Bridge) Page 67 of 148
Figure 16 Location of Joint Shear Reinforcement (Elevation View) a.1) Vertical Stirrups in Joint Region Vertical stirrups or ties shall be placed transversally within region 3 as shown in Figure 15.
st
jvs AA ×= 2.0 SDC Equation (7.19)
where =stA Total area of column main reinforcement anchored in the joint. In our case, the whole column main reinforcement i.e. #14, total 26, is anchored into the joint.
27.115.5820.0 inA requiredjv
s =×=
Provide 5 sets of 6-legged ,#6 stirrups so that
providedjv
sA = 22 7.112.13)44.0)(5)(6( ininsetslegs >= OK
These vertical stirrups and ties are placed transversely within a distance 2
cD extending
from the face of the column. The maximum stirrup spacing is:
SDC EXAMPLE # B (Bridge Design Academy Prototype Bridge) Page 68 of 148
⎩⎨⎧ ==
=in
indofLessers
24372/742/
max BDS 8.19.3
where d =distance of extreme compression fiber from the centroid of the tensile reinforcement. The d = 74in value was calculated during the bent cap design. As shown in Figures 16 and 17, place 5 sets at 8 in c/c in region 3. These vertical stirrups are shown in Figure 16 and also as dots in Figure 17.
Figure 17 Location of Vertical Stirrups (Elevation View) b) Horizontal Stirrups in Joint Region Horizontal stirrups or ties shall be placed transversely around the vertical stirrups or ties in two or more intermediate layers vertically at not more than 18 in.
strequiredjh
s AA ×= 1.0 SDC Equation (7.20)
285.55.581.0 inA requiredjh
s =×= As shown in Figure 18, provide 3 legged #6 total 14 sets so that
providedjh
sA = 22 85.548.18)44.0)(14)(3( ininsetslegs >=
SDC EXAMPLE # B (Bridge Design Academy Prototype Bridge) Page 69 of 148
This horizontal reinforcement shall be placed within a distance cD extending from either side of the column centerline as shown in Figure 16. These stirrups are in Figure 18.
Figure 18 Joint Reinforcement Within the Column Region
c) Horizontal Side Reinforcement According to the SDC (Section 7.4.4.3), the total longitudinal side face reinforcement in the bent cap shall be equal to the greater of the area specified by
⎪⎩
⎪⎨
⎧
×
×≥
botcap
topcap
sfs
Aor
AA
1.0
1.0 where =capA Area of bent cap top or bottom flexural steel.
This side reinforcement shall be continuous around the joint end and placed near the side faces of the bent cap with a maximum spacing of 12 in. As shown in Figures 18 and 19, such horizontal reinforcement shall be in the form of continuous over the end face of the knee-joint. Splices in these continuous bars shall be located at least distance dl beyond the interior face of the column.
232.34 inAtopcap =
244.37 inAbotcap =
SDC EXAMPLE # B (Bridge Design Academy Prototype Bridge) Page 70 of 148
⎪⎩
⎪⎨
⎧
=×
=×≥
2
2
74.344.371.0
43.332.341.0
inor
inAsf
s
As shown in Figures 18 and 19, provide #6, 5 continuous giving
providedsfsA = 22 74.34.444.0)10( ininbars >=× .
Figure 19 Joint Reinforcement Outside the Column Region d) J-Dowels According to the SDC Sec. 7.4.4.3, for bents skewed greater than 020 , J-dowels hooked around the longitudinal top deck steel extending alternatively 24 in and 30 in into the bent cap are required. This helps to prevent any potential delamination of concrete around deck top reinforcement. Although strictly following SDC guidelines, there is no need for J-Dowels for this bridge. Let us provide it anyway.
268.45.5808.008.0 inAA stbarj
s =×=×=− Use 16, #5 J-Dowels.
providedbarj
sA − = .68.496.431.0)16( 22 ininbars >=× The J-Dowels will be uniformly placed within a rectangular region defined by the width of the bent cap and the distance cD on either side of the centerline of the column. These dowels are shown in Figures 18 and 19.
SDC EXAMPLE # B (Bridge Design Academy Prototype Bridge) Page 71 of 148
e) Transverse Reinforcement According to the recommendations made by the Work Team on Joint Shear, the transverse reinforcement in the joint region shall consist of hoops with a minimum reinforcement ratio specified as
24.0ac
sts l
A×=ρ SDC Equation (7.23),
=stA Area of longitudinal column reinforcement
=acl = Anchorage length. This requirement results in about 50% more steel than a similar case of T-joint. The Work Team felt that given the vulnerability of knee joints, such excessive transverse steel is justified.
0054.066
5.584.0 2 =×=requiredsρ
Column transverse reinforcement that extends into the joint region consists of #8 hoops at 5 in spacing.
( )0054.00094.0
5213.122272
79.04'
4, >=
×⎟⎠⎞
⎜⎝⎛ ×−×−
×=
××
=sD
Abprovidedsρ
e) Anchorage for Main Column Reinforcement According to the SDC, the main column reinforcement shall extend into the cap as deeply as possible in order to fully develop the compression strut mechanism in the joint. If the joint shear reinforcement prescribed in SDC Section 7.4.4.2, and the minimum bar spacing requirements in the Bridge Design Specifications 8.21 are met, then the anchorage for longitudinal column bars developed into the cap beam for seismic loads shall not be less than the length specified as
blrequiredac dl 24, = SDC Equation (8.1)
inl requiredac 6.4069.124, =×=
ininl providedac 6.4066, >= OK
SDC EXAMPLE # B (Bridge Design Academy Prototype Bridge) Page 72 of 148
It is important to note that as per the SDC requirements, the minimum anchorage length specified above cannot be reduced by adding hooks or mechanical anchorage devices. The reinforcement development requirements in BDS section 8.24 through 8.29 must also be satisfied for all cases other than seismic. II.F.ii Longitudinal (T-joint) As determined earlier based upon SDC guidelines, the connection between the column and the bent cap is analyzed as a T-joint for longitudinal bending. For longitudinal bending, the overturning effects on the column axial force are insignificant, and hence the column plastic moments due to dead load can be used. Let us calculate joint stresses for the tension column that will provide higher value of principal tensile stress, generally more critical than principal compressive stress. Column plastic moment, kipftM p −= 827,13 * Column axial force (including the effect of overturning), kipPc 689,1= * Cap Beam main reinforcement • Top Reinforcement: #11, total 22 bars • Bottom Reinforcement #11, total 24 bars. Calculate principal stresses, ct pandp
• Vertical shear stress, jv
cjv A
T=ν
The tensile stress resultant in the column, ,cT corresponding to the column overstrength moment, 0M is obtained to be 1.2 x 2,947 kips = 3,536 kips using xSECTION results.
2336,69666 inBlA capacjv =×=×=
ksijv 558.0336,6536,3
==∴ν
• Nominal vertical stress,
( ) ( ) ksiBDD
PAP
fcapsc
c
jh
cv 115.0
14400.875.600.6689,1
=××+
=×+
==
• Nominal horizontal stress
SDC EXAMPLE # B (Bridge Design Academy Prototype Bridge) Page 73 of 148
Since no prestressing is specifically designed to provide horizontal joint compression, it is assumed that that 0=bP .
00.075.600.8
0=
×=
×=
scap
bh DB
Pf
Now the principal stresses are calculated substituting these data.
( ) ksipt 503.0558.02
115.000.02
115.000.0 22
−=+⎟⎠⎞
⎜⎝⎛ −
−+
=
The negative sign indicates that the joint is under nominal principal tensile stresses.
( ) ksipc 676.0558.02
115.000.02
115.000.0 22
=+⎟⎠⎞
⎜⎝⎛ −
++
=
Check the Joint Size Adequacy Principal compression, ksiksipc 0.10.425.0676.0 =×≤= OK
Principal tension, ksiksipt 760.01000/400012503.0 =×<= OK Therefore, the bent cap-to-column joint satisfies the SDC joint proportioning requirements. Check the Need for Additional Joint Requirement According to the SDC 7.4.4.2, if the principal tensile stress, )('5.3 psifp ct ×≤ , no additional joint reinforcement is required. If no additional joint reinforcement is needed, then the volumetric ratio of transverse column reinforcement sρ continued into the cap shall not be less that
)('5.3
min, psif
f
yh
cs
×=ρ SDC Equation (7.18)
Since in our case ksiksipt 221.01000/40005.3503.0 =×>= , additional joint reinforcement will be necessary. The horizontal stirrups, cap beam u-bar requirements, continuous cap side face reinforcement, j-dowels, and column reinforcement anchorage provided for the transverse bending will also satisfy the joint shear requirements for the longitudinal bending. The only additional joint reinforcement requirement that needs to be satisfied for the longitudinal bending is to provide vertical stirrups in Regions 1 and 2 of Figure
SDC EXAMPLE # B (Bridge Design Academy Prototype Bridge) Page 74 of 148
15. Additionally, different requirement for transverse reinforcement in the joint will be checked. a) Vertical Stirrups in Joint Region – Regions 1 and 2 of Figure 15
st
jvs AA ×= 2.0 SDC Equation (7.19)
where =stA Total area of column main reinforcement anchored in the joint. In our case, all the column main reinforcement i.e. #14, total 26 bars are anchored into the bent cap.
27.115.582.0 inA providedjv
s =×=∴ Provide total 14 sets of 2 legged #6 stirrups or ties on each side of the column.
jvsA provided = 22 7.1132.12)44.0)(14)(2( ininsetslegs >= OK
As shown in Figures 16 and 17, these vertical stirrups and ties are placed transversely within a distance cD extending from either side of the column centerline. The maximum stirrup spacing is:
⎩⎨⎧ ==
=in
indofLessers
24372/742/
max BDS 8.19.3
Note that in the overlapping portions of regions 1 and 2 with region 3, the outside two legs of the 6-legged vertical stirrups provided for transverse bending are also counted towards two legs of the vertical stirrups required for the longitudinal bending. Transverse Reinforcement According to the SDC, the transverse reinforcement in a T-joint joint region shall consist of hoops with a minimum reinforcement ratio specified as:
)(4.0 2 inlA
ac
strequireds ×=ρ SDC Equation (7.23)
Also, all vertical bars shall be extended to within 12 in from the deck top, so
0054.066
5.584.0 2 =×=sρ
As calculated above for transverse bending 0054.00094.0, >=providedsρ OK
SDC EXAMPLE # B (Bridge Design Academy Prototype Bridge) Page 75 of 148
II.G Torsional Capacity Check The torsional effects in the bent cap beam under the longitudinal bending are well resisted by this integral bent cap that is clamped by the box girder superstructure on each side. If the superstructure remains elastic under the longitudinal bending (It will be assured that such is the case by making sure that the superstructure satisfies MTD 20-6 requirements – to be done in a subsequent section), it is difficult to expect torsional distress of cap beams, as the torsional rotations of the bent cap would require significant distortions and warping of the superstructure. Such rotations will be resisted by in-plane membrane forces in the deck and soffit slab. Additionally, there is no history of any damage to bent caps from previous earthquakes for integral bent caps. For these reasons, the torsional capacity of the cap beam is assumed to be adequate and not checked.
SDC EXAMPLE # B (Bridge Design Academy Prototype Bridge) Page 76 of 148
II.H. Abutment Seat Width Design The bridge is supported on seat type abutment. It is CalTrans design philosophy to provide adequate seat width so that the superstructure does not fall-off during the anticipated seismic shaking. As per SDC (7.8.3), sufficient seat width shall be available to accommodate the anticipated thermal movement, prestress shortening, creep, shrinkage, and the relative longitudinal earthquake displacement.
4/ +Δ+Δ+Δ+Δ≥ + eqtempshcrspAN (in) Where
=AN Abutment seat width normal to the centerline of the bearing. =Δ sp / Pre-stress-shortening =Δ + shcr Creep and shrinkage
=Δeq The largest relative earthquake displacement between the superstructure and the abutment. Such demand can be estimated either by global or stand-alone analysis. The minimum seat width calculated above is normal to the centerline of bearing and in no case shall be less than 30 in.
ininN providedA 3036, >= OK
Figure 21 Minimum Abutment Seat Width The combined effect of tempshcrsp ΔΔΔ + ,,/ is calculated using JOINT MOVEMENT CALCULATIONS form placed in Appendix O to be 2.5 in.
Δ eqΔ p/s + Δ cr+sh + Δ temp
N A
C Brg. L
Minimum Seat Width, Na=30 in
SDC EXAMPLE # B (Bridge Design Academy Prototype Bridge) Page 77 of 148
The maximum seismic demand along the longitudinal direction of the bridge is calculated in a conservative way assuming that maximum longitudinal and transverse (along the bent line) displacement occur simultaneously so that
inallongitudin 3.20)20sin(25.1511.15 0 =×+=Δ
incenterlinebearingtonormal 19)20cos(3.20 0 =×=Δ
.304.254)20cos(5.219 0 ininrequiredA <=+×+=Δ
II.I. No Splice Zone
Memo-to-Designers 20-9 deals with the issue of splices in bar reinforcing steel. In general any rebar longer than the standard 18m will need to be spliced. The type of splice depends upon whether the component is deemed as “seismic-critical” or not. As defined in MTD 20-9, seismic critical member elements are expected to undergo significant post-elastic deformations during a seismic event. For prototype bridge, only columns have been designated as “seismic critical” elements. In our case, maximum length of column rebar can be estimated as Lmax= 44.00 + 5.5 = 49.5 ft < 60.00 ft
Therefore, we will specify on the plans that no splices will be permitted for column main rebars. The superstructure rebars, however, will need be spliced. As per MTD20-6, “Service Splice” will be used to splice such rebars. It is good design practice, however, to also specify no splice zone up to the point of contraflexure, determined as per guidelines in MTD 20-6.
SDC EXAMPLE # B (Bridge Design Academy Prototype Bridge) Page 78 of 148
APPENDIX - A (Selective Portions of CTBRIDGE Input)
Input Summary
Cross Section Shape Information Box Girder 1 data Shape: Box Girder Overall Width: 706.00 in Top Slab Thickness: 9.13 in Overall Depth: 81.00 inBottom Slab Thickness: 8.25 in Left Overhang Width: 60.00 in Right Overhang Width: 60.00 in Left Overhang Inside Thickness: 12.00 in Right Overhang Inside Thickness: 12.00 in Left Overhang Outside Thickness: 8.00 in Right Overhang Outside Thickness: 8.00 in Left Exterior Web Offset: 34.50 in Right Exterior Web Offset: 34.50 in Left Exterior Web Thickness: 12.00 in Right Exterior Web Thickness: 12.00 in Top Fillet Width: 4.00 in Top Fillet Depth: 4.00 in Bottom Fillet Width: 0.00 in Bottom Fillet Depth: 0.00 in Web Spacing Type: Symmetrical Number of Interior Webs: 3 Interior Web Thickness: 12.00 in Interior Web Distance: 144.00 in Interior Web 1 Thickness: 12.00 in Interior Web 1 Distance: 114.50 in Interior Web 2 Thickness: 12.00 in Interior Web 2 Distance: 144.00 in Interior Web 3 Thickness: 12.00 in Interior Web 3 Distance: 144.00 in Box Girder 1 properties Gross Factor Cracked CG to Top 35.24 in Area: 14902.38 in² X 1.000 14902.38 in² CG to Bottom 45.76 in Ixx: 15160037.03 in4 X 1.000 15160037.03 in4 CG to Left 353.00 in Iyy: 533747046.76 in4 X 1.000 533747046.76 in4 CG to Right 353.00 in Torsion: 45022802.56 in4 X 1.000 45022802.56 in4 Box Girder 2 data Shape: Box Girder Overall Width: 706.00 in Top Slab Thickness: 9.13 in Overall Depth: 81.00 in Bottom Slab Thickness: 12.00 in Left Overhang Width: 60.00 in Right Overhang Width: 60.00 in Left Overhang Inside Thickness: 12.00 in Right Overhang Inside Thickness: 12.00 in Left Overhang Outside Thickness: 8.00 in Right Overhang Outside Thickness: 8.00 in Left Exterior Web Offset: 34.50 in Right Exterior Web Offset: 34.50 in Left Exterior Web Thickness: 12.00 in Right Exterior Web Thickness: 12.00 in Top Fillet Width: 4.00 in Top Fillet Depth: 4.00 in Bottom Fillet Width: 0.00 in Bottom Fillet Depth: 0.00 in Web Spacing Type: Symmetrical Number of Interior Webs: 3 Interior Web Thickness: 12.00 in Interior Web Distance: 144.00 in Interior Web 1 Thickness: 12.00 in Interior Web 1 Distance: 114.50 in Interior Web 2 Thickness: 12.00 in Interior Web 2 Distance: 144.00 in Interior Web 3 Thickness: 12.00 in Interior Web 3 Distance: 144.00 in Box Girder 2 properties Gross Factor Cracked CG to Top 38.97 in Area: 16646.17 in² X 1.000 16646.17 in² CG to Bottom 42.03 in Ixx: 17143559.87 in4 X 1.000 17143559.87 in4 CG to Left 353.00 in Iyy: 571091004.60 in4 X 1.000 571091004.60 in4 CG to Right 353.00 in Torsion: 50040498.04 in4 X 1.000 50040498.04 in4 Circle 1 data Shape: Circle Diameter: 72.00 in Circle 1 properties Gross Factor Cracked CG to Top 36.00 in Area: 4071.50 in² X 1.000 4071.50 in² CG to Bottom 36.00 in Ixx: 1319167.32 in4 X 1.000 1319167.32 in4 CG to Left 36.00 in Iyy: 1319167.32 in4 X 1.000 1319167.32 in4 CG to Right 36.00 in Torsion: 2638334.64 in4 X 1.000 2638334.64 in4
SDC EXAMPLE # B (Bridge Design Academy Prototype Bridge) Page 79 of 148
APPENDIX - A (Selective Portions of CTBRIDGE Input) - Continues
Span Information Span 1 data Effective Dimensions Begin: 1.50 ft Length: 126.00 ft End: 3.00 ft Model As Link: Yes Num Distance Section Num Distance Section 1 Begin Box Girder 1 3 121.78 ft Box Girder 2 2 105.78 ft Box Girder 1 4 End Box Girder 2 Num Distance Material Num Distance Material 1 Begin Concrete 1 2 End Concrete 1 Placement of Results Evenly spaced: 10 Placement of Nodes Evenly spaced: 4 Span 2 data Effective Dimensions Begin: 3.00 ft Length: 168.00 ft End: 3.00 ft Model As Link: Yes Num Distance Section Num Distance Section 1 Begin Box Girder 2 4 147.78 ft Box Girder 1 2 4.22 ft Box Girder 2 5 163.78 ft Box Girder 2 3 20.22 ft Box Girder 1 6 End Box Girder 2 Num Distance Material Num Distance Material 1 Begin Concrete 1 2 End Concrete 1 Placement of Results Evenly spaced: 10 Placement of Nodes Evenly spaced: 4
SDC EXAMPLE # B (Bridge Design Academy Prototype Bridge) Page 80 of 148
APPENDIX - A (Selective Portions of CTBRIDGE Input) - Continues
Span 3 data Effective Dimensions Begin: 3.00 ft Length: 118.00 ft End: 1.50 ft Model As Link: Yes Num Distance Section Num Distance Section 1 Begin Box Girder 2 3 20.22 ft Box Girder 1 2 4.26 ft Box Girder 2 4 End Box Girder 1 Num Distance Material Num Distance Material 1 Begin Concrete 1 2 End Concrete 1 Placement of Results Evenly spaced: 10 Placement of Nodes Evenly spaced: 4
Column Type Information Column Type 1 data Datum: Bottom Num Distance Section Num Distance Section 1 Bottom Circle 1 2 Top Circle 1 Num Distance Material Num Distance Material 1 Bottom Concrete 1 2 Top Concrete 1 Placement of Results Evenly spaced: 4 Placement of Nodes Evenly spaced: 4
Bent Information Bent 2 data Skew Angle: 20.0000 ° Continuous Connection Condition: Fix Bent 2, Column 1 Dist in Bent -17.00 ft Rotation: 0.0000 ° Column Type: Column Type 1 Column top placed at bent bottom Top Elev: 82.02 ft Bot Elev: 38.02 ft Height defined by column length Length: 44.00 ft Bottom Condition: Pin Bent 2, Column 2 Dist in Bent 17.00 ft Rotation: 0.0000 ° Column Type: Column Type 1 Column top placed at bent bottom Top Elev: 82.02 ft Bot Elev: 38.02 ft Height defined by column length Length: 44.00 ft Bottom Condition: Pin
SDC EXAMPLE # B (Bridge Design Academy Prototype Bridge) Page 81 of 148
APPENDIX - A (Selective Portions of CTBRIDGE Input) - Continues
Bent 3 data Skew Angle: 20.0000 ° Continuous Connection Condition: Fix Bent 3, Column 1 Dist in Bent -17.00 ft Rotation: 0.0000 ° Column Type: Column Type 1 Column top placed at bent bottom Top Elev: 84.70 ft Bot Elev: 37.70 ft Height defined by column length Length: 47.00 ft Bottom Condition: Pin Bent 3, Column 2 Dist in Bent 17.00 ft Rotation: 0.0000 ° Column Type: Column Type 1 Column top placed at bent bottom Top Elev: 84.70 ft Bot Elev: 37.70 ft Height defined by column length Length: 47.00 ft Bottom Condition: Pin
Support Information Abut 1 data Skew Type: Skew Angle: 20.0000 ° Connection to Span(s): Continuous Spans Connection Type: Roller Abut 4 data Skew Type: Skew Angle: 20.0000 ° Connection to Span(s): Continuous Spans Connection Type: Roller Dead Load Dead load is active Self weight is applied
Added Dead Load Additional dead load is active Wearing surface is applied Wearing Surface: 35.00 psf Deck Width: 56.00 ft Load Start End Start End Load Applied Name Magnitude Magnitude Distance Distance Load Type Direction To Type 732 Barrier ... 0.82 kip/ft 0.82 kip/ft 0.000 ratio 1.000 ratio Distributed Force Gravity Span 1 Span 2 Span 3
SDC EXAMPLE # B (Bridge Design Academy Prototype Bridge) Page 82 of 148
APPENDIX - B (Selective Portions of CTBRIDGE Output )
Dead Load - Unfactored Bent Reactions Bent Location AX VY VZ TX MY MZ kip kip kip kip·ft kip·ft kip·ft Bent 2 Col Bots -2894.0 27.0 2.1 0.0 0.0 -0.0 Bent 2 Col Tops -2520.8 27.0 2.1 0.0 90.7 -1189.0 Bent 3 Col Bots -2830.9 -27.8 -0.0 0.0 -0.0 0.0 Bent 3 Col Tops -2432.2 -27.8 -0.0 0.0 -0.8 1305.1
SDC EXAMPLE # B (Bridge Design Academy Prototype Bridge) Page 83 of 148
APPENDIX - B (Selective Portions of CTBRIDGE Output) - Continues
Additional Dead Load - Unfactored Forces - Columns
Additional Dead Load - Unfactored Bent Reactions Bent Location AX VY VZ TX MY MZ kip kip kip kip·ft kip·ft kip·ft Bent 2 Col Bots -461.9 4.8 0.4 0.0 0.0 -0.0 Bent 2 Col Tops -461.9 4.8 0.4 0.0 17.3 -213.4 Bent 3 Col Bots -446.2 -5.0 -0.0 0.0 -0.0 0.0 Bent 3 Col Tops -446.2 -5.0 -0.0 0.0 -1.1 234.2
SDC EXAMPLE # B (Bridge Design Academy Prototype Bridge) Page 84 of 148
APPENDIX – C (Input file for xSECTION)
xSECTION VER._2.40,_MAR-14-99 LICENSE (choices: LIMITED/UNLIMITED) UNLIMITED ENTITY (choices: GOVERNMENT/CONSULTANT) Government NAME_OF_FIRM Caltrans BRIDGE_NAME EXAMPLE BRIDGE BRIDGE_NUMBER 99-9999 JOB_TITLE PROTYPE BRIDGE - BRIDGE DESIGN ACADEMY *********************************************************** * 6' Dia. Column * * * * 4/17/06 * *********************************************************** Subsection definition is supported by coordinates bending parallel to x-axis (horiz.) local x- and y- axes parallel to global X- and YUnits are Kips and inches ************************************************************** * Welded hoops or seismic hooks are required for confinement * * to be effective. * ************************************************************** CONC_TYPES_START NUMBER_OF_TYPES 2 TYPE_NUMBER 1 MODEL mander CONFINED_SUBSECTION_SHAPE circular CONFINED_SUBSECTION_DIAM 68.00 CONF_TYPE hoops CONF_STEEL_TYPE 1 CONF_BAR_AREA 0.79 CONF_BAR_DIAM 1.00 CONF_BAR_SPACING 5.0 MAIN_BAR_TOTAL 26 MAIN_BAR_AREA 2.25 STRAIN_e0 0.002 STRAIN_eu 0.005 ULT_STRAIN_FACT 1.0 STRESS_f0 5.28 STRESS_fu 2.64 UNIT_WEIGHT_FACT 0.986 TYPE_NUMBER 2 MODEL unconfined_mander STRAIN_e0 0.002 STRAIN_eu 0.005 ULT_STRAIN_FACT 1.0 STRESS_f0 5.28 STRESS_fu 2.64 UNIT_WEIGHT_FACT 0.986 CONC_TYPES_END *************************************************************** * A706 Steel type 2 is for #11 and larger bars. Type 1 is for * * smaller bars. * *************************************************************** STEEL_TYPES_START NUMBER_OF_TYPES 2 TYPE_NUMBER 1 MODEL park YIELD_STRAIN 0.0023 HARDEN_STRAIN 0.0150 ULT_STRAIN 0.09 YIELD_STRESS 68.0 ULT_STRESS 95.0 MODULUS 29000.0 TYPE_NUMBER 2 MODEL park YIELD_STRAIN 0.0023 HARDEN_STRAIN 0.0075 ULT_STRAIN 0.06 YIELD_STRESS 68.0 ULT_STRESS 95.0 MODULUS 29000.0 STEEL_TYPES_END ************************************************* * Comment area * * Arc_strip is used to model a full circle. * ************************************************* SUBSECTION_START NUMBER_OF_SUBSECTIONS 2 SUBSECTION_NUMBER 1
SDC EXAMPLE # B (Bridge Design Academy Prototype Bridge) Page 85 of 148
APPENDIX – C (Input file for xSECTION) – Continues
SHAPE arc_strip CENTER_GLOBAL_X_Y 0 0 START_ANGLE 0 DURATION_CCW RADIUS_OUTER 34.00 RADIUS_INNER 0 NUMBER_OF_FIBERS_RADIAL 10 NUMBER_OF_FIBERS_ANGULAR 40 CONC_TYPE 1 MIRROR_4_WAYS no SUBSECTION_NUMBER 2 SHAPE arc_strip CENTER_GLOBAL_X_Y 0 0 START_ANGLE 0 DURATION_CCW 360 RADIUS_OUTER 36.00 RADIUS_INNER 34.00 NUMBER_OF_FIBERS_RADIAL 1 NUMBER_OF_FIBERS_ANGULAR 50 CONC_TYPE 2 MIRROR_4_WAYS no SUBSECTION_END ********************************************************* * Comment area * * Circular rebar distribution is a special case of arc * * distribution * ********************************************************* REBAR_LAYOUT_START NUMBER_OF_REBAR_GROUPS 1 GROUP_NUMBER 1 LAYOUT_SHAPE circular NUMBER_OF_REBARS 26 AREA_OF_EACH_BAR 2.25 STEEL_TYPE 2 CENTER_GLOBAL_X_Y 0 0 START_ANGLE 0 DURATION_CCW 360 RADIUS 31.930 MIRROR_4_WAYS no REBAR_LAYOUT_END ******************************************************** AXIAL_LOAD LOAD_VALUE 1694 CENTER_OF_LOAD_APPLICATION_GLOBAL_X_Y 0 0 *************************************************************** * Comment area * * Let the cover concrete fail but stop at first longitudinal * * rebar failure.To control the initial guess of the Neutral * * Axis a factor is defined which varies from 0.01 to 0.99 * * as shown below. This is used if there is instablity in * * the moment-curvature curve. * *************************************************************** ANALYSIS_CONTROL STOP_DUE_FIRST_CONC_FAILURE no STOP_DUE_FIRST_REBAR_FAILURE yes BENDING_AXIS_CCW_ROTATION_DEGREES 0 NEUTRAL_AXIS_PROXIMITY_TO_COMPRESSION_EDGE 0.99 CONVERGENCE_TOLERANCE 0.001 ********************************************************* RESULTS_REQUESTED MOMENT_AT_GLOBAL_X_Y 0 0 CONC_FIBER_INFO_OUTPUT no REBAR_FIBER_INFO_OUTPUT yes *********************************************************
SDC EXAMPLE # B (Bridge Design Academy Prototype Bridge) Page 86 of 148
APPENDIX – D (Output from xSECTION)
04/17/2006, 11:45 ************************************************************ * * * xSECTION * * * * DUCTILITY and STRENGTH of * * Circular, Semi-Circular, full and partial Rings, * * Rectangular, T-, I-, Hammer head, Octagonal, Polygons * * or any combination of above shapes forming * * Concrete Sections using Fiber Models * * * * VER._2.40,_MAR-14-99 * * * * Copyright (C) 1994, 1995, 1999 By Mark Seyed Mahan. * * * * A proper license must be obtained to use this software. * * For GOVERNMENT work call 916-227-8404, otherwise leave a * * message at 530-756-2367. The author makes no expressed or* * implied warranty of any kind with regard to this program.* * In no event shall the author be held liable for * * incidental or consequential damages arising out of the * * use of this program. * * * ************************************************************ This output was generated by running: xSECTION VER._2.40,_MAR-14-99 LICENSE (choices: LIMITED/UNLIMITED) UNLIMITED ENTITY (choices: GOVERNMENT/CONSULTANT) Government NAME_OF_FIRM Caltrans BRIDGE_NAME EXAMPLE BRIDGE_NUMBER 99-9999 JOB_TITLE PROTYPE BRIDGE - BRIDGE DESIGN ACADEMY Concrete Type Information: ----------strains-------- --------strength-------- Type e0 e2 ecc eu f0 f2 fcc fu E W 1 0.0020 0.0040 0.0055 0.0145 5.28 6.98 7.15 6.11 4313 148 2 0.0020 0.0040 0.0020 0.0050 5.28 3.61 5.28 2.64 4313 148 Steel Type Information: -----strains------ --strength- Type ey eh eu fy fu E 1 0.0023 0.0150 0.0900 68.00 95.00 29000 2 0.0023 0.0075 0.0600 68.00 95.00 29000 Steel Fiber Information: Fiber xc yc area No. type in in in^2 1 2 31.93 0.00 2.25 2 2 31.00 7.64 2.25 3 2 28.27 14.84 2.25 4 2 23.90 21.17 2.25 5 2 18.14 26.28 2.25 6 2 11.32 29.86 2.25
SDC EXAMPLE # B (Bridge Design Academy Prototype Bridge) Page 87 of 148
SDC EXAMPLE # B (Bridge Design Academy Prototype Bridge) Page 88 of 148
APPENDIX – D (Output from xSECTION) – Continues
39 0.01312 18.38 -0.0373 3847 1217 -3371 0 -0.48 0.000745 14841 40 0.01450 18.41 -0.0414 3857 1256 -3420 0 -1.66 0.000825 14976 First Yield of Rebar Information (not Idealized): Rebar Number 20 Coordinates X and Y (global in.) -3.85, -31.70 Yield strain = 0.00230 Curvature (rad/in)= 0.000054 Moment (ft-k) = 9537 Cross Section Information: Axial Load on Section (kips) = 1694 Percentage of Main steel in Cross Section = 1.44 Concrete modulus used in Idealization (ksi) = 4313 Cracked Moment of Inertia (ft^4) = 23.717 Idealization of Moment-Curvature Curve by Various Methods: Points on Curve Idealized Values =============== ============================= Method Conc. Yield symbol Plastic ID | Strain Curv. Moment | Curv. Moment for Curv. | in/in rad/in (K-ft) | rad/in (K-ft) moment rad/in Strain @ 0.003 0.000155 12388 0.000070 12388 Mn 0.000755 Strain @ 0.004 0.000219 12957 0.000073 12957 Mn 0.000752 Strain @ 0.005 0.000279 13302 0.000075 13302 Mn 0.000750 CALTRANS 0.00720 0.000407 13838 0.000078 13838 Mp 0.000747 [email protected] 0.000270 13271 0.000075 13271 Mn 0.000750
SDC EXAMPLE # B (Bridge Design Academy Prototype Bridge) Page 89 of 148
APPENDIX – E (Moment – Curvature Relationship)
SDC EXAMPLE # B (Bridge Design Academy Prototype Bridge) Page 90 of 148
APPENDIX - F (Soil Spring Data)
p-y Data - Bent 2 (Location 1)
0
50
100
150
200
250
0.0 0.5 1.0 1.5 2.0 2.5 3.0 3.5 4.0 4.5
Displacement (in)
Stiff
ness
(lbs
/in)
p-y Data - Bent 2 (Location 2)
0
200
400
600
800
1000
1200
1400
0.0 0.5 1.0 1.5 2.0 2.5 3.0 3.5 4.0 4.5
Displacement (in)
Stiff
ness
(lbs
/in)
SDC EXAMPLE # B (Bridge Design Academy Prototype Bridge) Page 91 of 148
APPENDIX - F (Soil Spring Data) - Continues
p-y Data - Bent 2 (Location 3)
0
200
400
600
800
1000
1200
1400
1600
0.0 0.5 1.0 1.5 2.0 2.5 3.0 3.5 4.0 4.5
Displacement (in)
Stiff
ness
(lbs
/in)
p-y Data - Bent 2 (Location 4)
0500
100015002000250030003500400045005000
0.0 0.5 1.0 1.5 2.0 2.5 3.0 3.5 4.0 4.5
Displacement (in)
Stiff
ness
(lbs
/in)
SDC EXAMPLE # B (Bridge Design Academy Prototype Bridge) Page 92 of 148
APPENDIX – G (Bent Cap – xSECTION Model)
SDC EXAMPLE # B (Bridge Design Academy Prototype Bridge) Page 93 of 148
APPENDIX – H1 (Bent Cap – Positive Bending Section Capacities)
05/16/2006, 10:17 ************************************************************ * * * xSECTION * * * * DUCTILITY and STRENGTH of * * Circular, Semi-Circular, full and partial Rings, * * Rectangular, T-, I-, Hammer head, Octagonal, Polygons * * or any combination of above shapes forming * * Concrete Sections using Fiber Models * * * * VER._2.40,_MAR-14-99 * * * * Copyright (C) 1994, 1995, 1999 By Mark Seyed Mahan. * * * * A proper license must be obtained to use this software. * * For GOVERNMENT work call 916-227-8404, otherwise leave a * * message at 530-756-2367. The author makes no expressed or* * implied warranty of any kind with regard to this program.* * In no event shall the author be held liable for * * incidental or consequential damages arising out of the * * use of this program. * * * ************************************************************ This output was generated by running: xSECTION VER._2.40,_MAR-14-99 LICENSE (choices: LIMITED/UNLIMITED) UNLIMITED ENTITY (choices: GOVERNMENT/CONSULTANT) GOVERNMENT NAME_OF_FIRM CALTRANS BRIDGE_NAME EXAMPLE BRIDGE_NUMBER 99-9999 JOB_TITLE PROTYPE BRIDGE - BRIDGE DESIGN ACADEMY Concrete Type Information: ----------strains-------- --------strength-------- Type e0 e2 ecc eu f0 f2 fcc fu E W 1 0.0020 0.0040 0.0027 0.0115 5.00 5.01 5.35 2.63 4200 148 2 0.0020 0.0040 0.0020 0.0050 5.00 3.52 5.00 2.50 4200 148 Steel Type Information: -----strains------ --strength- Type ey eh eu fy fu E 1 0.0023 0.0150 0.0900 68.00 95.00 29000 2 0.0023 0.0075 0.0600 68.00 95.00 29000 ……………………………………………………………………………………………………………… ……………………………………………………………………………………………………………… ……………………………………………………………………………………………………………… ……………………………………………………………………………………………………………… ……………………………………………………………………………………………………………… ……………………………………………………………………………………………………………… First Yield of Rebar Information (not Idealized): Rebar Number 1
SDC EXAMPLE # B (Bridge Design Academy Prototype Bridge) Page 94 of 148
Coordinates X and Y (global in.) -44.80, -35.49 Yield strain = 0.00230 Curvature (rad/in)= 0.000037 Moment (ft-k) = 14873 Cross Section Information: Axial Load on Section (kips) = 1 Percentage of Main steel in Cross Section = 0.80 Concrete modulus used in Idealization (ksi) = 4200 Cracked Moment of Inertia (ft^4) = 55.568 Idealization of Moment-Curvature Curve by Various Methods: Points on Curve Idealized Values =============== ============================= Method Conc. Yield symbol Plastic ID | Strain Curv. Moment | Curv. Moment for Curv. | in/in rad/in (K-ft) | rad/in (K-ft) moment rad/in Strain @ 0.003 0.000520 21189 0.000053 21189 Mn 0.000665 Strain @ 0.004 0.000684 21635 0.000054 21635 Mn 0.000664 Strain @ 0.005 0.000000 0 0.000000 0 Mn 0.000718 CALTRANS 0.00187 0.000306 19484 0.000048 19484 Mp 0.000669 [email protected] 0.000184 17426 0.000043 17426 Mn 0.000674
SDC EXAMPLE # B (Bridge Design Academy Prototype Bridge) Page 95 of 148
APPENDIX – H2 (Bent Cap – Negative Bending Section Capacities)
05/15/2006, 08:26 ************************************************************ * * * xSECTION * * * * DUCTILITY and STRENGTH of * * Circular, Semi-Circular, full and partial Rings, * * Rectangular, T-, I-, Hammer head, Octagonal, Polygons * * or any combination of above shapes forming * * Concrete Sections using Fiber Models * * * * VER._2.40,_MAR-14-99 * * * * Copyright (C) 1994, 1995, 1999 By Mark Seyed Mahan. * * * * A proper license must be obtained to use this software. * * For GOVERNMENT work call 916-227-8404, otherwise leave a * * message at 530-756-2367. The author makes no expressed or* * implied warranty of any kind with regard to this program.* * In no event shall the author be held liable for * * incidental or consequential damages arising out of the * * use of this program. * * * ************************************************************ This output was generated by running: xSECTION VER._2.40,_MAR-14-99 LICENSE (choices: LIMITED/UNLIMITED) UNLIMITED ENTITY (choices: GOVERNMENT/CONSULTANT) GOVERNMENT NAME_OF_FIRM CALTRANS BRIDGE_NAME EXAMPLE BRIDGE_NUMBER 99-9999 JOB_TITLE PROTYPE BRIDGE - BRIDGE DESIGN ACADEMY Concrete Type Information: ----------strains-------- --------strength-------- Type e0 e2 ecc eu f0 f2 fcc fu E W 1 0.0020 0.0040 0.0027 0.0115 5.00 5.01 5.35 2.63 4200 148 2 0.0020 0.0040 0.0020 0.0050 5.00 3.52 5.00 2.50 4200 148 Steel Type Information: -----strains------ --strength- Type ey eh eu fy fu E 1 0.0023 0.0150 0.0900 68.00 95.00 29000 2 0.0023 0.0075 0.0600 68.00 95.00 29000 ……………………………………………………………………………………………………………… ……………………………………………………………………………………………………………… ……………………………………………………………………………………………………………… ……………………………………………………………………………………………………………… ……………………………………………………………………………………………………………… ……………………………………………………………………………………………………………… First Yield of Rebar Information (not Idealized): Rebar Number 25
SDC EXAMPLE # B (Bridge Design Academy Prototype Bridge) Page 96 of 148
Coordinates X and Y (global in.) 44.80, -34.49 Yield strain = 0.00230 Curvature (rad/in)= 0.000037 Moment (ft-k) = 13030 Cross Section Information: Axial Load on Section (kips) = 1 Percentage of Main steel in Cross Section = 0.80 Concrete modulus used in Idealization (ksi) = 4200 Cracked Moment of Inertia (ft^4) = 48.938 Idealization of Moment-Curvature Curve by Various Methods: Points on Curve Idealized Values =============== ============================= Method Conc. Yield symbol Plastic ID | Strain Curv. Moment | Curv. Moment for Curv. | in/in rad/in (K-ft) | rad/in (K-ft) moment rad/in Strain @ 0.003 0.000593 19436 0.000055 19436 Mn 0.000563 Strain @ 0.004 0.000000 0 0.000000 0 Mn 0.000618 Strain @ 0.005 0.000000 0 0.000000 0 Mn 0.000618 CALTRANS 0.00159 0.000282 17307 0.000049 17307 Mp 0.000569 [email protected] 0.000183 15735 0.000044 15735 Mn 0.000573
SDC EXAMPLE # B (Bridge Design Academy Prototype Bridge) Page 97 of 148
S01 S02 S03
C01 C02
P02 P01
APPENDIX – I (wFRAME - Input File)
wFPREP VER._1.12,_JAN-14-95 JOB_TITLE Design Academy Example No: 1 (Bent 2) ********************************************************************* * Columns are pinned at the base. Column longitudinal reinforcement * * consists of 26, #14 bars. The lateral reinforcement consists of * * #8 Hoops at 5" spacing. * * * * 5/10/06 * ********************************************************************* All units in kips and feet ****************************************************************** *** Analysis Control Block Info *** The following block of information is for analysis control. Number of spans and number of link beams are specified. Direction of push is specified (push to left is not checked yet). 2nd deck out-of-phase push is not checked yet. ****************************************************************** ANALYSIS_CONTROL NUMBER_OF_SPANS 3 NUMBER_OF_LINK_BEAMS 0 DIRECTION_OF_PUSH right 2ND_DECK_OUT_OF_PHASE no ****************************************************************** *** Structural Data Block Info *** The follwing block of information is for definition of spans, columns and piles. A span/column/pile code and number (example S01) is specified; followed by total number of elements in span/col/pile; followed by number of different types of segments over which all elements are defined. The logic of this version is such that info for S01, C01, P01, S02, C02 P02, etc... is expected in the specified order. If a column is connected to a pile cap and a pile group and the user does not wish to model the pile group, then the portion of the column below ground (usually 2') must be modeled as a pile and the tip of the 2' pile should be modeled as fixed in X and Y translation and fixed, partially released (spring), or completely released for moment for a column to footing connection of pin nature.51.84 For each segment input the following: Number of elements per segment; Fixity code (rn= no release, rs=release start, re=release end); Length of each element (L); Depth of element in direction of bending (not used in this version); Area of cross section; Modulus of elasticity (Ei); Softened modulus (Ef, not used in this version); Cracked moment of inertia(Icr); Uniform dead load q (negative for superstructure elements, zero otherwise); Positive plastic moment capacity (Mpp); Negative plastic moment capacity (Mpn); Tolerance for elasto-plastic transition (.02 recommended); Element status = e for elastic, i for inactive. # F L D A Ei Ef I q Mp Mn T status ***************************************************************************** STRUCTURAL_DATA S01 2 2 1 rn 4.72 6.75 62.62 629528 62953 52.25 -68.40 27676 27676 0.02 e 1 rn 3.00 6.75 62.62 629528 62953 52.25 -68.40 27676 27676 0.02 e C01 4 2 1 rn 3.38 6.00 28.27 629528 62953 47.44 0 27676 27676 0.02 e 3 rn 11.93 6.00 28.27 629528 62953 23.72 0 13838 13838 0.02 e P01 4 2 3 rn 2.05 6.00 28.27 629528 62953 23.72 0 13838 13838 0.02 e
Bent cap +ve effective inertia
SDC EXAMPLE # B (Bridge Design Academy Prototype Bridge) Page 98 of 148
APPENDIX – I (wFRAME - Input File) - Continues
1 rn 2.05 6.00 28.27 629528 62953 23.72 0 13838 13838 0.02 e S02 6 4 1 rn 3.00 6.75 62.62 629528 62953 52.25 -68.40 27676 27676 0.02 e 2 rn 7.00 6.75 62.62 629528 62953 52.25 -68.40 27676 27676 0.02 e 2 rn 7.00 6.75 62.62 629528 62953 52.25 -68.40 27676 27676 0.02 e 1 rn 3.00 6.75 62.62 629528 62953 52.25 -68.40 27676 27676 0.02 e C02 4 2 1 rn 3.38 6.00 28.27 629528 62953 47.44 0 27676 27676 0.02 e 3 rn 11.93 6.00 28.27 629528 62953 23.72 0 13838 13838 0.02 e P02 4 2 3 rn 2.05 6.00 28.27 629528 62953 23.72 0 13838 13838 0.02 e 1 rn 2.05 6.00 28.27 629528 62953 23.72 0 13838 13838 0.02 e S03 2 2 1 rn 3.00 6.75 62.62 629528 62953 52.25 -68.40 27676 27676 0.02 e 1 rn 4.72 6.75 62.62 629528 62953 52.25 -68.40 27676 27676 0.02 e ***************************************************************************** *** Link Beam or Second Deck Block Info *** Link beam or second deck option may be placed at any span or any elevation relative to the superstructure (down is negative). For each link beam indicate beam number; total number of elements; nmber of segments; left end elevation; right end elevation. For each link beam segment input the following: see Structural Data Block Info. Data Specific to this bridge: Link Beams are NOT being used. # F L D A Ei Ef I q Mp Mn T status ****************************************************************** LINK_BEAM_DATA ****************************************************************** *** Soil p-y Block Info *** This section contains the p-y information. First the number of p-y curves is specified in the analysis (max 50). Then For each p-y curve enter the curve number, number of segments (2 for this version with the plateaue as the third segment generated by computer), p1, y1, p2, y2. Data Specific to this bridge: There are two layers of sand. The top layer is loose sand with layer thickness of 3'. The bottom layer is medimum dense sand with layer thickness of 5' Two p-y curves are used per layer. ***************************************************************** PYS NUMBER_OF_PYS 4 PY_NO. NO._OF_SEGMENTS P1 Y1 P2 Y2 1 2 2.520 0.142 2.520 1.000 2 2 14.400 0.154 14.400 1.000 3 2 15.840 0.104 15.840 1.000 4 2 47.880 0.108 47.880 1.000 ****************************************************************** *** Soil t-z Block Info *** This section contains the t-z information. First the number of t-z curves is specified in the analysis (max 50). Then For each t-z curve enter the curve number, number of segments (2 for this version with the plateaue as the third segment generated by computer), t1, z1, t2, z2. t-z curves are usually specified for muti-pile situation.
Column effective inertia and plastic moment capacity.
Superstructure and bent cap weight uniformly distributed over the entire bent cap
SDC EXAMPLE # B (Bridge Design Academy Prototype Bridge) Page 99 of 148
APPENDIX – I (wFRAME - Input File) - Continues
Data Specific to this bridge: ****************************************************************** TZS NUMBER_OF_TZS 0 TZ_NO. NO._OF_SEGMENTS T1 Z1 T2 Z2 ****************************************************************** *** Foundation Block Info for p-y application *** These p-y values are used to attach horizontal springs to the pile nodes for lateral response of the pile in the soil-structure interaction study. This section contains the foundation information for the p-y applications. A foundation location is defined as pile locations defined in the structural input. As discussed earlier the portion of a column below ground is called a pile. For each foundation location (i.e. pile or column 1, 2, etc.) indicate: location number; and the number of p-y applications. Each soil layer is considered one p-y application in this example. A soil layer may be subdivided into several segments, each considered one application. You need to input one new line per each count of application. Provide as many new lines as the number of p-y applications with the following info: Start & end depth of soil layer or sub-layer (measured from top of pile). Starting p-y number at top of layer. End p-y number at bottom of layer where linear interpolation is used for the generation of the intermediate springs. A factor is also used for the case of many actual piles represented by one "model pile" in the 2-D modeling of wFRAME. Also the group reduction factors typically used in soil-structure interaction problems for pile-groups may be applied through this factor. Data Specific to this bridge: ****************************************************************** FOUNDATIONS_PY | NO. OF | | | | | FACTOR LOC| SOIL-LAYERS/ |START |END |START-PY |END-PY |FOR # OF NO.| PY APPLIC. |DEPTH |DEPTH | NO. | NO. | PILE 1 2 0.00 3.28 1 2 1 3.28 8.20 3 4 1 2 2 0.00 3.28 1 2 1 3.28 8.20 3 4 1 ****************************************************************** *** Foundation Block Info for t-z application *** This section contains the foundation information for the t-z applications. The general logic followed in this section is similar to the p-y applications. These values are used to attach vertical springs to the pile nodes for axial response of the pile in the soil-structure interaction study. For each foundation location (i.e. column 1, 2, etc.) indicate: location number, and the number of t-z applications. Each soil layer may be considered one t-z application or a soil layer may be subdivided into several segments, each considered one application. Provide as many new lines as the number of t-z applications with the following info: start & end depth of soil (measured from top of pile). Starting t-z number at top of layer. End t-z number at bottom of layer where linear interpolation is used for the generation of the intermediate springs.
SDC EXAMPLE # B (Bridge Design Academy Prototype Bridge) Page 100 of 148
APPENDIX – I (wFRAME - Input File) - Continues
A factor is also used for the case of many actual piles represented by one "model pile" in the 2-D modeling of wFRAME. Data Specific to this bridge: None ****************************************************************** FOUNDATIONS_TZ | NO. OF | | | | | FACTOR LOC| SOIL-LAYERS/ |START |END |START-TZ |END-TZ |FOR # OF NO.| TZ APPLIC. |DEPTH |DEPTH | NO. | NO. | PILES 1 0 2 0 ****************************************************************** *** Boundary node Block Info for spring application *** This section contains the boundary information where additional springs may be attached to the extreme boundaries of the structure. The locations are at the pile tips and at the abutments. The boundary locations are identified according to the structural definition listed earlier in the input file. The following possibilities exist: For transverse analysis of say a 2 column bent (pin at base of columns) on pile group the following assumptions may be made if the user does not wish to model the piles explicitly. The pile group at each footing location may be modeled as providing fixity or spring action in horizontal direction (the user must estimate the spring value, otherwise fixity must be used). Therefore, boundary locations 0 and 3 are the overhangs and they must be released in all components (rx, ry, rz). The locations 1 and 2 will be modeld at column to footing connection as fx, fy, rz. In general for the transverse analysis of bents with "n" columns, locationns 1 and n+1 indicate the ends of cap beam and it usually is free (rx, ry, rz). For the transverse analysis of the above bent the user may decide to model the entire pile groups at the two foundations. The piles must be numbered as seen on the elevation view of the bent. This example will be presented later due to the complexity of the situation. For the longitudinal analysis of a 2 span bridge one may input two ficticious column/pile combinations at the abutments with proper releases to model the roller action of the seat abutment support. In this case release the top of the ficticious column for moment (rs in the element) and model the bottom with fx, fy, rz. This column will not carry a shear in the longitudinal push and it will only carry the dead load at the abutment. Attach a spring at the right abutment to model the passive resistance of the soil (sx plus a new line with k1, del1, k2, del2). For Location: enter 0 for left end of frame, 1 to xx for tips of piles, and the last location is for right end of frame. After boundary location number enter the following info on the next line: Fixity code for each X, Y and Z directions on consecutive lines: (rx=release x dir., fx=fix x dir., sx=spring code in x dir. etc.). If a spring is defined, the next line must be included for the spring with the following info.: Number of segments, stiffness and displacements at breakpoints of the multi-linear curve ((ki,deli) for i=1, 2...) (Input only 2 segments for this version with the plateaue segment generated by computer as the third segment). End bearing at tip of compression piles may be modeled with these springs. Data Specific to this bridge: For this simple example only fixity in the Y-direction is provided because the t-z(s) were not explicitly modeled. With t-z modeling the structure will be floating is soil with releases at all boundary locations to represent the
SDC EXAMPLE # B (Bridge Design Academy Prototype Bridge) Page 101 of 148
APPENDIX – I (wFRAME - Input File) - Continues
real condition. ****************************************************************** BOUNDARIES LOCATION FIXITY_CODE NO._OF_SEGMENTS ki del1 k2 del2 0 rx ry rz 1 fx fy rz 2 fx fy rz 3 rx ry rz ******************************************************************
SDC EXAMPLE # B (Bridge Design Academy Prototype Bridge) Page 102 of 148
APPENDIX – J (wFRAME Output File)
05/15/2006, 07:47 Design Academy Example No: 1 (Bent 2) ************************************************************ * * * wFRAME * * * * PUSH ANALYSIS of BRIDGE BENTS and FRAMES. * * * * Indicates formation of successive plastic hinges. * * * * VER._1.12,_JAN-14-95 * * * * Copyright (C) 1994 By Mark Seyed. * * * * This program should not be distributed under any * * condition. This release is for demo ONLY (beta testing * * is not complete). The author makes no expressed or * * implied warranty of any kind with regard to this program.* * In no event shall the author be held liable for * * incidental or consequential damages arising out of the * * use of this program. * * * ************************************************************ Node Point Information: Fixity condition definitions: s=spring and value r=complete release f=complete fixity with imposed displacement node name coordinates -----------fixity -------- # X Y X-dir. Y-dir. Rotation 1 S01.00 0.00 0.00 r r r 2 S01.01 4.72 0.00 r r r 3 S01.02 7.72 0.00 r r r 4 C01.01 7.72 -3.38 r r r 5 C01.02 7.72 -15.31 r r r 6 C01.03 7.72 -27.24 r r r 7 C01.04 7.72 -39.17 r r r 8 P01.01 7.72 -41.22 s 1.4e+002 r r 9 P01.02 7.72 -43.27 s 4.1e+002 r r 10 P01.03 7.72 -45.32 s 6.7e+002 r r 11 P01.04 7.72 -47.37 f 0.0000 f 0.0000 r 12 S02.01 10.72 0.00 r r r 13 S02.02 17.72 0.00 r r r 14 S02.03 24.72 0.00 r r r 15 S02.04 31.72 0.00 r r r 16 S02.05 38.72 0.00 r r r 17 S02.06 41.72 0.00 r r r 18 C02.01 41.72 -3.38 r r r 19 C02.02 41.72 -15.31 r r r 20 C02.03 41.72 -27.24 r r r 21 C02.04 41.72 -39.17 r r r 22 P02.01 41.72 -41.22 s 1.4e+002 r r 23 P02.02 41.72 -43.27 s 4.1e+002 r r 24 P02.03 41.72 -45.32 s 6.7e+002 r r 25 P02.04 41.72 -47.37 f 0.0000 f 0.0000 r 26 S03.01 44.72 0.00 r r r 27 S03.02 49.44 0.00 r r r Spring Information at node points: k's = k/ft or ft-k/rad.; d's = ft or rad. node spring k1 d1 k2 d2
SDC EXAMPLE # B (Bridge Design Academy Prototype Bridge) Page 103 of 148
SDC EXAMPLE # B (Bridge Design Academy Prototype Bridge) Page 107 of 148
APPENDIX – K (Output from xSECTION)
05/10/2006, 07:43 ************************************************************ * * * xSECTION * * * * DUCTILITY and STRENGTH of * * Circular, Semi-Circular, full and partial Rings, * * Rectangular, T-, I-, Hammer head, Octagonal, Polygons * * or any combination of above shapes forming * * Concrete Sections using Fiber Models * * * * VER._2.40,_MAR-14-99 * * * * Copyright (C) 1994, 1995, 1999 By Mark Seyed Mahan. * * * * A proper license must be obtained to use this software. * * For GOVERNMENT work call 916-227-8404, otherwise leave a * * message at 530-756-2367. The author makes no expressed or* * implied warranty of any kind with regard to this program.* * In no event shall the author be held liable for * * incidental or consequential damages arising out of the * * use of this program. * * * ************************************************************ This output was generated by running: xSECTION VER._2.40,_MAR-14-99 LICENSE (choices: LIMITED/UNLIMITED) UNLIMITED ENTITY (choices: GOVERNMENT/CONSULTANT) Government NAME_OF_FIRM Caltrans BRIDGE_NAME EXAMPLE BRIDGE_NUMBER 99-9999 JOB_TITLE PROTYPE BRIDGE - BRIDGE DESIGN ACADEMY Concrete Type Information: ----------strains-------- --------strength-------- Type e0 e2 ecc eu f0 f2 fcc fu E W 1 0.0020 0.0040 0.0055 0.0145 5.28 6.98 7.15 6.11 4313 148 2 0.0020 0.0040 0.0020 0.0050 5.28 3.61 5.28 2.64 4313 148 Steel Type Information: -----strains------ --strength- Type ey eh eu fy fu E 1 0.0023 0.0150 0.0900 68.00 95.00 29000 2 0.0023 0.0075 0.0600 68.00 95.00 29000 Steel Fiber Information: Fiber xc yc area No. type in in in^2 1 2 31.93 0.00 2.25 2 2 31.00 7.64 2.25 3 2 28.27 14.84 2.25 4 2 23.90 21.17 2.25 5 2 18.14 26.28 2.25 6 2 11.32 29.86 2.25
SDC EXAMPLE # B (Bridge Design Academy Prototype Bridge) Page 108 of 148
SDC EXAMPLE # B (Bridge Design Academy Prototype Bridge) Page 109 of 148
APPENDIX – K (Output from xSECTION) – Continues
40 0.01450 16.91 -0.0370 4458 1269 -3255 0 -1.79 0.000761 15987 First Yield of Rebar Information (not Idealized): Rebar Number 20 Coordinates X and Y (global in.) -3.85, -31.70 Yield strain = 0.00230 Curvature (rad/in)= 0.000057 Moment (ft-k) = 10802 Cross Section Information: Axial Load on Section (kips) = 2474 Percentage of Main steel in Cross Section = 1.44 Concrete modulus used in Idealization (ksi) = 4313 Cracked Moment of Inertia (ft^4) = 25.572 Idealization of Moment-Curvature Curve by Various Methods: Points on Curve Idealized Values =============== ============================= Method Conc. Yield symbol Plastic ID | Strain Curv. Moment | Curv. Moment for Curv. | in/in rad/in (K-ft) | rad/in (K-ft) moment rad/in Strain @ 0.003 0.000138 13546 0.000071 13546 Mn 0.000689 Strain @ 0.004 0.000198 14042 0.000074 14042 Mn 0.000687 Strain @ 0.005 0.000253 14366 0.000075 14366 Mn 0.000685 CALTRANS 0.00755 0.000392 14964 0.000079 14964 Mp 0.000682 [email protected] 0.000283 14479 0.000076 14479 Mn 0.000685 ************************************************************
SDC EXAMPLE # B (Bridge Design Academy Prototype Bridge) Page 110 of 148
APPENDIX – L (wFRAME Output File)
05/15/2006, 08:02 Design Academy Example No: 1 (Bent 2) ************************************************************ * * * wFRAME * * * * PUSH ANALYSIS of BRIDGE BENTS and FRAMES. * * * * Indicates formation of successive plastic hinges. * * * * VER._1.12,_JAN-14-95 * * * * Copyright (C) 1994 By Mark Seyed. * * * * This program should not be distributed under any * * condition. This release is for demo ONLY (beta testing * * is not complete). The author makes no expressed or * * implied warranty of any kind with regard to this program.* * In no event shall the author be held liable for * * incidental or consequential damages arising out of the * * use of this program. * * * ************************************************************ Node Point Information: Fixity condition definitions: s=spring and value r=complete release f=complete fixity with imposed displacement node name coordinates -----------fixity -------- # X Y X-dir. Y-dir. Rotation 1 S01.00 0.00 0.00 r r r 2 S01.01 4.72 0.00 r r r 3 S01.02 7.72 0.00 r r r 4 C01.01 7.72 -3.38 r r r 5 C01.02 7.72 -15.31 r r r 6 C01.03 7.72 -27.24 r r r 7 C01.04 7.72 -39.17 r r r 8 P01.01 7.72 -41.22 s 1.4e+002 r r 9 P01.02 7.72 -43.27 s 4.1e+002 r r 10 P01.03 7.72 -45.32 s 6.7e+002 r r 11 P01.04 7.72 -47.37 f 0.0000 f 0.0000 r 12 S02.01 10.72 0.00 r r r 13 S02.02 17.72 0.00 r r r 14 S02.03 24.72 0.00 r r r 15 S02.04 31.72 0.00 r r r 16 S02.05 38.72 0.00 r r r 17 S02.06 41.72 0.00 r r r 18 C02.01 41.72 -3.38 r r r 19 C02.02 41.72 -15.31 r r r 20 C02.03 41.72 -27.24 r r r 21 C02.04 41.72 -39.17 r r r 22 P02.01 41.72 -41.22 s 1.4e+002 r r 23 P02.02 41.72 -43.27 s 4.1e+002 r r 24 P02.03 41.72 -45.32 s 6.7e+002 r r 25 P02.04 41.72 -47.37 f 0.0000 f 0.0000 r 26 S03.01 44.72 0.00 r r r 27 S03.02 49.44 0.00 r r r Spring Information at node points: k's = k/ft or ft-k/rad.; d's = ft or rad.
SDC EXAMPLE # B (Bridge Design Academy Prototype Bridge) Page 111 of 148
SDC EXAMPLE # B (Bridge Design Academy Prototype Bridge) Page 116 of 148
APPENDIX – M (Force – Displacement Relationship)
SDC EXAMPLE # B (Bridge Design Academy Prototype Bridge) Page 117 of 148
APPENDIX – N (Cap Beam – Seismic Moment and Shear Demands)
05/15/2006, 15:50 Design Academy Example No: 1 (Bent 2) ************************************************************ * * * wFRAME * * * * PUSH ANALYSIS of BRIDGE BENTS and FRAMES. * * * * Indicates formation of successive plastic hinges. * * * * VER._1.12,_JAN-14-95 * * * * Copyright (C) 1994 By Mark Seyed. * * * * This program should not be distributed under any * * condition. This release is for demo ONLY (beta testing * * is not complete). The author makes no expressed or * * implied warranty of any kind with regard to this program.* * In no event shall the author be held liable for * * incidental or consequential damages arising out of the * * use of this program. * * * ************************************************************ Node Point Information: Fixity condition definitions: s=spring and value r=complete release f=complete fixity with imposed displacement node name coordinates -----------fixity -------- # X Y X-dir. Y-dir. Rotation 1 S01.00 0.00 0.00 r r r 2 S01.01 4.72 0.00 r r r 3 S01.02 7.72 0.00 r r r 4 C01.01 7.72 -3.38 r r r 5 C01.02 7.72 -15.31 r r r 6 C01.03 7.72 -27.24 r r r 7 C01.04 7.72 -39.17 r r r 8 P01.01 7.72 -41.22 s 1.4e+002 r r 9 P01.02 7.72 -43.27 s 4.1e+002 r r 10 P01.03 7.72 -45.32 s 6.7e+002 r r 11 P01.04 7.72 -47.37 f 0.0000 f 0.0000 r 12 S02.01 10.72 0.00 r r r 13 S02.02 17.72 0.00 r r r 14 S02.03 24.72 0.00 r r r 15 S02.04 31.72 0.00 r r r 16 S02.05 38.72 0.00 r r r 17 S02.06 41.72 0.00 r r r 18 C02.01 41.72 -3.38 r r r 19 C02.02 41.72 -15.31 r r r 20 C02.03 41.72 -27.24 r r r 21 C02.04 41.72 -39.17 r r r Cumulative Results of analysis at end of stage 6 Plastic Action at: Lat. Force / Deflection Element/ Stage/ Code/ *g (DL= 3381.7) / (in) P02X01 1 2 0.1863 9.3076 P01X01 2 2 0.1958 9.7870 P02X02 3 2 0.1966 9.8292 P01X02 4 2 0.2059 10.3036 C02-02 5 rs 0.2147 10.7599
SDC EXAMPLE # B (Bridge Design Academy Prototype Bridge) Page 118 of 148
APPENDIX – N (Cap Beam – Seismic Moment and Shear Demands) - Continues
SDC EXAMPLE # B (Bridge Design Academy Prototype Bridge) Page 120 of 148
APPENDIX – O (Joint Movement Calculations)
Anticipated Shortening = in30.12
210202100
63.0=⎟
⎠⎞
⎜⎝⎛ +
×
STATE OF CALIFORNIA.DEPARTMENT OF TRANSPORTATION JOINT MOVEMENTS CALCULATIONS a DS-D-0129(Rev.5/93) Note: Specific instructions are included as footnotes.
EA DISTRICT COUNTY ROUTE PM (KP) BRIDGE NAME AND NUMBER
910076 59 ES 999 99 Prototype Bridge
TYPE OF STRUCTURE TYPE ABUTMENT TYPE EXPANSION(2" elasto pads, etc.)
CIP/PS BOX GIRDER Seat Elastomeric Bearing Pads
(1) TEMPERATURE EXTREMES(from Preliminary Rerport) (2)THERMAL MOVEMENT ANTICIPATED SHORTENING (3)MOVEMENT FACTOR
Type Of Structure (inches/100 feet) (inches/100 feet) (inches/100 feet)
Concrete(Pretensioned) Range( ? )(0.0000060X1200) = + 0.12 g = = Range 87 ? Concrete(Post Tensioned) Range( 87 ? )(0.0000060X1200) = 0.6264 + 0.63 g = 1.26
ITEM(1) DESIGNER DATE ITEM(2)CHECKED BY DATE DESIGNER CHECKER 5/2/2006
To be filled in by Office of Structures Design b To be filled in by SR c Date: Seal Width Limits d Groove (saw cut) Width
Skew (4) Calculated M.R. Seal Type or Installation Width e (degrees) Contributing Movement (inches) A,B, Catalog W1 (5) W2 Structure (6)Adjust from Width at
Location Do not Length (inches) (Round up (Others) Number (inches) (inches) Temperature Maximum Temp. Temp. Listed
use in (feet) (3)X(4)/100 to 1/2") or Maximum Min.@Max. ( ? ) f (inches) (inches)
calculation Open Joint Temperature Δ° /(1)X(2)X(4)/100 w=(5)+(6)
Abut 1 0 202 2.53 2.50 Joint Seal Assembly(strip seal)
Abut 4 0 210 2.64 3.00 Joint Seal Assembly(strip seal)
see XS-12-59
SDC EXAMPLE # B (Bridge Design Academy Prototype Bridge) Page 121 of 148
APPENDIX – P (wFRAME Longitudinal Push Over – Input file)
wFPREP VER._1.12,_JAN-14-95 JOB_TITLE Design Academy Example No: 1 (Superstructure right Push) ********************************************************************* * Columns are pinned at the base. Column longitudinal reinforcement * * consists of 26, #14 bars. The lateral reinforcement consists of * * #8 Hoops at 5" spacing. The superstructure properties used are as * * calculated in BDS. * * * * 05/23/06 * ********************************************************************* All units in kips and feet ****************************************************************** *** Analysis Control Block Info *** The following block of information is for analysis control. Number of spans and number of link beams are specified. Direction of push is specified (push to left is not checked yet). 2nd deck out-of-phase push is not checked yet. ****************************************************************** ANALYSIS_CONTROL NUMBER_OF_SPANS 5 NUMBER_OF_LINK_BEAMS 0 DIRECTION_OF_PUSH right 2ND_DECK_OUT_OF_PHASE no ****************************************************************** *** Structural Data Block Info *** The follwing block of information is for definition of spans, columns and piles. A span/column/pile code and number (example S01) is specified; followed by total number of elements in span/col/pile; followed by number of different types of segments over which all elements are defined. The logic of this version is such that info for S01, C01, P01, S02, C02 P02, etc... is expected in the specified order. If a column is connected to a pile cap and a pile group and the user does not wish to model the pile group, then the portion of the column below ground (usually 2') must be modeled as a pile and the tip of the 2' pile should be modeled as fixed in X and Y translation and fixed, partially released (spring), or completely released for moment for a column to footing connection of pin nature.51.84 For each segment input the following: Number of elements per segment; Fixity code (rn= no release, rs=release start, re=release end); Length of each element (L); Depth of element in direction of bending (not used in this version); Area of cross section; Modulus of elasticity (Ei); Softened modulus (Ef, not used in this version); Cracked moment of inertia(Icr); Uniform dead load q (negative for superstructure elements, zero otherwise); Positive plastic moment capacity (Mpp); Negative plastic moment capacity (Mpn); Tolerance for elasto-plastic transition (.02 recommended); Element status = e for elastic, i for inactive. # F L D A Ei Ef I q Mp Mn T status ***************************************************************************** STRUCTURAL_DATA S01 1 1 1 rn 2.0 6.75 103.49 629528 62953 826.75 -0.01 83028 83028 0.02 e C01 1 1 1 rs 1.0 6.00 56.55 629528 62953 94.88 0 83028 83028 0.02 e P01 1 1 1 rn 1.0 6.00 56.55 629528 62953 47.44 0 27676 27676 0.02 e S02 12 4
SDC EXAMPLE # B (Bridge Design Academy Prototype Bridge) Page 122 of 148
APPENDIX – P (wFRAME Longitudinal Push Over – Input file) - Continues
9 rn 12.60 6.75 103.49 629528 62953 731.10 -18.25 83028 83028 0.02 e 1 rn 4.17 6.75 109.55 629528 62953 778.93 -19.12 83028 83028 0.02 e 1 rn 4.17 6.75 109.55 629528 62953 778.93 -19.59 83028 83028 0.02 e 1 rn 4.26 6.75 115.60 629528 62953 826.75 -70.07 83028 83028 0.02 e C02 4 2 1 rn 3.38 6.00 56.55 629528 62953 94.88 0 83028 83028 0.02 e 3 rn 11.93 6.00 56.55 629528 62953 47.44 0 27676 27676 0.02 e P02 4 2 3 rn 2.05 6.00 56.55 629528 62953 47.44 0 27676 27676 0.02 e 1 rn 2.05 6.00 56.55 629528 62953 47.44 0 27676 27676 0.02 e S03 14 5 1 rn 4.26 6.75 115.60 629528 62953 826.75 -70.07 83028 83028 0.02 e 2 rn 6.27 6.75 109.55 629528 62953 778.93 -18.64 83028 83028 0.02 e 8 rn 16.80 6.75 103.49 629528 62953 731.10 -18.25 83028 83028 0.02 e 2 rn 6.27 6.75 109.55 629528 62953 778.93 -18.64 83028 83028 0.02 e 1 rn 4.26 6.75 115.60 629528 62953 826.75 -70.07 83028 83028 0.02 e C03 4 2 1 rn 3.38 6.00 56.55 629528 62953 94.44 0 83028 83028 0.02 e 3 rn 11.95 6.00 56.55 629528 62953 47.22 0 27554 27554 0.02 e P03 5 2 4 rn 2.23 6.00 56.55 629528 62953 47.22 0 27554 27554 0.02 e 1 rn 2.23 6.00 56.55 629528 62953 47.22 0 27554 27554 0.02 e S04 12 4 1 rn 4.26 6.75 115.60 629528 62953 826.75 -70.07 83028 83028 0.02 e 1 rn 3.77 6.75 109.55 629528 62953 778.93 -19.64 83028 83028 0.02 e 1 rn 3.77 6.75 109.55 629528 62953 778.93 -19.21 83028 83028 0.02 e 9 rn 11.80 6.75 103.49 629528 62953 731.10 -18.25 83028 83028 0.02 e C04 1 1 1 rs 1.0 6.00 56.55 629528 62953 94.44 0 83028 83028 0.02 e P04 1 1 1 rn 1.0 6.00 56.55 629528 62953 47.22 0 27554 27554 0.02 e S05 1 1 1 rn 2.0 6.75 103.49 629528 62953 826.75 -0.01 83028 83028 0.02 e ****************************************************************************** *** Link Beam or Second Deck Block Info *** Link beam or second deck option may be placed at any span or any elevation relative to the superstructure (down is negative). For each link beam indicate beam number; total number of elements; nmber of segments; left end elevation; right end elevation. For each link beam segment input the following: see Structural Data Block Info. Data Specific to this bridge: Link Beams are NOT being used. # F L D A Ei Ef I q Mp Mn T status ****************************************************************** LINK_BEAM_DATA ****************************************************************** *** Soil p-y Block Info *** This section contains the p-y information. First the number of p-y curves is specified in the analysis (max 50). Then For each p-y curve enter the curve number, number of segments (2 for this version with the plateaue as the third segment generated by computer), p1, y1, p2, y2. Data Specific to this bridge: There are two layers of sand. The top layer is loose sand with layer thickness of 3'. The bottom layer is medimum dense sand with layer thickness of 5' Two p-y curves are used per layer. ***************************************************************** PYS NUMBER_OF_PYS 8
SDC EXAMPLE # B (Bridge Design Academy Prototype Bridge) Page 123 of 148
APPENDIX – P (wFRAME Longitudinal Push Over – Input file) - Continues
PY_NO. NO._OF_SEGMENTS P1 Y1 P2 Y2 1 2 5.040 0.142 5.040 1.000 2 2 28.800 0.154 28.800 1.000 3 2 31.680 0.104 31.680 1.000 4 2 95.360 0.108 95.360 1.000 5 2 5.040 0.138 5.040 1.000 6 2 28.800 0.154 28.800 1.000 7 2 30.960 0.110 30.960 1.000 8 2 126.240 0.108 126.240 1.000 ****************************************************************** *** Soil t-z Block Info *** This section contains the t-z information. First the number of t-z curves is specified in the analysis (max 50). Then For each t-z curve enter the curve number, number of segments (2 for this version with the plateaue as the third segment generated by computer), t1, z1, t2, z2. t-z curves are usually specified for muti-pile situation. Data Specific to this bridge: Curve 1 is applicable at 6" below Ground Level Curve 2 is applicable at 2'-6" below Ground Level. Curve 3 is applicable at 3'-6" below Ground Level. Curve 4 is applicable at 7'-6" below Ground Level. ****************************************************************** TZS NUMBER_OF_TZS 0 TZ_NO. NO._OF_SEGMENTS T1 Z1 T2 Z2 ****************************************************************** *** Foundation Block Info for p-y application *** These p-y values are used to attach horizontal springs to the pile nodes for lateral response of the pile in the soil-structure interaction study. This section contains the foundation information for the p-y applications. A foundation location is defined as pile locations defined in the structural input. As discussed earlier the portion of a column below ground is called a pile. For each foundation location (i.e. pile or column 1, 2, etc.) indicate: location number; and the number of p-y applications. Each soil layer is considered one p-y application in this example. A soil layer may be subdivided into several segments, each considered one application. You need to input one new line per each count of application. Provide as many new lines as the number of p-y applications with the following info: Start & end depth of soil layer or sub-layer (measured from top of pile). Starting p-y number at top of layer. End p-y number at bottom of layer where linear interpolation is used for the generation of the intermediate springs. A factor is also used for the case of many actual piles represented by one "model pile" in the 2-D modeling of wFRAME. Also the group reduction factors typically used in soil-structure interaction problems for pile-groups may be applied through this factor. Data Specific to this bridge: ****************************************************************** FOUNDATIONS_PY | NO. OF | | | | | FACTOR LOC| SOIL-LAYERS/ |START |END |START-PY |END-PY |FOR # OF NO.| PY APPLIC. |DEPTH |DEPTH | NO. | NO. | PILE 1 0
SDC EXAMPLE # B (Bridge Design Academy Prototype Bridge) Page 124 of 148
APPENDIX – P (wFRAME Longitudinal Push Over – Input file) – Continues
2 2 0.00 3.28 1 2 1 3.28 8.20 3 4 1 3 2 0.00 3.28 5 6 1 3.28 11.15 7 8 1 4 0 ****************************************************************** *** Foundation Block Info for t-z application *** This section contains the foundation information for the t-z applications. The general logic followed in this section is similar to the p-y applications. These values are used to attach vertical springs to the pile nodes for axial response of the pile in the soil-structure interaction study. For each foundation location (i.e. column 1, 2, etc.) indicate: location number, and the number of t-z applications. Each soil layer may be considered one t-z application or a soil layer may be subdivided into several segments, each considered one application. Provide as many new lines as the number of t-z applications with the following info: start & end depth of soil (measured from top of pile). Starting t-z number at top of layer. End t-z number at bottom of layer where linear interpolation is used for the generation of the intermediate springs. A factor is also used for the case of many actual piles represented by one "model pile" in the 2-D modeling of wFRAME. Data Specific to this bridge: None ****************************************************************** FOUNDATIONS_TZ | NO. OF | | | | | FACTOR LOC| SOIL-LAYERS/ |START |END |START-TZ |END-TZ |FOR # OF NO.| TZ APPLIC. |DEPTH |DEPTH | NO. | NO. | PILES 1 0 2 0 3 0 4 0 ****************************************************************** *** Boundary node Block Info for spring application *** This section contains the boundary information where additional springs may be attached to the extreme boundaries of the structure. The locations are at the pile tips and at the abutments. The boundary locations are identified according to the structural definition listed earlier in the input file. The following possibilities exist: For transverse analysis of say a 2 column bent (pin at base of columns) on pile group the following assumptions may be made if the user does not wish to model the piles explicitly. The pile group at each footing location may be modeled as providing fixity or spring action in horizontal direction (the user must estimate the spring value, otherwise fixity must be used). Therefore, boundary locations 0 and 3 are the overhangs and they must be released in all components (rx, ry, rz). The locations 1 and 2 will be modeld at column to footing connection as fx, fy, rz. In general for the transverse analysis of bents with "n" columns, locationns 1 and n+1 indicate the ends of cap beam and it usually is free (rx, ry, rz). For the transverse analysis of the above bent the user may decide to model the entire pile groups at the two foundations. The piles must be numbered as seen on the elevation view of the bent. This example will be presented later due to the complexity of the situation.
SDC EXAMPLE # B (Bridge Design Academy Prototype Bridge) Page 125 of 148
APPENDIX – P (wFRAME Longitudinal Push Over – Input file) Continues
For the longitudinal analysis of a 2 span bridge one may input two ficticious column/pile combinations at the abutments with proper releases to model the roller action of the seat abutment support. In this case release the top of the ficticious column for moment (rs in the element) and model the bottom with fx, fy, rz. This column will not carry a shear in the longitudinal push and it will only carry the dead load at the abutment. Attach a spring at the right abutment to model the passive resistance of the soil (sx plus a new line with k1, del1, k2, del2). For Location: enter 0 for left end of frame, 1 to xx for tips of piles, and the last location is for right end of frame. After boundary location number enter the following info on the next line: Fixity code for each X, Y and Z directions on consecutive lines: (rx=release x dir., fx=fix x dir., sx=spring code in x dir. etc.). If a spring is defined, the next line must be included for the spring with the following info.: Number of segments, stiffness and displacements at breakpoints of the multi-linear curve ((ki,deli) for i=1, 2...) (Input only 2 segments for this version with the plateaue segment generated by computer as the third segment). End bearing at tip of compression piles may be modeled with these springs. Data Specific to this bridge: For this simple example only fixity in the Y-direction is provided because the t-z(s) were not explicitly modeled. With t-z modeling the structure will be floating is soil with releases at all boundary locations to represent the real condition. ****************************************************************** BOUNDARIES LOCATION FIXITY_CODE NO._OF_SEGMENTS ki del1 k2 del2 0 rx ry rz 1 fx fy rz 2 fx fy rz 3 fx fy rz 4 fx fy rz 5 sx 2 7716 0.249 0.01 1 ry rz ******************************************************************
Initial Abutment Stiffness Units: kip,ft.
SDC EXAMPLE # B (Bridge Design Academy Prototype Bridge) Page 126 of 148
APPENDIX – Q1 (wFRAME Longitudinal Push Over – Force/Displacement Relationship)
SDC EXAMPLE # B (Bridge Design Academy Prototype Bridge) Page 127 of 148
APPENDIX – Q2 (wFRAME Longitudinal Push Over – Force/Displacement Relationship)
SDC EXAMPLE # B (Bridge Design Academy Prototype Bridge) Page 128 of 148
APPENDIX – R (wFRAME Input File – To Determine Superstructure Force due to Column Hinging, Case 1) wFPREP VER._1.12,_JAN-14-95 JOB_TITLE Design Academy Example No: 1 (Superstructure Right Push) ********************************************************************* * Columns are pinned at the base. Column longitudinal reinforcement * * consists of 26, #14 bars. The lateral reinforcement consists of * * #8 Hoops at 5" spacing. The superstructure properties used are as * * calculated in CTBridge. This file determines the distribution of * * the earthquake moments to the superstructure. * * * * 05/08/06 * ********************************************************************* All units in kips and feet ****************************************************************** *** Analysis Control Block Info *** The following block of information is for analysis control. Number of spans and number of link beams are specified. Direction of push is specified (push to left is not checked yet). 2nd deck out-of-phase push is not checked yet. ****************************************************************** ANALYSIS_CONTROL NUMBER_OF_SPANS 5 NUMBER_OF_LINK_BEAMS 0 DIRECTION_OF_PUSH right 2ND_DECK_OUT_OF_PHASE no ****************************************************************** *** Structural Data Block Info *** The follwing block of information is for definition of spans, columns and piles. A span/column/pile code and number (example S01) is specified; followed by total number of elements in span/col/pile; followed by number of different types of segments over which all elements are defined. The logic of this version is such that info for S01, C01, P01, S02, C02 P02, etc... is expected in the specified order. If a column is connected to a pile cap and a pile group and the user does not wish to model the pile group, then the portion of the column below ground (usually 2') must be modeled as a pile and the tip of the 2' pile should be modeled as fixed in X and Y translation and fixed, partially released (spring), or completely released for moment for a column to footing connection of pin nature.51.84 For each segment input the following: Number of elements per segment; Fixity code (rn= no release, rs=release start, re=release end); Length of each element (L); Depth of element in direction of bending (not used in this version); Area of cross section; Modulus of elasticity (Ei); Softened modulus (Ef, not used in this version); Cracked moment of inertia(Icr); Uniform dead load q (negative for superstructure elements, zero otherwise); Positive plastic moment capacity (Mpp); Negative plastic moment capacity (Mpn); Tolerance for elasto-plastic transition (.02 recommended); Element status = e for elastic, i for inactive. # F L D A Ei Ef I q Mpp Mpn T status ***************************************************************************** STRUCTURAL_DATA S01 1 1 1 rn 2.0 6.75 103.49 629528 60480 826.75 -0.01 99999 99999 0.02 e C01 1 1 1 rs 1.0 6.00 56.55 629528 62107 94.88 0 99999 99999 0.02 e P01 1 1 1 rn 1.0 6.00 56.55 629528 62107 47.44 0 99999 99999 0.02 e S02 13 4 10 rn 10.57 6.75 103.49 629528 60480 731.10 -0.01 99999 99999 0.02 e 1 rn 8.00 6.75 109.55 629528 60480 778.93 -0.01 99999 99999 0.02 e
SDC EXAMPLE # B (Bridge Design Academy Prototype Bridge) Page 129 of 148
APPENDIX – R (wFRAME Input File – To Determine Superstructure Force due to Column Hinging Continues, Case 1) 1 rn 8.00 6.75 109.55 629528 60480 778.93 -0.01 99999 99999 0.02 e 1 rn 4.26 6.75 115.60 629528 60480 826.75 -0.01 99999 99999 0.02 e C02 4 2 1 rn 3.38 6.00 56.55 629528 62107 94.88 0 99999 99999 0.02 e 3 rn 11.93 6.00 56.55 629528 62107 47.44 0 32060 34566 0.02 e P02 4 2 3 rn 2.05 6.00 56.55 629528 62107 47.44 0 32060 34566 0.02 e 1 re 2.05 6.00 56.55 629528 62107 47.44 0 32060 34566 0.02 e S03 16 5 1 rn 4.26 6.75 115.60 629528 60480 826.75 -0.01 99999 99999 0.02 e 2 rn 8.00 6.75 109.55 629528 60480 778.93 -0.01 99999 99999 0.02 e 10 rn 12.75 6.75 103.49 629528 60480 731.10 -0.01 99999 99999 0.02 e 2 rn 8.00 6.75 109.55 629528 60480 778.93 -0.01 99999 99999 0.02 e 1 rn 4.26 6.75 115.60 629528 60480 826.75 -0.01 99999 99999 0.02 e C03 4 2 1 rn 3.38 6.00 56.55 629528 62107 94.44 0 99999 99999 0.02 e 3 rn 11.95 6.00 56.55 629528 62107 47.22 0 34512 31835 0.02 e P03 5 2 4 rn 2.23 6.00 56.55 629528 62107 47.22 0 34512 31835 0.02 e 1 re 2.23 6.00 56.55 629528 62107 47.22 0 34512 31835 0.02 e S04 13 4 1 rn 4.26 6.75 115.60 629528 60480 826.75 -0.01 99999 99999 0.02 e 1 rn 8.00 6.75 109.55 629528 60480 778.93 -0.01 99999 99999 0.02 e 1 rn 8.00 6.75 109.55 629528 60480 778.93 -0.01 99999 99999 0.02 e 10 rn 9.77 6.75 103.49 629528 60480 731.10 -0.01 99999 99999 0.02 e C04 1 1 1 rs 1.0 6.00 56.55 629528 62107 94.44 0 99999 99999 0.02 e P04 1 1 1 rn 1.0 6.00 56.55 629528 62107 47.22 0 99999 99999 0.02 e S05 1 1 1 rn 2.0 6.75 103.49 629528 60480 826.75 -0.01 99999 99999 0.02 e ****************************************************************************** *** Link Beam or Second Deck Block Info *** Link beam or second deck option may be placed at any span or any elevation relative to the superstructure (down is negative). For each link beam indicate beam number; total number of elements; nmber of segments; left end elevation; right end elevation. For each link beam segment input the following: see Structural Data Block Info. Data Specific to this bridge: Link Beams are NOT being used. # F L D A Ei Ef I q Mp Mn T status ****************************************************************** LINK_BEAM_DATA ****************************************************************** *** Soil p-y Block Info *** This section contains the p-y information. First the number of p-y curves is specified in the analysis (max 50). Then For each p-y curve enter the curve number, number of segments (2 for this version with the plateaue as the third segment generated by computer), p1, y1, p2, y2. Data Specific to this bridge: There are two layers of sand. The top layer is loose sand with layer thickness of 3'. The bottom layer is medimum dense sand with layer thickness of 5' Two p-y curves are used per layer. ***************************************************************** PYS NUMBER_OF_PYS 8 PY_NO. NO._OF_SEGMENTS P1 Y1 P2 Y2 1 2 5.040 0.142 5.040 1.000
SDC EXAMPLE # B (Bridge Design Academy Prototype Bridge) Page 130 of 148
APPENDIX – R (wFRAME Input File – To Determine Superstructure Force due to Column Hinging Continues, Case 1) 2 2 28.800 0.154 28.800 1.000 3 2 31.680 0.104 31.680 1.000 4 2 95.360 0.108 95.360 1.000 5 2 5.040 0.138 5.040 1.000 6 2 28.800 0.154 28.800 1.000 7 2 30.960 0.110 30.960 1.000 8 2 126.240 0.108 126.240 1.000 ****************************************************************** *** Soil t-z Block Info *** This section contains the t-z information. First the number of t-z curves is specified in the analysis (max 50). Then For each t-z curve enter the curve number, number of segments (2 for this version with the plateaue as the third segment generated by computer), t1, z1, t2, z2. t-z curves are usually specified for muti-pile situation. Data Specific to this bridge: Curve 1 is applicable at 6" below Ground Level Curve 2 is applicable at 2'-6" below Ground Level. Curve 3 is applicable at 3'-6" below Ground Level. Curve 4 is applicable at 7'-6" below Ground Level. ****************************************************************** TZS NUMBER_OF_TZS 0 TZ_NO. NO._OF_SEGMENTS T1 Z1 T2 Z2 ****************************************************************** *** Foundation Block Info for p-y application *** These p-y values are used to attach horizontal springs to the pile nodes for lateral response of the pile in the soil-structure interaction study. This section contains the foundation information for the p-y applications. A foundation location is defined as pile locations defined in the structural input. As discussed earlier the portion of a column below ground is called a pile. For each foundation location (i.e. pile or column 1, 2, etc.) indicate: location number; and the number of p-y applications. Each soil layer is considered one p-y application in this example. A soil layer may be subdivided into several segments, each considered one application. You need to input one new line per each count of application. Provide as many new lines as the number of p-y applications with the following info: Start & end depth of soil layer or sub-layer (measured from top of pile). Starting p-y number at top of layer. End p-y number at bottom of layer where linear interpolation is used for the generation of the intermediate springs. A factor is also used for the case of many actual piles represented by one "model pile" in the 2-D modeling of wFRAME. Also the group reduction factors typically used in soil-structure interaction problems for pile-groups may be applied through this factor. Data Specific to this bridge: ****************************************************************** FOUNDATIONS_PY | NO. OF | | | | | FACTOR LOC| SOIL-LAYERS/ |START |END |START-PY |END-PY |FOR # OF NO.| PY APPLIC. |DEPTH |DEPTH | NO. | NO. | PILE 1 0 2 2 0.00 3.28 1 2 1
SDC EXAMPLE # B (Bridge Design Academy Prototype Bridge) Page 131 of 148
APPENDIX – R (wFRAME Input File – To Determine Superstructure Force due to Column Hinging Continues, Case 1) 3.28 8.20 3 4 1 3 2 0.00 3.28 5 6 1 3.28 11.15 7 8 1 4 0 ****************************************************************** *** Foundation Block Info for t-z application *** This section contains the foundation information for the t-z applications. The general logic followed in this section is similar to the p-y applications. These values are used to attach vertical springs to the pile nodes for axial response of the pile in the soil-structure interaction study. For each foundation location (i.e. column 1, 2, etc.) indicate: location number, and the number of t-z applications. Each soil layer may be considered one t-z application or a soil layer may be subdivided into several segments, each considered one application. Provide as many new lines as the number of t-z applications with the following info: start & end depth of soil (measured from top of pile). Starting t-z number at top of layer. End t-z number at bottom of layer where linear interpolation is used for the generation of the intermediate springs. A factor is also used for the case of many actual piles represented by one "model pile" in the 2-D modeling of wFRAME. Data Specific to this bridge: None ****************************************************************** FOUNDATIONS_TZ | NO. OF | | | | | FACTOR LOC| SOIL-LAYERS/ |START |END |START-TZ |END-TZ |FOR # OF NO.| TZ APPLIC. |DEPTH |DEPTH | NO. | NO. | PILES 1 0 2 0 3 0 4 0 ****************************************************************** *** Boundary node Block Info for spring application *** This section contains the boundary information where additional springs may be attached to the extreme boundaries of the structure. The locations are at the pile tips and at the abutments. The boundary locations are identified according to the structural definition listed earlier in the input file. The following possibilities exist: For transverse analysis of say a 2 column bent (pin at base of columns) on pile group the following assumptions may be made if the user does not wish to model the piles explicitly. The pile group at each footing location may be modeled as providing fixity or spring action in horizontal direction (the user must estimate the spring value, otherwise fixity must be used). Therefore, boundary locations 0 and 3 are the overhangs and they must be released in all components (rx, ry, rz). The locations 1 and 2 will be modeld at column to footing connection as fx, fy, rz. In general for the transverse analysis of bents with "n" columns, locationns 1 and n+1 indicate the ends of cap beam and it usually is free (rx, ry, rz). For the transverse analysis of the above bent the user may decide to model the entire pile groups at the two foundations. The piles must be numbered as seen on the elevation view of the bent. This example will be presented later due to the complexity of the situation. For the longitudinal analysis of a 2 span bridge one may input two ficticious
SDC EXAMPLE # B (Bridge Design Academy Prototype Bridge) Page 132 of 148
APPENDIX – R (wFRAME Input File – To Determine Superstructure Force due to Column Hinging Continues, Case 1) column/pile combinations at the abutments with proper releases to model the roller action of the seat abutment support. In this case release the top of the ficticious column for moment (rs in the element) and model the bottom with fx, fy, rz. This column will not carry a shear in the longitudinal push and it will only carry the dead load at the abutment. Attach a spring at the right abutment to model the passive resistance of the soil (sx plus a new line with k1, del1, k2, del2). For Location: enter 0 for left end of frame, 1 to xx for tips of piles, and the last location is for right end of frame. After boundary location number enter the following info on the next line: Fixity code for each X, Y and Z directions on consecutive lines: (rx=release x dir., fx=fix x dir., sx=spring code in x dir. etc.). If a spring is defined, the next line must be included for the spring with the following info.: Number of segments, stiffness and displacements at breakpoints of the multi-linear curve ((ki,deli) for i=1, 2...) (Input only 2 segments for this version with the plateaue segment generated by computer as the third segment). End bearing at tip of compression piles may be modeled with these springs. Data Specific to this bridge: For this simple example only fixity in the Y-direction is provided because the t-z(s) were not explicitly modeled. With t-z modeling the structure will be floating is soil with releases at all boundary locations to represent the real condition. ****************************************************************** BOUNDARIES LOCATION FIXITY_CODE NO._OF_SEGMENTS ki del1 k2 del2 0 rx ry rz 1 fx fy rz 2 fx fy rz 3 fx fy rz 4 fx fy rz 5 sx 2 7723 0.249 0 1 ry rz ******************************************************************
SDC EXAMPLE # B (Bridge Design Academy Prototype Bridge) Page 133 of 148
APPENDIX – S (wFRAME Output File – To Determine Superstructure Forces due to Column Hinging, Case 1)
05/08/2006, 14:34 Design Academy Example No: 1 (Superstructure Right Push) ************************************************************ * * * wFRAME * * * * PUSH ANALYSIS of BRIDGE BENTS and FRAMES. * * * * Indicates formation of successive plastic hinges. * * * * VER._1.12,_JAN-14-95 * * * * Copyright (C) 1994 By Mark Seyed. * * * * This program should not be distributed under any * * condition. This release is for demo ONLY (beta testing * * is not complete). The author makes no expressed or * * implied warranty of any kind with regard to this program.* * In no event shall the author be held liable for * * incidental or consequential damages arising out of the * * use of this program. * * * ************************************************************ Node Point Information: Fixity condition definitions: s=spring and value r=complete release f=complete fixity with imposed displacement node name coordinates -----------fixity -------- # X Y X-dir. Y-dir. Rotation 1 S01.00 0.00 0.00 r r r 2 S01.01 2.00 0.00 r r r 3 C01.01 2.00 -1.00 r r r 4 P01.01 2.00 -2.00 f 0.0000 f 0.0000 r 5 S02.01 12.57 0.00 r r r 6 S02.02 23.14 0.00 r r r 7 S02.03 33.71 0.00 r r r 8 S02.04 44.28 0.00 r r r 9 S02.05 54.85 0.00 r r r 10 S02.06 65.42 0.00 r r r 11 S02.07 75.99 0.00 r r r 12 S02.08 86.56 0.00 r r r 13 S02.09 97.13 0.00 r r r 14 S02.10 107.70 0.00 r r r 15 S02.11 115.70 0.00 r r r 16 S02.12 123.70 0.00 r r r 17 S02.13 127.96 0.00 r r r 18 C02.01 127.96 -3.38 r r r 19 C02.02 127.96 -15.31 r r r 20 C02.03 127.96 -27.24 r r r 21 C02.04 127.96 -39.17 r r r 22 P02.01 127.96 -41.22 s 2.7e+002 r r 23 P02.02 127.96 -43.27 s 8.3e+002 r r 24 P02.03 127.96 -45.32 s 1.3e+003 r r 25 P02.04 127.96 -47.37 f 0.0000 f 0.0000 r 26 S03.01 132.22 0.00 r r r 27 S03.02 140.22 0.00 r r r 28 S03.03 148.22 0.00 r r r 29 S03.04 160.97 0.00 r r r 30 S03.05 173.72 0.00 r r r 31 S03.06 186.47 0.00 r r r 32 S03.07 199.22 0.00 r r r 33 S03.08 211.97 0.00 r r r
SDC EXAMPLE # B (Bridge Design Academy Prototype Bridge) Page 134 of 148
APPENDIX – S (wFRAME Output File – To Determine Superstructure Forces due to Column Hinging Continues, Case 1) 34 S03.09 224.72 0.00 r r r 35 S03.10 237.47 0.00 r r r 36 S03.11 250.22 0.00 r r r 37 S03.12 262.97 0.00 r r r 38 S03.13 275.72 0.00 r r r 39 S03.14 283.72 0.00 r r r 40 S03.15 291.72 0.00 r r r 41 S03.16 295.98 0.00 r r r 42 C03.01 295.98 -3.38 r r r 43 C03.02 295.98 -15.33 r r r 44 C03.03 295.98 -27.28 r r r 45 C03.04 295.98 -39.23 r r r 46 P03.01 295.98 -41.46 s 3.2e+002 r r 47 P03.02 295.98 -43.69 s 9.2e+002 r r 48 P03.03 295.98 -45.92 s 1.5e+003 r r 49 P03.04 295.98 -48.15 s 2e+003 r r 50 P03.05 295.98 -50.38 f 0.0000 f 0.0000 r 51 S04.01 300.24 0.00 r r r 52 S04.02 308.24 0.00 r r r 53 S04.03 316.24 0.00 r r r 54 S04.04 326.01 0.00 r r r 55 S04.05 335.78 0.00 r r r 56 S04.06 345.55 0.00 r r r 57 S04.07 355.32 0.00 r r r 58 S04.08 365.09 0.00 r r r 59 S04.09 374.86 0.00 r r r 60 S04.10 384.63 0.00 r r r 61 S04.11 394.40 0.00 r r r 62 S04.12 404.17 0.00 r r r 63 S04.13 413.94 0.00 r r r 64 C04.01 413.94 -1.00 r r r 65 P04.01 413.94 -2.00 f 0.0000 f 0.0000 r 66 S05.01 415.94 0.00 s 7.7e+003 r r Spring Information at node points: k's = k/ft or ft-k/rad.; d's = ft or rad. node spring k1 d1 k2 d2 # name 22 P02X01 272.74 0.149 0.00 1.000 0.00 1000.000 23 P02X02 828.36 0.105 0.00 1.000 0.00 1000.000 24 P02X03 1326.91 0.106 0.00 1.000 0.00 1000.000 46 P03X01 317.46 0.149 0.00 1.000 0.00 1000.000 47 P03X02 919.77 0.110 0.00 1.000 0.00 1000.000 48 P03X03 1476.21 0.109 0.00 1.000 0.00 1000.000 49 P03X04 2038.47 0.109 0.00 1.000 0.00 1000.000 66 S05X01 7723.00 0.249 0.00 1.000 0.00 1000.000 Structural Setup: Spans= 5, Columns= 4, Piles= 4, Link Beams= 0 Element Information: element nodes depth # name fix i j L d area Ei Ef Icr q Mpp Mpn tol status 1 S01-01 rn 1 2 2.00 6.8 103.5 629528 60480 826.75 -0.01 99999 99999 0.02 e 2 C01-01 rs 2 3 1.00 6.0 56.5 629528 62107 94.88 0.00 99999 99999 0.02 e 3 P01-01 rn 3 4 1.00 6.0 56.5 629528 62107 47.44 0.00 99999 99999 0.02 e 4 S02-01 rn 2 5 10.57 6.8 103.5 629528 60480 731.10 -0.01 99999 99999 0.02 e 5 S02-02 rn 5 6 10.57 6.8 103.5 629528 60480 731.10 -0.01 99999 99999 0.02 e 6 S02-03 rn 6 7 10.57 6.8 103.5 629528 60480 731.10 -0.01 99999 99999 0.02 e 7 S02-04 rn 7 8 10.57 6.8 103.5 629528 60480 731.10 -0.01 99999 99999 0.02 e 8 S02-05 rn 8 9 10.57 6.8 103.5 629528 60480 731.10 -0.01 99999 99999 0.02 e 9 S02-06 rn 9 10 10.57 6.8 103.5 629528 60480 731.10 -0.01 99999 99999 0.02 e 10 S02-07 rn 10 11 10.57 6.8 103.5 629528 60480 731.10 -0.01 99999 99999 0.02 e
SDC EXAMPLE # B (Bridge Design Academy Prototype Bridge) Page 135 of 148
SDC EXAMPLE # B (Bridge Design Academy Prototype Bridge) Page 140 of 148
APPENDIX - T (PSSECx Input File)
PSSEC300,_OCT_26_2005 Bridge Design Academy - Prototype Supestructure Capacity S1 1.0NEG Number of different types of concrete 1 For each concrete type input: Type number; Model code= 0 simple(unconfined/confined), 1 Mander's (unconfined) strength f'c0 (ksi), strain ec0, strength fcu (ksi), ult. strain ecu, conc. density 1 1 5.200 .002 0.5 0.0025 150 Number of different types of P/S steel 1 For each type, 1st line for tensile parameters,2nd line for cmpressive parameters type#;E;fy;strain hard. factor;fu;ult. strain;PS-code: 0 tendons, 1 otherwise E;fy;strain hard. factor;fu;ult. strain 1 28500 245 2 270 0.030 0 0 0 0 0 0 Number of different types of mild steel 1 For each steel type input: Type number;Model code= 0 simple, 1 complex E(ksi);fy(ksi);strain hard. factor;fu(ksi);ultimate strain 1 1 29000 68 6.41 95 0.09 Number of Conc. Subsections 1 For each Subsec.:Subsection #,Section shape type, Concrete type, No. of fibers Subsec. Dim.(in):(See Manual for input parameters.) Subsec. Dim.(in):(See Manual for input parameters.) Global coord. of the center of Subsec.: Xg, Yg 1 I-shaped, 1 200 706.0 48.0 517.0 81.0 9.125 8.25 0 -5.26 Number of P/S steel groups 1 For each group:group#;P/S type;x-coord.(in);y-coord.(in);area(in^2);P/S force 1 1 0 25.4412 38.28 6157 Number of mild steel rebar cages (rebar distributed around the perimeter) 0 cage#;steel type;cage shape;#of bars;x(in) of 1st bar(y=0);area(in^2)of bar Number of mild steel groups (no logical pattern for distribution) 2 n group#;steel type;x-coord.(in); y-coord.(in); area(in^2) 1 1 0 31.80 47.40 2 1 0 -42.13 34.76 Non P/S Axial load on mid-depth of section (Kips)(+ sign=compression) 0 Numerical Computation Factor (1 to 10) 5 Computer Graphics Card identifier: 0 none; 2 CGA; 3 Hercules; 9 EGA; 12 VGA 12 Output control: 0 short; 1 long output 1 X-Sec. plot control (0=no plot, 1=each stage, 2=every iteration of each step) 0 Analysis Control: p - Positive moment, n - Negative moment n
SDC EXAMPLE # B (Bridge Design Academy Prototype Bridge) Page 141 of 148
APPENDIX – U (PSSECx Model for Superstructure)
SDC EXAMPLE # B (Bridge Design Academy Prototype Bridge) Page 142 of 148
APPENDIX – V (Partial Output from PSSECx Run)
05-15-2006 ******** SECx ******** DUCTILITY and STRENGTH of Rectangular, T-, I-, Hammer, Octagonal, Circular, Ring, and Hollowed shaped Prestressed and Reinforced Concrete Sections using fiber models Ver. 3.00, OCT-26-2005 Copyright (C) 2005 By Mark Seyed and Don Lee. This program should not be distributed under any condition. This release is for demo ONLY (beta testing is not complete). Caltrans or the author make no expressed or implied warranty of any kind with regard to this program. In no event shall the author or Caltrans be held liable for incidental or consequential damages arising out of the use of this program. JOB TITLE: Bridge Design Academy - Prototype Supestructure Capacity S1 1.0NEG Concrete Data, Complex Model, Mander's unconfined Concrete Type = 1 Compressive Strength (max.) (ksi) = 5.200 Strain at max. Strength = .00200 Strength at Ultimate Strain (ksi) = 0.000 Ultimate strain = .00500 Unit Weight (pcf) = 150.00 Prestressing Steel Data Material Yield Hardening Ultimate Yield Ultimate Modulus No. Strain Strain Strain Stress Stress of Elasticity ksi ksi ksi 1 0.00860 0.00860 0.03000 245.10 270.00 28500.00 Tensile prop. 0.00000 0.00000 0.00000 0.00 0.00 0.00 Compressive prop. Prestress element type # 1 is 7-wire and Low-Relaxation Tendon with 270 ksi strands. ( Refer to PCI Design Handbook 4th Edition.) Mild Steel Reinforcing Data Material Yield Hardening Ultimate Yield Ultimate No. Strain Strain Strain Stress Stress ksi ksi 1 0.00234 0.01503 0.09000 68.00 95.00 Rectangular, T-, or I-shaped section information Depth of Section (in.) = 81.00 Top Flange width (in.) = 706.00 Top Flange thickness (in.) = 9.13 Bot Flange width (in.) = 517.00 Bot Flange thickness (in.) = 8.25 Web thickness (in.) = 48.00 Concrete fiber information Fiber Material x y area # # (in) (in) (in^2) 1 1.0 0.00 -45.56 203.11 2 1.0 0.00 -45.17 203.11 3 1.0 0.00 -44.78 203.11 4 1.0 0.00 -44.38 203.11 5 1.0 0.00 -43.99 203.11 6 1.0 0.00 -43.60 203.11 7 1.0 0.00 -43.21 203.11
SDC EXAMPLE # B (Bridge Design Academy Prototype Bridge) Page 143 of 148
APPENDIX – V (Partial Output from PSSECx Run) – Continues
8 1.0 0.00 -42.81 203.11 9 1.0 0.00 -42.42 203.11 10 1.0 0.00 -42.03 203.11 11 1.0 0.00 -41.63 203.11 12 1.0 0.00 -41.24 203.11 13 1.0 0.00 -40.85 203.11 14 1.0 0.00 -40.46 203.11 15 1.0 0.00 -40.06 203.11 ……………………………………………… ……………………………………………… ……………………………………………… 188 1.0 0.00 30.06 292.83 189 1.0 0.00 30.47 292.83 190 1.0 0.00 30.88 292.83 191 1.0 0.00 31.30 292.83 192 1.0 0.00 31.71 292.83 193 1.0 0.00 32.13 292.83 194 1.0 0.00 32.54 292.83 195 1.0 0.00 32.96 292.83 196 1.0 0.00 33.37 292.83 197 1.0 0.00 33.79 292.83 198 1.0 0.00 34.20 292.83 199 1.0 0.00 34.62 292.83 200 1.0 0.00 35.03 292.83 Prestressing Steel Fiber Data Fiber Material x y area P/S force No. No. (in) (in) (in^2) Kips 1 1 0.00 25.44 38.28 6157.00 Total P/S force on the section = 6157.0 kips Total moment due to P/S about point (0, 0) = 13053.5 ft-kip Mild Steel Fiber Data Fiber Material x y area No. No. (in) (in) (in^2) 1 1 0.00 31.80 47.40 2 1 0.00 -42.13 34.76 Axial load at mid-depth of section (kip)(positive means compression) = 0.0 *************************************************** * Analysis Results --- Negative Moment Capacity * *************************************************** Initial state due to P/S without non-P/S axial force: N.A. Loc. Curvature Conc. Strain @ max. compressed fiber -41.50 0.0000023 0.00017950 Undeformed P/S element position w.r.t. reference plane P/S Fiber Loc.(y) Undef. pos. Conc. Strain @ same loc. 1 25.44 -0.0058006 -0.0001570 Force Equilibrium Condition of the x-section: Max. Max. Conc. Neutral Steel Steel Strain Axis Strain Conc. force P/S Net Curvature Moment step epscmax in. Tens. Comp. Comp. Tens. force force in/in (K-ft) 0 -.00001 -41.50 -.00000 5923. 236. -1. -6157. -0.8 0.000002 -4. 1 -.00001 -42.26 0.00000 5923. 235. 0. -6158. -0.4 0.000002 -147.
SDC EXAMPLE # B (Bridge Design Academy Prototype Bridge) Page 144 of 148
APPENDIX – V (Partial Output from PSSECx Run) – Continues
SDC EXAMPLE # B (Bridge Design Academy Prototype Bridge) Page 145 of 148
APPENDIX – V (Partial Output from PSSECx Run) – Continues
31 0.00178 -38.26 1 -.021292 32 0.00199 -38.64 1 -.024243 33 0.00223 -38.94 1 -.027534 34 0.00000 0.00 1 -.005801 35 0.00000 0.00 1 -.005801 36 0.00000 0.00 1 -.005801 37 0.00000 0.00 1 -.005801 38 0.00000 0.00 1 -.005801 39 0.00000 0.00 1 -.005801 40 0.00000 0.00 1 -.005801 Recommended value of 'effective moment of inertia' based on initial slope of moment-curvature diagram (ft^4) = 211.8303 Yield pt. is defined as the First mild steel yields. The first mild steel yields between the following Steps: 23 and 24 The computation of mild steel yield point IS within 2% tolerance. The first P/S steel yields between the following Steps: 24 and 25 The computation of P/S steel yield point IS NOT within 2% tolerance. Curvature(rad/in) Moments (ft-K) Yield 0.000040 67871 Nominal See force equilibrium table at concrete strain of .003 Ultimate 0.000000 0 end
SDC EXAMPLE # B (Bridge Design Academy Prototype Bridge) Page 146 of 148
APPENDIX – W (Partial xSECTION output Including Transverse Overturning Effects – Compression Column)
05/31/2006, 23:21 ************************************************************ * * * xSECTION * * * * DUCTILITY and STRENGTH of * * Circular, Semi-Circular, full and partial Rings, * * Rectangular, T-, I-, Hammer head, Octagonal, Polygons * * or any combination of above shapes forming * * Concrete Sections using Fiber Models * * * * VER._2.40,_MAR-14-99 * * * * Copyright (C) 1994, 1995, 1999 By Mark Seyed Mahan. * * * * A proper license must be obtained to use this software. * * For GOVERNMENT work call 916-227-8404, otherwise leave a * * message at 530-756-2367. The author makes no expressed or* * implied warranty of any kind with regard to this program.* * In no event shall the author be held liable for * * incidental or consequential damages arising out of the * * use of this program. * * * ************************************************************ This output was generated by running: xSECTION VER._2.40,_MAR-14-99 LICENSE (choices: LIMITED/UNLIMITED) UNLIMITED ENTITY (choices: GOVERNMENT/CONSULTANT) Government NAME_OF_FIRM Caltrans BRIDGE_NAME EXAMPLE BRIDGE_NUMBER 99-9999 JOB_TITLE PROTYPE BRIDGE - BRIDGE DESIGN ACADEMY Concrete Type Information: ----------strains-------- --------strength-------- Type e0 e2 ecc eu f0 f2 fcc fu E W 1 0.0020 0.0040 0.0055 0.0145 5.28 6.98 7.15 6.11 4313 148 2 0.0020 0.0040 0.0020 0.0050 5.28 3.61 5.28 2.64 4313 148 Steel Type Information: -----strains------ --strength- Type ey eh eu fy fu E 1 0.0023 0.0150 0.0900 68.00 95.00 29000 2 0.0023 0.0075 0.0600 68.00 95.00 29000 ----------------------------------- ----------------------------------- ----------------------------------- Force Equilibrium Condition of the x-section: Max. Max. Conc. Neutral Steel Steel
SDC EXAMPLE # B (Bridge Design Academy Prototype Bridge) Page 147 of 148
APPENDIX – W (Partial xSECTION output Including Transverse Overturning Effects – Compression Column Continues)