Page 1
β2-adrenoceptor-induced modulation of
transglutaminase 2 transamidase activity in cardiomyoblasts
Falguni S. VYASa, Carl P. NELSONa, Fiona FREEMANa, David J. BOOCOCKb, Alan J
HARGREAVESa, John M. DICKENSONa*
aSchool of Science and Technology
Nottingham Trent University
Clifton Lane
Nottingham
NG11 8NS
b John van Geest Cancer Research Centre
Nottingham Trent University
Clifton Lane
Nottingham
NG11 8NS
*To whom correspondence should be addressed
Tel: +44-1158486683
E-mail: [email protected]
Running title: β2-adrenoceptor-induced TG2 activation
Page 2
Abstract
Tissue transglutaminase 2 (TG2) is modulated by protein kinase A (PKA) mediated
phosphorylation: however, the precise mechanism(s) of its modulation by G-protein coupled
receptors coupled to PKA activation are not fully understood. In the current study we
investigated the potential regulation of TG2 activity by the β2-adrenoceptor in rat H9c2
cardiomyoblasts. Transglutaminase transamidation activity was assessed using amine-
incorporating and protein cross-linking assays. TG2 phosphorylation was determined via
immunoprecipitation and Western blotting. The long acting β2-adrenoceptor agonist
formoterol induced time- and concentration-dependent increases in TG2 transamidation.
Increases in TG2 activity were reduced by the TG2 inhibitors Z-DON (Benzyloxycarbonyl-(6-
Diazo-5-oxonorleucinyl)-L-valinyl-L-prolinyl-L-leucinmethylester) and R283 (1,3,dimethyl-
2[2-oxo-propyl]thio)imidazole chloride). Responses to formoterol were blocked by
pharmacological inhibition of PKA, extracellular signal-regulated kinase 1 and 2 (ERK1/2), or
phosphatidylinositol 3-kinase (PI-3K) signalling. Furthermore, the removal of extracellular
Ca2+ also attenuated formoterol-induced TG2 activation. Fluorescence microscopy
demonstrated TG2-induced biotin-X-cadaverine incorporation into proteins. Formoterol
increased the levels of TG2-associated phosphoserine and phosphothreonine, which were
blocked by inhibition of PKA, ERK1/2 or PI-3K signalling. Subsequent proteomic analysis
identified known (e.g. lactate dehydrogenase A chain) and novel (e.g. Protein S100-A6)
protein substrates for TG2. Taken together, the data obtained suggest that β2-
adrenoceptor-induced modulation of TG2 represents a novel paradigm in β2-adrenoceptor
cell signalling, expanding the repertoire of cellular functions responsive to catecholamine
stimulation.
Key words: β2-adrenoceptor; phosphorylation; protein kinase A; ERK1/2; H9c2
cardiomyocytes; transglutaminase 2.
Page 3
1. Introduction
Transglutaminases (EC 2.3.2.13; TGs) are a family of structurally and functionally similar
Ca2+ dependent enzymes that catalyse post-translational modifications of proteins. TGs
introduce a stable covalent bond between free amine groups (e.g. protein- or peptide-bound
lysine) and γ-carboxamide groups of peptide-bound glutamine residues (Eckert et al.,
2014). Nine members of the TG family have been characterised (Factor XIIIa, TGs 1-7 and
erythrocyte band 4.2), of which erythrocyte band 4.2 is inactive in mammals (Iismaa et al.,
2009; Agnihotri and Mehta, 2017). TG2 is the only member of the family that is ubiquitously
expressed and displays a variety of activities. Along with post-translational protein
modifications (transamidation, deamidation, protein disulphide isomerase), TG2 also acts as
a G-protein (Gh) and has an intrinsic kinase activity (Gundemir et al., 2012).
When acting as a G-protein, TG2 couples to members of the G-protein coupled receptor
(GPCR) family including the 1β-adrenergic receptor, thromboxane A2 receptor and oxytocin
receptor (Gundemir et al., 2012). The capacity of TG2 to perform multifunctional roles in
cells and tissues makes it an important regulator of many cellular functions, including
migration, cell adhesion, cell differentiation, cell survival, apoptosis, and organization of the
extracellular matrix (Nurminskaya and Belkin, 2012). Dysregulation of TG2 is implicated in
numerous pathologies, e.g. celiac disease, neurodegenerative disorders, cancer and fibrosis;
hence, it represents a potential therapeutic target (Caccamo et al., 2010). TG2 activity is
modulated by protein kinases; e.g. phosphorylation of TG2 at Ser216 by protein kinase A
(PKA) inhibits its transamidase activity and enhances its kinase activity (Mishra et al., 2007;
Wang et al., 2012). However at present, the precise mechanism(s) of its modulation by
GPCRs coupled to PKA activation are not fully understood.
The β2-adrenoceptor is a member of the GPCR superfamily, which can interact with both Gs
and Gi-proteins (Rockman et al., 2002). When interacting with Gs, the β2-adrenoceptor
activates PKA-dependent signalling pathway (Benovic, 2002). Interaction with Gi results in
the release of βγ subunits and triggers the activation of additional signaling cascades that
Page 4
include extracellular signal-regulated kinase 1 and 2 (ERK1/2) and protein kinase B (PKB;
Daaka et al., 1997; Okamoto et al., 1991; Steinberg, 1999; Yano et al., 2007). Our recent
studies have demonstrated that TG2 activity increases in cardiomyocyte-like H9c2 cells
following stimulations with phorbol-12-myristrate-13-acetate (PMA) and forskolin, activators
of protein kinase C (PKC) and PKA, respectively (Almami et al., 2014). Overall, these
observations indicate that TG2 activity could be modulated by the β2-adrenoceptor. In this
respect, it is interesting to note that β2-adrenoceptor activation triggers TG2 expression in
macrophages in response to the stress-related catecholamines adrenaline and noradrenaline
(Yanagawa et al., 2014). In the present study, we have demonstrated for the first time that
activation of the β2-adrenoceptor with the long-acting β2-adrenoceptor agonist formoterol
increases TG2 transamidation activity in H9c2 cells via a pathway dependent upon PKA,
ERK1/2, phosphatidylinositol 3-kinase (PI-3K) and extracellular Ca2+. Hence β2-
adrenoceptor-induced modulation of TG2 represents a novel paradigm in β2-adrenoceptor
cell signalling, expanding the repertoire of cellular functions responsive to catecholamine
stimulation.
Page 5
2. Materials and methods
2.1. Materials
AS 605240 (5-(6-Quinoxalinylmethylene)-2,4-thiazolidine-2,4-dione), BAPTA/AM (1,2-Bis(2-
aminophenoxy)ethane-N,N,N',N'-tetraacetic acid tetrakis acetoxymethyl ester), CGP 20712
(1-[2-((3-Carbamoyl-4-hydroxy)phenoxy)ethylamino]-3-[4-(1-methyl-4-trifluoromethyl-2-
imidazolyl)phenoxy]-2-propanol dihydrochloride), CL 316243 (5-[(2R)-2-[[(2R)-2-(3-
Chlorophenyl)-2-hydroxyethyl]amino]propyl]-1,3-benzodioxole-2,2-dicarboxylic acid
disodium salt), dobutamine, formoterol, ICI 118,551 (±)-erythro-(S*,S*)-1-[2,3-(Dihydro-
7-methyl-1H-inden-4-yl)oxy]-3-[(1-methylethyl)amino]-2-butanol hydrochloride), KT 5720
(9R,10S,12S)-2,3,9,10,11,12-Hexahydro-10-hydroxy-9-methyl-1-oxo-9,12-epoxy-1H-
diindolo[1,2,3-fg:3',2',1'-kl]pyrrolo[3,4-i][1,6]benzodiazocine-10-carboxylic acid, hexyl
ester), LY 294002 (2-(4-morpholinyl)-8-phenyl-4H-1-benzopyran-4-one), PD 98059 (2’-
amino-3’-methoxyflavone), propranolol and wortmannin were obtained from Tocris Bioscience
(Bristol, UK). Casein, 3-isobutyl-1-methylxanthine (IBMX), N′,N′-dimethylcasein, pertussis
toxin, protease inhibitor cocktail, phosphatase inhibitor cocktail 2, horseradish peroxidase
conjugated ExtrAvidin® (ExtrAvidin-HRP), Fluorescein isothiocyanate-conjugated ExtrAvidin®
(ExtrAvidin-FITC and Triton™ X-100 was obtained from Sigma-Aldrich Company Ltd.
(Gillingham, UK). The TG2 inhibitors Z-DON (Z-DON-Val-Pro-Leu-OMe; Benzyloxycarbonyl-
(6-Diazo-5-oxonorleucinyl)-L-valinyl-L-prolinyl-L-leucinmethylester) and R283
(1,3,dimethyl-2[2-oxo-propyl]thio)imidazole chloride) along with purified standard guinea-
pig liver TG2 were obtained from Zedira GmbH (Darmstadt, Germany). Biotin-TVQQEL was
purchased from Pepceuticals (Enderby, UK). Biotin cadaverine (N-(5-aminopentyl)
biotinamide) and biotin-X-cadaverine (5-([(N-
(biotinoyl)amino)hexanoyl]amino)pentylamine) were purchased from Invitrogen UK
(Loughborough, UK). DAPI (2-[4-(Aminoiminomethyl)phenyl]-1H-Indole-6-carboximidamide
hydrochloride) was from Vector Laboratories Inc (Peterborough, UK). Coomassie blue
Page 6
(InstantBlue™ stain) was purchased from Expedeon (Swavesey, UK). Fluo-8 AM was
purchased from Stratech Scientific Ltd (Newmarket, UK). Rp-cAMPs (adenosine 3’,5’-cyclic
monophosphorothioate, 8-chlro, Rp-isomer) was from Calbiochem (San Diego, CA, USA).
Dulbecco’s modified Eagle’s medium (DMEM), foetal bovine serum, trypsin (10X), L-
glutamine (200 mM), penicillin (10,000 U/ml)/streptomycin (10,000 g/ml) were purchased
from Lonza (Castleford, UK). All other reagents were purchased from Sigma-Aldrich Co Ltd
(Gillingham, UK) and were of analytical grade. Antibodies were obtained from the following
suppliers: monoclonal phospho-specific ERK1/2 (Thr202/Tyr204) from Sigma-Aldrich;
polyclonal phospho-specific PKB (Ser473), polyclonal total unphosphorylated PKB, monoclonal
total unphosphorylated ERK1/2, polyclonal total unphosphorylated c-Jun N-terminal kinase
(JNK), polyclonal total unphosphorylated p38 mitogen-activated protein kinase (p38 MAPK),
monoclonal phospho-specific p38 MAPK, monoclonal phospho-specific JNK, and polyclonal
anti-cleaved caspase 3 from New England Biolabs (UK) Ltd (Hitchin, UK); monoclonal anti-
transglutaminase 2 (CUB 7402) from Thermo Scientific (Loughborough, UK); polyclonal
antibodies recognising phosphoserine and phosphothreonine from Abcam (Cambridge, UK).
2.2. Cell culture
Rat embryonic cardiomyoblast-derived H9c2 cells were obtained from the European Collection
of Animal Cell Cultures (Porton Down, Salisbury, UK). These cells, derived from embryonic rat
heart tissue (Kimes and Brandt, 1976), are increasingly used as an in vitro model for
studies exploring cardioprotection, since they display similar morphological,
electrophysiological and biochemical properties to primary cardiac myocytes (Hescheler et
al., 1991). Cells were cultured in 75 cm2 flasks in DMEM supplemented with 2 mM L-
glutamine, 10% (v/v) foetal bovine serum and penicillin (100 U/ml)/streptomycin (100
g/ml). Cells were maintained at 37°C in a humidified 5% CO2 atmosphere until confluency
and sub-cultured (1:10 split ratio) using trypsin (0.05% w/v)/EDTA (0.02% w/v).
Page 7
2.3. RT-PCR analysis of β1, β2 and β3-adrenoceptor mRNA expression
Total RNA was isolated from mitotic H9c2 cells, rat heart and rat lung using a GenElute™
mammalian total RNA isolation miniprep kit (Sigma-Aldrich Company Ltd, Gillingham, UK)
according to the manufacturer’s instructions. First strand complementary DNA (cDNA) was
synthesized utilising random primers and M-MLV reverse transcriptase (Promega,
Southampton, UK). PCR was performed using the following gene-specific primer sequences:
β1-adrenoceptor (599 bp cDNA product) forward 5´-TACTCCTGGCGCTCATCGT-3´ and
reverse 5´- CTCGCAGCTGTCGATCTTC-3´; β2-adrenoceptor (323 bp cDNA product) forward
5´- AGCCACACGGGAATGACAG-3´ and reverse 5´-CCAGAACTCGCACCAGAA-3´; β3-
adrenoceptor (724 bp cDNA product) forward 5´-AGTCCTGGTGTGGATCGTG-3´ and reverse
5´- ACGCTCACCTTCATAGCCAT-3´; GAPDH (392 bp cDNA product) forward 5´-
CAAGTTCAACGGCACAGTCA-3´and reverse 5´- GAGTGGCAGTGATGGCATG-3´. PCR
conditions for the β1, β2 and β3-adrenoceptor and GAPDH were 40 cycles of 94oC for 1 min,
59oC for 1.5 min, and 72oC for 1 min. RT-PCR products were analysed by using 1.5% (w/v)
agarose gel electrophoresis and visualised by ethidium bromide staining.
2.4. cAMP accumulation assay
H9c2 cells (5000 cells/well) were seeded on a white 96 well microtitre plate, with clear-
bottomed wells (Fisher Scientific, Loughborough, UK) and cultured for 24 h in fully
supplemented DMEM. The medium was removed and the monolayer treated with a range of
concentrations of formoterol for 20 min in serum-free DMEM (40 µl/well) in the presence of
20 mM MgCl2 and 500 µM IBMX. Following stimulation, cAMP levels within cells were
determined using the cAMP-Glo™ Max Assay kit (Promega UK, Southampton, UK). Briefly,
10 µl of cAMP detection solution were added to all wells and incubated for 20 min at room
temperature. After incubation, Kinase-Glo® reagent (50 µl/well) was added and incubated
for 10 min at room temperature, following which luminescence levels across the plate were
Page 8
read using a plate-reading FLUOstar Optima luminometer (BMG Labtech Ltd, Aylesbury,
UK). Forskolin (10 µM) was used as a positive control and the luminescence values were
converted to cAMP levels using a cAMP standard curve (0-100 nM), according to the
manufacturer’s instructions.
2.5. Transglutaminase activity assays
Time course profiles and concentration-response curves were obtained for formoterol.
Where appropriate, cells were also pre-incubated for 30 min in a medium with or without
the protein/lipid kinase inhibitors Rp-cAMPs (PKA, 50 µM; de Wit et al., 1984), KT 5720
(PKA, 5 µM; Kase et al., 1987), PD 98059 (MEK1/2, 50 µM; Dudley et al., 1995), LY
294002 (PI-3K, 30 µM; Vlahos et al., 1994), wortmannin (PI-3K; 100 nM; Arcaro and
Wymann, 1993) and AS 605240 (PI-3K; 1 µM; Camps et al., 2005) prior to treatment with
1 µM formoterol. Following stimulation, cells were rinsed twice with 2.0 ml of chilled PBS,
lysed with 500 μl of ice-cold lysis buffer (50 mM Tris-HCl pH 8.0, 0.5% (w/v) sodium
deoxycholate, 0.1% (v/v) protease inhibitor cocktail, and 1% (v/v) phosphatase inhibitor
cocktail 2 and 3). Cell lysates were clarified by centrifugation at 4°C for 10 min at 14,000 x
g prior to being assayed for TG activity, as described below. Protein was determined using
the bicinchoninic acid (BCA) protein assay (Smith et al., 1985), using a commercially
available kit (Sigma-Aldrich Co. Ltd), with bovine serum albumin (BSA) as the standard.
Biotin-labelled cadaverine incorporation assays were performed according to Slaughter et
al. (1992) with the modifications reported by Lilley et al. (1998). Briefly, 96-well microtitre
plates were coated overnight at 4°C with 250 µl of N′,N′-dimethylcasein (10 mg/ml in
100 mM Tris-HCl, pH 8.0). The plate was washed twice with distilled water, blocked with
250 μl of 3% (w/v) BSA in 100 mM Tris-HCl, pH 8.0 and incubated for 1 h at room
temperature. The plate was washed twice before the application of 150 µl of either 6.67 mM
calcium chloride or 13.3 mM EDTA (used to check background TG2 activity) assay buffer
containing 225 µM biotin-cadaverine (a widely used substrate to monitor TG amine
Page 9
incorporating activity) and 2 mM 2-mercaptoethanol. The reaction was started by the
addition of 50 μl of samples, positive control (50 ng/well of guinea-pig liver TG2) and/or
negative control (100 mM Tris-HCl, pH 8.0). After incubation for 1 h at 37°C, plates were
washed as before. Then, 200 μl of 100 mM Tris-HCl pH 8.0 containing 1% (w/v) BSA and
ExtrAvidin®-HRP (1:5000 dilution) were added to each well and the plate incubated at 37°C
for 45 min; it was then washed as before. The plate was developed with 200 μl of freshly
prepared developing buffer (7.5 µg/ml 3, 3´, 5, 5´-tetramethylbenzidine and 0.0005%
(v/v) H2O2 in 100 mM sodium acetate, pH 6.0) and incubated at room temperature for 15
min. The reaction was terminated by adding 50 μl of 5.0 M sulphuric acid and the
absorbance read at 450 nm. One unit of TG2 was defined as a change in absorbance of one
unit/h. Each experiment was performed in triplicate.
Biotin-labelled peptide cross-linking assay was performed according to the method of
Trigwell et al. (2004) with minor modifications. Microtitre plates (96-well) were coated and
incubated overnight at 4°C with casein at 1 mg/ml in 100 mM Tris-HCl pH 8.0 (250 μl per
well). The wells were washed twice with distilled water, before incubation at room
temperature for 1 h with 250 μl of blocking solution (100 mM Tris-HCl pH 8.0 containing 3%
(w/v) BSA). The plate was washed twice before the application of 150 µl of either 6.67 mM
calcium chloride or 13.3 mM EDTA assay buffer containing 5 μM biotin-TVQQEL and 2 mM 2-
mercaptoethanol. Starting of reactions, positive and negative controls, reaction
development and termination were as described above for biotin-cadaverine assay. One unit
of TG2 was defined as a change in absorbance of one unit/h. Each experiment was
performed in triplicate.
2.6. Western blot analysis
H9c2 cells were grown in 25 cm2 flasks and when 80-90% confluent placed in serum free
DMEM medium for 16 h. Serum-starved cells were then washed once with PBS (pH 7.4) and
where appropriate incubated for 30 min in medium with or without the protein/lipid kinase
Page 10
inhibitors as described above, prior to treatment with 1 µM formoterol. Following treatment
cells were washed twice with PBS and lysed (300 µl) with boiling 0.5% (w/v) SDS in Tris.
Protein samples (15-20 µg) were separated by SDS-PAGE in 10% (w/v) polyacrylamide gels
using a Bio-Rad Mini Protean III system. Proteins were transferred to nitrocellulose
membranes in a Bio-Rad Trans-Blot system, using electro-transfer buffer comprising 25 mM
Tris, 192 mM glycine pH 8.3 and 20% (v/v) MeOH. Following transfer, the membranes were
blocked and probed with antibodies as described by Almami et al., (2014). The primary
antibodies (1:500 dilutions unless otherwise indicated) used were phospho-specific ERK1/2
(1:1000), phospho-specific PKB, phospho-specific p38 MAPK, phospho-specific JNK, and
cleaved active caspase 3, GAPDH and TG2. Horseradish peroxidase-conjugated secondary
antibodies (New England Biolabs (UK) Ltd), diluted 1:1000 in blocking buffer, were applied
for 2 h at room temperature. Following removal of the unbound secondary antibody, blots
were extensively washed and developed using the Enhanced Chemiluminescence (ECL)
Detection System (Uptima, Interchim, France) and quantified by densitometry using
Advanced Image Data Analysis Software (Fuji; version 3.52). Samples were also analysed
using primary antibodies that recognise total ERK1/2, PKB, p38 MAPK and JNK (1:1000) in
order to confirm the uniformity of protein loading.
2.7. Measurement of in situ TG2 activity
H9c2 cells were seeded on 8-well chamber slides (15,000 cells/well) and cultured for 24 h in
fully supplemented DMEM. The cells were then incubated for 6 h in medium containing 1
mM biotin-X-cadaverine (a cell permeable TG2 substrate; Perry et al., 1995) before
experimentation. Where appropriate, cells were treated for 1 h with TG2 inhibitors Z-DON
(150 µM) or R283 (200 µM) before the addition of 1 µM formoterol. Following stimulation,
cells were fixed with 3.7 % (w/v) paraformaldehyde and permeabilised with 0.1% (v/v)
Triton™ X-100, both in PBS, for 15 min at room temperature. After washing, cells were
blocked with 3% (w/v) BSA for 1 h at room temperature and the transglutaminase-
Page 11
mediated biotin-X-cadaverine labelled protein substrates detected by incubation with FITC-
conjugated ExtrAvidin® (1:200 v/v). Nuclei were stained with DAPI and images acquired
using a Leica TCS SP5 II confocal microscope (Leica Microsystems, GmbH, Manheim,
Germany) equipped with a 20x air objective. Optical sections were typically 1-2 µm and the
highest fluorescence intensity values were acquired and fluorescence intensity relative to
DAPI stain quantified for each field of view. Image analysis and quantification were carried
out using Leica LAS AF software.
2.8. Measurement of intracellular calcium
H9c2 cells were plated in 24-well flat-bottomed plates (15,000 cells/well) and cultured for
24 h in fully supplemented DMEM. Cells were loaded with Fluo-8 AM (5 µM, 30-40 min)
before mounting on the stage of a Leica TCS SP5 II confocal microscope (Leica
Microsystems, GmbH, Manheim, Germany) equipped with a 20x air objective. Cells were
incubated at 37°C using a temperature controller and micro incubator (The Cube, Life
Imaging Services, Basel, Switzerland) in the presence of imaging buffer (134 mM NaCl 134,
6 mM KCl 6, 1.3 mM CaCl2 1 mM MgCl2 1, 10 mM HEPES, and 10 mM glucose 10; pH 7.4).
Using an excitation of 490 nm, emissions over 514 nm were collected. Cells were imaged
and data collected every 1.7 s for 10 min. Increases in intracellular Ca2+ were defined as
F/F0 where F was the fluorescence at any given time, and F0 was the initial basal level of
fluorescence.
2.9. Determination of TG2 phosphorylation
Following stimulation, H9c2 cells were rinsed twice with 2.0 ml of chilled PBS and lysed with
500 μl of ice-cold lysis buffer (2 mM EDTA, 1.5 mM MgCl2, 10% (v/v) glycerol, 0.5% (v/v)
IGEPAL, 0.1% (v/v) protease inhibitor cocktail, and 1% (v/v) phosphatase inhibitor cocktail
2 and 3 in PBS). Cell lysates were clarified by centrifugation (4°C for 10 min at 14000 x g),
after which 500 µg of supernatant protein were incubated overnight at 4°C with 2 µg of
Page 12
anti-TG2 monoclonal antibody or IgG. Immune complexes were precipitated using Pierce™
Classic Magnetic IP/Co-IP Kit (Fisher Scientific, Loughborough, UK). The precipitates were
resolved by SDS-PAGE in 10% polyacrylamide gels, transferred to nitrocellulose membrane
filters and probed using anti-phosphoserine or anti-phosphothreonine antibodies (1:1000).
Antibody reactivity was visualised by ECL and quantified densitometrically, as described
above.
2.10. Measurement of biotin-X-cadaverine incorporation into proteins serving as
substrates for TG2
Cellular proteins acting as substrates for endogenous TG2-catalysed polyamine
incorporation reactions were investigated as described by Singh et al. (1995). Biotin-X-
cadaverine labelled proteins were enriched using CaptAvidin™-agarose sedimentation beads
(Life Technologies, Loughborough, UK), subjected to SDS-PAGE in 4-15% polyacrylamide
gradient gels and separated proteins stained with Coomassie blue.
2.11. Proteomic analysis of TG2 biotin-X-cadaverine labelled substrate proteins
Following pre-treatment with 1 mM biotin-X-cadaverine, H9c2 cells were treated with
formoterol and lysed as described above. The proteins labelled with biotin-X-cadaverine
were purified using CaptAvidin™-agarose and biotin-X-cadaverine labelled proteins were
processed for trypsin digestion (Trypsin, proteomics grade; Sigma-Aldrich, UK).
Samples (~50 µg protein) were reduced and alkylated (1 µl 0.5 M DTT, 56° C for 20 min;
2.7 µl 0.55 M iodoacetamide, room temperature 15 min in the dark), dried in a vacuum
concentrator (Eppendorf, UK) and resuspended in 100 µl 50 mM tri-ethyl ammonium
bicarbonate (TEAB). Trypsin (2 µg in 2 µl of 1 mM HCl), was added in and incubated
overnight at 37° C in a thermomixer. Samples were then evaporated to dryness in a
vacuum concentrator and resuspended in 5% (v/v) acetonitrile/0.1% (v/v) formic acid (20
µl) and transferred to a HPLC vial for MS analysis. Samples (3 µl) were injected by
Page 13
autosampler (Eksigent nanoLC 425 LC system) at 5 µl/min directly onto a YMC Triart-C18
column (25 cm, 3 µm, 300 µm i.d.) using gradient elution (2-40% Mobile phase B, followed
by wash at 80% B and re-equilibration) over either 110 (120 min run time) min (for
spectral library construction using data/information dependent acquisition DDA/IDA) or 50
min (60 min run time) for SWATH/DIA (Data Independent Acquisition) analysis (Gillet et al.,
2012; Huang et al., 2015). Mobile phases consisted of A: 2% (v/v) acetonitrile, 5% (v/v)
DMSO in 0.1% (v/v) formic acid; B: acetonitrile containing 5% (v/v) DMSO in 0.1% (v/v)
formic acid.
A spectral library was constructed using the output from ProteinPilot 5 (SCIEX) combining
four IDA runs per group (Control, formoterol treated), filtered, and aligned to spiked-in iRT
peptides (Biognosys, Switzerland) using PeakView 2.2 (SCIEX) and the SWATH micro app
2.1 plug in. SWATH data extraction, quantitation and fold change analysis were carried out
using SCIEX OneOmics cloud processing software (Lambert et al., 2013).
2.12. Data analysis
All graphs and statistics (one-way ANOVA followed by Dunnett’s multiple comparison test
and two-way ANOVA for group comparison) were performed using GraphPad Prism®
software (GraphPad 7.0 Software, Inc., USA). Agonist EC50 values (concentration of agonist
producing 50% of the maximal stimulation) were obtained by computer-assisted curve
fitting using GraphPad Prism® software. Agonist p[EC50] values were subsequently
calculated as the negative logarithm to base 10 of the EC50. Results represent mean ±
S.E.M. and p values <0.05 were considered statistically significant.
Page 14
3. Results
3.1. Functional expression of the β2-adrenoceptor in H9c2 cells
In this study the expression of mRNA encoding for β1, β2 and the β3-adrenoceptors was
determined in H9c2 cells by RT-PCR analysis. As shown in Fig. 1, mRNA was detected for all
three β-adrenoceptor subtypes with a rank order of β2 β1 = β3. The selective β2-
adrenoceptor agonist formoterol (EC50 = 1.3 0.3 nM; p[EC50] = 8.9 0.1; n=3) stimulated
a robust and pertussis toxin-insensitive increase in cAMP, confirming the functional
expression of the β2-adrenoceptor in H9c2 cells via Gs-protein coupling (Fig. 2A).
Formoterol-induced cAMP responses were blocked by the non-selective β-adrenoceptor
antagonist propranolol (1 µM) and the selective β2-adrenoceptor antagonist ICI 118,551 (1
µM), whereas the selective β1-adrenoceptor antagonist CGP 20712 (1 µM) had no effect
(Fig. 2B). Due to the lack of a selective β1-adrenoceptor agonist, the functional expression
of this subtype was assessed by determining the effect of the β1-adrenoceptor antagonist
CGP 20712 on dobutamine (non-selective β1 and β2 agonist)-induced cAMP accumulation.
Dobutamine-induced cAMP responses were blocked by propranolol and ICI 118,551,
whereas CGP 20712 had no effect (Fig. 2C). The selective β3-adrenoceptor agonist CL
316243 (1 µM) did not trigger a measureable increase in cAMP accumulation, suggesting
that this subtype is not functionally expressed H9c2 cells (data not shown). Overall these
data suggest functional expression of the β2-adrenoceptor (and neither β1- not β3-
adrenoceptors) in H9c2 cells.
3.2. Effect of β2-adrenoceptor activation on TG2-mediated biotin cadaverine amine
incorporation and protein cross-linking activity
Initial experiments investigated the effect of the β2-adrenoceptor agonist formoterol on TG2
transamidase activity in H9c2 cardiomyoblasts. TG2 catalyses two types of transamidation,
namely (i) intra-, and/or inter-molecular covalent cross-links between protein-bound
Page 15
glutamine and lysine residues, and (ii) cross-links between small molecule primary amines
and protein-bound glutamine (Nurminskaya and Belkin, 2012). H9c2 cells were treated with
formoterol (100 nM) for varying times and cell lysates subjected to the biotin cadaverine
amine-incorporation assay (Slaughter et al., 1992). Formoterol produced increases in TG2-
catalysed biotin-cadaverine incorporation activity, peaking at 20 min (Fig. 3A). Furthermore,
formoterol (EC50 = 15 2.3 nM; p[EC50] = 7.85 0.09; n=4; Fig. 3C) stimulated
concentration-dependent increases in biotin-cadaverine incorporation activity. The effect of
β2-adrenoceptor activation on TG2-mediated protein cross-linking activity in H9c2 cells was
also determined using the biotin-labeled peptide (biotin-TVQQEL) cross-linking assay
(Trigwell et al., 2004). Formoterol (Fig. 3B) triggered time-dependent increases in TG2-
mediated protein cross-linking activity peaking at 20 min. Formoterol (EC50 = 27 11 nM;
p[EC50] = 7.69 0.15; n=4; Fig. 3D) also stimulated concentration-dependent increases in
protein cross-linking activity. It is worth noting that levels of TG2 protein expression did not
significantly change following stimulation with formoterol (data not shown). Although the β2-
adrenoceptor couples to Gs and Gi proteins (Daaka et al., 1997; Zamah et al., 2002), pre-
treatment with pertussis toxin (Gi/o-protein blocker; 100 ng/ml) for 16 h had no significant
effect on formoterol-induced TG2 activity (Fig. 3E and F). Finally, ICI 118,551 and
propranolol blocked formoterol-induced TG2 activity (Fig. 4A and B).
3.3. The effect of TG2 inhibitors on β2-adrenoceptor-induced TG2 activity
To confirm that TG2 is responsible for the β2-adrenoceptor induced transglutaminase
activity in H9c2 cardiomyocytes, two structurally different cell permeable TG2 specific
inhibitors were tested; R283 (a small molecule; Freund et al., 1994) and Z-DON (peptide-
based; Schaertl et al., 2010). Although these TG2 inhibitors are cell-permeable, inhibition of
cellular TG2 is only achievable at concentrations significantly above their IC50 value versus
purified enzyme (Schaertl et al., 2010; Freund et al., 1994). H9c2 cells were pre-treated for
1 h with Z-DON (150 µM) or R283 (200 µM) prior to stimulation with formoterol (1 µM) for
Page 16
20 min. Both inhibitors blocked formoterol-induced TG-mediated amine incorporation (Fig.
4C) and peptide cross-linking activity (Fig. 4D), confirming the involvement of TG2.
3.4. The role of Ca2+ in β2-adrenoceptor- induced TG2 activity
Since TG2 is a Ca2+-dependent enzyme we determined the role of Ca2+ in β2-adrenoceptor-
induced TG2 activation. The role of extracellular Ca2+ was assessed by measuring TG2
responses in the absence of extracellular Ca2+ using nominally Ca2+-free Hanks/HEPES
buffer containing 0.1 mM EGTA. Removal of extracellular Ca2+ partially attenuated
formoterol-induced TG2 activity (Fig. 4E and F). To assess the role of intracellular Ca2+,
measurements of TG2 activation were also performed using cells pre-incubated with the
Ca2+ chelator BAPTA-AM (50 µM for 30 min) in the absence of extracellular Ca2+. Loading
cells with BAPTA in the absence of extracellular Ca2+ did not lead to further inhibition of
formoterol-induced TG2 activation (Fig. 4E and F). These observations suggest that β2-
adrenoceptor-induced TG2 activation is partially dependent upon the influx of extracellular
Ca2+. We have previously measured A1 adenosine receptor-induced changes in intracellular
Ca2+ in H9c2 cells using the fluorescent Ca2+ indicator Fluo-8 (Vyas et al., 2016). In this
study, formoterol did not trigger measurable increases in intracellular Ca2+ in H9c2 cells
loaded with Fluo-8 AM (data not shown).
3.5. The effect of protein and lipid kinase inhibitors on β2-adrenoceptor-induced
TG2 activity
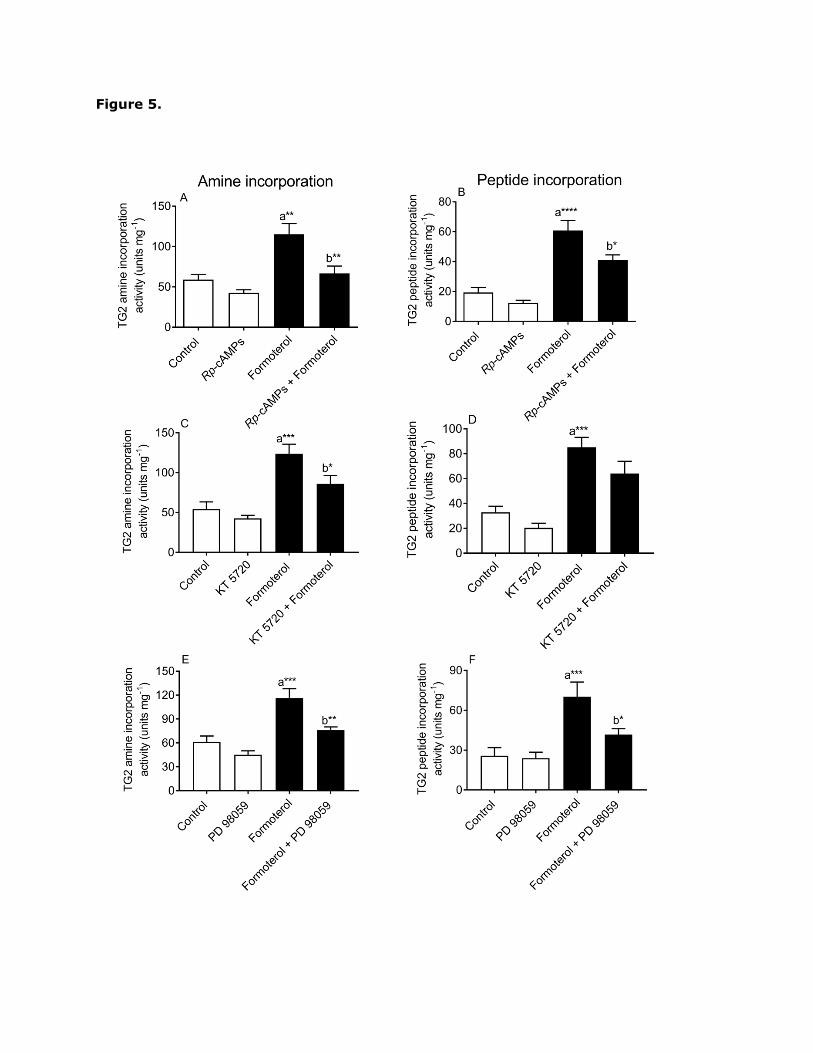
Since the β2-adrenoceptor activates PKA, the effect of two structurally different PKA
inhibitors, Rp-cAMPs (de Wit et al., 1984) and KT-5720 (Kase et al., 1987), on formoterol-
induced TG2 activity was assessed. Pre-treatment with Rp-cAMPs (50 µM; Fig. 5A and B)
and KT 5720 (5 µM; Fig. 5C and D) partially attenuated formoterol-induced TG-mediated
amine incorporation and protein cross-linking activity, suggesting the involvement of PKA.
However, the effect of KT 5720 on protein cross-linking activity was not statistically
Page 17
significant. Overall, these data indicate that PKA-dependent pathway(s) play a role in β2-
adrenoceptor-induced TG2 activity.
We have recently shown that the Gi-protein coupled A1 adenosine receptor stimulates
TG2 activity in H9c2 cells via a number of protein kinases (e.g. PKC, ERK1/2, p38 MAPK and
JNK1/2; Vyas et al., 2016). The β2-adrenoceptor also triggers the activation of signalling
cascades involving ERK1/2, p38 MAPK, JNK1/2 and PKB (Daaka et al., 1997; Okamoto et
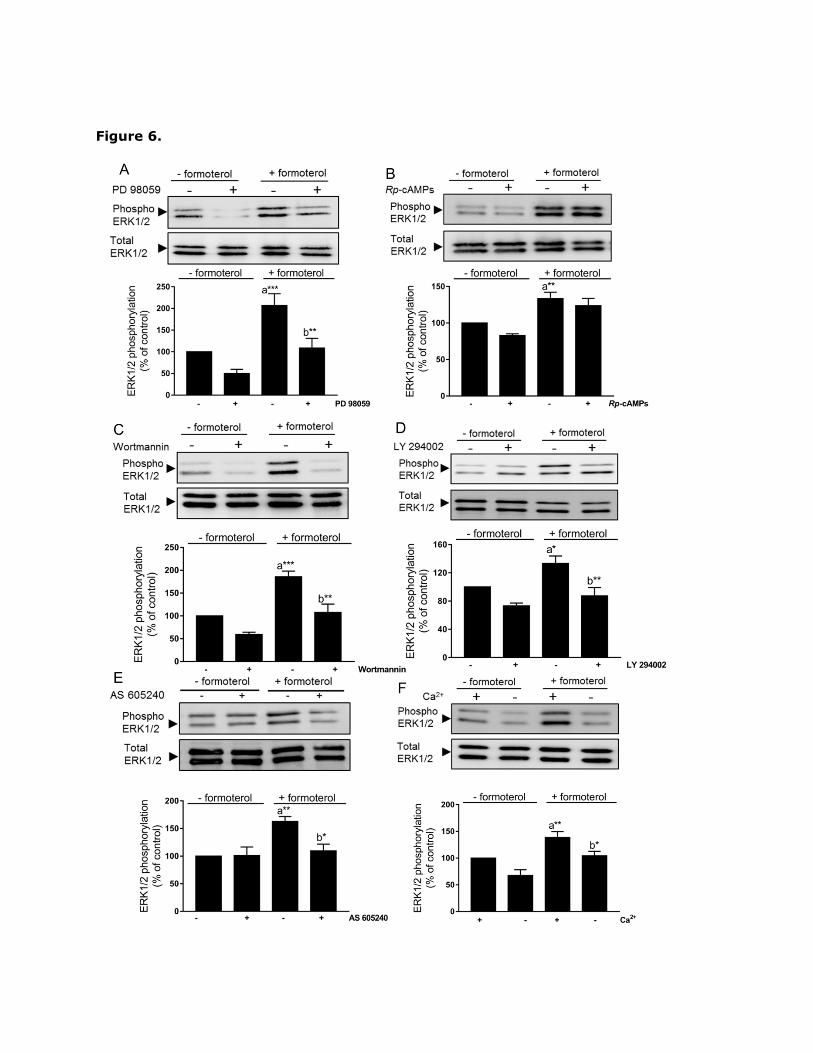
al., 1991; Steinberg, 1999; Yano et al., 2007). Modulation of ERK1/2, p38 MAPK, JNK1/2 and
PKB activity following β2-adrenoceptor activation was assessed in H9c2 cells by Western
blotting using phospho-specific antibodies that recognise phosphorylated motifs within
activated ERK1/2 (pTEpY), p38 MAPK (pTGpY), JNK1/2 (pTPpY) and PKB (pS473). Formoterol
(1 µM for 20 min) stimulated significant increases in ERK1/2 (Fig. 6) and PKB phosphorylation
(data not shown for clarity) in H9c2 cells. In contrast, formoterol did not stimulate p38 MAPK
or JNK1/2 activation (data not shown). As expected, pre-treatment with PD 98059 (50 µM;
MEK1 inhibitor) blocked formoterol-induced activation of ERK1/2 (Fig. 6A). Treatment with
PD 98059 (50 µM) also blocked formoterol-induced induced TG-mediated amine
incorporation activity and protein cross-linking activity, suggesting a role for ERK1/2 in
regulating these activities (Fig. 5E and F).
PI-3K plays a prominent up-stream role in β2-adrenoceptor-induced modulation of
ERK1/2 and PKB (Zhang et al., 2011). In this study the pan PI-3K inhibitors wortmannin
(100 nM; Fig. 7A and B) and LY 294002 (30 µM; Fig. 7C and D) blocked formoterol-induced
TG2 activity. Furthermore, the selective PI-3K inhibitor AS 605240 (1 µM) also blocked
formoterol-induced TG2 activity (Fig. 7E and F).
Given the role of ERK1/2, PI-3K and extracellular Ca2+ in formoterol-induced TG2
activation, we assessed whether PI-3K and extracellular Ca2+ play an up-stream role in
ERK1/2 activation. Wortmannin, LY 294002, AS 605240 or removal of extracellular Ca2+
attenuated formoterol-induced ERK1/2 activation (Fig. 6). In contrast, Rp-cAMPs (Fig. 6B)
and pertussis toxin (data not shown) had no significant effect on formoterol-induced ERK1/2
Page 18
activation. These data suggest formoterol activates ERK1/2 via a PKA-independent but PI-
3K and Ca2+-dependent pathway.
It is important to note that KT-5720, Rp-cAMPs, PD 98059, LY 294002, and AS 605240
had no significant effect on purified guinea pig liver TG2 activity (data not shown). Overall,
these data suggest that TG2 activity is modulated in H9c2 cells by the β2-adrenoceptor via a
pathway involving PKA, ERK1/2 and PI-3K.
3.6. Visualisation of in situ TG2 activity following β2-adrenoceptor activation
Biotin-X-cadaverine, a cell penetrating biotin-labelled primary amine, acts as the acyl-
acceptor in intracellular TG2-mediated transamidating reactions and becomes incorporated
into endogenous protein substrates of TG2, which can subsequently be visualised by
reporters such as FITC- and HRP-ExtrAvidin® (Lee et al., 1993). H9c2 cells were pre-
incubated with 1 mM biotin-X-cadaverine for 6 h at 37°C prior to treatment with formoterol
for 1, 5, 10, 20, 30 and 40 min. After fixation and permeabilisation, intracellular proteins
with covalently attached biotin-X-cadaverine were visualized using FITC-ExtrAvidin®. As
shown in Fig. 8A, formoterol (100 nM) induced a time-dependent increase in the
incorporation of biotin-X-cadaverine into endogenous protein substrates of TG2. These data
are comparable to the time-dependent increases in TG2 activity observed in vitro (see Fig.
3). Formoterol-mediated biotin-X-cadaverine incorporation was also concentration-
dependent (EC50 = 47 27 nM; p[EC50] = 7.65 0.27; n=4; Fig. 8B). To confirm the
involvement of TG2 activation, cells were treated with the TG2 inhibitors Z-DON (150 µM)
and R283 (200 µM) for 1 h prior to incubation with formoterol (1 µM) for 20 min. Pre-
treatment of cells with Z-DON and R283 resulted in the complete inhibition of formoterol-
mediated biotin-X-cadaverine incorporation into protein substrates (Fig. 9A). The in situ
responses to formoterol were attenuated by inhibitors of PKA (KT 5720 and Rp-cAMPs), PI-
3K (LY 294002 and AS 605240) and MEK1 (PD 98059) and following removal of
extracellular Ca2+ (Fig. 9).
Page 19
3.7. β2-adrenoceptor-induced TG2 phosphorylation
The effect of formoterol on TG2 phosphorylation was examined via immunoprecipitation of
TG2, followed by SDS-PAGE and Western blot analysis using anti-phosphoserine and anti-
phosphothreonine antibodies. As shown in Fig. 10, formoterol (1 µM) enhanced TG2-bound
phosphoserine and phosphothreonine. Pre-treatment with Rp-cAMPs (50 µM), PD 98059 (50
µM) and AS 605240 (1 µM) attenuated formoterol-induced TG2 phosphorylation (Fig. 10
and 11). Finally, removal of extracellular Ca2+ attenuated formoterol-induced TG2 activity
(Fig. 11). Formoterol-induced increases in TG2 phosphorylation were also blocked by the
pan PI-3K inhibitors wortmannin and LY 294002 (data not shown).
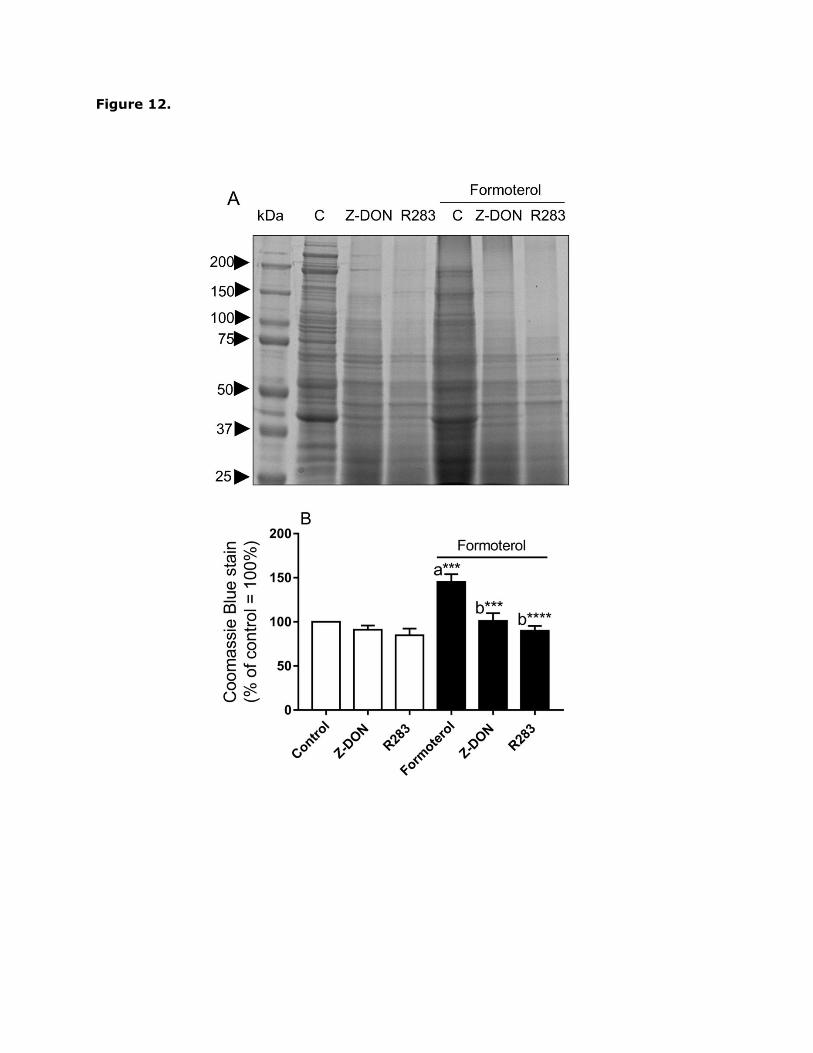
3.8. Identification of biotin-X-cadaverine labelled protein substrates
Following stimulation with formoterol (1 µM for 20 min), cell extracts from biotin-X-
cadaverine labelled cells were enriched using CaptAvidin™-agarose sedimentation beads,
resolved by SDS-PAGE on 4-15% polyacrylamide gradient gels and visualised using
Coomassie blue stain (Fig. 12). As shown in Fig. 12A, the intensity of some proteins bands
eluted from the CaptAvidin™-agarose beads increased following stimulation with formoterol
(1 µM) which may be indicative of TG2-mediated transamidation and/or altered interactions
with TG2 substrate binding partners. Furthermore, pre-treatment with Z-DON and R283
attenuated the levels of eluted proteins (Fig. 12). However, it is notable that the intensity of
several protein bands also decreased following formoterol treatment, indicative of reduced
levels of transamidation and/or altered interactions with TG2 substrate binding partners. To
identify the proteins captured and eluted from CaptAvidin™-agarose beads, eluates were
analysed by SWATH-MS (Sequential Windowed Acquisition of All Theoretical Fragment Ion
Mass Spectra; Huang et al., 2015). This technique allows quantification of mass
spectrometry data and the results presented are shown as formoterol-induced fold-changes
in proteins eluted from CaptAvidin™-agarose compared to control unstimulated cells. SWATH
analysis revealed increases in eight proteins not previously identified as TG2 protein
Page 20
substrates and five known substrates in response to β2-adrenoceptor activation in H9c2 cells
(Table 1). Interestingly, SWATH-MS analysis also identified proteins whose profile revealed
a decrease in formoterol treated cells when compared to untreated control cells (Table 1).
Further work is needed to determine whether these changes represent altered
transamidation and/or interactions with TG2 substrate binding partners.
Page 21
4. Discussion
In this study, we have established for the first time that the β2-adrenoceptor triggers robust
increases in TG2 transamidation activity in H9c2 cells via a signalling pathway dependent
upon PKA, ERK1/2, PI-3K and extracellular Ca2+.
4.1. In vitro modulation of TG2 by the β2-adrenoceptor
Activation of the β2-adrenoceptor with formoterol triggered time- and concentration-
dependent increases in the amine incorporating and protein cross-linking activity of TG2. It
is notable that the potency in mediating biotin-cadaverine incorporation and protein cross-
linking is lower than for formoterol-stimulated cAMP accumulation. These differences may
be a consequence of biased agonism between agonist-induced cAMP accumulation versus
TG2 activation (Rajagopal et al., 2011). Alternatively, it may be a consequence of the
multiple signalling pathways e.g. PKA, ERK1/2, PI-3K, and Ca2+ shown to be required for
TG2 modulation.
4.2. Role of extracellular Ca2+ in β2-adrenoceptor-induced TG2 activation
Since the transamidating activity of TG2 is dependent upon Ca2+, we assessed the role of
extracellular and intracellular Ca2+ in β2-adrenoceptor-induced TG2 activation. Removal of
extracellular Ca2+ partially inhibited formoterol-induced TG2-mediated transamidation
activity. Surprisingly, formoterol did not trigger observable increases in intracellular [Ca2+]
in H9c2 cells loaded with Fluo-8 AM. At present the reason(s) for this discrepancy are
unclear but it may reflect very localized formoterol-induced increases in intracellular [Ca2+]
(as a consequence of Ca2+ influx) that, whilst sufficient to trigger TG2 activation, were not
detectable using the methodology employed. It is important to note that, although changes
in intracellular [Ca2+] required for TG2 activation are typically in the order 3-100 µM, there
is growing evidence that intracellular [Ca2+] can reach levels sufficient to activate TG2
(Király et al., 2011). Alternatively, the role of Ca2+ in formoterol-induced TG2 activation
Page 22
may be in the sensitization of TG2 to β2-adrenoceptor-mediated activation. For example,
interaction of TG2 with protein binding partners and/or membrane lipids have been
proposed to induce a conformational change that promotes activation at low levels of
intracellular [Ca2+] (Király et al., 2011). Clearly, further studies are required to determine
precisely how β2-adrenoceptor-induced TG2 activation occurs in the absence of detectable
increases in intracellular Ca2+, but the kinase-dependent pathways outlined in the present
study could be central to these novel aspects of TG2 regulation.
4.3. Role of PKA and ERK1/2 in β2-adrenoceptor-induced TG2 activation
The role of PKA and other protein/lipid kinases in formoterol-induced TG2 activation was
explored using appropriate pharmacological inhibitors. The PKA inhibitors Rp-cAMPs and KT
5720 attenuated formoterol-induced TG2 responses, suggesting a role for PKA. The MEK1/2
(up-stream activator of ERK1/2) inhibitor PD 98059 also attenuated formoterol-induced TG2
activation. These data are in agreement with the role of ERK1/2 in TG2 activation triggered
by the Gi-protein coupled A1 adenosine receptor (Vyas et al., 2016). The attenuation of
formoterol-induced TG2 responses by Rp-cAMPs and KT 5720 may be a consequence of the
up-stream role of PKA in β2-adrenoceptor-induced ERK1/2 activation (Schmitt and Stork,
2000). However, in H9c2 cells formoterol-induced ERK1/2 activation was insensitive to PKA
inhibition and therefore the role of PKA in TG2 activation appears to be independent of
ERK1/2. However, removal of extracellular Ca2+ and inhibition of PI-3K attenuated
formoterol-induced ERK1/2 activation. Although beyond the scope of the present study, it
would be of interest to investigate further the mechanism(s) underlying β2-adrenoceptor -
induced ERK1/2 activation in H9c2 cells.
PI-3K plays a prominent role in β2-adrenoceptor signalling (Zhang et al., 2011). In the
present study we have shown that formoterol-induced TG2 activity is sensitive to the pan
PI-3K inhibitors wortmannin and LY 294002 and the selective PI-3K inhibitor AS 605240.
Page 23
Overall, these observations suggest that PI-3K lies up-stream of ERK1/2 stimulation and
TG2 activation in H9c2 cells.
4.4. β2-adrenoceptor-induced phosphorylation of TG2
Given the apparent role of PKA and ERK1/2 in the regulation of TG2, we investigated the
phosphorylation status of TG2 following β2-adrenoceptor stimulation. The data obtained
demonstrate that TG2 is phosphorylated in response to β2-adrenoceptor activation.
However, it is important to state that the relationship between formoterol-induced TG2
phosphorylation and TG2 transamidase activity is not known. Further work is required to
determine if formoterol stimulated TG2 activation is dependent upon formoterol-induced
TG2 phosphorylation. It is notable that we have recently reported that TG2 is also
phosphorylated following stimulation of the A1 adenosine receptor in H9c2 cells (Vyas et al.,
2016). Hence, the modulation of TG2 phosphorylation may represent a common
downstream target of GPCR signalling. Previous studies have shown that TG2 is
phosphorylated by PKA at Ser215 and Ser216 (Mishra and Murphy, 2006). At present it is not
known if formoterol triggers TG2 phosphorylation at Ser215 and Ser216 . However, previous
studies have revealed that PKA-mediated phosphorylation of TG2 at these sites has several
potential consequences, including promotion of protein-protein interactions, enhancement of
TG2 kinase activity and inhibition of transamidating activity (Mishra and Murphy, 2006;
Mishra et al., 2007). In this study β2-adrenoceptor-induced PKA activation promoted TG2
transamidating activity. The attenuation of in vitro TG2 cross-linking activity by PKA
observed by Mishra et al. (2007) was achieved using histidine-tagged TG2 immobilized on
nickel-agarose and incubation with purified PKA. Hence, in vivo regulation of TG2 activity by
PKA may be influenced by interaction of TG2 with other proteins and/or lipids. Thus, further
studies are warranted in order to determine the consequence(s) of β2-adrenoceptor-induced
TG2 phosphorylation. In view of the multiple protein/lipid kinases (PKA, ERK1/2, PI-3K)
implicated in β2-adrenoceptor-induced TG2 activation, we investigated the influence of
Page 24
kinase inhibitors on TG2 phosphorylation. Formoterol-induced increases in TG2
phosphorylation were reduced following pharmacological inhibition of PKA, MEK1/2, PI-3K
and removal of extracellular Ca2+. Whilst the attenuation of TG2 phosphorylation following
PI-3K inhibition is most likely due to the upstream role of PI-3K in ERK1/2 activation, it is
conceivable that the protein kinase activity of PI-3K may directly phosphorylate TG2 (Hunter
1995; Naga Prasad et al., 2005). Further studies are required to establish if PKA, ERK1/2 or
indeed PI-3K directly catalyse the phosphorylation of TG2. Finally, removal of extracellular
Ca2+ attenuated formoterol-induced TG2 phosphorylation. These data may reflect the role of
extracellular Ca2+ in formoterol-induced ERK1/2 activation. Alternatively, it may be that
conformational changes in TG2 triggered by Ca2+ facilitate its subsequent phosphorylation
by PKA and/or ERK1/2. Conversely, it is also a possibility that TG2 phosphorylation may
sensitize TG2 to activation in the presence of low Ca2+ as discussed above. Further work to
identify the phosphorylation site(s) targeted following β2-adrenoceptor activation would be
worthwhile.
4.5. In situ β2-adrenoceptor-induced polyamine incorporation into protein
substrates
Intracellular polyamines e.g. spermine, spermidine, and putrescine can be covalently
attached onto proteins via TG2-mediated transamidation activity, resulting in the
incorporation of a positively charged group into the target protein. Thus, TG2-mediated
polyamination may promote changes in protein conformation, which could lead to
alterations in protein function (Yu et al., 2015). For example, the TG2-mediated
incorporation of polyamines into RhoA results in constitutive G-protein activity (Makitie et
al., 2009; Shin et al., 2008; Singh et al., 2001), whereas the incorporation of polyamines
into phospholipase A2 results in a 2-3 fold increase in enzymic activity (Cordella-Miele et al.,
1993). In the current study, in situ TG2 activity increased following stimulation of the β2-
adrenoceptor. These in situ responses were comparable to amine incorporation activity
Page 25
observed in vitro and were also sensitive to pharmacological inhibition of PKA, MEK1/2, PI-
3K and removal of extracellular Ca2+, confirming the role of these signalling pathways in β2-
adrenoceptor-induced TG2 activation. It is interesting to speculate that β2-adrenoceptor-
mediated incorporation of polyamines might regulate the function of a range of cellular
targets and may represent a new paradigm in β2-adrenoceptor signaling and regulation of
cellular function.
4.6. Identification of proteins in CaptAvidin™-agarose bead eluates
SWATHTM-MS analysis identified eight proteins not previously identified as TG2 protein
substrates (e.g. Protein S100-A6) and five known substrates (Table 1) in response to
formoterol stimulation. It is beyond the scope of the present discussion to describe the
biological functions/roles of all of these proteins but it is interesting to note that protein
S100-A6 is a Ca2+ binding protein that is known to interact with tropomyosin and actin
(Donato et al., 2013), and that several other identified proteins are cytoskeletal proteins
(e.g. actin, myosin, tropomyosin). Hence it is conceivable that TG2-mediated modulation of
protein S100-A6 function plays a role in β2-adrenoceptor-induced regulation of
cardiomyocyte contractility. Interestingly, recent studies have shown that TG2 plays a role
in oxytocin-induced contraction of human myometrium (Alcock et al., 2011).
Further interrogation of the SWATH data identified a large number of proteins (including
many whose function is linked with muscle contraction) that displayed a pronounced
decrease following treatment with formoterol indicative of altered levels of transamidation of
specific substrates and/or proteins interacting with them (Table 1). It is notable that TG2
can catalyse simultaneous transamidation and deamidation of heat shock protein 20 and
thus β2-adrenoceptor-induced activation may also promote the deamidation of TG2
substrates (Boros et al., 2006). Overall, these data have identified a large number of
proteins whose elution profile from CaptAvidin™-agarose beads changes markedly in
Page 26
formoterol treated cells. The challenge for future work will be to explore the role of such
TG2-mediated modifications in β2-adrenoceptor function and signalling.
At present very little is known of the in vivo regulation of TG2 in cardiomyocytes and how
such activity may alter under pathological conditions. Interestingly, TG2 knockout mice
display no significant change in haemodynamic parameters (heart rate, systolic and diastolic
blood pressure and contractility) when compared to non-transgenic animals (Nanda et al.,
2001). These observations suggest no significant role for TG2 in normal cardiovascular
function. More recent studies have demonstrated that TG2 mediates cell survival against
ischaemia/reperfusion injury by regulating ATP synthesis in cardiomyocytes derived from
TG2-/- knockout mice, suggesting a cardioprotective role for TG2 (Szondy et al., 2006).
Interestingly, increased levels of TG2 expression have been demonstrated in animal models
of cardiac hypertrophy (Iwai et al., 1995) and from heart failure patients (Hwang et al.,
1996). Furthermore, cardiac-specific over-expression of TG2 is associated with cardiac
hypertrophy, apoptosis and fibrosis (Small et al., 1999; Zhang et al., 2003). Overall, these
studies demonstrate a potential role for TG2 in cardiac pathology (Iismaa et al., 2009).
Regarding the increased levels of TG2 observed in heart failure patients it is interesting to
speculate that TG2 activation, as a consequence of the elevated levels of catecholamines
associated with heart failure, may contribute to the pathophysiology of heart failure.
Alternatively, TG2 activation under these conditions may play a protective role during heart
failure.
In conclusion, our data have revealed for the first time that activation of TG2 occurs by
the β2-adrenoceptor via a multi-protein kinase pathway. Work is currently underway to
explore further the function(s) of β2-adrenoceptor-induced TG2 activity in cardiomyocytes.
Conflict of interest
None declared
Page 27
Acknowledgements
We would like to thank Gordon Arnott for helping with confocal imaging.
Page 28
Figure legends
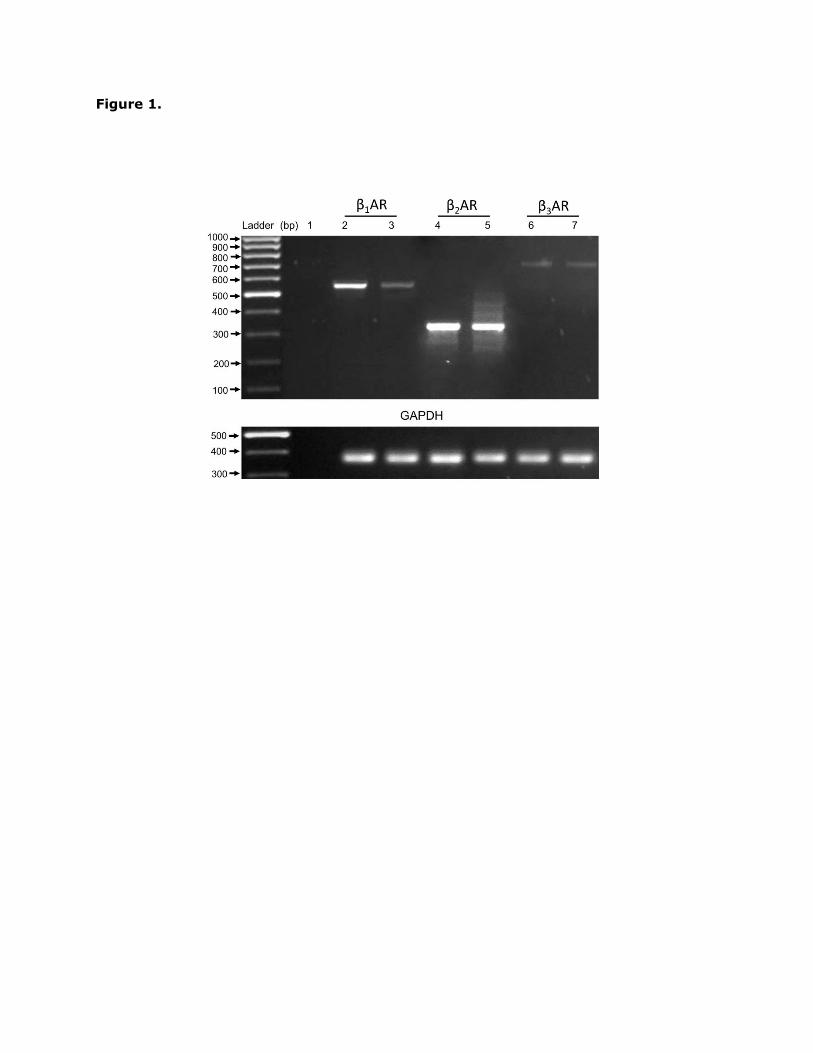
Fig. 1. β-adrenoceptor mRNA expression in H9c2 cells. mRNA isolated from H9c2 cells was
subjected to RT-PCR using intron spanning β1, β2 and β3-adrenoceptor gene specific primers.
mRNA samples isolated from rat heart (β1-adrenoceptor) and rat lung (β2 and β3-
adrenoceptor) were used as positive controls. L: 100 bp DNA standard; lane 1: no DNA
control; lanes 2, 4 and 6: positive control; lanes 3, 5 and 7: H9c2 cell-derived mRNA.
mRNA control using GAPDH primers is shown in the lower panel. The results presented are
representative of three independent experiments.
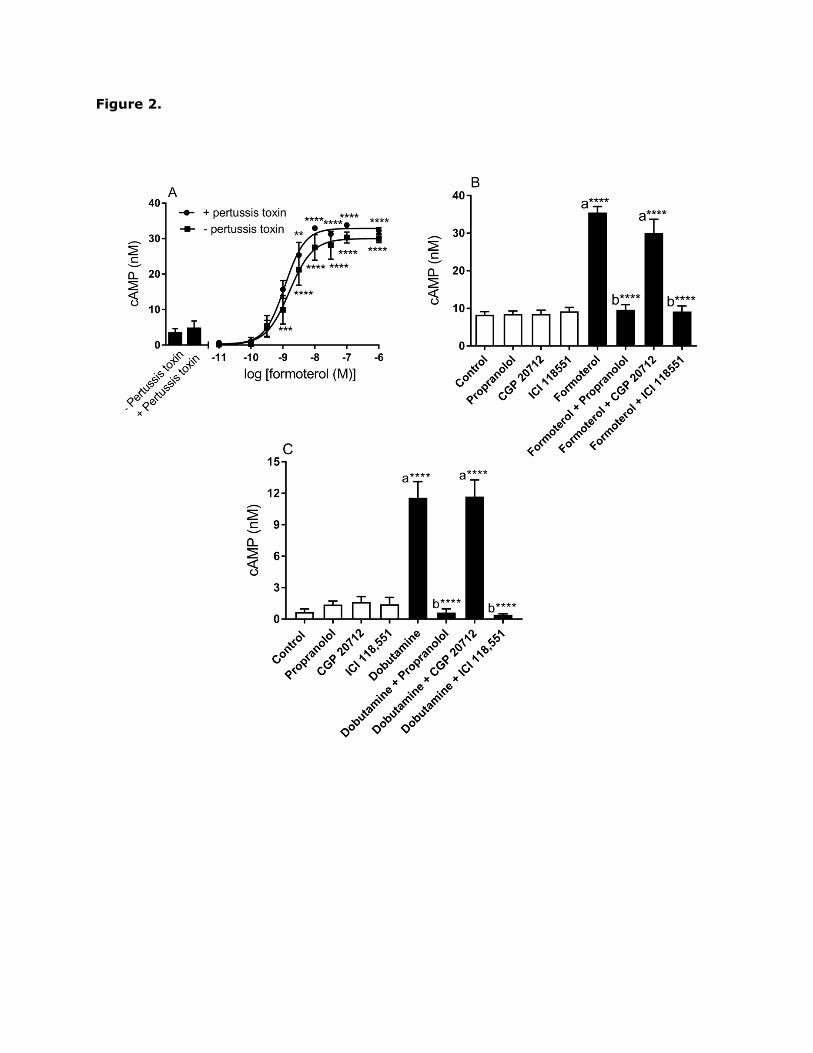
Fig. 2. β-adrenoceptor agonist-induced cAMP accumulation in H9c2 cells. Where indicated
cells were pre-treated for 16 h with 100 ng/ml pertussis toxin. Cells were either (A) treated
with the indicated concentrations of formoterol for 20 min; (B) pretreated for 30 min with
propranolol (100 nM), CGP 20712 (100 nM), or ICI 118551 (100 nM) prior to 20 min
stimulation with formoterol (10 nM) or (C) pretreated for 30 min with propranolol (100 nM),
CGP 20712 (100 nM), or ICI 118551 (100 nM) prior to 20 min stimulation with dobutamine
(1 µM). Levels of cAMP were determined as described in Materials and Methods. Data are
presented as levels of cAMP in nM. The results represent the mean S.E.M. of four
experiments each performed in triplicate. *P0.05, **P<0.01, ***P<0.001, and
****P<0.0001, (a) versus control and (b) versus 10 nM formoterol or 1 µM dobutamine
alone.
Fig. 3. Effect of the β2-adrenoceptor agonist formoterol on TG2 activity in H9c2 cells. Cells
were stimulated with formoterol (100 nM) for the indicated time periods (panels A and C).
Concentration-response curves for formoterol in cells treated with agonist for 20 min
(panels B and D). Where indicated H9c2 cells were pre-treated for 16 h with 100 ng/ml
Page 29
pertussis toxin prior to 20 min stimulation with 1 µM formoterol (panels E and F). Cell
lysates were subjected to the biotin-cadaverine incorporation (panels A, C and E) or the
peptide cross-linking assay (panels B, D and F). Data points represent the mean ± S.E.M.
for TG2 specific activity from four independent experiments. *P0.05, **P<0.01,
***P<0.001 and ****P0.0001, (a) versus control response and (b) versus 1 µM formoterol
alone.
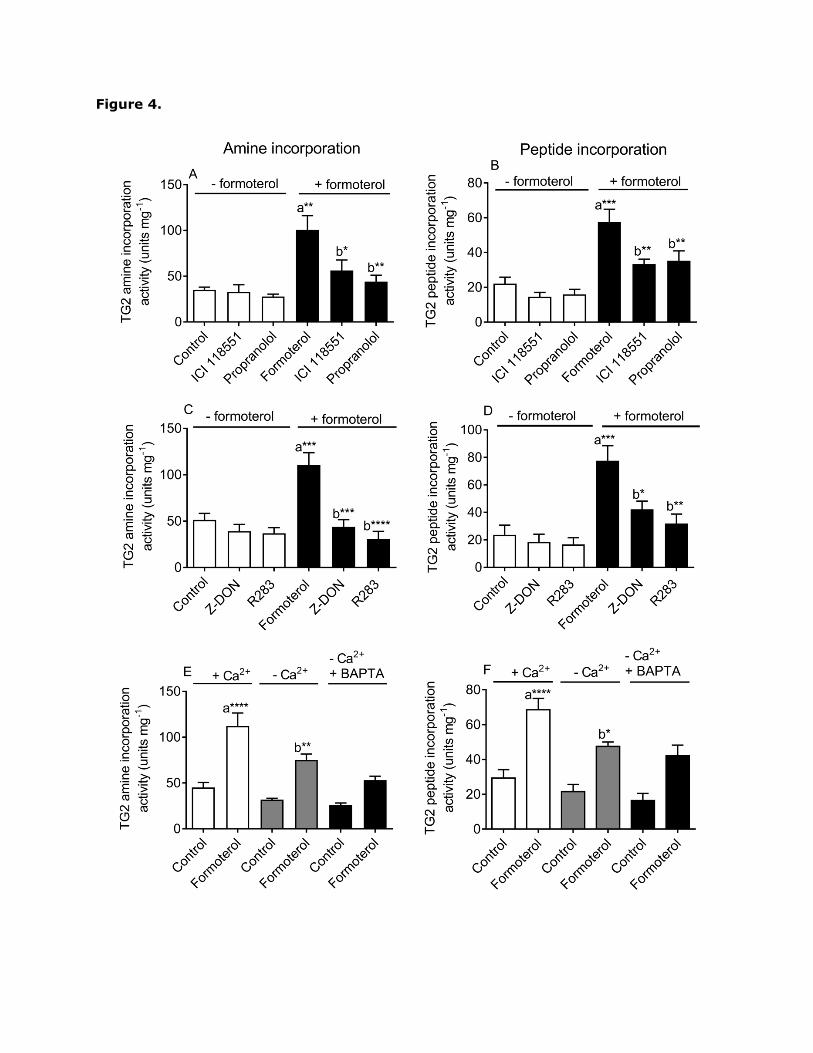
Fig. 4. Effect of β-adrenoceptor antagonists, inhibitors of TG2 and removal of extracellular
Ca2+ on formoterol-induced TG2 activity in H9c2 cells. H9c2 cells were pretreated for 30 min
with the antagonists ICI 118,551 (1 µM; β2-adrenoceptor selective) and propranolol (1 µM
non-selective β-adrenoceptor) or for 1 h with the TG2 inhibitors Z-DON (150 µM) and R283
(200 µM) prior to stimulation with formoterol (1 µM; 20 min). H9c2 cells were also
stimulated for 20 min with formoterol (1 µM) either in the presence of extracellular Ca2+
(1.8 mM) or in its absence using nominally Ca2+-free Hanks/HEPES buffer containing 0.1
mM EGTA. Experiments were also performed using cells pre-incubated for 30 min with 50
µM BAPTA/AM and in the absence of extracellular Ca2+ (nominally Ca2+-free Hanks/HEPES
buffer containing 0.1 mM EGTA) to chelate intracellular Ca2+. Cell lysates were subjected to
biotin-cadaverine incorporation assay (panels A, C and E) or peptide cross-linking assay
(panels B, D and F). Data points represent the mean ± S.E.M. for TG2 specific activity from
four independent experiments. *P0.05, **P0.01, ***P0.001 and ****P0.0001, (a)
versus control and (b) versus 1 µM formoterol in the presence of extracellular Ca2+.
Fig. 5. Effect of PKA and ERK1/2 inhibition on formoterol-induced TG2 activity. H9c2 cells
were pretreated for 30 min with Rp-cAMPs (50 µM), KT-5720 (5 µM) or PD 98059 (50 µM)
prior to 20 min stimulation with formoterol (1 µM). Cell lysates were subjected to biotin-
cadaverine incorporation (panels A, C and E) or peptide cross-linking assays (panels B, D
Page 30
and F). Data points represent the mean ± S.E.M. for TG2 specific activity from four
independent experiments. *P<0.05, **P0.01, ***P0.001 and ****P0.0001, (a) versus
control and (b) versus 1 µM formoterol alone.
Fig. 6. Effect of formoterol on ERK1/2 phosphorylation in H9c2 cells. Where indicated, H9c2
cells were pre-treated for 30 min with A) PD 98059 (50 µM), B) Rp-cAMPs (50 µM), C)
wortmannin (100 nM), D) LY 294002 (30 µM), or E) AS 605240 (1 µM) prior to stimulation
with formoterol (1 µM) for 20 min. In Panel (F) cells were stimulated for 20 min with
formoterol (1 µM) either in the presence of extracellular Ca2+ (1.3 mM) or in its absence
using nominally Ca2+-free Hanks/HEPES buffer containing 0.1 mM EGTA. Cell lysates were
analysed by Western blotting for activation of ERK1/2 using phospho-specific antibodies.
Samples were subsequently analysed on separate blots using antibodies that recognize total
ERK1/2 (data omitted for clarity). Data are expressed as the percentage of values for
control cells (=100%) in the absence of protein kinase inhibitor and represent the mean
S.E.M. of four independent experiments. **P<0.01 and ***P<0.001, (a) versus control and
(b) versus 1 µM formoterol alone.
Fig. 7. Effect of PI-3K inhibitors on formoterol -induced TG2 activity. H9c2 cells were
pretreated for 30 min with wortmannin (100 nM), LY 294002 (30 µM), or AS 605240 (1 µM)
prior to 20 min stimulation with formoterol (1 µM). Cell lysates were subjected to protein
biotin-cadaverine amine incorporation assay (panels A, C and E) or cross-linking assay
(panels B, D and F). Data points represent the mean ± S.E.M. TG2 specific activity from
four independent experiments. *P<0.05, **P0.01 and ***P0.001, (a) versus control and
(b) versus 1 µM formoterol alone.
Fig. 8. Formoterol-induced in situ TG2 activity in H9c2 cells. Cells were incubated with 1
mM biotin-X-cadaverine (BTC) for 6 h, after which they were treated with (A) 100 nM
Page 31
formoterol for 1, 5, 10, 20, 30 or 40 min or (B) the indicated concentrations (in M) of
formoterol for 20 min. TG2-mediated biotin-X-cadaverine incorporation into intracellular
proteins was visualized using FITC-ExtrAvidin® (green). Nuclei were stained with DAPI
(blue) and viewed using a Leica TCS SP5 II confocal microscope (20x objective lens).
Images presented are from one experiment and representative of three independent
experiments. Quantified data points for (C) time course and (D) concentration-response
curve experiments represent the mean ± S.E.M. of fluorescence intensity relative to DAPI
stain for five fields of view each from three to four independent experiments. *P<0.05,
**P0.01, ***P0.001 and ****P0.0001 versus control response.
Fig. 9. Effects of TG2 and kinase inhibitors on in situ TG2 activity in H9c2 cells following
stimulation with formoterol. Cells were incubated with 1 mM biotin-X-cadaverine (BTC) for 6
h after which they were treated as follows: (A) 1 h with the TG2 inhibitors Z-DON (150 µM)
or R283 (200 µM), (B) 30 min with KT 5720 (5 µM) or Rp-cAMPs (50 µM), (C) 30 min with
PD 98059 (50 µM) or LY 294002 (30 µM) or (D) 30 min with AS 605240 (1 µM) or in the
absence of extracellular Ca2+ for 30 min (nominally Ca2+-free Hanks/HEPES buffer containing
0.1 mM EGTA), prior to 20 min stimulation with formoterol (1 µM). TG2-mediated biotin-X-
cadaverine incorporation into intracellular proteins was visualized using FITC-ExtrAvidin®
(green). Nuclei were stained with DAPI (blue) and viewed using a Leica TCS SP5 II confocal
microscope (20x objective lens). Images presented are from one experiment and are
representative of three independent experiments. Quantified data points represent the
mean ± S.E.M. of fluorescence intensity relative to DAPI stain for five fields of view each
from three independent experiments. *P<0.05, **P0.01, ***P0.001 and ****P<0.0001,
(a) versus control and (b) versus 1 µM formoterol alone.
Fig. 10. Effect of PKA and ERK1/2 inhibition on formoterol-induced phosphorylation of TG2.
Where indicated, H9c2 cells were incubated for 30 min with Rp-cAMPs (50 µM) or PD 98059
Page 32
(50 µM) prior to stimulation with formoterol (1 µM) for 20 min. Following stimulation, cell
lysates were subjected to immunoprecipitation using anti-TG2 monoclonal antibody as
described under “Materials and Methods”. The resultant immunoprecipitated protein(s) were
subjected to SDS-PAGE and analysed via Western blotting using (A) anti-phosphoserine
and (B) and anti-phosphothreonine antibodies. One tenth of the input was added to the first
lane to show the presence of phosphorylated proteins prior to immunoprecipitation and
negative controls with the immunoprecipitation performed with beads or IgG only were
included to demonstrate the specificity of the bands shown. Quantified data for formoterol-
induced increases in TG2-associated serine and threonine phosphorylation are expressed as
a percentage of that observed in control cells (100%). Data points represent the mean
S.E.M. from three independent experiments. *P0.05, **P0.01 and ***P0.001 (a) versus
control and (b) versus formoterol alone.
Fig. 11. Roles of extracellular Ca2+ and PI-3K in formoterol-induced phosphorylation of TG2.
Measurements of formoterol-induced TG2 phosphorylation were performed either in the
absence of extracellular Ca2+ using nominally Ca2+-free Hanks/HEPES buffer containing 0.1
mM EGTA, as indicated, or in cells incubated for 30 min with AS 60540 (1 µM) prior to
stimulation with formoterol (1 µM) for 20 min. Following stimulation, cell lysates were
subjected to immunoprecipitation using anti-TG2 monoclonal antibody as described under
“Materials and Methods”. The resultant immunoprecipitated protein(s) were subjected to
SDS-PAGE and Western blot analysis using (A) anti-phosphoserine and (B) and anti-
phosphothreonine antibodies. One tenth of the input was added to the first lane to show the
presence of phosphorylated proteins prior to immunoprecipitation and negative controls with
the immunoprecipitation performed with beads or IgG only were included to demonstrate
the specificity of the bands shown. Quantified data for formoterol-induced increases in TG2-
associated serine and threonine phosphorylation are expressed as a percentage of that
observed in control cells (100%). Data points represent the mean S.E.M. from three
Page 33
independent experiments. *P0.05 and **P0.01 (a) versus control and (b) versus
formoterol alone.
Fig. 12. Detection of in situ TG2 activity and protein substrates in formoterol-treated H9c2
cells. Cells were incubated with 1 mM biotin-X-cadaverine for 6 h, after which they were
treated for 1 h with the TG2 inhibitors Z-DON (150 µM) or R283 (200 µM) before stimulation
with formoterol (1 µM) for 20 min. Biotin-X-cadaverine-labelled proteins were enriched
using CaptAvidin™ agarose sedimentation beads and eluted proteins subjected to SDS-
PAGE on 4-15% polyacrylamide gradient gels. (A) Coomassie blue staining of enriched
biotin-X-cadaverine-labelled proteins following SDS-PAGE. (B) Quantification of protein
substrates detected using Coomassie blue staining. Densitometry of each lane (total
protein) was carried out using Advanced Image Data Analyser software (Fuji; version 3.52)
and data are expressed as a percentage of basal TG2 protein substrate levels. Values are
means S.E.M. from three independent experiments. ***P<0.001 and ****P0.0001, (a)
versus control response, (b) versus formoterol alone.
Page 34
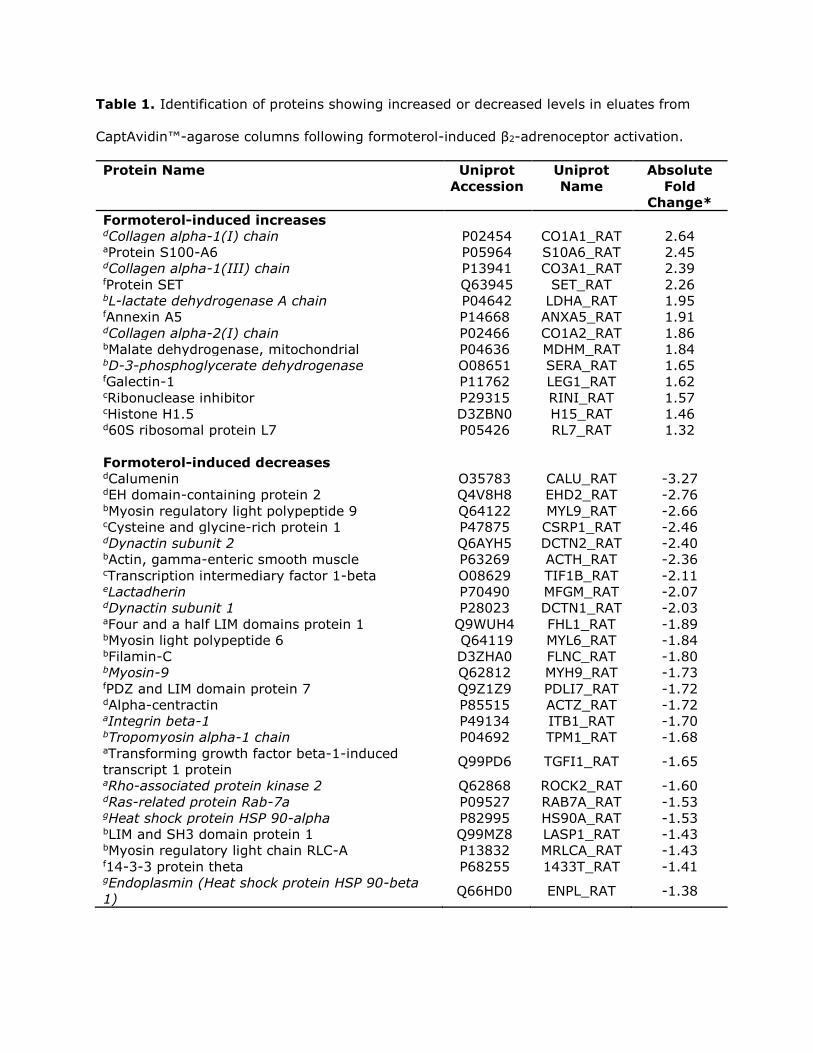
Table 1. Identification of proteins showing increased or decreased levels in eluates from
CaptAvidin™-agarose columns following formoterol-induced β2-adrenoceptor activation.
Protein Name Uniprot
Accession
Uniprot
Name
Absolute
Fold
Change*
Formoterol-induced increases dCollagen alpha-1(I) chain P02454 CO1A1_RAT 2.64 aProtein S100-A6 P05964 S10A6_RAT 2.45 dCollagen alpha-1(III) chain P13941 CO3A1_RAT 2.39 fProtein SET Q63945 SET_RAT 2.26 bL-lactate dehydrogenase A chain P04642 LDHA_RAT 1.95 fAnnexin A5 P14668 ANXA5_RAT 1.91 dCollagen alpha-2(I) chain P02466 CO1A2_RAT 1.86 bMalate dehydrogenase, mitochondrial P04636 MDHM_RAT 1.84 bD-3-phosphoglycerate dehydrogenase O08651 SERA_RAT 1.65 fGalectin-1 P11762 LEG1_RAT 1.62 cRibonuclease inhibitor P29315 RINI_RAT 1.57 cHistone H1.5 D3ZBN0 H15_RAT 1.46 d60S ribosomal protein L7 P05426 RL7_RAT 1.32
Formoterol-induced decreases dCalumenin O35783 CALU_RAT -3.27 dEH domain-containing protein 2 Q4V8H8 EHD2_RAT -2.76 bMyosin regulatory light polypeptide 9 Q64122 MYL9_RAT -2.66 cCysteine and glycine-rich protein 1 P47875 CSRP1_RAT -2.46 dDynactin subunit 2 Q6AYH5 DCTN2_RAT -2.40 bActin, gamma-enteric smooth muscle P63269 ACTH_RAT -2.36 cTranscription intermediary factor 1-beta O08629 TIF1B_RAT -2.11 eLactadherin P70490 MFGM_RAT -2.07 dDynactin subunit 1 P28023 DCTN1_RAT -2.03 aFour and a half LIM domains protein 1 Q9WUH4 FHL1_RAT -1.89 bMyosin light polypeptide 6 Q64119 MYL6_RAT -1.84 bFilamin-C D3ZHA0 FLNC_RAT -1.80 bMyosin-9 Q62812 MYH9_RAT -1.73 fPDZ and LIM domain protein 7 Q9Z1Z9 PDLI7_RAT -1.72 dAlpha-centractin P85515 ACTZ_RAT -1.72 aIntegrin beta-1 P49134 ITB1_RAT -1.70 bTropomyosin alpha-1 chain P04692 TPM1_RAT -1.68 aTransforming growth factor beta-1-induced
transcript 1 protein Q99PD6 TGFI1_RAT -1.65
aRho-associated protein kinase 2 Q62868 ROCK2_RAT -1.60 dRas-related protein Rab-7a P09527 RAB7A_RAT -1.53 gHeat shock protein HSP 90-alpha P82995 HS90A_RAT -1.53 bLIM and SH3 domain protein 1 Q99MZ8 LASP1_RAT -1.43 bMyosin regulatory light chain RLC-A P13832 MRLCA_RAT -1.43 f14-3-3 protein theta P68255 1433T_RAT -1.41 gEndoplasmin (Heat shock protein HSP 90-beta
1) Q66HD0 ENPL_RAT -1.38
Page 35
H9c2 cells were pre-incubated with biotin-X-cadaverine prior to treatment with formoterol
(1 µM) and biotin-cadaverine labelled proteins were captured and analysed by SWATH MS.
*Absolute fold changes in formoterol treated samples versus control (n=4) were calculated
using SCIEX OneOmics with parameters MLR weight > 0.15, confidence >70%, algorithms
used described by Lambert et al., (2013). Known TG2 targets appearing in the TG2
substrate database (Csósz et al., 2009) or identified by Yu et al. (2015) and Almami et al.
(2014) are indicated in italics. Proteins are grouped according to their functions and/or
cellular function as follows: acell signalling; bmetabolism; ctransciption/translation; dvesicular
trafficking/extracellular matrix constituent; eapoptosis; fstructural/scaffolding protein;
gprotein folding.
Page 36
References
Agnihotri N, Mehta K (2017) Transglutaminase-2: evolution from pedestrian protein to a
promising therapeutic target. Amino Acids 49: 425-439.
Alcock J, Warren AY, Goodson YJ, Hill SJ, Khan RN, Lymn JS (2011) Inhibition of tissue
transglutaminase 2 attenuates contractility of pregnant human myometrium. Biol Reprod
84: 646-653.
Almami I, Dickenson JM, Hargreaves AJ, Bonner PLR (2014) Modulation of transglutaminase
2 activity in H9c2 cells by PKC and PKA signaling: a role for transglutaminase 2 in
cytoprotection. Br J Pharmacol 171: 3946-3960.
Arcaro A, Wymann MP (1993) Wortmannin is a potent phophatidylinositol 3-kinase inhibitor:
the role of phosphatidylinositol 3,4,5-trisphosphate in neutrophil responses. Biochem. J.
296: 297-301.
Benovic JL (2002) Novel β2-adrenergic receptor signaling pathways J Allergy Clin Immunol
110: S229-S235.
Boros S, Ahrman E, Wunderink L, Kamps B, de Wong WW, Boelens WC, Emanuelsson CS
(2006) Site-specific transamidation and deamidation of the small heat-shock protein Hsp20
by tissue transglutaminase. Blood 62: 1044-1052.
Caccamo D, Currò M, Lentile R (2010) Potential of transglutaminase 2 as a therapeutic
target. Expert Opin Ther Targets 14: 989-1003.
Page 37
Camps M, Rückle T, Ji H, Ardissone V, Rintelen F, Shaw J, Ferrandi C, Chabert C, Gillieron C,
Francon B, Martin T, Gretener D, Perrin D, Leroy D, Vitte PA, Hirsch E, Wymann MP, Cirillo
R, Schwarz MK, Rommel C (2005) Blockade of PI3K suppresses joint inflammation and
damage in mouse models of rheumatoid arthritis. Nature Med 11: 936-943.
Cordella-Miele E, Miele L, Beninati S, Mukherjee AB (1993) Transglutaminase-catalysed
incorporation of polyamines into phospholipase A2. J Biochem 113: 164-173.
Csósz E, Meskó B, Fésϋs L (2009) Transdab wiki: the interactive transglutaminase substrate
database on web 2.0 surface. Amino Acids 36: 615-617.
Daaka Y, Luttrell LM, Lefkowitz RJ (1997) Switching of the coupling of the β2-adrenergic
receptor to different G proteins by protein kinase A. Nature 390:88-91.
de Wit RJ, Hekstra D., Jastorff B, Stec WJ, Baraniak J, Van Driel R, Van Haastert PJ (1984)
Inhibitory action of certain cyclophosphate derivatives of cAMP on cAMP-dependent protein
kinases. Eur J Biochem 142: 255-260.
Donato R, Cannon BR, Sorci G, Riuzzi F, Hsu K, Weber DJ, Geczy CL (2013) Functions of
S100 proteins. Curr Mol Med 13: 25-57.
Dudley, DT, Pang L, Decker SJ, Bridges AJ, Saltiel AR (1995) A synthetic inhibitor of the
mitogen-activated protein kinase cascade. Proc Natl Acad Sci USA 92: 7686-7689.
Eckert RL, Kaartinen MT, Nurminskaya M, Belkin AM, Colak G, Johnson GVW, Mehta K
(2014) Transglutaminase regulation of cell function. Physiol Rev 94: 383-417.
Page 38
Freund KF, Doshi KP, Gaul SL, Claremon DA, Remy DC, Baldwin JJ, Pitzenberger SM, Stern
AM (1994) Transglutaminase inhibition by 2-[(2-oxopropyl)thio]imidazolium derivatives:
mechanism of factor XIIIa inactivation. Biochemistry 33: 10109-10119.
Gillet LC, Navarro P, Tate S, Röst H, Selevsek N, Reiter L, Bonner R, Aebersold R (2012)
Targeted data extraction of the MS/MS spectra generated by Data-independent Acquisition:
a new concept for consistent and accurate proteome analysis. Mol Cell Proteomics : 11(6),
O111.016717.
Gundemir S, Colak G, Tucholski J, Johnson GVW (2012) Transglutaminase 2: a molecular
Swiss army knife. Biochim Biophys Acta 1823: 406-419.
Hescheler J, Meyer R, Plant S, Krautwurst D, Rosenthal W, Schultz G (1991) Morphological,
biochemical and electrophysiological characterization of a clonal cell (H9c2) line from rat
heart. Circ Res 69: 1476-1486.
Huang Q, Yang L, Luo J, Guo L, Wang Z, Yang X, Jin W, Fang Y, Ye J, Shan B, Zhang Y
(2015) SWATH enables precise label-free quantification on proteome scale. Proteomics 15:
1215-1223.
Hunter T (1995) When is a lipid kinase not a lipid kinase? When it is a protein kinase. Cell
83: 1-4.
Hwang KC, Gray CD, Sweet We, Moravec CS, Im MJ (1996) 1-adrenergic receptor coupling
with Gh in failing human heart. Circulation 94: 718-726.
Page 39
Iismaa SE, Meams BM, Lorand L, Graham RM (2009) Transglutaminases and disease:
lessons from genetically engineered mouse models and inherited disorders. Physiol Rev 89:
991-1023.
Iwai N, Shimoike H, Kinoshita M (1995) Genes up-regulated in hypertrophied ventricle.
Biochem. Biophys Res Commun 209: 527-534.
Kase H, Iwahashi K, Nakanishi S, Matsuda Y, Yamada K, Takahashi M, Murakata C, Sato A,
Kaneko M (1987) K-252 compounds, novel and potent inhibitors of protein kinase C and
cyclic nucleotide-dependent protein kinases. Biochem Biophys Res Commun 142: 436-440.
Kimes BW, Brandt BL (1976) Properties of a clonal muscle cell line from rat heart. Exp Cell
Res 98: 367-381.
Király R, Demény MA, and Fésϋs L (2011) Protein transamidation by transglutaminase 2 in
cells: a disputed Ca2+-dependent action of a multifunctional protein FEBS J. 278, 4717-
4739.
Lambert J-P, Ivosev G, Couzens AL, Larsen B, Taipale M, Lin Z-Y, Zhong Q, Lindquist S,
Vidal M, Aebersold R, Pawson T, Bonner R, Tate S, Gingras A-C (2013) Mapping differential
interactomes by affinity purification coupled with data-independent mass spectrometry
acquisition. Nature Meth 10: 1239-1245.
Lee KN, Arnold SA, Birkbichler PJ, Patterson Jr MK, Fraij BM, Takeuchi Y, Carter HA (1993)
Site-directed mutagenesis of human tissue transglutaminase: Cys-277 is essential for
transglutaminase activity but not for GTPase activity. Biochim Biophys Acta 1202:1-6.
Page 40
Lilley GR, Skill J, Griffin M, Bonner PLR (1998) Detection of Ca2+-dependent
transglutaminase activity in root and leaf tissue of monocotyledonous and dicotyledonous
plants. Plant Physiol 117: 1115-1123.
Makitie LT, Kanerva K, Anderson LC (2009) Ornithine decarboxylase regulates the activity
and localization of rhoA via polyamination. Exp Cell Res 315: 1008-1014.
Mishra S, Melino G, Murphy LJ (2007) Transglutaminase 2 kinase activity facilitates protein
kinase A-induced phosphorylation of retinoblastoma protein. J Biol Chem 282: 18108-
18115.
Mishra S, Murphy LJ (2006) Phosphorylation of transglutaminase 2 by PKA at Ser216
creates 14.3.3 binding sites. Biochem Biophys Res Commun 347: 1166-1170.
Naga Prasad SV, Jayatilleke A, Madamanchi, Rockman HA (2005) Protein kinase activity of
phosphoinositide 3-kinase regulates β-adrenergic receptor endocytosis. Nature Cell Biol 7:
785-796.
Nanda N, Iismaa SE, Owens WA, Husain A, Mackay F, Graham RM (2001) Targeted
inactivation of Gh/tissue transglutaminase II. J Biol Chem 276: 20673-20678.
Nurminskaya MV, Belkin AM (2012) Cellular functions of tissue transglutaminase. Int Rev
Cell Mol Biol 294: 1-97.
Okamoto T, Murayama Y, Hayashi Y, Inagaki M, Ogata E, Nishimoto I (1991) Identification
of a Gs activator region of the β2-adrenergic receptor that is autoregulated via protein
kinase A-dependent phosphorylation. Cell 67:723-730.
Page 41
Perry MJ, Mahoney SA, Haynes LW (1995) Transglutaminase C in cerebellar granule
neurons: regulation and localization of substrate cross-linking. Neuroscience 65: 1063-
1076.
Rajagopal S, Ahn S, Rominger DH, Gowen-MacDonald W, Lam CM, DeWire SM, Violin JD,
Lefkowitz RJ (2011) Quantifying ligand bias at seven-transmembrane receptors. Mol
Pharmacol 80: 367-377.
Rockman HA, Koch WJ, Lefkowitz RJ (2002) Seven-transmembrane-spanning receptors and
heart function. Nature 415:206-212.
Schaertl S, Prime M, Wityak J, Dominguez C, Munoz-Sanjuan I, Pacifici RE, Courtney S,
Scheel A, Macdonald D (2010) A profiling platform for the characterization of
transglutaminase 2 (TG2) inhibitors. J Biomol Screen 15: 478-487.
Schmitt JM, Stork PJS (2000) β2-adrenergic receptor activates extracellular signal-regulated
kinases (ERKs) via the small G-protein Rap1 and the serine/threonine kinase B-Raf. J Biol
Chem 275: 25342-25350.
Shin DM, Kang J, Ha J, Kang HS, Park SC, Kim IG, Kim SJ (2008) Cystamine prevents
ischaemia-reperfusion injury by inhibiting polyamination of RhoA. Biochem Biophys Res
Commun 365: 509-514.
Singh RN, McQueen T, Mehta K (1995) Detection of the amine acceptor protein substrates
of transglutaminase with 5-(biotinamido) pentylamine. Anal Biochem 231: 261-263.
Page 42
Singh US, Kunar MT, Kao YL, Baker KM (2001) Role of transglutaminase II in retinoic acid-
induced activation of RhoA-associated kinase-2. EMBO J 20: 2413-2423.
Slaughter TF, Achyuthan KE, Lai TS, Greenberg CS (1992) A microtiter plate
transglutaminase assay utilizing 5-(biotinamido) pentylamine as substrate. Anal Biochem
205: 166-171.
Small K, Feng JF, Lorenz J, Donnelly ET, Yu A, Im MJ, Dorn GW 2nd, Liggett SB (1999)
Cardiac specific overexpression of transglutaminase II (Gh) results in a unique hypertrophy
phenotype independent of phospholipase C activation. J Biol Chem 274: 21291-21296.
Smith PK, Krohn RI, Hermanson GT, Mallia AK, Gartner FH, Provenzano MD, Fujimoto EK,
Goeke NM, Olson BJ, Klenk DC (1985) Measurement of protein using bicinchoninic acid. Anal
Biochem 150:76-85.
Steinberg SF (1999) The molecular basis for distinct β-adrenergic receptor subtype actions
in cardiomyocytes. Circ Res 85:1101-1111.
Szondy Z, Mastroberardino PG, Váradi J, Farrace MG, Nagy N, Bak I, Viti I, Wieckowski
MR, Melino G, Rizzuto R, Tósaki A, Fesus L, Piacentini M (2006) Tissue transglutaminase
(TG2) protects cardiomyocytes against ischemia/reperfusion injury by regulating ATP
synthesis. Cell Death Differ 13: 1827-1829.
Trigwell SM, Lynch PT, Griffin M, Hargreaves AJ, Bonner PL (2004) An improved colorimetric
assay for the measurement of transglutaminase (type II)-(γ-glutamyl) lysine cross-linking
activity. Anal Biochem 330: 164-166.
Page 43
Vyas FS, Hargreaves AJ, Bonner PLR, Boocock D, Dickenson JM (2016) A1 adenosine
receptor-induced phosphorylation and modulation of transglutaminase activity in H9c2 cells:
a role in cell survival. Biochem Pharmacol 107: 41-58.
Vlahos CJ, Matter WF, Hui KY, Brown RF (1994) A specific inhibitor of phosphatidylinositol 3-
kinase, 2-(4-morpholinyl)-8-phenyl-4H-1-benzopyran-4-one (LY294002). J Biol Chem 269:
5241-5248.
Wang Y, Ande SR, Mishra S (2012) Phosphorylation of transglutaminase 2 (TG2) at serine-
216 has a role in TG2 mediated activation of nuclear factor-kappa B and in downregulation
of PTEN. BMC Cancer 12:277.
Yanagawa Y, Hiraide S, Matsumoto M, Shimamura K, Togashi H (2014) Enhanced
transglutaminase 2 expression in response to stress-related catecholamines in
macrophages. Immunobiology 219: 680-686.
Yano N, Ianus V, Zhao TC, Tseng A, Padbury JF, Tseng YT (2007) A novel signaling pathway
for beta-adrenergic receptor-mediated activation of phosphoinositide 3-kinase in H9c2
cardiomyocytes. Am J Physiol Heart Circ Physiol 293: H385–H393.
Yu C-H, Chou C-C, Lee Y-J, Khoo K-H, Chang G-D (2015) Uncovering protein polyamination
by the spermine-specific antiserum and mass spectrometric analysis. Amino Acids 47: 469-
481.
Zamah AM, Delahunty M, Luttrell LM, Lefkowitz RJ (2002) Protein kinase A-mediated
phosphorylation of the β2-adrenergic receptor regulates its coupling to Gs and Gi:
demonstration in a reconstituted system. J Biol Chem 277: 31249-31256.
Page 44
Zhang W, Yano N, Deng M, Mao Q, Shaw SK, Tseng Y-T (2011) β-adrenergic receptor-PI3K
signaling crosstalk in mouse heart: elucidation of immediate downstream signaling
cascades. PLoS ONE 6(10): e26581. doi:10.1371/journal.pone.0026581.
Zhang Z, Vezza R, Plappert T, McNamara P, Lawson JA, Austin S, Pratico D, Sutton MSJ,
FitzGerald GA (2003) COX-2 dependent cardiac failure in Gh/tTG transgenic mice. Circ Res
92: 1153-1161.