72


Suggested Citation: Central Coast Local Health District. Central Coast Community Health Survey: Analysis of Telephone Survey 2014. Central Coast Local Health District and Central Coast NSW Medicare Local.
Prepared by: Cheryl Travers, Andrew Dixon, Alice Laurence, Dr Peter Lewis Cover by: Leanne Andrew Published October 2015 © Copyright CCLHD 2015
ISBN: 978-1-74139-095-7
For further Information, please contact: Public Health Unit Central Coast Local Health District PO Box 361 Gosford, NSW, 2250

Acknowledgements
The Central Coast Community Health Survey team would like to extend our thanks to the Hunter Valley Research Foundation, in particular Dr Clare Hogue (Project Manager), Mr David Shellard (CATI Programmer), Mr Russell Redford (Computer Programmer & Statistician), Ms Vanessa Sewell (Survey Supervisor) and the telephone interviewers. We thank the many people who gave their valuable advice, input and time to this survey.
Particularly, we wish to acknowledge:
Central Coast Public Health Unit: Colleen Gately (Area Immunisation Coordinator), Dr Kleete Simpson (former Public Health Registrar), Anne Brown (Administrative Officer)
Central Coast Health Promotion Service: Douglas Tutt (Former Director), Nicole Kajons (Director), Annie Warn (Manager), Wendy Harris (Communication Manager), Gina Stuart (Senior Health Promotion Officer - Research & Evaluation), Dr Lyndon Bauer (Research & Evaluation Officer), Nigel Tebb (Health Promotion Officer)
Central Coast LHD Ongoing & Complex Care: Nicole McDonald (Health Service Manager)
Central Coast NSW Medicare Local: Richard Nankervis (Chief Executive Officer), Andrew Davison (Health Care Integration & Improvement Manager), Rachel Sheather-Reid (Population Health & Planning Program Leader )
Survey participants for their time and support
We gratefully acknowledge additional financial support from the CCLHD Health Promotion Service, CCLHD Ongoing and Complex Care, and the Central Coast NSW Medicare Local.

i
Table of Contents Abbreviations ........................................................................................................................................... v Executive Summary ................................................................................................................................. vi Introduction ............................................................................................................................................. 1 Methods .................................................................................................................................................. 1 Sampling Strategy .................................................................................................................................... 1 Response Rate .......................................................................................................................................... 1 Weighting .............................................................................................................................................. 2 Age and Sex .............................................................................................................................................. 2 Format of this Report .............................................................................................................................. 4 PART 1: HEALTH-RELATED BEHAVIOURS ........................................................................................................ 5 Physical Activity ....................................................................................................................................... 5 Smoking Status ........................................................................................................................................ 7
Smoking in the Home .......................................................................................................................... 8 Alcohol ..................................................................................................................................................... 9
Perceived Sufficiency in Number of Liquor Outlets in Neighbourhoods .......................................... 10 Nutrition ................................................................................................................................................ 12 Influenza Vaccination ............................................................................................................................ 14 Active Travel .......................................................................................................................................... 15 Companion Animals (Pets) .................................................................................................................... 16 PART 2: HEALTH STATUS ........................................................................................................................... 17 Hypertension ......................................................................................................................................... 17 Hyperlipidaemia .................................................................................................................................... 19 Overweight and Obesity ........................................................................................................................ 20
Perceived Weight .............................................................................................................................. 21 Heart Disease (Previous Cardiovascular Disease) ................................................................................. 22 Previous Stroke / Transient Ischaemic Attack (TIA) .............................................................................. 23 Diabetes ................................................................................................................................................. 24 Chronic Obstructive Pulmonary Disease (COPD) .................................................................................. 26 Asthma .................................................................................................................................................. 28 Arthritis .................................................................................................................................................. 30 Other Chronic Health Conditions .......................................................................................................... 32 Injury ..................................................................................................................................................... 34 Oral Health ............................................................................................................................................ 35 PART 3: HEALTH SERVICES .................................................................................................................... 37 Use of Medical Services ......................................................................................................................... 37 PART 4: SOCIAL SUPPORT .......................................................................................................................... 40 References ............................................................................................................................................. 42 Appendix 1: Methodology ..................................................................................................................... 44 Appendix 2: Community Health Survey 2014 - Questionnaire ............................................................. 46 Appendix 3: Age and Sex Breakdown .................................................................................................... 59 Appendix 4 Participant Letter & Information Sheet ............................................................................. 60

ii
List of Figures Figure 1: Central Coast population weights by age and sex at Dec 31 2013 ................................................ 2 Figure 2: Gosford LGA population weights by age and sex at Dec 31 2013 ................................................. 3 Figure 3: Wyong LGA population weights by age and sex at Dec 31 2013 ................................................... 3 Figure 4: Physical activity categories by Central Coast LGAs, CHS 2014 ....................................................... 5 Figure 5: Tobacco smoking status by Central Coast LGAs, CHS 2014 ........................................................... 7 Figure 6: Exposure to tobacco smoke in the home by Central Coast LGAs, CHS 2014 ................................. 8 Figure 7: Alcohol consumption Central Coast, CHS 2014 ............................................................................. 9 Figure 8: Respondent perception of sufficient places to buy alcohol in their neighbourhood, pre- and post-educational intervention, Central Coast, CHS 2014 ............................................................................ 11 Figure 9: Respondent perception of sufficient places to buy alcohol in their neighbourhood pre- and post-educational intervention by LGAs, CHS 2014 ..................................................................................... 11 Figure 10: Sufficient serves of fruit and vegetables by Central Coast LGAs, CHS 2014 .............................. 12 Figure 11: Respondents 65 years and over vaccinated against flu in the past 12 months by LGAs, Central Coast, CHS 2014 .............................................................................................................................. 14 Figure 12: Main form of travel to work or study, Central Coast, CHS 2014 ................................................ 15 Figure 13: Pet ownership by type of pet for Central Coast respondents, CHS 2014 .................................. 16 Figure 14: Proportion of respondents reporting hypertension by Central Coast LGA, CHS 2014 .............. 17 Figure 15: Proportion of respondents reporting hyperlipidaemia by Central Coast LGAs, CHS 2014 ........ 19 Figure 16: Proportion of respondents in BMI categories by LGA, CHS 2014 .............................................. 20 Figure 17: Self-perceived weight by LGA, CHS 2014 ................................................................................... 21 Figure 18: Self-reported prevalence of heart disease by type and Central Coast LGAs (unweighted data), CHS 2014 ........................................................................................................................................... 22 Figure 19: Proportion of respondents reporting previous stroke/TIA by LGA, CHS 2014 .......................... 23 Figure 20: Proportion of respondents reporting diabetes by Central Coast LGAs, CHS 2014 .................... 24 Figure 21: Proportion of respondents reporting emphysema by Central Coast LGAs, CHS 2014 .............. 26 Figure 22: Proportion of respondents reporting either COPD or emphysema by Central Coast LGAs, CHS 2014 ..................................................................................................................................................... 27 Figure 23: Proportion of respondents reporting asthma by Central Coast LGAs, CHS 2014 ...................... 28 Figure 24: Proportion of respondents reporting arthritis by Central Coast LGAs, Central Coast, CHS 2014 ............................................................................................................................................................. 30 Figure 25: Type of arthritis reported by Central Coast LGAs, CHS 2014 ..................................................... 31 Figure 26: Proportion of respondents reporting chronic health conditions (weighted data), Central Coast, CHS 2014 .......................................................................................................................................... 32 Figure 27: Proportion of respondents 50 years and over reporting a fall in the past 12 months by Central Coast LGAs, CHS 2014 ..................................................................................................................... 34 Figure 28 Proportion of respondents reporting last visit to a dental professional by Central Coast LGAs, CHS 2014 ........................................................................................................................................... 35 Figure 29: Proportion of respondents reporting having a regular practice and regular GP within that practice by 10-year age group, Central Coast, CHS 2014 ............................................................................ 37 Figure 30: Barriers to getting health care when needed by LGA, CHS 2014 ............................................... 38 Figure 31: Action taken for health problem not an emergency and after-hours, Central Coast, CHS 2014 ............................................................................................................................................................. 39 Figure 32 Respondents use of prescribed medicines by LGA, Central Coast, CHS 2014 ............................ 39 Figure 33: Main types of activities undertaken in the past 2 weeks and the past 3 months. .................... 40 Figure 34: Who helps when sick, Central Coast, CHS 2014, Central Coast, CHS 2014 ................................ 41 Figure 35: How often discuss your health issues with a friend or family member, Central Coast, CHS 2014 ............................................................................................................................................................. 41

iii
List of Tables Table 1: Comparison of cardiovascular disease risk factors for the 2006, 2010 and 2014 Community Health Surveys, Central Coast. Sex and age weighted population estimates (%) and 95% Confidence Intervals ........................................................................................................................................................ vii Table 2: Population distribution by age and LGA (n=1003), Central Coast, CHS 2014 ................................ 1 Table 3: Estimated population proportion (95% Cl) for physical activity categories by LGA, Central Coast, CHS 2014 ............................................................................................................................................ 6 Table 4: Estimated population proportion (95% Cl) for current tobacco smoking status by LGA, Central Coast, CHS 2014 ................................................................................................................................ 8 Table 5: Estimated population proportion (95% Cl) for tobacco smoking in the home by LGA, Central Coast, CHS 2014 ............................................................................................................................................ 8 Table 6: Estimated population proportion (95% Cl) of perceived sufficient places to buy alcohol in the neighbourhood, before and after educational intervention by Central Coast LGAs, CHS 2014 ................. 10 Table 7: Estimated population proportion (95% Cl) of sufficient serves of fruit by LGA, Central Coast, CHS 2014 ..................................................................................................................................................... 13 Table 8: Estimated population proportion (95% Cl) of sufficient serves of vegetables by LGA, Central Coast, CHS 2014 .......................................................................................................................................... 13 Table 9: Estimated population proportion (95% Cl) for respondents aged 65 years and over (n=401), vaccinated against flu in the past 12 months by LGA, Central Coast, CHS 2014 ........................................ 14 Table 10: Participants main form of travel to work or study by LGA, Central Coast, CHS 2014 ................. 15 Table 11: Estimated population proportion (95% Cl) for respondents who own an animal as a pet by LGAs, Central Coast, CHS 2014 .................................................................................................................... 16 Table 12: Estimated population proportion (95% Cl) of respondents with hypertension by LGAs, Central Coast, CHS 2014 .............................................................................................................................. 18 Table 13: Estimated population proportion (95% Cl) of respondents with hyperlipidaemia by LGA, Central Coast, CHS 2014 .............................................................................................................................. 19 Table 14: Estimated population proportion (95% Cl) for respondents in Body Mass Index categories by LGAs, Central Coast, CHS 2014 ............................................................................................................... 21 Table 15: Estimated population proportion (95% Cl) for respondent perception of weight by LGA, Central Coast, CHS 2014 .............................................................................................................................. 21 Table 16: Estimated population proportion (95% Cl) of respondents reporting heart disease or heart condition by LGA, Central Coast, CHS 2014 ................................................................................................ 22 Table 17: Estimated population proportion (95% Cl) of respondents reporting previous stroke or TIA by LGA, Central Coast, CHS 2014 ................................................................................................................. 23 Table 18: Estimated population proportion (95% Cl) of respondents reporting diabetes by LGA, Central Coast, CHS 2014 .............................................................................................................................. 25 Table 19: Self-reported type of diabetes, Central Coast (weighted data), CHS 2014 ................................. 25 Table 20: Estimated population proportion (95% Cl) of respondents with emphysema by LGA, Central Coast, CHS 2014 .......................................................................................................................................... 26 Table 21: Estimated population proportion (95% Cl) of respondents with emphysema or COPD by LGA, Central Coast, CHS 2014 ..................................................................................................................... 27 Table 22: Estimated population proportion (95% Cl) of respondents reporting ‘ever had asthma’ by LGA, Central Coast, CHS 2014 ..................................................................................................................... 28 Table 23: Time series for current asthma, persons aged 16 years and over, Central Coast LHD, NSW 2002 to 2013. Extracted from Health Statistics NSW. ................................................................................. 29 Table 24: Estimated population proportion (95% Cl) of respondents reporting arthritis by LGA, Central Coast, CHS 2014 .............................................................................................................................. 30 Table 25: Estimated population proportion (95% Cl) of respondents reporting ‘other’ chronic health conditions by LGA, Central Coast, CHS 2014 ............................................................................................... 33 Table 26: Estimated population proportion (95% Cl) of respondents (≥50 years) reporting a fall in the past 12 months by LGA, Central Coast, CHS 2014 ....................................................................................... 34 Table 27: Estimated population proportion (95% Cl) of respondents (≥50 years) reporting fear of falling, by LGA, Central Coast, CHS 2014 ..................................................................................................... 34

iv
Table 28: Estimated population proportion (95% Cl) of respondents reporting last visit to a dental professional by LGA, Central Coast, CHS 2014 ............................................................................................ 35 Table 29: Estimated population proportion (95% Cl) of respondents reporting experience of dental problems in past two years left untreated due to cost by LGA, Central Coast, CHS 2014 ......................... 36 Table 30: Estimated population proportion (95% Cl) for respondent who reported having a regular medical or GP practice and pharmacy by LGA, Central Coast, CHS 2014 ................................................... 38

v
Abbreviations
ABS Australian Bureau of Statistics
CATI Computer Aided Telephone Interview
CC Central Coast
CC LHD Central Coast Local Health District
CHS Community Health Survey
COPD Chronic Obstructive Pulmonary Disease
CVD Cardiovascular Disease
BMI Body Mass Index
ERP Estimated Resident Population
HVRF Hunter Valley Research Foundation
K10 Kessler 10
LGA Local Government Area
NSW New South Wales
TIA Transient Ischaemic Attack
kg kilogram
m metre
Erratum: Northern Sydney Central Coast Community Health Survey Profile of cardiovascular disease and associated risk factor: Analysis of telephone survey 2010. Page 8 ‘Nutrition’ reported that the 'proportion of people having a sufficient intake of vegetables has doubled since 2006’ and is reflected in Figure 5 and Table 7 as well as Table 1 comparisons for 2006 and 2010 surveys by Health Service Area (page v). This is incorrect. In 2010, new definitions for vegetable consumption were proposed, based on age and sex dependent categories. Analysis was performed for both ‘old’ and ‘new’ categories. Data for the ‘new’ categories was mistakenly included in the CHS 2010. Table 1, sufficient vegetables, 2010 data should read: Central Coast 8.5% (±1.9); Hornsby Ku-ring-gai 10.0% (±3.0%); Northern Beaches 6.8% (±2.2%); and North Shore/Ryde 8.2% (±2.6%).

vi
Executive Summary From 16th January to the 6th March 2014, 1,003 residents of the Central Coast of New South Wales took part in a telephone health survey. Questions covered the health priority areas of cardiovascular disease, respiratory disease, diabetes, and associated risk factors. The survey also collected data on emerging health areas such as the built environment, active travel, social support, and health topics of relevance to key partners. Questions and methods were largely adopted from the NSW Health Adult Population Health Survey. Results are reported for the Central Coast and its two local government areas of the City of Gosford and Wyong Shire. Matching results for the 2006, 2010 and 2014 Community Health Surveys are presented in the same format (Table 1, p. vii). Health Related Behaviours Health behaviours directly influence preventable illness and death throughout adulthood. Rates of sufficient physical activity remain low at 53%. The proportion of the population reporting as current smokers has declined since 2006 from 20% to 12% in 2014. Over this time, more homes were reported as smoke free. Only half the population reported a sufficient intake of fruit while the proportion of people having a sufficient intake of vegetables has declined since 2006 from 10% to 7% in 2014. Health Status Health status provides self-reported prevalence of doctor diagnosed chronic disease with an emphasis on cardiovascular disease and its associated risk factors. Some key findings are:
The proportion of people with hypertension increased from 27% in 2006 to 30% in 2014
Self-reported high cholesterol increased from 22% in 2006 to 26% in 2014.
Self-reported obesity (from height and weight data) has increased since 2006 from 17% to 26% in 2014.
Since 2006, self-reported diabetes increased for the Central Coast from 7.9% to 10.3% in 2014.
Central Coast reported similar proportion of people with emphysema since 2006 at 2.3% in 2014. Access to Health Services Most (93%) Central Coast adults have a regular GP practice and a regular doctor at that practice (93%). Most respondents (72%) also attended a regular pharmacy. However, 16% of Central Coast adults report having difficulties getting health care when needed. Social Support People participate directly in the community through a wide range of social and other types of groups. Popular social activities included: going to a café, restaurant or bar, using online social media, taking part in sport or physical activity, visiting a park, the botanic gardens, zoo or theme park, and attending a movie, theatre or concert. A person's social or support networks include people who they can turn to for help with small favours or routine household tasks. Respondents indicated their spouse as the main source of help when sick (53.3%) and the majority felt they could discuss health issues with friends or family members most or some of the time.

vii
Table 1: Comparison of cardiovascular disease risk factors for the 2006, 2010 and 2014 Community Health Surveys, Central Coast. Sex and age weighted population estimates (%) and 95% Confidence Intervals
Question Name Indicator 2006 (w%)
2010 (w%)
2014 (w%)
He
alth
Be
hav
iou
rs
Sufficient Physical Activity
Achieved 150 minutes physical activity over at least 5 sessions in the last week
51.2 (±3.4)
50.9 (±3.7)
53.3 (±3.6)
Daily smoker Status described as ‘I smoke daily’ 19.9 (±2.8)
12.5 (±2.5)
11.8 (±2.3)
Smoke free home Described as ‘My home is smoke free’ 85.6 (±2.5)
91.4 (±2.1)
92.4 (±1.8)
Sufficient fruit intake Consumed at least 2 serves of fruit daily 48.6 (±3.4)
48.9 (±3.7)
50.2 (±3.6)
Sufficient vegetable intake
Consumed at least 5 serves of vegetables daily
10.2 (±1.9)
8.5 (±1.9)
7.4 (±1.8)
He
alth
Sta
tus
High psychological distress
Based on Kessler 10 scores 7.1 (±1.7)
6.9 (±1.8)
-
Very high psychological distress
Based on Kessler 10 scores 2.5 (±1.1)
2.8 (±1.2)
-
Hypertension Told by a doctor or at a hospital that you have high blood pressure...hypertension
27.2 (±2.8)
27.8 (±2.9)
29.7 (±3.1)
Hyperlipidaemia Told by a doctor or at a hospital that you have high cholesterol
22.2 (±2.6)
26.6 (±2.9)
26.3 (±2.9)
Overweight Self-reported height & weight (BMI > 25Kg/m
2 )
36.8 (±3.3)
33.9 (±3.5)
33.8 (±3.4)
Obese Self-reported height & weight BMI > 30Kg/m
2
17.5 (±2.5)
22.4 (±3.0)
25.7 (±3.1)
Self-perceived weight [Do you] consider yourself to be overweight 46.8 (±3.4)
42.6 (±3.6)
48.4 (±3.6)
Stroke/TIA Told by a doctor or at a hospital that you have had a stroke or TIA
4.3 (±1.1)
4.2 (±1.1)
3.6 (±1.1)
Heart condition Told by a doctor or at a hospital that you have heart disease or a heart condition
12.8 (±2.0)
13.6 (±2.0)
13.7 (±2.2)
Diabetes Told by a doctor or at a hospital that you have diabetes
7.9 (±1.6)
10.0 (±1.9)
10.3 (±1.9)
Emphysema Told by a doctor or at a hospital that you have emphysema
2.2 (±0.8)
2.6 (±0.9)
2.3 (±0.9)
COPD Told by a doctor or at a hospital that you have COPD
1.5 (±0.7)
1.8 (±0.8)
2.5 (±1.0)
COPD or Emphysema Calculated from questions above for COPD, Emphysema
2.9 (±0.9)
3.2 (±1.0)
4.0 (±1.2)
Asthma Told by a doctor or at a hospital that you have asthma
17.8 (±2.6)
21.7 (±3.2)
22.6 (±3.1)

1
Introduction The Central Coast Community Health Survey 2014 (CHS 2014) is a random telephone survey of Central Coast residents aged 18 years and over. It provides local, self-reported prevalence data for the priority areas of cardiovascular disease, respiratory disease and diabetes and associated risk factors. Many of the risk factors are common across multiple conditions such as physical activity, nutrition, and smoking. This survey builds on the foundations of prior studies conducted 4-yearly since 2002, and allows for some trend monitoring, particularly with the 2006 and 2010 Central Coast Community Health Surveys [1]. It also allows for the collection of data on emerging health areas such as the built environment and active travel, and health topics of current relevance to key partners. The data informs health promotion, and service and strategic planning, by the Central Coast Local Health District, the Central Coast NSW Medicare Local (Primary Health Network) and other organisations. Results are reported for the Central Coast and its two local government areas (LGAs) of the City of Gosford and Wyong Shire. Matching results for the 2006, 2010 and 2014 Community Health Surveys are presented in the same format (Table 1, p. vii). A complete methodology is provided in Appendix 1 and the CHS 2014 Questionnaire in Appendix 2. In the 2014 survey, there were a total of 1003 respondents: 512 respondents from Gosford LGA and 491 respondents from Wyong LGA. People of Aboriginal and/or Torres Strait Islander origin comprised 2.7% of the survey population.
Methods The Hunter Valley Research Foundation (HVRF) conducted the survey using a computer aided telephone interviewing (CATI) system which guides trained interviewers through the introduction, subject selection and interview process. A random digit dialling sample was randomly selected from the Central Coast LGAs of the City of Gosford and Wyong Shire. The survey questions were largely adapted from New South Wales Adult Population Health Survey, an ongoing survey of the health of the people, conducted by NSW Health using the CATI method. Sampling Strategy We aimed to interview 1,000 adults 18 years and over and living on the Central Coast. Table 2 shows the distribution of respondents (n=1003) for the 2014 survey.
Table 2: Population distribution by age and LGA (n=1003), Central Coast, CHS 2014
Age Group (years) Gosford Wyong Total
18-64 336 345 681 ≥ 65 years 176 146 322
Total 512 491 1003
Response Rate The overall response rate obtained for the survey was 78.5%.

2
Weighting The weighting process effectively converts the age and sex profile of the sample to that of the Estimated Resident Population (ERP). Weights for each local government area in each sex/age group strata were calculated as number in population / number in sample (Figures 1-3). Weights were applied to questions which were answered by the whole survey population. Age and Sex Appendix 3 shows the age/sex breakdown for the Central Coast population at December 2013, and for the study sample. The population counts for 18 and 19 year old males and females for December 2013 were extrapolated from the June 2008 to June 2012 ABS single year sex specific age group data. This included December data resulting in 9 data points for each sex/age group. The population counts for 18 and 19 year old males and females are calculated from each sex/age group’s Least Squares Regression (which minimises the estimated error) line equation over that time period.
0
200
400
600
800
1000
1200
1400
1600
1800
2000
2200
2400
18 19 20-24 25-29 30-34 35-39 40-44 45-49 50-54 55-59 60-64 65-69 70-74 75-79 80-84 85+
We
igh
ted
Po
pu
lati
on
Age Group
Weight M
Weight F
Figure 1: Central Coast population weights by age and sex at Dec 31 2013

3
0
200
400
600
800
1000
1200
1400
1600
1800
2000
2200
2400
18 19 20-24 25-29 30-34 35-39 40-44 45-49 50-54 55-59 60-64 65-69 70-74 75-79 80-84 85+
We
igh
ted
Po
pu
lati
on
Age Group
Weight M
Weight F
Figure 2: Gosford LGA population weights by age and sex at Dec 31 2013
0
200
400
600
800
1000
1200
1400
1600
1800
2000
2200
2400
18 19 20-24 25-29 30-34 35-39 40-44 45-49 50-54 55-59 60-64 65-69 70-74 75-79 80-84 85+
We
igh
ted
Po
pu
lati
on
Age Group
Weight M
Weight F
Figure 3: Wyong LGA population weights by age and sex at Dec 31 2013

4
Format of this Report The Community Health Survey results are reported under four headings: 1. Health related behaviours – include risk factors for chronic lifestyle diseases that are under the
direct control of individuals e.g. choosing to smoke or participate in physical activity. 2. Health status – prevalence of health conditions (cardiovascular disease, respiratory disease,
diabetes) within the community. Health status was based on answers to the question “have you ever been told by a doctor or at a hospital that you have …” (refer to Appendix2: Telephone Survey Questions, 2014).
3. Health service use – covers health services used, access issues, difficulties getting health care and
after-hours services, consulting with medical specialists, medication cost, and public dental services.
4. Social Support – the relationships and conventions that shape social networks, foster trust and
facilitate cooperation for mutual benefit. Questions include health support networks and participation in the local community.
All data are based on self-reported information. Weighted proportion (%) data is provided unless otherwise stated.
Error bars represent 95% confidence limits. NSW population estimates provided by the NSW Adult Population Health Survey are cited, where available. Smoothed and/or actual estimates are reported as provided. The CHS 2014 reports actual estimates only. The NSW Adult Population Health Survey targets adults aged 16 years and over; the CHS 2014 targets adults 18 years and over. Text information for each of the Indicators (e.g. physical activity, smoking, diabetes) is often drawn from Health Statistics NSW, and sometimes other references. Readers are encouraged to visit Health Statistics NSW [2] for further information.

5
PART 1: HEALTH-RELATED BEHAVIOURS
Physical Activity To maintain good health, the national physical activity guidelines for adults recommend at least 30 minutes of moderate activity on most, and preferably all, days of the week. Moderate intensity activity includes brisk walking, dancing, swimming, or cycling, which can be undertaken in shorter bursts such as 3 lots of 10 minutes [2]. Sufficient physical activity was defined as a total of at least 150 minutes per week over at least 5 separate occasions. The total minutes are calculated by adding minutes in the last week spent walking continuously for at least 10 minutes, plus minutes doing moderate physical activity, plus 2 x the number of minutes doing vigorous physical activity [1]. In this report, respondents were classified as ‘sedentary’ if they reported no physical activity during the previous week and ‘insufficiently active’ if they reported some activity, but not enough to be classified as sufficiently active. The 2013 NSW Adult Population Health Survey reported the actual estimate of 51.5% for adults aged 16 years and over undertaking adequate levels of physical activity (CC actual, 48.3%)[2]. The CHS 2014 estimated that 53.3% of Central Coast adults aged 18 years and over undertook adequate levels of physical activity. Figure 4 and Table 3 indicate that a higher proportion of Gosford respondents reported sufficient physical activity (55.0%) than Wyong respondents (50.5%). There appeared to be an increase in the proportion of sedentary adults from 9.0% reported in the CHS 2010 to 13.2% in 2014. There was also a decrease in insufficient physical activity from 37.3% in 2010 to 31.2% in 2014.
Figure 4: Physical activity categories by Central Coast LGAs, CHS 2014

6
Table 3: Estimated population proportion (95% Cl) for physical activity categories by LGA, Central Coast, CHS 2014
Question qex1 - qex6 Gosford (n=512) Wyong (n=491) Central Coast (n=1003)
Sedentary 13.0 (8.5 – 17.4) 13.9 (10.4 – 17.4) 13.2 (10.7 – 15.8)
Insufficient 29.1 (24.0 – 34.3) 34.0 (29.4 – 38.6) 31.2 (28.0 – 34.4)
Sufficient 55.0 (49.5 – 60.6) 50.5 (45.4 – 55.7) 53.3 (49.8 – 56.9)
Don’t know 2.9 ( 1.4 – 4.4) 1.6 (0.0 – 3.4) 2.2 (1.2 – 3.3)

7
Smoking Status Tobacco smoking is the leading preventable cause of illness and premature death, particularly from cardiovascular disease, cancers of the lung, larynx, and mouth, and chronic obstructive pulmonary disease. Current evidence on the mechanisms by which smoking causes disease indicates that there is no risk-free level of exposure to tobacco smoke [2]. The 2013 NSW Adult Population Health Survey reported the smoothed estimate of 16.2% for adults aged 16 years and over who were ‘current smokers’, that is, they smoked daily or occasionally (CC smoothed, 17.3%). Smoking status was categorised as (actual estimates only): 12.0% of adults smoked daily, 4.4% who smoked occasionally, 24.1% had smoked in the past, 8.9% had tried smoking a few times but never smoked regularly, and 50.6% had never smoked. The CHS 2014 estimated that 14.7% of Central Coast adults aged 18 years and over were current smokers, that is, they smoked daily or occasionally. The ‘daily’ smoking rate for Central Coast residents has fallen since the CHS 2006 from 19.9% to 11.8% reported in 2014 (Tables 1 & 4). This is consistent with the NSW Adult Population Health Survey which indicated a decline in ‘daily’ smoking from 20.1% to 12.0%. Figure 5 shows the high proportion of respondents reporting as ex-smokers or having ‘never smoked’.
Figure 5: Tobacco smoking status by Central Coast LGAs, CHS 2014

8
Table 4: Estimated population proportion (95% Cl) for current tobacco smoking status by LGA, Central Coast, CHS 2014
Question qtb1 Gosford (n=512) Wyong (n=491) Central Coast (n=1003)
Daily 10.3 (7.6 – 13.0) 12.2 (8.9 – 15.5) 11.8 (9.5 – 14.1)
Occasionally 3.9 (1.9 – 5.8) 2.3 (0.6 – 3.9) 2.9 (1.7 – 4.1)
Not now but used to 28.9 (24.2 – 33.6) 30.5 (26.2 – 34.9) 29.2 (26.1 – 32.3)
Few times but never regularly 10.6 (7.0 – 14.3) 13.0 (9.1 – 16.9) 11.7 (9.2 – 14.2)
Never 46.3 (40.8 – 51.8) 42.1 (37.0 – 47.1) 44.4 (40.8 – 48.0)
Smoking in the Home The 2012 NSW Adult Population Health Survey reported the smoothed estimate of 93.1% (actual 92.6%) for adults living in homes that were smoke-free (CC actual, 92.9).
The CHS 2014 estimated that 92.4% of Central Coast adults aged 18 years and over lived in homes that were smoke free; a marked improvement from 85.6% in 2006 (Table 1). Figure 6 & Table 5 indicate that more homes were smoke free in Gosford than in Wyong LGA (95.1%, 89.3% respectively).
Figure 6: Exposure to tobacco smoke in the home by Central Coast LGAs, CHS 2014 Table 5: Estimated population proportion (95% Cl) for tobacco smoking in the home by LGA, Central Coast, CHS 2014
Question qtb5 Gosford (n=512) Wyong (n=491) Central Coast (n=1003)
My home is smoke free 95.1 (93.2 – 97.0) 89.3 (86.1 – 92.5) 92.4 (90.6 – 94.2)
People occasionally smoke in the house 1.7 (0.6 – 2.9) 5.2 (2.8 – 7.5) 3.4 (2.1 – 4.7)
People frequently smoke in the house 3.2 (1.6 – 4.7) 5.5 (3.2 – 7.8) 4.2 (2.9 – 5.5)

9
Alcohol Excessive alcohol consumption is one of the main preventable public health problems in Australia. Long term adverse effects of high consumption of alcohol on health include contribution to cardiovascular disease, some cancers, cirrhosis of the liver, mental health conditions, long term cognitive impairment, and self-harm [2].
The lifetime risk of harm from alcohol-related disease or injury is reduced by drinking no more than two standard drinks on any day when drinking alcohol. The questions used to define the indicator were: How often do you usually drink alcohol? On a day when you drink alcohol, how many standard drinks do you usually have? A standard drink is equal to 1 middy of full-strength beer, 1 schooner of light beer, 1 small glass of wine, or 1 pub-sized nip of spirits [2]. The 2013 NSW Adult Population Health Survey reported the smoothed estimate of 26.5% (actual 26.6%) for adults aged 16 years and over consuming alcohol at levels posing lifetime risk to health (CC smoothed estimate, 28.9%; actual 30.4%). The CHS 2014 estimated that 33.6% of Central Coast adults aged 18 years and over consumed more than 2 standard alcoholic drinks on a day when they consumed alcohol i.e. at levels posing lifetime risk to health (Figure 7).
Figure 7: Alcohol consumption Central Coast, CHS 2014

10
Perceived Sufficiency in Number of Liquor Outlets in Neighbourhoods Participants were asked “how do you feel about the number of places in your neighbourhood where you can buy alcohol to take home?” This was followed by a short message “there is evidence that increased access to alcohol is associated with an increase in local crime, violence and underage drinking”. Participants were then asked “in light of this, how do you feel about the number of places in your neighbourhood where you can buy alcohol to take home?” Figures 8 and 9 indicate a shift in people’s response on receiving the short message regarding access to alcohol and increase levels of crime, violence and underage drinking. There was a marked decline in those suggesting ‘there are enough’ places to buy alcohol (68.8% to 58.7%) with a corresponding increase in those suggesting ‘there are too many’ (23.4% to 35.4%). The breakdown for estimated population proportions by Gosford and Wyong LGAs is provided in Table 6. Table 6: Estimated population proportion (95% Cl) of perceived sufficient places to buy alcohol in the neighbourhood, before and after educational intervention by Central Coast LGAs, CHS 2014
Question qalc6 & qalc6A Gosford (n=512) Wyong (n=491) Central Coast (n=1003)
Pre Post Pre Post Pre Post
There are too many 24.5 (19.7-29.2)
37.9 (32.4-43.4)
21.6 (17.6-25.5)
33.8 (28.9-38.6)
23.4 (20.4-26.3)
35.4 (32.0-38.8)
There are enough 69.6 (64.6-74.6)
55.8 (50.3-61.2)
68.7 (64.1-73.2)
60.9 (55.9-65.8)
68.8 (65.6-72.1)
58.7 (55.1-62.2)
There are not enough 1.5 (0.0-3.1)
1.0 (0.0-2.4)
2.2 (0.6-3.7)
1.0 (0.0-2.2)
1.7 (0.8–2.5)
1.0 (0.1-2.0)
Don't Know 4.4 (2.8-6.0)
5.4 (3.4-7.3)
7.6 (5.0-10.3)
4.3 (2.5-6.1)
6.1 (4.5-7.8)
4.9 (3.6-6.2)

11
Figure 8: Respondent perception of sufficient places to buy alcohol in their neighbourhood, pre- and post-educational intervention, Central Coast, CHS 2014
Figure 9: Respondent perception of sufficient places to buy alcohol in their neighbourhood pre- and post-educational intervention by LGAs, CHS 2014

12
Nutrition Fruit and vegetable consumption is strongly linked to the prevention of chronic disease and to better health. Vegetables and fruit are sources of antioxidants, fibre, folate, and complex carbohydrates. The fibre and low-energy content of fruit and vegetables may benefit weight control. Inadequate fruit and vegetable consumption is associated with coronary heart disease, some cancers, Type 2 diabetes, overweight and obesity, osteoporosis, dental caries, gall bladder disease, and diverticular disease [2]. The term ‘sufficient’ is defined as two serves of fruit per day and five serves of vegetables per day. One serve is ½ cup cooked or 1 cup raw vegetables or 1 cup of salad vegetables; or 1 medium piece or 2 small pieces of fruit or 1 cup of diced pieces (not juice) [2]. The 2013 NSW Adult Population Health Survey reported the actual estimates of 51.8% for adults aged 16 years and over consuming 2 or more serves of fruit (CC actual, 47.7%), and 9.4% consuming 5 or more serves of vegetables (CC actual, 7.3%). Figure 10 shows the proportion of respondents consuming sufficient fruit and vegetables. These two categories are not mutually exclusive. The CHS 2014 estimated that 50.2% of Central Coast adults aged 18 years and over consumed sufficient fruit and only 7.4% of adults consumed sufficient vegetables (Tables 7 and 8). Vegetable intake appears to be in decline from 10.2% in 2006 to 7.4% in 2014 (Table 1).
Figure 10: Sufficient serves of fruit and vegetables by Central Coast LGAs, CHS 2014

13
Table 7: Estimated population proportion (95% Cl) of sufficient serves of fruit by LGA, Central Coast, CHS 2014
Question qdt2 Gosford (n=512) Wyong (n=491) Central Coast (n=1003)
Sufficient 51.0 (45.5 – 56.4) 48.3 (43.2 – 53.4) 50.2 (46.6 – 53.7)
Insufficient 48.9 (43.4 – 54.4) 51.5 (46.4 – 56.6) 49.7 (46.1 – 53.2)
Don’t Know - 0.2 (0.0 – 0.6) 0.1 (0.0 – 0.3)
Refused 0.2 (0.0 – 0.4) - 0.1 (0.0 – 0.2)
Table 8: Estimated population proportion (95% Cl) of sufficient serves of vegetables by LGA, Central Coast, CHS 2014
Question qdt1 Gosford (n=512) Wyong (n=491) Central Coast (n=1003)
Sufficient 6.2 (4.0 – 8.3) 7.9 (5.0 – 10.9) 7.4 (5.5 – 9.2)
Insufficient 93.2 (91.0 – 95.4) 91.7 (88.7 – 94.7) 92.1 (90.2 – 94.0)
Don’t Know 0.7 (0.0 – 1.3) 0.3 (0.0 – 0.8) 0.5 (0.1 – 1.0)

14
Influenza Vaccination Influenza immunisation significantly reduces morbidity and preventable mortality. Influenza vaccination is recommended and funded for all people aged 65 years and over, Aboriginal and Torres Strait Islander people aged 15 years and over, pregnant women, and people aged 6 months or over with conditions predisposing to severe influenza. It needs to be given each year [2]. The 2013 NSW Adult Population Health Survey reported the actual estimate of 71.0% for adults aged 65 years and over being vaccinated against influenza in the past 12 months (CC actual, 75.3%). There were 401 participants in the CHS 2014 aged 65 years and over. It was estimated that 69% of Central Coast adults aged 65 years and over were vaccinated against influenza in the past 12 months (Figure 11 and Table 9).
Figure 11: Respondents 65 years and over vaccinated against flu in the past 12 months by LGAs, Central Coast, CHS 2014 Table 9: Estimated population proportion (95% Cl) for respondents aged 65 years and over (n=401), vaccinated against flu in the past 12 months by LGA, Central Coast, CHS 2014
Question qvc1 Gosford (n=211) Wyong (n=190) Central Coast (n=401)
Yes 66.8 (60.1 – 73.6) 70.2 (63.3 – 77.1) 68.8 (64.1 – 73.5)
No 33.2 (26.4 – 39.9) 29.8 (22.9 – 36.7) 31.2 (26.5 – 35.9)

15
Active Travel Active travel choices, such as walking, cycling, and/or using public transport for their daily travel, can help people attain their minimum physical activity requirements. Living in a neighbourhood that is ‘walkable’ and/or ‘cycleable’ (e.g. where housing is close to shops and services, streets and pathways are highly connected, public transport is available, urban design is conducive to walking and cycling) is associated with higher levels of physical activity [3]. In 2010, the NSW Adult Population Health Survey reported that among adults aged 16 years and over who were employed, the usual form of transport to work was: car as driver (72.6%), train (9.3%), walk only (5.8%), bus (5.5%), car as passenger (3.9 %), bicycle (1.6%), motorbike or motor scooter (0.5%), and truck (0.4%). The CHS 2014 estimated that 84.9% of Central Coast adults aged 18 years and over travelled by car or train (8.7%) to work or study. Residents of Wyong LGA were more likely to travel by car (88.4%) than their Gosford counterparts (81.4%). Gosford residents used train travel more often than Wyong residents. Both LGAs report very low levels of walking and cycling (Figure 12 and Table 10).
Figure 12: Main form of travel to work or study, Central Coast, CHS 2014
Table 10: Participants main form of travel to work or study by LGA, Central Coast, CHS 2014
Question qtr2 Gosford (n=247) Wyong (n=250) Central Coast (n=497)
Train 12.6 4.8 8.7
Bus 0.4 1.2 0.8
Car 81.4 88.4 84.9
Ute/panel van/truck* 1.6 3.6 2.6
Passenger Van / people mover* 0.4 0.0 0.2
Motorbike or scooter* 0.4 0.4 0.4
Bicycle 0.4 0.8 0.6
Walk 2.8 0.8 1.8
*Combined = ‘Other’ in figure 12

16
Companion Animals (Pets) Around 63% of Australian households have at least one companion animal (pet) and most consider them as a valued family member. Compared with non-owners, people who own companion animals show lower levels of risk factors associated with heart disease, deal better with stressful situations, and are less likely to report feeling lonely. Companion animals can enhance social connectedness, and make great caregivers – offering comfort, a sense of safety, and companionship [4]. The CHS 2014 estimated that 63% of Central Coast adults aged 18 years and over owned a companion animal (Table 11): 45% had at least one dog and 19% at least one cat (Figure 13). In Figure 13 ‘other’ refers to guinea pigs, rats, snakes, lizards and horse/pony.
Figure 13: Pet ownership by type of pet for Central Coast respondents, CHS 2014 Table 11: Estimated population proportion (95% Cl) for respondents who own an animal as a pet by LGAs, Central Coast, CHS 2014
Question qvc1 Gosford (n=512) Wyong (n=491) Central Coast (n=1003)
Yes 62.6 (57.4 – 67.9) 64.5 (59.7 – 69.3) 63.1 (59.7 – 66.6)

17
PART 2: HEALTH STATUS Among the spectrum of cardiovascular disease, the four types responsible for the most deaths in NSW are coronary heart disease (or ischaemic heart disease), stroke (or cerebrovascular disease), heart failure, and peripheral vascular disease. These share a number of behavioural risk factors (tobacco smoking, physical inactivity, poor diet, risky alcohol consumption) leading to physiological risk factors (high blood pressure, elevated blood lipids, diabetes mellitus, and overweight or obesity) [2].
Hypertension Hypertension is a major risk factor for coronary heart disease, stroke, heart failure, peripheral vascular disease and renal failure [5]. The 2013 NSW Adult Population Health Survey reported the actual estimate of 28.4% for adults 16 years and over who had ever been told by a doctor or hospital that they had high blood pressure. Central Coast adults were higher than the State average at 32.5%. The CHS 2014 estimated that 29.7% of Central Coast adults aged 18 years and over had ever been told by a doctor or hospital they had high blood pressure (Figure 14 and Table 12). This excludes those reporting high blood pressure temporarily or during pregnancy.
Figure 14: Proportion of respondents reporting hypertension by Central Coast LGA, CHS 2014

18
Table 12: Estimated population proportion (95% Cl) of respondents with hypertension by LGAs, Central Coast, CHS 2014
Question qcvd1 Gosford (n=512) Wyong (n=491) Central Coast (n=1003)
Yes 28.5 (23.7 – 33.2) 31.9 (27.5 – 36.4) 29.7 (26.6 – 32.8)
No 67.7 (62.8 – 72.6) 63.6 (58.9 – 68.3) 65.8 (62.5 – 69.0)
Yes, but only during pregnancy 0.9 (0.0 – 1.8) 1.8 (0.3 – 3.2) 1.5 (0.5 – 2.5)
Yes, but only temporarily 2.8 (1.4 – 4.2) 2.1 (1.0 – 3.3) 2.6 (1.7 – 3.5)
Don't Know 0.1 (0.0 – 0.3) 0.5 (0.0 – 1.6) 0.4 (0.0 – 1.2)

19
Hyperlipidaemia High blood cholesterol is a major risk factor for coronary heart disease and possibly some types of stroke [6]. The 2013 NSW Adult Population Health Survey reported the actual estimate of 20.9% of adults who had ever been told by a doctor or hospital they had high cholesterol (CC actual, 21.7%). The CHS 2014 estimated that 26.3% of Central Coast adults aged 18 years and over had ever been told by a doctor or hospital they had high blood pressure. Wyong reported slightly higher levels of cholesterol than Gosford (Figure 15 and Table 13).
Figure 15: Proportion of respondents reporting hyperlipidaemia by Central Coast LGAs, CHS 2014 Table 13: Estimated population proportion (95% Cl) of respondents with hyperlipidaemia by LGA, Central Coast, CHS 2014
Question qcvd2 Gosford (n=512) Wyong (n=491) Central Coast (n=1003)
Yes 24.6 (20.6 – 28.7) 28.2 (23.9 – 32.4) 26.3 (23.4 – 29.2)
No 70.4 (66.0 – 74.7) 68.2 (63.8 – 72.7) 69.6 (66.5 – 72.6)
Borderline 4.7 (3.0 – 6.5) 3.4 (1.7 – 5.1) 3.9 (2.8 – 5.0)
Don’t Know 0.2 (0.0 – 0.6) 0.2 (0.0 – 0.6) 0.3 (0.0 – 0.6)

20
Overweight and Obesity Obesity is strongly linked to Type 2 diabetes and being overweight can hamper the ability to control or manage chronic disorders. Many of these are often preventable through a healthy and active lifestyle [7]. Using self-reported height and weight, a self-reported Body Mass Index (BMI) is calculated by dividing a person’s weight (kilograms) by their height (metres) squared i.e. kg /m2. The Central Coast Community Health Surveys (2002 – 2014) have consistently applied the World Health Organization weight categories: underweight (BMI < 18.5), acceptable or ideal weight (BMI ≥18.5 and < 25), overweight (BMI ≥ 25 and < 30), and obese (BMI ≥ 30) [8]. While many studies have observed a high correlation between BMI calculated from self-reported and measured height and weight, there is evidence that self-reported height and weight is not as exact a measure. While caution is advised when interpreting BMI calculated from self-reported height and weight, it is still useful for ongoing surveillance of population health [9]. The 2013 NSW Adult Population Health Survey reported the smoothed estimate of 50.5% (actual 51.2%) for adults aged 16 years and over being overweight or obese (CC smoothed estimate, 59.6%; actual 62.6%). The CHS 2014 estimated that 59.5% of Central Coast adults aged 18 years and over were overweight or obese (Table 14). Figure 16 and Table 14 indicate that more Wyong respondents were in the obese category compared with Gosford respondents. Self-reported obesity (from height and weight data) has increased since 2006 from 17.5% to 25.7% in 2014 (Table 14).
Figure 16: Proportion of respondents in BMI categories by LGA, CHS 2014
21
Table 14: Estimated population proportion (95% Cl) for respondents in Body Mass Index categories by LGAs, Central Coast, CHS 2014
Question qhw1 – qhw2 Gosford (n=512) Wyong (n=491) Central Coast (n=1003)
Underweight 3.6 (1.3 – 5.9) 1.6 (0.4 – 2.8) 2.5 (1.3 – 3.8)
Acceptable 38.7 (33.3 – 44.1) 31.9 (27.1 – 36.7) 35.1 (31.7 – 38.5)
Overweight 34.0 (28.8 – 39.2 33.1 (28.2 – 37.9) 33.8 (30.4 – 37.2)
Obese 21.8 (17.5 – 26.0) 29.9 (25.3 – 34.4) 25.7 (22.6 – 28.8)
Missing 2.0 (0.8 – 3.1) 3.5 (1.6 – 5.5) 2.8 (1.7 – 4.0)
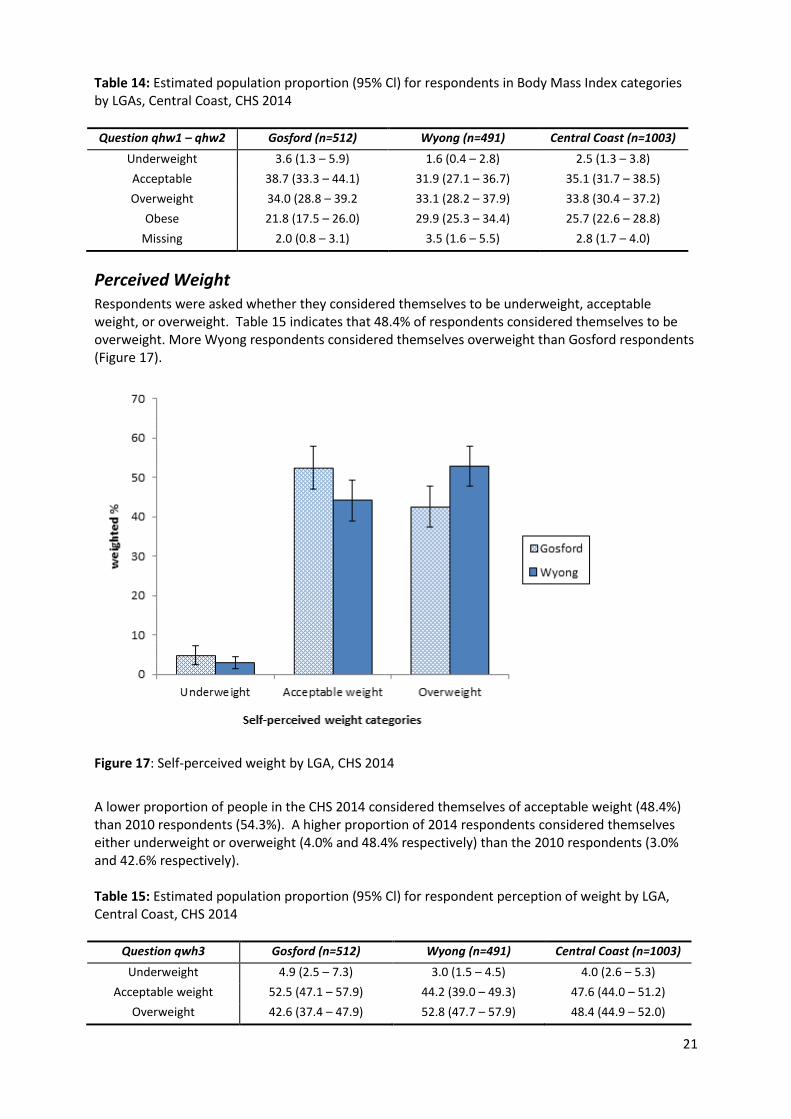
Perceived Weight Respondents were asked whether they considered themselves to be underweight, acceptable weight, or overweight. Table 15 indicates that 48.4% of respondents considered themselves to be overweight. More Wyong respondents considered themselves overweight than Gosford respondents (Figure 17).
Figure 17: Self-perceived weight by LGA, CHS 2014
A lower proportion of people in the CHS 2014 considered themselves of acceptable weight (48.4%) than 2010 respondents (54.3%). A higher proportion of 2014 respondents considered themselves either underweight or overweight (4.0% and 48.4% respectively) than the 2010 respondents (3.0% and 42.6% respectively). Table 15: Estimated population proportion (95% Cl) for respondent perception of weight by LGA, Central Coast, CHS 2014
Question qwh3 Gosford (n=512) Wyong (n=491) Central Coast (n=1003)
Underweight 4.9 (2.5 – 7.3) 3.0 (1.5 – 4.5) 4.0 (2.6 – 5.3)
Acceptable weight 52.5 (47.1 – 57.9) 44.2 (39.0 – 49.3) 47.6 (44.0 – 51.2)
Overweight 42.6 (37.4 – 47.9) 52.8 (47.7 – 57.9) 48.4 (44.9 – 52.0)

22
Heart Disease (Previous Cardiovascular Disease) Respondents were asked whether they had ever been told by a doctor or at a hospital that they had heart disease or a heart condition. Those reporting heart disease or a heart condition were asked what type. Respondents could list more than one condition. Figure 18 and Table 16 show that 13.7% of Central Coast adults aged 18 years and over reported having ever been told by a doctor or at a hospital that they had heart disease, mostly irregular heartbeat. Wyong respondents reported a higher proportion of previous CVD (15.5%) than Gosford LGA respondents (11.6%). Considerably more Wyong respondents said yes to ‘heart attack’ than those in Gosford LGA (41.4% and 24.3% respectively); likewise for heart failure (16.1% and 4.3% respectively).
Figure 18: Self-reported prevalence of heart disease by type and Central Coast LGAs (unweighted data), CHS 2014 Table 16: Estimated population proportion (95% Cl) of respondents reporting heart disease or heart condition by LGA, Central Coast, CHS 2014
Question qcvd3 Gosford (n=512) Wyong (n=491) Central Coast (n=1003)
Yes 11.6 (8.8 – 14.4) 15.5 (12.1 – 18.8) 13.7 (11.5 – 15.8)
No 88.4 (85.6 – 91.2) 84.1 (80.7 – 87.5) 86.2 (84.0 – 88.4)
Don’t Know - 0.4 (0.0 – 1.0) 0.1 (0.0 – 0.4)

23
Previous Stroke / Transient Ischaemic Attack (TIA) Stroke can produce a range of effects from minor impairment of motor function to catastrophic neurological impairment, and can be fatal. Transient ischaemic attack (TIA) has similar symptoms to a stroke, usually caused by a temporary blockage of the blood supply to the brain and often lasting only a few minutes and producing stroke-like symptoms that disappear within 24 hours. Risk factors for stroke include TIA, high blood pressure, tobacco smoking, diabetes, high alcohol consumption, high blood cholesterol, atrial fibrillation, other heart disease and narrowing of the carotid arteries [10]. The CHS 2014 estimated that 3.6% of Central Coast adults aged 18 years and over reported previous stroke or TIA (Figure 19 and Table 17).
Figure 19: Proportion of respondents reporting previous stroke/TIA by LGA, CHS 2014 Table 17: Estimated population proportion (95% Cl) of respondents reporting previous stroke or TIA by LGA, Central Coast, CHS 2014
Question qcvd5 Gosford (n=512) Wyong (n=491) Central Coast (n=1003)
Yes 3.3 (1.8 – 4.7) 4.1 (2.3 – 5.9) 3.6 (2.5 – 4.7)
No 96.7 (95.3 – 98.2) 95.6 (93.7 – 97.5) 96.2 (95.1 – (97.3)
Don’t Know - 0.3 (0.0 – 0.8) 0.2 (0.0 – 0.4)

24
Diabetes Diabetes now represents one of the most challenging public health problems worldwide. There are three main forms of diabetes mellitus [2]:
(1) Type 1 diabetes - present in 10-15% of people with diabetes, caused by a combination of genetic and environmental factors, but there are no known modifiable risk factors
(2) Type 2 diabetes - accounts for 85-90% of all diabetes in the community and primarily affects people older than 40 years
(3) Gestational diabetes which may occur during pregnancy and usually resolves after the baby is born
Several risk factors play a role in the onset of Type 2 diabetes, including obesity, physical inactivity, poor nutrition, genetic predisposition, and ageing [2]. The 2013 NSW Adult Population Health Survey reported the actual estimate of 8.4% for adults aged 16 years and over who had diabetes or high blood glucose (CC actual, 10.8%). Prevalence estimates have been increasing over time. The CHS 2014 estimated that 10.3% of Central Coast adults aged 18 years and over had ever been told by a doctor or hospital they had diabetes (Figure 20 and Table 18). This estimate has increased from 7.9% in 2006 (Table 18). Table 19 reports on type of diabetes as indicated by respondents.
Figure 20: Proportion of respondents reporting diabetes by Central Coast LGAs, CHS 2014

25
Table 18: Estimated population proportion (95% Cl) of respondents reporting diabetes by LGA, Central Coast, CHS 2014
Question qdi2 Gosford (n=512) Wyong (n=491) Central Coast (n=1003)
Yes 9.8 (7.1 – 12.5) 10.7 (8.0 – 13.4) 10.3 (8.4 – 12.2)
No 90.0 (87.3 – 92.7) 89.1 (86.4 – 91.8) 89.5 (87.6 – 91.4)
Don't Know 0.1 (0.0 – 0.4) 0.2 (0.0 – 0.5) 0.2 (0.0 – 0.4)
Table 19: Self-reported type of diabetes, Central Coast (weighted data), CHS 2014
Question qdi2 Gosford (n=1003)
No Diabetes 89.7 (87.8 – 91.6)
Type 1 0.9 (0.3 – 1.4)
Type 2 7.5 (5.9 – 9.1)
Gestational 2.0 (1.1 – 2.8

26
Chronic Obstructive Pulmonary Disease (COPD) COPD limits airflow to the lungs. The spectrum of COPD includes emphysema and chronic bronchitis. The main risk factor for COPD is tobacco smoking. The prevalence of COPD can be difficult to estimate. The current definitions of COPD and asthma overlap. An important distinguishing feature is that COPD develops over many years and mostly affects older people, while asthma affects people of all ages. People with COPD continue to lose lung function despite medication, which is not a common feature of asthma [11]. Figure 21 & Table 20 show the population proportions of respondents with emphysema, and Figure 22 & Table 21 show those reporting either COPD or emphysema. The CHS 2014 estimated that 2.3% of Central Coast adults aged 18 years and over had ever been told by a doctor or a hospital they had emphysema and 4.0% of Central Coast residents reporting having been diagnosed with COPD or emphysema.
Figure 21: Proportion of respondents reporting emphysema by Central Coast LGAs, CHS 2014 Table 20: Estimated population proportion (95% Cl) of respondents with emphysema by LGA, Central Coast, CHS 2014
Question qas3p1 Gosford (n=512) Wyong (n=491) Central Coast (n=1003)
Yes 2.2 (1.0 – 3.4) 2.6 (1.2 – 4.0) 2.3 (1.4 – 3.1)
No 97.8 (96.6 – 99.0) 97.4 (96.0 – 98.8) 97.7 (96.9 – 98.6)

27
Figure 22: Proportion of respondents reporting either COPD or emphysema by Central Coast LGAs, CHS 2014 Table 21: Estimated population proportion (95% Cl) of respondents with emphysema or COPD by LGA, Central Coast, CHS 2014
Question qas3 Gosford (n=512) Wyong (n=491) Central Coast (n=1003)
Yes 3.8 (2.2 – 5.3) 4.2 (2.4 – 6.0) 4.0 (2.8 – 5.2)
No 96.2 (94.7 – 97.8) 95.8 (94.0 – 97.6) 96.0 (94.8 – 97.2)

28
Asthma Asthma is a chronic inflammatory disorder of the airways in which, in response to a wide range of triggers, the airways narrow too much and too easily, resulting in episodes of wheeze, chest tightness, and shortness of breath. Asthma remains a significant health problem in Australia, with prevalence rates high by international standards [12]. The 2013 NSW Adult Population Health Survey reported the actual estimate of 10.0% for adults aged 16 years and over who currently had asthma (CC actual, 11.7%). Table 23 provides a time series for persons 16 years and over living on the Central Coast and reporting ‘current asthma’, 2002-2013. The CHS 2014 estimated that 22.6% of Central Coast adults aged 18 years and had ever been told by a doctor or hospital they had asthma (Figure 23 and Table 22). Since 2006, the proportion of respondents reporting asthma has increased from 17.8% to 22.6% (Table 1).
Figure 23: Proportion of respondents reporting asthma by Central Coast LGAs, CHS 2014
Table 22: Estimated population proportion (95% Cl) of respondents reporting ‘ever had asthma’ by LGA, Central Coast, CHS 2014
Question qas1 Gosford (n=512) Wyong (n=491) Central Coast (n=1003)
Yes 25.6 (19.8 – 31.4) 22.4 (18.0 – 26.7) 22.6 (19.5 – 25.6)
No 74.3 (68.5 – 80.0) 77.6 (73.3 – 82.0) 77.4 (74.3 – 80.4)
Don’t Know 0.1 (0.0 – 0.4) - 0.1 (0.0 – 0.2)

29
Table 23: Time series for current asthma, persons aged 16 years and over, Central Coast LHD, NSW 2002 to 2013. Extracted from Health Statistics NSW.
Year Number of Respondents
Actual estimate (%)
LL 95% CI UL 95% CI
2002 688 10.5 7.8 13.1
2003 745 12.3 9.5 15.0
2004 571 10.0 7.1 12.8
2005 433 8.2 5.2 11.2
2006 325 12.6 8.7 16.5
2007 293 8.5 4.4 12.7
2008 340 9.2 5.8 12.5
2009 416 8.8 5.8 11.9
2010 439 10.8 7.4 14.2
2011 857 11.3 8.2 14.5
2012 878 14.8 10.6 18.9
2013 834 11.7 8.4 15.1

30
Arthritis Osteoarthritis and rheumatoid arthritis are two of the most common types of arthritis. Osteoarthritis largely affects the weight-bearing joints of the hips, knees and ankles as well as the hands and spine. It is more common in females, more prevalent in later years of life, and is often associated with overweight and obesity [13]. The most severe form of arthritis is rheumatoid arthritis, an autoimmune disease in which the immune system of the body attacks its own tissues. It can affect joints, other body parts and organs. The incidence of rheumatoid arthritis is more common between the ages of 30 and 65 years, though it may occur at any age [13]. CHS 2014 estimated that 24.6% of Central Coast adults aged 18 years and over had arthritis (Figure 24 and Table 24). Of those who said ‘yes’ to ever being told by a doctor or at a hospital that they had arthritis, 70.8% reported osteoarthritis and 19.5% rheumatoid arthritis (Figure 25).
Figure 24: Proportion of respondents reporting arthritis by Central Coast LGAs, Central Coast, CHS 2014
Table 24: Estimated population proportion (95% Cl) of respondents reporting arthritis by LGA, Central Coast, CHS 2014
Question qch1 Gosford (n=512) Wyong (n=491) Central Coast (n=1003)
Yes 21.7 (17.9 – 25.4) 27.2 (23.1 – 31.3) 24.6 (21.8 – 27.3)
No 78.2 (74.4 – 81.9) 72.6 (68.5 – 76.8) 75.3 (72.5 – 78.0)
Don’t Know 0.2 (0.0 – 0.5) 0.2 (0.0 – 0.5) 0.2 (0.0 – 0.4)

31
Figure 25: Type of arthritis reported by Central Coast LGAs, CHS 2014

32
Other Chronic Health Conditions Figure 26 and Table 25 provide self-reported data for other chronic health conditions on the Central Coast, refer to the survey questionnaire question qch2 (Appendix 2). The CHS 2014 estimated that 18.6% of Central Coast adults aged 18 years and over had skin cancer. Of those who said ‘yes’ to ever being told by a doctor or at a hospital that they had skin cancer, 19.8% (n=227) reported that it was melanoma. It was estimated that 18.6% of Central Coast adults aged 18 years and over had experienced chronic pain. Chronic pain was not defined for respondents. Respondents were also asked if they had ever been told by a doctor or hospital that they had a chronic mental illness (e.g. schizophrenia, anxiety, depression or mood disorders) or a nervous system illness (e.g. multiple sclerosis, spinal cord injuries, epilepsy or seizures). It was estimated that 16.3% of Central Coast adults aged 18 years and over had ever been told they had a mental illness.
Figure 26: Proportion of respondents reporting chronic health conditions (weighted data), Central Coast, CHS 2014

33
Table 25: Estimated population proportion (95% Cl) of respondents reporting ‘other’ chronic health conditions by LGA, Central Coast, CHS 2014
Question qch2p1 – p9 Gosford (n=512) Wyong (n=491) Central Coast (n=1003)
Skin Cancer 18.1 (14.7 – 21.6) 19.2 (15.7 – 22.8) 18.6 (16.2 – 21.0)
Chronic or persistent pain 17.1 (13.7 – 20.5) 20.1 (16.4 – 23.9) 18.6 (16.2 – 21.1)
Chronic mental illness1 14.3 (10.5 – 18.1) 17.7 (13.6 – 21.8) 16.3 (13.5 – 19.0)
Cancer, not skin cancer 7.1 (5.0 – 9.3) 6.6 (4.4 – 8.7) 7.1 (5.6 – 8.7)
Chrohn’s disease, Coeliac, irritable or inflammatory bowel disease
6.3 (4.1 – 8.4) 8.1 (5.2 – 11.1) 7.0 (5.2 – 8.8)
Osteoporosis 7.2 (5.0 – 9.4) 6.3 (4.3 – 8.4) 6.8 (5.3 – 8.2)
Chronic nervous system illness2 3.6 (1.7 – 5.5) 4.1 (2.3 – 5.8) 3.9 (2.6 – 5.1)
Kidney disease (includes renal failure) 1.2 (0.3 – 2.0) 2.4 (0.9 – 3.8) 1.9 (0.9 – 2.9)
Chronic liver disease, cirrhosis of liver 0.4 (0.0 – 0.9) 1.0 ( 0.1 – 1.9) 0.8 (0.2 – 1.4)
1 e.g. Schizophrenia, anxiety, depression, mood disorders;
2e.g. multiple sclerosis, spinal cord injuries, epilepsy or seizures;

34
Injury Falls-related injuries impose a substantial burden on the health care and aged care systems [14]. The CHS 2014 reported that 12.9% of Central Coast adults aged 50 years and over had had at least one fall in the past 12 months (Figure 27 and Table 26). Approximately 30% of respondents 50 years and over said they had a fear of falling (Table 27).
Figure 27: Proportion of respondents 50 years and over reporting a fall in the past 12 months by Central Coast LGAs, CHS 2014 Table 26: Estimated population proportion (95% Cl) of respondents (≥50 years) reporting a fall in the past 12 months by LGA, Central Coast, CHS 2014
Question qfl1 Gosford (n=332) Wyong (n=297) Central Coast (n=629)
Once 15.0 (11.0 – 19.0) 11.0 (7.1 – 14.8) 12.9 (10.2 – 15.6)
Twice 7.3 (4.4 – 10.3) 6.7 (3.6 – 9.7) 7.0 (4.9 – 9.0)
Three or more times 5.1 (2.7 – 7.5) 4.6 (2.2 – 7.0) 5.1 (3.3 – 6.9)
Have not fallen in the past 12 months 72.6 (67.6 – 77.6) 77.8 (72.7 – 82.8) 75.0 (71.5 – 78.5)
Table 27: Estimated population proportion (95% Cl) of respondents (≥50 years) reporting fear of falling, by LGA, Central Coast, CHS 2014
Question qfl3 Gosford (n=332) Wyong (n=297) Central Coast (n=629)
Yes, very afraid 3.9 (1.8 – 6.0) 4.5 (2.1 – 6.8) 4.5 (2.8 – 6.1)
Yes, somewhat afraid 14.2 (10.2 – 18.1) 13.1 (9.0 – 17.2) 13.5 (10.7 – 16.3)
Yes, fairly afraid 12.4 (8.6 – 16.1) 9.1 (5.5 – 12.7) 11.0 (8.4 – 13.6)
No, not at all afraid 68.7 (63.5 – 74.0) 73.3 (68.0 – 78.6) 70.6 (66.9 – 74.2)
Don’t Know 0.8 (0.0 – 1.7) - 0.4 (0.0 – 0.9)

35
Oral Health Oral health is an integral component of lifelong health and includes a person's comfort in eating and social interactions, their self-esteem and satisfaction with their appearance. About 90% of all tooth loss can be attributed to dental caries and periodontal diseases. Most tooth loss is preventable and treatable. Factors such as changes in diet, reduced sugar consumption, exposure to fluoride, and changes in disease management have contributed to significant improvements in oral health. In NSW, around 60% of adults visit a dentist every year. Oral health is worse in areas with no access to a fluoridated community water supply [2]. The CHS 2014 estimated that 51.7% of Central Coast adults aged 18 years and over had visited a dental professional less than one year ago (Figure 28 and Table 28). There were 21.3% of respondents with experience of dental problems in the past two years but left untreated due to cost (Table 29).
Figure 28 Proportion of respondents reporting last visit to a dental professional by Central Coast LGAs, CHS 2014 Table 28: Estimated population proportion (95% Cl) of respondents reporting last visit to a dental professional by LGA, Central Coast, CHS 2014
Question qden1 Gosford (n=512) Wyong (n=491) Central Coast (n=1003)
Less than 12 months ago 52.5 (47.0 – 58.0) 52.2 (47.1 – 57.3) 51.7 (48.1 – 55.3)
One year to less than 2 years ago 22.2 (17.2 – 27.1) 19.4 (15.5 – 23.3) 20.8 (17.9 – 23.7)
Two to 5 years ago 13.5 (9.6 – 17.4) 17.8 (13.7 – 21.8) 16.5 (13.6 – 19.5)
Five to 10 years ago 7.5 (3.4 – 11.6) 5.0 (3.1 – 6.9) 5.5 (3.8 – 7.2)
Ten or more years ago 4.3 (2.5 – 6.2) 5.6 (3.0 – 8.1) 5.5 (3.6 – 7.4)

36
Table 29: Estimated population proportion (95% Cl) of respondents reporting experience of dental problems in past two years left untreated due to cost by LGA, Central Coast, CHS 2014
Question qden2 Gosford (n=512) Wyong (n=491) Central Coast (n=1003)
Yes 19.6 (15.0 – 24.2) 22.6 (18.2 – 26.9) 21.3 (18.3 – 24.4)
No 80.4 (75.8 – 85.0) 77.2 (72.9 – 81.6) 78.6 (75.5 – 81.7)
Don’t Know 0.0 (0.0 – 0.0) 0.2 (0.0 – 0.5) 0.1 (0.0 – 0.2)
37
PART 3: HEALTH SERVICES
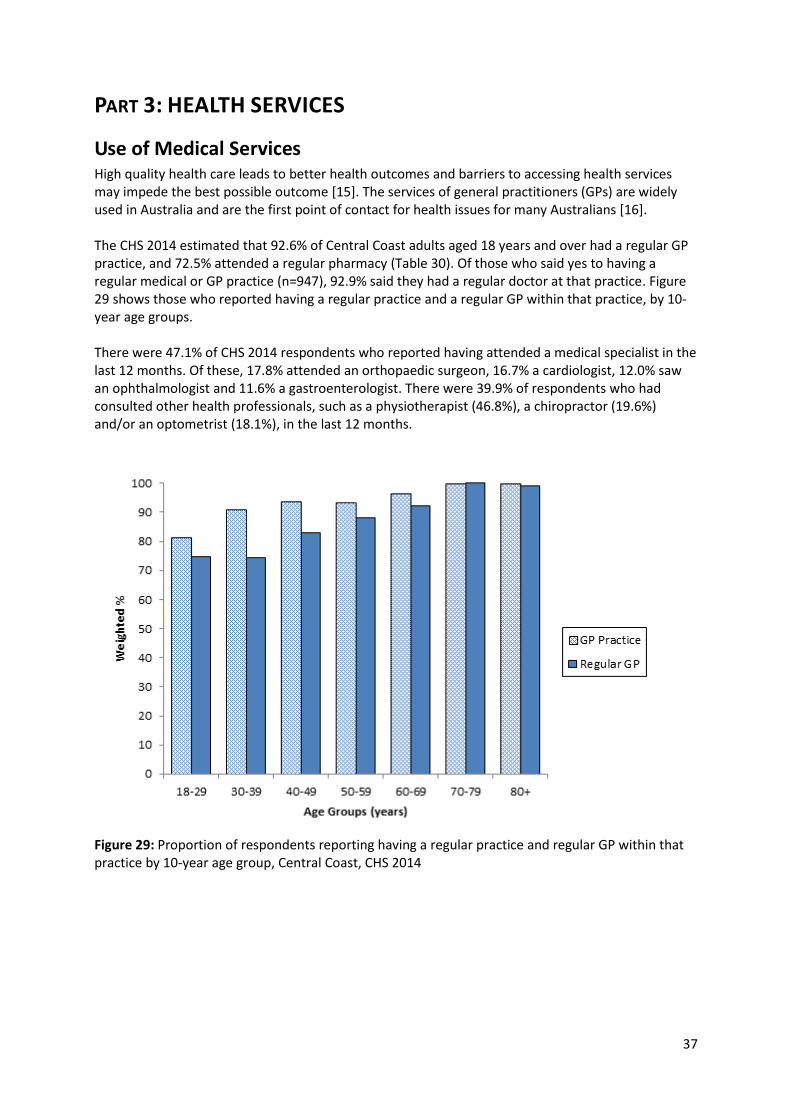
Use of Medical Services High quality health care leads to better health outcomes and barriers to accessing health services may impede the best possible outcome [15]. The services of general practitioners (GPs) are widely used in Australia and are the first point of contact for health issues for many Australians [16]. The CHS 2014 estimated that 92.6% of Central Coast adults aged 18 years and over had a regular GP practice, and 72.5% attended a regular pharmacy (Table 30). Of those who said yes to having a regular medical or GP practice (n=947), 92.9% said they had a regular doctor at that practice. Figure 29 shows those who reported having a regular practice and a regular GP within that practice, by 10-year age groups. There were 47.1% of CHS 2014 respondents who reported having attended a medical specialist in the last 12 months. Of these, 17.8% attended an orthopaedic surgeon, 16.7% a cardiologist, 12.0% saw an ophthalmologist and 11.6% a gastroenterologist. There were 39.9% of respondents who had consulted other health professionals, such as a physiotherapist (46.8%), a chiropractor (19.6%) and/or an optometrist (18.1%), in the last 12 months.
Figure 29: Proportion of respondents reporting having a regular practice and regular GP within that practice by 10-year age group, Central Coast, CHS 2014

38
Table 30: Estimated population proportion (95% Cl) for respondent who reported having a regular medical or GP practice and pharmacy by LGA, Central Coast, CHS 2014
Questions q1c1 & qac3 Gosford (n=512) Wyong (n=491) Central Coast (n=1003)
Regular Medical or GP Practice 94.7 (92.3 - 97.1) 91.6 (88.3 – 94.9) 92.6 (90.2- 94.9)
Regular Pharmacy 72.8 (67.4- 78.2) 73.0 (68.3 - 77.7) 72.5 (69.0 -76.0)
The 2012 NSW Adult Population Health Survey reported the smoothed estimate of 15.8% (actual, 15.6%) for adults aged 16 years and over who had difficulty accessing health care when needing it (CC smoothed estimate, 22.2%; actual, 23.2%). The CHS 2014 estimated that 16.5% of Central Coast adults aged 18 years and over had difficulties getting health care when needed. Of these, 80.8% said they couldn’t get an appointed at the time required and 14.1% said the services were not available in their local area (Figure 30).
Figure 30: Barriers to getting health care when needed by LGA, CHS 2014
Respondents were asked what action they took the last time they had a health problem that was not an emergency in the after-hours (Figure 31). Most reported never having had such a problem (40.0%), 24.5% waited to see their GP in normal hours, and 15.3% rang or attended their local hospital.

39
Figure 31: Action taken for health problem not an emergency and after-hours, Central Coast, CHS 2014 In 2012-13, in Australia, 8.5% of people given a prescription by their GP delayed or did not fill it due to cost. In the most disadvantaged areas, 12.4% delayed or did not fill a prescription; this was twice the rate found in the least disadvantaged areas (6.0%) [17]. In the CHS 2014, 14.6% of Central Coast participating adults 18 years and over said that the cost of medicine had caused them not to collect, stop using, or cut down the dose of medicine prescribed by their doctor, at some time. Figure 32 shows usage of medicinal drugs on a regular basis by LGA.
Figure 32 Respondents use of prescribed medicines by LGA, Central Coast, CHS 2014

40
PART 4: SOCIAL SUPPORT People participate directly in the community through a wide range of social and other types of groups. A person's social or support networks include people who they can turn to for help with small favours or routine household tasks. These types of relationships provide an indication of the connectedness within communities [18]. The CHS 2014 provided information on people’s activities in the last 2 weeks and the last 3 months (Figure 33). Respondents indicated that the top four activities in the past 2 weeks were: going to a café, restaurant or bar (76.1%), using online social media (59.1%), taking part in sport or physical activity (50.5%), and visiting a park, the botanic gardens, zoo or theme park (39%). Cafes, restaurants or bars remained the main activity for people, increasing in activity, in a period of the 3 months. Visits to parks, botanic gardens and zoos came in second (64%), followed by attending a movie, theatre or concert (60.9%), and online social media (59.1%).
Figure 33: Main types of activities undertaken in the past 2 weeks and the past 3 months. Figure 34 indicates that a person’s spouse is the main source of help when sick or unwell (53.3%), followed by son, daughter, sibling or in-law (11.8%) or other family members (17.4%). Figure 35 shows that most respondents reported that they could discuss health issues with friends or family members most (37.1%) or some (34.5%) of the time.

41
Figure 34: Who helps when sick, Central Coast, CHS 2014, Central Coast, CHS 2014
Figure 35: How often discuss your health issues with a friend or family member, Central Coast, CHS 2014
42
References 1. Central Coast Local Health District. Northern Sydney Central Coast community health surveys -
2002 and 2006. Central Coast community health survey 2010. Gosford: Public Health Unit. [Cited 2015 Apr 7]. Available at: http://www.cclhd.health.nsw.gov.au/ourservices/PublicHealth/Pages/Epidemiology.aspx
2. Centre for Epidemiology and Evidence. HealthStats NSW. Sydney: NSW Ministry of Health. [Cited
2015 Sept 08]. Available at: www.healthstats.nsw.gov.au
3. NSW Health. Healthy urban development checklist: A guide for health services when commenting on development policies, plans and proposals. Ch 8: Physical activity, p.55. October 2009. NSW Department of Health. ISBN 978 1 74187 4112. [Cited 2015 Sept 08]. Available at: http://www.health.nsw.gov.au/urbanhealth/Pages/healthy-urban-dev-check.aspx
4. RSPCA Australia Knowledgebase. Companion Animals. Pet ownership. [Cited 2015 Sept 08].
Available at: http://kb.rspca.org.au/31/ 5. Australian Institute of Health and Wellbeing. High blood pressure. Canberra: AIHW. [Cited 2015
Feb 20]. Available at: http://www.aihw.gov.au/high-blood-pressure/ 6. Australian Institute of Health and Wellbeing. High blood cholesterol. Canberra: AIHW. [Cited
2015 Feb 20]. Available at: http://www.aihw.gov.au/high-blood-cholesterol/ 7. Australian Institute of Health and Wellbeing. Overweight and obesity. Canberra: AIHW. [Cited
2015 Feb 20]. Available at: http://www.aihw.gov.au/overweight-and-obesity/ 8. World Health Organization. Global database on body mass index. 2006. [Cited 2015 Feb 23].
Available at: http://www.assessmentpsychology.com/icbmi.htm 9. Centre for Epidemiology and Evidence. HealthStats NSW. Sydney: NSW Ministry of Health.
Overweight or obesity in adults by socioeconomic status and year. Methods for indicator: Body mass Index. [Cited 2015 Sept 08]. Available at: http://www.healthstats.nsw.gov.au/Indicator/beh_bmi_age/beh_bmi_ses
10. Australian Institute of Health and Welfare. Cardiovascular disease: Australian facts 2011. Ch 5:
Stroke. Cardiovascular disease series, Cat. no. CVD 53, p.73. Canberra: AIHW. [Cited 2015 Feb 23]. Available at: http://www.aihw.gov.au/WorkArea/DownloadAsset.aspx?id=10737418530
11. Australian Institute of Health and Wellbeing. COPD – chronic obstructive pulmonary disease.
Canberra: AIHW. [Cited 2015 Feb 23]. Available at: http://www.aihw.gov.au/copd/
12. Centre for Epidemiology and Research. NSW adult population health survey. 2010 Annual report on adult health for the whole State. Asthma, P. 81. Sydney: NSW Ministry of Health. [Cited 2015 Oct 01]. Available at: http://www.health.nsw.gov.au/surveys/adult/Pages/adults-10.aspx
13. Australian Institute of Health and Welfare. A snapshot of arthritis in Australia 2010. Arthritis
series no. 13. Cat. no. PHE 126. Canberra: AIHW. [Cited 2015 Feb 24]. Available at: http://www.aihw.gov.au/WorkArea/DownloadAsset.aspx?id=6442460004&libID=6442460006
14. Centre for Epidemiology and Evidence. Health Stats NSW. Sydney: NSW Ministry of Health. Falls among older people, NSW Health, Report Card. [Cited 2015 Feb 24]. Available at: http://www.healthstats.nsw.gov.au/resources/falls_health_statistics_r.pdf

43
15. Australian Bureau of Statistics. 4839.0 - Patient experiences in Australia: Summary of findings,
2013-14. Released 28/11/2014. [Cited 2015 Feb 25]. Available at: http://www.abs.gov.au/ausstats/[email protected]/PrimaryMainFeatures/4839.0?OpenDocument
16. Australian Bureau of Statistics. 4839.0 - Patient experiences in Australia: General Practitioners,
2013-14. Released 28/11/2014. [Cited 2015 Feb 25]. Available at: http://www.abs.gov.au/ausstats/[email protected]/Lookup/by%20Subject/4839.0~2013-14~Main%20Features~General%20practitioners~2
17. COAG Reform Council. Healthcare in Australia 2012-13: Five years of performance, p. 51. Report
to the Council of Australian Governments 30 April 2014. [Cited 2015 Feb 24]. Available at: http://apo.org.au/files/Resource/coag_healthcare-in-australia-2012-13_2014.pdf
18. Australian Bureau of Statistics. Social networks and support. [Cited 2015 Feb 24]. Available at:
http://www.abs.gov.au/ausstats/[email protected]/Products/4714.0~2008~Main+Features~Social+networks+and+support?OpenDocument

44
Appendix 1: Methodology The Hunter Valley Research Foundation (HVRF) was contracted to conduct the fieldwork component of the project. The following is extracted from the HVRF Central Coast Community Health Study: Methods Report, March 2014 (unpubl.). The data collection methodology involved interviewing by computer assisted telephone interviews (CATI) 1,000 residents of the Central Coast - 500 per Local Government Areas (LGAs) of Gosford and Wyong). Verbal consent to participate in the survey was obtained by the HVRF at the time of interview. A pilot was conducted consisting of 34 completed interviews with ‘real’ respondents. Pilot respondents were eligible residents of the Central Coast who were available to undertake the interview at the time of the call. The purpose of the pilot was to test the questionnaire timing, wording and flow, as well as to address any issues respondents may raise during the course of interviewing on the main study. Several changes to the survey instrument were made as a result of the pilot, primarily to reduce interview length. The survey was conducted by HVRF using a CATI system to guide the telephone interviewer through the questionnaire, identifying appropriate skips and branching to additional questions as required. The final version of the CATI survey was approved by the Central Coast Public Health Unit before data collection commenced. The survey started on Thursday, 16 January 2014 and was completed on Thursday, 6 March 2014. The interviews took an average of 18.5 minutes to complete. At the conclusion of the data collection period, 1,003 interviews had been completed in total, with an overall response rate of 78.5 per cent.
The questionnaire The questionnaire (Appendix 2) asked questions about self-reported prevalence of diagnoses of, and risk factors for, cardiovascular disease, respiratory disease and diabetes and associated risk factors. Data was also collected on other local priority health issues such as active travel, access to health services and after-hours care, and social support. The questions were mostly adapted from the NSW Health Adult Population Health Survey, an ongoing survey of the health of people of New South Wales, which uses the CATI method. Other reliable sources of survey questions included the National Health Survey 2011-12, and 2009/10 Household Travel Survey (Bureau of Transport Statistics, NSW Dept. Transport).
The study population The population was defined as residents of the Central Coast (Gosford and Wyong LGAs) aged 18 or over. Exclusion Because the survey was only conducted in English, respondents who could not complete the survey in this language were excluded.
Sampling frame The source of contact telephone numbers was the HVRF composite ‘White Pages database. A random selection of telephone numbers was extracted sufficient to accommodate the proportions of interviews.
The respondent The respondent was a randomly selected member of the household aged 18 or over and who agreed to take part in the survey. If there was more than one resident in the household aged 18 or over, the

45
CATI program randomly selected the respondent from these. In the initial telephone contact, the number of eligible respondents in the household (18 years and over) was ascertained, and the age of the person answering the phone relative to the other householders. A respondent was randomly selected based on age position within the household (e.g. third eldest), or birthday (e.g. the last birthday) where the person refused to provide the number of eligible respondents. Once the respondent had been randomly selected, they could not be substituted with another member of the household.
The CATI interviewers A total of 18 interviewers were trained to conduct survey interviews for this study. All interviewers had CATI interviewing experience, particularly with health surveys. Interviewer training for the Central Coast Community Health Survey In order to work on the project, interviewers were required to attend a training session before beginning data collection. During that session, interviewers were given a training manual. This manual was designed specifically to address operating CATI procedures and data collection survey methodology. It also provided interviewers with some background and rationale of the study including what the study hoped to achieve. During the training session, the interviewers had an opportunity to ask questions and clarify any concerns or issues they may have had with data collection methods. Interviewers were also able to practise with the CATI survey prior to commencement of data collection.
CATI contact attempts Attempts at contacting each respondent were usually made between the hours of 9 a.m. and 8 p.m. Eastern Standard Time (EST), Monday to Friday. A minimum of 6 call attempts were made to each household to establish contact, unless a terminating code was entered (terminating codes include completion of interview, personal refusals, household refusals, ineligible contacts, unsuitable/incapable respondents etc.). Once contact had been made, at least another 5 attempts were made to speak to the respondent to obtain either agreement to participate in the survey or a refusal. Maximising response rates A letter and information sheet was available for people wanting to confirm the legitimacy of the survey (Appendix 4). This information was also posted on the Central Coast Local Health District website. Where people requested a letter or visited the website, follow−up contact was made within 2 weeks to confirm participation. Participants could choose to answer the survey without receiving the letter, and were reassured that withdrawal from the survey at any point would not affect their relationship with the Central Coast Local Health District

46
Appendix 2: Community Health Survey 2014 - Questionnaire
Good ....., my name is ......
I'm calling for the Central Coast Local Health District. We're
interviewing residents of the Central Coast as part of a study on risk
factors for heart disease and associated health issues.
Because we want to speak to a wide range of people in the Central Coast
Region, we are calling computer-generated numbers in your area.
Could I confirm that you live in the Central Coast?
The questions I want to ask you will take about 10 to 15 minutes. Your
participation is voluntary, and any information that could identify you
will be deleted from the record of this interview.
Is it OK to talk to you now?
[For individual requiring further information] We can send a letter to
any address you nominate [POST OR FAX]. OR we can give you a webpage.
The webpage is for the Central Coast Local Health District [details
provided] [3. YES, WEBPAGE 1. YES, SEND LETTER 2. NO - REFUSED]
[I'll call back in a few days after you have received the letter]
qlga. Which local government area do you live in?
1. Gosford
2. Wyong
7. OTHER [TERMINATE]
9. REFUSED
------------------
qdm1. What is the sex of the respondent? [OBSERVE OR ASK]
M = Male
F = Female
qdm2. Could you please tell me how old you are today?
[999. REFUSED - ATTEMPT AGE RANGE QUESTION NEXT PAGE]
IF qdm2=refused, ask:
qdm2r. What is your age group? Is it ... [READ OPTIONS]
1. 18 - 24 6. 45 - 49 11. 70 - 74
2. 25 - 29 7. 50 - 54 12. 75 - 79
3. 30 - 34 8. 55 - 59 13. 80 - 84
4. 35 - 39 9. 60 - 64 14. 85 and over
5. 40 - 44 10. 65 - 69 99. REFUSED
------------------
qdm3. Are you of Aboriginal or Torres Strait Islander origin?
2. NO
3. Aboriginal but not Torres Strait Islander
4. Torres Strait Islander but not Aboriginal origin
5. Aboriginal and Torres Strait Islander origin
8. DON'T KNOW
9. REFUSED

47
qdm4. What is your postcode? [POSTCODE Range: , 8888. DON'T KNOW 9999.
REFUSED]
------------------
HYPERTENSION
qcvd1. Have you ever been told by a doctor or at a hospital that you
have high blood pressure, which is sometimes called hypertension?[DO
NOT READ OPTIONS]
1. Yes
2. NO
3. Yes, but only during pregnancy?
4. Yes, but only temporarily?
8. DON'T KNOW
9. REFUSED
----------------
HYPERLIPIDAEMIA
qcvd2. Have you ever been told by a doctor or at a hospital that you
have high cholesterol? [DO NOT READ OPTIONS]
1. Yes
2. No 7. BORDERLINE
8. DON'T KNOW
9. REFUSED
------------------
DIABETES
The next few questions are about diabetes. Diabetes is a disease where
there is too much sugar in the blood.
qdi2. Have you ever been told by a doctor or at a hospital that you
have
diabetes? [1. YES 2. NO 8. DON'T KNOW 9. REFUSED]
if qdi2=1 skip to qdi4
qdi3. Have you ever been told by a doctor or at a hospital that you
have high blood glucose? [1. YES 2. NO 3. BORDERLINE 8. DON'T KNOW 9.
REFUSED]
Skip to qcvd3
qdi4. What type of diabetes were you told you had? [CODE IF POSSIBLE]
1. Type 1 [INSULIN DEPENDENT DIABETES MELLITUS]
2. Type 2 [NON-INSULIN DEPENDENT DIABETES MELLITUS]
3. Gestational (diabetes in pregnancy)
[TYPE IN OTHER - 88. DON'T KNOW 99. REFUSED]
[INTERVIEWER: If participant needs more information: Type 1 - there may
be a family link and usually can't be prevented. Insulin is required;
it can happen at any age, although usually before 40 years, and often
childhood onset. Type 2 often occurs later in life, usually treated
with lifestyle modifications eg diet and exercise, may at some point
require insulin treatment; Gestational is diabetes during pregnancy]
-------------- HEART DISEASE & STROKE
Now I would like to ask you about heart disease and stroke.

48
qcvd3. Have you ever been told by a doctor or at a hospital that you
have heart disease or a heart condition? [1. YES 2. NO 8. DON'T KNOW 9.
REFUSED]
if qcvd3<>1 skip to qcvd5
qcvd4. What type of heart disease do you have? [READ OPTIONS] [MULTIPLE
RESPONSE] [1. YES 2. NO 8. DON'T KNOW/NOT SURE 9. REFUSED]
# Angina
# Heart attack (myocardial infarction)
# Heart failure
# Irregular heart beat (including SVT, atrial fibrillation, bundle
branch block)
# OTHER [NO DETAILS REQUIRED]
qcvd5. Have you ever been told by a doctor or at a hospital that you
have had a stroke or TIA; transient ischaemic attack or warning sign of
a stroke? [1. YES 2. NO 8. DON'T KNOW 9. REFUSED]
------------------
ASTHMA AND COPD
The next few questions are about asthma.
qas1. Have you ever been told by a doctor or at a hospital that you
have asthma? [1. YES 2. NO 8. DON'T KNOW 9. REFUSED]
IF qas1=1
qas1a. Have you had symptoms of asthma or taken treatment for asthma in
the last 12 months?
2. No
3. Yes - symptoms
4. Yes - treatment
5. Yes - both symptoms and treatment
8. DON'T KNOW
9. REFUSED
qas3 Have you ever been told by a doctor or hospital that you have:
[READ OPTIONS] [1. YES 2. NO 8. DON'T KNOW 9. REFUSED]
# Emphysema
# Chronic Obstructive Pulmonary Disease (COPD)?
-----------------
CHRONIC HEALTH CONDITIONS
I would now like to ask you about chronic health conditions that last
at
least 6 months.
qch1. Have you ever been told by a doctor or hospital that you have
arthritis? #[1. YES 2. NO 8. DON'T KNOW 9. REFUSED]
IF qch1=1
qch1a. Which type or types do you have? [READ OUT IF NECESSARY]
[1. YES 2. NO 8. DON'T KNOW]
# Osteoarthritis
# Rheumatoid arthritis
# Other [DO NOT READ OUT]

49
qch2. Have you ever been told by a doctor or hospital that you have any
of
the following chronic health conditions? [READ OUT] [1. YES 2. NO 8.
DON'T REMEMBER 9. REFUSED]
# Osteoporosis
# Kidney disease (incl. renal failure)
# Skin cancer
# Cancer, other than skin cancer
# Chronic liver disease or cirrhosis of the liver
# Crohn's Disease, Coeliac Disease, Irritable or Inflammatory Bowel
Disease
# Chronic nervous system illness for example multiple sclerosis, spinal
cord injuries, epilepsy or seizures
# Chronic Mental illness, for example, Schizophrenia, Anxiety,
Depression,
Mood disorders
# Chronic or persistent pain
IF qch2p3=1
qch2m. You said you had skin cancer, was it melanoma? [1. YES 2. NO 8.
DON'T KNOW 9. REFUSED]
-------------
FOOD AND DRINK
The next few questions are about food.
qdt1. How many serves of vegetables do you usually eat each day? One
serve is half a cup cooked or 1 cup raw vegetables or 1 cup of salad
vegetables.
[SERVES PER DAY - 77. NEVER EAT 88. DON'T KNOW 99. REFUSED]
If respondent USUALLY eats less than 1 serve per day Enter weekly value
[SERVES PER WEEK - 88. DON'T KNOW 99. REFUSED]
[INTERVIEWER: ONLY USE ONE RESPONSE FIELD]
qdt2. How many serves of fruit do you usually eat each day? A serve is
1 medium piece or 2 small pieces of fruit or 1 cup of diced pieces.]
[NOT JUICE.] [SERVES PER DAY - 77. NEVER EAT 88. DON'T KNOW 99.
REFUSED]
If respondent USUALLY eats less than 1 serve per day Enter weekly value
[SERVES PER WEEK - 88. DON'T KNOW 99. REFUSED]
[INTERVIEWER: ONLY USE ONE RESPONSE FIELD]
qdt3. How many CUPS of fruit juice do you usually drink each day?
[INCLUDE FRUIT JUICE DRINKS - DO NOT INCLUDE CORDIALS]
1 CUP = 250 ml (approx)
COMMERCIAL PACKAGES
Popper = 1 cup
Small bottle (320ml) = 1.5 cups
Large bottle (500ml) = 2 cups
[CUPS PER DAY - 77. NEVER DRINK 88. DON'T KNOW 99. REFUSED]
If respondent USUALLY drinks less than 1 cup per day Enter weekly value
[CUPS PER WEEK - 88. DON'T KNOW 99. REFUSED]
[INTERVIEWER: ONLY USE ONE RESPONSE FIELD]

50
qdt4. How many serves of hot chips (French fries) did you eat
yesterday?
[PROMPT IF NECESSARY] [NUMBER: RANGE 0 - 2, 3 = MORE THAN 2]
[8. DON'T REMEMBER 9. REFUSED]
qdt5. Did you drink any softdrink, cordials or sports drink such as
lemonade or gatorade yesterday? [1. YES 2. NO 8. DON'T KNOW 9. REFUSED]
[INTERVIEWER: DO NOT INCLUDE DIET DRINKS]
---------------
PHYSICAL ACTIVITY
The next few questions are about physical activity.
qex1. In the last week, how many times have you walked continuously for
at
least 10 minutes for recreation or exercise or to get to or from
places? [NO. OF TIMES - 88. DON'T KNOW - USE ONLY AS AN ABSOLUTE LAST RESORT]
if qex1=0 skip to qex3
qex2. What do you estimate was the total time you spent walking in this
way IN THE LAST WEEK?
# Hours [888. DON'T KNOW]
# Minutes [88. DON'T KNOW]
This next question does not include household chores or gardening.
qex3. In the last week, how many times did you do any vigorous physical
activity which made you breathe harder or puff and pant? (e.g football,
tennis, squash, athletics, cycling, jogging, gym, swimming etc.)
[NO. OF TIMES: RANGE 0 - 80: 88. DON'T KNOW - USE AS ABSOLUTE LAST
RESORT]
if qex3=0 skip to qex5
qex4. What do you estimate was the total time you spent doing this
vigorous physical activity IN THE LAST WEEK?
# Hours [888. DON'T KNOW]
# Minutes [88. DON'T KNOW]
This next question does not include household chores or gardening.
qex5. In the last week, how many times did you do any other more
moderate
physical activity that you haven't already mentioned? (e.g. lawn bowls,
golf, tai chi)[NO. OF TIMES: RANGE 0 - 80: 88. DON'T KNOW - USE AS
ABSOLUTE LAST RESORT]
IF qex5>0
qex6. What do you estimate was the total time you spent doing these
activities in the last week?
# Hours [888. DON'T KNOW]
# Minutes [88. DON'T KNOW]
--------------
HEIGHT AND WEIGHT
The next few questions are about height and weight
qhw1. How tall are you without shoes?
# Feet # Inches [Min 3 feet, Max 7 ft: Min 0 inches, Max 11 ins)
[88. DON'T KNOW in Feet and 88. DON'T KNOW in Inches]

51
[99. REFUSED 99. REFUSED ]
OR
# Cms [Min 90 cm, Max 230 cm - 888. DON'T KNOW]
999. REFUSED
qhw2. How much do you weigh without clothes or shoes?
# Stones & # Pounds [Minimum 4 stone or 45 lbs]
[88. DON'T KNOW in Stones & 888. DON'T KNOW in lbs]
99. REFUSED 999. REFUSED
OR
# Kilograms [Minimum 20 kilos Max 200 - 888. DON'T KNOW]
999. REFUSED
qhw3. Do you consider yourself to be: [READ OUT ITEMS AS PRESENTED]
1. Underweight
3. Overweight
2. Acceptable weight
8. DON'T KNOW
9. REFUSED
--------------
SMOKING
The next two questions about tobacco smoking. This includes cigarettes,
cigars and pipes.
qtb1. Which of the following best describes your smoking status?[READ
ITEMS]
1. I smoke daily
5. I've never smoked
2. I smoke occasionally
4. I've tried it a few times but never smoked regularly
3. I don't smoke now, but I used to
8. DON'T KNOW [DO NOT READ]
9. REFUSED [DO NOT READ]
qtb5. Which of the following best describes your home situation
regarding smoking? [READ OPTIONS AS PRESENTED]
1. my home is smoke free (includes smoking is only allowed outside)
3. people frequently smoke in the house
2. people occasionally smoke in the house
8. DON'T KNOW
9. REFUSED
--------------
ALCOHOL
Now I would like to ask you some questions about alcohol.
qalc1. How often do you usually drink alcohol? [INTERVIEWER: PROMPT
'How many days in the average week?' IF NECESSARY]
[Number of days in week; Range 1 - 7]
8. Less than once per week
9. I don't drink alcohol
88. DON'T KNOW
99. REFUSED
If qalc1=9 skip to="qalc6"
---------------

52
Alcoholic drinks are measured in terms of a standard drink. A standard
drink is equal to 1 middy of full-strength beer, 1 schooner of light
beer, 1 small glass of wine, or 1 pub-sized nip of spirits.
qalc2. On a day when you drink alcohol, how many standard drinks do you
usually have? # [Number of drinks: Range 1 - 30; 88. DON'T KNOW 99.
REFUSED]
qalc3. In the last 4 weeks have you had more than (Male = FOUR, Female
= TWO) drinks in a day?[1. YES 2. NO 8. DON'T KNOW 9. REFUSED]
qalc6. How do you feel about the number of places in your neighbourhood
where you can buy alcohol to take home?
1. There are not enough
3. There are too many
2. There are enough
8. DON'T KNOW
9. REFUSED
qalc6a. There is evidence that increased access to alcohol is
associated with an increase in local crime, violence and underage
drinking. In light of this, how do you feel about the number of places
in your neighbourhood
where you can buy alcohol to take home?
1. There are not enough
3. There are too many
2. There are enough
8. DON'T KNOW
9. REFUSED
------------------
ACCESS TO MEDICAL SERVICES
Next I have some questions about access to medical services
qac1. Do you have a regular Medical or GP practice? [1. YES 2. NO 8.
DON'T KNOW 9. REFUSED]
IF qac1=1
qac2. Do you have a regular doctor at that practice? [1. YES 2. NO 8.
DON'T KNOW 9. REFUSED]
qac3. Do you have a regular pharmacy?
1. Yes
2. No - go to different pharmacies
3. No - Don't use pharmacies
8. DON'T KNOW
9. REFUSED
qac4. Do you have any difficulties getting health care when you need
it?
[1. YES 2. NO 8. DON'T KNOW 9. REFUSED]
IF qac4=1
qac4a. What are the barriers to getting health care when you need it?
1. Lack of transport
2. Services not available in your local area
3. Inability to get an appointment at the time you required
4. Cost
-. OTHER [TYPE IN]

53
[CODE OR TYPE IN OTHER - 88. DON'T KNOW 99. REFUSED]
IF qac4a1=1
qac4b. What was the MAIN reason your travel was limited or restricted?
[DO NOT READ OUT CODES]
1. Existing health condition or mobility problem
2. Traffic delays/roadwork/congestion/accidents
3. Age/caring for an aged dependent
4. Public transport service inadequate
5. Private transport inadequate/restricted
6. Cost
-. OTHER [TYPE IN]
[CODE OR TYPE IN OTHER - 88. DON'T KNOW 99. REFUSED]
qac5. Do you know how to contact an after-hours GP service in your
area?
1. Yes
2. No
3. There are no after-hours services in my local area
8. DON'T KNOW
9. REFUSED
qac6. The last time you had a health problem that was not an emergency
in the after-hours what did you do? [PROMPT IF NECESSARY]
1. Never had a health problem after hours
2. Waited to see a GP in normal hours
3. Called a helpline such as Health Direct
4. Rang or attended my usual GP
5. Attended an after-hours service
6. Rang or attended my local hospital
7. Attended a pharmacy
[CODE OR TYPE IN OTHER - 88. DON'T REMEMBER 99. REFUSED]
--------------
qac8. IN THE LAST 12 MONTHS, have you consulted any medical specialist?
[1. YES 2. NO 8. DON'T KNOW 9. REFUSED]
IF qac8=1
qac8a. Which ones, in the last 12 months? [MULTIPLE RESPONSES]
1. Cardiologist 11. Neurosurgeon
2. Cardiothoracic surgeon 12. Obstetrician
3. Dermatologist 13. Oncologist/Cancer Specialist
4. ENT specialist 14. Orthopaedic surgeon
5. Endocrinologist 15. Palliative Medicine specialist
6. Gastroenterologist 16. Psychiatrist
7. General Surgeon 17. Respiratory Specialist
8. Gynaecologist 18. Rheumatologist
9. Immunologist 19. Sleep Medicine specialist
10. Neurologist 20. Urologist
[ENTER CODE OR TYPE IN RESPONSES - 88. DON'T KNOW 99. REFUSED]
qac9. IN THE LAST 12 MONTHS, have you consulted any other health
professionals; for instance, a physiotherapist, psychologist,
osteopath...? [1. YES 2. NO 8. DON'T KNOW 9. REFUSED]
IF qac9=1
qac9a. Which ones, in the last 12 month? [MULTIPLE RESPONSES]

54
1. Aboriginal Health Worker 11. Osteopath
2. Audiologist 12. Pharmacist
3. Chiropractor 13. Physiotherapist
4. Diabetes Educator 14. Podiatrist
5. Dietician 15. Psychologist
6. Exercise physiologist 16. Social Worker
7. Genetic Counsellor 17. Speech Pathologist
8. Occupational Therapist
9. Optometrist
10. Orthoptist
[ENTER CODE OR TYPE IN RESPONSES - 88. DON'T KNOW 99. REFUSED]
qac10. When you go to the GP do you understand what is being said to
you?
1. All of it
5. None of it
2. Most of it
4. A little of it
3. Some of it
8. DON'T KNOW
9. REFUSED
qac11. Concerning your use of prescribed medicines. Do you ... [READ
OUT]
1. not use any prescribed medicinal drugs regularly
2. use one or two medicinal drugs regularly
3. need to use three to four medicinal drugs regularly
4. use five or more medicinal drugs regularly
8. DON'T KNOW
9. REFUSED
IF qac11>1
qac12. Has the cost of medicine ever caused you to not collect, stop
using or cut down the dose of medicine prescribed by your doctor? [1.
YES 2. NO 8. DON'T KNOW 9. REFUSED]
------------------
SOCIAL SUPPORT
I would now like to ask some questions about your social support.
qss1. How often do you discuss your health issues with a friend or
family member? [READ OUT FIRST THREE OPTIONS ONLY]
1. Hardly ever
2. Some of the time
3. Most of the time
4. DO NOT HAVE HEALTH ISSUES
5. DO NOT HAVE ANYONE TO TALK TO
8. DON'T KNOW
9. REFUSED
qss2. Who mainly helps you when you are sick or unwell?[INTERVIEWER:
MAIN SOURCE OF ASSISTANCE ONLY]
1. Spouse or partner
2. Son or daughter
3. Son or daughter-in-law
4. Grandchildren
5. Brother or sister
6. Other family
7. Neighbours (incl.friends who are also neighbours)

55
8. Friends who are not neighbours
9. An organised community service e.g Home Care
10. Private services (not a government or voluntary agency) 11. Services (don't know if public or private)
12. No-one /No service / Don't need help
[ENTER CODE OR TYPE IN RESPONSES - 88. DON'T KNOW 99. REFUSED]
qss3. In the last 12 months, have you participated in any of the
following activities? [READ OUT, MULTIPLE RESPONSES] [1. YES 2. NO 8.
DON'T KNOW 9. REFUSED]
# Recreational group or cultural group activities
# Community or special interest group activities
# Church or religious activities
# Went out to a cafe, restaurant or bar
# Took part in sport or physical activities
# Attended a sporting event as a spectator
# Visited a library, museum or art gallery
# Attended the movies, a theatre or a concert
# Visited a park, botanic gardens, zoo or theme park
# Used online social networks such as Facebook or Twitter
----------------
ORAL HEALTH
qden1. When did you last visit a dental professional about your teeth,
dentures or gums?
1. Less than 12 months ago
2. One year to less than 2 years ago
3. Two to 5 years ago
4. Five to 10 years ago
5. Ten or more years ago
6. Never
8 DON'T KNOW
9 REFUSED
qden2. Have you experienced dental problems in the last two years which
were left untreated because you could not afford to go to the dentist?
[1. YES 2. NO 8. DON'T KNOW 9. REFUSED]
----------------
INFLUENZA VACCINATION qvc1. Were you vaccinated or immunised against flu in the past 12
months?
[1. YES 2. NO 8. DON'T KNOW 9. REFUSED]
If Female, ≤ 50 years and qvc1=1
qvc2. Were you pregnant at the time?
[1. YES 2. NO 8. DON'T KNOW 9. REFUSED]
-------------------
FALLS - 50 YEARS AND OVER ONLY
The next few questions are about falls.
qfl1. How many times have you fallen in the past 12 months?
1. Once
2. Twice
3. Three or more times
4. Have not fallen in the past 12 months

56
8. DON'T KNOW
9. REFUSED
IF qfl1<4
qfl2. In the past twelve months, have you had a fall which required
medical treatment for injuries? [1. YES 2. NO 8. DON'T KNOW 9. REFUSED]
IF qfl2=1
qfl2a. In the past twelve months, did you stay in hospital overnight
for medical treatment as a result of a fall? [1. YES 2. NO 8. DON'T
KNOW 9. REFUSED]
------------------
Qf13. Are you afraid of falling?
1. Yes, very afraid
4. No, not at all afraid
2. Yes, somewhat afraid
3. Yes, fairly afraid
8. DON'T KNOW
9. REFUSED]
----------------
PETS
Changing the focus to pets now ...
qpt1. Do you have an animal as a pet?
1. YES 2. NO [8. DON'T KNOW 9. REFUSED]
IF qpt1=1
qpt2. What kind of animal is your pet?
1. Dog
2. Cat
3. Bird
4. Fish
[TYPE IN CODES OR OTHER RESPONSES - 88. DON'T KNOW 99. REFUSED]
------------------
WORK
qwk1. Which of the following best describes your current employment
status? [READ OUT CODED ITEMS]
1. In full time paid work
2. In part time paid work
3. Self employed
4. Doing unpaid work
5. Completely retired
6. Partially retired
7. Looking after home/family
8. Studying
9. Unemployed
10. Sick/disabled/unable to work
[TYPE IN OTHER - 88. DON'T KNOW 99. REFUSED]
qwk2. How many hours of PAID work do you usually do per week?
# [HOURS: Range 1 - 90; 777. NO PAID WORK 888. DON'T KNOW 999. REFUSED]
qwk3. How many hours of VOLUNTARY work do you usually do per week?
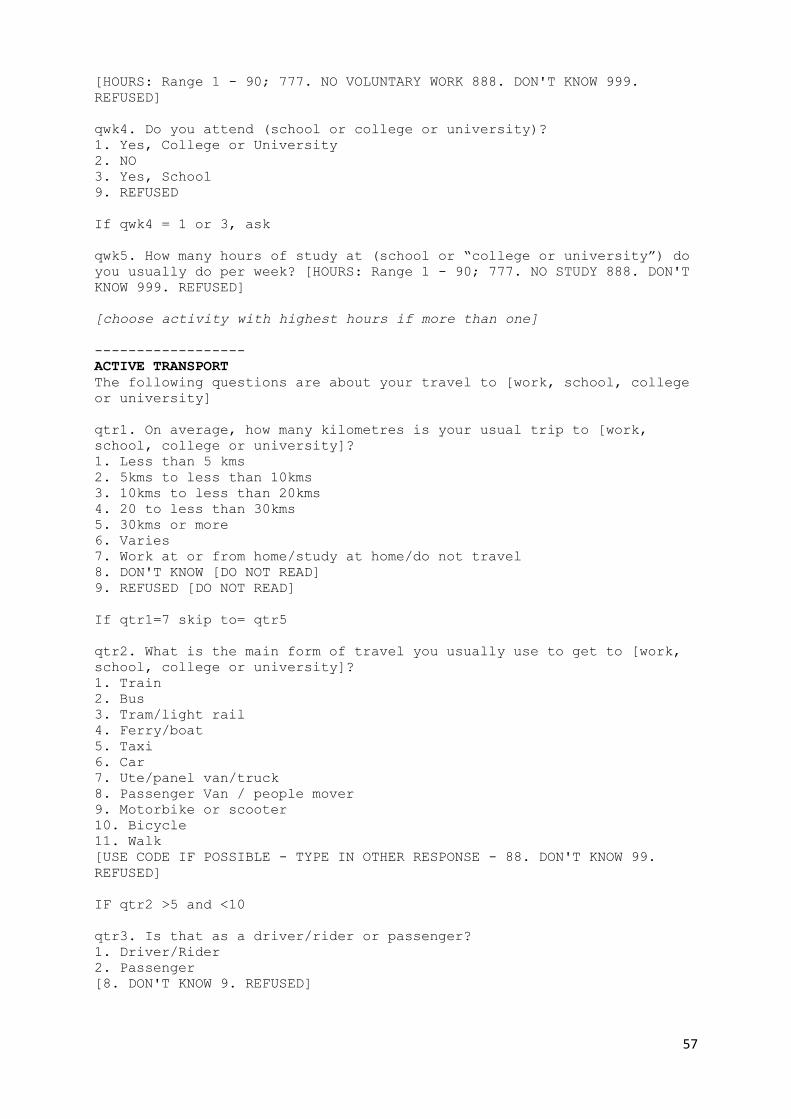
57
[HOURS: Range 1 - 90; 777. NO VOLUNTARY WORK 888. DON'T KNOW 999.
REFUSED]
qwk4. Do you attend (school or college or university)?
1. Yes, College or University
2. NO
3. Yes, School
9. REFUSED
If qwk4 = 1 or 3, ask
qwk5. How many hours of study at (school or “college or university”) do
you usually do per week? [HOURS: Range 1 - 90; 777. NO STUDY 888. DON'T
KNOW 999. REFUSED]
[choose activity with highest hours if more than one]
------------------
ACTIVE TRANSPORT
The following questions are about your travel to [work, school, college
or university]
qtr1. On average, how many kilometres is your usual trip to [work,
school, college or university]?
1. Less than 5 kms
2. 5kms to less than 10kms
3. 10kms to less than 20kms
4. 20 to less than 30kms
5. 30kms or more
6. Varies
7. Work at or from home/study at home/do not travel
8. DON'T KNOW [DO NOT READ]
9. REFUSED [DO NOT READ]
If qtr1=7 skip to= qtr5
qtr2. What is the main form of travel you usually use to get to [work,
school, college or university]?
1. Train
2. Bus
3. Tram/light rail
4. Ferry/boat
5. Taxi
6. Car
7. Ute/panel van/truck
8. Passenger Van / people mover
9. Motorbike or scooter
10. Bicycle
11. Walk
[USE CODE IF POSSIBLE - TYPE IN OTHER RESPONSE - 88. DON'T KNOW 99.
REFUSED]
IF qtr2 >5 and <10
qtr3. Is that as a driver/rider or passenger?
1. Driver/Rider
2. Passenger
[8. DON'T KNOW 9. REFUSED]

58
The next question is asking about travel to and from [work, school,
college or university] as well as other day-to-day travel.
qtr5. On average how many days per week do you use public transport?
[NUMBER OF DAYS: RANGE 1 - 7; 77. NONE/LESS THAN 1 PW.
88. DON'T KNOW
99. REFUSED ]
------------------
BUILT ENVIRONMENT/LOCAL NEIGHBOURHOOD
The next question is about your local neighbourhood.
qbl2. Are there shops, stores, markets or other places to buy things
you need within easy walking distance of your home? [1. YES 2. NO 8.
DON'T KNOW 9. REFUSED]
------------------
DEMOGRAPHICS
qdmb3. What is the highest level of education you have completed?
[DO NOT READ - PROMPT IF NECESSARY]
1. Never attended school
2. Completed primary school
3. Some high school
4. Completed school certificate/intermediate/year 10/4th form
5. Complete HSC/Leaving/Year 12/6th form
6. TAFE Certificate or Diploma
7. University, CAE or some other tertiary institute degree or higher
[TYPE IN OTHER RESPONSES - 99. REFUSED]
qdmb4. What is your approximate FAMILY INCOME before tax and other
deductions? That's the total for you, your partner and your children
if they live at home. I'll read out the categories and you just give me
the number. [CLARIFY: before tax, super, health insurance etc.
deducted]
[READ OUT LIST WITH NUMBERS]
1. Less than $10,000
2. $10,000-$20,000
3. $20,000-$40,000
4. $40,000-$60,000
5. $60,000-$80,000
6. $80,000-$100,000
7. More thaqn $100,000
8. DON'T KNOW
9. REFUSED
qdmb6. How many adults 18 years and over, including yourself, live at
your home? [NUMBER OF ADULTS - 8 = 8 OR MORE - 9. REFUSED]
qdmb7. How many children aged under 18 years live at your home? [NUMBER
OF Children: Range 0 - 12 (12=12 or more); 99. REFUSED]
Thank you for taking the time to complete this questionnaire. The
information will be used to help improve health services in your local
area.
My name is ....., calling for the Central Coast Local Health District.
If you have any concerns about this survey please contact my supervisor
on [number].

59
Appendix 3: Age and Sex Breakdown Age and sex breakdown for the Central Coast population and CHS 2014 survey sample, as at Dec 2013
Age Group Population Male
Population Female
Study Male
Study Female
Weight Male
Weight Female
18 yrs 2163.2 2080.3 7 3 309.0 693.4
19 yrs 2108.0 1947.7 9 3 234.2 649.2
20-24 9897.4 9284.4 17 21 582.2 442.1
25-29 9008.8 9195.1 7 10 1287.0 919.5
30-34 8895.1 9394.0 15 19 593.0 494.4
35-39 9157.8 9680.4 29 41 315.8 236.1
40-44 10572.9 11446.0 55 45 192.2 254.4
45-49 10193.3 10875.7 48 45 212.4 241.7
50-54 11045.3 11642.3 54 59 204.5 197.3
55-59 10233.7 11029.0 58 57 176.4 193.5
60-64 9255.1 10034.7 40 39 231.4 257.3
65-69 9256.5 10219.7 46 51 201.2 200.4
70-74 7134.1 7854.2 40 42 178.4 187.0
75-79 5307.4 6298.7 28 40 189.6 157.5
80-84 4062.4 5351.5 14 30 290.2 178.4
85+ 3642.8 6297.9 14 17 260.2 370.5
121933.8 132631.5 481 522
254565.3 1003

60
Appendix 4: Participant Letter & Information Sheet
The «surname» Household
«addr1»
«addr2»
«suburb» NSW «pcode»
Date
Dear Householder
Central Coast Community Health Study 2014
I am writing to tell you about an important study that is being conducted by the Central Coast Public Health
Unit. The main aim of the study is to learn more about the cardiovascular (heart) health of adults living on the
Central Coast, and the factors that affect heart health. We will also ask questions about other common illnesses
like diabetes and respiratory disorders.
We will be interviewing approximately 1,000 residents by telephone. Your telephone number has been randomly
selected to take part in this study. A trained telephone interviewer has contacted you to invite your household to
participate. The interviewer is employed by the Hunter Valley Research Foundation, which is a non-profit
organisation contracted to conduct the telephone survey.
The telephone interview will take around 10-15 minutes. If you are unable to be interviewed at the time our
interviewer calls back, they can arrange a time convenient to you to call back. Interviews are conducted during
the daytime and in the evening, as well as on weekends.
Please be assured that your answers to the survey questions will remain confidential. The results will not be used
in any way in which they can be associated with your name and address. We hope that you can help us in our
study, however, we understand that you may not wish to participate. If this is the case, simply let the interviewer
know and we will remove your household from our contact list.
Please find enclosed an Information sheet with answers to important questions about the Community Health
Survey. If you have any further questions regarding the telephone interview please contact [Name], the Survey
Supervisor, on freecall [Number].
Thank you in advance for your help with the survey.
Yours faithfully
Dr Peter Lewis
Director, Central Coast Public Health Unit
Central Coast Public Health Unit
Level 1, 4 Watt Street, Gosford NSW 2250 P O Box 361, Gosford NSW 2250
Telephone (02) 4320 9730 Facsimile (02) 4320 9746
IDCODE:

61
Central Coast Community Health Survey 2014: Q&A
How did you choose my telephone number?
Your number was chosen at random from all of the possible telephone numbers in your local
area, similar to a Lotto draw.
When will the interviewer ring me? Interviewers will call between 9.00am and 8.30pm on weekdays or on a Saturday. If you are
busy when they ring, they will be happy to phone back at a time convenient to you.
What types of questions will be asked? The questions in the survey cover chronic health conditions such as cardiovascular (heart)
disease, diabetes, and respiratory disorders. It covers common risk factors for these
conditions such as nutrition, smoking, and physical activity. Other important health issues
include access to medical service provision and neighbourhood characteristics which support
walking. There will be some basic questions about age, education and languages spoken at
home.
People are more at risk of cardiovascular (heart) disease if they:
have high blood cholesterol have high blood pressure
smoke have poor nutrition
are physically inactive are overweight
Do I have to answer all of the questions? We would really appreciate your help with this important survey, however, your participation
is voluntary and you are free to withdraw from the survey at any time. If you do choose to
participate, you don't have to answer all of the questions in the survey. Some of the questions
are of a personal nature, if you feel uncomfortable with any question, you can just tell the
interviewer and they will move on to the next question.
How long will it take? The whole survey will take about 10-15 minutes.
Central Coast Public Health Unit
Level 1, 4 Watt Street, Gosford NSW 2250
P O Box 361, Gosford NSW 2250 Telephone (02) 4320 9730 Facsimile (02) 4320 9746

62
Will the information I give be kept confidential? Please be assured that your answers to the survey questions will remain confidential. The
results will not be used in any way in which they can be associated with your household's
name, address or phone number. Reports that are written as a result of the survey will refer to
groups of people, not individuals e.g. 18% of men reported that they were current smokers.
Will the study results be available to me? A Technical Report will be available at Central Coast libraries in 2015.
Any Questions?
If you have any further questions regarding the telephone interview please contact [Name],
the Survey Supervisor, on freecall [Number]. Should you have any questions in relation to the
Central Coast Community Health Survey, please contact Cheryl Travers (Project Manager) or
Dr Peter Lewis (Director) at the Central Coast Public Health Unit on 02 4320 9730. This
project has been approved by Hunter New England Ethics Committee.
If you have any concerns about the way this study is conducted or wish to make a complaint,
you can contact [Name], Research Manager, Central Coast Local Health District on
[Number], and quote Reference No. [Number]. You may also call [Name], Manager,
Research Ethics and Governance Unit on [Number] and quote Reference No. [Number].


