25
© ANZDATA Registry PEADIATRIC CHAPTER CHAPTER 11
| Date post: | 03-Jan-2016 |
| Category: |
Documents |
| Upload: | bethanie-cunningham |
| View: | 222 times |
| Download: | 0 times |
© ANZDATA Registry
PEADIATRIC CHAPTER
CHAPTER 11

© ANZDATA Registry
0
5
10
15
20
25
RR
T in
cide
nce
(per
mill
ion)
1991
1992
1993
1994
1995
1996
1997
1998
1999
2000
2001
2002
2003
2004
2005
2006
2007
2008
2009
2010
0-45-910-14
15-19
Age (years)
Incidence of RRT - Age 0-19 YearsAustralia
Figure 11.1 Aust

© ANZDATA Registry
Figure 11.1 NZ
0
10
20
30
40
RR
T in
cide
nce
(per
mill
ion)
1991
1992
1993
1994
1995
1996
1997
1998
1999
2000
2001
2002
2003
2004
2005
2006
2007
2008
2009
2010
0-45-910-14
15-19
Age (years)
Incidence of RRT - Age 0-19 YearsNew Zealand
© ANZDATA Registry
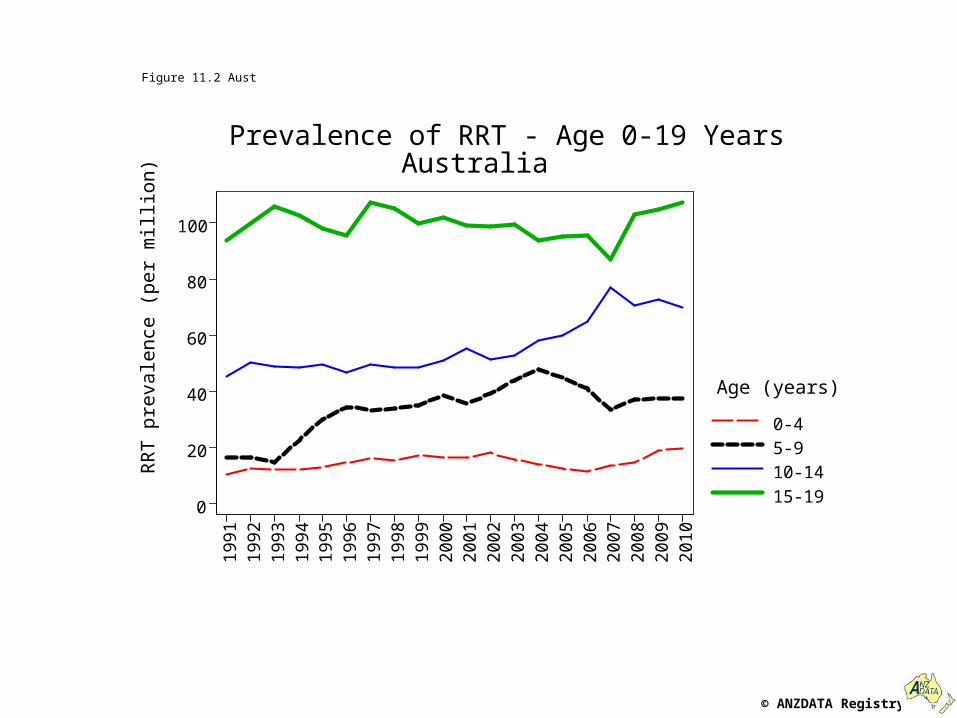
Figure 11.2 Aust
0
20
40
60
80
100
RR
T pr
eval
ence
(per
mill
ion)
1991
1992
1993
1994
1995
1996
1997
1998
1999
2000
2001
2002
2003
2004
2005
2006
2007
2008
2009
2010
0-45-910-14
15-19
Age (years)
Prevalence of RRT - Age 0-19 YearsAustralia

© ANZDATA Registry
Figure 11.2 NZ
0
50
100
150
RR
T pr
eval
ence
(per
mill
ion)
1991
1992
1993
1994
1995
1996
1997
1998
1999
2000
2001
2002
2003
2004
2005
2006
2007
2008
2009
2010
0-45-910-14
15-19
Age (years)
Prevalence of RRT - Age 0-19 YearsNew Zealand
© ANZDATA Registry
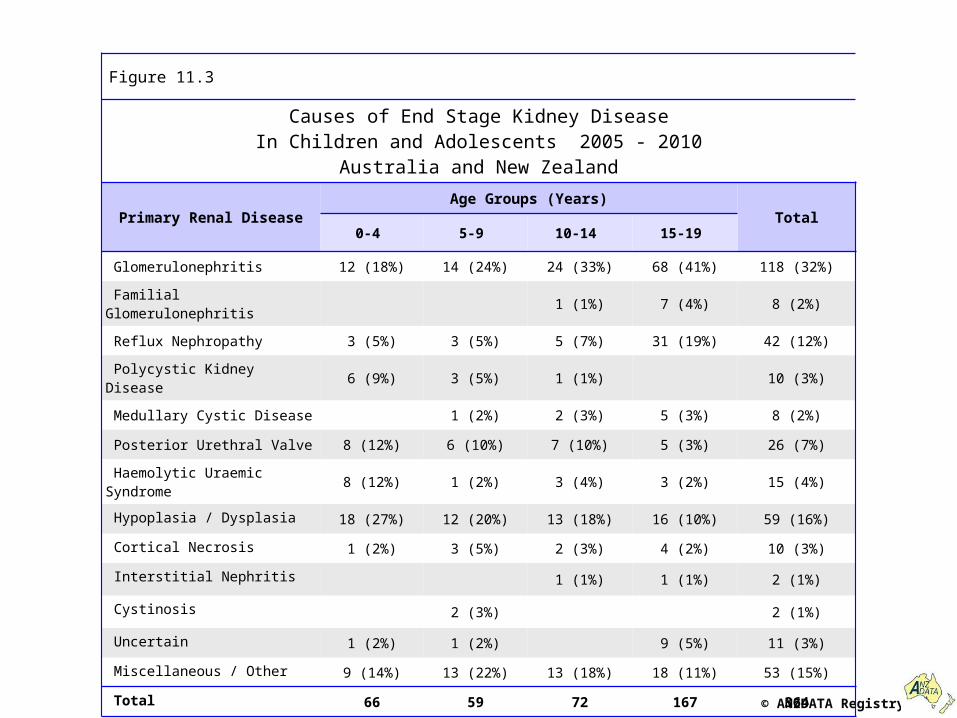
Figure 11.3
Causes of End Stage Kidney DiseaseIn Children and Adolescents 2005 - 2010
Australia and New Zealand
Primary Renal DiseaseAge Groups (Years)
Total0-4 5-9 10-14 15-19
Glomerulonephritis 12 (18%) 14 (24%) 24 (33%) 68 (41%) 118 (32%)
Familial Glomerulonephritis 1 (1%) 7 (4%) 8 (2%)
Reflux Nephropathy 3 (5%) 3 (5%) 5 (7%) 31 (19%) 42 (12%)
Polycystic Kidney Disease 6 (9%) 3 (5%) 1 (1%) 10 (3%)
Medullary Cystic Disease 1 (2%) 2 (3%) 5 (3%) 8 (2%)
Posterior Urethral Valve 8 (12%) 6 (10%) 7 (10%) 5 (3%) 26 (7%)
Haemolytic Uraemic Syndrome 8 (12%) 1 (2%) 3 (4%) 3 (2%) 15 (4%)
Hypoplasia / Dysplasia 18 (27%) 12 (20%) 13 (18%) 16 (10%) 59 (16%)
Cortical Necrosis 1 (2%) 3 (5%) 2 (3%) 4 (2%) 10 (3%)
Interstitial Nephritis 1 (1%) 1 (1%) 2 (1%)
Cystinosis 2 (3%) 2 (1%)
Uncertain 1 (2%) 1 (2%) 9 (5%) 11 (3%)
Miscellaneous / Other 9 (14%) 13 (22%) 13 (18%) 18 (11%) 53 (15%)
Total 66 59 72 167 364
© ANZDATA Registry
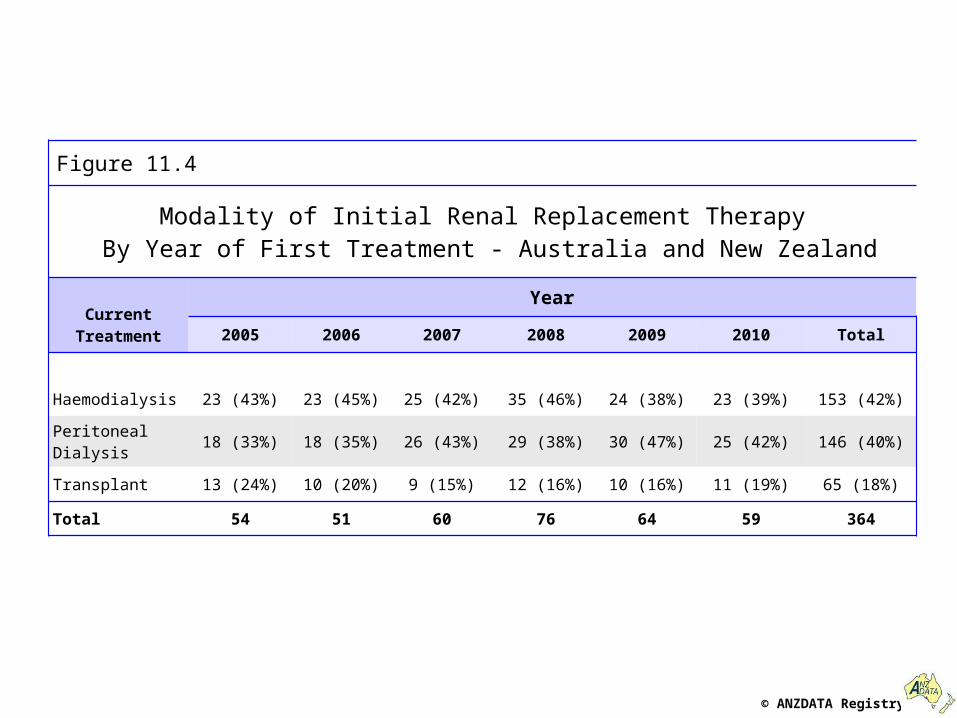
Figure 11.4
Modality of Initial Renal Replacement Therapy By Year of First Treatment - Australia and New Zealand
Current
Treatment
Year
2005 2006 2007 2008 2009 2010 Total
Haemodialysis 23 (43%) 23 (45%) 25 (42%) 35 (46%) 24 (38%) 23 (39%) 153 (42%)
Peritoneal Dialysis 18 (33%) 18 (35%) 26 (43%) 29 (38%) 30 (47%) 25 (42%) 146 (40%)
Transplant 13 (24%) 10 (20%) 9 (15%) 12 (16%) 10 (16%) 11 (19%) 65 (18%)
Total 54 51 60 76 64 59 364
© ANZDATA Registry
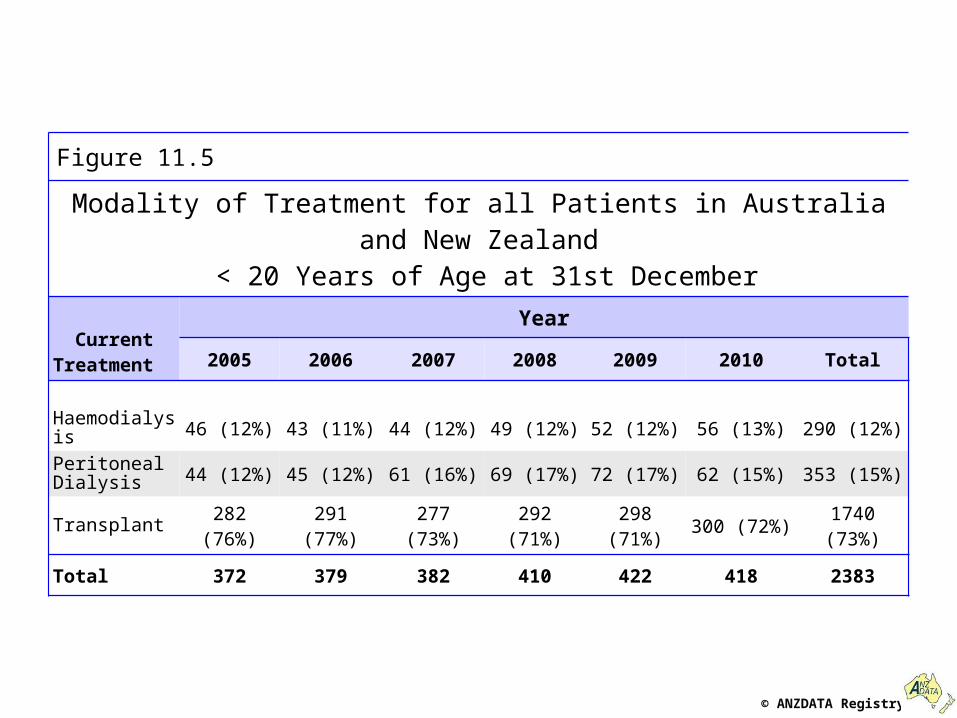
Figure 11.5
Modality of Treatment for all Patients in Australia and New Zealand
< 20 Years of Age at 31st December
CurrentTreatment
Year
2005 2006 2007 2008 2009 2010 Total
Haemodialysis 46 (12%) 43 (11%) 44 (12%) 49 (12%) 52 (12%) 56 (13%) 290 (12%)
Peritoneal Dialysis 44 (12%) 45 (12%) 61 (16%) 69 (17%) 72 (17%) 62 (15%) 353 (15%)
Transplant 282 (76%) 291 (77%) 277 (73%) 292 (71%) 298 (71%) 300 (72%) 1740 (73%)
Total 372 379 382 410 422 418 2383
© ANZDATA Registry
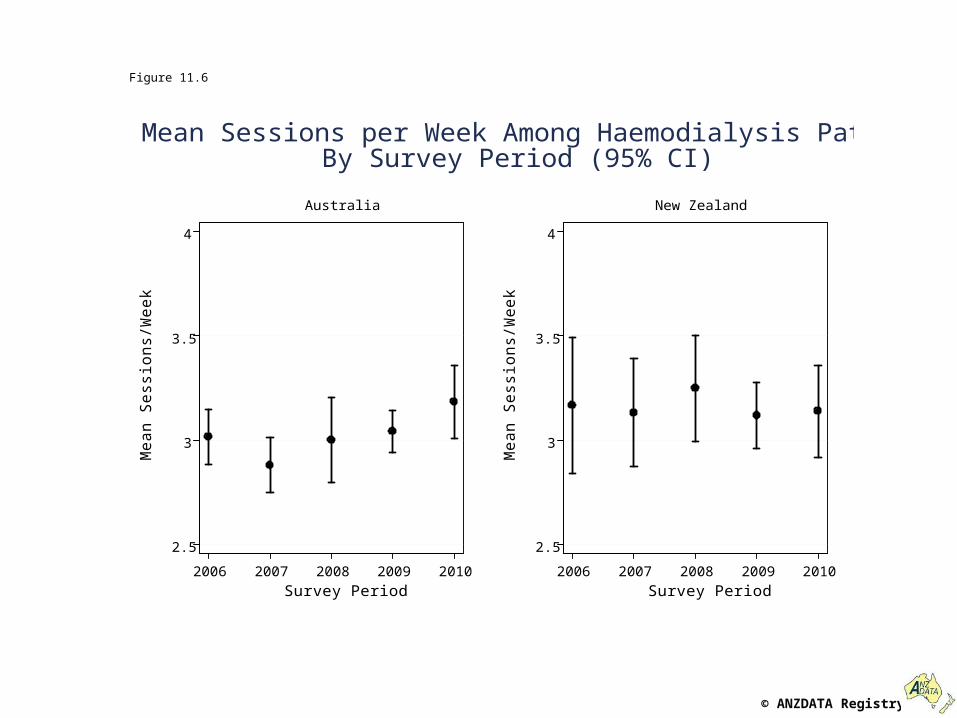
Figure 11.6
2.5
3
3.5
4
Me
an
Se
ss
ion
s/W
ee
k
2006 2007 2008 2009 2010
Survey Period
Aus tra l ia
2 .5
3
3.5
4
Me
an
Se
ss
ion
s/W
ee
k
2006 2007 2008 2009 2010
Survey Period
New Zealand
Mean Sessions per Week Among Haemodialysis PatientsBy Survey Period (95% CI)

© ANZDATA Registry
Figure 11.7
3.5
4
4.5
5
Me
an
Ho
urs
/Se
ss
ion
2006 2007 2008 2009 2010
Survey Period
Aus tra l ia
3 .5
4
4.5
5
Me
an
Ho
urs
/Se
ss
ion
2006 2007 2008 2009 2010
Survey Period
New Zealand
Mean Hours per Session Among Haemodialysis PatientsBy Survey Period (95% CI)

© ANZDATA Registry
Figure 11.8
50
75
100
125
150
175
200
Hb
(g
/L)
2006 2007 2008 2009 2010
Haemodia ly s is
50
75
100
125
150
175
200
Hb
(g
/L)
2006 2007 2008 2009 2010
Peri toneal Dia ly s is
Haemoglobin, December 2006-2010Australia
© ANZDATA Registry
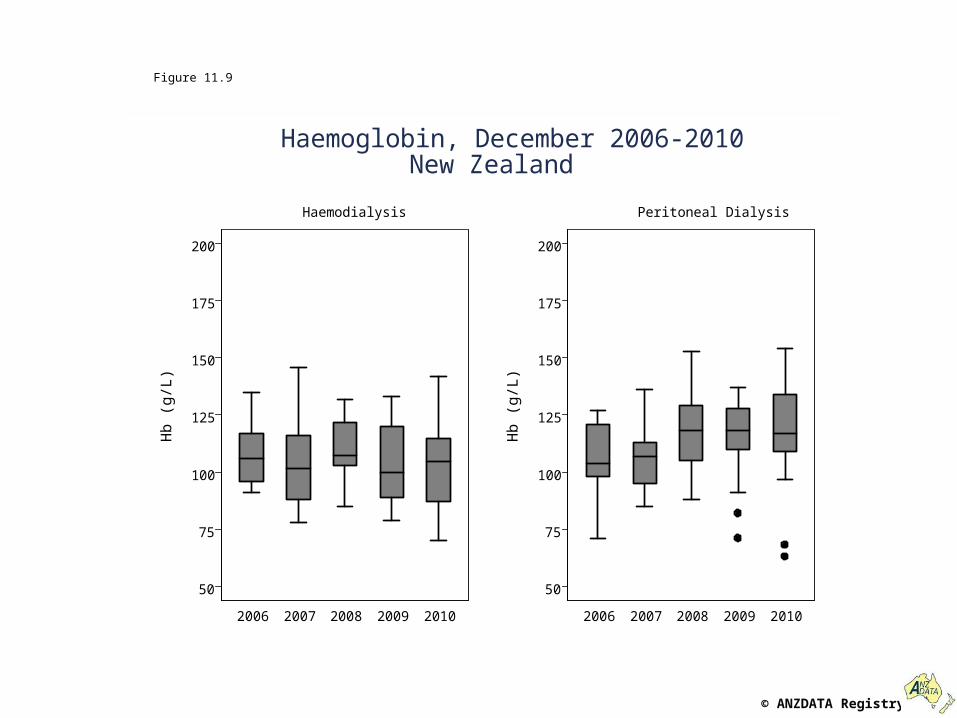
Figure 11.9
50
75
100
125
150
175
200
Hb
(g
/L)
2006 2007 2008 2009 2010
Haemodia ly s is
50
75
100
125
150
175
200
Hb
(g
/L)
2006 2007 2008 2009 2010
Peri tonea l Dia ly s is
Haemoglobin, December 2006-2010New Zealand

© ANZDATA Registry
Figure 11.10
0
10
20
30
40
50
60
70
80
90
100
UR
R (
%)
2006 2007 2008 2009 2010
Aus tra l ia
0
10
20
30
40
50
60
70
80
90
100
UR
R (
%)
2006 2007 2008 2009 2010
New Zealand
URR 90% exc luded as non-phys iological.
Urea Reduction Ratio (HD Patients)December 2006-2010
© ANZDATA Registry
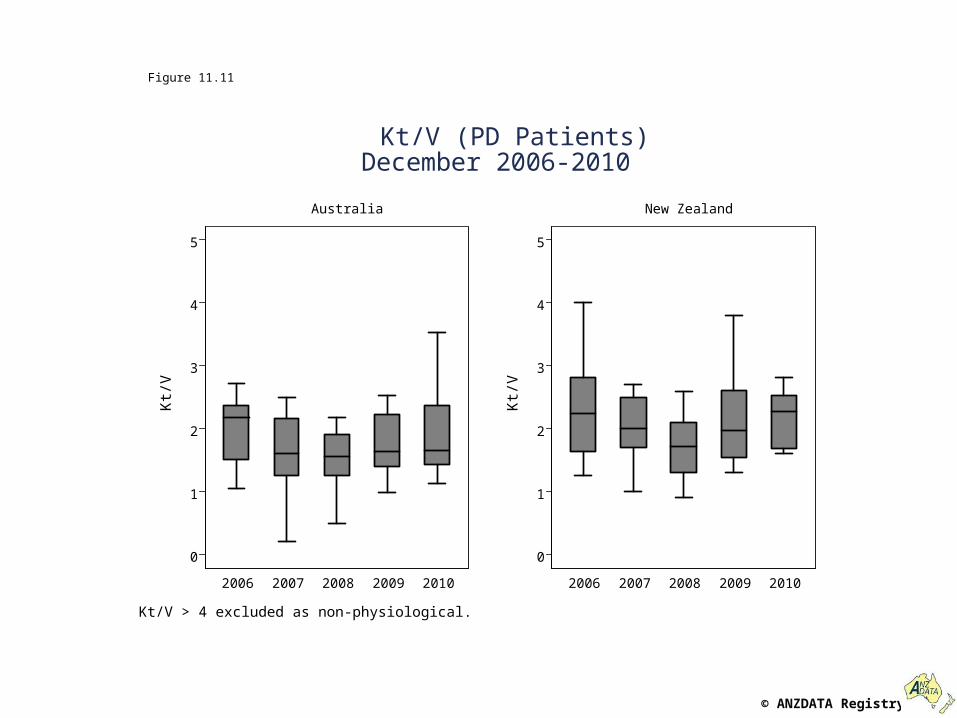
Figure 11.11
0
1
2
3
4
5
Kt/
V
2006 2007 2008 2009 2010
Aus tra l ia
0
1
2
3
4
5
Kt/
V
2006 2007 2008 2009 2010
New Zealand
Kt/V > 4 exc luded as non-phys iological .
Kt/V (PD Patients)December 2006-2010

© ANZDATA Registry
Figure 11.12
1
1.5
2
2.5
3
Ca
lciu
m (
mm
ol/
L)
2006 2007 2008 2009 2010
Peri tonea l Dia ly s is
1
1.5
2
2.5
3
Ca
lciu
m (
mm
ol/
L)
2006 2007 2008 2009 2010
Haemodia ly s is
Serum Calcium, December 2006-2010Australia

© ANZDATA Registry
Figure 11.13
1
1.5
2
2.5
3
Ca
lciu
m (
mm
ol/
L)
2006 2007 2008 2009 2010
Peri tonea l Dia ly s is
1
1.5
2
2.5
3
Ca
lciu
m (
mm
ol/
L)
2006 2007 2008 2009 2010
Haemodia ly s is
Serum Calcium, December 2006-2010New Zealand

© ANZDATA Registry
Figure 11.14
0
1
2
3
4
5
Ph
os
ph
ate
(m
mo
l/L
)
2006 2007 2008 2009 2010
Peri toneal Dia ly s is
0
1
2
3
4
5
Ph
os
ph
ate
(m
mo
l/L
)
2006 2007 2008 2009 2010
Haemodia ly s is
Serum Phosphate, December 2006-2010Australia
© ANZDATA Registry
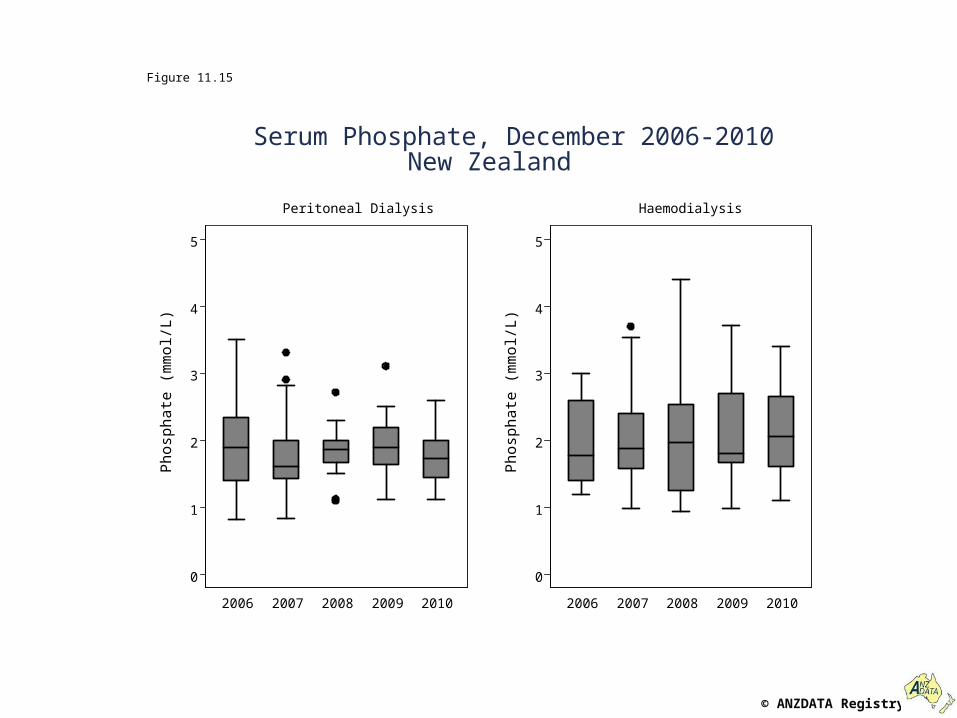
Figure 11.15
0
1
2
3
4
5
Ph
os
ph
ate
(m
mo
l/L
)
2006 2007 2008 2009 2010
Peri toneal Dia ly s is
0
1
2
3
4
5
Ph
os
ph
ate
(m
mo
l/L
)
2006 2007 2008 2009 2010
Haemodia ly s is
Serum Phosphate, December 2006-2010New Zealand
© ANZDATA Registry
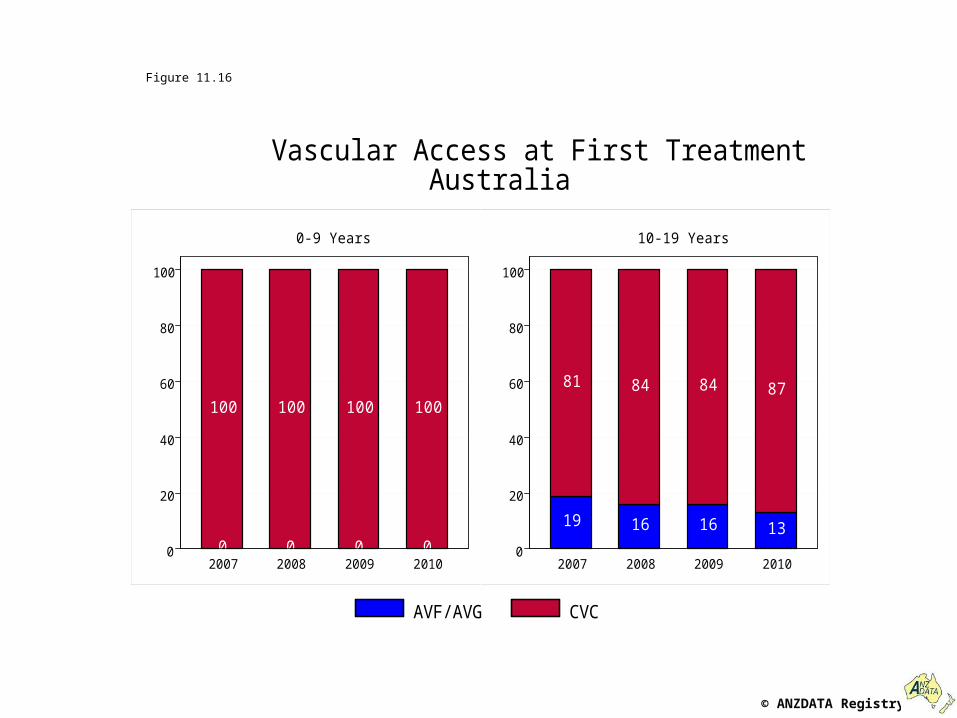
Figure 11.16
0
100
0
100
0
100
0
100
0
20
40
60
80
100
2007 2008 2009 2010
0-9 Years
19
81
16
84
16
84
13
87
0
20
40
60
80
100
2007 2008 2009 2010
10-19 Years
Vascular Access at First TreatmentAustralia
AVF/AVG CVC

© ANZDATA Registry
Figure 11.17
0
100
0
100
0
100
0
100
0
20
40
60
80
100
2007 2008 2009 2010
0-9 Years
4
96
4
96
0
100
0
100
0
20
40
60
80
100
2007 2008 2009 2010
10-19 Years
Vascular Access at First TreatmentNew Zealand
AVF/AVG CVC
© ANZDATA Registry
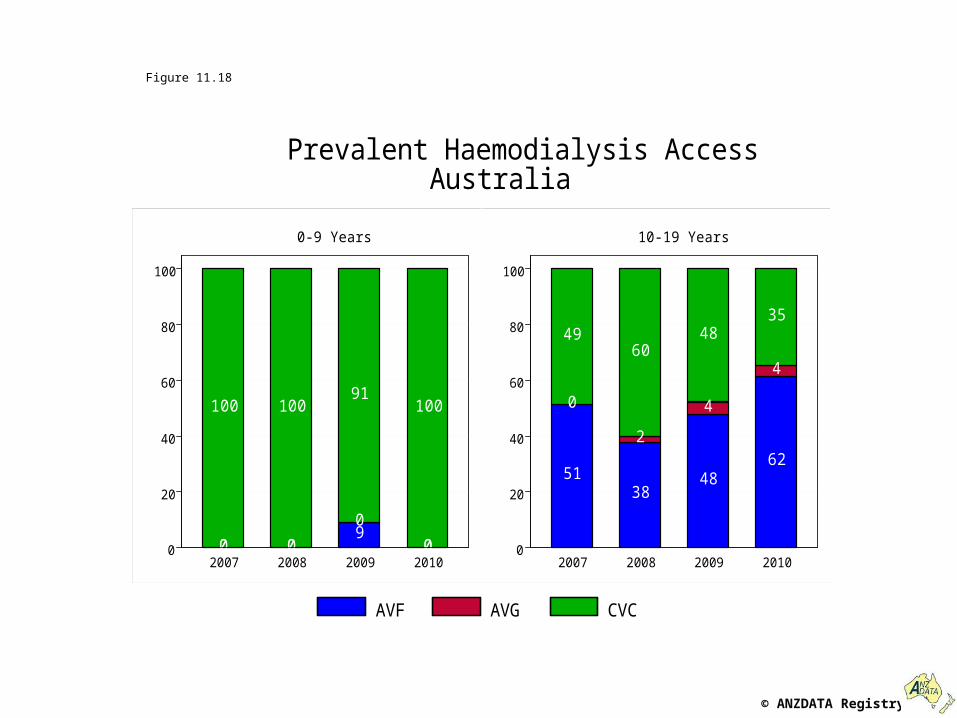
Figure 11.18
00
100
00
100
90
91
00
100
0
20
40
60
80
100
2007 2008 2009 2010
0-9 Years
51
0
49
38
2
60
48
4
48
62
4
35
0
20
40
60
80
100
2007 2008 2009 2010
10-19 Years
Prevalent Haemodialysis AccessAustralia
AVF AVG CVC
© ANZDATA Registry
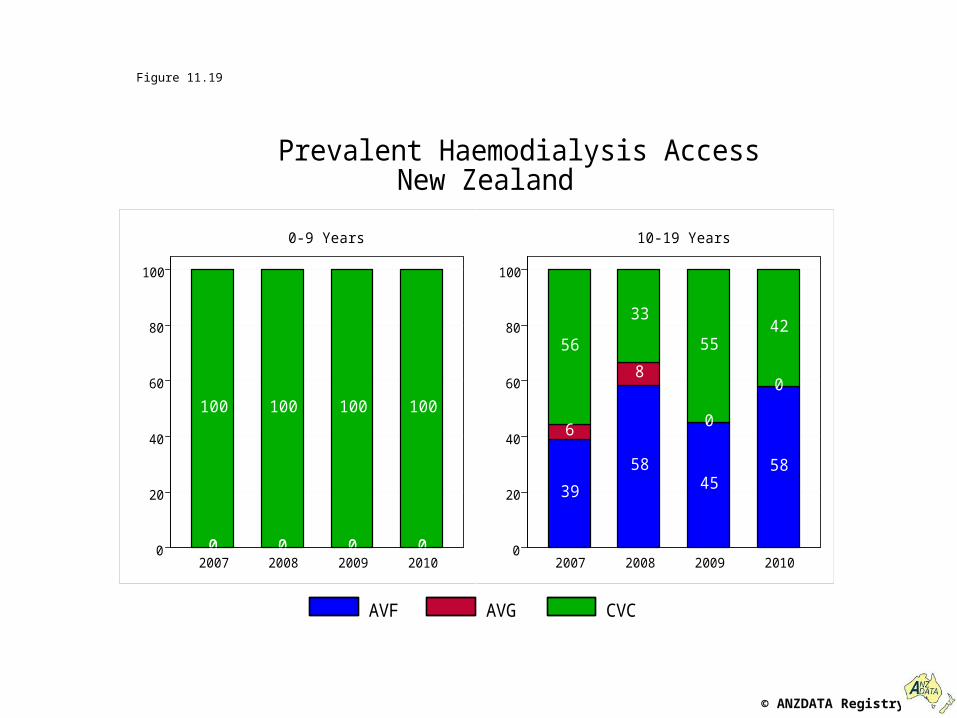
Figure 11.19
00
100
00
100
00
100
00
100
0
20
40
60
80
100
2007 2008 2009 2010
0-9 Years
39
6
56
58
8
33
45
0
55
58
0
42
0
20
40
60
80
100
2007 2008 2009 2010
10-19 Years
Prevalent Haemodialysis AccessNew Zealand
AVF AVG CVC
© ANZDATA Registry
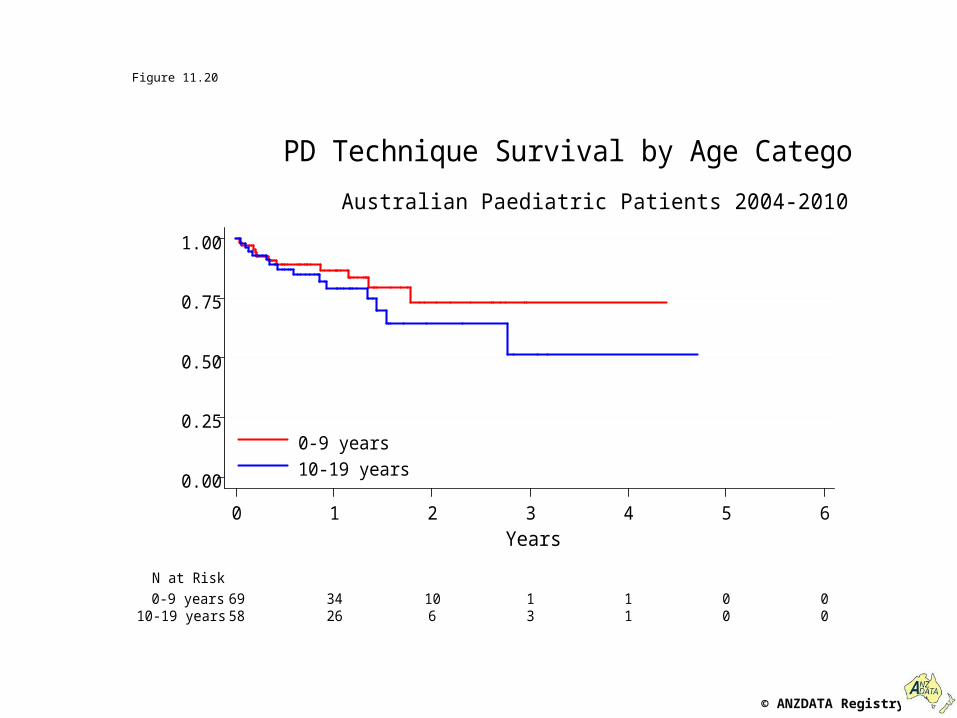
Figure 11.20
0.00
0.25
0.50
0.75
1.00
58 26 6 3 1 0 010-19 years69 34 10 1 1 0 00-9 years
N at Risk
0 1 2 3 4 5 6
Years
0-9 years
10-19 years
Australian Paediatric Patients 2004-2010
PD Technique Survival by Age Category
© ANZDATA Registry
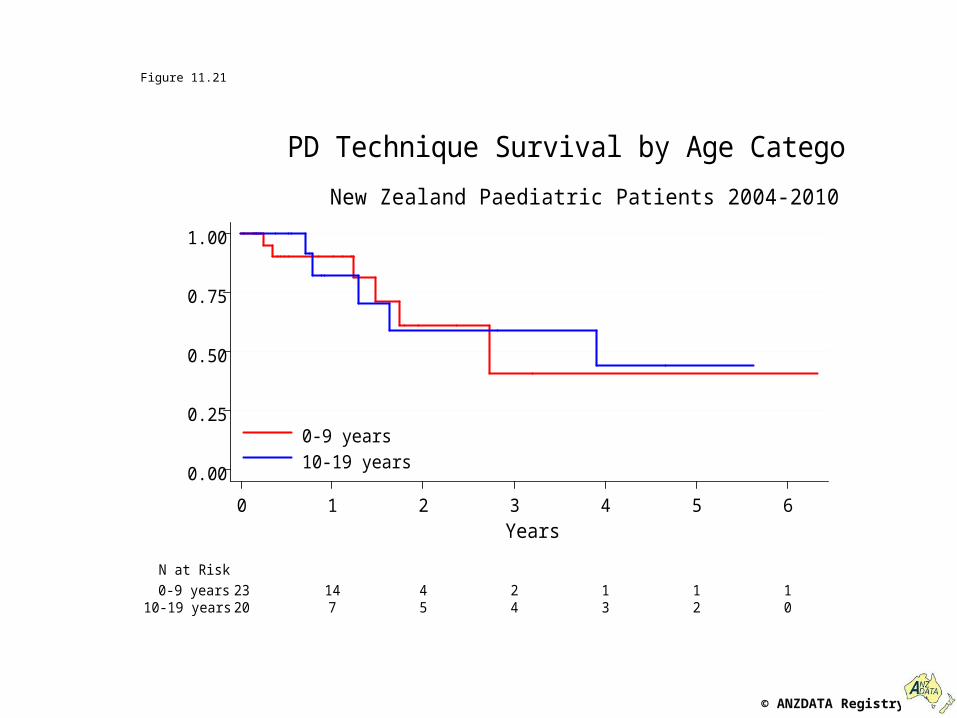
Figure 11.21
0.00
0.25
0.50
0.75
1.00
20 7 5 4 3 2 010-19 years23 14 4 2 1 1 10-9 years
N at Risk
0 1 2 3 4 5 6
Years
0-9 years
10-19 years
New Zealand Paediatric Patients 2004-2010
PD Technique Survival by Age Category
© ANZDATA Registry
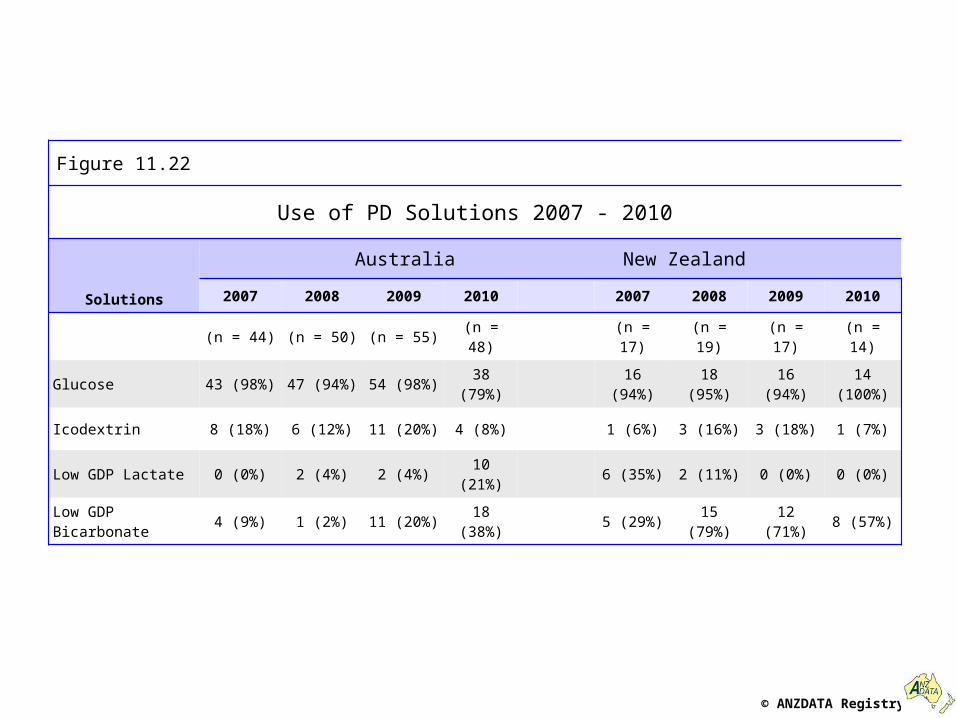
Figure 11.22
Use of PD Solutions 2007 - 2010
Solutions
Australia New Zealand
2007 2008 2009 2010 2007 2008 2009 2010
(n = 44) (n = 50) (n = 55) (n = 48) (n = 17) (n = 19) (n = 17) (n = 14)
Glucose 43 (98%) 47 (94%) 54 (98%) 38 (79%) 16 (94%) 18 (95%) 16 (94%) 14 (100%)
Icodextrin 8 (18%) 6 (12%) 11 (20%) 4 (8%) 1 (6%) 3 (16%) 3 (18%) 1 (7%)
Low GDP Lactate 0 (0%) 2 (4%) 2 (4%) 10 (21%) 6 (35%) 2 (11%) 0 (0%) 0 (0%)
Low GDP Bicarbonate 4 (9%) 1 (2%) 11 (20%) 18 (38%) 5 (29%) 15 (79%) 12 (71%) 8 (57%)


