52
tá - Colombia - Bogotá - Colombia - Bogotá - Colombia - Bogotá - Colombia - Bogotá - Colombia - Bogotá - Colombia - Bogotá - Colombia - Bogotá - Colo

- Bogotá - Colombia - Bogotá - Colombia - Bogotá - Colombia - Bogotá - Colombia - Bogotá - Colombia - Bogotá - Colombia - Bogotá - Colombia - Bogotá - Colombia - Bogotá -

Technical Change and Polarization of the Labor Market: Evidencefor Colombia, Brazil and Mexico�
Carlos A. Medinay Christian M. Possoz
September 1, 2010
Abstract
We use occupations descriptions for Colombia, Brazil, and Mexico, to build computer-use related tasksintensities, and link then to series of cross sections of data of each country in order to empirically assessto what extent the observed empirical regularities, and the reallocation of workers across occupationsthat require di¤erent tasks intensities, are consistent with the SBTC or polarization models (TBTC). We�nd an increase of both wages and workers at the extremes of the wage or skills occupations distribu-tion, the less routinaire/computerizabe, particularly pronounced in the period since personal computersbegan to be introduced in the region. This �nding, along with other empirical regularities, providessupport for some of the main implications of the polarization model in the cases of Colombia and Mexico.
JEL Codes : J3, D3, O3Keywords : Relative Wages, Income Distribution, Technical Change
�We thank Hugo López, Francisco Lasso, Franceso Bogliacino and seminar participants at the Banco de la República inMedellín for comments, and Jorge Eliécer Giraldo for assistance. We are the solely responsible for any errors. The opinionsexpressed here are those of the authors and not of the Banco de la República de Colombia nor of its Board.
yResearcher, Banco de la República. [email protected], Banco de la República. [email protected]
1
1 Introduction
Several studies in the case of developed economies have assigned a role to technical change on the evolutionof earnings inequality, either through skill-replacing (unskill-biased) or unskill-replacing (skill-biased) tech-nologies.1 . Today there is wide consensus that technical change was skill-biased during most of the twentycentury in both developed and developing economies.2 Increases in relative demand of skilled versus unskilledworkers has been found for several Latin-American countries, including Brazil, Colombia and Mexico.3
The study of the evolution of income inequality in Colombia until the 1980s was mostly linked to theaccess to education and the evolution of its returns. Londoño (1990) for example, highlighted the huge returnsto education in the urban Colombia of the 1960s, a decade with the highest income inequality reported inhis study, and attributed the decrease in earnings inequality that took place until the 1980s to the expansionof access to education, the straightforward implication of a standard supply and demand framework, butunconditional to variations in the technologies employed in the production processes.4 It was only until thelate 1990s and 2000s that the role of technical change on earnings inequality, initially motivated by the studyof the e¤ect of the opening of the economy that took place in the early nineties, began to be widely consideredby several authors which largely analyzed the evolution of earnings inequality following various approaches,but usually including the one proposed by Katz and Murphy (1992).5 Although most of those studies foundevidence of international trade a¤ecting relative wages, they did not �nd strong evidence to claim that tradehad been the major force a¤ecting them, and most agreed in attributing a major role in the observed increasein the skill premium during the nineties to skill-biased technical change, SBTC.Nonetheless, various empirical regularities of the Colombia labor market observed over the longer period
of time that includes most of the 2000s, reveals several characteristics that are hard to be predicted by thestandard model of SBTC, and that actually might be better matched by that introducing the task dimensioninto the production function, like Autor, Levy and Murnane (2003) (ALM hereafter) did, and that derivedinto the models of polarization (or Task Biased Technical Change, TBTC) in the labor market developed andused by Autor, Katz and Kearney (2006) (AKK hereafter), and Goos and Manning (2007), among others.First, SBTC predicts an increase in earnings inequality all through the income distribution, with workersincreasing their earnings the more educated they were before the technical change took place. Nonetheless,and just as it has occurred in the US, in the Colombian labor market we observe that earnings of workersin the middle of the income distribution have decreased more than those of workers at the lower end of it.Secondly, although the increase in earnings inequality observed among skilled workers matches the SBTCmodel, the evolution towards a stable or even lower income inequality, among the unskilled workers, is atodds with it.In this article, we use household survey data for Colombia and ,Brazil and census data for Mexico,
to assess whether the TBTC (or Polarization) model could contribute to explain key stylized facts of thelabor market in these countries. We present evidence of aggressive implementation of computer technology inLatin American countries, and important reductions in the cost of computer capital in Colombia since the late1990s. In particular, we test whether there is a positive covariance between increases in wages at the extremesof the wage distribution, and increases in employment at the extremes of the distribution of occupations�average skills or wages. We begin presenting evidence that the tasks more likely to a¤ect workers�earnings
1Acemoglu (2002, 2007) review the broad evidence contained in the literature, and argue that skill-replacing technologies wereendogenously developed in nineteen century Britain, while unskilled-replacing technologies were as well endogenously developedthrough most of the twenty century, since in each of these two periods, it was more pro�table for potential innovator �rms tofocus on the unskilled and skilled markets respectively.
2See the literature review made by Acemoglu (2002), which also includes evidence for developing economies which experiencedlarge increases in their premiums to skills despite both their increases in skills relative supplies, and despite of being implementingprocesses of trade opennes.
3See Sanchez-Paramo and Schady (2003) for evidence of important increases in relative demand of skilled workers for Ar-gentina, Chile, Colombia and Mexico. These authors �nd a much moderate variation in relative demand for Brazil.
4According to Londoño (1990) the wage ratio between workers with complete high school and the non educated was 5.3 inthe 1930s and 9.1 in the 1960s, while between workers with complete university and the non educated it was 10.6 in the 1930sand 28.8 in the 1960s, both �gures much larger than what they have been since the 1980s.
5See for example Núñez and Sánchez (1998a), Cárdenas and Bernal (1999), Robbins (2001), Attanasio, Goldberg, and Pavcnik(2003), Arango, Posada and Uribe (2004) and Santamaria (2004).
2
in Colombia though the intensive adoption of computer technologies, are performed in those occupationswith median wages or skills, which are more intensive in routinary computerizable activities. Then we showevidence that TBTC might have taken place in Colombia and Mexico, but not in Brazil. Polarization inColombia would have lead to an increase in the supply of unskilled labor to manual tasks relative to routinetasks, and to an increase in the supply of skilled labor to abstract tasks relative to routine tasks. Reductionsin the cost of computer capital in the case of Colombia would have led to an increase in the wages of unskilledworkers in manual tasks relative to those in routine tasks, and similarly, to an increase in the relative wagesof the skilled workers performing abstract tasks relative to those performing routine tasks, which in turn,would have contributed to a reduction of earnings inequality within unskilled workers, and an increase inearnings inequality between skilled workers. These e¤ects nonetheless, were not enough to o¤set the severeconsequences of the economic crisis experienced by the country in the late nineties, which particularly hitthe very poorest.We begin presenting some background that presents a sketch of the SBTC and TBTC models, and then
we present the main empirical regularities of the Colombian labor market since 1984 until 2009 and analyzeto what extent they could be matched by either model. Then we brie�y assess the role of SBTC in Colombia,before presenting our detailed assessment of the polarization model for Colombia, Brazil and Mexico. Sincethere are empirical regularities that neither the SBTC nor the standard polarization model seem to match,we present a brief discussion to motivate a modi�ed polarization model that seeks to capture some of thoseunexplained empirical regularities. We �nish with the conclusions.
2 Background
There is a wide variety of hypotheses seeking to explain the evolution of earnings inequality among workers,and most of them, have been focused on the evolution of relative wages between skilled and unskilled workers.More recently, it has been proposed a new approach that places its emphasis on the substitutabilities betweenspeci�c types of task performed by workers of di¤erent skills and the technologies involved in the productionprocess. A large part of the literature focused on explaining the evolution of relative earnings between skilledand unskilled workers propose hypotheses based on di¤erent forms of Skill Biased Technical Change, SBTC,but their framework is limited to explain earnings di¤erences between just those two groups, skilled andunskilled, while the literature focused on a production function that uses as inputs tasks performed by peopleof di¤erent skills allows to establish earnings di¤erences among a broader group of workers, thus lettingexplain additional regularities than those explain by the SBTC models. Before assessing what data can tellus about relative wages and demand of skilled workers once we introduce the task dimension, let us sketchthe theoretical SBTC model, and the TBTC model developed by AKK, in order to understand what changesshould we expect to happen in the labor market due to technical change and computerization. In this sectionwe sketch both approaches and highlight the main implications of each of them.
2.1 Earnings Inequality and the Skill Premium
Literature on skill premium is widely reviewed by Acemoglu (2002), so here we just provide the basic elementsof it in order to express our argument later. The standard model in this case considers two types of workers,skilled, H, and unskilled, L. who are inputs in the following CES production function for the aggregateeconomy: Yt = [�t (AHtHt +BHt)
�+ (1� �t) (ALtLt +BLt)�]
1=�; where AHt and ALt represent skilled
and unskilled labor augmenting technological change, BHt and BLt are skilled-labor-replacing and unskill-replacing technologies respectively, and � � 1
1�� is the elasticity of substitution between skilled and unskilledworkers.6 Standard optimization assumptions imply the following relationship between relative wages and
relative supplies (simpli�ed omitting the terms on the Bs) : Ln�wHt
wLt
�= Ln
��t1��t
�+ ��1
� Ln�AHt
ALt
��
1�Ln
�Ht
Lt
�: In this model, an increase in �t implies SBTC, and so does an increase in AHt=ALt when � > 1;
6Note that this model implicitly assumes perfect substitution across age groups with the same level of education. For a modelthat relaxes this assumption see Card and Lemieux (2001).
3
that is, when skilled and unskilled workers are gross substitutes, so that an increase in AHt=ALt will beunskill-replacing.7
Under what Acemoglu (2002) calls the steady-demand hypothesis, the structure of demand for skills has
evolved according to Ln�AHt
ALt
�= 0 + 1t, where t is time, what supposes that SBTC has progressed
constantly, and implies that, once we simplify omitting the term that is a function of �t, the previousrelationship becomes
Ln
�wHtwLt
�=� � 1�
0 +� � 1�
1t�1
�Ln
�HtLt
�(1)
which is the equation commonly estimated to explain the relation between relative wages and quantities.Whenever it is found a positive covariation between these variables during a determined period of time, it istaken as evidence of SBTC.A related model by Krusell et al. (2000), use a set up that allows capital being a complement of skill labor
and a substitute of unskilled labor. Using their model they can explaining the empirical result obtained forthe United States under the steady-demand hypothesis, since the new terms they include in (1) are nearlyperfectly related to the time trend used by Katz and Murphy (1992) to simulate labor demand, what Krussellet al. to conclude that Katz and Murphy�s time trend is a good proxy for capital-skill complementarity inthe analyzed period.Acemoglu (1998), Kiley (1999), and Acemoglu (2007) endogenize the skill bias in technology by making it
a function of pro�t incentives in a similar way as some models of endogenous economic growth do. Althoughthose models present an illuminating story of how skill based technology evolves, which can even be consistentwith the timing of innovations, they still consider only two labor inputs, and thus, end up explaining similarempirical regularities as the steady-demand model does.Trying to explain one of the empirical caveats SBTC models present, namely their not being able to
predict the reduction of earnings among the unskilled workers, Acemoglu (1999) presents a model that canhave either a pooling or a separating equilibrium. When the economy moves from the pooling to the separatingequilibrium, the unskilled move from middle wage occupations to low wage occupations, and the skilled frommiddle to high wage occupations. Neither this model or that by Krussell et al. (2000), is able to explain thepositive covariation between earnings and quantities at the lower end of the income distribution reported byAutor, Katz and Kearney (2006, 2008), since in their model skill premium increases both because earnings ofthe skilled increase, and those of the unskilled decrease, due to technological change. Although in AKK theearnings of all unskilled workers might as well fall, those at the lower end of the distribution might actuallyincrease. Lack of predicting an increase in the share of workers performing unskilled tasks is another criticismto the SBTC model. Actually, a quality of the polarization model we will describe next, is its possibility topredict the positive covariation between wages and quantities at the lower end of the earnings distribution.With the exception of models like that by Card and Lemieux (2001), which considers imperfect substi-
tutability among workers of di¤erent ages and the same education, models based on (1) can only explainearnings di¤erences between two groups, what prevent them from being able to explain more complex em-pirical regularities like a potential polarization of earnings, under which both groups of workers, at the lowerand upper ends of the distribution, increase their earnings relative to those at the middle of it. That is oneof the goals seek to explain by the models we analyze next.
2.2 Earnings Inequality and Polarization in the Labor Market
In this section we brie�y present the key characteristics and implications of the theoretical model developedby AKK, which incorporates the key implications of that developed by ALM, and formally models the conceptof polarization in the labor market, introduced by Goos and Manning (2007). The model moves beyond the
7See for example Freeman (1976), Katz and Murphy (1992), Autor, Katz and Krueger (1998), Johnson and Sta¤ord (1998),Murphy, Riddell and Romer (1998), Autor, Katz and Kearney (2008), and the surveys by Gordon and Dew-Becker (2008) andAcemoglu (2002), on which this section builds heavely, and the references quoted therein.
4
standard two types of skills approach, towards what Acemoglu (2002) argued it was need, multidimensionalskills. In words of Gordon and Dew-Becker (2008), "three- or �ve-dimensional breakdown of skills".In the model, there are three tasks. First, the routine task, like clerical work and repetitive production
tasks, can be performed by either computer capital or human labor, which are assumed to be perfect sub-stitutes to perform routine tasks. The abstract task which involves analysis, direction and coordination andcomplex activities. Finally, the manual task as those performed by barbers, truck drivers, etc. Both abstractand manual tasks are non-routinary. The introduction of computers a¤ects the demand of labor supplied toroutinary tasks, and the decline in the cost of computing adoption further a¤ects the assignment of laboracross tasks.8
2.2.1 Firms
Aggregate production is given by the Cobb-Douglas production function
Y = A�R�M (1����) (2)
where A, R, andM are abstract, routine and manual tasks, and �, � 2 (0; 1). Abstract and Manual tasks canonly be performed by workers who supply labor inputs LA and LM , while Routine tasks can be performedby workers supplying LR or by computer capital, X, the exogenous driving force in this model, which issupplied perfectly elastically.The �rm maximizes pro�ts subject to (2) and the fact that labor supplied to perform Routine tasks, and
capital, are perfect substitutes. That is, R = LR + X, where LR is the amount of labor demanded by the�rm to perform Routine tasks. Perfect substitution of these inputs imply that their prices are equal, thatis, WR = P , where WR and P are the prices of labor demanded for Routinary tasks and computer capitalrespectively.
2.2.2 Workers
There are N workers endowed with three skills, S = fa; r;mg, each denoting the individual�s endowment toperform abstract, routine and manual tasks respectively. Individuals can either be High School workers, H,or College workers, C; and there are a fraction � and 1 � � of workers in each of these groups respectively.College workers are assumed to be endowed with one e¢ ciency unit of abstract skill, and each supplies oneunit of labor. High School workers can either supply one e¢ ciency unit of manual task or r e¢ ciency unitsof routine task, where r 2 (0; 1) and it is assumed that r has a known probability density function, r~f (r).Each High School worker chooses occupation to maximize earnings. In particular, they would choose theroutinary task if WR � r > WM �M =WM , that is, if r > WM=WR =WM=P = �
�: Aggregate e¢ ciency unitssupplied to the routine task are then
LR (��) = �N � [1� F (��)] � E (rjr > ��) (3)
and the aggregate e¢ ciency units supplied to the manual task are
LM (��) = �N � F (��) � E (M jr > ��) = �N � F (��) (4)
On the other hand, labor supply to the abstract task becomes
LA (�) = (1� �)N (5)
8The speci�c role of computers on wages has also been studied by Krueger (1993), DiNardo and Pischke (1997), Autor, Levyand Murnane (2000), Brynjolfsson and Hitt (2002), Spitz (2004), Borghans and ter Weel (2007), and Nresnahan, Spitz (2008)among others.
5
2.3 Implications of the SBTC and TBTC Models
Maybe the key di¤erence between the SBTC and the TBTC models is the later disaggregates labor in morethan just the two types considered by the SBTC model, and considers intuitive ways of substitutabilities andcomplementarities between them and computer capital.Some of the key implications of AKK model are that a decline in the price of computer capital, P , causes
an increase in the demand for computer capital, X, an increase in the demand for routine task input, R, anda reduction in labor supplied to the routine task, LR. This in turn, implies that the increase in R is entirelysupplied by computer capital and that labor supply to the manual task, LM , increases. In addition, theyconclude that as P decreases, the wage level of the abstract task measured in e¢ ciency units, WA, increases,and so does the relative wage between manual and routine tasks, WM=WR. Note that the model allows thepossibility of both, an average reduction in earning of the unskilled workers, and an increase in earnings ofthe unskilled at the lower end of the distribution relative to those of unskilled workers in the middle of thedistribution, what could help to explain the reduction in earnings at the lower end referred to as a puzzle byAcemoglu (2002), and previously addressed by Galor and Moav (2000), Acemoglu (1999), and Caselli (1999),as it simultaneously could explain polarization in the labor market.Very importantly, note that, unlike the SBTC models, this model can be consistent with an increase in
both the amount of labor supplied to the manual tasks, and an increase in the wage received by workersperforming manual tasks, that is, with a positive covariation between earnings and quantities at the lower endof the income distribution. It would as well be consistent with a reduction in inequality among workers at thebottom 50 percent of the distribution as inequality among worker at the upper 50 percent increases. Theseimplications go beyond the scope of most SBTC models. Furthermore, a slight variation of AKK�s model,using the same intuition, would be consistent with a simultaneous increase in both earnings and workers atthe upper end of the earnings distribution, as standard SBTC predict.Goos, Manning and Salomons (2009b) claim that the SBTC model fails to predict correctly the changes on
employment between quali�ed and non-Quali�ed workers, and points to the evidence provided by the studiesby AKK for the United States, and Goos and Manning (2007) for the United Kingdom, which have shownthat employment has been growing for both, skilled and unskilled occupations, while medium quali�cationjobs have lost participation in the labor market, a result labeled �Job Polarization�by Goos and Manning(2007) and "Task-Biased Technological Change" by Goos, Manning and Salomons (2009a).Goos, Manning and Salomons (2009a) propose at least three reasons that could explain the job polarization
hypothesis. First, routinary jobs substitution through the technical change process suggested by ALM.Second, the phenomenon of general globalization and o¤shoring, that have caused important changes onlabor structure of richest countries and even on some of medium income countries like Colombia. Third, theyargue that the proportion of rich persons has grown both in the United States and the United Kingdom,which has caused a signi�cant increase in the demand for unskilled work that carries out service activitieswith high component on manual tasks.Their empirical assessment of the case of the United Kingdom lead them to conclude that the UK has
experienced a job polarization process since the early nineties, and that its main explanation is the hypothesisbased on the adoption of new technologies that complemented the jobs that required greater quali�cationand substituted jobs intensive in intermediate skills.In the next section we will describe the main empirical regularities of the Colombian labor market, and
suggest to what extent the SBTC or polarization models could be able to explain them.
3 Dynamics of Colombian Labor Market Over the Past 25 Years
To describe the key features of Colombian labor market over the last two decades we use Colombian householdsurveys provided by the Administrative Department of National Statistics, DANE, from 1984 to 2009. Eventhough DANE�s household surveys currently cover more than 20 of the main Colombian cities, it used tocover only seven cities during the 1980s and part of the 1990s, and that is why we focus our analysis on
6
these cities throughout the paper.9 In addition, we only study labor market dynamics of males to avoidgetting involved into considerations di¤erent to the focus of our analysis, like the e¤ects of technical changeon gender wage inequality. Unless speci�cally stated, the analysis considers males 19 and older.10 Finally,we will additionally present descriptive statistics and results of the described population restricted to wageearners or skilled (regardless of whether they are wage earners) workers, a subset of workers which we willrefer to as modern employment, and that each year represents between 70 and 75 percent of our sample inthe analyzed period.11
3.1 Changes in Key Employment Indicators
Figure 6 allows us to analyze the evolution of key labor market indicators, namely the unemployment,participation and occupation rates, between 1984 and 2009, for the seven main Colombian cities. The graphsat the top of the �gure illustrate the evolution of the unemployment rate for all males 12 and older (left), andfor those males by skill (right), de�ning skilled males as those with 12 or more years of education, that is,with at least one completed year of college. The vertical lines indicate the dates at which the unemploymentrate reached its minimum (third quarter of 1994) and maximum (third quarter of 1999) levels, which werecharacterized by periods of high and negative growth rates respectively (5.2% and -4.2% annual real GDPgrowth rates respectively). The high unemployment levels reached during the economic crisis of late 1990swere unprecedented in the analyzed period. It a¤ected both skilled and unskilled males. As graphs at thebottom of the �gure show, skilled males kept high their participation rates during the period, and even duringthe economic crisis, so that changes in their unemployment rates were fully explained by reductions in theiroccupation rate rather than by new males coming into the active labor force. Unskilled males on their part,reduced their participation rate somewhat constantly since the mid 1990s, which contributed to attenuatetheir unemployment rates to the extent that they became comparable to those of the skilled workers in thesecond half of the 2000s.
3.2 Changes in Wage Inequality
To analyze the evolution of wage inequality we focus on males 19 and older working 20 hours or more aweek. As it is shown in the graphs on the left in Figure 7, for both the whole sample of workers and that ofworkers in the modern sector (wage earners or skilled), wage inequality, measured by the standard deviationof log hourly earnings, registered a slight increase between 1984 and the third quarter of 1996, when it beganto continuously increase much more markedly until 2001-2002, when it stayed at its highest level beforebeginning a permanent decrease to levels still above those of the early 1980s. The picture depicted by thatgraph conceals the di¤erent patterns followed by males according to their education levels. As it is shown inthe graphs on the right in the �gure, although the overall evolution of wage inequality among the unskilledmales is similar to that followed by all males, that of skilled males registers a permanent increase sincethe early 1990s rather than since 1996. The increase in wage inequality of skilled males took place mostlybetween 1992 and 1994, matching a period in which the economy was becoming more opened to internationaltrade, and then between 1997 and 2002, when computer technologies were being massively implemented. Inaddition, inequality among the unskilled returned to its early 1980s level, when we consider the whole sampleof workers, and even to lower levels when we only consider worker in the modern sector; while inequalityamong the skilled remained above its late 1990s levels for both samples of workers.The role of international trade has been empirically addressed for Colombia by Attanasio, Goldberg, and
Pavcnik (2003), Cárdenas and Bernal (1999), Núñez and Sánchez (1998a), Robbins (2001), and Santamaria(2004). Although all studies but the one by Santamaria (2004) �nd that trade increased inequality inColombia, all suggest that the magnitude of its impact was moderate, as most of the literature reviewed by
9The cities included are Bogotá, Medellín, Cali, Barranquilla, Bucaramanga, Manizales and Pasto. Dane�s household surveyswere subject to changes that do not allow us to obtain comparable �gures for the second semester of 2006, so we do not considerthem.10We do not include unpaid family workers. Earnings are corrected for top-coding (wages were top-coded in $1�000,000 until
June 1993) using cite: Nuñez and Jimenez methodology.11A detailed analysis of the evolution of modern employment in Colombia is made by López (2010)
7
Acemoglu (2003) �nd it as well for the United States. Both of those �ndings seem consistent with internationalevidence for developed and developing countries quoted by Acemoglu (2003) and Robbins (2003).12
To better understand the dynamics of wage inequality by skill, Figure 8 shows kernel densities of loghourly wages for groups of years and by skill for the sample of workers in modern employment. As it becomesclear from the �gure, during the analyzed period the unskilled males�s income distribution shifted slightly tothe right and became more equal. In addition, the wage distribution of skilled males became �atter and with alarger share of people under eight, implying that a share of skilled males from the middle of the distributionmoved to the left. This regularity is very important since it shows that as the total set of workers withlow earnings, both skilled and unskilled, became more numerous, those among the unskilled increased theirearning, thus evidencing a the positive covariation between quantities and prices usually linked to demandforces.Figure 9 shows the evolution of male�s hourly wages for �ve income percentile groups: 90, 75, 50, 25
and 10, and for all males (left), unskilled males (center) and skilled males (right). On the whole, males�wages slightly decreased between 1984 and 1992, when they began to increase, until 1994 for the unskilled,and until 1998 for the skilled. Between 1998 and 2005, and further until 2009, wages of the unskilled malesbecame more equally distributed since earnings of worker at the 90 and 75 percentiles increased relativelyless than earnings of workers at the bottom percentiles. Since 1997-1998 unskilled males began a permanentprocess of deterioration of their wages until reaching values about 30% below their 1984 levels due to the late1990s economic crisis that particularly a¤ected that group�s earnings. Among the skilled workers the periodor largest increase in inequality was right after the economic crisis, but still after earnings bottomed, theyremained more unequally distributed that they were in 1984 or the early 1990s, when computer technologywas just beginning to be introduced in the country. That history is clear when we analyze Figure 10, whichshows that between the early 1990s and the second half of the 2000s, the reduction in earnings inequalityamong the unskilled was mostly explained by a reduction in the 90-50 ratio, while the increase in earningsinequality among the skilled was mostly explained by the increase in the 90-50 ratio.In short, among the unskilled males, earnings decreased substantially during most of the analyzed period,
and when inequality decreased it was because wages of the better o¤ in the group decreased, while theincreases in inequality was due to reductions in wages of the worse o¤. On the other hand, among the skilledmales, when inequality decreased it was because wages at the median of the group decreased, while theincreases in inequality was mostly due to increases in wages of the better o¤, those at percentile 90 relativeto percentile 50, consistent with the process of �attening of their income distribution depicted in Figure 8.As it is shown in Figure 11, the result of these dynamics led to a pattern of relative wages between skilledand unskilled males similar to the one of the standard deviation of log hourly earnings presented in Figure7. That is, when inequality increased, it did both within and between skills, a so it did when it decreased.In addition, its is important to highlight that while the premium between workers with complete highereducation or more and those unskilled remains in the second half of the 2000s much higher that it was in theearly 1990s, the premium between workers with incomplete higher education and the unskilled decreased,again consistent with what was observed in the income distributions of Figure 8 and with the �ndings byPosso (2008) that show that earnings of workers with higher education in the 10 and 50 percentiles, thosemore likely to have incomplete higher education, fell constantly since 1999.In the analysis that follows we will focus on three di¤erent periods: from 1984 to 1990, from 1990 to 2005
and from 1990 to 2009. The �rst period is characterized by important increases in the education level ofthe labor force, the second one includes the economic crisis of late 1990s, and it is the one expected to haveaccounted for the main increases in technology adoption, as it will be shown below, along of course with thethird period. The period ending in 2009 though is less likely to be contaminated by the economic crisis ofthe late 1990s, since by 2005 the economy was just bottoming up, and it was not until 2006 and 2007 that itwas fully recovered.
12Acemoglu (2003) quotes references that provide evidence that the skilled-unskilled wage gap increased in Mexico, Brazil,Venezuela, Argentina and Bolivia, and remained approximately constant in Chile and Costa Rica, despite substantial globaltrade opening during the analyzed period. Robbins (2003) reviews evidence of increases in the relative demand for skills inArgentina, Chile, Colombia, Costa Rica, Mexico, Peru, the Philippines, Taiwan and Uruguay, as these economies were openingto trade.
8
Figure 12 shows the changes in average wages by wage percentile within education levels for three di¤erentperiods: 1985-1995, 1995-2005, and 1985-2005, and for the whole sample of workers for di¤erent periods oftime. The �gure shows that during the �rst period the wages of the less educated population equalized,since those of males with primary or incomplete secondary increased relative to those of males with completesecondary. On the other hand, during the same period the increases in the wage gap between skilled andunskilled workers was mostly due to the high increase in earnings of males in the highest percentile of thedistribution.During the second period, the wage gap between males with complete secondary with respect to those
with primary or incomplete secondary decreased for the lowest 40 percent of the wage distribution, butincreased for the rest. On the other hand, only males with higher education at or above the 70 percentileincreased their wage gap with respect to the unskilled males. This empirical regularity suggest a movementof males with complete secondary education, who are the most likely to perform routinary tasks (those ofintermediate level of complexity and that often can be automated/computerized), from these tasks to othermore manual. A similar history can emerge from the �gures of the skilled males: the sharper decrease in theincome of those below their median wage suggest they might as well have moved from more to less complextasks (from analytic to routinary tasks).Finally, the graph in the lower right of Figure 12 shows the results for the whole set of workers. The graph
shows a pattern similar to the one reported for the United States by ALM and AKK, with two exceptions:�rst, in the Colombian case, after the economic crisis of the late 1990s there was a pronounced reduction inthe average wages of all groups of workers, as it became clear from Figure 9, that particularly impoverishedthe unskilled, and an important share of the skilled workers, explaining the dramatic fall in wages of the verypoorest, as it is shown in the lowest percentiles of the wage distribution in Figure 12. Secondly, between1995 and 2005 or 2009, the period in which computers began to be adopted by �rms, the curve has a muchmore pronounced U-shaped that in the case of the United States, but only for the upper 75% of the incomedistribution, since the lowest 25% was the one most severely hit by the crisis, and even by then had notrecovered.It is still important to highlight that the SBTCmodels would not predict the U-shaped pattern of the �gure
but rather a continuous pattern of increase in earnings inequality along the income distribution. Nonetheless,previous work by Núñez and Sánchez (1998a, b), Arango, Posada and Uribe (2004), Cárdenas and Bernal(1999), Attanasio, Goldberg and Pavcnik (2003), and Santamaría (2004), has attributed the increase in thewages of skilled relative to unskilled workers that took place in the 1990s, or the increase in the cost ofskilled relative to that of unskilled labor reported by Cárdenas and Bernal (2003), to the huge increase inthe demand for skilled relative to unskilled labor, and suggest a roll for Skill Biased Technological Change,SBTC, and the liberalization of trade in the early 1990s.
3.3 Changes in Labor Supply by Skill
Figure 13 shows the permanent trend of increase in the number of college educated workers in our sample,and for the subset of wage earners or skilled workers. By 2005, college educated workers were three timesas many as they were in 1984, while high school workers �uctuated between 1.75 and 2.0, and workers withprimary education were nearly as many as those in 1984.
4 Assessing the Role of SBTC in Colombia
As we mentioned before, the relation between the skill premium and the relative supply of skills in Colombiahas been widely analyzed. In this section we reassess the previous evidence using household surveys from1984 to 2009. Although we expect that our results in this section are not going to show major di¤erences tothose of previous studies, we do want to simultaneously show the results of this exercise and the one we willperform below to assess the polarization model using the same dataset, as a way to validate our data bothwhen compared to the one used in previous studies, and here between the two models.Note �rst that in the early 2000s, the skill premium of Colombia, Mexico and Brazil were among the highest
9
when compared with the broad set of countries included in Figure 14. We estimate (1) for the Colombiancase.13 Panel A of Table 1 shows our estimates, which reveals that when we use the equivalent skill premium,and the relative equivalent employment and unemployment rates, the implied elasticity of substitution forColombia is 1:47. When we use the equivalent work hours instead, the elasticity of substitution becomes1:16. Panel B of Table 1 shows the results obtained when we additionally control for the minimum wage. Inthat case, the elasticity is equal to 1:31, with equivalent jobs, and to 1:27 with equivalent work hours. In allcases � > 1, implying that skilled and unskilled workers in Colombia are gross substitutes.Our estimated elasticity of substitution for equivalent employment when not controlling for the minimum
wage, is similar to the ones previously found by Núñez and Sánchez (1998a) and Santamaría (2004) whichwere equal to 1:37 and 1:48 respectively.14 Estimates of this elasticity for Chile, obtained by Gallego (2006),range between 1:39 and 1:67, while Katz and Murphy (1992) and Acemoglu (2002) estimate it in 1:41 forThe United States. In short, our dataset allow us to get estimates that are consistent with those of previouswork.15
To try to understand whether computer adoption in Colombia can contribute to explain the magnitude ofthe changes in the skill composition of the Colombian labor force and the skill premium and earnings inequalityin general previously documented, we proceed in the next section to assess whether the polarization modelcan provide a consistent story to explain those changes. To do it, in the following section we will beginexplaining the way we empirically introduce the task dimension, a dimension that incorporates a directrelationship between workers� activities and computer use, and a dimension on which utility maximizerworkers, endogenously sort.
5 Assessing the Role of the TBTC Model in Colombia
As we mentioned previously, we want to quantify changes in relative wages and supply of skills in the labormarket, to computer use. To do it, we adopt the task dimensions proposed by ALM and previously described.According to the theoretical model outlined above, there are key implications of that framework that canbe used to test for the e¤ects of computer use on wages and supply of workers with di¤erent skills. In thissection we begin de�ning the tasks in our empirical data that we expect could perform the roles implicitin the polarization model previously sketched. Then we show how has been the adoption of computers andinternet in Colombia, and how computer use is related to the di¤erent occupations when we order them byskill or earnings. Finally, we show how workers have moved across occupations of di¤erent skill intensities,and assess to what extent the results consistent to the polarization model.
5.1 Linking Computer Use and Workers Skills
Since the work by ALM, other authors like Goos and Manning (2007), Goos, Manning and Salamons (2009),Spitz-Oener (2006), AKK, Dustmann, Ludsteck and Schönberg (2007), and Autor, Katz and Kearney (2008),have adopted models in which workers with di¤erent skills choose to supply their work to di¤erent tasks inwhich their input might be complementary, substitute, or unrelated to computers, in order to explain changesin the relative demand and wages of skilled workers.16 Here we follow this approach and use Colombianhousehold survey data to classify Colombian workers�occupations in the task dimension, according to theconceptual grounds used by ALM.In particular, we use the National Classi�cation of Occupations of the Department of National Statistics
of Colombia (DANE by its acronym in Spanish), which adopted the CNO70 international classi�cation ofoccupations, to classify occupations according to the same �ve tasks categories ALM did: (i) Non-Routine
13We use a Vector Error Correction Model (VEC), because the series presented a cointegration process. We estimated asystem where skill premium and relative supply were endogenous variables.14Núñez and Sánchez (1998a) and Santamaría (2004) do not control for the unemployment rate though.15Our results also reveals, by means of estimating the relative demands (not show here), that contrary to the tendencies
registered by relative labor demand that suggested that it would keep constantly growing, it actually decreases in the late 2000s.16Some controversy about the polarization and other approaches can be found in Hilton (2008)
10
Cognitive/Analytic (MATH), (ii) Non-Routine Cognitive/Interactive (DCP), (iii) Routine Cognitive (STS),(iv) Routine Manual (Finger), and (v) Non-Routine Manual (EHF).17
First notice that the �ve tasks are split into two groups: routine and non-routine tasks. Routine tasksare meant to be those that can be computerized and non-routine tasks those that cannot. We follow theconventions used by ALM, according to which among the routine tasks there are some manual, that require"�nger dexterity" (Finger), in which they include tasks like "monitoring the temperature of a steel �nishingline or moving a windshield into place on an assembly line", and others that are cognitive, that require "settinglimits, tolerances or standards" (STS), like call centers or automatic teller machines. On the other hand,among the non-routine tasks we can �nd some that are analytic, that require "from arithmetic to advancedmathematics" (MATH), like those performed by researchers, engineers, etc., others that are interactive, whichrequire "direction, control and planning" (DCP), like those performed by managers, lawyers, etc.; and �nally,others that are manual, which require "eye-hand-foot" (EHF) coordination, like the one performed by truckdrivers.The previous classi�cation of occupations according to their intensities in the �ve di¤erent tasks described
above, allows us to assess the changes that intensities of each task across occupations experience with time,since workers�movements across occupations weight di¤erently tasks intensities, leading to changes in taskintensities in the aggregate. This dimension of variation in tasks intensities is what ALM call the �extensive�margin, that is, the one that is obtained maintaining the task content within occupations at its 1984 level.18
Since the international classi�cation of occupations adopted in Colombia was not updated during the analyzedperiod, we cannot measure variations in tasks intensities along the �intensive�margin, meaning, the onedetermined by changes within occupations.19
5.2 Computer Related Technology Adoption in Colombia
As Figure 15 shows, personal computers began to be introduced in Colombia in the early 1990s, while theinternet began to be introduced in the mid 1990s. On the other hand, Figure 16 shows that computer andinternet adoption in Colombia has taken place at a lower pace than most South American countries. AlthoughColombia registered similar use of computers and internet to Brazil until 1999,from 2000 on Brazil began tomove ahead, and to increase the gap with respect to Colombia.It is worth noticing that the 90/50 percentiles wage gap among the skilled workers shown in Figure 10
picked up in 1992, and the 50/10 percentiles wage gap increased beginning in 1995. In addition, the 50/10wage gap among the unskilled began to increase as well by 1992, while the 90/50 wage gap stagnated between1993 and 1998, slightly increased until 2000, and then dramatically and continuously fell. This pattern couldbe consistent with AKK theoretical model previously outlined if the decrease in the price of computer capitalshown in Figure 15 increased computerization, reducing relative wages of routine (middle income) versusabstract (higher income) skilled workers. It would also explain the �uctuations in percentiles wage gaps ofthe unskilled workers, since there actually was a decrease in the 90-50 percentile di¤erential, if there was adecrease in the relative wages of routine (higher income) versus manual (middle income) unskilled workers.In order to assess more accurately the relationship between computerization and relative wages and supply
of skilled versus unskilled workers, we proceed now to assess the empirical link observed in our data betweencomputer use and workers skill through the introduction of the task dimension.
5.3 Tasks Intensities and Computer Use
We begin by showing how computer use is characterized in our data, and whether our tasks dimensionsactually relate consistently with computer use at the industry level.
17Other applications of the tasks dimension can be found in Peri and Sparber (2008, 2009) who have shown that the smalle¤ect on wages of native Americans has been the result of a process of specialization of them in di¤erent tasks than those inwhich the immigrants specialize. Medina and Posso (2009) use the tasks South American Immigrants perform in the UnitedStates to determine their quality of jobs by country of origin, and related them to their individual skills.18See also Levy and Murnane (1996)19See more details about the occupations classi�cation in Appendix A.
11
Figures 17 and 18 show that the higher the average initial wage by occupation, the higher the share ofworkers using personal computers and internet respectively, in their occupations. Here by initial conditionswe mean their values in 1984-5. Actually, the share of workers in occupations in which wages are at or belowthe 40 average wage percentile is negligible. The �gure also shows that high frequencies of computer useis basically exclusive of occupations with a high share of skilled workers, or in general, for occupations ator above the 50 wage or skill percentiles. This empirical pattern seems consistent with only occupationsintensive in skilled labor, and the most intensive in the most skilled among the unskilled workers, havingaccess to personal computers at work.Now we proceed to implement a test used by ALM, that seeks to assess whether the reported declines in
the price of computer capital increased computers use relatively more in industries intensive in routine tasks,in order to substitute the more expensive routine labor input. Computer capital would have as well increasedin industries intensive in non-routine cognitive tasks, in which computers complement skills. Finally, inindustries not intensive in non-routine manual tasks, there should have been a much smaller increase incomputer use, since these tasks cannot be substituted by computer use. The test consists of estimating thefollowing model
�Ck;1984�2001 = �+ �Tk;1984 (6)
where �Ck;1984�2001 is the change between 1984 and 2001 in the share of workers in industry k using acomputer at work, and Tk;1984 is a measure of industry task intensity in 1984.20 As it is shown in �gure 15,by 1984 computer use in Colombian industries was basically nil, thus the share of workers using computersat work by industry in 2001, is actually its change.The results of estimating equation (6) are presented in Table 2: Our table has two panels: at the top we
present estimates using a measure of task intensity weighted by the number of employees in the occupation,while at the bottom we weight task intensities with total hours of all workers in the occupation. As it wasexpected, all coe¢ cients but one (routine manual) have the correct sign, and once we control for the shareof workers with college in the industry, three coe¢ cients have the correct signi�cant sign (despite the smallnumber of industries), the one of routine manual becomes statistically insigni�cant, and that of non-routinemanual has the correct nearly signi�cant sign. These results imply that our task classi�cation is, as a whole,consistent with the concepts they were meant to capture from ALM�s model.
5.4 Assessing TBTC in the Colombian Labor Market
As pointed at by Goos and Manning (2007), ALM, and AKK, the decreasing price of computer technologyreduces demand for routine labor on the one hand, and on the other hand, increases the demand for theother tasks which are complementary to the routine task, that is, for both cognitive non-routine tasks, andfor the non-routine manual tasks. Thus, provided that relative average wages of manual versus routine tasksincreases, and the relative wages of abstract versus routinary tasks increases as well, we should observe anincrease in the share of workers at the extremes of the wage distribution, and a reduction at the middle ofit. As noted by Acemoglu (2002) and Goos and Manning (2007), this implication is at odds with the SBTChypothesis, since according to that hypothesis, we should observe a monotonic positive relationship betweeninitial wages and increases in employment.To provide evidence of the relationship between changes in task demands and changes in skill demands,
we begin by using Figure 19, which illustrates how workers of di¤erent skills sort into the three broadtasks categories de�ned above: abstract, routine and manual tasks.21 In the �gure each dot representsa combination of the average skill of a speci�c occupation, measured as the average number of years ofeducation of its workers, and its task intensity, de�ned as the percentile of that occupation�s speci�c intensityin the 1984 distribution. As it is clear from the �gure, regardless of whether occupation are organized byaverage skill or wage, low skilled workers work on average in non-routine manual intensive occupations, middle
20We use the special 2001 formularie of the household survey that inquires about the use and posesion of technologies ofinformation and communications in people�s houses or at work.21The Abstract task is built from both non-routine cognite tasks, analytic and interactive, and the routine task from the
cognitive and manual routine tasks de�ned above.12
skilled workers in routine intensive occupations, and high skilled workers in abstract intensive occupations.The polarization hypothesis predicts that under decreasing costs of computer technology, routine activities aremore demanded basically by an important increase in computers demand, but simultaneously, it is implieda reduction in demand for routine labor. Thus, we should expect demand for workers in occupations ofintermediate levels of skills to fall.Figure 20 illustrates the change in occupation�s employment shares between 1984 and 1990, between 1990
and 2004, and between 1990 and 2008, using occupation wage and skill percentiles in 1984. The two graphsat the top of the �gure show the results for the sample of all workers while those at the bottom show them forthe sample of wage earners or skilled workers. Graphs on the left order occupations according to their wageswhile those on the right order them according to their skills. Figure 21 shows the same set of graphs, butnow each one assesses the whole periods between 1984 and 1990,1984 and 2004 and 1984 and 2008. Finally,Figures 22 and 23 show the same information as the previous two �gures, but now changes are estimated onthe number of total hours of work rather than on employment.Evidence represented in most of these �gures are at odds with the SBTC, since rather than presenting
a monotonic relationship between skills or wages, and changes in employment, they show a clear relativereduction of employment around the median of the respective distributions, at least for a subset of the wholeanalyzed period, precisely where we would expect to be most of the workers employed in routinary tasks. ForColombia, in both periods 1990-2004 and 1990-2008 we �nd a U-shaped curve, implying that jobs polarized atthe extremes of the wage distribution. Actually, the di¤erence in the relative changes of the shares betweenworkers in occupations at the lower end of the distribution, and those that show the largest drop in theanalyzed period, �uctuates around 10 percent, magnitudes similar to the ones represented in the �guresobtained by AKK, and by Autor, Katz and Kearney (2008) for the United States.Note that graphs that order occupations in their x axis according to their wages show a monotone increase
in the shares among the better paid occupations, while those that order occupations according to their skillsproduce an inverted U-shaped curve among the most skillful occupations. This relationship implies thatthe workers in occupations at the lower end of the distribution would have had a dynamic consistent withAKK polarization model previously outlined, but suggests that some occupations that, given their locationin the wage distribution, might be composed by both routinary and non-routinary cognitive tasks, wouldhave gained workers in the analyzed period well beyond what the most skillful occupations did.We can complement the empirical evidence provided in �gures 19 and 20, 21; 22 and 23; by estimating
Goos and Manning (2007) models of the form
�E = �0 + �1w0 + �2w20 + " (7)
where �E is the change in the participation of employment per occupation, and w0 is the median wage inthe occupation in 1984. The results of estimating equation (7) are presented in Table 3. The table containsfour panels, those at the top consider changes in employment and those at the bottom in hours of work.Panels at the left use occupation�s wages in the estimation and those at the right use occupation�s skills. Inorder to provide evidence not only that the pattern in the previous �gures is U-shaped, but also that suchU-shaped pattern became more pronounced in the period beginning in 1990 than it could have been in theperiod 1984-1990, we include in the estimation data for both the whole period 1984-2008, and for the period1984-1990 to estimate the following modi�ed regression
�E = �0 + �1w0 + �2w20 + �3
�t � w20
�+ " (8)
where t is a dummy variable equal to 1 if the data was of the period 1984-1990, and zero otherwise. Weexpect to have a positive coe¢ cient in the quadratic term, �2, and a negative coe¢ cient in the interactionbetween the quadratic wage or skill and the dummy variable that indicates the data was of the period1984-1990, �3, so that we can provide evidence that the U-shaped pattern became more pronounced aftercomputer technology began to become available in the Colombian economy. Notice that a key implicationof polarization is the U-shaped form of the relationship between wages and changes in employment, whichimplies that our estimates would support the polarization hypothesis.
13
As it can be seen in the table, in the estimation on wages all �2 coe¢ cients are positive and signi�cant,and all �3 coe¢ cients are negative and signi�cant, while estimates on skills have the same sign but notalways are statistically di¤erent from zero. That is, evidence for Colombia is consistent with a polarizationin employment in the period between 1984 and 2008, and with a deepening of that polarization in the periodbetween 1990 and 2008, since after 1990 was when computer technologies began to become popularly usedby workers.
5.5 On the Role of O¤shoring
As Goos, Manning and Salomons (2009a) argue, another channel that could lead to this sort of polarizationin the labor market is o¤shoring. If routine occupations are more o¤shorable, then the change in the shareof workers employed in the manual and abstract tasks relative to the share of those employed in the routinetask would be similar to the one predicted by the polarization model based on technical change. Theempirical assessment of this hypothesis requires determining how o¤shorable are the di¤erent occupations.As Blinder (2007a, b) and Goos, Manning and Salomons (2009a) found, routine occupations are actually moreo¤shorable than manual and abstract occupations in the United States and Europe respectively, althoughsome occupations among the abstract are also at risk of o¤shoring.We do not have data to directly assess how much of the measured e¤ect in our exercise is due to o¤shoring,
but previous work suggests it might have had a role. First, Núñez and Sánchez (1998) assessed the changesin relative demand of workers of di¤erent levels of education due to changes in net international trade, andfound that relative demand of workers with incomplete high school fell 4.7 percent between 1991 and 1995,while that of workers with lower education fell 1 percent, those with complete secondary fell 0.5 percent, andthat of workers with incomplete higher or more increased. This evidence is consistent with workers morelikely to perform routine occupations experiencing a reduction in their participation in the labor market.Secondly, Attanasio et al. (2003) found that in the 1990s wage premiums decreased more in sectors thatexperienced larger tari¤ cuts. Although that result is not directly linked to the average skills of the a¤ectedsectors nor to the type of their most intensive tasks, it would be consistent with the �nding provided byNúñez and Sánchez (1998) if sectors more o¤shorable were as well the most intensive in routine tasks.Despite the results provided by those articles, there are reasons to expect that the magnitude of o¤shoring
on the polarization in the labor market was much smaller than that of technical change in the case of Colombia.First, the magnitude of trade in the case of Colombia has historically been much smaller than that of theUnited States of the European countries. While Imports in Europe increased from 26 percent to 40 percentbetween 1993 (when the European Union was established) and 2008, in Colombia they increased from 15percent to 22 percent between 1990 and 2008, a much smaller level and increase.22 In addition, the magnitudeof the e¤ects of changes in international trade found by Núñez and Sánchez (1998) of less than 5 percentis small when compared to the relative decreases in the share or workers performing routine task found inthe previous section of around 10 percent. Also, the results obtained by Attanasio et al. (2003) led them toconclude that the overall e¤ect of trade reforms on wage distribution would have been small. Lastly, Bernaland Cárdenas (1999) provided evidence that the larger increases in the relative earnings of the more educatedworkers took place in the non-traded sectors, which is consistent with the results provided by both Núñezand Sánchez (1999) and Attanasio et al. (2003), but most importantly, it is consistent with technical change,beyond o¤shoring, playing a role in determining relative wages in the �rst half of the 1990s.23
5.6 On the Role of Labor Market Institutions
As stated by Goos, Manning and Salomons (2009a), the e¤ect of polarization in the labor market shouldbe augmented in the presence of higher wage rigidities, since in that case, technical change would be lesslikely to lead to lower wages and thus to a lower decrease in the demand of workers performing routine tasks,
22World Development Indicators, World Bank. In the case of Colombia, the average tari¤ was reduced from 44 percent at thebeginning of 1990 to 11.8 percent in March 1992 (See Ocampo et al. (1998)).23Ocampo et al. (1998) also attributes the increase in the premium of the most skilled in that period to the increase in
government consumption.
14

but rather, under a fall in the price of computer capital wage rigidities would imply larger changes in thedemand of routine labor. A similar rationale applies in the cases of the manual and abstract tasks. In thecase of workers at the lower end of the occupation distribution, consider the e¤ect of a binding minimumwage on labor demand. A binding minimum wage actually diminishes labor demand of the unskilled, butonce technical change leads to a labor demand increase, and the minimum wage is not binding anymore,demand for the unskilled can overshoot, and higher wage rigidity could lead to a higher increase in theirdemand compared to what could have happened had not there been a binding minimum wage. Figures 20to 23 suggest that institutions might be playing a role in our results. When we compare the results of thesample of all workers with those of the sample of wage earners or educated, it is clear that the later havea more pronounced reduction in the share of workers performing routine tasks, and their share of workersperforming manual tasks falls much less than it does for the sample of all workers. Since wage earners areexpected to have their wages more a¤ected by the minimum wage regulation, the comparison suggests thattechnical change, although having had an e¤ect in both cases, would have had a more pronounced e¤ect inthe formal sector due to labor market rigidities.
5.7 Assessing TBTC in the Brazilian and Mexican Labor Markets
Figures 24 and 25 present similar graphs for Brazil and Mexico to the ones presented above for Colombia.Although we do not have tasks intensities by occupation for these countries, provided that workers of di¤erentskills sorted across tasks according to the way Colombian workers do (that is, the low skilled mostly in manualintensive tasks, the middle skilled mostly in routine intensive tasks, and the highly skilled mostly in abstracttasks), which is shown in Figure 19, then, based on the pattern illustrated in those �gures, we could concludethat Mexico might have as well experienced a period of polarization in the 1990s, but could not conclude thesame for the case of Brazil.We now proceed to test our preliminary conclusion for Mexico by estimating equation (7). The equation
can only be estimated for the period 1990-2000, since for 1980 we only have available a few set of occupationcategories. Results of the estimation are presented in Table 4. Estimates in the table are consistent with thepattern shown in Figure 25: whenever we consider employment or hours of work the estimates support theU-shaped relationship between initial wages and changes in employment in Mexico.Previous evidence regarding the way technology complements skills in Brazil is mixed. Acemoglu (2003)
quotes the studies by Desjounqueres, Machin and Van Reenen (1999), who found that wage di¤erentialsbetween nonproduction and production workers increased in countries like Chile and Pakistan, but remainedstable in Brazil, while the demand for skills in several countries including Brazil, increased; and quotesalso Duryea and Szekely (2000), Behrman, Birdsall and Szekely (2001), and Davis (1992), who reported anincrease in wage inequality in Brazil during the 1980s and mid 1990s. Nonetheless, Sanchez-Paramo andSchady (2003) �nd that while relative wages of the skilled increased in Argentina, Chile, Colombia, andMexico, as relative supply increased as well, they did not increase in Brazil, and claim that out of those �vecountries, Brazil would be the only one where the evolution of relative wages would not have been determinedby relative demand, but by relative supply of skills. Also Fajnzylber and Fernandes (2004) �nd evidence forBrazil of a negative e¤ect of exports on skilled labor demand in plants that export most of their output, anda positive e¤ect on skilled labor demand for the remaining exporting plants. In short, the evidence suggeststhat Brazil has responded somewhat di¤erently to the way other countries of the region have responded toSBTC, and likewise, to the mechanics behind the polarization model. A possibility to assess in future workis whether the much larger size of its unskilled labor force in relation to that of the other countries in theregion, has played a role in the type of technologies (skill-replacing vs. unskilled replacing) that have beenadopted in the country.Although we followed in the cases of Brazil and Mexico the same steps we followed for the Colombian case,
we consider our results for these countries as preliminary since we did not analyze as deeply the empiricalregularities in those countries, neither we had available the necessary data to test whether our assigned taskintensities by occupation matched the use of computer technologies in their data.
15
5.8 Discussion
Despite the power of ALM polarization model to describe some key empirical regularities of the US labormarket, there are still some stylized facts that cannot be accounted for by that model at least for theColombian case. First, consider the importance of skilled labor in the US. Since one of the goals of thepolarization model is, by linking tasks to skills, to explain the dynamics of relative wages and supply ofskills, limiting the model to have an exogenous group of high skilled workers does not allow the model toactually relate highly skilled workers to tasks other than the abstract ones, even though empirical evidenceprovided by ALM, AKK, and others, clearly suggests that the occupations with some degree of intensity ofroutine tasks cover a very wide spectrum of the skill distribution. In other words, since empirical evidencesuggest that a subset of the highly skilled workers must be working in routine tasks, the polarization modelfails to account for the e¤ects that decreasing the cost of computer capital would have on the wages of thoseskilled workers in routine task, in which case a �rst question to answer would be to de�ne whether skilledlabor and computer capital enter in routine tasks as substitutes, as it is the case with unskilled labor, oras complements. Depending on the way unskilled capital enters in the routine tasks production function,aggregate wages of skilled workers would increase more or less than in the baseline polarization model ofALM, or actually, wages might decrease.Take as an example the analysis of the dynamics of workers across occupations in Colombia. According
to the bottom right graph in Figure 20, between 1990 and 2004, and between 1990 and 2008, there was anincrease in the supply of workers around the 80 percentile of the wage distribution, even larger than the oneexperienced at the very top of it. In addition, as we saw in Figure 8, many skilled workers experienced a dropin their earnings in the analyzed period, as it becomes also clear from the premium of skilled workers withincomplete higher education shown in Figure 11. A model that would allow skilled workers to perform inboth abstract and routine tasks, could allow either some skilled workers to cluster around the 80 percentile, orexperience a drop in their earnings, while the baseline polarization model, which assumes skilled labor beingsupplied perfectly inelastically, would require the unskilled labor to explain such increase in labor supply inoccupations at that level of the skilled, an unlikely scenario for unskilled workers.In order to account for the interaction between �uctuations in the cost of computer capital, and the
endogenous choices of skilled workers, in the next section we introduce the participation of the skilled workersin routine tasks, so that they can now supply labor to both routine and abstract tasks.
6 Model
In this section we present a model that allows skilled workers to participate in both routine and abstracttasks, in order to account for the interactions that changes in the price of capital and choices of unskilledlabor, have on the decisions of the skilled workers, and vice-versa. We keep assuming substitutability betweencomputer capital and unskilled labor, but now we allow for the possibility that some skilled workers performin the routinary tasks, entering as a complement of computer capital an as substitute of unskilled labor.
6.1 The Firm
The production function maintains the same form it had in the baseline model expressed in (2), but now weintroduce the new production function of the routine task as
R = LR + �X�H1��
R (9)
which maintains the substitutability between LR and X, but now introduces the possibility that some ofthe skilled labor, HR, performs in the routine tasks, but complementing rather substituting X.24
24Note the similarities between this model and the one of organizational models by Kremer and Maskin (1999), and Acemoglu(1999a), presented and reviewed by Acemoglu (2003), in which output is equal to Bp [(AlL)
� + (AhhO)�]1=�+BsA
�h (H � hO),
where skilled workers can perform in the old or new organizational sectors. Although the concepts behind the models aredi¤erent, their formulations would be even much closer if in the organizational model we would allow L to perform in bothsectors.
16
6.2 The Consumer
There are N worker in the economy, a share � of them are Low Skilled workers, L, and the remaining 1��are High Skilled, H.
N : Number of workers
H = (1��)N
L = �N
H workers are endowed with no Manual tasks, one e¢ ciency unit of Routine tasks and h units of Abstracttasks, where
Ln(h) � N��h; �
2h
�L workers are endowed with no Abstract tasks, one e¢ ciency unit of Manual tasks and l units of Routine
tasks, where
Ln(l) � N��l; �
2l
�Workers self-select into speci�c tasks according to
h =
(hA if WAhA > W
HR hr �! hA >
WHR
WAhr =
WHR
WA= ��h
hR if WAhA < WHR hr �! hA <
WHR
WAhr =
WHR
WA= ��h
l =
(lr if WL
R lr > WM lM �! lr >WM
WLR
lM = WM
WLR
= ��llm if WL
R lr < WM lM �! lr <WM
WLR
lM = WM
WLR
= ��l
The labor supply functions of L workers can be written as
LsR (��l ) = �N � P (lr > ��l ) � E [lrjlr > ��l ] = �N
�1� �
���l j�; �2
�� 1Z��l
l � d��lj�; �2
�[1� � (��l j�; �2)]
(10)
where ��xj�; �2
�=
xZ0
e� 12 [
Ln(z)��� ]
2
p2��z
dz, that is, it is the lognormal distribution. Now let y =Ln(l)�(�+�2)
� ;
then �l � dy = dl, and25
LsR (��l ) = �N
�1� �
�Ln (��l )� �l
�l
�� 1ZLn(��l )�(�l+�2l )
�l
e�l+�2l =2 � � (y) dy�
1� ��Ln(��l )��l
�l
��
= �N � E (l) �(1� �
"Ln (��l )�
��l + �
2l
��l
#)(11)
where � (x) =
xZ�1
e�z2
2 dzp2�
, that is, it is the normal distribution and � (z) is the standard normal density
function. Similarly for LsM (��l ) we �nd that
25Note that from (10) we have ze� 12
hLn(z)��
�
i2= e�+�
2=2e� 12
"Ln(z)�(�+�2)
�
#217

LsM (��l ) = �N � [1� P (lr > ��l )] � E [lmjlr < ��l ] = �N � �
�Ln (��l )� �l
�l
�(12)
where the second equality follows from the fact that E [lmjlr < ��l ] = E (lm) = 1:Labor supply of Hworkers is
HsA (�
�h) = (1��)N � P (A) � E [hAjhA > ��h] = (1��)N � E (h)
(1� �
"Ln (��h)�
��h + �
2h
��h
#)(13)
and
HsR (�
�h) = (1��)N � [1� P (A)] � E [hRjhA < ��h] = (1��)N � �
�Ln (��h)� �h
�h
�(14)
where the second equality follows from the fact that E [hRjhA < ��h] = E (hR) = 1:
6.3 Equilibrium
This economy gets to an equilibrium when �rms maximize pro�ts, workers maximize their utility functions,and labor markets clear.Given these condition we now present some key results of the model.
Claim 1 The following results are observed in the equilibrium of this economy:
(i)@��h@P
< 0 (15)
and(ii)
@��l@P
< 0 (16)
Thus
@��h@P
< 0)# P �!" ��h =WHR
WA�!
�# HA" HR
(17)
@��l@P
< 0)# P �!" ��l =WM
WLR
�!�" LM# LR
(18)
See the details of this result in Appendix B. These results allow the possibility to have as the cause of areduction in the cost of computer capital, a decrease in the wage of the unskilled working in routine task,followed by an increase in the supply of unskilled workers to the non-routine manual tasks as the AKK modeldoes. Simultaneously, it would allow skilled workers performing abstract tasks to move to routine tasks, sincethe lower price of computer capital would rise the demand of skilled labor in routine tasks. If that was thecase, a pattern of changes in employment similar to the one depicted in the bottom left graph of �gure 20could be reasonable explained by this model, since those skilled workers moving from abstract to routine taskmight cluster around the 80 percentile of the distribution as it is the case in the �gure.A caveat of this scenario is that this result would require the relative wage of skilled workers performing
routine tasks, WHR , to increase in relation to the one earned by skilled workers performing abstract tasks,
WHA . leading to a reduction in earnings inequality among the skilled workers, which goes against the evidence
provided by Figures 7 and 9, which as we had already noted, show an increase in earnings inequality amongthe skilled workers.
18
Such increase in earnings inequality among the skilled workers could be captured by a model that wouldreplace (9) by
R = L�RH1��R + �X (19)
Under (19), and after some straightforward calculations following those made in the previous case, now we
would get that @��h
@P > 0, thus @��h
@P > 0)# P �!# ��h =WH
R
WA�!
�" HA# HR
, leading to the desired result that
would allow us to explain the drop in the premium of the skilled workers with incomplete higher education,as well as the increase in earnings inequality among skilled workers. The actual model that could explain theregularities of the Colombian labor market might be something with a R function that captured features ofthe two proposed functions.
7 Conclusions
In this paper, we show that the traditional Skill Biased Technological Change, SBTC, model that includestwo skill groups performing two distinct and imperfectly substitutable occupations, is unable to explain somefeatures of the dynamics of the Colombian labor market. Speci�cally, two factors models like that by Katzand Murphy (1992), are unable to capture U-shaped dynamics in the distribution of labor across occupationsin the Colombian labor market, previously found for the American and some European economies, as TaskBiased Technical Change, TBTC (polarization) models, do.Even though the traditional SBTC model has been widely used to explain the main facts of the earnings
inequality dynamics in Colombian, we argue that various empirical regularities observed over the longerperiod of time, that includes most of the 2000s, reveals several characteristics that are hard to be predictedby the standard model, and that might be better explained by that introducing the task dimension intothe production function, like the TBTC models developed by Autor, Katz and Kearney (2006), Goos andManning (2007), and others.We use household survey data of Colombia to assess whether the polarization model could contribute to
explain key stylized facts of its labor market. We present evidence of aggressive implementation of computertechnology in Latin American countries, and of important reductions in the cost of computer capital inColombia during the last decade, and link its rate of adoption to speci�c tasks and occupations, as previousliterature do.The evidence found is consistent with TBTC having taken place in Colombia. TBTC would have led
to an increase in the supply of both unskilled labor performing manual tasks, at the bottom of the wageor skills occupation distribution, and skilled labor performing abstract tasks, at the top of the occupationdistribution, relative to workers performing routine tasks. Reductions in the cost of computer capital wouldhave led to an increase in the wages of unskilled workers in manual tasks relative to those in routine tasks,and similarly, to an increase in the relative wages of the skilled workers performing abstract tasks relativeto those performing routine tasks. Altogether, the evidence implies a positive covariance between changes inwages and employment at the extremes of the wages or skills occupation distribution.The mentioned e¤ects of the more aggressive adoption of computer technology in Colombia would also
help to explain both the observed increase in earnings inequality among skilled workers, and the decrease,or at the best stability, in earnings inequality among unskilled workers. Finally, we replicate Colombia�sempirical work to the cases of Mexico and Brazil, and found evidence consistent with polarization havingtaken place in Mexico, but not in Brazil.The evidence provided calls for caution at the moment of implementing policies in Colombia or Mexico,
and potentially, in other countries of the region, seeking to raise public funds, promote private investment,etc., by distorting the relative price between capital and labor, and in particular, the relative price of computercapital, given its potential implications on the assignment of labor in the economy, and on earnings inequality.It also calls into question the institutional policies seeking to guarantee minimum levels of earnings to workers,
19

or to impose restrictions to labor turnover, rather than promoting the provision of the necessary quali�cationsto workers for them to adapt to the technical changes experienced by the economy.
20
8 Appendix A: Data on Occupations and Tasks De�nitions
8.1 Colombia
In the case of Colombia, we use 77 occupations and all of them are comparable for the period 1984-2006 (seetable 5). We exclude individuals who are engaged in tasks such as (i) priests, missionaries, or (ii) athletes,sportsmen and related workers.The de�nitions of the di¤erent tasks are available in the National Classi�cation of Occupations of the
Department of National Statistics of Colombia, DANE, which adopted the CNO70 which is based in The In-ternational Standard Classi�cation of Occupations (ISCO). The manual of CNO70 has a name and de�nitionthat describes the main task, obligations and functions for every occupation.According to CNO70, what is relevant for classifying an individual in a special occupation is the nature
of the functions or task that he performs, rather than the academic achievements, like degrees or academiccerti�cates he had earned. Thus, an economist who works as a taxi driver will not be classi�ed in theoccupation �Economists�, but in �drivers of vehicles other than dump trucks�.For each occupation we calculate the median income and the average education in the initial period, in
this case, 1984, Using this information, we build the test and �gures of polarization in the labor market.The occupations were classi�ed into �ve groups according to whether their main task was abstract, routine
or manual. The �ve groups are the same as de�ned by ALM: (i) non-routine cognitive/interactive (DCP);(ii) non-routine cognitive/analytical (MATH); (iii) routine cognitive (STS); (iv) routine manual (FINGER),and (v) non-routine manual (EHF). To develop the classi�cation we used the manual of the CNO70 and thede�nitions developed by ALM .In the �rst group - DCP �were classi�ed occupations that perform task with high managerial analytical
component as those occupations which are responsible for the direction of enterprises or institutions. Inthe second group - MATH �were classi�ed those task with high requirements of quantitative reasoning,for example, the occupations associates with engineering, medicine or economics. The third group - STS- comprises task with high component where the main requirement is the ability to adapt to jobs thatrequire set limits, tolerances or standards. The fourth group - Finger �includes those tasks with high routinecomponent and manual skill requirement. The last group - EHF �contains those tasks with a high componenton non-routine manual skills, playing an important role the eye-hand-foot coordination. Some examples aredomestic workers and drivers.
8.2 Brazil
In the case of Brazil, we have information from household surveys for the period 1981-2005. The occupationvariable changed its de�nition in 2002, and it is not possible to compare both versions. The new de�nitionis based on CBO-household, which in turn is based on ISCO-88. We only used the information for theperiod 1981-2001 given the no-comparability between surveys. Finally, we have 199 kinds of occupations. Asin Colombia, for each occupation we calculate the median income and the average education in the initialperiod, in this case, 1981. The available occupation can be consulted in Instituto Brasileiro de Geogra�a eEstatística (IBGE, http://www.ibge.gov.br/concla/cl_corresp.php?sl=3).
8.3 Mexico
For Mexico we have information from census data of 1990 and 2000, available from IPUMS international(https://international.ipums.org/international). For our exercise we used 280 occupations. As in Colombiaand Brazil, for each occupation we calculate the median income and the average education in the initialperiod, in this case, 1990.
9 Appendix B
The claim follows from some straightforward calculations. The pro�ts of the �rm are21
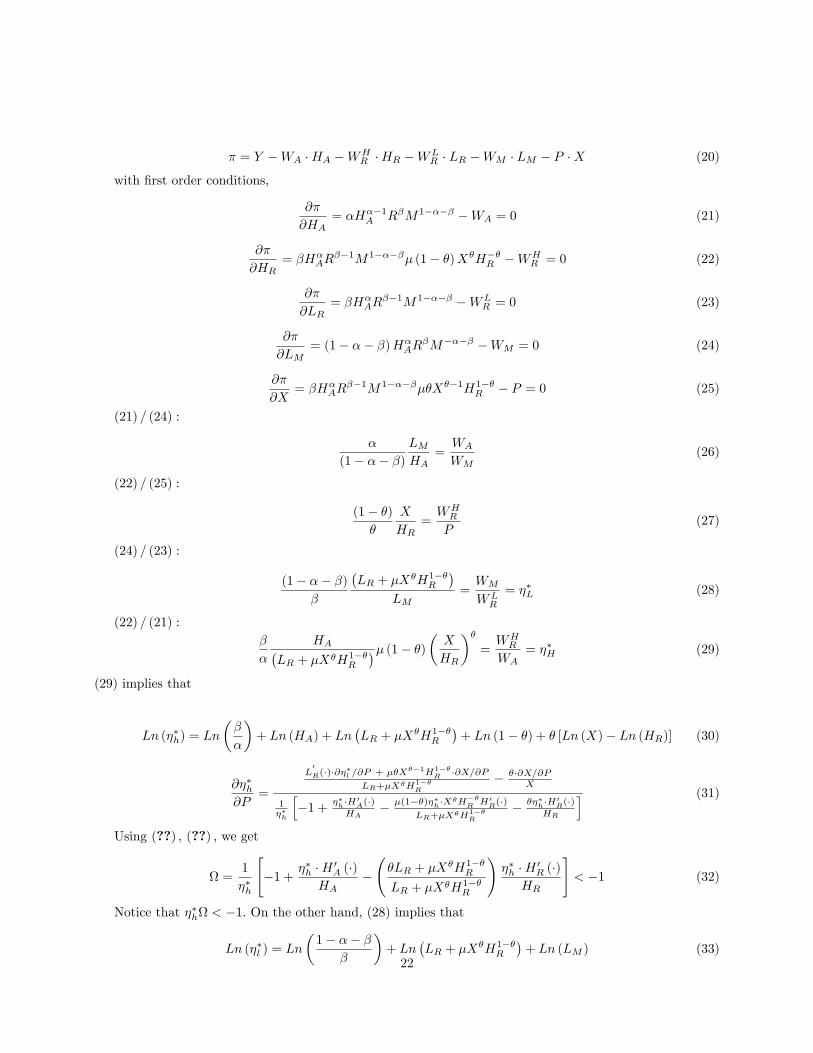
� = Y �WA �HA �WHR �HR �WL
R � LR �WM � LM � P �X (20)
with �rst order conditions,
@�
@HA= �H��1
A R�M1���� �WA = 0 (21)
@�
@HR= �H�
AR��1M1����� (1� �)X�H��
R �WHR = 0 (22)
@�
@LR= �H�
AR��1M1���� �WL
R = 0 (23)
@�
@LM= (1� �� �)H�
AR�M���� �WM = 0 (24)
@�
@X= �H�
AR��1M1������X��1H1��
R � P = 0 (25)
(21) = (24) :
�
(1� �� �)LMHA
=WA
WM(26)
(22) = (25) :
(1� �)�
X
HR=WHR
P(27)
(24) = (23) :
(1� �� �)�
�LR + �X
�H1��R
�LM
=WM
WLR
= ��L (28)
(22) = (21) :
�
�
HA�LR + �X�H1��
R
�� (1� �)� X
HR
��=WHR
WA= ��H (29)
(29) implies that
Ln (��h) = Ln
��
�
�+ Ln (HA) + Ln
�LR + �X
�H1��R
�+ Ln (1� �) + � [Ln (X)� Ln (HR)] (30)
@��h@P
=
L0R(�)�@�
�l =@P + ��X��1H1��
R �@X=@PLR+�X�H1��
R
� ��@X=@PX
1��h
h�1 + ��h�H0
A(�)HA
� �(1��)��h�X�H��R H0
R(�)LR+�X�H1��
R
� ���h�H0R(�)
HR
i (31)
Using (??) ; (??) ; we get
=1
��h
"�1 + �
�h �H 0
A (�)HA
� �LR + �X
�H1��R
LR + �X�H1��R
!��h �H 0
R (�)HR
#< �1 (32)
Notice that ��h < �1: On the other hand, (28) implies that
Ln (��l ) = Ln
�1� �� �
�
�+ Ln
�LR + �X
�H1��R
�+ Ln (LM ) (33)
22
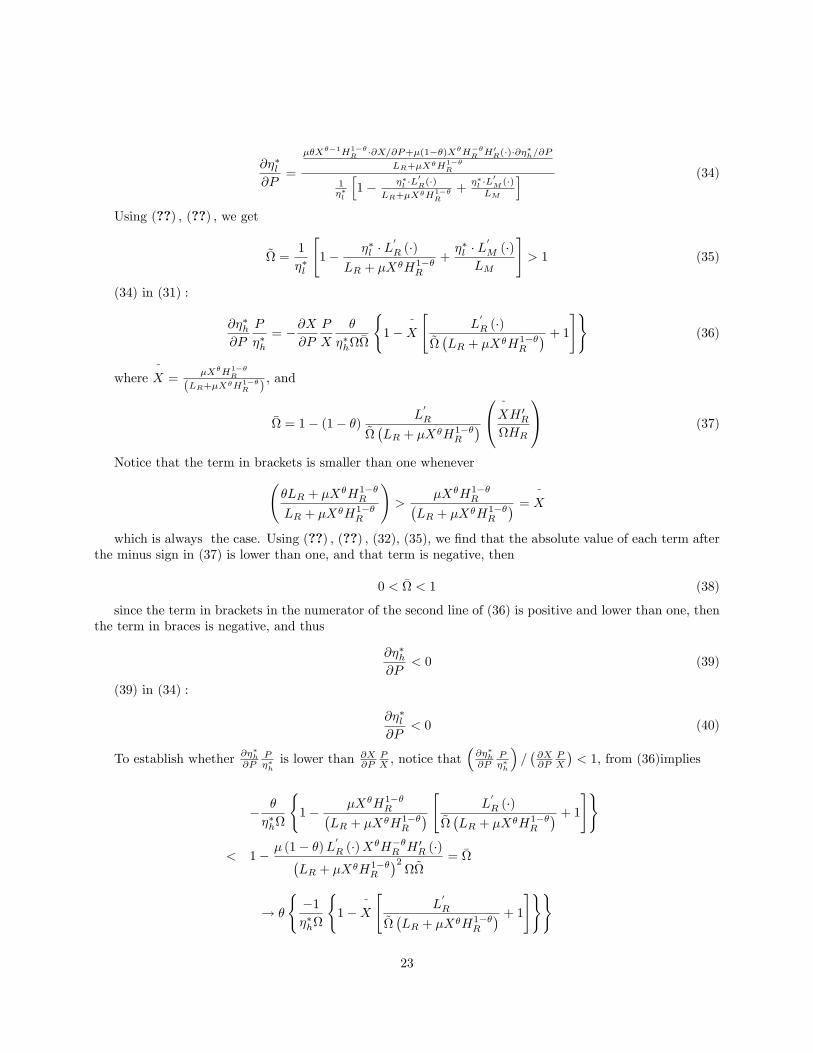
@��l@P
=
��X��1H1��R �@X=@P+�(1��)X�H��
R H0R(�)�@�
�h=@P
LR+�X�H1��R
1��l
h1� ��l �L
0R(�)
LR+�X�H1��R
+��l �L
0M (�)
LM
i (34)
Using (??) ; (??) ; we get
~ =1
��l
"1� ��l � L
0
R (�)LR + �X�H1��
R
+��l � L
0
M (�)LM
#> 1 (35)
(34) in (31) :
@��h@P
P
��h= �@X
@P
P
X
�
��h�
(1�
~
X
"L0
R (�)~�LR + �X�H1��
R
� + 1#) (36)
where~
X =�X�H1��
R
(LR+�X�H1��R )
, and
� = 1� (1� �) L0
R
~�LR + �X�H1��
R
�0@ ~
XH 0R
HR
1A (37)
Notice that the term in brackets is smaller than one whenever �LR + �X
�H1��R
LR + �X�H1��R
!>
�X�H1��R�
LR + �X�H1��R
� = ~
X
which is always the case. Using (??) ; (??) ; (32), (35), we �nd that the absolute value of each term afterthe minus sign in (37) is lower than one, and that term is negative, then
0 < � < 1 (38)
since the term in brackets in the numerator of the second line of (36) is positive and lower than one, thenthe term in braces is negative, and thus
@��h@P
< 0 (39)
(39) in (34) :
@��l@P
< 0 (40)
To establish whether @��h@P
P��his lower than @X
@PPX , notice that
�@��h@P
P��h
�=�@X@P
PX
�< 1; from (36)implies
� �
��h
(1� �X�H1��
R�LR + �X�H1��
R
� " L0
R (�)~�LR + �X�H1��
R
� + 1#)
< 1� � (1� �)L0
R (�)X�H��R H 0
R (�)�LR + �X�H1��
R
�2~
= �
! �
(�1��h
(1�
~
X
"L0
R
~�LR + �X�H1��
R
� + 1#))
23
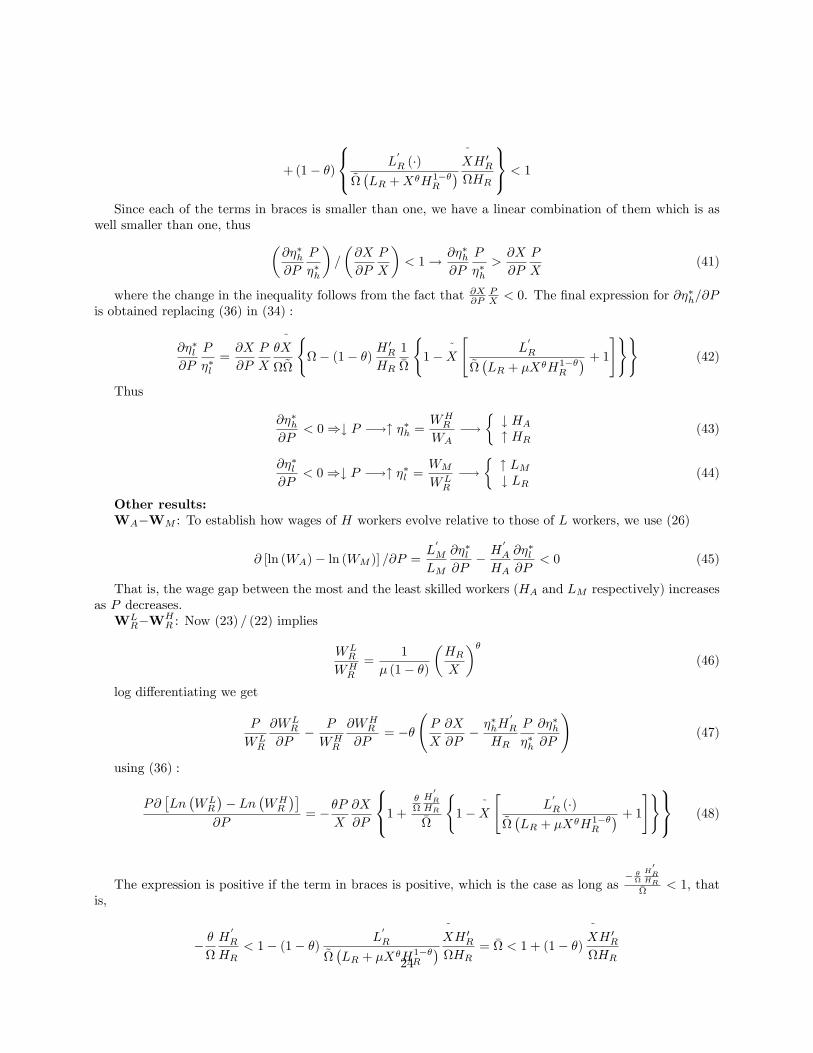
+(1� �)
8<: L0
R (�)~�LR +X�H1��
R
� ~
XH 0R
HR
9=; < 1
Since each of the terms in braces is smaller than one, we have a linear combination of them which is aswell smaller than one, thus �
@��h@P
P
��h
�=
�@X
@P
P
X
�< 1! @��h
@P
P
��h>@X
@P
P
X(41)
where the change in the inequality follows from the fact that @X@PPX < 0. The �nal expression for @��h=@P
is obtained replacing (36) in (34) :
@��l@P
P
��l=@X
@P
P
X
�~
X
~
(� (1� �) H
0R
HR
1�
(1�
~
X
"L0
R
~�LR + �X�H1��
R
� + 1#)) (42)
Thus
@��h@P
< 0)# P �!" ��h =WHR
WA�!
�# HA" HR
(43)
@��l@P
< 0)# P �!" ��l =WM
WLR
�!�" LM# LR
(44)
Other results:WA�WM : To establish how wages of H workers evolve relative to those of L workers, we use (26)
@ [ln (WA)� ln (WM )] =@P =L0
M
LM
@��l@P
� H0
A
HA
@��l@P
< 0 (45)
That is, the wage gap between the most and the least skilled workers (HA and LM respectively) increasesas P decreases.WL
R�WHR : Now (23) = (22) implies
WLR
WHR
=1
� (1� �)
�HRX
��(46)
log di¤erentiating we get
P
WLR
@WLR
@P� P
WHR
@WHR
@P= ��
P
X
@X
@P� �
�hH
0
R
HR
P
��h
@��h@P
!(47)
using (36) :
P@�Ln�WLR
�� Ln
�WHR
��@P
= ��PX
@X
@P
8<:1 +�H0R
HR
�
(1�
~
X
"L0
R (�)~�LR + �X�H1��
R
� + 1#)9=; (48)
The expression is positive if the term in braces is positive, which is the case as long as� �
H0R
HR�
< 1; thatis,
� �
H0
R
HR< 1� (1� �) L
0
R
~�LR + �X�H1��
R
� ~
XH 0R
HR= � < 1 + (1� �)
~
XH 0R
HR24
! 0 < 1 +
�(1� �)
~
X + �
�H 0R
HR= 1 +
"�LR + �X
�H1��R
LR + �X�H1��R
#H 0R
HR
which always holds because the second term is smaller than one in absolute value by the de�nition of .
It follows thatP@[Ln(WL
R )�Ln(WHR )]
@P > 0; that is, when P falls the wage gap between HR and LR workersincreases.Prices: Now let us establish the implications of changes in P on wages.WH
R =P: From (27) :
P�WHR =P
� @ �WHR =P
�@P
=P
X
@X
@P� ��hHR
@HR@��h
P
��h
@��h@P
(49)
using (36) :
P�WHR =P
� @ �WHR =P
�@P
=P
X
@X
@P
8<:1 +���hHR
@HR
@��h���h
(1�
~
X
"L0
R (�)~�LR + �X�H1��
R
� + 1#)9=; (50)
where~
X =�X�H1��
R
(LR+�X�H1��R )
. Since all components of the second term in braces are smaller than one and
that term is negative, we �nd that
P�WHR =P
� @ �WHR =P
�@P
< 0 (51)
That is, WHR increases relative to P as P decreases.
25
References
Acemoglu, Daron (1998) "Why Do New Technologies Complement Skills? Directed Technical Change andWage Inequality" Quarterly Journal of Economics, 113, pp. 1055-1090.
Acemoglu, Daron (1999) "Changes in Unemployment and Wage Inequality: An Alternative Theory and SomeEvidence" American Economic Review, 89, pp. 1259-1278.
Acemoglu, Daron (2002) "Technical Change, Inequality and the Labor Market" Journal of Economic Liter-ature, Vol. 40, No. 1 (Mar.), pp. 7-72.
Daron Acemoglu (2003) "Patterns of Skill Premia" Review of Economic Studies, Blackwell Publishing, vol.70(2), pages 199-230, 04.
Acemoglu, Daron (2007) "Equilibrium Bias of Technology" Econometrica, Vol. 75, Issue 5, pp. 1371-1409.
Arango, Luis E., Posada, Carlos E., and Uribe, José Darío (2004) "Cambios en la Estructura de los SalariosUrbanos en Colombia (1984 �2000)" Borradores de Economía,No. 247, julio.
Attanasio, Orazio, Goldberg, Pinelopi K., and Pavcnik, Nina (2003) "Trade Reforms and Wage Inequalityin Colombia" NBER WP 9830, July.
Autor, David H., Katz, Lawrence F., and Kearney, Melissa S. (2006) "The Polarization of the U.S. LaborMarket" The American Economic Review, Vol. 96, May, 189-194.
Autor, David H., Katz, Lawrence F., and Kearney, Melissa S. (2008) "Trends in U.S. Wage Inequality:Revising the Revisionists" The Review of Economics and Statistics, Vol. 90, Issue 2, 300-323.
Autor, David; Katz, Lawrence and Krueger, Alan (1998) "Computing Inequality: Have Computers Changedthe Labor Market?" Quarterly Journal of Economics, 113, pp. 1169-1214.
David H. Autor; Levy, Frank and Murnane, Richard (2000) "Upstairs, Downstairs: Computer-Skill Comple-mentarity and Computer-Labor Substitution on Two Floors of a Large Bank" NBER Working Paper No.7890.
Autor, David H., Levy, Frank, and Murnane, Richard J. (2003) "The Skill Content of Recent TechnologicalChange: An Empirical Exploration" The Quarterly Journal of Economics, Vol. 118, Issue 4, 1279-1333.
Behrman, Jere; Birdsall, Nancy and Szekely, Miguel (2001) "Economic Reform and Wage Di¤erentials inLatin America" RES Working Paper No. 4235, October.
Blinder, Alan (2007a) "O¤shoring: Big Deal, or Business as Usual?" CEPS Working Paper No. 149, June.
Blinder, Alan (2007b) "How Many US Jobs Might Be O¤shorable?" CEPS Working Paper No. 147, June.
Borghans, Lex and ter Weel, Bas (2007) "The Di¤usion of Computers and the Distribution of Wages"European Economic Review, Elsevier, vol. 51(3), pages 715-748, April.
Bresnahan, Timothy F.; Brynjolfsson, Erik and Hitt, Lorin M. (2002) "Information Technology, WorkplaceOrganization, And The Demand For Skilled Labor: Firm-Level Evidence" The Quarterly Journal of Eco-nomics, MIT Press, vol. 117(1), pages 339-376, February.
Card, David and Thomas Lemieux (2001) "Can Falling Supply Explain the Rising Return to College forYounger Men?" Quarterly Journal of Economics, 116:2, pp. 705-746.
Cárdenas, Mauricio, and Bernal, Raquel (1999) "Changes in the Distribution of Income and the New Eco-nomic Model in Colombia" Serie Reformas Económicas, No. 36, November.
26
Cárdenas, Mauricio, and Bernal, Raquel (2003) "Determinants of Labor Demand in Colombia: 1976-1996"NBER WP 10077, November.
Caselli, Francesco (1999) "Technological Revolutions" American Economic Review, 87, pp. 78-102.
Davis, Steve (1992) "Cross-Country Patterns of Changes in Relative Wages" NBER Macroeconomic Annual,MIT Press, Cambridge, pp. 239-292.
Desjounqueres, Thibaut; Machin, Steve and Van Reenen, John (1999) "Another Nail in the Co¢ n? OrCan the Trade Based Explanation of Changing Skill Structures Be Resurrected" Scandinavian Journal ofEconomics, Vol. 101, No. 4, pp. 533-54.
DiNardo, John E. and Pischke, Jorn-Ste¤en (1997) "The Returns to Computer Use Revisited: Have PencilsChanged the Wage Structure Too?" The Quarterly Journal of Economics, MIT Press, vol. 112(1), pages291-303, February.
Duryea, Suzanne and Miguel Szekely (2000) "Labor Markets in Latin America: A Look at the Supply-Side"Emerging Markets Review, Vol 1, No. 3, pp. 199-228.
Dustmann, Christian; Ludsteck, Johannes, and Schönberg, Uta (2007) �Revisiting the German Wage Struc-ture�Mimeograph, University of Rochester, February.
Fajnzylber, Pablo and Fernandes, Ana M. (2004) "International Economic Activities and the Demand forSkilled Labor: Evidence from Brazil and China" Policy Research Working Paper Series No. 3426, The WorldBank, October.
Freeman, Richard (1976) "The Overeducated American" NY: Academic Press.
Gallego, Francisco (2006) �Skill Premium in Chile: Studying the Skill Bias Technical Change Hypothesis inthe South�Banco Central de Chile, Documento de Trabajo No. 363 (Mayo).
Galor, Oded and Moav, Omer (2000) "Ability Biased Technological Transition, Wage Inequality and Eco-nomic Growth" Quarterly Journal of Economics, 115, pp. 469-498.
Goos, Maarten, and Manning, Alan (2007) �Lousy and Lovely Jobs: The Rising Polarization of Work inBritain�Review of Economics and Statistics 89 (February), 118-33.
Goos, Maarten; Manning, Alan and Salomons, Anna (2009) "Recent Changes in the European EmploymentStructure: the Roles of Technology and Globalization" Open Access publications from Katholieke UniversiteitLeuven, Katholieke Universiteit Leuven.
Goos, Maarten; Manning, Alan and Salomons, Anna (2009) "Job Polarization in Europe" American EconomicReview, Vol. 99, No. 2, pp. 58-63.
Gordon, Robert J. and Dew-Becker, Ian (2008) "Controversies About the Rise of American Inequality: ASurvey" NBER WP No. 13982, April.
Hilton, Margaret (2008) "Research on Future Skill Demands: A Workshop Summary " Center for Education,Division of Behavioral and Social Sciences and Education, National Research Council. Washington, DC: TheNational Academies Press.
Johnson, George and Sta¤ord, Frank (1998) "Technology Regimes and the Distribution of Real Wages�in Microfoundations of Economc Growth: A Schumpeterian Perspective (Christopher Greene and GunnarEliasson, eds.) University of Michigan Press.
Katz, Lawrence and Murphy, Kevin (1992) "Changes in Relative Wages: Supply and Demand Factors" TheQuarterly Journal of Economics, 107, pp. 35-78.
27
Kiley, Michael (1999) "The Supply of Skilled Labor and Skill-Biased Technological Progress" Economc Jour-nal, 109, pp. 708-724.
Krueger, Alan B. (1993) "How Computers Have Changed the Wage Structure: Evidence from Microdata,1984-1989" The Quarterly Journal of Economics, MIT Press, vol. 108(1), pages 33-60, February.
Krusell, Per; Ohanian, Lee E.; Ríos-Rull, José-Víctor and Violante, Giovanni L. (2000) "Capital-Skill Com-plementarity and Inequality: A Macroeconomic Analysis" Econometrica, Vol. 68, No. 5. (Sep.), pp. 1029-1053.
Levy, Frank and Murnane, Richard J. (1996) "With What Skills are Computers a Complement?�AmericanEconomic Review, 86 (2) May, 258 �262.
Londoño, Juan Luis (1990) "Income Distribution During the Structural Transformation: Colombia 1938-1988" Tesis Ph.D., Cambridge, Harvard University.
López, Hugo (2010) "El Mercado Laboral Colombiano: Tendencias de Largo Plazo y Sugerencias de Política"Borradores de Economía No. 606, June.
Medina, Carlos and Posso, Christian Manuel (2009) "Colombian and South American Immigrants in theUnited States of America: Education Levels, Job Quali�cations and the Decision to Go Back Home" Bor-radores de Economía No. 572, Banco de la República.
Murphy, Kevin; Riddell, W. Craig and Romer, Paul M. (1998) "Wages, Skills and Technology in the UnitedStates and Canada" NBER WP No. 6638, July.
Nuñez, Jairo, and Jiménez, Jaime (1997) "Corrección de los Ingresos de las Encuestas de Hogares y Dis-tribución del Ingreso Urbano de Colombia" Archivos de Economia, DDE-DNP, Bogotá, Septiembre.
Núñez, Jairo, and Sánchez, Fabio (1998a) "Educación y Salarios Relativos en Colombia: 1976-1995. De-terminantes, Evolución e Implicaciones para la Distribución del Ingreso" Archivos de Economía, No. 074,DDE-DNP, Bogotá, Enero.
Núñez, Jairo, and Sánchez, Fabio (1998b) "Descomposición de la Desigualdad del Ingreso Laboral Urbanoen Colombia: 1976-1997 " Archivos de Economía, No. 86, DDE-DNP, Bogotá, Junio.
Ocampo, José Antonio; Pérez, María José; Tovar, Camilo Ernesto, and Lasso, Francisco Javier (1998) "Macro-economía, Ajuste Estructural y Equidad en Colombia: 1978-1996" Archivos de Macroeconomía No. 79, March.
Peri, Giovanni and Sparber, Chad (2008) "Highly-Educated Immigrants and Native Occupational Choice"Discussion Paper Series, CDP No 13/08, Centre for Research and Analysis of Migration.
Peri, Giovanni and Sparber, Chad (2009) "Task Specialization, Immigration, and Wages" American EconomicJournal: Applied Economics, 1(3): 135�69.
Posso, Christian Manuel (2008) "Desigualdad Salarial en Colombia 1984-2005: Cambios en la Composicióndel Mercado Laboral y Retornos a la Educación Post-Secundaria" Borradores de Economía No. 529, Bancode la República, September.
Robbins, Donald (2001) "Trade Oppening and Distribution in Colombia -A Time Series Analysis of Colom-bia�s Seven Principal Cities" Cuadernos de Administración, 16 (26), July-December, pp. 11-34.
Robbins, Donald (2003) "The Impact of Trade Liberalization Upon Inequality In Developing Countries"Working Paper No. 13, Policy Integration Department, International Labour O¢ ce.
Sánchez-Páramo, Carolina and Schady, Norbert (2003) "O¤and Running? Technology, Trade, and the RisingDemand for Skilled Workers in Latin America" Policy Research Working Paper Series No. 3015, The WorldBank, April.
28

Santamaria, Mauricio (2004) "Income Inequality, Skills and Trade: Evidence from Colombia During the 80sand 90s" Documento Cede 2004-02, February.
Spitz, Alexandra (2004) "Using Methods of Treatment Evaluation to Estimate the Wage E¤ect of IT Usage",Discussion Paper No. 04-67
Spitz, Alexandra (2006) �Technical Change, Job Tasks and Rising Educational Demands: Looking Outsidethe Wage Structure�Journal of Labor Economics 24 (April), 235-70.
Spitz, Alexandra (2008) "The Returns to Pencil Use Revisited" Industrial and Labor Relations Review, ILRReview, ILR School, Cornell University, vol. 61(4), pages 502-517, July.
29
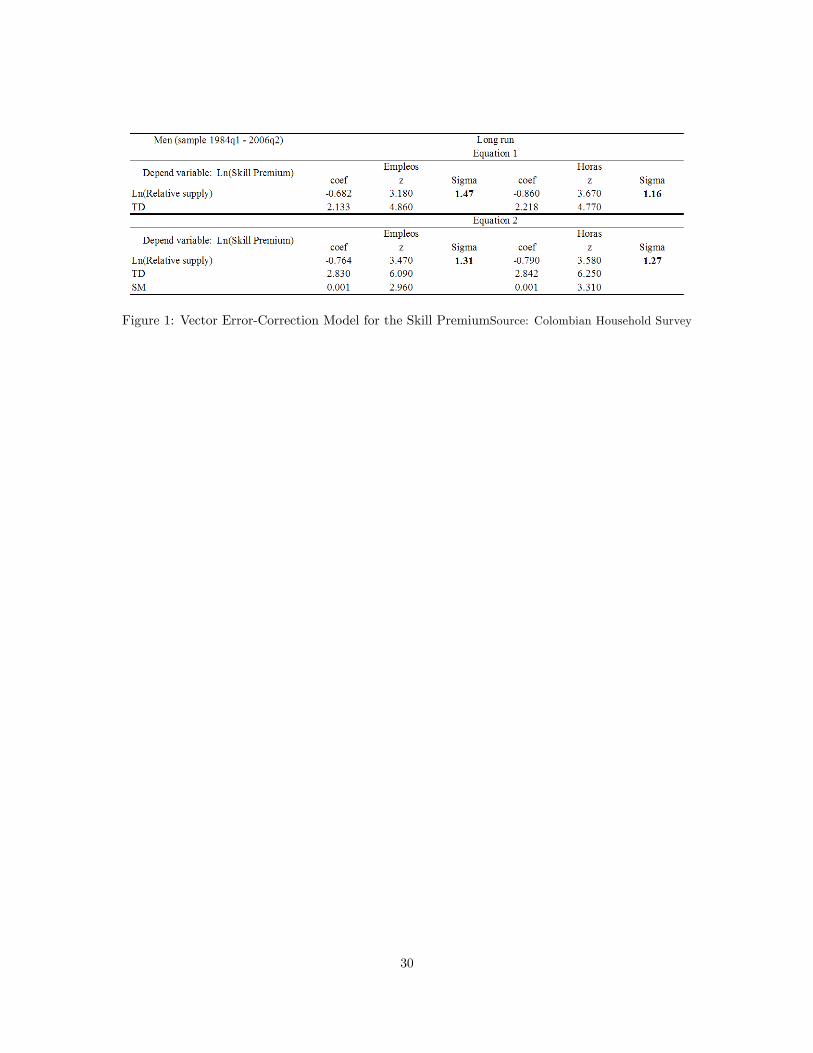
Figure 1: Vector Error-Correction Model for the Skill PremiumSource: Colombian Household Survey
30
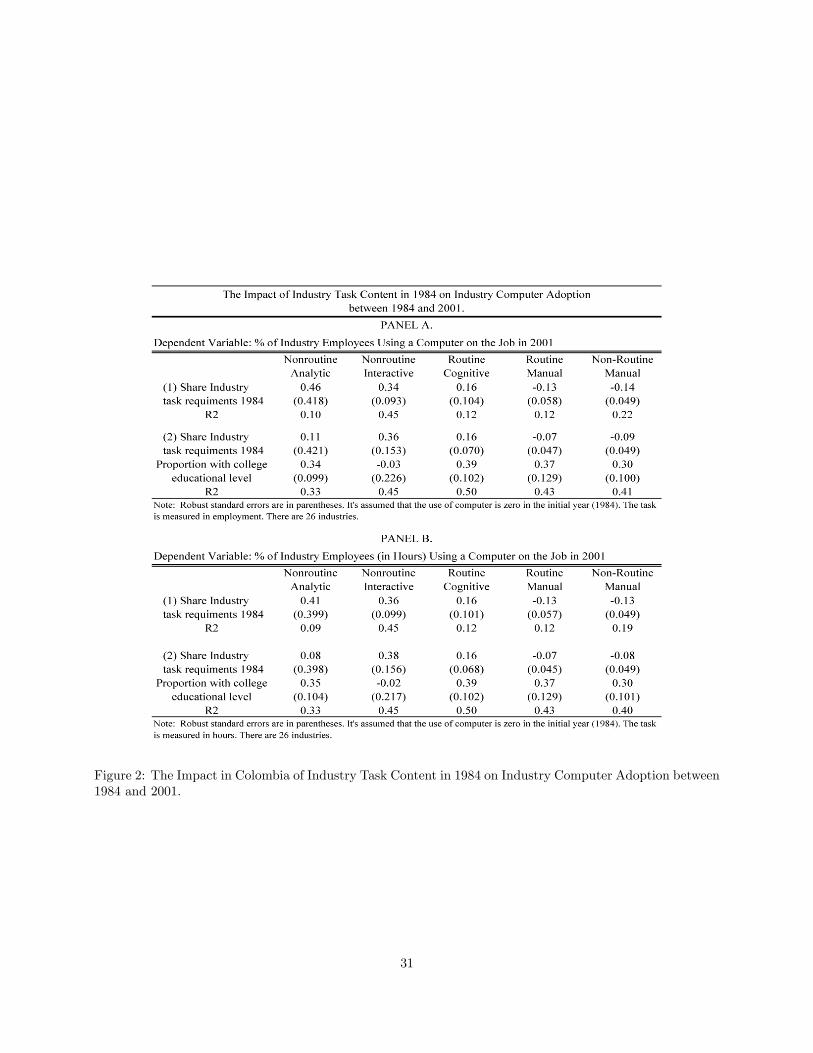
Figure 2: The Impact in Colombia of Industry Task Content in 1984 on Industry Computer Adoption between1984 and 2001.
31

Wage Earners or Skilled Wage Earners or SkilledWage 7.04*** 6.65** Skill 0.08 0.05
(2.30) (2.97) (0.07) (0.06)Wage2 0.43*** 0.41** Skill2 0.0060* 0.0046
(0.14) (0.18) 0.0033* (0.0031)t * Wage2 0.005*** 0.004*** t * Skill2 0.0033*** 0.0025***
(0.001) (0.001) (0.0007) (0.0006)
Wage Earners or SkilledWage 6.85*** 6.83** Skill 0.07 0.04
(2.39) (3.05) (0.07) (0.07)Wage2 0.42*** 0.42** Skill2 0.0058* 0.0045
(0.14) (0.18) 0.0034* 0.0032t * Wage2 0.0060*** 0.0048*** t * Skill2 0.0037*** 0.0029***
0.0009*** (0.0009) 0.0008*** 0.0007***
All
Note: Occupation uses two digit CNO70 codes. Regressions are weighted by the number of individuals within anoccupation in the initial period. Robust standard errors are in parentheses. *** p<0.01, ** p<0.05, * p<0.1. Datacontain information of periods 19841990 and 19842008. t is a dummy variable equal to 1 if data belongs toperiod 19841990 and zero otherwise.
Employment Growth and Initial Median Wage or Skill:
Employment (in hours) Growth and Initial Median Wage or Skill:All All Wage Earners or Skilled
All)*( 20202010 jjjj WtWWO C C γβββ +++=∆ )*( 20202010 jjjj StSSO CC γβββ +++=∆
Figure 3: The Relation Between Employment Growth and Initial Median Wage or Skill in Colombia. 1984-1990 and 1984-2008
Figure 4: The Relation Between Employment Growth and Initial Median Wage or Skill in Mexico. 1990-2000.
32
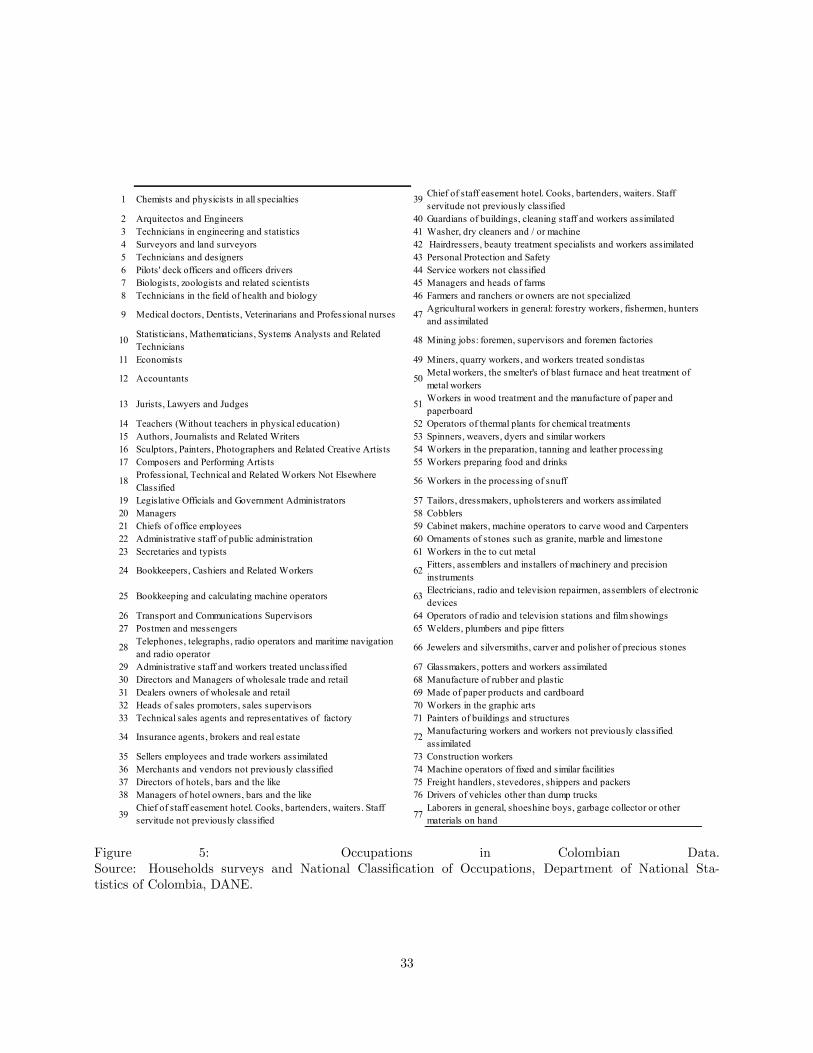
1 Chemists and physicists in all specialties 39 Chief of staff easement hotel. Cooks, bartenders, waiters. Staffservitude not previously classified
2 Arquitectos and Engineers 40 Guardians of buildings, cleaning staff and workers assimilated3 Technicians in engineering and statistics 41 Washer, dry cleaners and / or machine4 Surveyors and land surveyors 42 Hairdressers, beauty treatment specialists and workers assimilated5 Technicians and designers 43 Personal Protection and Safety6 Pilots' deck officers and officers drivers 44 Service workers not classified7 Biologists, zoologists and related scientists 45 Managers and heads of farms8 Technicians in the field of health and biology 46 Farmers and ranchers or owners are not specialized
9 Medical doctors, Dentists, Veterinarians and Professional nurses 47 Agricultural workers in general: forestry workers, fishermen, huntersand assimilated
10 Statisticians, Mathematicians, Systems Analysts and RelatedTechnicians
48 Mining jobs: foremen, supervisors and foremen factories
11 Economists 49 Miners, quarry workers, and workers treated sondistas
12 Accountants 50 Metal workers, the smelter's of blast furnace and heat treatment ofmetal workers
13 Jurists, Lawyers and Judges 51 Workers in wood treatment and the manufacture of paper andpaperboard
14 Teachers (Without teachers in physical education) 52 Operators of thermal plants for chemical treatments15 Authors, Journalists and Related Writers 53 Spinners, weavers, dyers and similar workers16 Sculptors, Painters, Photographers and Related Creative Artists 54 Workers in the preparation, tanning and leather processing17 Composers and Performing Artists 55 Workers preparing food and drinks
18 Professional, Technical and Related Workers Not ElsewhereClassified
56 Workers in the processing of snuff
19 Legislative Officials and Government Administrators 57 Tailors, dressmakers, upholsterers and workers assimilated20 Managers 58 Cobblers21 Chiefs of office employees 59 Cabinet makers, machine operators to carve wood and Carpenters22 Administrative staff of public administration 60 Ornaments of stones such as granite, marble and limestone23 Secretaries and typists 61 Workers in the to cut metal
24 Bookkeepers, Cashiers and Related Workers 62 Fitters, assemblers and installers of machinery and precisioninstruments
25 Bookkeeping and calculating machine operators 63 Electricians, radio and television repairmen, assemblers of electronicdevices
26 Transport and Communications Supervisors 64 Operators of radio and television stations and film showings27 Postmen and messengers 65 Welders, plumbers and pipe fitters
28 Telephones, telegraphs, radio operators and maritime navigationand radio operator
66 Jewelers and silversmiths, carver and polisher of precious stones
29 Administrative staff and workers treated unclassified 67 Glassmakers, potters and workers assimilated30 Directors and Managers of wholesale trade and retail 68 Manufacture of rubber and plastic31 Dealers owners of wholesale and retail 69 Made of paper products and cardboard32 Heads of sales promoters, sales supervisors 70 Workers in the graphic arts33 Technical sales agents and representatives of factory 71 Painters of buildings and structures
34 Insurance agents, brokers and real estate 72 Manufacturing workers and workers not previously classifiedassimilated
35 Sellers employees and trade workers assimilated 73 Construction workers36 Merchants and vendors not previously classified 74 Machine operators of fixed and similar facilities37 Directors of hotels, bars and the like 75 Freight handlers, stevedores, shippers and packers38 Managers of hotel owners, bars and the like 76 Drivers of vehicles other than dump trucks
39Chief of staff easement hotel. Cooks, bartenders, waiters. Staffservitude not previously classified 77
Laborers in general, shoeshine boys, garbage collector or othermaterials on hand
Figure 5: Occupations in Colombian Data.Source: Households surveys and National Classi�cation of Occupations, Department of National Sta-tistics of Colombia, DANE.
33
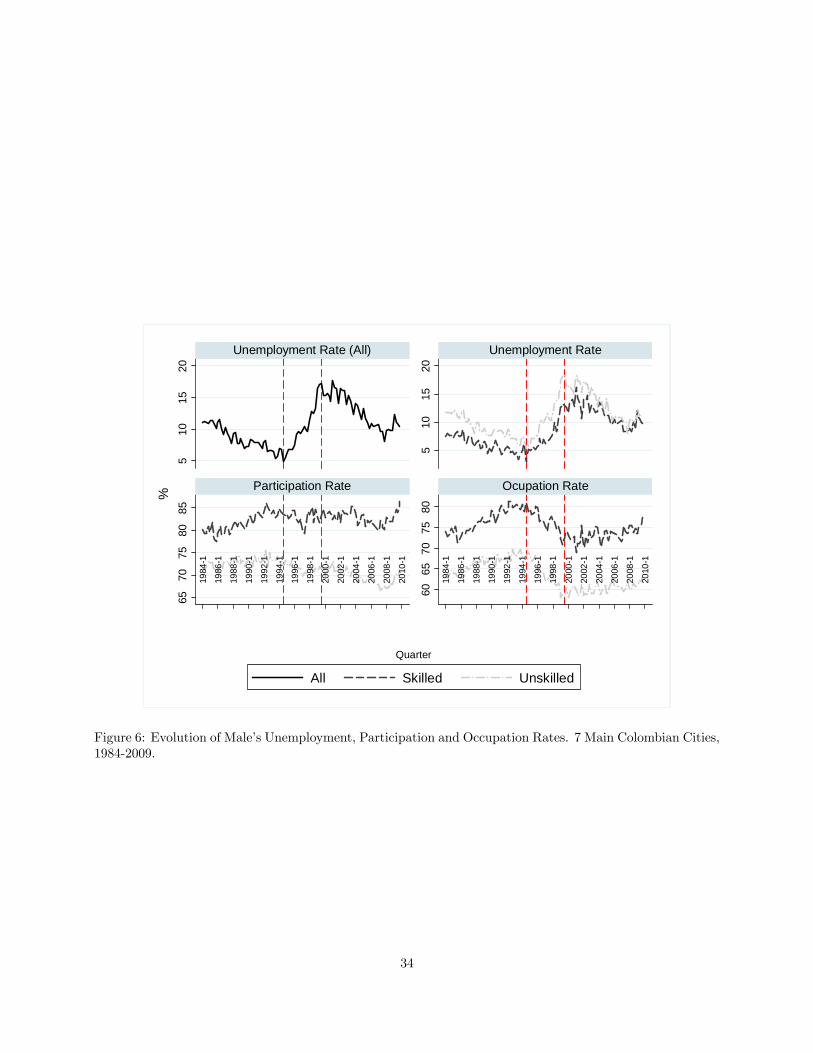
510
1520
510
1520
6570
7580
85
6065
7075
80
1984
1
1986
1
1988
1
1990
1
1992
1
1994
1
1996
1
1998
1
2000
1
2002
1
2004
1
2006
1
2008
1
2010
1
1984
1
1986
1
1988
1
1990
1
1992
1
1994
1
1996
1
1998
1
2000
1
2002
1
2004
1
2006
1
2008
1
2010
1
Unemployment Rate (All) Unemployment Rate
Participation Rate Ocupation Rate
All Skilled Unskilled
%
Quarter
Figure 6: Evolution of Male�s Unemployment, Participation and Occupation Rates. 7 Main Colombian Cities,1984-2009.
34
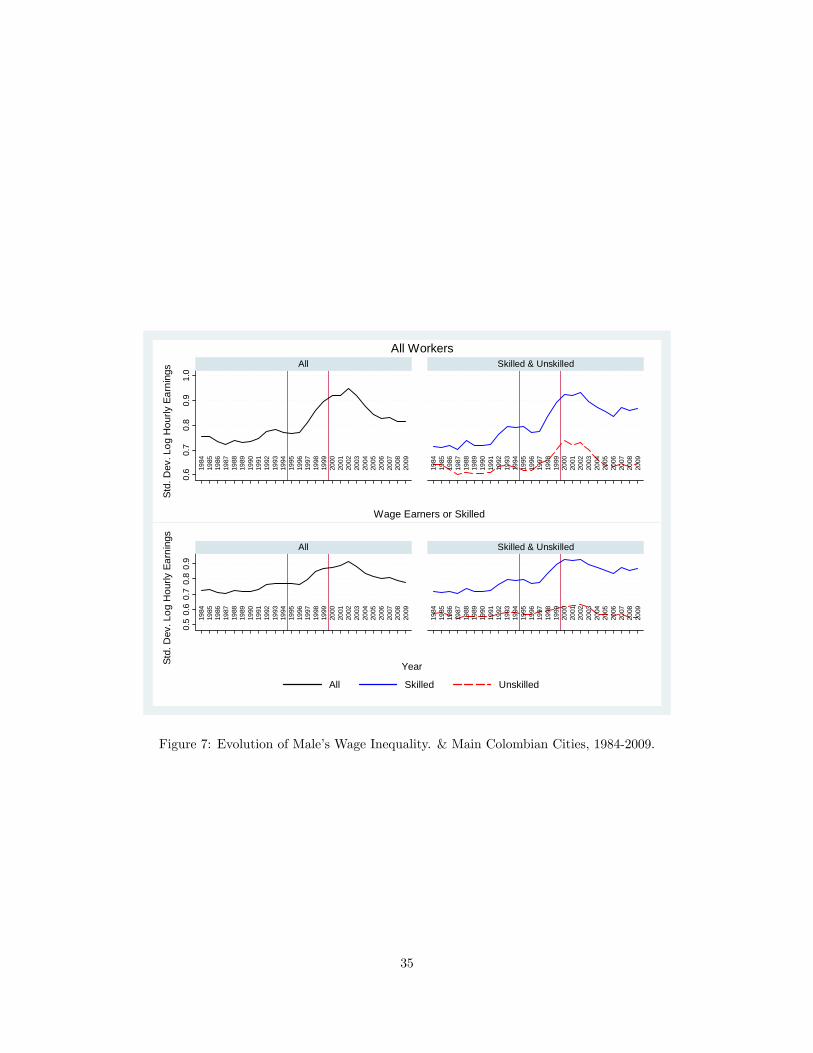
0.6
0.7
0.8
0.9
1.0
1984
1985
1986
1987
1988
1989
1990
1991
1992
1993
1994
1995
1996
1997
1998
1999
2000
2001
2002
2003
2004
2005
2006
2007
2008
2009
1984
1985
1986
1987
1988
1989
1990
1991
1992
1993
1994
1995
1996
1997
1998
1999
2000
2001
2002
2003
2004
2005
2006
2007
2008
2009
All Skilled & Unskilled
Wage Earners or Skilled
Std.
Dev
. Log
Hou
rly E
arni
ngs
All Workers
0.5
0.6
0.7
0.8
0.9
1984
1985
1986
1987
1988
1989
1990
1991
1992
1993
1994
1995
1996
1997
1998
1999
2000
2001
2002
2003
2004
2005
2006
2007
2008
2009
1984
1985
1986
1987
1988
1989
1990
1991
1992
1993
1994
1995
1996
1997
1998
1999
2000
2001
2002
2003
2004
2005
2006
2007
2008
2009
All Skilled & Unskilled
All Skilled Unskilled
Std.
Dev
. Log
Hou
rly E
arni
ngs
Year
Figure 7: Evolution of Male�s Wage Inequality. & Main Colombian Cities, 1984-2009.
35
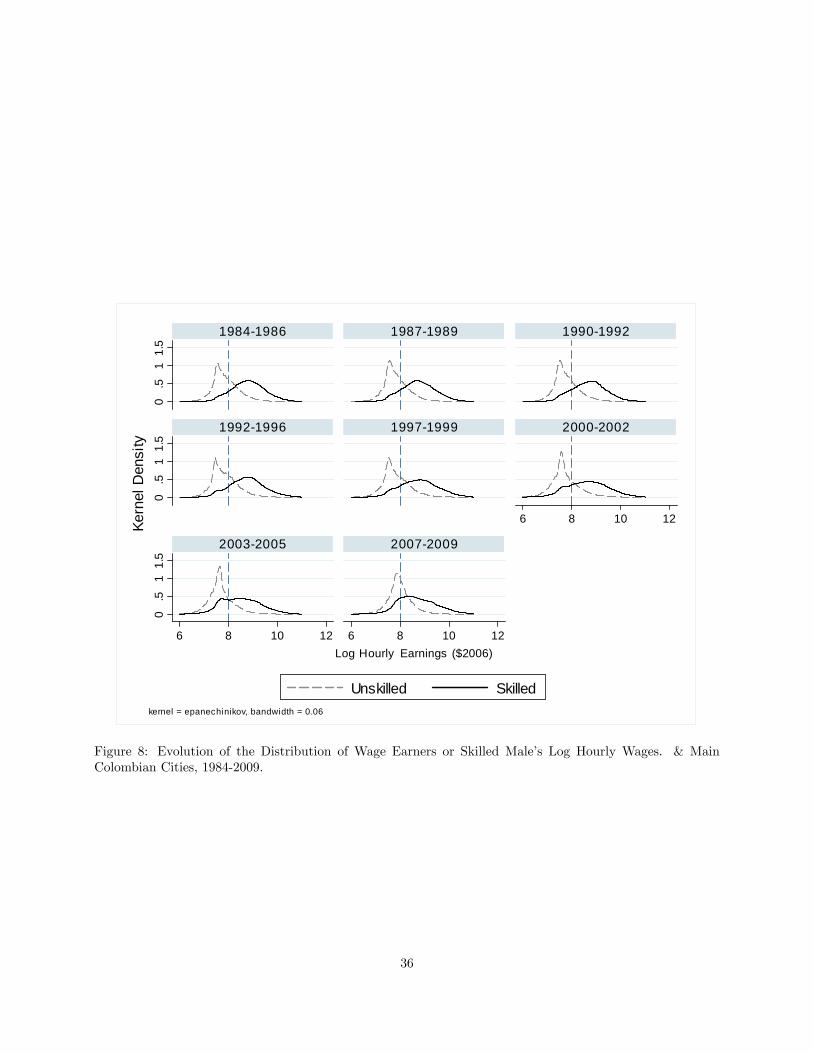
0.5
11.
50
.51
1.5
0.5
11.
5
6 8 10 12
6 8 10 12 6 8 10 12
19841986 19871989 19901992
19921996 19971999 20002002
20032005 20072009
Unskilled Skilled
Kern
el D
ensi
ty
Log Hourly Earnings ($2006)
kernel = epanechinikov, bandwidth = 0.06
Figure 8: Evolution of the Distribution of Wage Earners or Skilled Male�s Log Hourly Wages. & MainColombian Cities, 1984-2009.
36
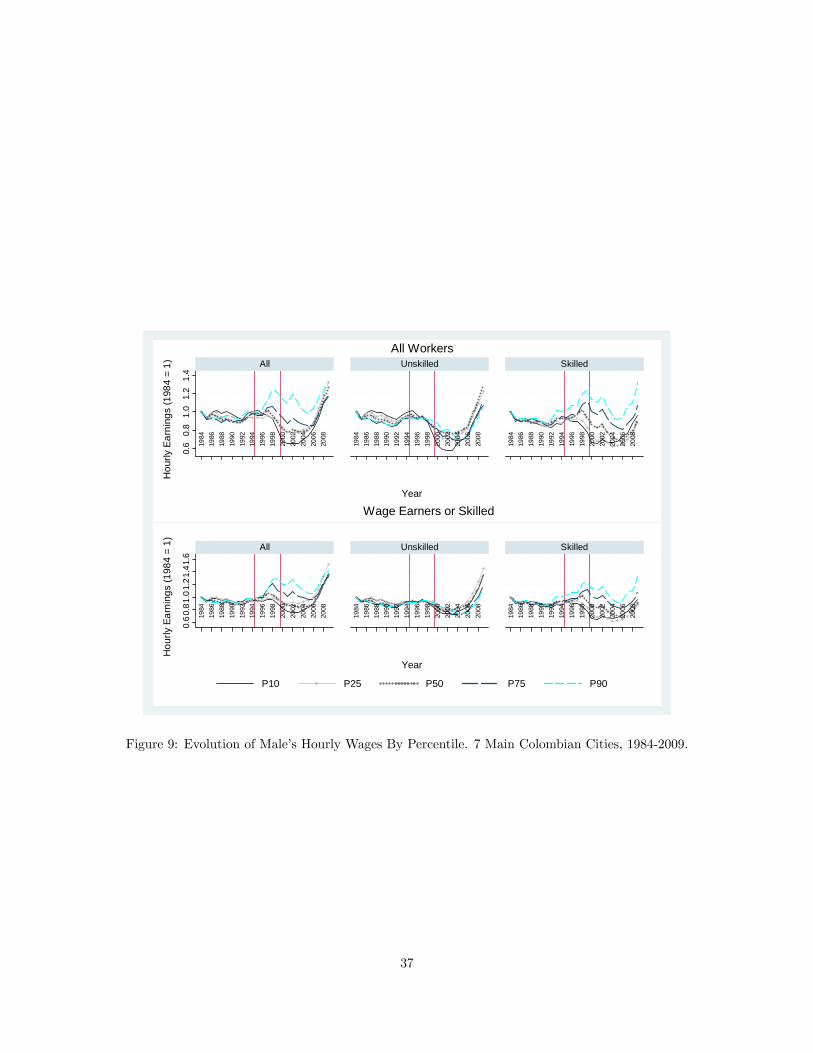
0.6
0.8
1.0
1.2
1.4
1984
1986
1988
1990
1992
1994
1996
1998
2000
2002
2004
2006
2008
1984
1986
1988
1990
1992
1994
1996
1998
2000
2002
2004
2006
2008
1984
1986
1988
1990
1992
1994
1996
1998
2000
2002
2004
2006
2008
All Unskilled Skilled
Hou
rly E
arni
ngs
(198
4 =
1)
Year
All Workers
Wage Earners or Skilled
0.6
0.81
.01.
21.
41.6
1984
1986
1988
1990
1992
1994
1996
1998
2000
2002
2004
2006
2008
1984
1986
1988
1990
1992
1994
1996
1998
2000
2002
2004
2006
2008
1984
1986
1988
1990
1992
1994
1996
1998
2000
2002
2004
2006
2008
All Unskilled Skilled
P10 P25 P50 P75 P90
Hou
rly E
arni
ngs
(198
4 =
1)
Year
Figure 9: Evolution of Male�s Hourly Wages By Percentile. 7 Main Colombian Cities, 1984-2009.
37
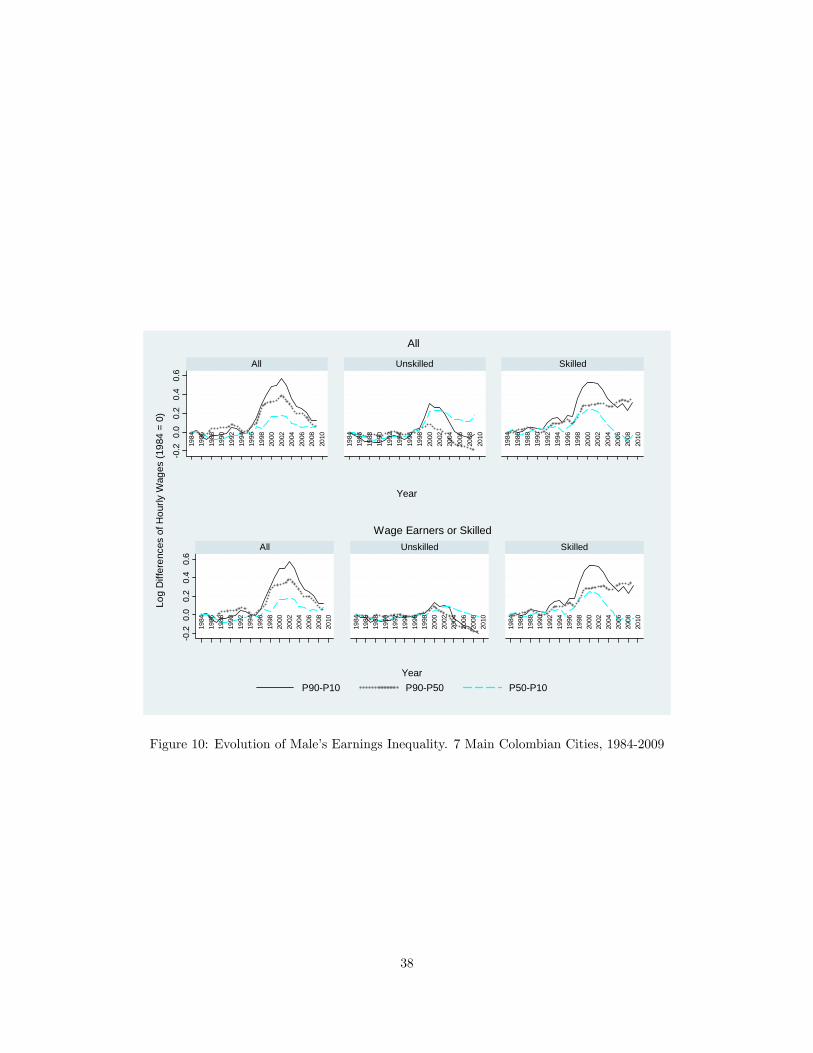
0.2
0.0
0.2
0.4
0.6
1984
1986
1988
1990
1992
1994
1996
1998
2000
2002
2004
2006
2008
2010
1984
1986
1988
1990
1992
1994
1996
1998
2000
2002
2004
2006
2008
2010
1984
1986
1988
1990
1992
1994
1996
1998
2000
2002
2004
2006
2008
2010
All Unskilled Skilled
Year
All
Wage Earners or Skilled
0.2
0.0
0.2
0.4
0.6
1984
1986
1988
1990
1992
1994
1996
1998
2000
2002
2004
2006
2008
2010
1984
1986
1988
1990
1992
1994
1996
1998
2000
2002
2004
2006
2008
2010
1984
1986
1988
1990
1992
1994
1996
1998
2000
2002
2004
2006
2008
2010
All Unskilled Skilled
P90P10 P90P50 P50P10
Log
Diff
eren
ces
of H
ourly
Wag
es (1
984
= 0)
Year
Figure 10: Evolution of Male�s Earnings Inequality. 7 Main Colombian Cities, 1984-2009
38
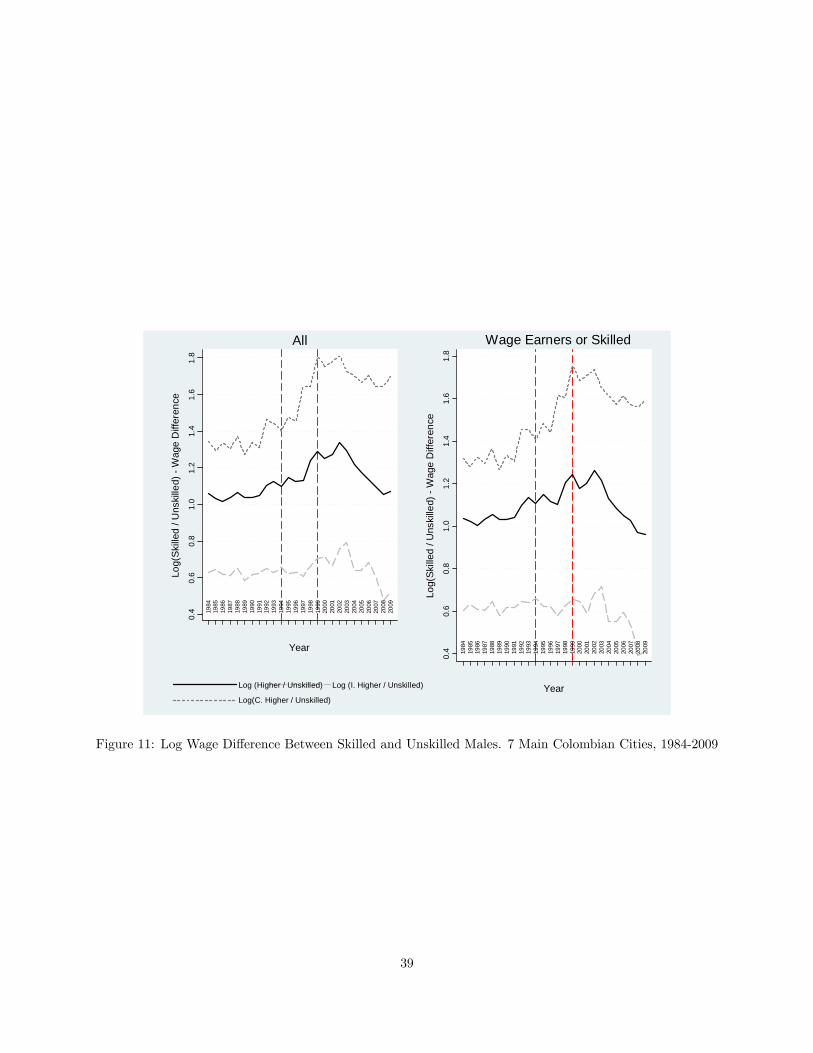
0.4
0.6
0.8
1.0
1.2
1.4
1.6
1.8
Log(
Skill
ed /
Uns
kille
d)
Wag
e D
iffer
ence
1984
1985
1986
1987
1988
1989
1990
1991
1992
1993
1994
1995
1996
1997
1998
1999
2000
2001
2002
2003
2004
2005
2006
2007
2008
2009
Year
Log (Higher / Unskilled) Log (I. Higher / Unskilled)
Log(C. Higher / Unskilled)
0.4
0.6
0.8
1.0
1.2
1.4
1.6
1.8
Log(
Skill
ed /
Uns
kille
d)
Wag
e D
iffer
ence
1984
1985
1986
1987
1988
1989
1990
1991
1992
1993
1994
1995
1996
1997
1998
1999
2000
2001
2002
2003
2004
2005
2006
2007
2008
2009
Year
All Wage Earners or Skilled
Figure 11: Log Wage Di¤erence Between Skilled and Unskilled Males. 7 Main Colombian Cities, 1984-2009
39

0.2
0.0
0.2
0.4
0.6
Log
Earn
ings
Cha
nge,
199
519
85
0 20 40 60 80 100Percentile
Prim I Sec C Sec I Univ C Univ
0.8
0.6
0.4
0.2
0.0
Log
Earn
ings
Cha
nge,
200
519
95
0 20 40 60 80 100Percentile
Prim I Sec C Sec I Univ C Univ
0.80.60.40.20.00.2
Log
Earn
ings
Cha
nge,
200
519
85
0 20 40 60 80 100Percentile
Prim I Sec C Sec I Univ C Univ
0.60.40.20.00.20.40.6
Log
Earn
ings
Cha
nge
0 10 20 30 40 50 60 70 80 90 100Percentile
94 84 0484 0884 0494 0894
Figure 12: Change in log Real Hourly Wages by Education Level and Aggregated, and by Percentile. 7 MainColombian Cities, 1985-2009.
40

0.5
1.0
1.5
2.0
2.5
3.0
3.5
4.0
1984
1986
1988
1990
1992
1994
1996
1998
2000
2002
2004
2006
2008
2010
1984
1986
1988
1990
1992
1994
1996
1998
2000
2002
2004
2006
2008
2010
All Wage Earners or Skilled
Primary Secondary Higher
Num
ber o
f Em
ploy
ees
Mal
es (1
984
= 1)
Year
Figure 13: Evolution of the Number of Occupaid and Wage Earners Males. 7 Main Colombian Cities,1984-2009
41
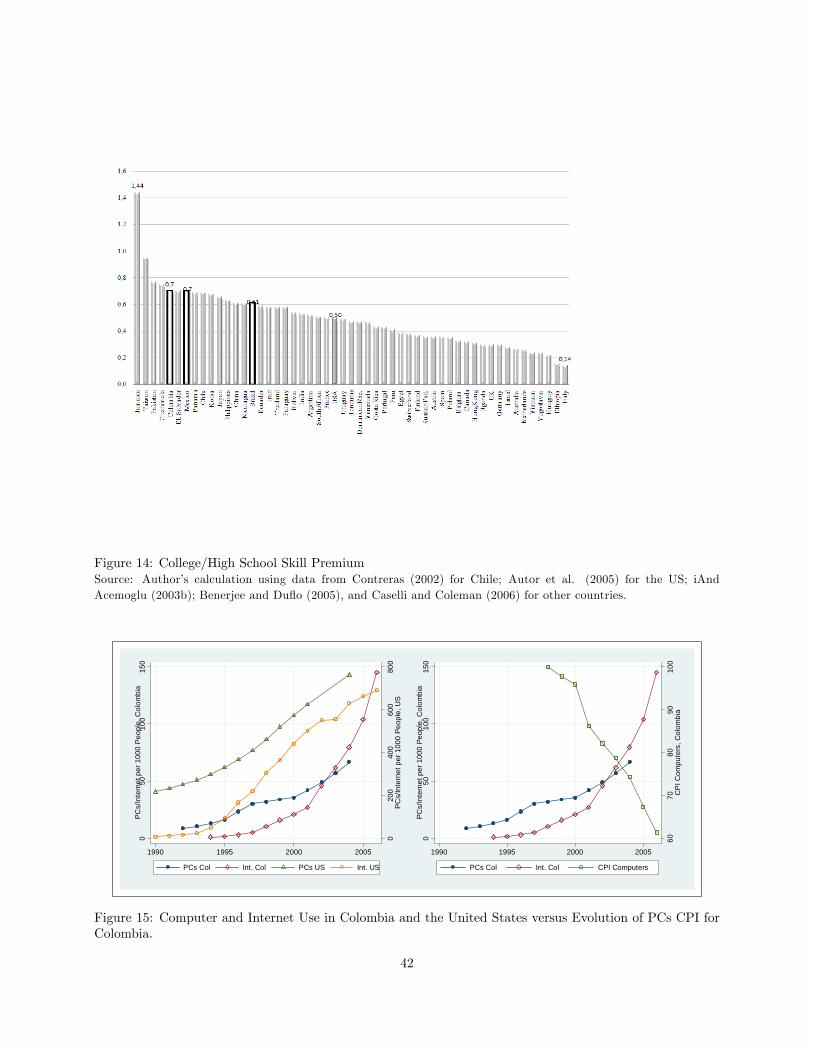
Figure 14: College/High School Skill PremiumSource: Author�s calculation using data from Contreras (2002) for Chile; Autor et al. (2005) for the US; iAndAcemoglu (2003b); Benerjee and Du�o (2005), and Caselli and Coleman (2006) for other countries.
020
040
060
080
0PC
s/In
tern
et p
er 1
000
Peop
le, U
S
050
100
150
PCs/
Inte
rnet
per
100
0 Pe
ople
, Col
ombi
a
1990 1995 2000 2005( m ea n) y ea r
PCs Col Int. Col PCs US Int. US
6070
8090
100
CP
I Com
pute
rs, C
olom
bia
050
100
150
PCs/
Inte
rnet
per
100
0 Pe
ople
, Col
ombi
a
1990 1995 2000 2005( m ea n) y ea r
PCs Col Int. Col CPI Computers
Figure 15: Computer and Internet Use in Colombia and the United States versus Evolution of PCs CPI forColombia.
42
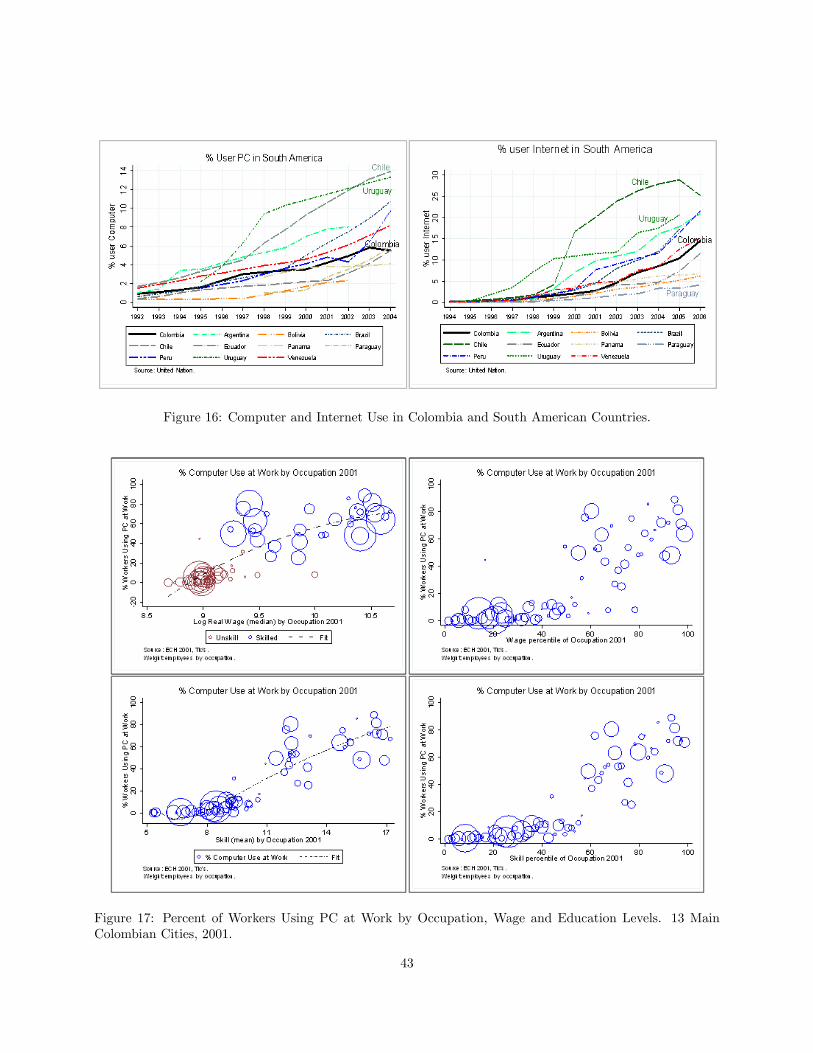
Figure 16: Computer and Internet Use in Colombia and South American Countries.
Figure 17: Percent of Workers Using PC at Work by Occupation, Wage and Education Levels. 13 MainColombian Cities, 2001.
43
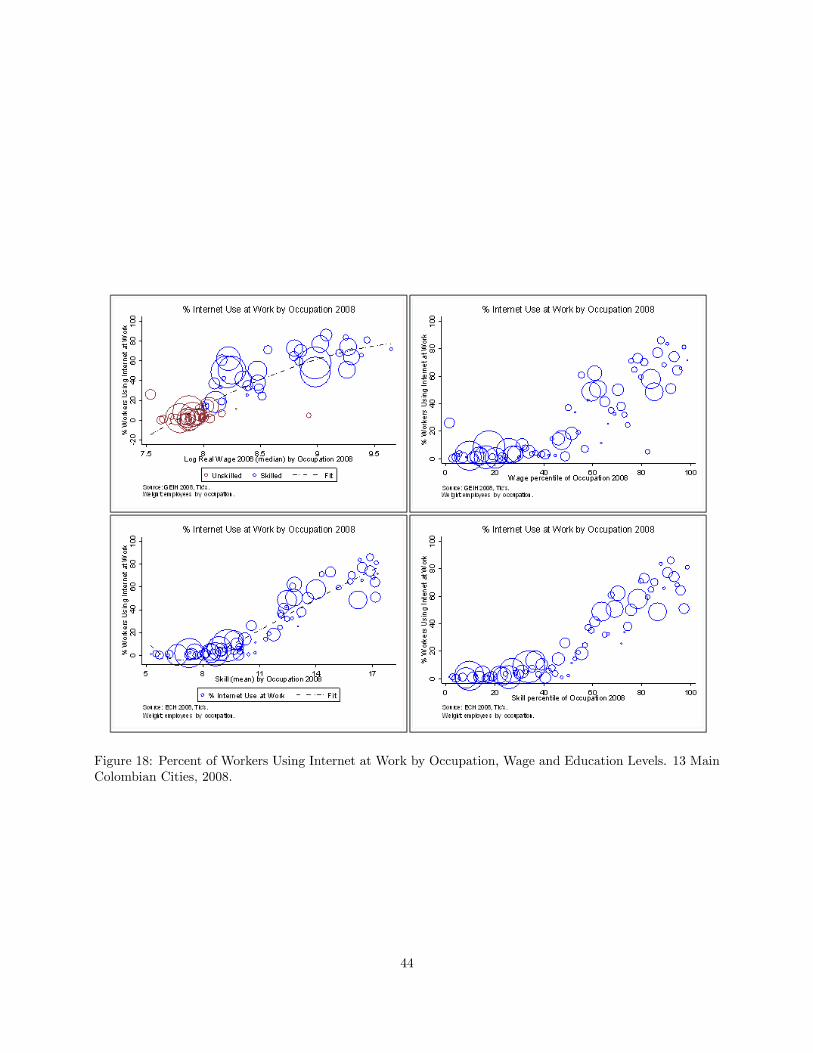
Figure 18: Percent of Workers Using Internet at Work by Occupation, Wage and Education Levels. 13 MainColombian Cities, 2008.
44
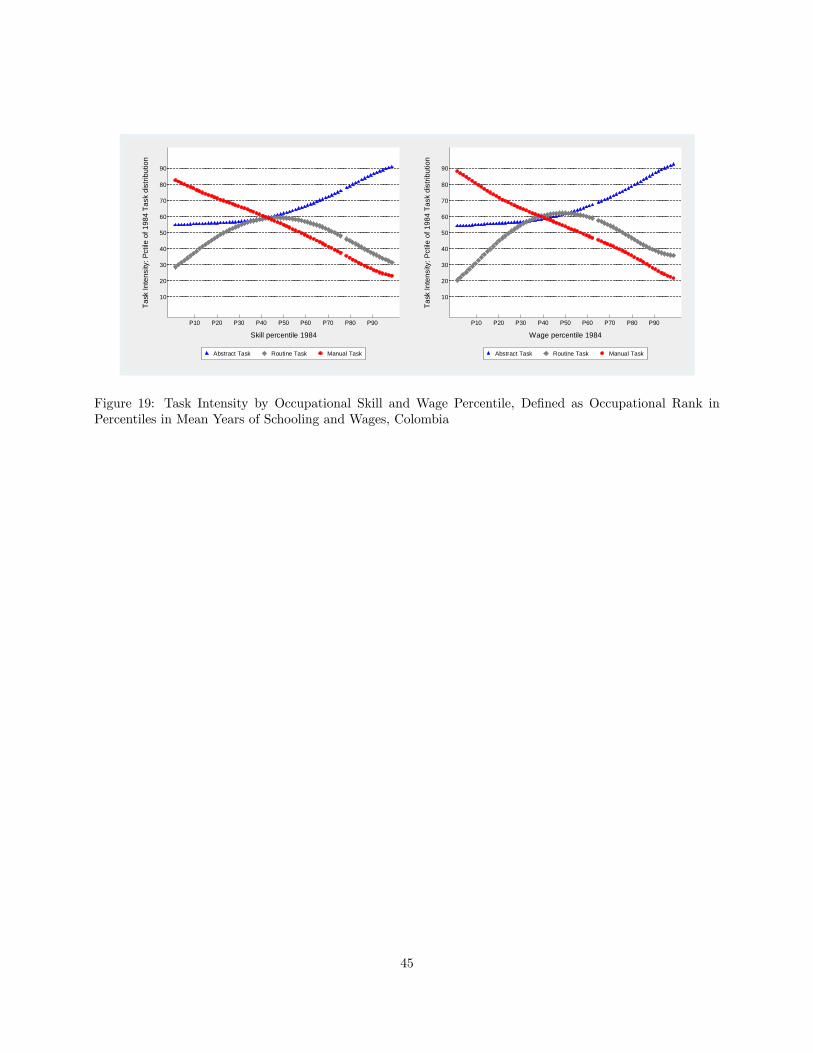
10
20
30
40
50
60
70
80
90
Task
Inte
nsity
: Pct
ile o
f 198
4 Ta
sk d
istri
butio
n
P10 P20 P30 P40 P50 P60 P70 P80 P90
Skill percentile 1984
Abstract Task Routine Task Manual Task
10
20
30
40
50
60
70
80
90
Task
Inte
nsity
: Pct
ile o
f 198
4 Ta
sk d
istri
butio
n
P10 P20 P30 P40 P50 P60 P70 P80 P90
Wage percentile 1984
Abstract Task Routine Task Manual Task
Figure 19: Task Intensity by Occupational Skill and Wage Percentile, De�ned as Occupational Rank inPercentiles in Mean Years of Schooling and Wages, Colombia
45

20
020
4060
20
020
4060
0 20 40 60 80 100 0 20 40 60 80 100
All All
Wage Earners or Skilled Wage Earners or Skilled
19901984 20041990 20081990
Cha
nges
(x 1
00) i
n E
mpl
oym
ent S
hare
Wage Percentile Skill Percentile
Note: Calculation with Kernelweighted Local Polynomial Regression.
Figure 20: Change in Occupation Employment Shares 1984-1990, 1990-2004 and 1990-2008, by OccupationWage and Skill Percentiles in 1984, Colombia.
46
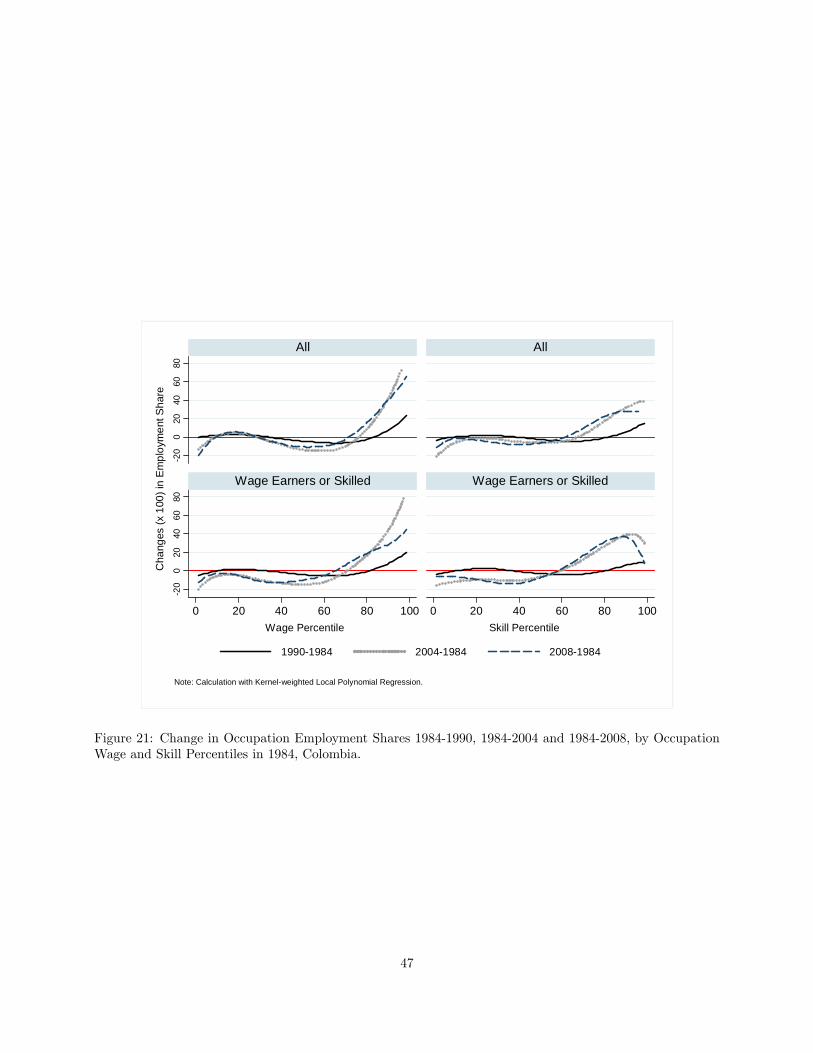
20
020
4060
802
00
2040
6080
0 20 40 60 80 100 0 20 40 60 80 100
All All
Wage Earners or Skilled Wage Earners or Skilled
19901984 20041984 20081984
Cha
nges
(x 1
00) i
n E
mpl
oym
ent S
hare
Wage Percentile Skill Percentile
Note: Calculation with Kernelweighted Local Polynomial Regression.
Figure 21: Change in Occupation Employment Shares 1984-1990, 1984-2004 and 1984-2008, by OccupationWage and Skill Percentiles in 1984, Colombia.
47
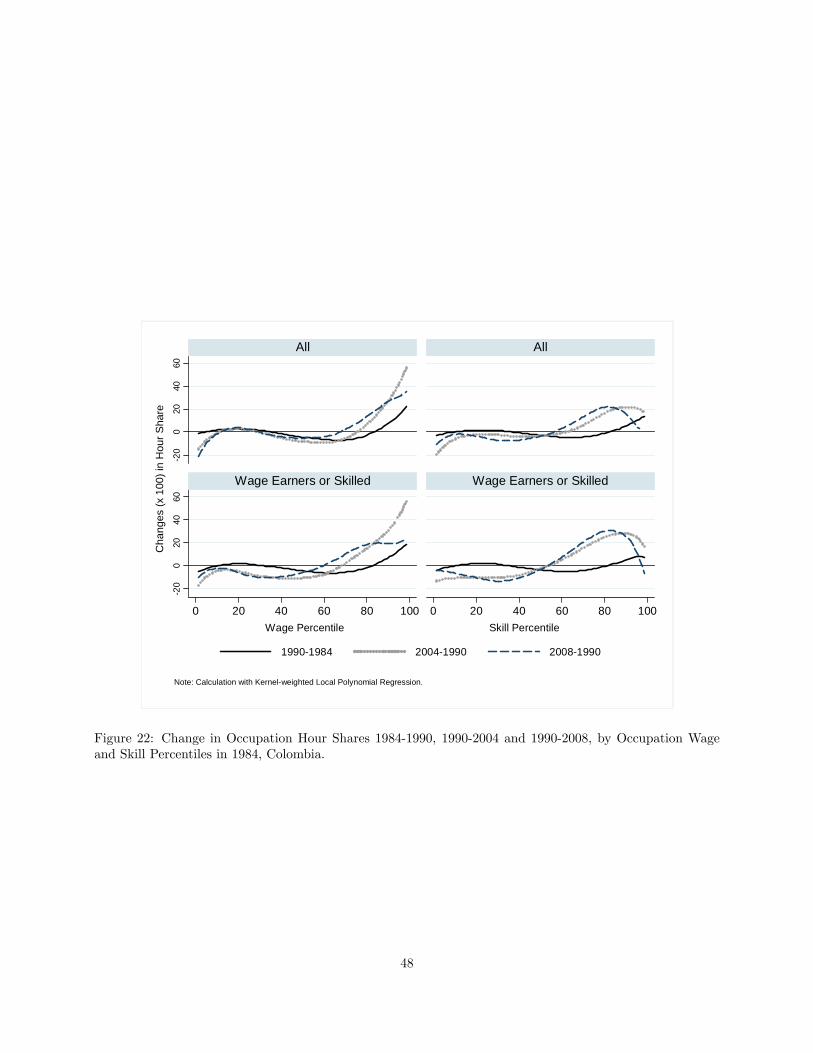
20
020
4060
20
020
4060
0 20 40 60 80 100 0 20 40 60 80 100
All All
Wage Earners or Skilled Wage Earners or Skilled
19901984 20041990 20081990
Cha
nges
(x 1
00) i
n H
our S
hare
Wage Percentile Skill Percentile
Note: Calculation with Kernelweighted Local Polynomial Regression.
Figure 22: Change in Occupation Hour Shares 1984-1990, 1990-2004 and 1990-2008, by Occupation Wageand Skill Percentiles in 1984, Colombia.
48

20
020
4060
802
00
2040
6080
0 20 40 60 80 100 0 20 40 60 80 100
All All
Wage Earners or Skilled Wage Earners or Skilled
19901984 20041984 20081984
Cha
nges
(x 1
00) i
n H
our S
hare
Wage Percentile Skill Percentile
Note: Calculation with Kernelweighted Local Polynomial Regression.
Figure 23: Change in Occupation Hour Shares 1984-1990, 1984-2004 and 1984-2008, by Occupation Wageand Skill Percentiles in 1984, Colombia.
49

Figure 24: Change in Occupation Employment Shares 1981-1992 and 1992-2001 by Occupation Wage andSkill Percentiles in 1981, Brazil.
50
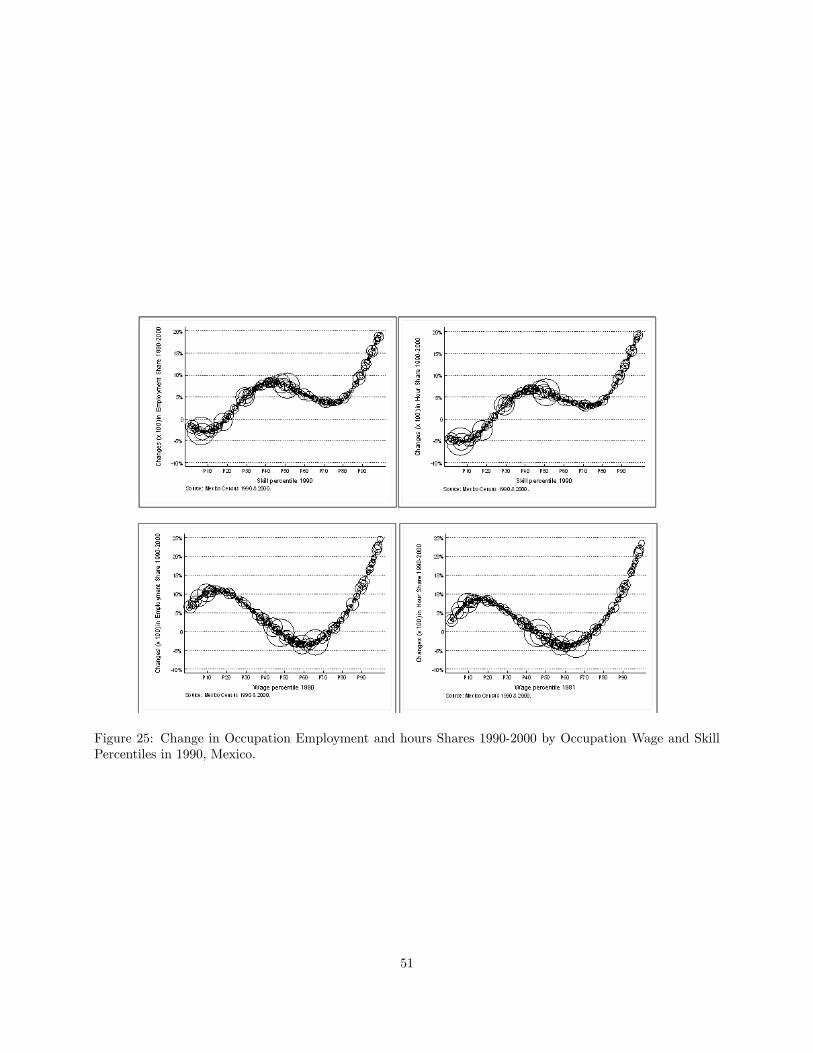
Figure 25: Change in Occupation Employment and hours Shares 1990-2000 by Occupation Wage and SkillPercentiles in 1990, Mexico.
51


