120
Annual Report 07

Annual Report 07

Annual Report 2007All amounts are in Australian dollars, unless otherwise specifi ed. The information in this report is current as at 14 March 2008, unless otherwise specifi ed.
AMP LimitedABN 49 079 354 519
Contents1 Chairman’s foreword 2 Five-year financial summary3 2007 results at a glance 4 Directors’ report 10 Remuneration report 34 Corporate governance 40 Income statement 41 Balance sheet 42 Statement of recognised
income and expenses 43 Statement of cash flows 44 Notes to the financial
statements 114 Directors’ declaration 115 Independent audit report 116 Shareholder informationIBC Glossary
Printed on paper manufactured under international environmental standard ISO 14001, from sustainable forest pulp, elementally chlorine free-bleached. Please recycle.
You can elect to receive your AMP shareholder communications, including dividend statements or the shareholder review, by print or online. To change how you receive this information, go to our website at:www.amp.com.au/shareholdercentre
Update your details any time of the day or night – by phone or online
Phone Using our interactive phone system you can change your bank details, provide your tax file number, check your dividend payments and the number of shares you hold. Have your SRN or HIN at hand and call: 1300 654 442 Australia 0800 448 062 New Zealand +613 9415 4051 Other countries
Online You can update your details online at:www.amp.com.au/shareholdercentre
You can also: Manage your holding online – such as changing your address and bank details
See when your dividends are being paid. You can choose to receive an email reminder using our interactive calendar
See the share price on both the Australian and New Zealand stock exchanges
See the value of your shares. Our online calculator will tell you in a flash
Read all the latest news and reports in one convenient place

Chairman’s foreword
Welcome to AMP’s 2007 Annual Report. This report provides you with AMP’s full statutory accounts, along with the directors’, remuneration and corporate governance reports.
Accompanying this report is the Shareholder Review, which provides a summary of AMP’s 2007 fi nancial performance and management commentary.
The Shareholder Review includes messages from me and from Chief Executive Offi cer, Craig Dunn, overviews of AMP’s business units and information about the company’s strategy and outlook.
2007 financial performanceAMP reported robust fi nancial results in 2007. The company increased its underlying profi t by 10 per cent to $960 million and made good progress against its fi ve key performance measures.
The board declared a fi nal dividend of 24 cents per share. This includes two cents a share from proceeds of the sale of the Cobalt/Gordian business that was announced on 11 December 2007.
Added to the interim dividend of 22 cents per share, the fi nal dividend brings the total dividend for 2007 to 46 cents per share, which is up six cents on the 2006 dividend.
Our dividend policy is to pay out 85 per cent of underlying profi t, with a target of 85 per cent franking.
OutlookAMP is a fi nancially strong company with low debt, a strong balance sheet and a resilient business model.
Our strategic focus is on continuing to invest for growth, while prudently managing the business through volatile market conditions.
Our goal remains to double the value of an investment in AMP every fi ve years, which will mean faster growth in some years than others.
While the outlook for 2008 is challenging and AMP is not immune to the impact of volatile fi nancial markets, your board is confi dent of AMP’s ability to prosper.
Peter MasonChairman
“The company increased its underlying profi t by 10 per cent to $960 million and made good progress against its fi ve key performance measures.”Peter MasonChairman
AMP ANNUAL REPORT 2007 1
2 AMP ANNUAL REPORT 2007
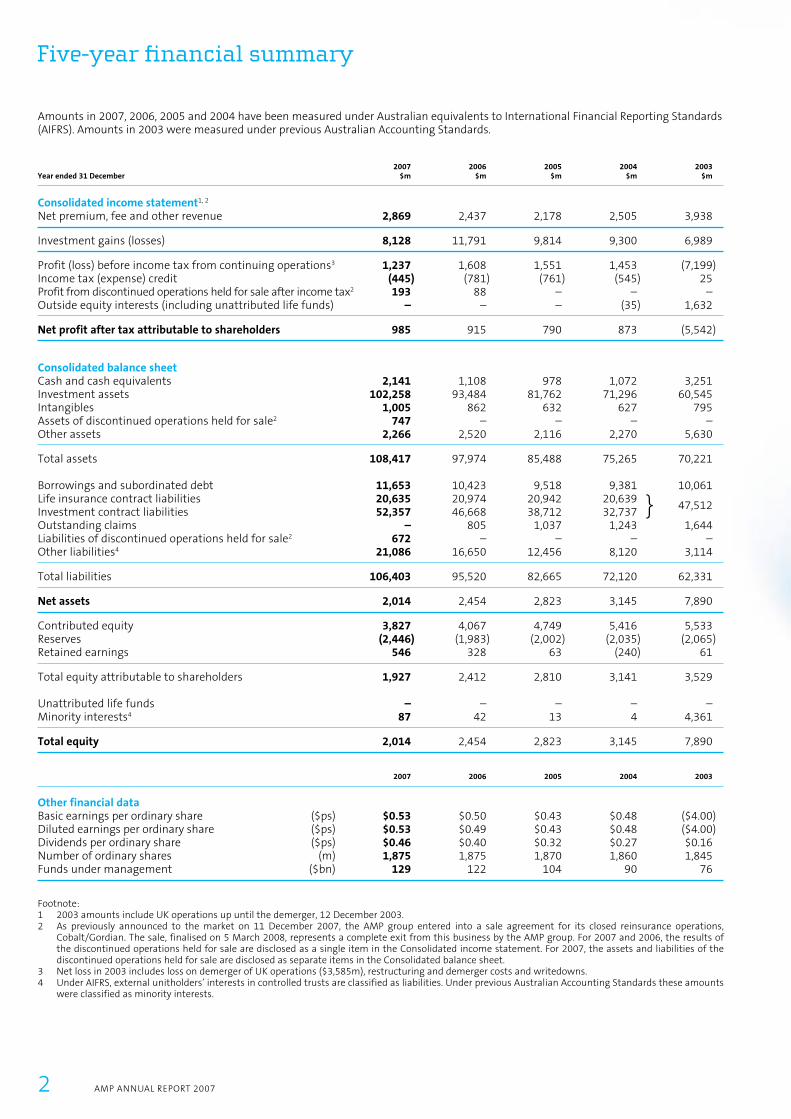
Five-year fi nancial summary
Amounts in 2007, 2006, 2005 and 2004 have been measured under Australian equivalents to International Financial Reporting Standards (AIFRS). Amounts in 2003 were measured under previous Australian Accounting Standards.
2007 2006 2005 2004 2003Year ended 31 December $m $m $m $m $m
Consolidated income statement1, 2 Net premium, fee and other revenue 2,869 2,437 2,178 2,505 3,938
Investment gains (losses) 8,128 11,791 9,814 9,300 6,989
Profit (loss) before income tax from continuing operations3 1,237 1,608 1,551 1,453 (7,199) Income tax (expense) credit (445) (781) (761) (545) 25 Profit from discontinued operations held for sale after income tax2 193 88 – – – Outside equity interests (including unattributed life funds) – – – (35) 1,632
Net profit after tax attributable to shareholders 985 915 790 873 (5,542)
Consolidated balance sheet Cash and cash equivalents 2,141 1,108 978 1,072 3,251 Investment assets 102,258 93,484 81,762 71,296 60,545 Intangibles 1,005 862 632 627 795 Assets of discontinued operations held for sale2 747 – – – – Other assets 2,266 2,520 2,116 2,270 5,630
Total assets 108,417 97,974 85,488 75,265 70,221
Borrowings and subordinated debt 11,653 10,423 9,518 9,381 10,061 Life insurance contract liabilities 20,635 20,974 20,942 20,639 } 47,512
Investment contract liabilities 52,357 46,668 38,712 32,737 Outstanding claims – 805 1,037 1,243 1,644 Liabilities of discontinued operations held for sale2 672 – – – – Other liabilities4 21,086 16,650 12,456 8,120 3,114
Total liabilities 106,403 95,520 82,665 72,120 62,331
Net assets 2,014 2,454 2,823 3,145 7,890
Contributed equity 3,827 4,067 4,749 5,416 5,533 Reserves (2,446) (1,983) (2,002) (2,035) (2,065)Retained earnings 546 328 63 (240) 61
Total equity attributable to shareholders 1,927 2,412 2,810 3,141 3,529
Unattributed life funds – – – – – Minority interests4 87 42 13 4 4,361
Total equity 2,014 2,454 2,823 3,145 7,890
2007 2006 2005 2004 2003
Other financial data Basic earnings per ordinary share ($ps) $0.53 $0.50 $0.43 $0.48 ($4.00)Diluted earnings per ordinary share ($ps) $0.53 $0.49 $0.43 $0.48 ($4.00)Dividends per ordinary share ($ps) $0.46 $0.40 $0.32 $0.27 $0.16 Number of ordinary shares (m) 1,875 1,875 1,870 1,860 1,845 Funds under management ($bn) 129 122 104 90 76
Footnote:1 2003 amounts include UK operations up until the demerger, 12 December 2003.2 As previously announced to the market on 11 December 2007, the AMP group entered into a sale agreement for its closed reinsurance operations,
Cobalt/Gordian. The sale, finalised on 5 March 2008, represents a complete exit from this business by the AMP group. For 2007 and 2006, the results of the discontinued operations held for sale are disclosed as a single item in the Consolidated income statement. For 2007, the assets and liabilities of the discontinued operations held for sale are disclosed as separate items in the Consolidated balance sheet.
3 Net loss in 2003 includes loss on demerger of UK operations ($3,585m), restructuring and demerger costs and writedowns. 4 Under AIFRS, external unitholders’ interests in controlled trusts are classified as liabilities. Under previous Australian Accounting Standards these amounts
were classified as minority interests.
AMP ANNUAL REPORT 2007 3
15%
8%
10%
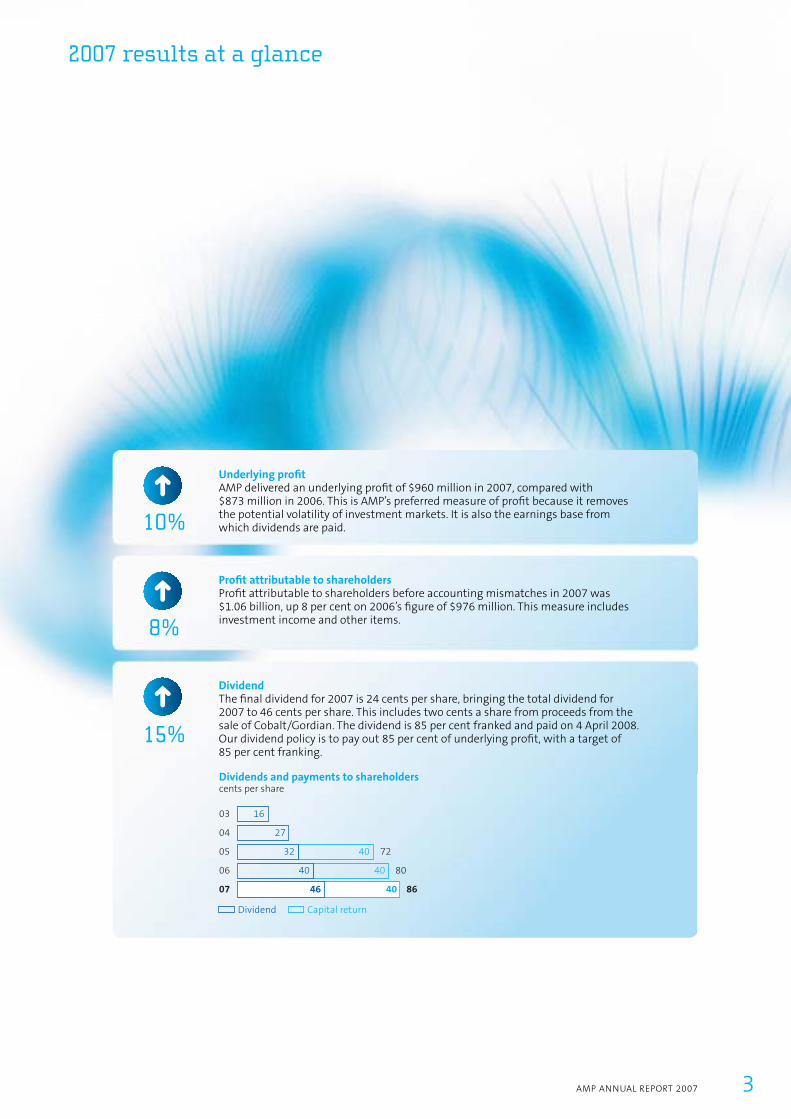
2007 results at a glance
DividendThe fi nal dividend for 2007 is 24 cents per share, bringing the total dividend for 2007 to 46 cents per share. This includes two cents a share from proceeds from the sale of Cobalt/Gordian. The dividend is 85 per cent franked and paid on 4 April 2008. Our dividend policy is to pay out 85 per cent of underlying profi t, with a target of 85 per cent franking.
Profi t attributable to shareholdersProfi t attributable to shareholders before accounting mismatches in 2007 was $1.06 billion, up 8 per cent on 2006’s fi gure of $976 million. This measure includes investment income and other items.
Underlying profi tAMP delivered an underlying profi t of $960 million in 2007, compared with $873 million in 2006. This is AMP’s preferred measure of profi t because it removes the potential volatility of investment markets. It is also the earnings base from which dividends are paid.
Dividends and payments to shareholders cents per share
04 27
03 16
05 32 40 72
06 40 40 80
07
Dividend
46 40 86
Capital return
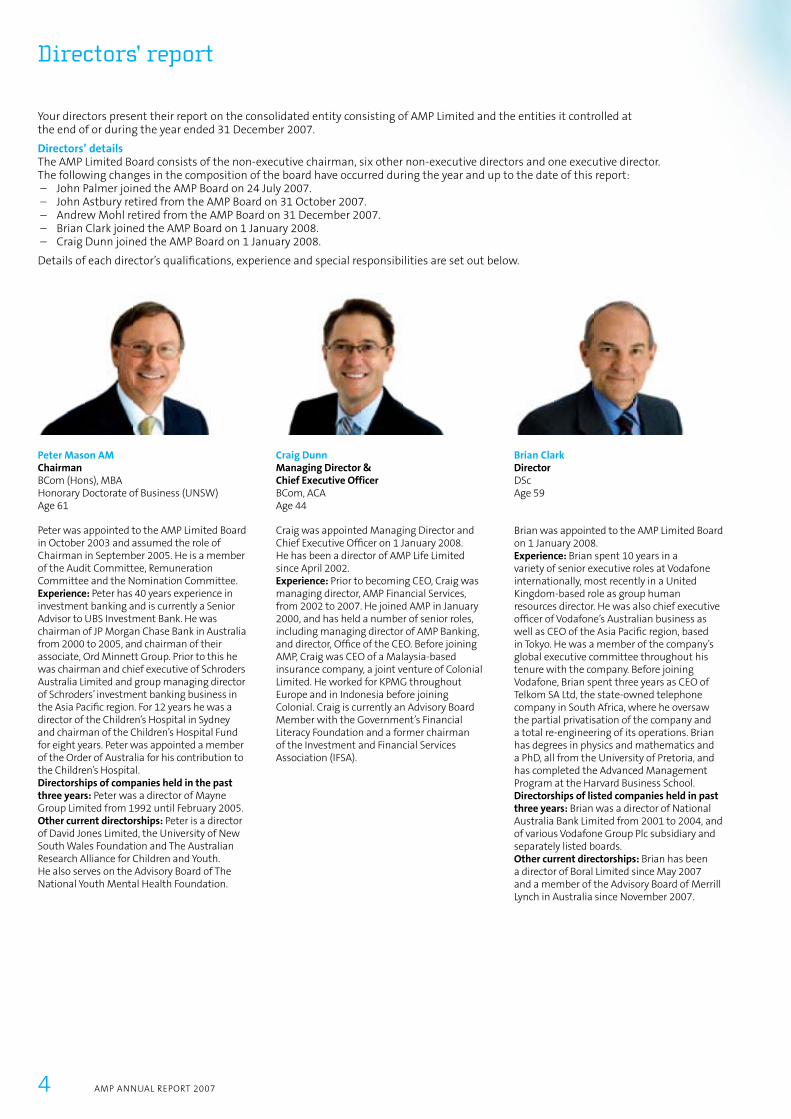
Peter Mason AMChairmanBCom (Hons), MBA Honorary Doctorate of Business (UNSW)Age 61
Craig DunnManaging Director & Chief Executive OfficerBCom, ACAAge 44
Brian ClarkDirectorDScAge 59
Your directors present their report on the consolidated entity consisting of AMP Limited and the entities it controlled at the end of or during the year ended 31 December 2007.
Directors’ detailsThe AMP Limited Board consists of the non-executive chairman, six other non-executive directors and one executive director. The following changes in the composition of the board have occurred during the year and up to the date of this report: – John Palmer joined the AMP Board on 24 July 2007. – John Astbury retired from the AMP Board on 31 October 2007. – Andrew Mohl retired from the AMP Board on 31 December 2007. – Brian Clark joined the AMP Board on 1 January 2008. – Craig Dunn joined the AMP Board on 1 January 2008.
Details of each director’s qualifi cations, experience and special responsibilities are set out below.
Brian was appointed to the AMP Limited Board on 1 January 2008. Experience: Brian spent 10 years in a variety of senior executive roles at Vodafone internationally, most recently in a United Kingdom-based role as group human resources director. He was also chief executive offi cer of Vodafone’s Australian business as well as CEO of the Asia Pacifi c region, based in Tokyo. He was a member of the company’s global executive committee throughout his tenure with the company. Before joining Vodafone, Brian spent three years as CEO of Telkom SA Ltd, the state-owned telephone company in South Africa, where he oversaw the partial privatisation of the company and a total re-engineering of its operations. Brian has degrees in physics and mathematics and a PhD, all from the University of Pretoria, and has completed the Advanced Management Program at the Harvard Business School.Directorships of listed companies held in past three years: Brian was a director of National Australia Bank Limited from 2001 to 2004, and of various Vodafone Group Plc subsidiary and separately listed boards.Other current directorships: Brian has been a director of Boral Limited since May 2007 and a member of the Advisory Board of Merrill Lynch in Australia since November 2007.
Craig was appointed Managing Director and Chief Executive Offi cer on 1 January 2008. He has been a director of AMP Life Limited since April 2002. Experience: Prior to becoming CEO, Craig was managing director, AMP Financial Services, from 2002 to 2007. He joined AMP in January 2000, and has held a number of senior roles, including managing director of AMP Banking, and director, Offi ce of the CEO. Before joining AMP, Craig was CEO of a Malaysia-based insurance company, a joint venture of Colonial Limited. He worked for KPMG throughout Europe and in Indonesia before joining Colonial. Craig is currently an Advisory Board Member with the Government’s Financial Literacy Foundation and a former chairman of the Investment and Financial Services Association (IFSA).
Peter was appointed to the AMP Limited Board in October 2003 and assumed the role of Chairman in September 2005. He is a member of the Audit Committee, Remuneration Committee and the Nomination Committee.Experience: Peter has 40 years experience in investment banking and is currently a Senior Advisor to UBS Investment Bank. He was chairman of JP Morgan Chase Bank in Australia from 2000 to 2005, and chairman of their associate, Ord Minnett Group. Prior to this he was chairman and chief executive of Schroders Australia Limited and group managing director of Schroders’ investment banking business in the Asia Pacifi c region. For 12 years he was a director of the Children’s Hospital in Sydney and chairman of the Children’s Hospital Fund for eight years. Peter was appointed a member of the Order of Australia for his contribution to the Children’s Hospital.Directorships of companies held in the past three years: Peter was a director of Mayne Group Limited from 1992 until February 2005.Other current directorships: Peter is a director of David Jones Limited, the University of New South Wales Foundation and The Australian Research Alliance for Children and Youth. He also serves on the Advisory Board of The National Youth Mental Health Foundation.
Directors’ report
4 AMP ANNUAL REPORT 2007

David ClarkeDirectorLLBAge 52
Richard was appointed to the AMP Limited Board in March 2000. He is chairman of the Audit Committee and a member of the Nomination Committee. He has been a director of AMP Life Limited since November 2001 and chairs its Audit Committee. Richard has been a director of Gordian RunOff Limited since May 2004 and chairman since May 2005. He is also a member of the AMP Capital Audit Committee.Experience: Richard has over 32 years of experience in the accounting profession. He was a partner of KPMG from 1982 to 2000 and a member of KPMG’s National Board from 1995 to 1997 and national executive from 1997 to 2000. He was an independent fi nancial expert for AMP’s demutualisation and investigating accountant for AMP’s prospectus and listing. In 2007, Richard was appointed a member of the Order of Australia for service to the community, particularly through leadership roles with Mission Australia and fundraising with Variety, The Children’s Charity, and to the fi nance and insurance sectors.Directorships of listed companies held in past three years: Richard has been the chairman of Cryosite Limited since December 2002, director of Atlas Group Holdings Limited since February 2003, director of Trafalgar Corporate Group since 2002 and its chairman since 2006.Other current directorships: Richard has been chairman of the Board and Council of the NSW Motor Accidents Authority since 1994, director of Mission Australia since 1984, and president and chairman since 2000. In 2006 he was appointed chairman of the NSW Lifetime Care and Support Authority. In 2002 Richard was appointed chairman of the Association of Surfi ng Professionals (International) Limited.
Meredith HellicarDirectorBA, LLM (Hons)Age 54
David was appointed to the AMP Limited Board in July 2005. He is a member of the Remuneration Committee and was a director of AMP Capital Investors and a member of its Audit Committee from August 2005 to March 2007.Experience: David has over 25 years experience in investment banking, funds management and retail banking. He joined Westpac Banking Corporation in July 2000 where he ran the Australian Business and Consumer Bank prior to being appointed chief executive of BT Financial Group, Westpac’s wealth management business, in September 2002. David was previously director and chief executive of MLC Limited (a subsidiary of Lend Lease Corporation of which he was a director). He built MLC into one of Australia’s leading funds management businesses and led the Asian Pacifi c business operations of Lend Lease, gaining experience across the group’s portfolio of global interests, including property development and fi nancial services. David’s early career was spent in Lloyds Bank, culminating in becoming the chief executive of Lloyds Merchant Bank in the United Kingdom. David was appointed chief executive offi cer and managing director of Allco Finance Group Limited in April 2007.Directorships of listed companies held in past three years: David has been a director of Allco Finance Group Limited since April 2007.Other current directorships: David is governor of Ascham School Limited since 1993 and is a director of the Hornery Institute.
Richard Grellman AMDirectorFCAAge 57
Meredith was appointed to the AMP Limited Board in March 2003. She is chairman of the Remuneration Committee, has been a director of AMP Bank since June 2004 and has been a director of the AMP Life Limited Board since May 2006 and its chairman since October 2006.Experience: Meredith has over 20 years of senior executive experience in the oil, coal, logistics, legal and fi nancial services industries. She was previously managing director TNT Logistics Asia, chief executive of Corrs Chambers Westgarth and managing director of InTech Financial Services Limited. Her previous directorships include NSW Treasury Corporation, AurionGold, HLA Envirosciences (chairman), the NSW Environment Protection Authority and HCS Limited. Meredith has been a member of the Takeovers Panel since March 1999. She was awarded a Centenary Medal in 2003 for service to Australian society in business leadership and is a member of the CEDA Board of Governors.Directorships of listed companies held in past three years: Meredith was a director of James Hardie Industries NV from October 2001 to February 2007 (she was chairman from August 2004 to February 2007). She was a director of Southern Cross Airports Group from February 2003 to March 2007. Meredith has been a director of Amalgamated Holdings Limited since October 2003.Other current directorships: Meredith has been chairman of the Sydney Institute since 1998 and has been a director of the Garvan Institute Foundation since March 2002.
AMP ANNUAL REPORT 2007 5

John PalmerDirectorONZM, BAgrSc, FNZIDAge 60
Nora was appointed to the AMP Limited Board in September 2003. She is chairman of the Nomination Committee and a member of the Audit Committee. She has been a director of AMP Capital Investors Limited since February 2004 and chairs its Audit Committee.Experience: Nora was formerly a senior banking executive in international and project fi nancing. She held positions with CRA Limited, Macquarie Bank, Chase AMP and Deutsche Bank where, as head of the Project Finance Unit, she was responsible for the development and fi nancing of major projects in Australasia and South East Asia. Nora’s current consulting practice assists government, corporate and institutional clients in areas such as corporate governance and project and structured fi nance. Nora is an experienced company director having served as chairman and non-executive director of companies in a wide range of industry sectors and in the public, government and private spheres. Previous directorships include North Limited, IOOF Funds Management, Medical Benefi ts Fund of Australia Limited and chairman and director of various energy and water utilities, in addition to those listed below. Nora is also an Associate Professor at the Melbourne Business School at Melbourne University. In 2003, she was awarded a centenary medal for services to Australian society in business leadership.Directorships of listed companies held in past three years: Nora has been a director of PaperlinX since 2000 and of Orica Limited since August 2006. Nora was a director of Newcrest Mining (2000 to 2007), Mayne Group Limited (2005) and of Mayne Pharma Limited (2005 to 2007).
Sharyn PageBoard Executive and Company SecretaryBA LLB, ACIS, AACI
John was appointed to the AMP Limited Board on 24 July 2007. He is a member of the Remuneration Committee, and he has been a director of the AMP Life Board since May 2004. He was previously a director of the AMP Bank Board from 1998 to 2003. John is based in New Zealand.Experience: John has considerable experience as a director and chairman of companies in the agricultural and fi nance sectors. His other business interests focus largely on horticultural production and servicing. He has a track record of successfully leading change and reconstruction of diverse corporates in marketing, agribusiness and aviation. In 1998 he received the Bledisloe Cup for outstanding contribution to the New Zealand fruit industry. In 1999 he was awarded with an Offi cer of the New Zealand Order of Merit (ONZM) for service to the New Zealand kiwifruit industry.Directorships of listed companies held in past three years: John has been the chairman of Air New Zealand Limited since November 2001 and chairman of Solid Energy NZ Limited since January 2007. He is a director of Rabobank Australia Limited and Saxton Fruit Ltd.
Dr Nora ScheinkestelDirectorLLB (Hons), PhD, FAICDAge 47
Sharyn joined AMP in 1990 and progressed through a variety of legal and compliance roles before taking up the role of Assistant Company Secretary in 2003. She was appointed Board Executive and Company Secretary on 18 July 2005.
6 AMP ANNUAL REPORT 2007
Directors’ report continued
AMP ANNUAL REPORT 2007 7
Principal activitiesAMP is a company focused on helping Australians and New Zealanders manage their fi nancial well-being so they can enjoy the future they want. AMP aims to be the leading provider of quality fi nancial advice, simple, value-for-money products and superior investment performance in the markets in which it operates.
AMP has two major businesses, AMP Financial Services and AMP Capital Investors.
AMP Financial Services offers customers a range of fi nancial products and services, primarily through one of the largest fi nancial planning networks in the market. These products and services include fi nancial planning advice, superannuation, retirement savings and income products, investments, life and general insurance and selected banking products.
AMP Capital Investors is one of the largest investment managers in Australia and is the largest in New Zealand. It also provides investment management services in Asia.
AMP is currently in the process of selling a third business, Cobalt/Gordian, which manages the run-off of AMP’s remaining books of general insurance and reinsurance business, as well as providing services to external clients. AMP announced the sale of this business to Enstar Group Limited on 11 December 2007 and the sale is expected to be completed by the end of the fi rst quarter of 2008.
AMP has 3.4 million customers in Australia and New Zealand, around 4,000 employees, 830,000 shareholders and around $130 billion of assets under management.
Review of operations and resultsAMP has a sound fi nancial base and a powerful and resilient business model. It is executing a disciplined strategy which capitalises on AMP’s brand, low-cost and scaleable manufacturing platform, strong partnerships with self-employed planners, diverse investment-management base and consistently good investment performance, cost and capital effi ciency, to drive growth in the business and returns for shareholders.
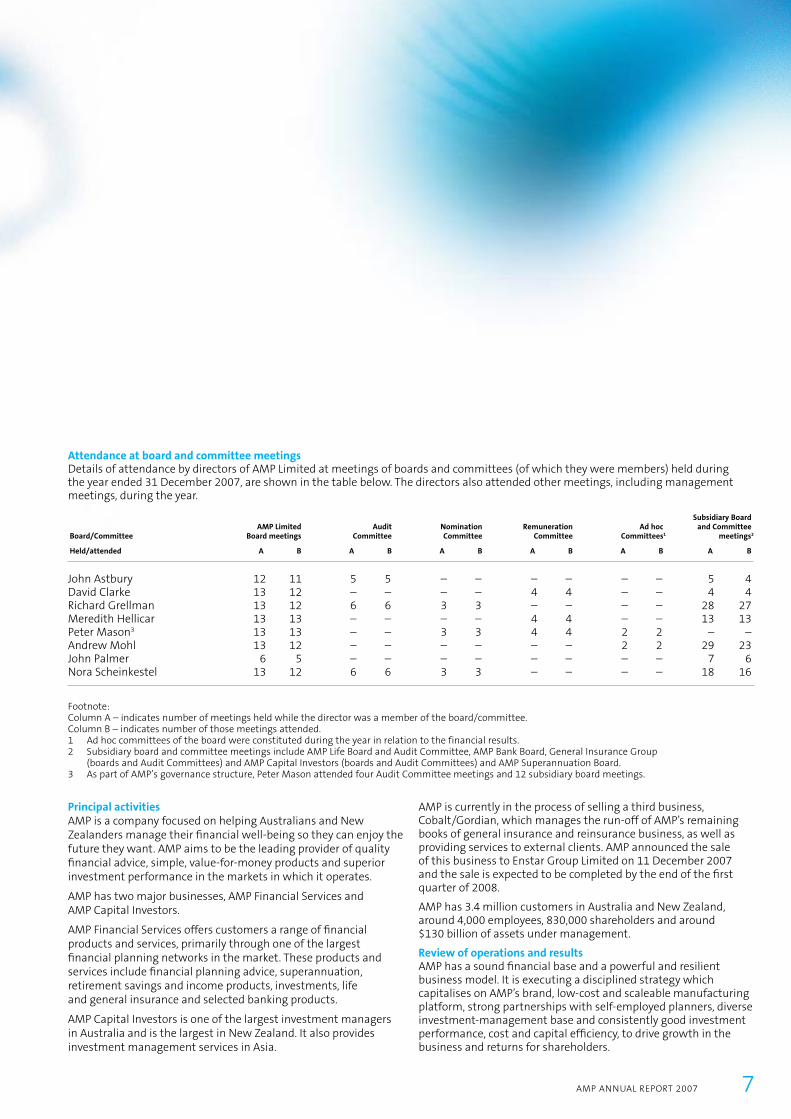
Attendance at board and committee meetings Details of attendance by directors of AMP Limited at meetings of boards and committees (of which they were members) held during the year ended 31 December 2007, are shown in the table below. The directors also attended other meetings, including management meetings, during the year.
Board/Committee
Held/attended
AMP Limited Board meetings
A B
AuditCommittee
A B
NominationCommittee
A B
RemunerationCommittee
A B
Ad hocCommittees1
A B
Subsidiary Board and Committee
meetings2
A B
John Astbury 12 11 5 5 – – – – – – 5 4David Clarke 13 12 – – – – 4 4 – – 4 4Richard Grellman 13 12 6 6 3 3 – – – – 28 27Meredith Hellicar 13 13 – – – – 4 4 – – 13 13Peter Mason3 13 13 – – 3 3 4 4 2 2 – –Andrew Mohl 13 12 – – – – – – 2 2 29 23John Palmer 6 5 – – – – – – – – 7 6Nora Scheinkestel 13 12 6 6 3 3 – – – – 18 16
Footnote:Column A – indicates number of meetings held while the director was a member of the board/committee.Column B – indicates number of those meetings attended.1 Ad hoc committees of the board were constituted during the year in relation to the financial results.2 Subsidiary board and committee meetings include AMP Life Board and Audit Committee, AMP Bank Board, General Insurance Group
(boards and Audit Committees) and AMP Capital Investors (boards and Audit Committees) and AMP Superannuation Board. 3 As part of AMP’s governance structure, Peter Mason attended four Audit Committee meetings and 12 subsidiary board meetings.
8 AMP ANNUAL REPORT 2007
Directors’ report continued
The result for the year ended 31 December 2007 was a consolidated profi t attributable to shareholders of AMP Limited, after accounting mismatches, of $985 million – compared to $915 million for the previous corresponding period.
There was a 10 per cent increase in underlying profi t to $960 million for the year to 31 December 2007, from $873 million for the year ended 31 December 2006. This refl ected solid cash fl ows, growth in assets under management and fees, and lower unit costs, which more than offset the lower investment income due to the impact of capital initiatives in the past three years that have reduced invested capital.
Underlying profi t smoothes out the effect of investment market volatility by using average long-term rates of return to calculate investment income in a period, rather than actual investment income, which can be higher or lower than the average long-term rate. Underlying profi t is AMP’s preferred measure of profi tability and it is the basis for calculation of AMP’s dividends to shareholders.
The business made good progress on its key short-term performance indicators in the period under review. – Underlying return on equity (RoE) increased to 37.9%
from 30.3% in 2006.– Total operating earnings grew by 12.4% to $770 million.– Cost-to-income ratio fell by 0.8 percentage points to 38.6%.– Value of new business rose 12.9% on 2006 to $393 million
and embedded value grew by 17.2% in the year before transfers (3% discount margin).
– 68% of Australian assets under management met or exceeded their benchmarks in the year to December.
AMP generated total investment gains (before tax) attributable to shareholders, policyholders and other equity interests of $8,128 million for the year ended 31 December 2007, compared to $11,791 million for the year to 31 December 2006, refl ecting weaker investment markets in 2007 relative to 2006.
Total AMP group assets under management were $129 billion at 31 December 2007, up 6 per cent from $122 billion at 31 December 2006.
Today, AMP is a low capital-intensive wealth-management group. AMP intends to continue to invest for growth in 2008 while prudently managing the business through the volatile market conditions that marked the beginning of the year.
Capital managementOn 15 February 2007, AMP announced that, subject to shareholder approval, AMP Limited shareholders would receive a capital return of 40 cents per share totalling $750 million. AMP’s shareholders approved the capital return at the Annual General Meeting in May 2007, and payment was made on 18 June 2007. The Australian Taxation Offi ce ruled that the capital return would be treated as a reduction in the cost base of the shares and not as a taxable dividend.
Capital and reserves of the group decreased to $1,927 million at 31 December 2007, from $2,412 million at 31 December 2006, as a result of the capital return and dividends paid during 2007, partially offset by 2007 profi ts and movements in reserves and contributed equity.
AMP group debt increased by $208 million in 2007. Interest cover (underlying basis) increased from 14.9 times in 2006 to 17.3 times in 2007. Gearing on a Standard and Poor’s basis was 10 per cent at December 2007.
As a result of the sale of the Cobalt/Gordian operations there will be an increase in Group Offi ce capital. AMP plans to use this
increase in Group Offi ce capital to pay shareholders an additional 2 cents per share in each of the next four dividend payments, commencing with the fi nal 2007 dividend to be paid in April 2008.
AMP’s capital management strategy is now moving to focus on optimising its capital mix which is currently biased to equity capital. The next capital management initiative is likely to be a Tier 2 debt issue to fund an on-market buy back of share capital. AMP has chosen to defer any initiative, with the timing of any issue yet to be decided and dependent on credit and equity markets stabilising.
AMP is maintaining its dividend payout ratio policy of 85 per cent of underlying profi t, with a target of 85 per cent franking.
Impact of accounting mismatches on profi tDuring the year, the aggregate of accounting mismatches reduced the net profi t attributable to the shareholders of AMP Limited by $71 million from $1,056 million, before the accounting mismatches, to $985 million after accounting mismatches. The accounting mismatches have reduced the net profi t of AMP Limited by approximately 7 per cent, although having no impact on cash fl ow and value.
The accounting mismatches arise in respect of:– gains and losses on ‘treasury shares’ (2007: loss $30 million;
2006: loss $77 million)– gains and losses on investments in controlled entities
of the life statutory funds (2007: loss $37 million; 2006: loss $20 million)
– gains and losses on owner-occupied property (2007: loss $11 million; 2006: loss $26 million), and
– discounting of deferred tax balances in the valuation of investment contract liabilities (2007: gain $7 million; 2006: gain $62 million).
So that the AMP Limited Financial Report for year ended 31 December 2007 can be drawn up in accordance with Australian Accounting Standards, and to present a true and fair view of the results of operations, the presentation of the Income statement has been reformatted in order to explain the impact of the accounting mismatches.
Accounting mismatches are one of the signifi cant impacts arising from the application of Australian equivalents to International Financial Reporting Standards (AIFRS).
As detailed in the accounting policies Note 1(d) in the Financial Report, accounting mismatches arise because the valuation rules for liabilities to policyholders differ from the valuation rules for certain assets which support them. The application of the rules to these policyholder assets has an illogical impact on shareholder profi t. For example, where policyholder funds own AMP Limited shares, the increase in AMP Limited’s share price (rebased for the capital returns) from $9.72 to $9.95 in the 12 months to December 2007 (2006: increase from $7.09 to $9.72) has driven an accounting loss of $30 million (2006: loss of $77 million) in the consolidated result.
The International Accounting Standards Board (IASB) has discussed accounting mismatches at previous meetings. The IASB has confi rmed that it would be preferable to eliminate such accounting mismatches, and is reviewing alternative accounting treatments to address the accounting mismatch issue. The current discussions are part of the wider Insurance Contracts project, and as such are not expected to be resolved in the short term.
Political donationsAMP’s policy is that it does not make donations to political parties. No political donations were made during 2007.

AMP ANNUAL REPORT 2007 9
Signifi cant changes to the state of affairsOn 23 August 2007, the AMP Board announced that it had agreed that Andrew Mohl would leave AMP at the end of his contract on 31 December 2007, following more than fi ve years as CEO. In September, the Board appointed Craig Dunn to take over as CEO from 1 January 2008.
On 11 December 2007, AMP announced the sale of its closed reinsurance and general insurance operations, Cobalt/Gordian, to Enstar Group Limited for $585 million. See Note 21 of the Financial Report for further details.
Details of capital changes during 2007 are set out earlier in this report.
There have been no other signifi cant changes in the state of affairs during this fi nancial year.
Events occurring after the reporting dateDividendsOn 14 February 2008, AMP proposed a fi nal dividend on ordinary shares. Details of the proposed fi nal dividend and dividends paid and declared during the fi nancial year are disclosed in Note 16 of the Financial Report.
As at the date of this report, the directors are not aware of any matter or circumstance that has arisen since the end of the year that has signifi cantly affected or may signifi cantly affect the operations of the consolidated entity, the results of its operations or its state of affairs, which is not already refl ected in this report.
Likely developmentsIn the opinion of the directors, disclosure of further information about likely developments in AMP’s businesses is commercially sensitive and would likely be detrimental and result in unreasonable prejudice to the company.
The environmentAMP’s environmental policy guides improvements in direct environmental impacts by reducing our use of energy, water, paper and other materials. It also outlines environmental considerations in our purchasing decisions and product design.
During 2007, initiatives to reduce the direct environmental impact of AMP’s operations included the expansion of a recycling system and implementation of water saving initiatives.
As an investor, AMP believes that engagement with companies on environmental issues is an effective way to infl uence management practices for the benefi t of customers and the environment. During 2007, AMP Capital Investors was a signatory to the Carbon Disclosure Project (www.cdproject.net) and an active participant in the Investor Group on Climate Change (www.igcc.org.au). AMP Capital Investors is also a signatory to the United Nations Principles of Responsible Investment.
In the normal course of its business operations, AMP is subject to a range of environmental regulations, of which there have been no material breaches during the year.
The environment policy is available on AMP’s website: www.amp.com.au
Remuneration disclosuresThe remuneration arrangements for AMP directors and senior executives are outlined in the remuneration report which forms part of the directors’ report for the year ended 31 December 2007. The remuneration report meets the remuneration disclosure requirements of both the Corporations Act 2001 and AASB 124 Related Party Disclosures.
Directors’ and senior executives’ interests in AMP Limited shares are also set out in the remuneration report.
Non-audit servicesThe Audit Committee has reviewed details of the amounts paid or payable for non-audit services provided to the AMP group of companies during the year ended 31 December 2007, by the Company’s auditor, Ernst & Young.
The Committee is satisfi ed that the provision of those non-audit services by the auditor is compatible with the general standard of independence for auditors imposed by the Corporations Act and did not compromise the auditor independence requirements of the Corporations Act for the following reasons:– All non-audit assignments were approved in accordance with
the process set out in the AMP Charter of Audit Independence.– No non-audit assignments were carried out which
were specifi cally excluded by the AMP Charter of Audit Independence.
– The level of fees for non-audit services amounted to $1,482,000 or 14 per cent of total audit fees. (Refer to Note 33 of the Financial Report for further details.)
Auditor’s independence declaration to the directors of AMP LimitedThe directors have obtained an independence declaration from our auditor, Ernst & Young, a copy of which is attached to this report and forms part of the directors’ report for the year ended 31 December 2007.
Indemnifi cation and insurance of directors and offi cersUnder its Constitution, the company indemnifi es, to the extent permitted by law, all offi cers of the company (including the directors) against any liability (including the costs and expenses of defending actions for an actual or alleged liability) incurred in their capacity as an offi cer of the company.
This indemnity is not extended to current or former employees of the AMP group against liability incurred in their capacity as an employee, unless approved by the board. No such indemnities have been provided during or since the end of the fi nancial year.
During the fi nancial year, the company agreed to insure all of the offi cers (including all directors) of the AMP group against certain liabilities as permitted by the Corporations Act. The insurance policy prohibits disclosure of the nature of the cover, the amount of the premium, the limit of liability and other terms.
In addition, the company and each of the directors are parties to Deeds of Indemnity and Access, as approved by the board. Those Deeds of Indemnity and Access provide that:– the directors will have access to the books of the company
for their period of offi ce and for seven years after they cease to hold offi ce
– the company indemnifi es the directors to the extent permitted by law
– the indemnity covers liabilities incurred by the directors in their capacity as offi cers of the company and of other AMP group companies, and
– the company will maintain directors’ and offi cers’ insurance cover for the directors to the extent permitted by law for the period of their offi ce and for seven years after they cease to hold offi ce.
Rounding In accordance with the Australian Securities and Investments Commission Class Order 98/100, amounts in this directors’ report and the accompanying Financial Report have been rounded off to the nearest million Australian dollars, unless stated otherwise.
Contents1. Executive remuneration 112. Remuneration tables 183. Remuneration and company performance 264. Contracts 275. Non-executive director remuneration 306. Statement on transfer of related party information 31
IntroductionThis remuneration report provides details of AMP’s remuneration policies and practices and explains how they are linked to company performance. The report also details the remuneration arrangements for former Chief Executive Offi cer (CEO), Andrew Mohl, nominated executives and the non-executive directors of AMP Limited. This group includes the key management personnel for the purposes of AASB 124 Related Party Disclosures.
The former CEO and nominated executives comprise the fi ve ‘company executives’ and fi ve ‘relevant group executives’ receiving the highest remuneration during the year, as those terms are defi ned by the Corporations Act 2001 (Cth).
AMP’s Remuneration CommitteeThe Remuneration Committee is a committee of the AMP Board. The Remuneration Committee advises the board on the structure, effectiveness, integrity and legal compliance of AMP’s remuneration programs, policies and practices.
Key responsibilities include:– annually reviewing and recommending to the board the total remuneration package of the CEO– reviewing and approving the remuneration of the CEO’s direct reports– determining the terms and conditions and allocations of the long-term incentive grant, and – reviewing and approving the performance measures and total expenditure for the short-term incentive plan.
Members of the committee are non-executive directors Meredith Hellicar (Chairman), Peter Mason, David Clarke and John Palmer (appointed 13 February 2008). The committee appoints independent external remuneration consultants to provide advice and market-related information to the committee as required. Current terms of reference for the Remuneration Committee are available on the AMP website: www.amp.com.au
Signifi cant changes In August 2007, the AMP Board announced that it had mutually agreed with Andrew Mohl that he would leave AMP on 31 December 2007, following over fi ve years as CEO. In September, the board appointed Craig Dunn to take over as CEO from 1 January 2008.
Peter Hodgett, General Manager, Human Resources and Strategy, left AMP on 31 December 2007. His role was restructured following the announcement in December 2007 of the sale of Cobalt/Gordian. Jonathan Deane was appointed General Manager, Group Strategy, effective 1 January 2008. On 1 February 2008, AMP announced that David Cohen, General Counsel, intended to leave AMP. The timing of his departure had not been fi nalised at the signing of this report.
In July 2007, John Palmer was appointed to the AMP Board. His biography is outlined on page 6. On 31 October 2007, John Astbury retired from the AMP Board. On 4 December 2007, Brian Clark was appointed to the AMP Board, effective 1 January 2008. His biography is outlined on page 4.
10 AMP ANNUAL REPORT 2007
Remuneration report Directors’ report continued

1. Executive remuneration
1.1 CEO and nominated executivesThe remuneration for the following executives is covered in this report:
CEO and direct reportsName Position
Andrew Mohl Chief Executive Offi cer (left AMP on 31 December 2007)Craig Dunn Managing Director, AMP Financial Services (prior to 15 October 2007)
Chief Operating Offi cer (15 October 2007 – 31 December 2007) (Chief Executive Offi cer from 1 January 2008)
Stephen Dunne Managing Director, AMP Capital InvestorsPaul Leaming Chief Financial Offi cerPeter Hodgett General Manager, Human Resources and Strategy (left AMP on 31 December 2007)David Cohen General CounselCraig Meller Director, Product Manufacturing (prior to 15 October 2007)
Managing Director, AMP Financial Services (appointed 15 October 2007)Lee Barnett Chief Information Offi cerMatthew Percival General Manager, Public Affairs
Other executives
Philip Garling Global Head of Infrastructure, AMP Capital Investors (reports to Stephen Dunne, Managing Director, AMP Capital Investors)
1.2 PhilosophyThe AMP Board’s approach to executive remuneration is to align remuneration with the creation of value for AMP shareholders. AMP’s remuneration is market competitive and aims to attract, retain and motivate high calibre employees who contribute to the success of AMP’s business.
AMP pays for performance. All executives have a signifi cant component of their remuneration at risk. Specifi c details about these components are listed below.
1.3 Remuneration structureDuring 2007, executive remuneration comprised four key components:
Fixed 1. Base salary, including salary sacrifi ce benefi ts and applicable Fringe Benefi ts Tax
2. Superannuation on base salary
At risk 3. Short-term incentives (STI) and superannuation on STI
4. Long-term incentives (LTI)
Base salary An executive’s salary is determined according to their level of responsibility, importance to the business and market competitiveness. Base salaries are fi xed payments and are reviewed (but not necessarily increased) each year taking into account the appropriate market-based salary for the role and individual.
The base salary is targeted around the median market rate. This means that AMP is ranked broadly in the middle of comparable companies for executive base salaries. Total remuneration above the market median can be achieved through AMP’s short- and long-term incentives, which reward high levels of performance.
Superannuation Executives, with the exception of Andrew Mohl and Craig Meller, received superannuation entitlements equal to 10.5 per cent of their base salary and their short-term incentive payment. Andrew Mohl received superannuation contributions equal to nine per cent of the superannuation maximum contribution base.
Similarly, Craig Meller, on appointment to his new role as Managing Director, AMP Financial Services, received entitlements equal to nine per cent of the superannuation maximum entitlements base. Prior to this he received superannuation entitlements equal to10.5 per cent of his base salary and short-term incentive payment.
Executives may choose to increase the proportion of their remuneration taken as superannuation, subject to legislative guidelines.
AMP ANNUAL REPORT 2007 11
Performance measure How it is measured Link to strategy
Financial measures 70% Underlying return on equity Underlying profi t of the business after tax, divided by the shareholder equity invested in the company
To achieve:– A return on equity in the
top 10% of its peer group (the Top 50 Industrials in the S&P/ASX100 Index)
– A target of doubling the value of an investment in AMP over a fi ve-year period
– AMP’s position in the top 25% of the Top 50 Industrials in the S&P/ASX100 Index for total shareholder returns
Growth in AMP’s value Increase in value of AMP after also taking into account dividends paid and capital returned to shareholders
Total operating earnings Profi ts earned by AMP’s operating businesses, minus corporate costs
Cost to income ratio Controllable costs divided by gross margin (being total operating earnings and underlying investment income before tax plus controllable costs)
Investment performance Percentage of assets under management which met or exceeded their benchmarks and the value added to the AMP Life No. 1 Fund
Qualitative measures
30% Market and competitive positioning
Position in a range of industry surveys covering product and services areas such as superannuation, risk, pensions and investments
– To increase market share in our core businesses of superannuation, retirement and individual risk insurance in Australia by developing and delivering market competitive products, services and platforms
– To be acknowledged as a high performing company from the perspective of our different stakeholders
Progress in developing key stakeholder relationships, including customers, planners, regulatory bodies and employees, to support long-term business objectives
Stakeholder feedback from a range of surveys and research studies including:− employee culture and climate
surveys− brand tracking− qualitative stakeholder
research
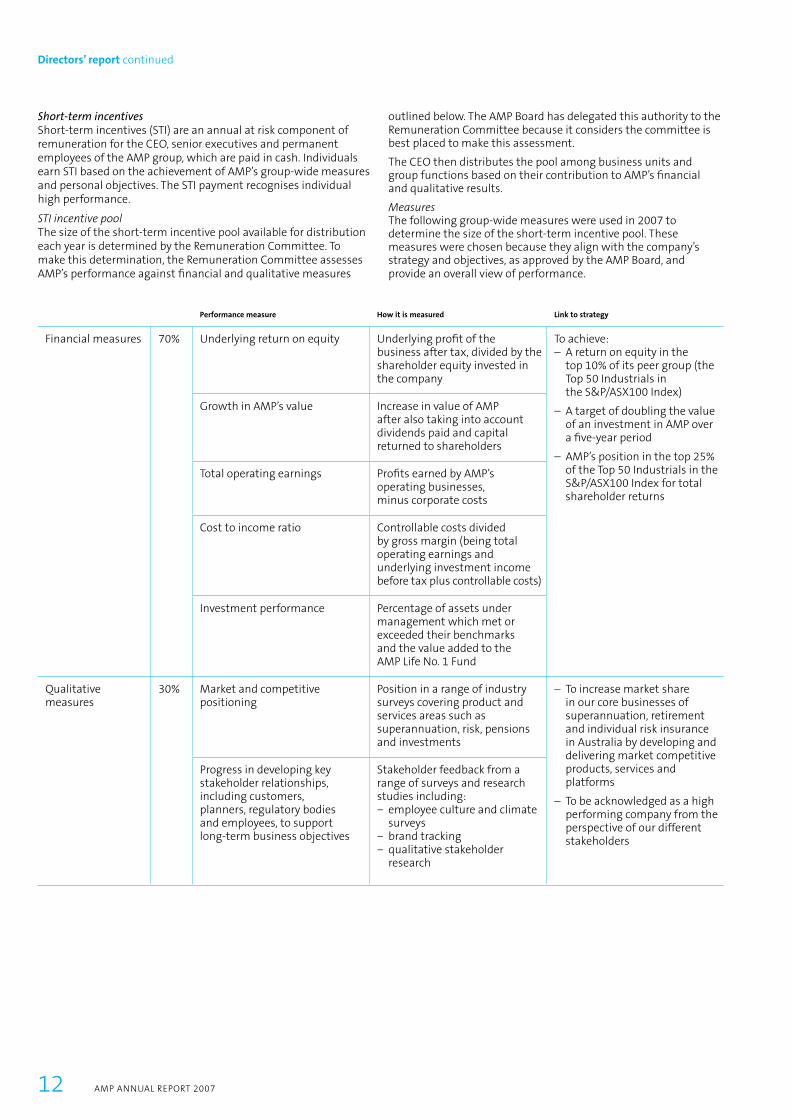
Short-term incentivesShort-term incentives (STI) are an annual at risk component of remuneration for the CEO, senior executives and permanent employees of the AMP group, which are paid in cash. Individuals earn STI based on the achievement of AMP’s group-wide measures and personal objectives. The STI payment recognises individual high performance.
STI incentive poolThe size of the short-term incentive pool available for distribution each year is determined by the Remuneration Committee. To make this determination, the Remuneration Committee assesses AMP’s performance against fi nancial and qualitative measures
outlined below. The AMP Board has delegated this authority to the Remuneration Committee because it considers the committee is best placed to make this assessment.
The CEO then distributes the pool among business units and group functions based on their contribution to AMP’s fi nancial and qualitative results.
MeasuresThe following group-wide measures were used in 2007 to determine the size of the short-term incentive pool. These measures were chosen because they align with the company’s strategy and objectives, as approved by the AMP Board, and provide an overall view of performance.
12 AMP ANNUAL REPORT 2007
Directors’ report continued
Individual STI objectivesIndividual performance objectives, with both fi nancial and qualitative measures, are set at the start of each year. These measures are chosen because they align with the objectives of the AMP group and relevant business units and functions.
Financial measures: An executive’s fi nancial measures may include some of the group-wide measures described above, as appropriate for the executive’s role, as well as business-unit or function-specifi c measures.
Qualitative measures: Some qualitative measures will be common to all senior executive roles, for example leadership, culture, risk and compliance. In addition, executives will have measures that are specifi c to their business unit or function. Examples of qualitative measures for the CEO in 2007 included business operations, cultural transformation, growth strategy, personal leadership, external positioning and succession planning.
Range: The short-term incentive opportunity ranges from a maximum payment of 50 per cent of base salary for lower level executives up to a maximum of 200 per cent of base salary for the CEO, and Managing Director, AMP Capital Investors. The maximum short-term opportunity depends on the scope of the individual’s role (level, responsibility and criticality) and market considerations.
The performance of an individual is assessed by their immediate manager as they are best placed to do this. This assessment is calibrated against the performance of their peers to determine the individual’s STI payment. Bonus recommendations are then signed off by the CEO and General Manager, Human Resources, to ensure group-wide consistency and quality control. For direct reports to the CEO, the CEO makes a recommendation to the Remuneration Committee in relation to their STI payments.
The Remuneration Committee assesses the performance of the CEO against his individual objectives, as they are well placed to assess his performance. The Remuneration Committee then makes a recommendation to the AMP Board in relation to any STI payment for the CEO.
Infrastructure Targeted Incentive Plan (AMP Capital Investors)The Infrastructure Targeted Incentive Plan is offered to employees within the infrastructure business of AMP Capital Investors. This includes Philip Garling, Global Head of Infrastructure. The infrastructure team is responsible for identifying, acquiring and managing investments in areas such as transport, power, roads and water supply.
The objective of the Infrastructure Targeted Incentive Plan is to motivate employees to grow the infrastructure business in a profi table way, and to assist in the retention of key employees.
The plan creates a team incentive pool based on a fi xed percentage of the profi t achieved by the infrastructure business above a predetermined profi t hurdle. The profi t hurdle is set with reference to the infrastructure business plan and is chosen so as to align the
interests of employees with the performance of the business. The team incentive pool is allocated amongst team members based on each individual’s contribution to profi tability over the short, medium and long term.
The AMP Capital Remuneration Committee (ACRC), whose membership includes the CEO and Stephen Dunne, Managing Director, AMP Capital Investors, determines the profi t hurdle, assesses performance relative to the profi t hurdle, and approves all individual allocations from the team incentive pool that is generated. The AMP Board has delegated this authority to the ACRC because it considers they are best placed to make these assessments.
To provide a long-term focus for employees, and to assist in the retention of key individuals, in cases when the employee’s total annual incentive payment (that is, the sum of their Targeted Incentive Plan and STI payments) is greater than their base salary, the amount above their base salary is deferred for up to two years. If an employee leaves during the deferral period he or she generally forfeits the entitlement to this amount. In some cases, such as retirement and redundancy, deferred incentives are paid upon termination.
In order to further align the interests of employees with AMP, employees in the Infrastructure business can choose to invest their deferred amounts into AMP Capital Investors managed funds or receive the original cash value of the deferred amount at the end of the deferral period. These investments are facilitated through a full-recourse, interest-free loan provided to employees at the commencement of the deferral period. The money lent to employees is wholly invested in AMP Capital Investors products.
The amount lent to employees is equivalent to the value of their deferred incentives. If the employee remains employed with AMP at the end of the deferral period, the proceeds from the payment of their deferred incentives are used to repay the loan. If the employee resigns from AMP during the deferral period, the employee retains their units in the managed funds but is required to repay the loan amount in full.
Long-term incentivesLong-term incentives (LTI) are the second at risk component of remuneration. LTI are primarily delivered in the form of performance rights and restricted shares.
In 2006, AMP introduced a policy as part of LTI participation that executives must not enter into any hedging arrangement in relation to any vested or unvested shares, options or performance rights. Breaches of this policy may lead to forfeiture of the relevant long-term incentives.
Immediately prior to the introduction of this policy, all performance rights holders were required to sign a declaration stating they had not previously engaged in hedging in relation to any vested or unvested shares, options or performance rights.
AMP ANNUAL REPORT 2007 13
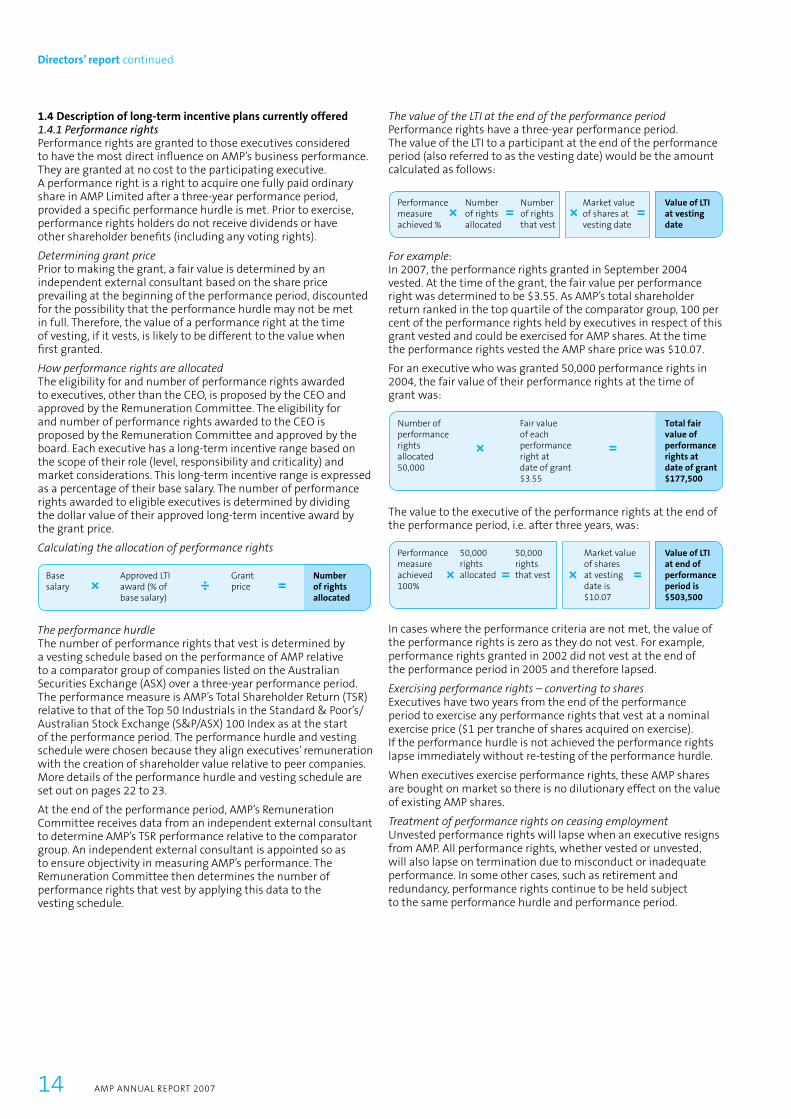
The value of the LTI at the end of the performance periodPerformance rights have a three-year performance period. The value of the LTI to a participant at the end of the performance period (also referred to as the vesting date) would be the amount calculated as follows:
For example:In 2007, the performance rights granted in September 2004 vested. At the time of the grant, the fair value per performance right was determined to be $3.55. As AMP’s total shareholder return ranked in the top quartile of the comparator group, 100 per cent of the performance rights held by executives in respect of this grant vested and could be exercised for AMP shares. At the time the performance rights vested the AMP share price was $10.07.
For an executive who was granted 50,000 performance rights in 2004, the fair value of their performance rights at the time of grant was:
The value to the executive of the performance rights at the end of the performance period, i.e. after three years, was:
In cases where the performance criteria are not met, the value of the performance rights is zero as they do not vest. For example, performance rights granted in 2002 did not vest at the end of the performance period in 2005 and therefore lapsed.
Exercising performance rights – converting to sharesExecutives have two years from the end of the performance period to exercise any performance rights that vest at a nominal exercise price ($1 per tranche of shares acquired on exercise). If the performance hurdle is not achieved the performance rights lapse immediately without re-testing of the performance hurdle.
When executives exercise performance rights, these AMP shares are bought on market so there is no dilutionary effect on the value of existing AMP shares.
Treatment of performance rights on ceasing employmentUnvested performance rights will lapse when an executive resigns from AMP. All performance rights, whether vested or unvested, will also lapse on termination due to misconduct or inadequate performance. In some other cases, such as retirement and redundancy, performance rights continue to be held subject to the same performance hurdle and performance period.
1.4 Description of long-term incentive plans currently offered1.4.1 Performance rightsPerformance rights are granted to those executives considered to have the most direct infl uence on AMP’s business performance. They are granted at no cost to the participating executive. A performance right is a right to acquire one fully paid ordinary share in AMP Limited after a three-year performance period, provided a specifi c performance hurdle is met. Prior to exercise, performance rights holders do not receive dividends or have other shareholder benefi ts (including any voting rights).
Determining grant price Prior to making the grant, a fair value is determined by an independent external consultant based on the share price prevailing at the beginning of the performance period, discounted for the possibility that the performance hurdle may not be met in full. Therefore, the value of a performance right at the time of vesting, if it vests, is likely to be different to the value when fi rst granted.
How performance rights are allocatedThe eligibility for and number of performance rights awarded to executives, other than the CEO, is proposed by the CEO and approved by the Remuneration Committee. The eligibility for and number of performance rights awarded to the CEO is proposed by the Remuneration Committee and approved by the board. Each executive has a long-term incentive range based on the scope of their role (level, responsibility and criticality) and market considerations. This long-term incentive range is expressed as a percentage of their base salary. The number of performance rights awarded to eligible executives is determined by dividing the dollar value of their approved long-term incentive award by the grant price.
Calculating the allocation of performance rights
The performance hurdleThe number of performance rights that vest is determined by a vesting schedule based on the performance of AMP relative to a comparator group of companies listed on the Australian Securities Exchange (ASX) over a three-year performance period. The performance measure is AMP’s Total Shareholder Return (TSR) relative to that of the Top 50 Industrials in the Standard & Poor’s/Australian Stock Exchange (S&P/ASX) 100 Index as at the start of the performance period. The performance hurdle and vesting schedule were chosen because they align executives’ remuneration with the creation of shareholder value relative to peer companies. More details of the performance hurdle and vesting schedule are set out on pages 22 to 23.
At the end of the performance period, AMP’s Remuneration Committee receives data from an independent external consultant to determine AMP’s TSR performance relative to the comparator group. An independent external consultant is appointed so as to ensure objectivity in measuring AMP’s performance. The Remuneration Committee then determines the number of performance rights that vest by applying this data to the vesting schedule.
14 AMP ANNUAL REPORT 2007
Directors’ report continued
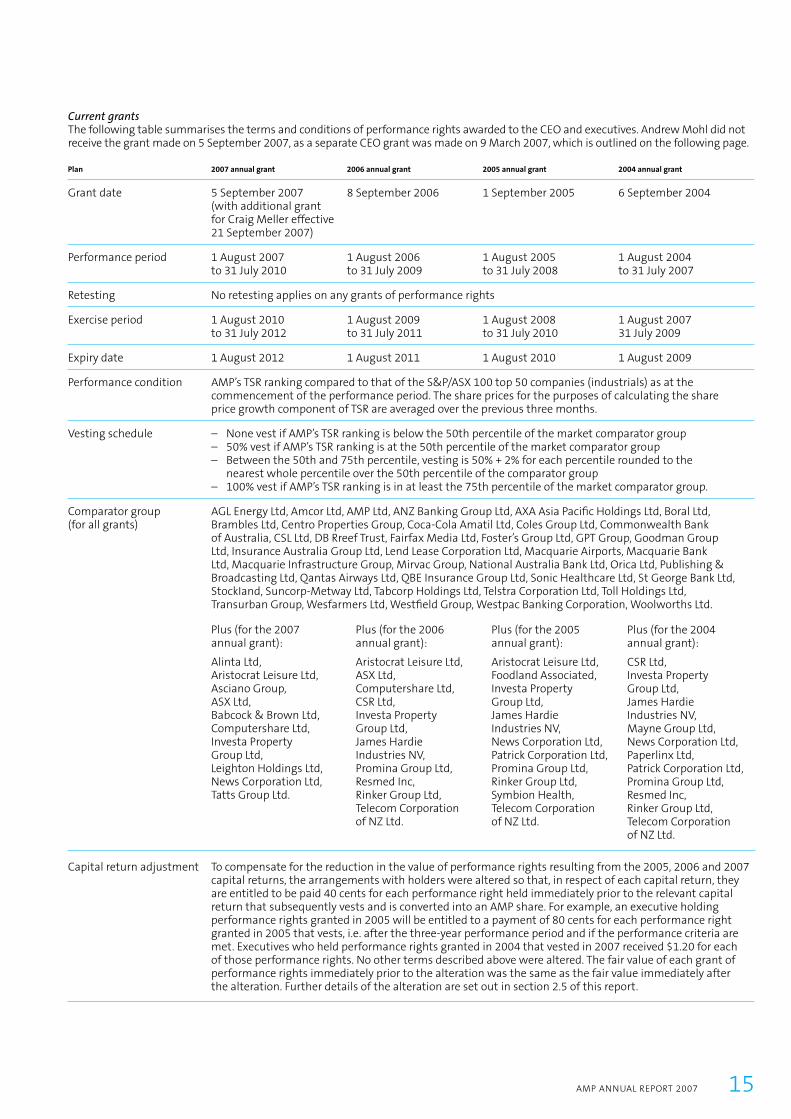
Current grantsThe following table summarises the terms and conditions of performance rights awarded to the CEO and executives. Andrew Mohl did not receive the grant made on 5 September 2007, as a separate CEO grant was made on 9 March 2007, which is outlined on the following page.
Plan 2007 annual grant 2006 annual grant 2005 annual grant 2004 annual grant
Grant date 5 September 2007 8 September 2006 1 September 2005 6 September 2004 (with additional grant for Craig Meller effective 21 September 2007)
Performance period 1 August 2007 1 August 2006 1 August 2005 1 August 2004 to 31 July 2010 to 31 July 2009 to 31 July 2008 to 31 July 2007
Retesting No retesting applies on any grants of performance rights
Exercise period 1 August 2010 1 August 2009 1 August 2008 1 August 2007 to 31 July 2012 to 31 July 2011 to 31 July 2010 31 July 2009
Expiry date 1 August 2012 1 August 2011 1 August 2010 1 August 2009
Performance condition AMP’s TSR ranking compared to that of the S&P/ASX 100 top 50 companies (industrials) as at the commencement of the performance period. The share prices for the purposes of calculating the share price growth component of TSR are averaged over the previous three months.
Vesting schedule – None vest if AMP’s TSR ranking is below the 50th percentile of the market comparator group– 50% vest if AMP’s TSR ranking is at the 50th percentile of the market comparator group– Between the 50th and 75th percentile, vesting is 50% + 2% for each percentile rounded to the
nearest whole percentile over the 50th percentile of the comparator group – 100% vest if AMP’s TSR ranking is in at least the 75th percentile of the market comparator group.
Comparator group AGL Energy Ltd, Amcor Ltd, AMP Ltd, ANZ Banking Group Ltd, AXA Asia Pacifi c Holdings Ltd, Boral Ltd, (for all grants) Brambles Ltd, Centro Properties Group, Coca-Cola Amatil Ltd, Coles Group Ltd, Commonwealth Bank
of Australia, CSL Ltd, DB Rreef Trust, Fairfax Media Ltd, Foster’s Group Ltd, GPT Group, Goodman Group Ltd, Insurance Australia Group Ltd, Lend Lease Corporation Ltd, Macquarie Airports, Macquarie Bank Ltd, Macquarie Infrastructure Group, Mirvac Group, National Australia Bank Ltd, Orica Ltd, Publishing & Broadcasting Ltd, Qantas Airways Ltd, QBE Insurance Group Ltd, Sonic Healthcare Ltd, St George Bank Ltd, StockIand, Suncorp-Metway Ltd, Tabcorp Holdings Ltd, Telstra Corporation Ltd, Toll Holdings Ltd, Transurban Group, Wesfarmers Ltd, Westfi eld Group, Westpac Banking Corporation, Woolworths Ltd.
Plus (for the 2007 annual grant):
Alinta Ltd, Aristocrat Leisure Ltd, Asciano Group, ASX Ltd, Babcock & Brown Ltd, Computershare Ltd, Investa Property Group Ltd, Leighton Holdings Ltd, News Corporation Ltd, Tatts Group Ltd.
Plus (for the 2006 annual grant):
Aristocrat Leisure Ltd, ASX Ltd, Computershare Ltd, CSR Ltd, Investa Property Group Ltd, James Hardie Industries NV, Promina Group Ltd, Resmed Inc,Rinker Group Ltd,Telecom Corporation of NZ Ltd.
Plus (for the 2005 annual grant):
Aristocrat Leisure Ltd, Foodland Associated,Investa Property Group Ltd, James Hardie Industries NV, News Corporation Ltd, Patrick Corporation Ltd, Promina Group Ltd, Rinker Group Ltd, Symbion Health, Telecom Corporation of NZ Ltd.
Plus (for the 2004 annual grant):
CSR Ltd,Investa Property Group Ltd, James Hardie Industries NV, Mayne Group Ltd, News Corporation Ltd, Paperlinx Ltd, Patrick Corporation Ltd, Promina Group Ltd, Resmed Inc, Rinker Group Ltd, Telecom Corporation of NZ Ltd.
Capital return adjustment To compensate for the reduction in the value of performance rights resulting from the 2005, 2006 and 2007 capital returns, the arrangements with holders were altered so that, in respect of each capital return, they are entitled to be paid 40 cents for each performance right held immediately prior to the relevant capital return that subsequently vests and is converted into an AMP share. For example, an executive holding performance rights granted in 2005 will be entitled to a payment of 80 cents for each performance right granted in 2005 that vests, i.e. after the three-year performance period and if the performance criteria are met. Executives who held performance rights granted in 2004 that vested in 2007 received $1.20 for each of those performance rights. No other terms described above were altered. The fair value of each grant of performance rights immediately prior to the alteration was the same as the fair value immediately after the alteration. Further details of the alteration are set out in section 2.5 of this report.
AMP ANNUAL REPORT 2007 15
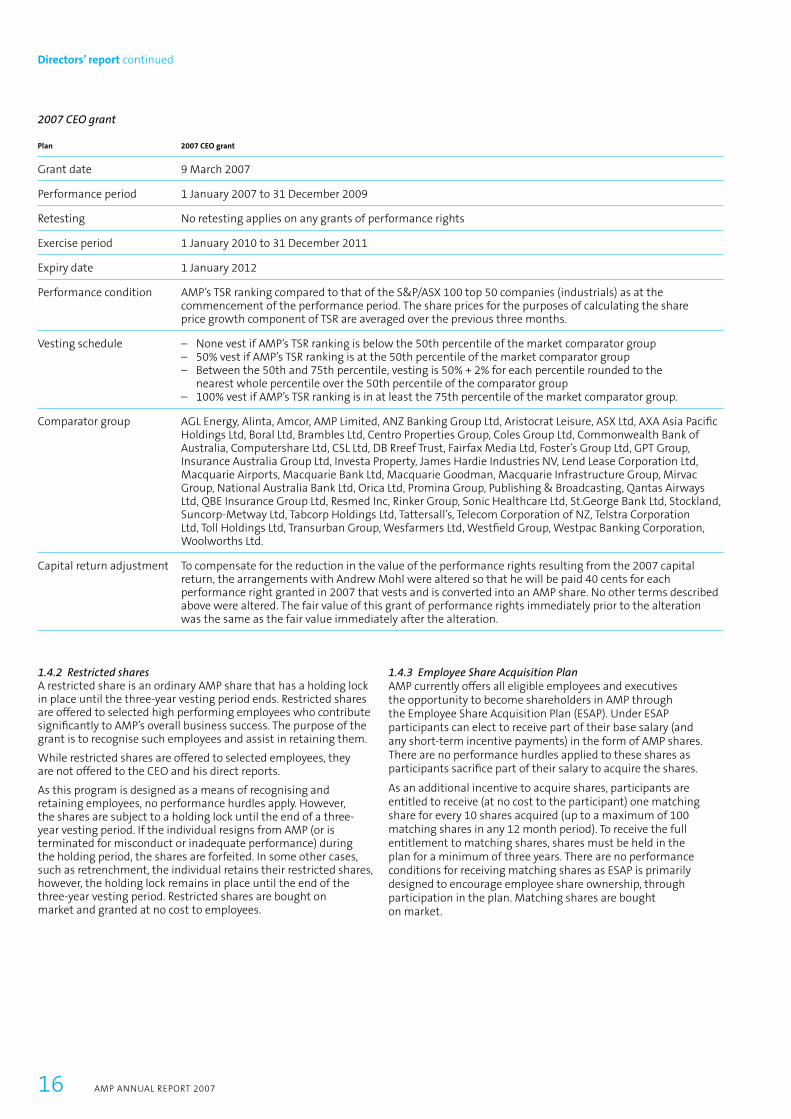
2007 CEO grant
Plan 2007 CEO grant
Grant date 9 March 2007
Performance period 1 January 2007 to 31 December 2009
Retesting No retesting applies on any grants of performance rights
Exercise period 1 January 2010 to 31 December 2011
Expiry date 1 January 2012
Performance condition AMP’s TSR ranking compared to that of the S&P/ASX 100 top 50 companies (industrials) as at the commencement of the performance period. The share prices for the purposes of calculating the share price growth component of TSR are averaged over the previous three months.
Vesting schedule – None vest if AMP’s TSR ranking is below the 50th percentile of the market comparator group – 50% vest if AMP’s TSR ranking is at the 50th percentile of the market comparator group – Between the 50th and 75th percentile, vesting is 50% + 2% for each percentile rounded to the
nearest whole percentile over the 50th percentile of the comparator group – 100% vest if AMP’s TSR ranking is in at least the 75th percentile of the market comparator group.
Comparator group AGL Energy, Alinta, Amcor, AMP Limited, ANZ Banking Group Ltd, Aristocrat Leisure, ASX Ltd, AXA Asia Pacifi c Holdings Ltd, Boral Ltd, Brambles Ltd, Centro Properties Group, Coles Group Ltd, Commonwealth Bank of Australia, Computershare Ltd, CSL Ltd, DB Rreef Trust, Fairfax Media Ltd, Foster’s Group Ltd, GPT Group, Insurance Australia Group Ltd, Investa Property, James Hardie Industries NV, Lend Lease Corporation Ltd, Macquarie Airports, Macquarie Bank Ltd, Macquarie Goodman, Macquarie Infrastructure Group, Mirvac Group, National Australia Bank Ltd, Orica Ltd, Promina Group, Publishing & Broadcasting, Qantas Airways Ltd, QBE Insurance Group Ltd, Resmed Inc, Rinker Group, Sonic Healthcare Ltd, St.George Bank Ltd, Stockland, Suncorp-Metway Ltd, Tabcorp Holdings Ltd, Tattersall’s, Telecom Corporation of NZ, Telstra Corporation Ltd, Toll Holdings Ltd, Transurban Group, Wesfarmers Ltd, Westfi eld Group, Westpac Banking Corporation, Woolworths Ltd.
Capital return adjustment To compensate for the reduction in the value of the performance rights resulting from the 2007 capital return, the arrangements with Andrew Mohl were altered so that he will be paid 40 cents for each performance right granted in 2007 that vests and is converted into an AMP share. No other terms described above were altered. The fair value of this grant of performance rights immediately prior to the alteration was the same as the fair value immediately after the alteration.
1.4.2 Restricted sharesA restricted share is an ordinary AMP share that has a holding lock in place until the three-year vesting period ends. Restricted shares are offered to selected high performing employees who contribute signifi cantly to AMP’s overall business success. The purpose of the grant is to recognise such employees and assist in retaining them.
While restricted shares are offered to selected employees, they are not offered to the CEO and his direct reports.
As this program is designed as a means of recognising and retaining employees, no performance hurdles apply. However, the shares are subject to a holding lock until the end of a three-year vesting period. If the individual resigns from AMP (or is terminated for misconduct or inadequate performance) during the holding period, the shares are forfeited. In some other cases, such as retrenchment, the individual retains their restricted shares, however, the holding lock remains in place until the end of the three-year vesting period. Restricted shares are bought on market and granted at no cost to employees.
1.4.3 Employee Share Acquisition PlanAMP currently offers all eligible employees and executives the opportunity to become shareholders in AMP through the Employee Share Acquisition Plan (ESAP). Under ESAP participants can elect to receive part of their base salary (and any short-term incentive payments) in the form of AMP shares. There are no performance hurdles applied to these shares as participants sacrifi ce part of their salary to acquire the shares.
As an additional incentive to acquire shares, participants are entitled to receive (at no cost to the participant) one matching share for every 10 shares acquired (up to a maximum of 100 matching shares in any 12 month period). To receive the full entitlement to matching shares, shares must be held in the plan for a minimum of three years. There are no performance conditions for receiving matching shares as ESAP is primarily designed to encourage employee share ownership, through participation in the plan. Matching shares are bought on market.
16 AMP ANNUAL REPORT 2007
Directors’ report continued

Participants who cease to be employed within the AMP group within the three-year holding period may lose their entitlement to some or all of their matching share entitlement, depending on the reason for leaving the company. To receive the maximum entitlement to matching shares, participants must be employed for the whole three-year period.
Impact of capital returns on matching sharesShareholders approved capital returns of 40 cents per share at the AMP Limited Annual General Meetings in 2005, 2006 and 2007.
To compensate for the reduction in the value of entitlements to matching shares resulting from the 2005, 2006 and 2007 capital returns, the arrangements with ESAP participants were altered so that, in respect of each capital return, they are entitled to be paid 40 cents for each matching share entitlement held in ESAP immediately prior to the relevant capital return that vests and is converted into an AMP share. For example, participants who held matching share entitlements under the plan immediately prior to the 2005 capital return will be paid $1.20 for each matching share that vests in 2008. The fair value of matching share entitlements immediately prior to the alteration was the same as the fair value immediately after the alteration. Further details of the alteration are set out in section 2.5 of this report.
1.4.4 AMP Capital Associates PlanThe AMP Capital Associates Plan is offered to selected AMP Capital Investors executives including Stephen Dunne, Managing Director, AMP Capital Investors and Philip Garling, Global Head of Infrastructure.
The objective of the AMP Capital Associates Plan (CAP) is to motivate and retain key executives in AMP Capital Investors by strengthening the alignment of their interests with the long-term performance of AMP Capital Investors.
Selected executives within AMP Capital Investors may participate in the AMP Capital Associates Plan. Participants in the plan use their own money to invest in deferred purchase agreements with AMP Capital Holdings Limited. Participants also have the opportunity to borrow money through AMP Bank on full commercial terms, in order to fund their investment. Each deferred purchase agreement is known as a CAP unit. CAP units are notional shares in AMP Capital Investors and allow participants to share in the performance of AMP Capital Investors through annual cash distributions on CAP units and participation in the change in capital value of CAP units. The capital value is realised on redemption of the units. Distributions are linked to a measure of the yield of AMP Capital Investors, and the capital value of CAP units is based on independent external valuations of AMP Capital Investors. There are no performance hurdles associated with the plan as participants use their own money to invest in the CAP units.
On the third anniversary of the purchase of each tranche of CAP units, a one-off bonus distribution equal to 10 per cent of the capital value of that tranche is made in cash to the participant provided that the CAP units have not been redeemed. A participant may only receive bonus distributions on those CAP units for which the aggregate purchase price paid by the participant (across all tranches) is less than or equal to $1 million. The bonus distribution is compensation for reduced liquidity as, generally, the fi rst opportunity for redemption of the investment is after three years. There are no performance conditions for receiving the bonus distribution.
A minimum holding period of three years applies before CAP units can be redeemed by continuing employees. On redemption, the capital value of the participant’s CAP unit holdings is transferred to units in selected AMP Capital unit trusts.
In the event of termination of employment with AMP, holders are required to redeem their units. In the case of resignation or termination due to misconduct or poor performance prior to the third anniversary of the purchase of the relevant CAPs, the redemption value will be equal to the lesser of the opening value of the CAPs or the most recent valuation of the CAPs. In some other cases, such as redundancy, the redemptions will be made using the most recent valuation of the CAPs.
Three tranches of CAPs purchases have been made – on 1 January 2005, 1 January 2006 and 1 January 2007. A further tranche is planned for 2008.
1.5 Description of long-term incentive plans no longer offeredExecutive Short-term Incentive ProgramWhile the Executive Short-term Incentive Program is no longer offered, it is summarised below as the CEO and some executives received matching shares when the three-year holding lock ended in March 2007.
At the time this program was offered, AMP invited selected executives to nominate up to 25 per cent of any 2002 or 2003 short-term incentive to be allocated as AMP shares. In addition, selected senior executives were required to take 30 per cent of their 2002 and 2003 short-term incentive as shares. As executives salary sacrifi ced their short-term incentive for AMP shares, no performance hurdles applied after the short-term incentive was granted.
For shares acquired on 10 March 2004, as part of the 2003 Executive Short-term Incentive Program, a three-year holding lock was imposed on these shares and executives who remained employed for three years received a full entitlement of one matching share (for no cash consideration) for each share held in the plan for three years. There were no performance criteria attached to receiving matching shares as the program was designed primarily as a retention tool. Participants who ceased employment with AMP during the three-year holding period lost their entitlement to receive some or all of their matching shares, depending on the reason their employment ceased.
Impact of capital returnsTo compensate for the reduction in the value of entitlements to matching shares resulting from the capital returns made in 2005 and 2006, arrangements with participants in the program were altered so that, in respect of each of those capital returns, they were paid 40 cents for each matching share entitlement that vested and was converted into an AMP share. For shares acquired on 10 March 2004 as part of the 2003 Executive Short-term Incentive Program, a payment of 80 cents per share was made to each eligible participant when their matching share entitlements vested on 10 March 2007. No compensation was paid for the 2007 capital return as all matching shares under this program had vested by this time. The fair value of matching share entitlements immediately prior to the alteration was the same as the fair value immediately after the alteration. Further details of the alteration are set out in section 2.5 of this report.
AMP ANNUAL REPORT 2007 17

2. Remuneration tables
This section provides the remuneration details for the Chief Executive Offi cer (CEO) and nominated executives and the non-executive directors.
CEO and nominated executives The following table shows the remuneration details for the former CEO, and nominated executives. This group includes the key management personnel for the purposes of AASB 124 Related Party Disclosures. The former CEO and nominated executives comprise the fi ve ‘company executives’ and fi ve ‘relevant group executives’ receiving the highest remuneration during the year (as those terms are defi ned by the Corporations Act 2001).
Short-term employee benefits
Post- employment
benefitsShare-based payments1
Other long-term benefits
Termination payments2
Cash salary
Short-term
incentive
Other short-
termbenefits3
Super- annuation
benefits Subtotal
Value of options and
performance rights4
Value of matching
shares and restricted
shares5
CAPs – bonus
distribution6
Deferred incentive payment7
Total before
termination payments
Cash- based
payments8
Share- based
payments9
Grand total
Executive $’000 $’000 $’000 $’000 $’000 $’000 $’000 $’000 $’000 $’000 $’000 $’000 $’000
Andrew Mohl, 2007 1,800 2,742 0 1310 4,555 2,261 41 – – 6,857 2,282 3,0519 12,1909
Chief Executive Offi cer 2006 1,682 2,720 38 12 4,452 1,593 209 – – 6,254 – – 6,254and Managing Director(left AMP on 31 Dec 2007)
Craig Dunn,11 2007 879 1,155 0 214 2,248 726 12 – – 2,986 – – 2,986Chief Operating Offi cer 2006 849 1,225 7 218 2,299 558 71 – – 2,928 – – 2,928(appointed CEO & Managing Director on 1 Jan 2008)
Stephen Dunne, 2007 698 1,080 1 187 1,966 452 – 83 – 2,501 – – 2,501Managing Director, 2006 609 992 7 168 1,776 317 – 42 – 2,135 – – 2,135AMP Capital Investors
Paul Leaming, 2007 782 900 0 177 1,859 528 9 – – 2,396 – – 2,396Chief Financial Offi cer 2006 709 864 6 165 1,744 461 54 – – 2,259 – – 2,259
Peter Hodgett, 2007 574 647 0 128 1,349 399 6 – – 1,754 1,465 8719 4,0909
General Manager, 2006 557 684 1 130 1,372 349 38 – – 1,759 – – 1,759Human Resources & Strategy(left AMP on 31 Dec 2007)
David Cohen, 2007 573 653 0 129 1,355 390 8 – – 1,753 – – 1,753General Counsel 2006 536 660 7 126 1,329 343 44 – – 1,716 – – 1,716
Craig Meller,12 2007 613 659 0 87 1,359 354 – – – 1,713 – – 1,713Managing Director, 2006 522 618 – 120 1,260 267 35 – – 1,562 – – 1,562AMP Financial Services
Lee Barnett, 2007 550 641 0 125 1,316 320 – – – 1,636 – – 1,636Chief Information Offi cer 2006 471 576 – 110 1,157 225 – – – 1,382 – – 1,382
Matthew Percival, 2007 454 512 0 101 1,067 324 6 – – 1,397 – – 1,397General Manager, 2006 446 540 7 104 1,097 272 33 – – 1,402 – – 1,402Public Affairs
Philip Garling,13 2007 406 410 – 73 889 – – 44 1,577 2,510 – – 2,510Global Head 2006 384 390 – 72 846 – – 9 635 1,490 – – 1,490of Infrastructure, AMP Capital Investors
2007 Total 7,329 9,399 1 1,234 17,963 5,754 82 127 1,577 25,503 3,747 3,922 33,172
2006 Total 6,765 9,269 73 1,225 17,332 4,385 484 51 635 22,887 – – 22,887
2006 Total14 5,859 8,261 73 1,032 15,225 4,118 449 42 0 19,834 – – 19,834for CEO and executives disclosed in 2006
18 AMP ANNUAL REPORT 2007
Directors’ report continued

Footnote: 1 All share-based payments are equity settled as per AASB 2. 2 Andrew Mohl left AMP on 31 December 2007. Details about his termination payment are outlined on page 20. Peter Hodgett left AMP on 31 December 2007.3 As per contractual arrangements, other short-term benefits consisted of legal fees, taxation and financial planning advice, and employee referral bonus. 4 The fair value of options and performance rights has been calculated as at the grant date by external consultants using Monte Carlo simulation techniques.
Fair value has been discounted for the probability of not meeting the performance hurdles. The value of the award made in any year is amortised over the vesting period.
5 The fair value of restricted shares has been determined using the share price of AMP ordinary shares on the grant date. Under the Employee Share Acquisition Plan (ESAP), and the Executive Short-term Incentive Program, participating employees may receive matching shares at the end of the specified vesting period. The employee has no right to dividends on these matching shares until after they are granted. Each matching share has been valued by external consultants as the face value of an AMP ordinary share at grant date less the present value of the expected dividends (not received). The value of the award made in any year is amortised over the vesting period.
6 The fair value of the bonus distribution in the AMP Capital Associates Plan has been determined as being 10% of the capital value of each tranche of CAP units as at the most recent valuation date. The value of the bonus distribution is amortised over the three-year vesting period.
7 Philip Garling participates in both the AMP Short-term Incentive scheme and the Infrastructure Targeted Incentive Plan. Philip’s reported values in both the ‘short-term incentive’ and ‘deferred incentive payments’ columns include amounts from these two schemes. Details about the Infrastructure Targeted Incentive Plan are outlined on page 13.
8 Cash-based payments comprise contractual payments such as leave entitlements.9 This represents the portion of performance rights granted in 2005, 2006 and 2007 that would normally have been amortised in future years. While the rights
remain subject to the usual vesting period and performance hurdle restrictions, AMP is required under the accounting regulations to expense all future liabilities at the time of departure.
10 Andrew Mohl received superannuation contributions equal to 9% of the superannuation maximum contribution base, this being the minimum level of employer contributions required in accordance with superannuation law.
11 Craig Dunn was appointed to the role of Chief Operating Officer on 15 October 2007. Prior to his appointment to that role he performed the role of Managing Director, AMP Financial Services, until 14 October 2007.
12 Craig Meller was appointed Managing Director, AMP Financial Services, on 15 October 2007. Prior to this appointment he performed the role of Director, Product Manufacturing, until 14 October 2007. Following his appointment to the new role, he received superannuation contributions equal to 9% of the superannuation maximum contribution base. Prior to this appointment, he received superannuation contributions equal to 10.5% of his base salary and short-term incentive payments.
13 Philip Garling is not a direct report to the CEO. However, he is included as one of the five ‘relevant group executives’ receiving the highest remuneration for 2007.14 In line with disclosure requirements, the totals for year ended 31 December 2006 relate to individuals disclosed in the 2006 annual report and so do not
equal the sum of amounts disclosed for individuals specified for the 2007 annual report.
Non-executive directorsThe table below shows the remuneration details for the non-executive directors of AMP Limited for 2007. For further details about the remuneration for non-executive directors go to section 5 on page 30. Director Brian Clark is not included as he was appointed to the AMP Limited Board on 1 January 2008.
Short-term benefi ts Post-employment benefi ts
AMP Limited Board and
committee fees1
$’000
Fees for other group boards1
$’000
Other short-term benefi ts
$’000
Additional board duties
$’000
Non-monetary benefi ts
$’000
Super- annuation
$’000
Termination benefi ts
$’000Total
$’000
Peter Mason, 2007 515 – – – – 46 – 561Chairman 2006 480 – – – – 43 – 523
John Astbury2 2007 129 64 5 – – 18 – 216 2006 145 80 6 – – 21 – 252
David Clarke 2007 152 15 6 – – 16 – 189 2006 143 60 6 – – 19 – 228
Richard Grellman 2007 182 170 6 – – 36 – 394 2006 173 165 6 – – 31 – 375
Meredith Hellicar 2007 165 1603 6 – – 30 – 361 2006 155 91 6 – – 23 – 275
John Palmer4 2007 61 111 3 – – 13 – 188 2006 – 106 – – – 30 – 136
Nora Scheinkestel 2007 170 66 6 – – 22 – 264 2006 160 60 6 – – 20 – 246
Total for 2007 1,374 586 32 – – 181 – 2,173
Total for 2006 for non-executive 1,256 562 30 – – 187 – 2,035directors disclosed above
2006 total for non-executive 1,256 456 30 – – 157 – 1,899directors disclosed in 20065
Footnote:1 Details of the non-executive directors’ committee memberships and directorships of subsidiary boards are set out in the following table.2 John Astbury retired from the AMP Limited Board on 31 October 2007.3 Meredith Hellicar was appointed Chairman, AMP Life Limited, on 1 October 2006.4 John Palmer was appointed to the AMP Limited Board on 24 July 2007.5 In line with disclosure requirements, the totals for year ended 31 December 2006 relate to individuals disclosed in the 2006 annual report and so do not
equal the sum of amounts disclosed for individuals specified for the 2007 annual report.
AMP ANNUAL REPORT 2007 19

Board, committee and subsidiary membership during 2007
AMP Limited
BoardAudit
CommitteeNomination Committee
Remuneration Committee
AMP Life Board
AMP Life Audit
Committee
Gordian RunOff
Limited
Gordian RunOff Audit
Committee
AMP CapitalInvestors
Board
AMP Capital Audit
Committee
AMP Bank
Board
Peter Mason
John Astbury1
David Clarke2
Richard Grellman
Meredith Hellicar
John Palmer
Nora Scheinkestel
Footnote:1 John Astbury retired from the board and relevant committees on 31 October 2007.2 David Clarke resigned from the AMP Capital Investors Board and the AMP Capital Audit Committee on 23 March 2007.
Indicates chairman of a board or committee. Indicates director or member of a board or committee.
2.1 Andrew Mohl’s departure In August 2007, the AMP Board announced that it had mutually agreed with Andrew Mohl that he would leave AMP on 31 December 2007, following over fi ve years as CEO. In line with that agreement, Andrew received, or will receive, the following payments:– Contractual payment of one year’s annual salary of $1.8 million paid in two equal payments. The fi rst payment was made on
27 December 2007. The second payment will be made in July 2008 provided the restraint of trade period of six months is met.– Statutory entitlements in respect of unused annual leave and long service leave of $453,633 were paid on 27 December 2007.
In accordance with the terms and conditions under which they were granted, Andrew Mohl will continue to hold the performance rights granted to him in 2005, 2006 and 2007 subject to the original performance period and performance hurdles (refer to page 14). At the time of grant, the fair values of these grants were $1,559,000, $1,959,000 and $2,570,000 respectively, while the performance periods for these grants end on 31 July 2008, 31 July 2009 and 31 December 2009, respectively.
In accordance with the terms and conditions under which they were granted, all options held by Andrew Mohl lapsed on 30 January 2008.
2.2 Remuneration mixThe table below shows the percentage of total remuneration for 2007 that is related to performance for the former CEO and nominated executives. Fixed pay and benefi ts account for 26 per cent of the total remuneration (excluding termination benefi ts) for the CEO and 18 per cent to 37 per cent of the total remuneration (excluding termination benefi ts) for nominated executives.
At risk
Performance based Service based
Fixed pay and benefi ts1 STI2
Performance rights and
options3
Matching and restricted
shares
CAPS –bonus
distribution Total
Andrew Mohl, Chief Executive Offi cer (left AMP on 31 December 2007) 26% 40% 33% 1% – 100%
Craig Dunn, Chief Operating Offi cer (appointed CEO on 1 January 2008) 33% 43% 24% – – 100%
Stephen Dunne, Managing Director, AMP Capital Investors 32% 48% 18% – 2% 100%
Paul Leaming, Chief Financial Offi cer 36% 42% 22% – – 100%
Peter Hodgett, General Manager, Human Resources and Strategy(left AMP on 31 December 2007) 36% 41% 23% – – 100%
David Cohen, General Counsel 37% 41% 22% – – 100%
Craig Meller, Managing Director, AMP Financial Services (appointed 15 October 2007) 39% 40% 21% – – 100%
Lee Barnett, Chief Information Offi cer 37% 43% 20% – – 100%
Matthew Percival, General Manager, Public Affairs 37% 40% 23% – – 100%
Philip Garling, Global Head of Infrastructure, AMP Capital Investors 18% 80% – – 2% 100%
Footnote:1 Comprises base salary, superannuation on base salary and non-monetary benefits, excluding termination payments. The figures in this column do not
include termination payments. If termination payments were included the proportion of Andrew Mohl’s remuneration that is related to performance is 67%, while the corresponding figure for Peter Hodgett is 50%.
2 Includes superannuation paid on STI, and the Infrastructure Targeted Incentive Plan payments for Philip Garling.3 For the purposes of executive remuneration disclosure under the Corporations Act 2001, performance rights are options.
20 AMP ANNUAL REPORT 2007
Directors’ report continued
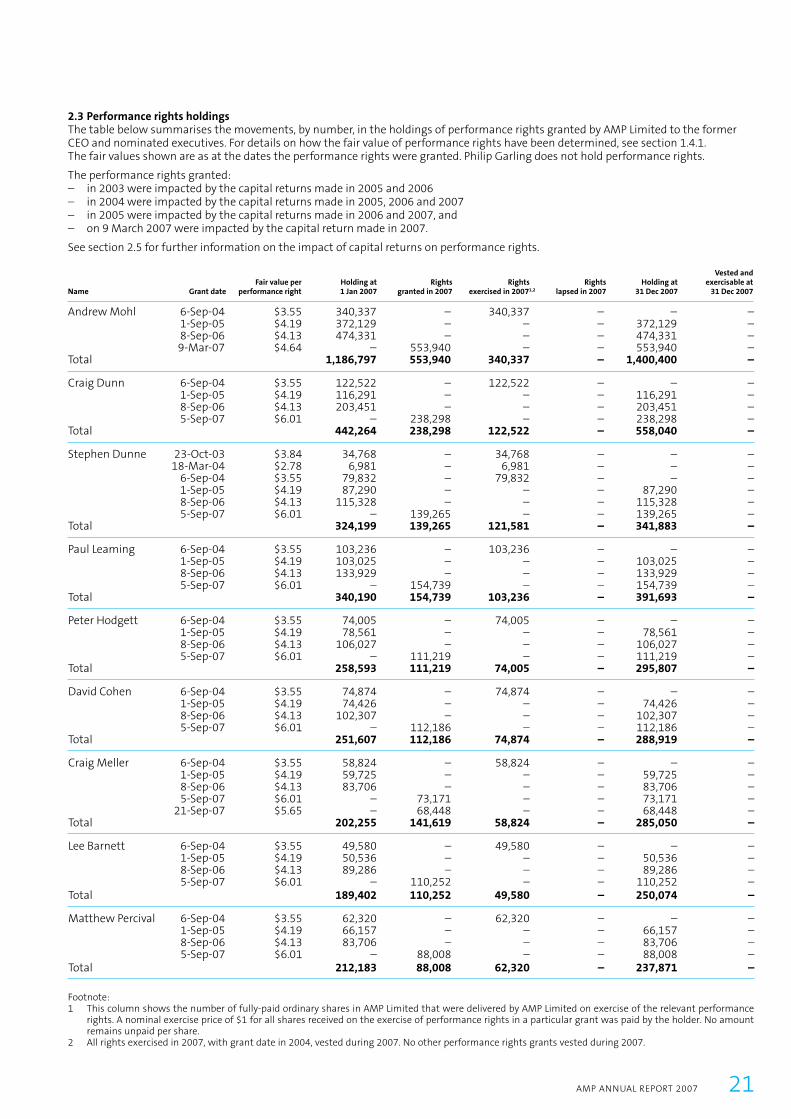
2.3 Performance rights holdings The table below summarises the movements, by number, in the holdings of performance rights granted by AMP Limited to the former CEO and nominated executives. For details on how the fair value of performance rights have been determined, see section 1.4.1. The fair values shown are as at the dates the performance rights were granted. Philip Garling does not hold performance rights.
The performance rights granted:– in 2003 were impacted by the capital returns made in 2005 and 2006– in 2004 were impacted by the capital returns made in 2005, 2006 and 2007– in 2005 were impacted by the capital returns made in 2006 and 2007, and– on 9 March 2007 were impacted by the capital return made in 2007.
See section 2.5 for further information on the impact of capital returns on performance rights.
Name Grant dateFair value per
performance rightHolding at 1 Jan 2007
Rights granted in 2007
Rightsexercised in 20071,2
Rights lapsed in 2007
Holding at 31 Dec 2007
Vested and exercisable at
31 Dec 2007
Andrew Mohl 6-Sep-04 $3.55 340,337 – 340,337 – – – 1-Sep-05 $4.19 372,129 – – – 372,129 – 8-Sep-06 $4.13 474,331 – – – 474,331 – 9-Mar-07 $4.64 – 553,940 – – 553,940 –Total 1,186,797 553,940 340,337 – 1,400,400 –
Craig Dunn 6-Sep-04 $3.55 122,522 – 122,522 – – – 1-Sep-05 $4.19 116,291 – – – 116,291 – 8-Sep-06 $4.13 203,451 – – – 203,451 – 5-Sep-07 $6.01 – 238,298 – – 238,298 –Total 442,264 238,298 122,522 – 558,040 –
Stephen Dunne 23-Oct-03 $3.84 34,768 – 34,768 – – – 18-Mar-04 $2.78 6,981 – 6,981 – – – 6-Sep-04 $3.55 79,832 – 79,832 – – – 1-Sep-05 $4.19 87,290 – – – 87,290 – 8-Sep-06 $4.13 115,328 – – – 115,328 – 5-Sep-07 $6.01 – 139,265 – – 139,265 –Total 324,199 139,265 121,581 – 341,883 –
Paul Leaming 6-Sep-04 $3.55 103,236 – 103,236 – – – 1-Sep-05 $4.19 103,025 – – – 103,025 – 8-Sep-06 $4.13 133,929 – – – 133,929 – 5-Sep-07 $6.01 – 154,739 – – 154,739 –Total 340,190 154,739 103,236 – 391,693 –
Peter Hodgett 6-Sep-04 $3.55 74,005 – 74,005 – – – 1-Sep-05 $4.19 78,561 – – – 78,561 – 8-Sep-06 $4.13 106,027 – – – 106,027 – 5-Sep-07 $6.01 – 111,219 – – 111,219 – Total 258,593 111,219 74,005 – 295,807 –
David Cohen 6-Sep-04 $3.55 74,874 – 74,874 – – – 1-Sep-05 $4.19 74,426 – – – 74,426 – 8-Sep-06 $4.13 102,307 – – – 102,307 – 5-Sep-07 $6.01 – 112,186 – – 112,186 –Total 251,607 112,186 74,874 – 288,919 –
Craig Meller 6-Sep-04 $3.55 58,824 – 58,824 – – – 1-Sep-05 $4.19 59,725 – – – 59,725 – 8-Sep-06 $4.13 83,706 – – – 83,706 – 5-Sep-07 $6.01 – 73,171 – – 73,171 – 21-Sep-07 $5.65 – 68,448 – – 68,448 –Total 202,255 141,619 58,824 – 285,050 –
Lee Barnett 6-Sep-04 $3.55 49,580 – 49,580 – – – 1-Sep-05 $4.19 50,536 – – – 50,536 – 8-Sep-06 $4.13 89,286 – – – 89,286 – 5-Sep-07 $6.01 – 110,252 – – 110,252 –Total 189,402 110,252 49,580 – 250,074 –
Matthew Percival 6-Sep-04 $3.55 62,320 – 62,320 – – – 1-Sep-05 $4.19 66,157 – – – 66,157 – 8-Sep-06 $4.13 83,706 – – – 83,706 – 5-Sep-07 $6.01 – 88,008 – – 88,008 –Total 212,183 88,008 62,320 – 237,871 –
Footnote:1 This column shows the number of fully-paid ordinary shares in AMP Limited that were delivered by AMP Limited on exercise of the relevant performance
rights. A nominal exercise price of $1 for all shares received on the exercise of performance rights in a particular grant was paid by the holder. No amount remains unpaid per share.
2 All rights exercised in 2007, with grant date in 2004, vested during 2007. No other performance rights grants vested during 2007.
AMP ANNUAL REPORT 2007 21
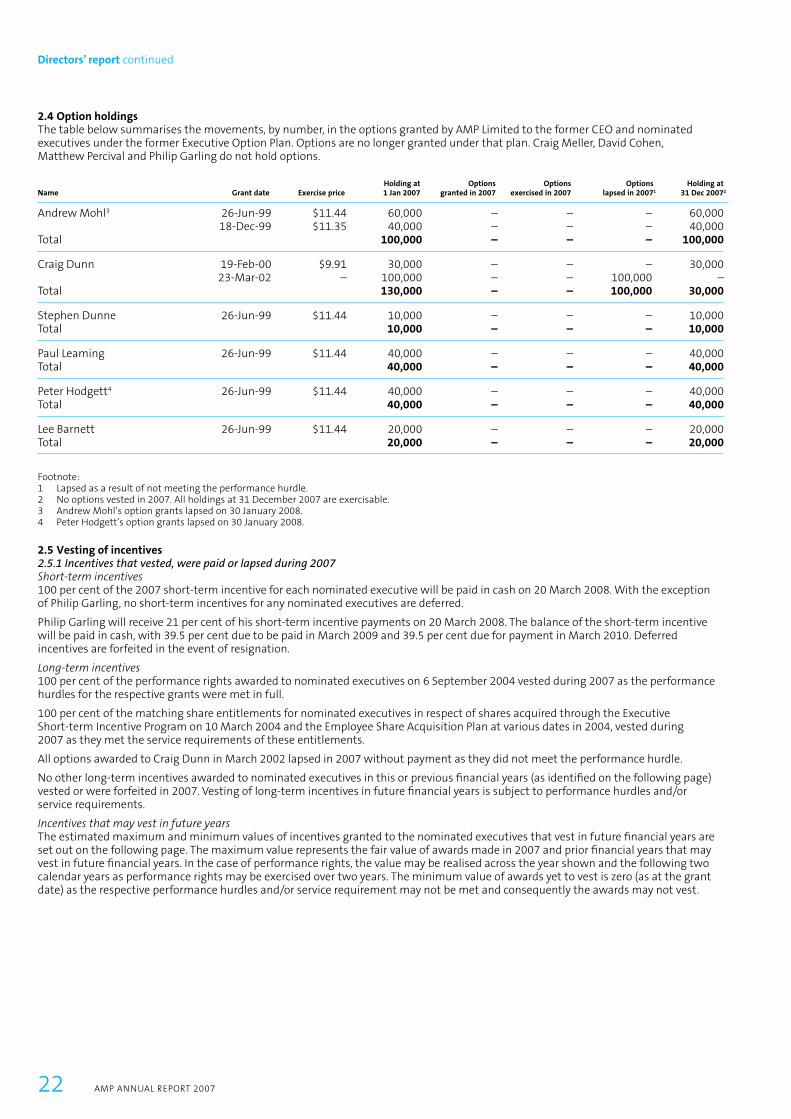
2.4 Option holdingsThe table below summarises the movements, by number, in the options granted by AMP Limited to the former CEO and nominated executives under the former Executive Option Plan. Options are no longer granted under that plan. Craig Meller, David Cohen, Matthew Percival and Philip Garling do not hold options.
Name Grant date Exercise priceHolding at 1 Jan 2007
Options granted in 2007
Options exercised in 2007
Optionslapsed in 20071
Holding at31 Dec 20072
Andrew Mohl3 26-Jun-99 $11.44 60,000 – – – 60,000 18-Dec-99 $11.35 40,000 – – – 40,000 Total 100,000 – – – 100,000
Craig Dunn 19-Feb-00 $9.91 30,000 – – – 30,000 23-Mar-02 – 100,000 – – 100,000 –Total 130,000 – – 100,000 30,000
Stephen Dunne 26-Jun-99 $11.44 10,000 – – – 10,000 Total 10,000 – – – 10,000
Paul Leaming 26-Jun-99 $11.44 40,000 – – – 40,000 Total 40,000 – – – 40,000
Peter Hodgett4 26-Jun-99 $11.44 40,000 – – – 40,000 Total 40,000 – – – 40,000
Lee Barnett 26-Jun-99 $11.44 20,000 – – – 20,000 Total 20,000 – – – 20,000
Footnote:1 Lapsed as a result of not meeting the performance hurdle. 2 No options vested in 2007. All holdings at 31 December 2007 are exercisable.3 Andrew Mohl’s option grants lapsed on 30 January 2008.4 Peter Hodgett’s option grants lapsed on 30 January 2008.
2.5 Vesting of incentives 2.5.1 Incentives that vested, were paid or lapsed during 2007Short-term incentives 100 per cent of the 2007 short-term incentive for each nominated executive will be paid in cash on 20 March 2008. With the exception of Philip Garling, no short-term incentives for any nominated executives are deferred.
Philip Garling will receive 21 per cent of his short-term incentive payments on 20 March 2008. The balance of the short-term incentive will be paid in cash, with 39.5 per cent due to be paid in March 2009 and 39.5 per cent due for payment in March 2010. Deferred incentives are forfeited in the event of resignation.
Long-term incentives 100 per cent of the performance rights awarded to nominated executives on 6 September 2004 vested during 2007 as the performance hurdles for the respective grants were met in full.
100 per cent of the matching share entitlements for nominated executives in respect of shares acquired through the Executive Short-term Incentive Program on 10 March 2004 and the Employee Share Acquisition Plan at various dates in 2004, vested during 2007 as they met the service requirements of these entitlements.
All options awarded to Craig Dunn in March 2002 lapsed in 2007 without payment as they did not meet the performance hurdle.
No other long-term incentives awarded to nominated executives in this or previous fi nancial years (as identifi ed on the following page) vested or were forfeited in 2007. Vesting of long-term incentives in future fi nancial years is subject to performance hurdles and/or service requirements.
Incentives that may vest in future years The estimated maximum and minimum values of incentives granted to the nominated executives that vest in future fi nancial years are set out on the following page. The maximum value represents the fair value of awards made in 2007 and prior fi nancial years that may vest in future fi nancial years. In the case of performance rights, the value may be realised across the year shown and the following two calendar years as performance rights may be exercised over two years. The minimum value of awards yet to vest is zero (as at the grant date) as the respective performance hurdles and/or service requirement may not be met and consequently the awards may not vest.
22 AMP ANNUAL REPORT 2007
Directors’ report continued
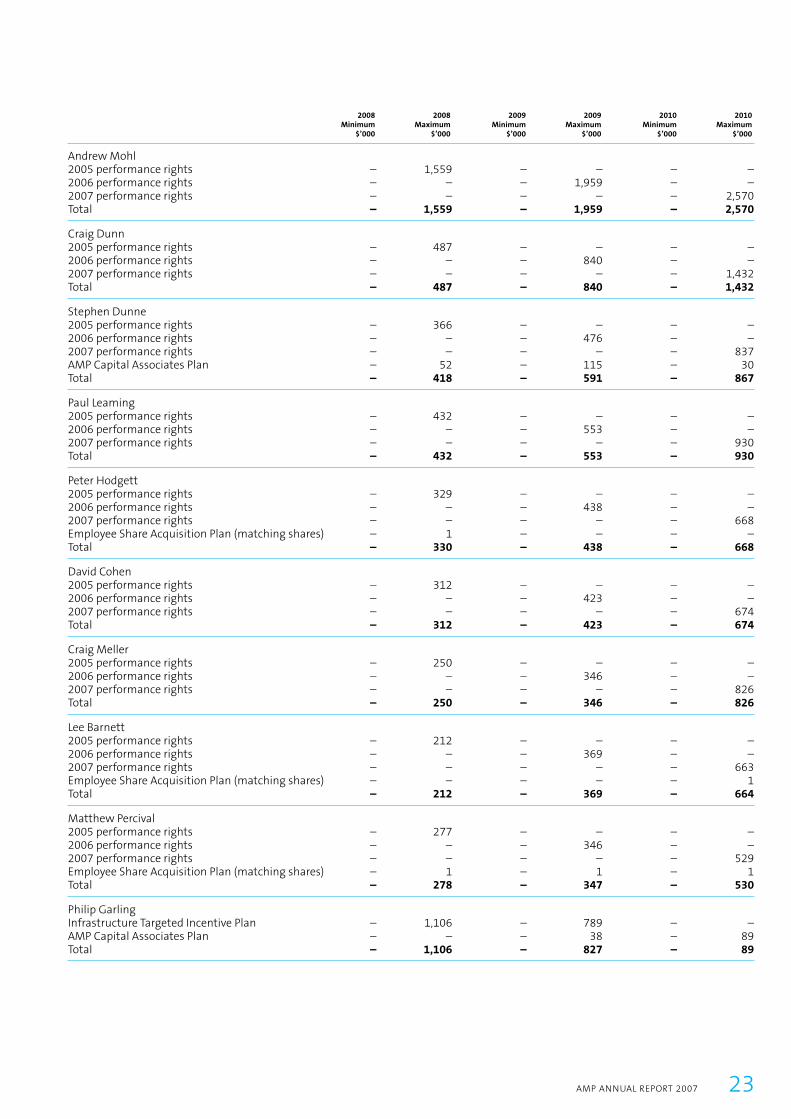
2008Minimum
$’000
2008Maximum
$’000
2009Minimum
$’000
2009Maximum
$’000
2010Minimum
$’000
2010Maximum
$’000
Andrew Mohl2005 performance rights – 1,559 – – – –2006 performance rights – – – 1,959 – –2007 performance rights – – – – – 2,570Total – 1,559 – 1,959 – 2,570
Craig Dunn2005 performance rights – 487 – – – –2006 performance rights – – – 840 – –2007 performance rights – – – – – 1,432Total – 487 – 840 – 1,432
Stephen Dunne 2005 performance rights – 366 – – – –2006 performance rights – – – 476 – –2007 performance rights – – – – – 837AMP Capital Associates Plan – 52 – 115 – 30Total – 418 – 591 – 867
Paul Leaming 2005 performance rights – 432 – – – –2006 performance rights – – – 553 – –2007 performance rights – – – – – 930Total – 432 – 553 – 930
Peter Hodgett 2005 performance rights – 329 – – – –2006 performance rights – – – 438 – –2007 performance rights – – – – – 668Employee Share Acquisition Plan (matching shares) – 1 – – – –Total – 330 – 438 – 668
David Cohen 2005 performance rights – 312 – – – –2006 performance rights – – – 423 – –2007 performance rights – – – – – 674Total – 312 – 423 – 674
Craig Meller 2005 performance rights – 250 – – – –2006 performance rights – – – 346 – –2007 performance rights – – – – – 826Total – 250 – 346 – 826
Lee Barnett 2005 performance rights – 212 – – – –2006 performance rights – – – 369 – –2007 performance rights – – – – – 663Employee Share Acquisition Plan (matching shares) – – – – – 1Total – 212 – 369 – 664
Matthew Percival 2005 performance rights – 277 – – – –2006 performance rights – – – 346 – –2007 performance rights – – – – – 529Employee Share Acquisition Plan (matching shares) – 1 – 1 – 1Total – 278 – 347 – 530
Philip Garling Infrastructure Targeted Incentive Plan – 1,106 – 789 – –AMP Capital Associates Plan – – – 38 – 89Total – 1,106 – 827 – 89
AMP ANNUAL REPORT 2007 23

Cash payments on vesting of long-term incentives as a result of capital return alterationsShareholders approved capital returns of 40 cents per share at the AMP Limited Annual General Meetings in 2005, 2006 and 2007.
To compensate for the reduction in the value of performance rights and matching share entitlements held under the ESAP and the 2003 Executive Short-term Incentive Program (respectively), resulting from each of the 2005, 2006 and 2007 capital returns, the arrangements with the former CEO and nominated executives named below (and other participating executives) were altered in 2005, 2006 and 2007 so that, in respect of each capital return (and subject to adjustment for any future capital reorganisation), the executives are entitled to payment by AMP of:– 40 cents for each performance right held immediately prior to the relevant capital return that subsequently vests and is converted
into an AMP share, and– 40 cents for each entitlement to matching shares under ESAP or the 2003 Executive Short-term Incentive Program (as the case
may be) held immediately prior to the relevant capital return that subsequently vests and is converted into an AMP share.
As a result of these alterations:– executives who held performance rights that were granted in 2004 and vested in 2007 received $1.20 for each of those
performance rights – executives who acquired shares on 10 March 2004 as part of the 2003 Executive Short-term Incentive Program received a payment
of 80 cents per share for each matching share entitlement that vested on 10 March 2007, and – executives who received matching shares under ESAP during 2007, in respect of shares acquired during 2004, received a payment
of 80 cents per share for each of those matching shares.
The table below sets out the cash amounts paid in 2007 to nominated executives on performance rights and matching share entitlements that vested in 2007. Philip Garling does not hold performance rights and did not receive any matching shares.
Name
Cash payment on vesting of 2004 performance rights
$’000
Cash payment on vesting of 2003 matching shares
$’000Total
$’000
Andrew Mohl 408 82 490Craig Dunn 147 34 181Stephen Dunne 96 0 96Paul Leaming 124 26 150Peter Hodgett 89 17 106David Cohen 90 23 113Craig Meller 71 15 86Lee Barnett 59 0 59Matthew Percival 75 14 89
The alterations in respect of performance rights, Executive STI program matching shares, and ESAP matching shares took effect on 26 May 2005, 25 May 2006, and 25 May 2007.
Details of the number of fully paid ordinary shares in AMP Limited underlying each tranche of performance rights held by the nominated executives immediately prior to the alteration made in 2007 are provided in section 2.7. The number of fully paid ordinary shares in AMP Limited underlying the ESAP matching share entitlements prior to the alteration made in 2007 for Peter Hodgett and Matthew Percival were 100 and 300 respectively. The market price of an AMP share was $10.12 as at 25 May 2007, being the date of the 2007 capital return alteration.
All other terms and conditions affecting performance rights and matching share entitlements (see sections 1.4.1, 1.4.3 and 1.5) held by the nominated executives in 2007, and their fair value, remained the same before and after the alterations described above.
24 AMP ANNUAL REPORT 2007
Directors’ report continued

2.6 Analysis of movements in performance rights and option holdingsThe table below summarises the movement of options and performance rights, by value, during the year. The performance rights exercised during 2007 were those granted to executives on 6 September 2004. Philip Garling did not hold any performance rights or options during 2007 and has therefore been excluded from the table.
The value reported in the fi rst column of the following table represents the ‘fair value’ of performance rights as calculated at the grant date by external consultants using Monte Carlo simulation techniques. Fair value has been discounted for the probability of not meeting the performance hurdles.
The value of performance rights exercised during 2007 represents the number of performance rights exercised multiplied by the market value of an AMP share as traded on the ASX at close of trading on the date of exercise, less the $1 exercise price per tranche of performance rights exercised.
Name
Value of performancerights granted during 2007
$’000
Value of performancerights exercised during 2007
$’000
Value of performance rights lapsed during 20071
$’000
Value of options lapsed during 20071
$’000Total
$’000
Andrew Mohl 2,570 3,505 0 0 6,075Craig Dunn 1,432 1,289 0 0 2,721Stephen Dunne 837 1,241 0 0 2,078Paul Leaming 930 1,063 0 0 1,993Peter Hodgett 668 766 0 0 1,434David Cohen 674 791 0 0 1,465Craig Meller 826 606 0 0 1,432Lee Barnett 663 522 0 0 1,185Matthew Percival 529 642 0 0 1,171
Footnote:1 The value of performance rights and options lapsed during 2007 was zero at the time of, and immediately prior, to lapse.
2.7 CEO and executive shareholdings in AMP LimitedIn 2006 the Remuneration Committee introduced guidelines outlining the minimum number of AMP shares that a senior AMP executive is expected to hold. The guidelines were introduced to strengthen the alignment between the interests of senior executives and shareholders in the long-term performance of AMP. Senior executives are expected to establish and maintain the following minimum shareholdings:– CEO: 300,000 shares– direct reports to the CEO: 60,000 shares.
Each vested performance right and share held in tax deferral by the executive is treated as being equal to 50 per cent of one share. A fi ve-year transition period (which began in 2006) gives executives a reasonable amount of time to meet their shareholding guidelines. For new appointments, the fi ve-year transition period begins at the time of appointment.
The table below summarises the movements in holdings of shares in AMP Limited held by the nominated executives and their personally-related entities.
NameHolding at1 Jan 2007
Granted as remunerationduring the period
Received on exercise ofperformance rights or options Other charges1
Holding at31 Dec 2007
Andrew Mohl (left AMP 31 December 2007) 1,014,454 – 340,337 303,901 1,658,692Craig Dunn2 276,780 42,268 122,522 – 441,570Stephen Dunne 525 – 121,581 – 122,106Paul Leaming 62,448 32,281 103,236 – 197,965Peter Hodgett (left AMP 31 December 2007) 277,919 21,539 74,005 (92,103) 281,360David Cohen 132,321 29,150 74,874 – 236,345Craig Meller 78,050 19,193 58,824 (59,860) 96,207Lee Barnett – – 49,580 1,165 50,745Matthew Percival 180,340 18,138 62,320 (50,545) 210,253Philip Garling – – 0 2,862 2,862
Footnote:1 Other changes represent individuals’ purchases and sales made during the period. Purchases made during the period include those shares purchased and
held under the Employee Share Acquisition Plan. For further details on the terms and conditions of these plans, see section 1.4.3 of this report. 2 The AMP Limited shareholdings for Craig Dunn include 30,000 vested restricted shares granted in previous roles. For further details on the terms and
conditions of restricted shares see section 1.4.2.
AMP ANNUAL REPORT 2007 25
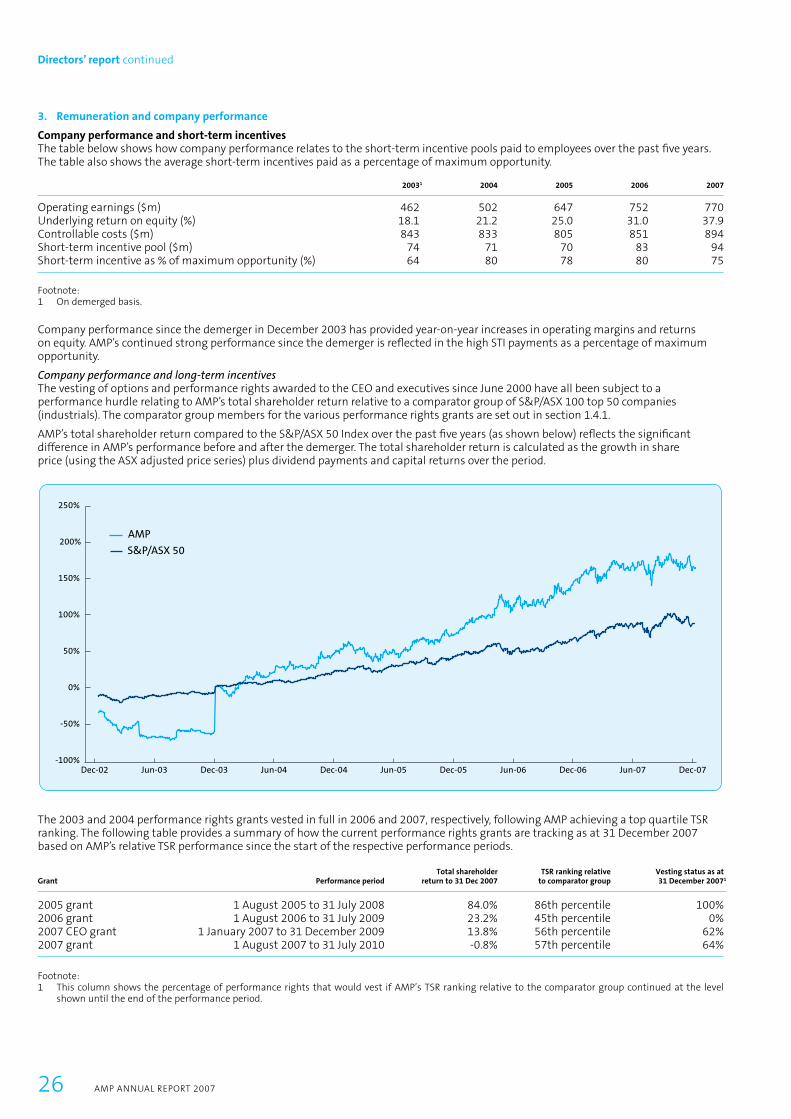
3. Remuneration and company performance
Company performance and short-term incentives The table below shows how company performance relates to the short-term incentive pools paid to employees over the past fi ve years. The table also shows the average short-term incentives paid as a percentage of maximum opportunity.
20031 2004 2005 2006 2007
Operating earnings ($m) 462 502 647 752 770Underlying return on equity (%) 18.1 21.2 25.0 31.0 37.9Controllable costs ($m) 843 833 805 851 894Short-term incentive pool ($m) 74 71 70 83 94Short-term incentive as % of maximum opportunity (%) 64 80 78 80 75
Footnote:1 On demerged basis.
Company performance since the demerger in December 2003 has provided year-on-year increases in operating margins and returns on equity. AMP’s continued strong performance since the demerger is refl ected in the high STI payments as a percentage of maximum opportunity.
Company performance and long-term incentives The vesting of options and performance rights awarded to the CEO and executives since June 2000 have all been subject to a performance hurdle relating to AMP’s total shareholder return relative to a comparator group of S&P/ASX 100 top 50 companies (industrials). The comparator group members for the various performance rights grants are set out in section 1.4.1.
AMP’s total shareholder return compared to the S&P/ASX 50 Index over the past fi ve years (as shown below) refl ects the signifi cant difference in AMP’s performance before and after the demerger. The total shareholder return is calculated as the growth in share price (using the ASX adjusted price series) plus dividend payments and capital returns over the period.
The 2003 and 2004 performance rights grants vested in full in 2006 and 2007, respectively, following AMP achieving a top quartile TSR ranking. The following table provides a summary of how the current performance rights grants are tracking as at 31 December 2007 based on AMP’s relative TSR performance since the start of the respective performance periods.
Grant Performance periodTotal shareholder
return to 31 Dec 2007TSR ranking relative
to comparator groupVesting status as at 31 December 20071
2005 grant 1 August 2005 to 31 July 2008 84.0% 86th percentile 100%2006 grant 1 August 2006 to 31 July 2009 23.2% 45th percentile 0%2007 CEO grant 1 January 2007 to 31 December 2009 13.8% 56th percentile 62%2007 grant 1 August 2007 to 31 July 2010 -0.8% 57th percentile 64%
Footnote:1 This column shows the percentage of performance rights that would vest if AMP’s TSR ranking relative to the comparator group continued at the level
shown until the end of the performance period.
26 AMP ANNUAL REPORT 2007
Directors’ report continued

4. Contracts
4.1 Andrew Mohl, Chief Executive Officer (left AMP on 31 December 2007)
Contract components Details
Length of contract Andrew Mohl’s contract expired 31 December 2007 by mutual agreement.
Base salary Base salary for the 2007 year was $1.8 million.
Superannuation Superannuation contributions equal to 9% of the superannuation maximum contribution base. For the 2007 year, $12,900 was paid to his nominated superannuation plan.
Short-term incentive Annual short-term incentive opportunity was 0% to 200% of base salary. Any short-term incentive payments(STI) awarded are paid in cash.
For the 2007 year the board determined that Andrew’s STI payment was $2.742 million, which was 150% of his base salary.
The STI is based on performance against a range of 2007 fi nancial, qualitative and personal performance measures: – 49% AMP group fi nancial measures (see page 12) – 21% AMP group qualitative measures (see page 12) – 30% personal performance measures (business operations, cultural transformation, growth strategy,
personal leadership, external positioning, succession planning).
These measures were recommended by the Remuneration Committee and approved by the AMP Board as they were considered to be the key indicators of the CEO’s performance.
Long-term incentive The contract included the opportunity to earn a long-term incentive in the form of performance rights (LTI) up to 150% of base salary.
The Remuneration Committee makes recommendations on CEO’s performance rights grant to the AMP Board for approval. Full details of previous grants are outlined in section 2.3.
In 2007 he received 553,940 performance rights with a fair value at the time of grant of $2.570 million.
Performance rights can be exercised at the end of the three-year performance period, provided a pre-determined performance hurdle is met (as outlined in section 1.4.1).
End of contract payments In August 2007, the AMP Board announced that it had mutually agreed with Andrew that he would leave AMP on 31 December 2007, following over fi ve years as CEO. Contractual payments made to him are outlined in section 2.1 on page 20.
Andrew’s contract expired and was not renewed, and this entitled him to a payment equivalent to 12 months base salary.
Note: Andrew’s employment with other companies is restricted until July 2008. Under this form of termination, he continues to hold previously granted performance rights subject to existing performance period and hurdles.
Andrew received statutory entitlements, including accrued long service leave and annual leave, as well as accumulated superannuation benefi ts.
The other provisions of his contract that related to termination of employment were as follows:– Andrew was required to provide six months written notice to the AMP Board to terminate his
employment contract.
– In the event AMP terminated his employment for any reason other than unsatisfactory performance, AMP was required to give two months written notice and provide a payment equivalent to 10 months base salary if the termination date fell between 8 October 2006 and 31 December 2007 (inclusive).
– Under this form of termination, he would continue to hold previously granted performance rights subject to existing performance period and hurdles.
– If Andrew’s employment ceased as a result of poor performance, AMP was required to give him written notice or payment comprising the lesser of 12 months or the balance of the period until the expiry of the term of his contract. In the event of termination as a result of poor performance, or serious misconduct or cessation of employment by Andrew, performance rights (vested and unvested) would have lapsed immediately.
AMP ANNUAL REPORT 2007 27
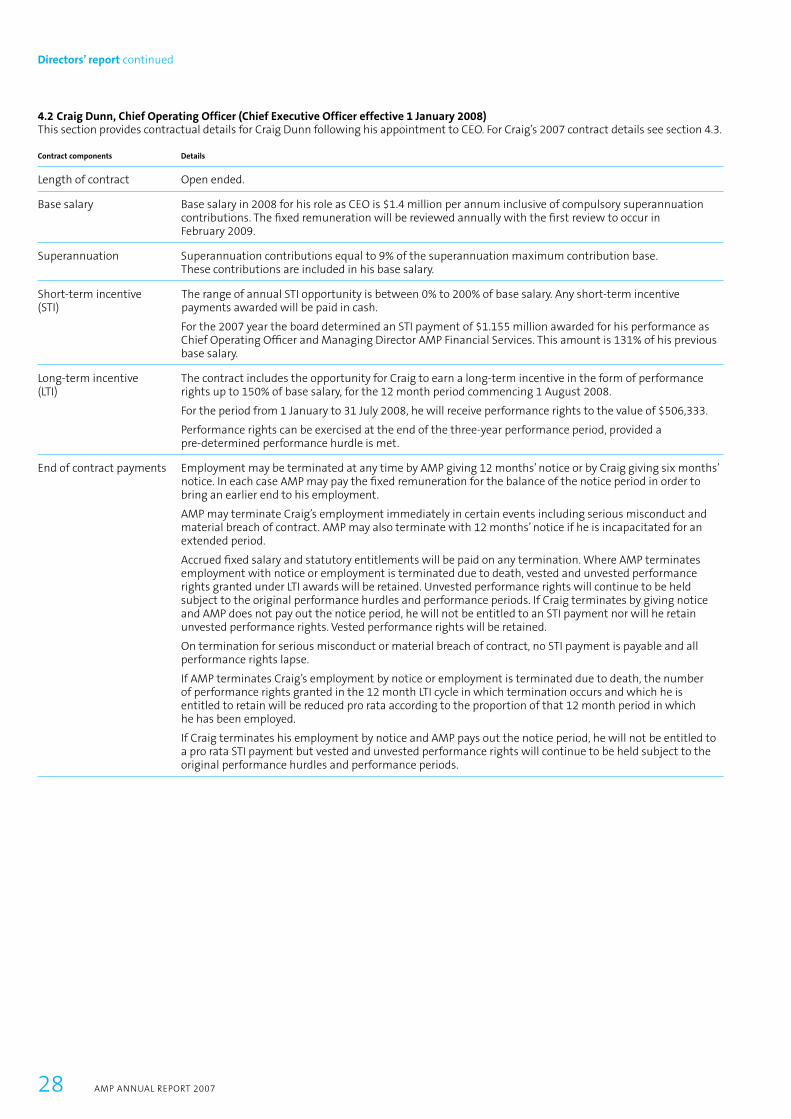
4.2 Craig Dunn, Chief Operating Officer (Chief Executive Officer effective 1 January 2008)This section provides contractual details for Craig Dunn following his appointment to CEO. For Craig’s 2007 contract details see section 4.3.
Contract components Details
Length of contract Open ended.
Base salary Base salary in 2008 for his role as CEO is $1.4 million per annum inclusive of compulsory superannuation contributions. The fi xed remuneration will be reviewed annually with the fi rst review to occur in February 2009.
Superannuation Superannuation contributions equal to 9% of the superannuation maximum contribution base. These contributions are included in his base salary.
Short-term incentive The range of annual STI opportunity is between 0% to 200% of base salary. Any short-term incentive (STI) payments awarded will be paid in cash.
For the 2007 year the board determined an STI payment of $1.155 million awarded for his performance as Chief Operating Offi cer and Managing Director AMP Financial Services. This amount is 131% of his previous base salary.
Long-term incentive The contract includes the opportunity for Craig to earn a long-term incentive in the form of performance(LTI) rights up to 150% of base salary, for the 12 month period commencing 1 August 2008.
For the period from 1 January to 31 July 2008, he will receive performance rights to the value of $506,333.
Performance rights can be exercised at the end of the three-year performance period, provided a pre-determined performance hurdle is met.
End of contract payments Employment may be terminated at any time by AMP giving 12 months’ notice or by Craig giving six months’ notice. In each case AMP may pay the fi xed remuneration for the balance of the notice period in order to bring an earlier end to his employment.
AMP may terminate Craig’s employment immediately in certain events including serious misconduct and material breach of contract. AMP may also terminate with 12 months’ notice if he is incapacitated for an extended period.
Accrued fi xed salary and statutory entitlements will be paid on any termination. Where AMP terminates employment with notice or employment is terminated due to death, vested and unvested performance rights granted under LTI awards will be retained. Unvested performance rights will continue to be held subject to the original performance hurdles and performance periods. If Craig terminates by giving notice and AMP does not pay out the notice period, he will not be entitled to an STI payment nor will he retain unvested performance rights. Vested performance rights will be retained.
On termination for serious misconduct or material breach of contract, no STI payment is payable and all performance rights lapse.
If AMP terminates Craig’s employment by notice or employment is terminated due to death, the number of performance rights granted in the 12 month LTI cycle in which termination occurs and which he is entitled to retain will be reduced pro rata according to the proportion of that 12 month period in which he has been employed.
If Craig terminates his employment by notice and AMP pays out the notice period, he will not be entitled to a pro rata STI payment but vested and unvested performance rights will continue to be held subject to the original performance hurdles and performance periods.
28 AMP ANNUAL REPORT 2007
Directors’ report continued
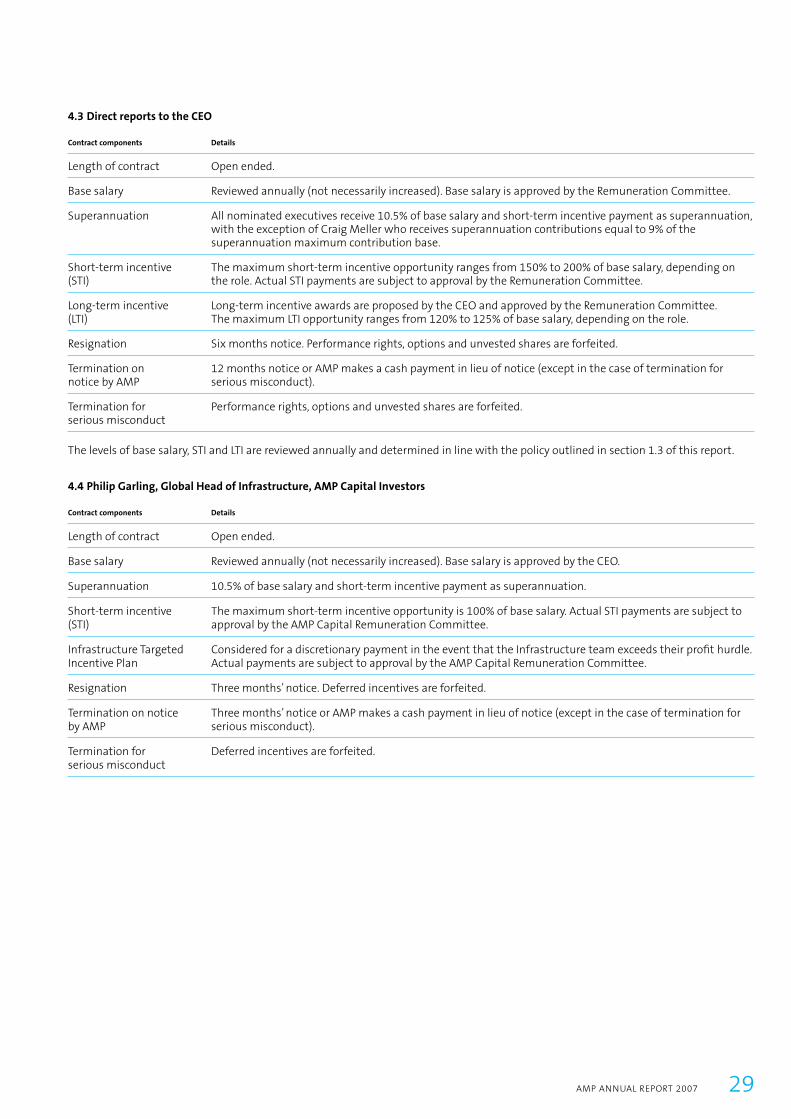
4.3 Direct reports to the CEO
Contract components Details
Length of contract Open ended.
Base salary Reviewed annually (not necessarily increased). Base salary is approved by the Remuneration Committee.
Superannuation All nominated executives receive 10.5% of base salary and short-term incentive payment as superannuation, with the exception of Craig Meller who receives superannuation contributions equal to 9% of the superannuation maximum contribution base.
Short-term incentive The maximum short-term incentive opportunity ranges from 150% to 200% of base salary, depending on (STI) the role. Actual STI payments are subject to approval by the Remuneration Committee.
Long-term incentive Long-term incentive awards are proposed by the CEO and approved by the Remuneration Committee. (LTI) The maximum LTI opportunity ranges from 120% to 125% of base salary, depending on the role.
Resignation Six months notice. Performance rights, options and unvested shares are forfeited.
Termination on 12 months notice or AMP makes a cash payment in lieu of notice (except in the case of termination for notice by AMP serious misconduct).
Termination for Performance rights, options and unvested shares are forfeited.serious misconduct
The levels of base salary, STI and LTI are reviewed annually and determined in line with the policy outlined in section 1.3 of this report.
4.4 Philip Garling, Global Head of Infrastructure, AMP Capital Investors
Contract components Details
Length of contract Open ended.
Base salary Reviewed annually (not necessarily increased). Base salary is approved by the CEO.
Superannuation 10.5% of base salary and short-term incentive payment as superannuation.
Short-term incentive The maximum short-term incentive opportunity is 100% of base salary. Actual STI payments are subject to (STI) approval by the AMP Capital Remuneration Committee.
Infrastructure Targeted Considered for a discretionary payment in the event that the Infrastructure team exceeds their profi t hurdle.Incentive Plan Actual payments are subject to approval by the AMP Capital Remuneration Committee.
Resignation Three months’ notice. Deferred incentives are forfeited.
Termination on notice Three months’ notice or AMP makes a cash payment in lieu of notice (except in the case of termination for by AMP serious misconduct).
Termination for Deferred incentives are forfeited.serious misconduct
AMP ANNUAL REPORT 2007 29

5. Non-executive director remuneration
The 2007 remuneration details for the following non-executive directors are covered in this report:– Peter Mason, Chairman– David Clarke– Meredith Hellicar– Dr Nora Scheinkestel– Richard Grellman– John Palmer (appointed to the board on 27 July 2007)– John Astbury (retired on 31 October 2007).
Director Brian Clark is not included as he was appointed to the AMP Limited Board on 1 January 2008.
5.1 PhilosophyFees paid to non-executive directors of the AMP Board are determined having regard to advice provided by AMP’s remuneration specialists and external remuneration advisers appointed by the Nomination Committee. Factors that are taken into consideration include: – the level of fees paid to board members of Australian corporations of a similar size– the complexity of AMP’s operations, and – the responsibilities and workload requirements of board members.
In order to maintain their independence, no proportion of non-executive directors’ remuneration is linked to performance.
5.2 StructureThe components of non-executive directors’ remuneration are:– board fees (including expense allowance), and– committee and subsidiary board fees.
Company superannuation contributions are made on these fees as outlined in section 5.3.
Board feesThe aggregate fee pool for non-executive directors is approved by shareholders. In 2007 this was $2,500,000. The board fees for 2007 were as follows:
Chairman Other non-executive directors
Base fee1 $515,000 $140,000Expense allowance1 N/A $6,000Total $515,000 $146,000
Footnote:1 These amounts exclude the minimum company superannuation contributions totaling nine per cent of fees.
The fee for the AMP Chairman incorporates all payments. No additional fees are paid for his membership of board committees or as a non-executive director of subsidiary boards, nor for his attendance at meetings of boards or committees of which he is not a member.
Board fees are not paid to the CEO as responsibilities regarding board membership are considered to be part of the CEO’s normal employment conditions.
An expense allowance of $6,000 is paid to each director, except the Chairman, for incidental expenses related to the business of the company.
Committee and subsidiary board fees During 2007, non-executive directors were paid a fee for service on the AMP Board. Additional fees were paid for service on the Audit, Nomination and Remuneration Committees. Individual non-executive directors are paid additional fees for duties associated with membership of AMP subsidiary boards, and for duties associated with due diligence committees of major projects (or other special purpose committees) on a per-day basis. Committee chairman Committee member $ $
Audit Committee 35,000 15,000Nomination Committee 15,000 7,500Remuneration Committee 25,000 12,500AMP Life Limited Board 127,500 85,000Gordian RunOff Limited 75,000 50,000AMP Capital Investors Limited Board 99,000 66,000AMP Bank Board 52,500 35,000
The amounts presented in the table above exclude the minimum company superannuation contributions totalling nine per cent of fees. Details about board, committee and subsidiary board membership are shown on page 20.
Remuneration table Refer to page 19 for full details of total remuneration paid to the non-executive directors for 2007.
30 AMP ANNUAL REPORT 2007
Directors’ report continued
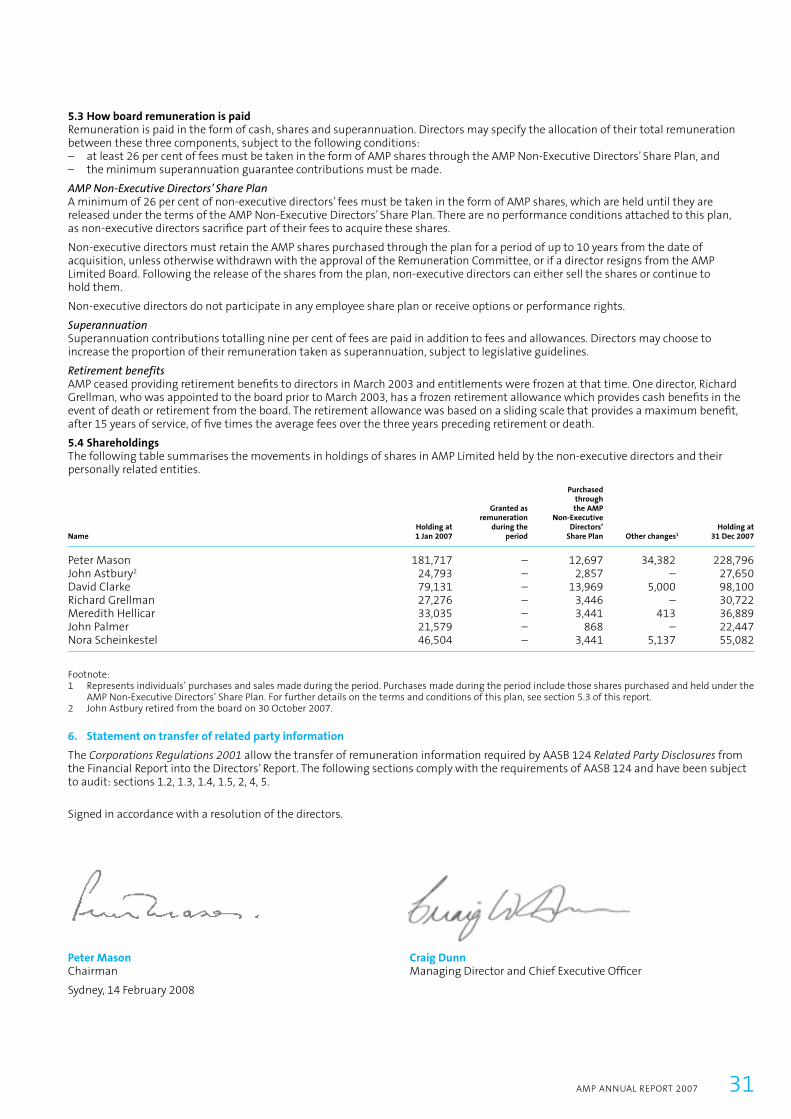
5.3 How board remuneration is paidRemuneration is paid in the form of cash, shares and superannuation. Directors may specify the allocation of their total remuneration between these three components, subject to the following conditions:– at least 26 per cent of fees must be taken in the form of AMP shares through the AMP Non-Executive Directors’ Share Plan, and– the minimum superannuation guarantee contributions must be made.
AMP Non-Executive Directors’ Share PlanA minimum of 26 per cent of non-executive directors’ fees must be taken in the form of AMP shares, which are held until they are released under the terms of the AMP Non-Executive Directors’ Share Plan. There are no performance conditions attached to this plan, as non-executive directors sacrifi ce part of their fees to acquire these shares.
Non-executive directors must retain the AMP shares purchased through the plan for a period of up to 10 years from the date of acquisition, unless otherwise withdrawn with the approval of the Remuneration Committee, or if a director resigns from the AMP Limited Board. Following the release of the shares from the plan, non-executive directors can either sell the shares or continue to hold them.
Non-executive directors do not participate in any employee share plan or receive options or performance rights.
SuperannuationSuperannuation contributions totalling nine per cent of fees are paid in addition to fees and allowances. Directors may choose to increase the proportion of their remuneration taken as superannuation, subject to legislative guidelines.
Retirement benefitsAMP ceased providing retirement benefi ts to directors in March 2003 and entitlements were frozen at that time. One director, Richard Grellman, who was appointed to the board prior to March 2003, has a frozen retirement allowance which provides cash benefi ts in the event of death or retirement from the board. The retirement allowance was based on a sliding scale that provides a maximum benefi t, after 15 years of service, of fi ve times the average fees over the three years preceding retirement or death.
5.4 ShareholdingsThe following table summarises the movements in holdings of shares in AMP Limited held by the non-executive directors and their personally related entities.
NameHolding at 1 Jan 2007
Granted as remuneration
during the period
Purchased through the AMP
Non-Executive Directors’
Share Plan Other changes1
Holding at 31 Dec 2007
Peter Mason 181,717 – 12,697 34,382 228,796John Astbury2 24,793 – 2,857 – 27,650David Clarke 79,131 – 13,969 5,000 98,100Richard Grellman 27,276 – 3,446 – 30,722Meredith Hellicar 33,035 – 3,441 413 36,889John Palmer 21,579 – 868 – 22,447Nora Scheinkestel 46,504 – 3,441 5,137 55,082
Footnote:1 Represents individuals’ purchases and sales made during the period. Purchases made during the period include those shares purchased and held under the
AMP Non-Executive Directors’ Share Plan. For further details on the terms and conditions of this plan, see section 5.3 of this report. 2 John Astbury retired from the board on 30 October 2007.
6. Statement on transfer of related party information
The Corporations Regulations 2001 allow the transfer of remuneration information required by AASB 124 Related Party Disclosures from the Financial Report into the Directors’ Report. The following sections comply with the requirements of AASB 124 and have been subject to audit: sections 1.2, 1.3, 1.4, 1.5, 2, 4, 5.
Signed in accordance with a resolution of the directors.
Peter Mason Craig DunnChairman Managing Director and Chief Executive Offi cer
Sydney, 14 February 2008
AMP ANNUAL REPORT 2007 31
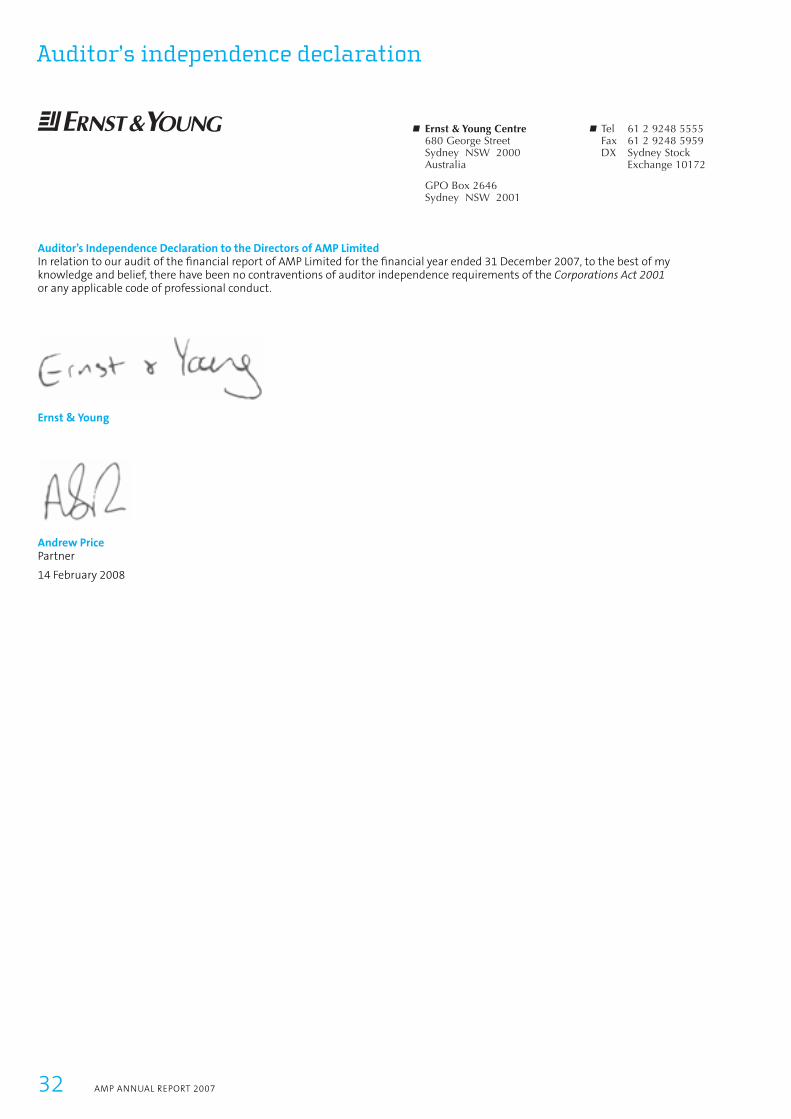
Auditor’s Independence Declaration to the Directors of AMP LimitedIn relation to our audit of the fi nancial report of AMP Limited for the fi nancial year ended 31 December 2007, to the best of my knowledge and belief, there have been no contraventions of auditor independence requirements of the Corporations Act 2001 or any applicable code of professional conduct.
Ernst & Young
Andrew PricePartner
14 February 2008
Ernst & Young Centre680 George StreetSydney NSW 2000Australia
Tel 61 2 9248 5555Fax 61 2 9248 5959DX Sydney Stock Exchange 10172
GPO Box 2646Sydney NSW 2001
32 AMP ANNUAL REPORT 2007
Auditor’s independence declaration

This table shows a detailed analysis of the source of net profit after income tax attributable to shareholders of AMP Limited by business unit.
2007 2006All amounts are after income tax $m $m
AMP Financial Services 663 607 AMP Capital Investors 150 115
Total business unit operating earnings1 813 722
Group Office costs (43) (37)
Total operating earnings1 770 685
Underlying investment income 158 184 Interest expense on Group debt (59) (63)Discontinued business – Cobalt/Gordian2 78 67 AMP Limited tax loss recognition 13 n/a
Underlying profit 960 873
Investment income market adjustment – 77
Profit after income tax before other items 960 950
Profit on sale of Cobalt/Gordian business and fair value release provision 93 20 Employee defined benefit schemes 6 5 Fair value of debt and derivatives (4) 2 Other items 1 (1)
Profit attributable to shareholders of AMP Limited before accounting mismatches 1,056 976
Mismatch items (71) (61)
Net profit after accounting mismatches 985 915
Footnote:1 Business unit and total operating earnings for 2006 have been restated as a result of the sale of the Cobalt/Gordian business.2 As previously announced to the market, on 11 December 2007, the AMP group entered into a sale agreement for its closed reinsurance operations, Cobalt/Gordian.
The sale, once finalised will represent a complete exit from this business by the AMP group.
for the year ended 31 December 2007
Analysis of shareholder profi t
AMP ANNUAL REPORT 2007 33

Approach to corporate governanceAMP has a set of values that recognises our responsibilities to all of our stakeholders, including shareholders, customers, employees, planners, the community and the environment.
The AMP Board places great importance on the highest standards of governance and continually reviews its governance practices to address AMP’s obligations as a responsible corporate citizen.
In March 2003, the ASX Corporate Governance Council (ASX Council) published its Principles of Good Corporate Governance and Best Practice Recommendations.
AMP has adopted the principles and practices, meeting all of the ASX Best Practice Recommendations, with the exception of:– Recommendation 9.4 relating to shareholder approval of equity
based remuneration plans. This is primarily because a number of AMP executive equity plans were established prior to the release of the ASX Best Practice Recommendations and did not require shareholder approval under the Corporations Act 2001 and ASX Listing Rules. However, at AMP’s 2008 Annual General Meeting, which will be held on 15 May 2008, shareholder approval will be sought for the continued participation of the Managing Director and Chief Executive Offi cer in AMP’s long-term incentive plan. Information about AMP’s long-term incentive plan was previously provided to shareholders in October 2003 when AMP proposed the demerger of its UK operations. Although specifi c shareholder approval of this plan was not required at that time, it did form part of the proposed ongoing arrangements for AMP. Shareholders can access a copy of the 2008 Notice of Meeting on the AMP website: www.amp.com.au/shareholdercentre, and
– Recommendation 4.3 states that the Audit Committee should be comprised of at least three members. Following John Astbury’s retirement as a director on the AMP Board in October 2007, and consequently the Audit Committee, the Audit Committee comprised two members (Richard Grellman as chairman and Nora Scheinkestel). As the board is considering succession planning and board composition generally, the chairman was appointed as a member on the Audit Committee as an interim measure, pending a permanent appointment to that committee.
In accordance with the best practice recommendations, AMP has posted copies of our governance practices in the corporate governance section on our website: www.amp.com.au including copies of relevant policies and terms of reference.
In August 2007, the ASX Council issued revised Corporate Governance Principles and Recommendations, effective 1 January 2008. AMP is required to report against these in the 2008 annual report, which will be published next year.
Role of the board of directors(ASX Best Practice Recommendation 1.1)Functions of board and management
The AMP Board is responsible to its shareholders for the overall governance and performance of the AMP group.
The boardThe AMP Board primarily represents the long-term interests of shareholders by:– providing strategic direction to AMP through constructive
engagement with senior management in the development, execution and modifi cation of AMP’s strategy
– appointing the Managing Director and Chief Executive Offi cer (CEO), the Chief Financial Offi cer (CFO) and the Company Secretary and approving succession plans
– monitoring the performance of the CEO – approving remuneration policies and practices– reporting to shareholders and ensuring that all regulatory
requirements are met– providing advice and counsel to senior management– ensuring appropriate group wide compliance and risk
frameworks and controls are in place– approving policies governing the operations of the AMP group– approving decisions concerning the capital of the AMP group,
including capital restructures and signifi cant changes to major fi nancing arrangements
– making decisions in relation to initiatives or matters otherwise not dealt with as part of the strategy process (e.g. major acquisitions and withdrawal from existing major lines of business)
– monitoring fi nancial results on an ongoing basis– determining dividends and fi nancing of dividend payments– ensuring the board’s effectiveness in delivering best practice
corporate governance– ensuring AMP’s business is conducted ethically and
transparently– reviewing strategic risk management including processes
for identifying areas of signifi cant business risk, monitoring risk management policies and procedures, overseeing internal controls and reviewing major assumptions used in the calculation of signifi cant risk exposures
– ensuring clear and transparent communication to the market, shareholders and other stakeholders as appropriate
– listening and responding to shareholders’ views on the management and direction of the company, and
– considering the interests of all stakeholders.
Role of management(ASX Best Practice Recommendation 1.1)Functions of board and management
The Chief Executive Offi cer (CEO) is responsible for the overall management and profi t performance of the AMP group. The CEO manages the organisation in accordance with the strategy, plans and policies approved by the board to achieve agreed goals.
Board composition and size(ASX Best Practice Recommendations 2.1, 2.5)Independence of directors – board composition and commitment
The directors determine the size of the board, with reference to the Constitution, which provides that there will be a minimum of three directors and a maximum of 16 directors. The AMP Board is made up of a majority of independent non-executive directors and has only one executive director, the CEO. The chairman of the board is non-executive and independent of the role of the CEO.
AMP’s Constitution is available on AMP’s website.
Appointment of directorsNominations of new directors, recommended by the Nomination Committee, are considered by the full board. The Nomination Committee considers a wide base of potential directors, taking into account the range of skills and experience required in relation to the:– current composition of the board– need for independence– strategic direction and progress of AMP, and– geographic spread and diversity of AMP’s businesses.
From time to time, the Nomination Committee uses external consultants in this practice. The board assesses nominated directors against a range of criteria including experience, professional skills, personal qualities and their capacity to commit themselves to the board’s activities. Any appointment is subject to any share qualifi cation requirement of AMP’s Constitution (Clause 60).
A copy of the Nomination Committee terms of reference is available on AMP’s website.
Director independenceIt is important that the board operates independently of executive management. Each of the non-executive directors is considered by the board to be independent of management. This means that they do not have any business interest or other relationship that could materially interfere with the exercise of their independent judgement and their ability to act in the best interests of the company.
AMP also includes independent directors on the boards of signifi cant regulated subsidiaries.
34 AMP ANNUAL REPORT 2007
Corporate governance
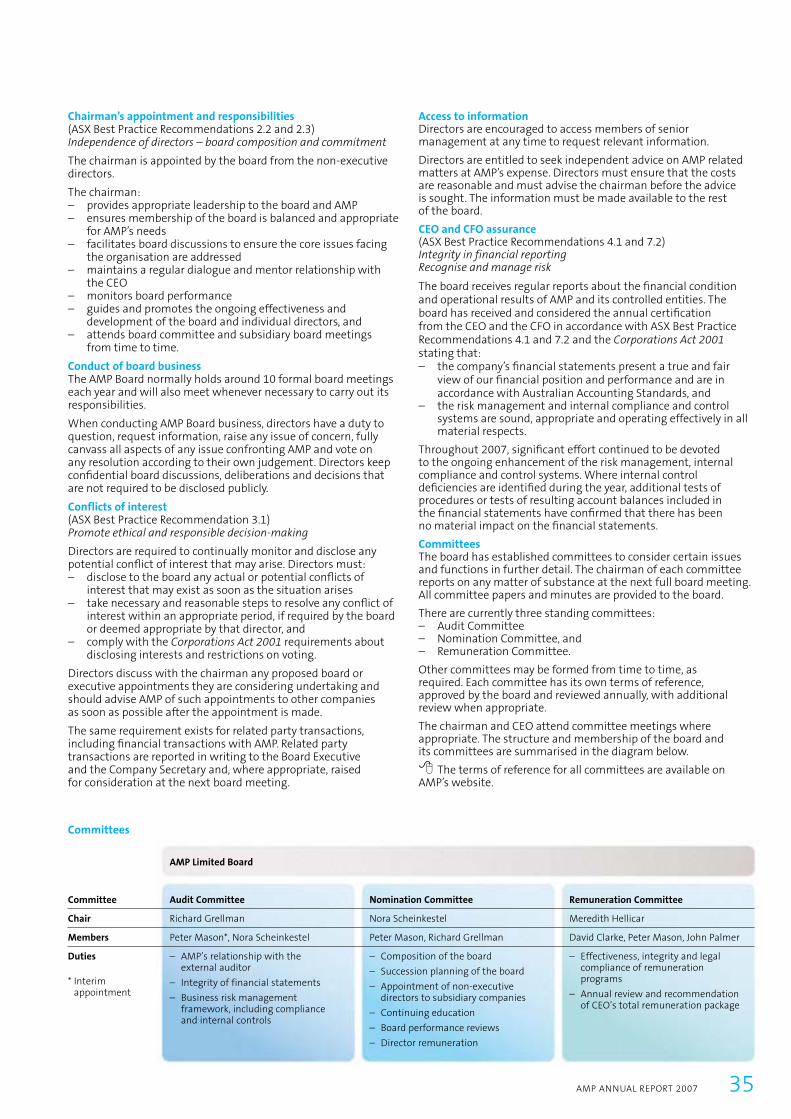
Access to informationDirectors are encouraged to access members of senior management at any time to request relevant information.
Directors are entitled to seek independent advice on AMP related matters at AMP’s expense. Directors must ensure that the costs are reasonable and must advise the chairman before the advice is sought. The information must be made available to the rest of the board.
CEO and CFO assurance(ASX Best Practice Recommendations 4.1 and 7.2)Integrity in financial reportingRecognise and manage risk
The board receives regular reports about the fi nancial condition and operational results of AMP and its controlled entities. The board has received and considered the annual certifi cation from the CEO and the CFO in accordance with ASX Best Practice Recommendations 4.1 and 7.2 and the Corporations Act 2001 stating that:– the company’s fi nancial statements present a true and fair
view of our fi nancial position and performance and are in accordance with Australian Accounting Standards, and
– the risk management and internal compliance and control systems are sound, appropriate and operating effectively in all material respects.
Throughout 2007, signifi cant effort continued to be devoted to the ongoing enhancement of the risk management, internal compliance and control systems. Where internal control defi ciencies are identifi ed during the year, additional tests of procedures or tests of resulting account balances included in the fi nancial statements have confi rmed that there has been no material impact on the fi nancial statements.
CommitteesThe board has established committees to consider certain issues and functions in further detail. The chairman of each committee reports on any matter of substance at the next full board meeting. All committee papers and minutes are provided to the board.
There are currently three standing committees:– Audit Committee– Nomination Committee, and– Remuneration Committee.
Other committees may be formed from time to time, as required. Each committee has its own terms of reference, approved by the board and reviewed annually, with additional review when appropriate.
The chairman and CEO attend committee meetings where appropriate. The structure and membership of the board and its committees are summarised in the diagram below.
The terms of reference for all committees are available on AMP’s website.
Chairman’s appointment and responsibilities(ASX Best Practice Recommendations 2.2 and 2.3)Independence of directors – board composition and commitment
The chairman is appointed by the board from the non-executive directors.
The chairman:– provides appropriate leadership to the board and AMP– ensures membership of the board is balanced and appropriate
for AMP’s needs– facilitates board discussions to ensure the core issues facing
the organisation are addressed– maintains a regular dialogue and mentor relationship with
the CEO– monitors board performance– guides and promotes the ongoing effectiveness and
development of the board and individual directors, and– attends board committee and subsidiary board meetings
from time to time.
Conduct of board businessThe AMP Board normally holds around 10 formal board meetings each year and will also meet whenever necessary to carry out its responsibilities.
When conducting AMP Board business, directors have a duty to question, request information, raise any issue of concern, fully canvass all aspects of any issue confronting AMP and vote on any resolution according to their own judgement. Directors keep confi dential board discussions, deliberations and decisions that are not required to be disclosed publicly.
Conflicts of interest(ASX Best Practice Recommendation 3.1)Promote ethical and responsible decision-making
Directors are required to continually monitor and disclose any potential confl ict of interest that may arise. Directors must:– disclose to the board any actual or potential confl icts of
interest that may exist as soon as the situation arises– take necessary and reasonable steps to resolve any confl ict of
interest within an appropriate period, if required by the board or deemed appropriate by that director, and
– comply with the Corporations Act 2001 requirements about disclosing interests and restrictions on voting.
Directors discuss with the chairman any proposed board or executive appointments they are considering undertaking and should advise AMP of such appointments to other companies as soon as possible after the appointment is made.
The same requirement exists for related party transactions, including fi nancial transactions with AMP. Related party transactions are reported in writing to the Board Executive and the Company Secretary and, where appropriate, raised for consideration at the next board meeting.
Committees
AMP Limited Board
Remuneration Committee
Meredith Hellicar
David Clarke, Peter Mason, John Palmer
– Effectiveness, integrity and legal compliance of remuneration programs
– Annual review and recommendation of CEO’s total remuneration package
Audit Committee
Richard Grellman
Peter Mason*, Nora Scheinkestel
– AMP’s relationship with the external auditor
– Integrity of financial statements
– Business risk management framework, including compliance and internal controls
Nomination Committee
Nora Scheinkestel
Peter Mason, Richard Grellman
– Composition of the board
– Succession planning of the board
– Appointment of non-executive directors to subsidiary companies
– Continuing education
– Board performance reviews
– Director remuneration
Committee
Chair
Members
Duties
* Interim appointment
AMP ANNUAL REPORT 2007 35
Nomination Committee(ASX Best Practice Recommendations 2.4 and 2.5)Independence of directors – board composition and commitment
The Nomination Committee supports and advises the AMP Board on board matters including policies, performance, remuneration, composition and succession planning. This includes identifying, evaluating and recommending candidates to the AMP Board and the boards of key operating subsidiaries and providing advice regarding candidates nominated by shareholders.
The Nomination Committee is responsible for reviewing the remuneration of non-executive directors on the AMP Board and on boards of key operating subsidiary boards. AMP has increased the presence of AMP Board non-executive directors on key operating subsidiaries to increase the non-executive directors’ knowledge and understanding of the businesses and to enhance the governance of the subsidiary boards.
The terms of reference for all committees are available on AMP’s website.
Board performance assessment(ASX Recommendation 8.1)Performance evaluation of the board and its committees, directors and key executives
The AMP Board reviews its own performance and that of individual directors, including the chairman, on a regular basis. In 2007, an external consultant facilitated these reviews. Future reviews will either be facilitated by the chairman, (and in the case of his own review by another non-executive director), or by an external consultant as deemed appropriate by the board from time to time.
In addition, the board reviews the performance of any director standing for re-election at a general meeting of the company.
All committees of the AMP Board as well as the boards, the individual directors and committees of key operating subsidiaries regularly review their own performance.
Retirement of directorsOne-third of the directors are required to retire by rotation at each Annual General Meeting (AGM). The directors to retire at each AGM are those who have been longest in offi ce since their last election. Where directors have served for equal periods, they may agree among themselves or determine by lot who will retire. A director must retire at the third AGM since last elected or re-elected.
A director appointed as an additional or casual director by the board will hold offi ce until the next AGM when the director is required to stand for election. This election will be in addition to any rotational retirements.
The managing director is not subject to retirement by rotation and is not to be taken into account in determining the retirement by rotation of directors.
A director who holds any executive offi ce with AMP (including the CEO) ceases to be a director when they no longer hold their executive offi ce. The tenure of non-executive directors will generally be no longer than nine years. A non-executive director can continue to hold offi ce after a nine-year term only if they are re-elected by shareholders at every subsequent AGM.
Remuneration Committee(ASX Best Practice Recommendations 9.2 and 9.5)Remunerate fairly and responsibly
The Remuneration Committee advises the board on overall remuneration strategy and in particular the effectiveness, competitiveness, integrity and alignment with shareholders’ interests of AMP’s senior executive remuneration programs (including share and performance right plans), protocols and practices.
Key responsibilities include annually reviewing and recommending to the board the performance targets and total remuneration
package of the CEO, and reviewing and approving the remuneration of the CEO’s direct reports and the short-term incentive plan performance measures and incentive pool amounts.
The terms of reference for all committees are available on AMP’s website.
Directors’ and executives’ remunerationComprehensive information on AMP’s remuneration policies and practices is contained in the remuneration report on pages 10 to 31.
The ASX Best Practice Recommendation 9.4, (which under the revised Corporate Governance Principles and Recommendations ceased to have effect from 1 January 2008), states that companies should ensure that payment of equity-based remuneration for executives is made in accordance with thresholds set in plans approved by shareholders. AMP’s equity-based remuneration plans have been designed around appropriate performance benchmarks and shares are acquired ‘on market’ under those plans. The plans were established between 1998 and 2001, prior to the release of the ASX Best Practice Recommendations, and were not put to shareholders for approval as the plans did not require shareholder approval under the Corporations Act nor under the ASX and NZX Listing Rules. In this respect, AMP was not in compliance with this recommendation; however, there is no dilution of shareholder capital as our policy is for shares to be purchased on-market under all plans.
At AMP’s 2008 Annual General Meeting, which will be held on 15 May 2008, shareholder approval will be sought for the continued participation of the Managing Director and Chief Executive Offi cer in AMP’s long-term incentive plan. Information about AMP’s long-term incentive plan was previously provided to shareholders in October 2003 when AMP proposed the demerger of its UK operations. Although specifi c shareholder approval of this plan was not required at that time, it did form part of the proposed ongoing arrangements for AMP. For further information, shareholders can access a copy of the 2008 Notice of Meeting on the AMP website: www.amp.com.au/shareholdercentre
Audit Committee(ASX Best Practice Recommendations 4.2, 4.3, 4.4, 4.5 and 7.1)Safeguard integrity in financial reporting Recognise and manage risk
The primary function of the Audit Committee is to review and provide recommendations to the board in regard to:– AMP’s fi nancial statements and fi nancial reporting systems– the appointment, performance and independence of the
external auditor– the effectiveness of the risk management framework including
compliance – internal controls and the assurance provided by internal audit,
and – the adequacy of the scope, cover and cost of AMP group’s
insurance program.
ASX Best Practice Recommendation 4.3 states that the Audit Committee should be comprised of at least three members. Following John Astbury’s retirement as a director on the AMP Board in October 2007, and consequently the Audit Committee, the Audit Committee comprised two members (Richard Grellman as chairman and Nora Scheinkestel). As the board is considering succession planning and board composition generally, the chairman was recently appointed as a member on the Audit Committee as an interim measure, pending a permanent appointment to that committee.
Auditor independenceThe independence of the external auditor is of particular importance to shareholders and the board. The board has adopted a Charter of Audit Independence, which covers the following key points: – the rotation of the senior audit partner every fi ve years– the annual confi rmation by the auditor that it has satisfi ed all
36 AMP ANNUAL REPORT 2007
Corporate governance continued

This code reinforces an already strong ethical culture for the benefi t of all stakeholders.
A copy of the code of conduct is provided to all directors and employees on joining AMP.
AMP’s code of conduct is available on AMP’s website.
Trading policyAMP’s Trading Policy sets out AMP’s policy regarding the trading in AMP securities by directors and employees and insider trading.
AMP’s Trading Policy aims to:– protect stakeholders’ interests at all times– ensure that directors and employees do not use any
information they possess for their personal advantage, or to the detriment of AMP, and
– ensure that directors and employees comply with insider trading provisions of the Corporations Act.
Trading in AMP securities by directors, executives and certain employees (‘Designated Persons’) is restricted to the following trading windows:– 30-day period beginning on the second day after the release
of AMP’s interim and annual results– 30-day period beginning on the second day after the AMP
Annual General Meeting, and– period commencing on the day after the issue of a prospectus
offering AMP securities (or a document containing equivalent information) and ending on the day the offer closes.
However, Designated Persons may acquire AMP securities under any share plan (such as the Employee Share Acquisition Plan or the Non-Executive Directors’ Share Plan, or any successor or similar plans), on a monthly or other regular basis, outside the trading windows referred to above. These securities are acquired in accordance with a fi xed purchase program under the terms of the share plan.
Trading in AMP securities, during or outside the formal trading windows, is subject to the overriding prohibition on trading while in the possession of inside information.
Outside the formal trading windows, a director or employee may, in the fi rst 10 business days in December each year:– elect to participate in or vary or cease their participation in
the AMP Employee Share Acquisition Plan and/or the AMP Executive Short-term Incentive Plan (or any successor or similar plans including any short-term incentive bonus), and
– apply to receive performance rights under the AMP International Employee Share Ownership Plan.
During this limited trading window, a Designated Person may not otherwise trade in AMP securities.
Breaches of this policy will be treated seriously and may lead to disciplinary action being taken against the employee, including dismissal.
AMP’s Trading Policy is available on AMP’s website.
Communication with shareholders(ASX Best Practice Recommendations 5.1, 5.2 and 6.1)Timely and balanced disclosure
AMP is committed to transparency and quality in its communication to shareholders. Our approach to communicating with shareholders and fi nancial markets is set out in AMP’s Market Disclosure Policy. Information is communicated to shareholders through the distribution of the Annual Report and other communications as required. All signifi cant information is posted on AMP’s website as soon as it is disclosed to the ASX.
The guiding principle of the policy is that AMP must immediately notify the market via an announcement to the ASX of any information concerning AMP that a reasonable person would expect to have a ‘material’ effect on the price or value of AMP securities. The policy permits exceptions to immediate notifi cation in accordance with the ASX Listing Rules.
professional regulations relating to auditor independence– the quarterly reporting on the levels of audit and non-audit
fees, and– the specifi c exclusion of the audit fi rm from work which may
give rise to a confl ict.
In accordance with the Corporations Act 2001 and, based on the advice of the Audit Committee, the directors have satisfi ed themselves that the provision of non-audit services during the year by the auditors, Ernst & Young, is compatible with the general standard of independence for auditors imposed by the Corporations Act 2001.
Risk managementThe board has overall responsibility for ensuring that there is a sound system of risk management and internal compliance and control across the business. It also has responsibility for establishing risk management policies and the risk appetite of the AMP group, and ensuring that these are implemented.
While the board is responsible for risk management, the Audit Committee assists the board by monitoring and evaluating the effectiveness of AMP’s risk management and internal control environment. The Audit Committee also approves AMP’s accounting policies, reporting practices and production of fi nancial statements and monitors the application of appropriate management controls. It considers internal and external audit reports and reviews the adequacy of AMP’s procedures and internal controls in order to monitor fi nancial risks and major operational risks.
Risk and compliance processes and reporting procedures provide assurance to the board and Audit Committee that the preparation of the fi nancial statements and the control systems underlying them are adequate.
Appropriate risk management structures exist throughout the organisation, including the Group Risk and Compliance Committee and business unit risk committees. The risk management framework enables the business to identify and assess risks and controls, respond promptly and appropriately and continue to monitor risks and issues as they evolve. Risk and compliance information is reported quarterly to the Audit Committee, or more urgently, if required.
AMP’s risk management structures and procedures are continually being enhanced or updated. In addition, the internal audit function provides independent and objective assurance to the board that risks are being managed effectively across the group.
The Risk Management Policy is available on AMP’s website.
ComplianceCompliance is a key element of risk management. The board is responsible for ensuring that adequate measures are undertaken to manage compliance with the laws, regulations, contracts, industry codes, internal standards and policies applicable to AMP’s operations.
As required by the Corporations Act 2001, Australian fi nancial services licensed entities have adopted individually tailored confl ict of interest policies.
While the board is responsible for AMP’s compliance framework, the Audit Committee assists the board by monitoring and evaluating AMP’s compliance. Consistent with AMP’s risk management approach, AMP’s compliance measures are subject to monitoring and continuous improvement. Any compliance issues or incidents are reported quarterly to the Audit Committee, or more urgently, if required.
Code of conduct(ASX Best Practice Recommendations 3.1 and 3.3)Promote ethical and responsible decision-making
AMP has adopted a code of conduct outlining the standards of personal and corporate behaviour required of all directors, offi cers and employees.
AMP ANNUAL REPORT 2007 37

AMP’s Market Disclosure Committee ensures that company announcements:– are made in a timely manner– are factual– are expressed in a clear and objective manner that allows
investors to assess the impact of the information when making investment decisions, and
– do not omit material information.
Shareholders can elect to receive all communications electronically or not to receive some communication materials by contacting our share registry or visiting our website.
AMP’s Market Disclosure Policy is available on AMP’s website.
Annual General Meeting (AGM)(ASX Best Practice Recommendations 6.1 and 6.2)Rights of shareholders
All shareholders are encouraged to attend and/or participate in AMP’s AGM. The meeting is webcast live or shareholders can attend in person or send a proxy as their representative. Online proxy voting is also available for all shareholders prior to the meeting. Unless indisposed, all directors and senior management attend the meeting, along with the external auditor.
Full details of the next AGM are included in the mailing for this Annual Report and are available on AMP’s website.
Social responsibility (ASX Best Practice Recommendation 10.1)Recognise the legitimate interests of stakeholders
AMP’s purpose is helping people to manage their fi nances so they an enjoy the future they want. This in itself is an important social responsibility. We also make a positive contribution to the communities in which we operate through the investment activities of the AMP Foundation.
AMP’s Social Responsibility Plan is endorsed by the board. Our strategy is to identify and act on a small number of issues that are close to our core business where we can make a difference. We will not seek publicity around these activities – our actions will speak for us – and we will be open and honest around what we are doing and why.
AMP’s Social Responsibility Plan, summarised below, looks at our social responsibilities from four perspectives and outlines our objectives for each. For AMP, Community relates to the general community in Australia and New Zealand; Marketplace encompasses our planners, customers and suppliers; Workplace is our employees; and Environment is the natural world.
While the CEO has overall responsibility for the delivery of our Social Responsibility Plan, this responsibility reaches much further into AMP, with senior management and many other employees directly involved.
AMP’s community program is available on AMP’s website.
Comparison of NZX and ASX Corporate Governance rules As an overseas listed issuer, AMP is deemed to satisfy and comply with the New Zealand Stock Exchange (NZX) Listing Rules so long as it remains listed on the Australian Stock Exchange (ASX). The only NZX requirements applicable to AMP are to give the NZX the same information and notices it is required to give to the ASX and to include a statement (referred to below) in its annual report.
Some material differences may exist between the corporate governance rules and principles of the ASX and NZX. This may arise because the relevant matters are mandatory under the NZX Corporate Governance Rules but are only best practice recommendations under the ASX Corporate Governance Rules (requiring disclosure of non compliance in the Annual Report).
Communitythe general community in Australia and New Zealand
Marketplaceencompassing our planners, customers and suppliers
Workplaceour employees
Environmentour impact on the natural world
2007 social responsibility framework
Helping to increase the effectiveness of Australia and New Zealand’s retirement income systems so that people can better prepare and provide for themselves in retirement. This includes increasing individual saving rates through
superannuation, and ensuring that people seek financial advice so as to maximise their retirement income
Helping to lift the standard of financial advice available to all Australians and New Zealanders. This includes working to improve how well people understand how to manage their money
to prepare for retirement
Influencing investee companies to improve their corporate governance, operational, environmental and social practices with the objective of maximising returns to their shareholders
Building community involvement programs that have a positive
impact on the community and are aligned to AMP’s business
Building sustainable supply chains that benefit both AMP and the supplier, and include social and
environmental standards
Encouraging AMP employees to increase their skills and
capabilities so they are more effective both within and
outside AMP
Embracing diversity to spur innovation, broaden
our perspective and attract, engage and retain talent
Increasing the efficiency of AMP’s operations and reducing
its environmental footprint
38 AMP ANNUAL REPORT 2007
Corporate governance continued

Table of contents
Income statement 40Balance sheet 41Statement of recognised income and expenses 42Statement of cash flows 43Notes to the financial statements 441. Summary of significant accounting policies 442. Segment information 533. Income 554. Expenses 565. Income tax 576. Receivables 587. Equity, debt and property securities and other financial assets 598. Investment property 609. Property, plant and equipment 6110. Other assets 6111. Intangibles 6212. Payables 6313. Provisions 6314. Borrowings 6415. Subordinated debt 6416. Dividends 6517. Contributed equity 6618. Reserves and retained earnings 6719. Life insurance contracts 6920. Other life insurance and investment contracts disclosures 7621. Discontinued operations held for sale 7822. Risk management and financial instruments information 8123. Capital management 9024. Notes to the statement of cash flows 9225. Earnings per share 9326. Superannuation funds 9427. Share-based payments 9728. Group controlled entity holdings 10229. Investments in associated entities 10830. Forward investments, leasing and other commitments 10931. Contingent liabilities 10932. Related-party disclosures 11033. Auditors’ remuneration 11334. Events occurring after reporting date 113Directors’ declaration 114Independent audit report 115
AMP FULL FINANCIAL REPORT 2007 39
for the year ended 31 December 2007
Full Financial Report

Consolidated Parent
Note 2007 2006 2007 2006 $m $m $m $m
Income and expenses of policyholders, shareholders and external unitholders1
Insurance premium and related revenue 3 930 896 – –Fee revenue 3 1,601 1,374 18 13 Other revenue 3 338 167 – –Investment gains and losses 3 8,128 11,791 813 509Insurance claims and related expenses 4 (1,349) (1,271) – –Operating expenses 4 (2,392) (2,093) (18) (12)Finance costs 4 (783) (616) – –Movement in external unitholders’ liabilities (815) (1,522) – –Change in policyholder liabilities before accounting mismatches– life insurance contracts2 (201) (794) – –– investment contracts2 (4,149) (6,263) – –Income tax (expense) credit 5 (445) (781) 90 57
Profit attributable to shareholders of AMP Limited from continuing operations before accounting mismatches 863 888 903 567
Profit from discontinued operations held for sale after income tax 21 193 88 – –
Net profit attributable to shareholders of AMP Limited before accounting mismatches 1,056 976 903 567
Unmatched changes in policyholder liabilities (accounting mismatches) due to:2 – treasury shares (30) (77) – –– investment in controlled entities of the statutory funds (37) (20) – –– other (4) 36 – –
Net profit attributable to shareholders of AMP Limited 985 915 903 567
Footnote:1 Income and expenses include amounts attributable to shareholder interests and also policyholder interests in the life statutory funds. Amounts included in
respect of the life statutory funds have a substantial impact on most of the consolidated Income statement lines, especially Investment gains and losses. In general, policyholders’ interests in the transactions for the period are attributed to them in the lines Change in policyholder liabilities before accounting mismatches and Unmatched changes in policyholder liabilities (accounting mismatches).
2 As explained further in Note 1(d), accounting mismatches arise because the recognition and measurement rules for certain policyholder assets differ from the recognition and measurement rules for the actual liability to policyholders in respect of the same assets. These mismatches result in policyholder asset movements impacting the Net profit after accounting mismatches and increased volatility of the reported profit.
Earnings per ordinary share Note cents cents
Basic from continuing operations before accounting mismatches 25 46.7 48.1 Diluted from continuing operations before accounting mismatches 25 46.5 47.9 Basic from continuing operations after accounting mismatches 25 42.8 44.8 Diluted from continuing operations after accounting mismatches 25 42.7 44.6 Basic after accounting mismatches 25 53.3 49.6 Diluted after accounting mismatches 25 53.1 49.3
40 AMP FULL FINANCIAL REPORT 2007
for the year ended 31 December 2007
Income statement
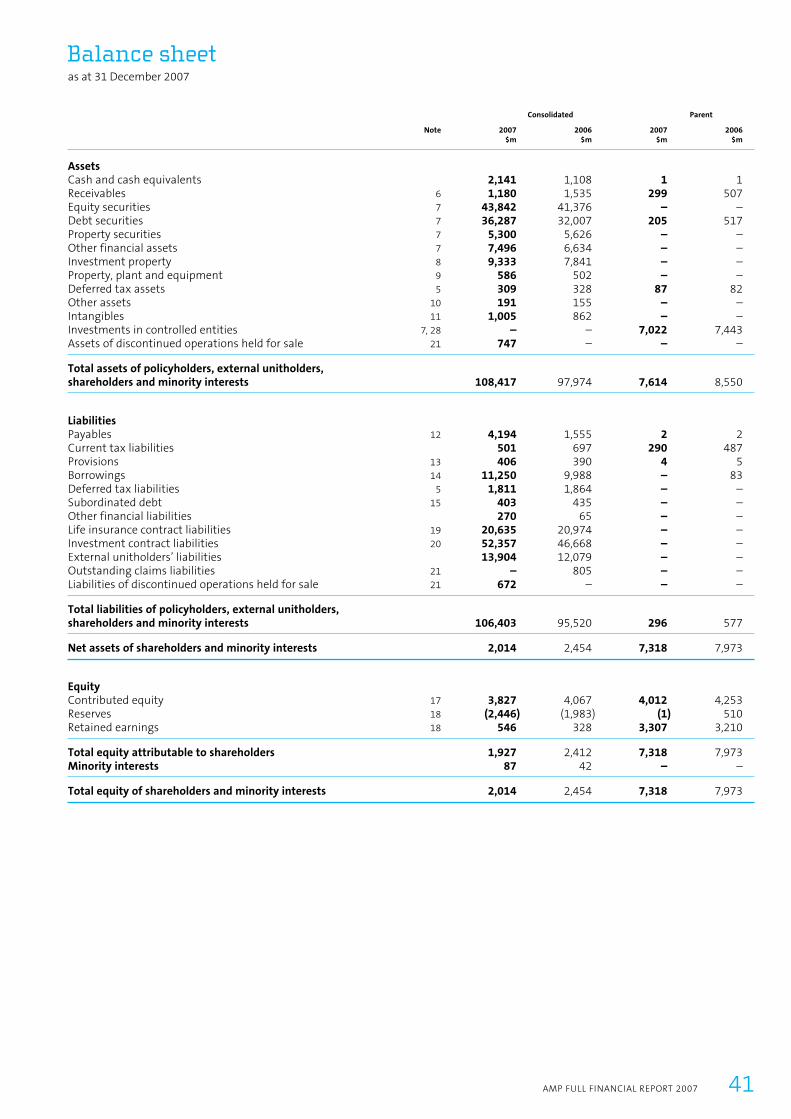
Consolidated Parent
Note 2007 2006 2007 2006 $m $m $m $m
AssetsCash and cash equivalents 2,141 1,108 1 1 Receivables 6 1,180 1,535 299 507 Equity securities 7 43,842 41,376 – –Debt securities 7 36,287 32,007 205 517 Property securities 7 5,300 5,626 – –Other financial assets 7 7,496 6,634 – –Investment property 8 9,333 7,841 – –Property, plant and equipment 9 586 502 – –Deferred tax assets 5 309 328 87 82 Other assets 10 191 155 – –Intangibles 11 1,005 862 – –Investments in controlled entities 7, 28 – – 7,022 7,443 Assets of discontinued operations held for sale 21 747 – – –
Total assets of policyholders, external unitholders, shareholders and minority interests 108,417 97,974 7,614 8,550
LiabilitiesPayables 12 4,194 1,555 2 2 Current tax liabilities 501 697 290 487 Provisions 13 406 390 4 5 Borrowings 14 11,250 9,988 – 83 Deferred tax liabilities 5 1,811 1,864 – –Subordinated debt 15 403 435 – –Other financial liabilities 270 65 – –Life insurance contract liabilities 19 20,635 20,974 – –Investment contract liabilities 20 52,357 46,668 – –External unitholders’ liabilities 13,904 12,079 – –Outstanding claims liabilities 21 – 805 – –Liabilities of discontinued operations held for sale 21 672 – – –
Total liabilities of policyholders, external unitholders, shareholders and minority interests 106,403 95,520 296 577
Net assets of shareholders and minority interests 2,014 2,454 7,318 7,973
EquityContributed equity 17 3,827 4,067 4,012 4,253 Reserves 18 (2,446) (1,983) (1) 510 Retained earnings 18 546 328 3,307 3,210
Total equity attributable to shareholders 1,927 2,412 7,318 7,973 Minority interests 87 42 – –
Total equity of shareholders and minority interests 2,014 2,454 7,318 7,973
AMP FULL FINANCIAL REPORT 2007 41
as at 31 December 2007
Balance sheet
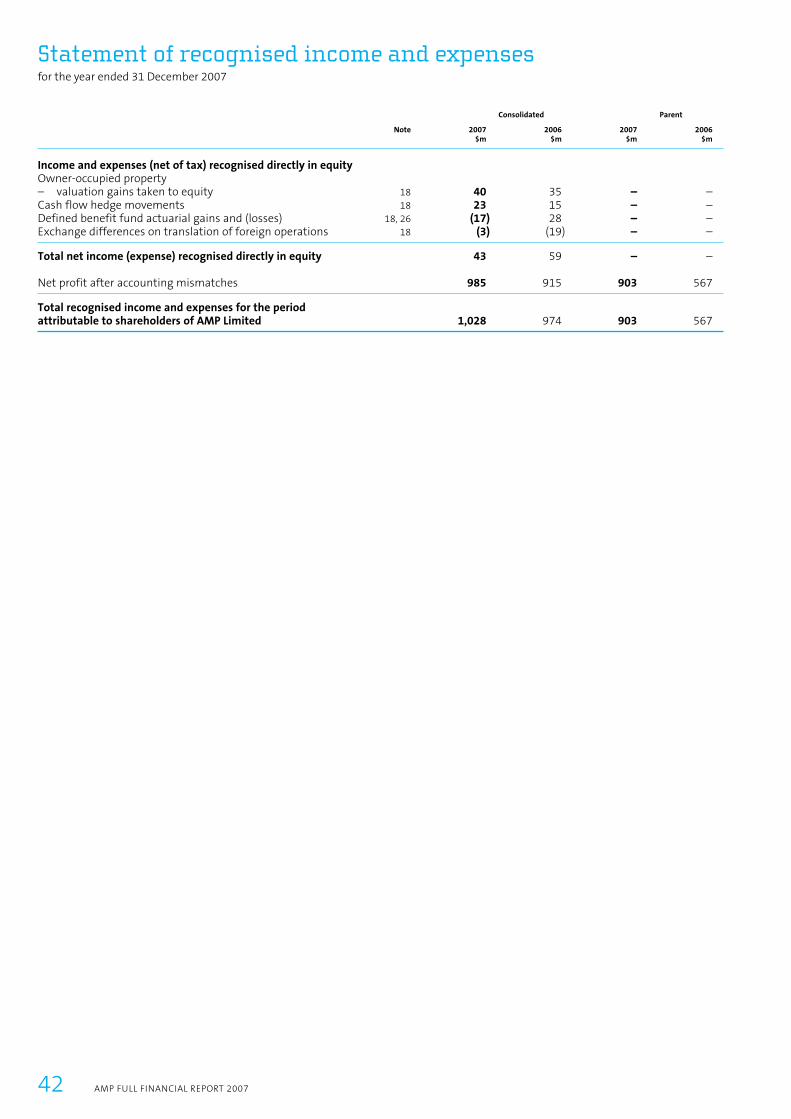
Consolidated Parent
Note 2007 2006 2007 2006 $m $m $m $m
Income and expenses (net of tax) recognised directly in equityOwner-occupied property– valuation gains taken to equity 18 40 35 – – Cash flow hedge movements 18 23 15 – –Defined benefit fund actuarial gains and (losses) 18, 26 (17) 28 – –Exchange differences on translation of foreign operations 18 (3) (19) – –
Total net income (expense) recognised directly in equity 43 59 – –
Net profit after accounting mismatches 985 915 903 567
Total recognised income and expenses for the period attributable to shareholders of AMP Limited 1,028 974 903 567
42 AMP FULL FINANCIAL REPORT 2007
for the year ended 31 December 2007
Statement of recognised income and expenses

Consolidated Parent
Note 2007 2006 2007 2006 $m $m $m $m
Cash flows from operating activities1 24(a)Cash receipts in the course of operations 17,161 13,623 27 4 Interest and other items of a similar nature received 1,793 1,459 2 2 Dividends received 739 616 811 506 Distributions received 4,798 2,778 – – Cash payments in the course of operations (16,523) (12,795) (21) (14)Finance costs (797) (659) – – Income tax refunded (paid) (849) (375) 89 10
Cash flows from (used in) operating activities 6,322 4,647 908 508
Cash flows from investing activities1
Net proceeds from sale of/(payments to acquire):– investment property (486) (895) – –– equity securities and unit trusts (4,148) 721 – –– interest bearing securities 152 (2,787) – –– loans (1,100) (1,390) – – – other investments 65 1 – –Proceeds from loans from controlled entities – – 310 57 Proceeds from capital return from controlled entity – – 421 750 Payments to acquire controlled and associated companies2,3 (36) (80) – –Proceeds from disposal of controlled and associated companies2,3 – 342 – –
Cash flows from (used in) investing activities (5,553) (4,088) 731 807
Cash flows from financing activities1
Proceeds from borrowings – non Banking operations 937 646 – 129 Net movement in borrowings – Banking operations 1,107 452 – –Net movement in deposits from customers (296) 60 – –Repayment of borrowings (303) (131) (83) (46)Payment of capital return4 (738) (739) (750) (750)Dividends paid5 (795) (639) (806) (649)
Cash flows from (used in) financing activities (88) (351) (1,639) (1,316)
Net increase (decrease) in cash 681 208 – (1)Balance at the beginning of the period 5,808 5,600 1 2 Effect of exchange rate changes on cash balances (3) – – –
Balance at the end of the period6 24(b) 6,486 5,808 1 1
Footnote: 1 Amounts include cash flows attributable to discontinued operations held for sale. See Note 21 for further information.2 Cash flows mainly relate to acquisitions and disposals during the year of operating companies controlled by the life statutory funds which carry out business
operations unrelated to the core wealth management operations of the AMP group.3 Net of cash acquired or disposed. 4 Payment of capital return is presented net of the capital return on ‘treasury shares’. See Note 17 for further information.5 Dividends paid is presented net of dividends reinvested and dividends on ‘treasury shares’. See Note 16 for further information.6 Current period disclosures reflect a reinterpretation of the definition of cash for the purposes of the cash flow statement including the removal of certain
investment related cash balances which are more appropriately defined as non-cash balances. Comparative information in relation to the closing cash balance has been reclassified to be consistent with current period disclosure causing a reduction in the closing balance of cash at 31 December 2006 of $3,063m.
AMP FULL FINANCIAL REPORT 2007 43
for the year ended 31 December 2007
Statement of cash fl ows
The consolidated economic entity (the AMP group) comprises AMP Limited (the parent entity), a company limited by shares, and all entities that it controlled during the year and at the balance date.
(a) Basis of preparation This general purpose Financial Report has been prepared in accordance with Australian Accounting Standards, other authoritative pronouncements of the Australian Accounting Standards Board (AASB), and the Corporations Act 2001.
Australian Accounting Standards include Australian equivalents to International Financial Reporting Standards (AIFRS). Compliance with AIFRS ensures that this Financial Report, comprising the financial statements and the notes thereto, complies with International Financial Reporting Standards.
The principal accounting policies adopted in the preparation of the Financial Report are set out below. These policies have been consistently applied to the current year and comparative period, unless otherwise stated. The same accounting policies and methods of computation are followed by this Financial Report as compared with the 31 December 2006 annual Financial Report except as described below. Where necessary, comparative information has been reclassified to be consistent with current period disclosures.
The AMP group is predominantly a wealth-management business conducting operations through AMP Life Limited (AMP Life), a registered life insurance company, and other entities. As described in Note 1(c) below, the assets, liabilities, income and expenses arising from investment contracts and life insurance contracts are measured predominantly on the basis of fair value. Subject to the exceptions noted in the accounting policies below, other assets and liabilities in this Financial Report are also measured on a fair value basis.
Assets and liabilities have been presented on the face of the Balance sheet in decreasing order of liquidity and do not distinguish between current and non-current items. The majority of the assets of the AMP group are investment assets held to back investment contract, life insurance contract and general insurance contract liabilities. Although the amount of those assets which may be realised and those liabilities which may be settled within 12 months of the reporting date is not always known, estimates have been provided in Note 20 (for life statutory funds) and Note 21 (for discontinued operations). Details of other amounts expected to be recovered or settled (a) no more than 12 months after the reporting date, and (b) more than 12 months after the reporting date, have been provided in footnotes to the relevant notes.
Australian Accounting Standards issued but not yet effectiveAustralian Accounting Standards that have recently been issued or amended but are not yet effective have not been adopted for the reporting period ending 31 December 2007. When applied in future periods, these recently issued or amended standards are not expected to have a material impact on the company’s results or financial position; however they may impact Financial Report disclosures.
Changes in accounting policySince 1 January 2007, the AMP group has adopted a number of Australian Accounting Standards and Interpretations which were mandatory for annual periods beginning on or after 1 January 2007. Adoption of these Standards and Interpretations has not had any effect on the financial position or performance of the AMP group.
(b) Principles of consolidationThis Financial Report consolidates the financial information of controlled entities. Control is determined as the power to govern the financial and operating policies of an entity or business so as to obtain benefits from its activities. In certain cases an entity or business may be controlled even though the AMP group does not own more than half of the voting power.
In these cases control has been determined based on the AMP group’s power to obtain benefits from the entity or business.
The financial information for subsidiaries is prepared for the same reporting period as the parent entity using consistent accounting policies. Where dissimilar accounting policies may exist, adjustments are made to bring these into line.
AMP Life conducts wealth-management business (see Note 1(c) below) through separate life statutory funds. Transactions in respect of policyholder activities within the life statutory funds are consolidated into the AMP group Financial Report, along with all activities attributable to the shareholders of the parent entity.
The life statutory funds include controlling interests in unit trusts and companies. The total amounts of each underlying asset, liability, income and expense of the controlled entities are recognised in the consolidated financial statements.
When a controlled unit trust is consolidated, the share of the unitholder liability attributable to the AMP group is eliminated but amounts due to external unitholders remain as liabilities in the consolidated Balance sheet.
The share of the net assets of controlled companies attributable to minority interests is disclosed separately on the Balance sheet. In the Income statement, the net profit or loss of the controlled entities relating to minority interests is removed before determining the net profit or loss attributable to shareholders of the parent entity.
Controlled entities that are acquired are accounted for using the purchase method of accounting. Information from the financial reports of controlled entities is included from the date the parent entity obtains control until such time as control ceases. Where the AMP group ceases to control an entity, the consolidated Financial Report includes the results for the part of the reporting period during which the parent entity had control. All inter-company balances and transactions are eliminated in full, including unrealised profits arising from intra-group transactions.
There have been no acquisitions or disposals of controlled entities or other changes in the composition of the AMP group during the year, which would require disclosures significant to an understanding of this Financial Report. Those acquisitions and disposals which took place during the year were largely a result of the investment activities of the life statutory funds.
Securitisation vehiclesThe banking operation of the AMP group sells mortgage loans to securitisation vehicles (also referred to as special purpose entities) through its loan securitisation program. These securitisation vehicles are deemed by accounting standards to be controlled by the AMP group and are therefore consolidated.
(c) Accounting for wealth-management and insurance businessThe accounting treatment of certain transactions in this Financial Report varies depending on the nature of the contract underlying the transactions. The three major contract classifications relevant to the wealth-management and insurance business of the AMP group are:– investment contracts– life insurance contracts, and – general insurance contracts.
The other transactions of the AMP group, not covered by the areas listed above, are predominantly investment management services and banking.
For the purposes of this Financial Report, holders of investment contracts or life insurance contracts are collectively and individually referred to as policyholders.
Investment contractsThe majority of the business of AMP Life relates to wealth- management products such as savings, investment-linked and retirement income policies.
1. Summary of signifi cant accounting policies
44 AMP FULL FINANCIAL REPORT 2007
for the year ended 31 December 2007
Notes to the fi nancial statements

The nature of this business is that AMP Life receives deposits from policyholders and those funds are invested on behalf of the policyholders. With the exception of fixed retirement income policies, the resulting liability to policyholders is linked to the performance and value of the assets that back those liabilities. For fixed retirement income policies, the resulting liability is linked to the fair value of the fixed retirement income payments and associated management services.
Under accounting standards such contracts are defined as life investment contracts and described as investment contracts throughout this Financial Report.
Life insurance contractsAMP Life also issues contracts that transfer significant insurance risk from the policyholder, covering death, disability or longevity of the insured. In addition, there are some policies that are similar to investment contracts, but the timing of the vesting of the profit attributable to the policyholders is at the discretion of AMP Life. These policies are referred to as discretionary participating contracts.
Under accounting standards, such contracts are defined as life insurance contracts.
General insurance contractsThe general insurance operations of the AMP group comprise the management of the outstanding claims liability on previously issued direct and reinsurance contracts. These contracts transfer significant insurance risk by agreeing to compensate the insured on the occurrence of a specified insured event, such as damage to property or the crystallisation of a third party liability (or the reinsurance thereof), within a given timeframe.
Under accounting standards, such contracts are defined as general insurance contracts.
Assets backing investment contract and life and general insurance contract liabilitiesThese assets are measured on a basis that is consistent with the measurement of the liabilities, to the extent permitted under accounting standards.
As life insurance contract liabilities and general insurance contract liabilities are measured as described in Note 1(x) and 1(r) and investment contract liabilities are measured at fair value, per Note 1(w), assets backing such liabilities are measured at fair value, to the extent permitted under accounting standards. Realised and unrealised gains and losses arising from changes in the fair value are recognised in the Income statement, to the extent permitted under accounting standards. The accounting policies for individual asset classes, and any restrictions on application of fair value, are described below.
All assets that back investment contract and life insurance contract liabilities are included within the life statutory funds and, as such, are separately identifiable. The general insurance business also maintains separate insurance funds that segregate the assets backing general insurance contract liabilities.
General insurance contracts and the assets backing general insurance contracts, form part of the general insurance operations which have been classified as discontinued operations held for sale. For further details see Note 21.
Assets not backing investment and insurance contract liabilitiesTo ensure consistency across the AMP group, and except where specifically stated otherwise, all financial assets and all non-financial assets, including those not backing investment or insurance contract liabilities, are recognised at fair value to the extent permitted under accounting standards. Similarly, adjustments to the value of such assets are recognised in the Income statement when the corresponding accounting standards allow such treatment. The accounting policy for the parent entity’s investments in controlled entities is set out in Note 1(k).
(d) Accounting mismatchesUnder AIFRS, accounting mismatches arise from some of the life statutory funds’ transactions because the recognition and measurement rules for certain policyholder assets differ from the recognition and measurement rules for the liability to policyholders in respect of the same items. These mismatches result in policyholder asset movements impacting the net profit after income tax attributable to shareholders and increase volatility of the reported profit. Accounting mismatches primarily arise in respect of:– gains and losses on ‘treasury shares’– gains and losses on investments in controlled entities
of the life statutory funds– gains and losses on owner-occupied properties– discounting of deferred tax balances in the valuation
of investment contract liabilities.
The International Accounting Standards Board (IASB) has discussed accounting mismatches at previous Board meetings. The IASB has confirmed that “it would be preferable to eliminate such [mismatch] effects” and the IASB is reviewing alternative accounting treatments to address the accounting mismatch issue. These discussions are part of the wider IASB Insurance Contracts (Phase II) project, which has a long time frame.
‘Treasury shares’The Australian Securities and Investments Commission (ASIC) has granted relief from restrictions in the Corporations Act 2001 to allow AMP Life to hold and trade shares in AMP Limited as part of the policyholder funds’ investment activities. These shares (defined by accounting standards as ‘treasury shares’) are held on behalf of policyholders and, as a result, the life statutory funds also recognise a corresponding liability to policyholders.
Under AIFRS, the AMP group cannot recognise ‘treasury shares’ on the consolidated Balance sheet. These assets, plus any corresponding Income statement fair value movement on the assets and dividend income, are eliminated when the life statutory funds are consolidated into the AMP group. The cost of the investment in the shares is deducted from contributed equity.
However, the corresponding investment contract and insurance contract liabilities, and related Income statement change in the liabilities, remain upon consolidation. At the AMP group consolidated level, this mismatch results in policyholder asset movements reducing the net profit after income tax attributable to shareholders by $30m (2006: $77m).
Investments in controlled entities of the life statutory fundsThe majority of the life statutory funds’ investments are held through controlling interests in a number of separate entities and these investments are measured at fair value. These investment assets are held on behalf of policyholders, and, as a result, the life statutory funds also recognise a corresponding liability to the policyholder.
Consolidation principles require the underlying net assets of the controlled entities to be recognised in the consolidated financial statements. The value of the underlying assets recognised will not necessarily be the same value as the life statutory funds’ value of investments in the controlled entities.
However, the corresponding investment contract and insurance contract liabilities, and related Income statement change in the liabilities, remain upon consolidation. At the AMP group consolidated level, this mismatch results in policyholder asset movements reducing the net profit after income tax attributable to shareholders by $37m (2006: $20m).
Owner-occupied property Under AIFRS, property owned by the AMP group, which is also occupied by the AMP group, is considered property, plant and equipment in the consolidated Balance sheet. Upward revaluations of owner-occupied property are recognised in equity.
1. Summary of signifi cant accounting policies continued
AMP FULL FINANCIAL REPORT 2007 45
Downward revaluations are recognised in the Income statement to the extent that they exceed previous upward revaluations of the same property.
However, to the extent any such property is held by the AMP life statutory funds, investment contract and life insurance contract liabilities are required to reflect owner-occupied property at fair value, with movements in those liabilities recognised in the Income statement. This mismatch results in policyholder asset movements reducing the net profit after income tax attributable to shareholders by $11m (2006: $26m).
Discounting of deferred tax balances in the valuation of investment contract liabilitiesThe calculation of investment contract liabilities for unit linked business includes a deduction for the policyholders’ share of current tax payable and deferred tax balances of the AMP group. Historically, the deferred tax relating to unit linked business was discounted in setting unit prices, where relevant, and therefore in the calculation of investment contract liabilities. AIFRS does not allow discounting of deferred tax for financial reporting purposes and, as a result, there has been an historical mismatch between the deferred tax retained within investment contract liabilities and that reported within the financial statements.
During 2006, a decision was made on the advice of the Appointed Actuary, having regard to the equity of policyholders and the circumstances of the investment sectors, to move to a non-discounted approach for deferred tax for those investment sectors where discounting was previously applied. The removal of the discounting of deferred tax reverses these accounting mismatches recognised in prior periods. This reversal increases net profit after income tax attributable to shareholders by $7m (2006: $62m). The discounting of deferred tax has been completely reversed as at the end of the period.
(e) Cash and cash equivalentsCash and cash equivalents comprise cash on hand that is available on demand and deposits that are held at call with financial institutions. Cash and cash equivalents are carried at fair value, being the principal amount. For the purpose of the cash flow statement, cash also includes other highly liquid investments not subject to significant risk of change in value, with short periods to maturity, net of outstanding bank overdrafts. Bank overdrafts are shown within borrowings in the Balance sheet.
(f) ReceivablesReceivables are financial assets and are measured at fair value. Given the short-term nature of most receivables, the recoverable amount approximates fair value. Reinsurance and other recoveries receivable are discounted to present value in a manner consistent with the outstanding claims liability. See Note 1(r).
(g) Equity securitiesEquity securities are financial assets and are initially recognised at fair value. Initial fair value is determined as the purchase cost of the asset, exclusive of any transaction costs. Equity securities are subsequently measured at fair value with any realised and unrealised gains or losses arising from changes in the fair value being recognised in the Income statement in the period in which they arise.
The fair value of a quoted equity security reflects the quoted bid price at the Balance sheet date. In the case of certain assets backing investment contract and life insurance contract liabilities there is no active market for these equity securities. A fair value is established using valuation techniques including the use of recent arm’s length transactions, reference to other instruments that are substantially the same, discounted cash flow analysis and option-pricing models. There is no reduction for realisation costs in the value of an equity security.
Investments in associatesInvestments in associated entities that back investment contract and life insurance contract liabilities are treated as financial assets. These are valued in the same manner as equity securities described above.
(h) Debt securitiesDebt securities are financial assets and are initially recognised at fair value. Initial fair value is determined as the purchase cost of the asset exclusive of any transaction costs. For debt securities held by AMP’s banking operations, initial fair value is determined as the purchase cost of the asset inclusive of any directly attributable transaction costs.
Debt securities, except for those held by AMP’s banking operations, are subsequently measured at fair value, with any realised and unrealised gains or losses arising from changes in the fair value being recognised in the Income statement for the period in which they arise. The fair value of a traded interest-bearing security reflects the bid price at the Balance sheet date. Interest-bearing securities that are not frequently traded are valued by discounting the estimated recoverable amounts, using prevailing interest rates. There is no reduction for realisation costs in the value of a debt security. Unlisted interest-bearing securities are valued using interest rate yields obtainable on comparable listed investments. The fair value of loans is established by discounting the estimated recoverable amount using prevailing interest rates. There is no reduction for realisation costs in the value of a debt security.
Debt securities held by AMP’s banking operations are subsequently carried at amortised cost using the effective interest rate method.
(i) Property securitiesProperty securities, comprising investments in property trusts, are financial assets and are initially recognised at fair value. Initial fair value is determined as the purchase cost of the asset exclusive of any transaction costs. Property securities are subsequently measured at fair value with any realised and unrealised gains or losses arising from changes in the fair value being recognised in the Income statement for the period in which they arise.
The fair value of a listed property security reflects the bid price at the Balance sheet date. If there is no active market for a property security, a fair value is established using valuation techniques. These include the use of recent arm’s length transactions, reference to other instruments that are substantially the same, discounted cash flow analysis, and option-pricing models. There is no reduction for realisation costs in the value of a property security.
The accounting policies for directly held investment property and owner-occupied property are described in Notes 1(l) and (m) respectively.
(j) Other financial assetsOther financial assets include investments in joint ventures and partnerships, units held in cash trusts and diversified trusts and derivatives. See Note 1(u).
Investments in joint ventures and partnershipsInvestments in joint ventures and partnerships that back investment contract and life insurance contract liabilities are treated as financial assets and are valued in the same manner as previously described for equity securities described above. See Note 1(g).
Cash trusts and diversified trustsThe fair value of units in a listed cash trust or diversified trust reflects the quoted bid price at the Balance sheet date. There is no reduction for realisation costs in the value of units in a cash trust.
(k) Investments in controlled entitiesInvestments by AMP Limited in controlled entities are recorded at cost (which, in the case of the investment in AMP Group Holdings Limited, was determined as net asset value on demutualisation) less any accumulated impairment losses.
1. Summary of signifi cant accounting policies continued
46 AMP FULL FINANCIAL REPORT 2007
Notes to the fi nancial statements continued
for the year ended 31 December 2007

(l) Investment propertyInvestment property is held to earn revenue from rentals and/or for the purposes of capital appreciation. Investment property includes all directly held freehold and leasehold properties but excludes owner-occupied properties. See Note 1(m) below.
Investment property is initially measured at cost, including transaction costs, and is subsequently measured at fair value. Any gains or losses arising from changes in fair value are recognised in the Income statement in the period in which they arise.
All property valuations are undertaken at least annually by independent registered valuers. Fair value is based on appropriate market evidence using earnings capitalisation, discounted cash flow analysis, comparable sales transactions or a combination of these methods. The valuations are adjusted, if necessary, for any difference in the nature, location or condition of the specific asset. Investment property that is being redeveloped for continuing use as investment property, or for which the market has become less active, continues to be measured at fair value. There is no reduction for realisation costs in the value of investment property.
(m) Property, plant and equipmentOwner-occupied propertyWhere the whole or a significant portion of a property owned by the AMP group is held for use by the group in the production or supply of goods or services, or for administrative purposes, that property is classified for accounting purposes as owner-occupied property.
Owner-occupied property is initially measured at cost, including transaction costs. It is subsequently measured at the revalued amount, being its fair value at the date of the revaluation, less any subsequent accumulated depreciation and accumulated impairment losses. Fair value is determined on the same basis as investment property in Note 1(l) above.
When a revaluation increases the carrying value of a property, the increase is recognised directly in equity in the owner-occupied property revaluation reserve. However, an increase is recognised in the Income statement to the extent that it reverses a revaluation decrease of the same asset previously recognised in the Income statement. When the carrying value of an asset is decreased as a result of a revaluation, the decrease is recognised in the Income statement. However, any decrease is recognised in the revaluation reserve to the extent that it reverses a balance existing in the reserve in respect of that asset.
Gains or losses on disposals are determined by comparing proceeds with the carrying amount and are recognised in the Income statement. The balance of the revaluation reserve, in respect of a property disposed of, is transferred to retained earnings.
Each part of an owner-occupied property, except land, that is significant in relation to the total property is depreciated on a systematic basis over the useful life of the asset, being a period not exceeding 40 years.
Plant and equipmentPlant and equipment is initially measured at cost, including transaction costs. It is subsequently measured at cost less any subsequent accumulated depreciation and accumulated impairment losses. The written down amount approximates fair value.
Each item of plant and equipment is depreciated on a systematic basis over the useful life of the asset of 3–10 years.
(n) Intangible assetsGoodwillGoodwill is initially measured as the excess of the cost of a business combination over the acquirer’s interest in the fair value of the identifiable net assets acquired at the date of acquisition. Subsequently, goodwill is carried at cost less any accumulated impairment losses.
Goodwill is not subject to amortisation but is tested for impairment annually or more frequently if events or changes in circumstances indicate that the carrying value may be impaired. For the purposes of assessing impairment of goodwill, assets are grouped at the lowest levels for which there are separately identifiable cash flows (cash-generating units). Impairment is determined by assessing the recoverable amount of the cash-generating unit to which the goodwill relates. Where the recoverable amount of the cash-generating unit is less than the carrying amount of the assets, including goodwill, an impairment loss is recognised in the Income statement.
Management rightsRights to receive fees for asset management services acquired either directly or as part of a business combination are recognised as an intangible asset when they can be separately identified and reliably measured and it is probable that the expected benefits will flow to the AMP group. Management rights are initially measured at cost. All management rights have been assessed to have an indefinite useful life as the contractual rights to manage the assets have no fixed term. Management rights are not amortised but are tested for impairment annually or more frequently if events or changes in circumstances indicate that the carrying value may be impaired.
Capitalised costsCosts are capitalised and carried forward only where the costs relate to the creation of an asset with expected future economic benefits which are capable of reliable measurement. Otherwise, all costs are recognised as expenses in the period in which they are incurred. Capitalised costs are amortised over the estimated useful life of the asset, being a period not exceeding five years, commencing at the time the asset is first put into use or held ready for use (whichever is the earlier).
Other intangible assetsOther intangible assets comprise acquired customer relationships These intangible assets are a result of business combinations and are recognised when they can be separately identified, reliably measured and it is probable that the expected benefits will flow to the AMP group. These intangible assets are initially measured at cost and are subsequently amortised over their estimated useful life.
(o) Impairment of assetsAssets measured at fair value, where changes in value are reflected in the Income statement, are not subject to impairment testing. As a result, all financial assets, except debt securities held by AMP’s banking operations, and investment properties are not subject to impairment testing. Other assets such as property, plant and equipment, goodwill, intangibles, borrowings and debt securities held by AMP’s banking operations are subject to impairment testing.
Assets that have an indefinite useful life, such as goodwill, are not subject to amortisation but are tested at least annually for impairment. Assets that are subject to amortisation are reviewed for impairment whenever events or changes in circumstances indicate that the carrying amount may not be recoverable.
An impairment loss is recognised in the Income statement, being the amount by which the carrying amount of an asset exceeds its recoverable amount. The recoverable amount is the higher of an asset’s fair value (including realisation costs) and its value in use.
(p) TaxesTax consolidationAMP Limited and wholly-owned controlled entities of AMP Limited comprise a tax-consolidated group of which AMP Limited is the head entity. The implementation date for the tax-consolidated group was 30 June 2003.
1. Summary of signifi cant accounting policies continued
AMP FULL FINANCIAL REPORT 2007 47

Under tax consolidation, AMP Limited, as head entity, assumes the following balances from subsidiaries within the tax-consolidated group:– current tax balances arising from external transactions
recognised by entities in the tax-consolidated group, occurring after the implementation date
– deferred tax assets arising from unused tax losses and unused tax credits recognised by entities in the tax-consolidated group.
A tax funding agreement has been entered into by the head entity and the controlled entities in the tax-consolidated group. Controlled entities in the tax-consolidated group continue to be responsible, by the operation of the tax funding agreement, for funding tax payments required to be made by the head entity arising from underlying transactions of the controlled entities. Controlled entities make (receive) contributions to (from) the head entity for the balances recognised by the head entity, described in the points above. The contributions are calculated in accordance with the tax funding agreement. The contributions are payable as set out in the agreement and reflect the timing of AMP Limited’s obligations to make payments to the relevant tax authorities.
Assets and liabilities which arise as a result of balances transferred from entities within the tax-consolidated group to the head entity, are recognised as related-party balances receivable and payable in the Balance sheet. The recoverability of balances arising from the tax funding arrangements is based on the ability of the tax-consolidated group to utilise the amounts recognised by the head entity.
Income tax for investment contracts and life insurance contracts businessThe income tax expense recognised in the Income statement arising in AMP Life reflects tax imposed on shareholders as well as policyholders.
Investment contracts and life insurance contracts liabilities are established net of the policyholders’ share of any current tax payable and deferred tax balances of the AMP group.
Arrangements made with some superannuation funds result in AMP Life making payments to the Australian Taxation Office in relation to contributions tax arising in those funds. The amounts paid are not classified as income tax expense.
Income tax for other businessThe income tax expense for all other business is the tax payable on taxable income for the current period, based on the income tax rate for each jurisdiction and adjusted for changes in deferred tax assets and liabilities attributable to:– temporary differences between the tax bases of assets and
liabilities and their Balance-sheet carrying amounts– unused tax losses.
Deferred taxDeferred tax assets and liabilities are recognised for temporary differences at the tax rates expected to apply when the assets are recovered or liabilities are settled, based on those tax rates which are enacted or substantively enacted for each jurisdiction.
The relevant tax rates are applied to the cumulative amounts of deductible and taxable temporary differences to measure the deferred tax asset or liability. An exception is made for certain temporary differences arising from the initial recognition of an asset or a liability. No deferred tax asset or liability is recognised in relation to these temporary differences if they arose in a transaction, other than a business combination, that at the time of the transaction did not affect either accounting profit or taxable profit or loss.
Deferred tax assets are recognised for deductible temporary differences and unused tax losses only if it is probable that future taxable amounts will be available to utilise those temporary differences and losses.
Deferred tax assets and liabilities are not recognised for temporary differences between the carrying amount and tax bases of investments in controlled entities where the parent entity is able to control the timing of the reversal of the temporary differences and it is probable that the differences will not reverse in the foreseeable future.
Any tax impact on income and expense items recognised directly in equity is also recognised directly in equity.
Deferred tax, including amounts in respect of investment contracts and life insurance contracts, is not discounted to present value.
Goods and services taxThe AMP group operates across a number of tax jurisdictions and offers products and services that may be subject to various forms of goods and services tax (GST) imposed by local tax authorities.
All income, expenses and assets are recognised net of any GST paid, except where they relate to products and services which are input taxed for GST purposes or where the GST incurred is not recoverable from the relevant tax authorities. In such circumstances, the GST paid is recognised as part of the cost of acquisition of the assets or as part of the particular expense.
Receivables and payables are recorded with the amount of GST included. The net amount of GST recoverable from or payable to the tax authorities is included as either a receivable or payable in the Balance sheet.
Cash flows are reported on a gross basis reflecting any GST paid or collected. The GST component of cash flows arising from investing or financing activities which are recoverable from, or payable to, local tax authorities are classified as operating cash flows.
(q) PayablesPayables are financial liabilities and are measured at fair value. Given the short-term nature of most payables, the recoverable amount approximates fair value.
(r) Outstanding claims The outstanding claims liability in respect of general insurance contracts is measured as the best estimate of the present value of expected future payments for claims incurred at the balance date. A risk margin is added to allow for the inherent uncertainty in the best estimate and to increase the probability that the liability is adequately provided for. The level of risk margin applied for financial reporting is the same as that applied for regulatory solvency purposes. The liability includes an allowance for inflation and superimposed inflation and is discounted to present value using a risk-free rate.
Claims incurred at the balance date comprise:– claims which have been reported but not yet paid– claims incurred but not yet reported– claims incurred but not enough reported– the anticipated direct and indirect costs of settling these claims.
Outstanding claims are determined by the Approved Actuary in accordance with Actuarial and Prudential Standards.
Outstanding claims in 2007 form part of the general insurance operations which have been classified as discontinued operations held for sale. For further details see Note 21.
(s) ProvisionsProvisions are recognised when:– The AMP group has a present obligation (legal or constructive)
as a result of a past event.– It is probable that an outflow of resources embodying
economic benefits will be required to settle the obligation.– A reliable estimate can be made of the amount of the
obligation.
Where the AMP group expects some or all of a provision to be reimbursed, for example under an insurance contract,
1. Summary of signifi cant accounting policies continued
48 AMP FULL FINANCIAL REPORT 2007
Notes to the fi nancial statements continued
for the year ended 31 December 2007

the reimbursement is recognised as a separate asset but only when the reimbursement is virtually certain. The expense relating to any provision is presented in the Income statement net of any reimbursement.
If the effect of the time-value of money is material, provisions are determined by discounting the expected future cash flows at a pre-tax rate. This rate reflects the current market assessments of the time-value of money and, where appropriate, the risks specific to the liability.
Employee entitlementsProvision is made for employee entitlements accumulated as a result of employees rendering services up to the balance date. These entitlements include salaries, wages, bonuses, annual leave and long service leave, but exclude share-based payments. See Note 1(gg).
Liabilities arising in respect of salaries and wages, annual leave and any other employee entitlements expected to be settled within 12 months of the reporting date are measured at their nominal amounts. All other employee entitlements are measured at the present value of the estimated future cash outflows to be made in respect of services provided by employees up to the balance date. In determining the present value of future cash outflows, discount rates used are based on the interest rates attaching to government securities, which have terms to maturity approximating the terms of the related liability.
RestructuringA restructuring provision is only recognised when it is probable that future costs will be incurred in respect of a fundamental reorganisation or change in focus of the business of the AMP group. A provision is recognised when the AMP group is demonstrably committed to the expenditure and a reliable estimate of the costs involved can be made. The provision is measured as the best estimate of the incremental, direct expenditures to be incurred as a result of the restructure and does not include costs associated with the ongoing activities of the AMP group.
(t) Borrowings and subordinated debt All borrowings and subordinated debt are financial liabilities and are initially recognised at fair value, net of directly attributable incremental transaction costs.
Borrowings and subordinated debt, other than those held by controlled entities of the life statutory funds, are subsequently measured at amortised cost. Any difference between the proceeds (net of transaction costs) and the redemption amount is recognised in the Income statement over the period of the contract using the effective interest method. It is AMP’s policy to hedge currency and interest rate risk arising on issued bonds and subordinated debt. When fair value hedge accounting is applied to borrowings and subordinated debt, the carrying values of borrowings and subordinated debt are adjusted for changes in fair value for the period that the fair value hedge relationship remains effective. See Note 1(u).
Borrowings of the controlled entities of the life statutory funds are subsequently measured at fair value with movements recognised in the Income statement.
(u) Derivatives and hedgingThe AMP group is exposed to changes in interest and foreign exchange rates. To mitigate the risks arising from these exposures, the AMP group uses derivative financial instruments such as cross-currency and interest-rate swaps, forward rate agreements, futures, options and foreign currency contracts. Derivative financial instruments are also used to gain exposure to various markets for asset and liability management purposes.
Derivatives are initially recognised at fair value on the date on which a derivative contract is entered into and are subsequently measured at their fair value. All derivatives are carried as assets
1. Summary of signifi cant accounting policies continued
when their fair value is positive, and as liabilities when their fair value is negative.
The method of recognising the movement in fair value depends on whether the derivative is designated as a hedging instrument and, if so, the nature of the item being hedged. The AMP group designates a hedge as either: – a hedge of the fair value of recognised assets or liabilities
or a firm commitment (fair value hedge), or – a hedge of highly probable forecast transactions (cash
flow hedge).
The AMP group documents the relationship between hedging instruments and hedged items at inception of the transaction, as well as its risk management and strategy for undertaking various hedge transactions. The AMP group also documents its assessment of whether the derivatives used in hedging transactions have been, or will continue to be, highly effective in offsetting changes in fair values or cash flows of hedged items. This assessment is carried out at both hedge inception and on an ongoing basis.
Accounting for hedges(i) Fair value hedges: – Changes in the fair value of derivatives that are designated
and qualify as fair value hedges are recorded in the Income statement together with any changes in the fair value of the hedged asset or liability that are attributable to the hedged risk.
– If a hedge no longer meets the criteria for hedge accounting, the adjustment to the carrying amount of a hedged item, for which the effective interest method is used, is amortised to the Income statement over the period to maturity.
(ii) Cash flow hedges: – The effective portion of changes in the fair value of
derivatives that are designated to qualify as cash flow hedges are recognised in equity in the cash flow hedges reserve. The balance of the cash flow hedges reserve in relation to each particular hedge is transferred to the Income statement in the period when the hedged item will affect profit or loss.
– The gain or loss relating to any ineffective portion of a hedge is recognised immediately in the Income statement.
– Hedge accounting is discontinued when a hedging instrument expires or is sold or terminated, or when a hedge no longer meets the criteria for hedge accounting. The cumulative gain or loss existing in equity at that time remains in equity and is recognised when the forecast transaction is ultimately recognised in the Income statement.
– When a forecast transaction is no longer expected to occur, the cumulative gain or loss that was reported in equity is immediately transferred to the Income statement.
Derivatives that do not qualify for hedge accountingCertain derivative financial instruments do not qualify for hedge accounting. Changes in the fair value of any derivative financial instrument that does not qualify for hedge accounting are recognised in the Income statement in the period in which they arise.
Fair value estimation The fair value of financial instruments traded in active markets (such as publicly traded derivatives and available-for-sale securities) is based on quoted market prices at the Balance sheet date. The quoted market price used for financial assets held by the AMP group is the current bid price; the quoted market price for financial liabilities is the current offer price.
The fair value of financial instruments not traded in an active market (for example over-the-counter derivatives) is determined
AMP FULL FINANCIAL REPORT 2007 49

using valuation techniques. Valuation techniques include net present value techniques, discounted cash-flow methods and comparison to quoted market prices or dealer quotes for similar instruments. Inputs to the models are market observable.
(v) Recognition and derecognition of financial assets and liabilities Financial assets are recognised at trade date. Financial assets are derecognised when the contractual rights to the cash flows from the financial assets expire, or are transferred. A transfer occurs when substantially all the risks and rewards of ownership of the financial asset are passed to an unrelated third party. Financial liabilities are derecognised when the obligation specified in the contract is discharged, cancelled or expires.
(w) Investment contract liabilitiesInvestment contracts consist of a financial instrument and an investment management services element, both of which are measured at fair value. With the exception of fixed retirement-income policies, the resulting liability to policyholders is closely linked to the performance and value of the assets (after tax) that back those liabilities. The fair value of such liabilities is therefore the same as the fair value of those assets, after tax, charged to the policyholders with the exception of the impact of the accounting mismatch items. See Note 1(d).
For fixed retirement-income policies, the financial instrument element of the liability is the fair value of the fixed retirement-income payments, being their net present value using a risk-free discount rate. The fair value of the associated management services element is the net present value, using a risk-free discount rate, of all expenses associated with the provision of services and any profit margins thereon. The risk-free discount rate is determined by the Appointed Actuary based on the Commonwealth Government bond rate or the inter-bank zero coupon mid swap rates, depending on the nature, structure and term of the contract liabilities.
(x) Life insurance contract liabilities The financial reporting methodology used to determine the fair value of life insurance contract liabilities is referred to as Margin on Services (MoS).
Under MoS, the excess of premium received over claims and expenses (the margin) is recognised over the life of the contract in a manner that reflects the pattern of risk accepted from the policyholder (the service). The movement in life insurance contract liabilities recognised in the Income statement reflects the planned release of this margin.
Life insurance contract liabilities are usually determined using a projection method, whereby estimates of policy cash flows (premiums, benefits, expenses and profit margins to be released in future periods) are projected into the future. The liability is calculated as the net present value of these projected cash flows using best-estimate assumptions about the future. When the benefits under the life insurance contract are linked to the assets backing it, the discount rate applied is based on the expected future earnings rate of those assets. Where the benefits are not linked to the performance of the backing assets, a risk-free discount rate is used. The risk-free discount rate is determined by the Appointed Actuary based on the Commonwealth Government bond rate or the inter-bank zero coupon mid swap rates depending on the nature, structure and terms of the contract liabilities.
An accumulation method may be used if it produces results that are not materially different from those produced by a projection method. A modified accumulation method is used for some discretionary participating business, where the life insurance liability is the accumulation of amounts invested by policyholders, less fees specified in the policy, plus investment earnings and vested benefits, adjusted to allow for the fact that crediting rates are determined by reference to investment income over a period of greater than one year.
The accumulation method may be adjusted to the extent that acquisition expenses are to be recovered from future margins between fees and expenses.
Allocation of operating profit and unvested policyholder benefitsThe operating profit arising from discretionary participating contracts is allocated between shareholders and participating policyholders by applying the MoS principles in accordance with the Life Insurance Act 1995 (Life Act).
Once profit is allocated to participating policyholders it can only be distributed to these policyholders. Any distribution of this profit to shareholders is only allowed for overseas business with specific approval of the regulators.
Profit allocated to participating policyholders is recognised in the Income statement as an increase in policy liabilities. Both the element of this profit that has not yet been allocated to specific policyholders (i.e. unvested) and that which has been allocated to specific policyholders by way of bonus distributions (i.e. vested) are included within life insurance contract liabilities.
Bonus distributions to participating policyholders are merely a change in the nature of the liability from unvested to vested and, as such, do not alter the amount of profit attributable to shareholders.
The principles of allocation of the profit arising from discretionary participating business determined under the Life Act and MoS are as follows:(i) Investment income (net of tax and investment expenses) on
retained earnings in respect of discretionary participating business is allocated between policyholders and shareholders in proportion to the balances of policyholders’ and shareholders’ retained earnings, being 80:20.
(ii) Other MoS profits arising from discretionary participating business (excluding the additional tax attributable to shareholders in respect of Australian superannuation business) are allocated 80% to policyholders and 20% to shareholders, with the following exceptions:
– The profit arising from New Zealand corporate superannuation business is apportioned such that shareholders are allocated 15% of the profit allocated to policyholders.
– The profit arising in respect of Preservation Superannuation Account business is allocated 92.5% to policyholders and 7.5% to shareholders.
(iii) Additional tax on taxable income to shareholders in respect of Australian superannuation business is allocated to shareholders only.
(iv) All profits arising from non-participating business, including net investment returns on shareholder capital and retained earnings in life statutory funds (excluding retained earnings dealt with in (i) above) are allocated to shareholders.
Allocation of expenses within the life statutory fundsAll operating expenses relating to the life insurance contract and investment contract activities are apportioned between acquisition, maintenance and investment management expenses. Expenses which are directly attributable to an individual life insurance contract or investment contract or product are allocated directly to a particular expense category, fund, class of business and product line as appropriate.
Where expenses are not directly attributable, they are appropriately apportioned, according to detailed expense analysis, with due regard for the objective in incurring that expense and the outcome achieved. The apportionment basis has been made in accordance with Actuarial Standards and on an equitable basis to the different classes of business in accordance with the Life Act.
The costs apportioned to life insurance contracts are included in the determination of margin described above.
Investment management expenses of the life statutory funds are classified as other operating expenses. See Note 1(ee).
1. Summary of signifi cant accounting policies continued
50 AMP FULL FINANCIAL REPORT 2007
Notes to the fi nancial statements continued
for the year ended 31 December 2007

(y) Issued capitalIssued capital in respect of ordinary shares is recognised as the fair value of consideration received by the parent entity. Incremental costs directly attributable to the issue of certain new shares are recognised in equity as a deduction, net of tax, from the proceeds.
(z) Foreign currency transactionsFunctional and presentation currencyItems included in the financial statements for each of the AMP group entities are measured using the currency of the primary economic environment in which that entity operates (the functional currency).
The presentation currency of this Financial Report, and the functional currency of the parent entity, is Australian dollars.
Transactions and balancesIncome and expense items denominated in a currency other than the functional currency are translated at the spot exchange rate at the date of the transaction. Monetary assets and liabilities denominated in foreign currencies are translated at the rate of exchange ruling at the Balance sheet date, with exchange gains and losses recognised in the Income statement.
Non-monetary items measured at fair value in a foreign currency are translated using the exchange rates at the date when the fair value was determined.
Translation of controlled entitiesWhere the functional currency of a controlled entity is not the presentational currency, the transactions and balances of that entity are translated as follows:– Income and expenses are translated at average exchange
rates, unless this is not a reasonable approximation of the cumulative effect of the rates prevailing on the transaction dates. In this case, income and expenses are translated at the dates of the transactions.
– Assets and liabilities are translated at the closing rate at the Balance sheet date.
– All resulting exchange differences are recognised as a separate component of equity in the foreign currency translation reserve.
When a foreign operation is sold, a proportionate share of such exchange differences is recognised in the Income statement as part of the gain or loss on sale.
(aa) Insurance premium and related revenueLife insurance contractsLife insurance contract premiums are separated into their revenue and deposit components. Premium amounts earned by bearing insurance risks are recognised as revenue. Other premium amounts received, which are in the nature of deposits, are recognised as an increase in life insurance contract liabilities.
Premiums with no due date or fixed amount are recognised on a cash-received basis. Premiums with a regular due date are recognised on an accruals basis. Unpaid premiums are only recognised during the days of grace or where secured by the surrender value of the life insurance contract and are reported as outstanding premiums and classified as receivables in the Balance sheet.
Investment contractsThere is no premium revenue in respect of investment contracts. Amounts received from policyholders in respect of investment contracts comprise:– origination fees and ongoing investment management fees.
See Note 1(bb). – amounts credited directly to investment contract liabilities.
See Note 1(w).
(bb) Fee and other revenue Fees are charged to customers in connection with investment contracts and other financial services contracts. Revenue is recognised as services are provided. In some cases services are
provided at the inception of the contract while other services are performed over the life of the contract.
Investment contracts consist of a financial instrument and an investment-management services element. The payment by the policyholder includes the amount to fund the financial instrument and a fee for the origination of the contract. In many cases, that origination fee is based on commission paid to financial planners for providing initial advice. The financial instrument is classified as an investment contract and is measured at fair value. See Note 1(w).
The revenue that can be attributed to the origination service is recognised at inception. Any commission paid related to that fee is also recognised as an expense at that time. See Note 1(ee).
Fees for ongoing investment management services and other services provided are charged on a regular basis, usually daily, and are recognised as income as the service is provided.
Performance-based fees are recognised as revenue when the contractual performance criteria have been met and the right to receive the fee has been established.
(cc) Investment gains or lossesDividend and interest income is recognised in the Income statement on an accruals basis when the AMP group obtains control of the right to receive the revenue.
Realised gains and losses represent the change in value between the previously reported value and the amount received on sale of the asset. Unrealised gains and losses represent changes in the fair value of financial assets and investment property recognised in the period.
(dd) Insurance claims and related expenseLife insurance contractsLife insurance contract claims are separated into their expense and withdrawal components. The component that relates to the bearing of risks is treated as an expense. Other claim amounts, which are in the nature of withdrawals, are recognised as a decrease in life insurance contract liabilities.
Claims are recognised when the liability to the policyholder under the life insurance contract has been established or upon notification of the insured event, depending on the type of claim.
Investment contractsThere is no claims expense in respect of investment contracts. Amounts paid to policyholders in respect of investment contracts are withdrawals and are recognised as a decrease in investment contract liabilities. See Note 1(w).
General insurance contractsA claims expense in respect of general insurance contracts is recognised in the Income statement either as claims are incurred or as movements in outstanding claims occur.
General insurance claims expense forms part of the result of the general insurance operations, which have been classified as discontinued operations held for sale. For further details see Note 21.
(ee) Operating expensesAll operating expenses, other than those allocated to life insurance contracts, are expensed as incurred. See Note 1(x).
Expenses of controlled entities of the life statutory funds represent the business costs of those entities and are consolidated into the results of the AMP group.
The majority of investment contracts issued result in commissions and other payments to external service and advice providers. Where the amount paid equates to a fee charged to policyholders for the provision of advice, the amount is expensed either at inception or over the period of the contract consistent with the basis for recognising the fee revenue on the respective contracts. See Note 1(bb).
1. Summary of signifi cant accounting policies continued
AMP FULL FINANCIAL REPORT 2007 51
(ff) Finance costs Finance costs include:(i) borrowing costs: – interest on bank overdrafts, borrowings and subordinated
debt – amortisation of discounts or premiums related to
borrowings – finance charges in relation to finance leases.(ii) exchange differences arising from foreign currency borrowings
to the extent that they are regarded as an adjustment to interest costs.
(iii) changes in the fair value of derivative hedges together with any change in the fair value of the hedged asset or liabilities that are designated and qualify as fair value hedges, foreign exchange gains and losses and other financing related amounts.
Borrowing costs are recognised as expenses when incurred. The accounting policy for derivatives is set out in Note 1(u).
(gg) Share-based paymentsThe AMP group issues performance rights, restricted shares and other equity instruments to employees as a form of equity-settled share-based compensation. Equity-settled share-based compensation to employees is an expense in respect of the services received and is recognised in the Income statement over the vesting period of the instrument. There is an equivalent increase in the share-based payment reserve within equity.
The expense is based on the fair value of each grant, measured at the date of the grant. For performance rights and similar instruments the fair value is determined by an external valuer. The fair value calculation takes into consideration a number of factors including the likelihood of achieving market-based vesting conditions such as total shareholder return. The fair value determined at grant date is not altered over the vesting period. Non-market vesting conditions are included in assumptions about the number of instruments that are expected to vest. At each Balance sheet date, the AMP group reviews its estimates of the number of instruments that are expected to vest. Any changes to the original estimates are recognised in the Income statement and the share-based payment reserve, over the remaining vesting period.
Where the terms of an equity-settled share-based payment are modified and the expense increases as a result of the modification, then the increase is recognised over the remaining vesting period. When a modification reduces the expense, there is no adjustment and the pre-modification cost continues to be recognised.
Expenses for awards that do not ultimately vest are reversed in the period in which the instrument lapses, except for awards where vesting is conditional upon a market condition, in which case no reversal is recognised.
If the instruments vest, shares are purchased on-market and transferred to the employee. This purchase results in a decrease in the share-based payments reserve for the amount of the cost of the purchase.
(hh) Superannuation fundsThe AMP group operates two superannuation funds that provide benefits for employees and their dependants on resignation, retirement, disability or death of the employee. The funds have both defined contribution and defined-benefit sections. New employees are only offered defined contribution benefits. AMP also makes contributions to multiple superannuation funds in respect of employees who are not members of AMP operated funds. These contributions are made on a defined contribution basis.
For the defined contribution sections, the AMP group pays contributions to the funds on a mandatory basis. The AMP group has no further payment obligations once the contributions
have been paid. The contributions are recognised in the Income statement as an operating expense when they fall due.
Prepaid contributions are recognised as an asset to the extent that a cash refund or a reduction in the future payments is available.
For the defined-benefit sections, the AMP group recognises the net deficit or surplus position of each fund in the Balance sheet. The deficit or surplus is measured as the difference between the fair value of the funds’ assets and the discounted defined-benefit obligations of the funds, using a government bond yield as the discount rate. The defined-benefit obligation is calculated annually, with half-yearly reviews, by independent actuaries.
After taking into account any contributions paid into the defined-benefits funds during the period, movements in the net surplus or deficit of each fund, except actuarial gains and losses, are recognised in the Income statement. Actuarial gains and losses arising from experience adjustments and changes in actuarial assumptions over the period are recognised in full (net of tax), directly in retained profits. The movement is also reflected in the Statement of recognised income and expenses.
Contributions paid into defined-benefit funds are recognised as reductions in the deficit.
(ii) Earnings per shareBasic earnings per share is calculated by dividing the consolidated profit attributable to shareholders of AMP Limited, by the weighted average number of ordinary shares outstanding during the period. The weighted average number of ‘treasury shares’ held during the period is excluded in calculating the weighted average number of ordinary shares outstanding.
Diluted earnings per share is calculated by dividing the profit used in the determination of basic earnings per share by the weighted average number of shares outstanding during the period adjusted for potential ordinary shares considered to be dilutive. Potential ordinary shares are contracts such as options and performance rights that may entitle the holder to ordinary shares. These potential ordinary shares are considered dilutive when their conversion into ordinary shares would be likely to cause a reduction in earnings per share.
(jj) Disposal groups held for saleDisposal groups are classified as held for sale and measured at the lower of their carrying amount and fair value less costs to sell if their carrying amount will be recovered principally through a sale transaction. For a disposal group to be classified as held for sale, it must be available for immediate sale in its present condition and its sale must be highly probable.
An impairment loss is recognised for any initial or subsequent write-down of the disposal group to fair value less costs to sell. A gain is recognised for any subsequent increases in fair value less costs to sell of a disposal group, but not in excess of any cumulative impairment loss previously recognised. A gain or loss not previously recognised by the date of the sale of the disposal group will be recognised at the date of derecognition, which, in relation to AMP’s general insurance operations, is expected to be finalised by 31 March 2008.
A discontinued operation is a component of the entity that has been disposed of or is classified as held for sale and that represents a separate major line of business or geographical area of operations, is part of a coordinated plan to dispose of such a line of business or area of operations, or is a subsidiary acquired exclusively with a view of resale. The results of discontinued operations are presented separately on the face of the Income statement. The assets and liabilities of discontinued operations in the current year are presented separately on the face of the Balance sheet whilst the prior year comparatives have not been restated.
1. Summary of signifi cant accounting policies continued
52 AMP FULL FINANCIAL REPORT 2007
Notes to the fi nancial statements continued
for the year ended 31 December 2007
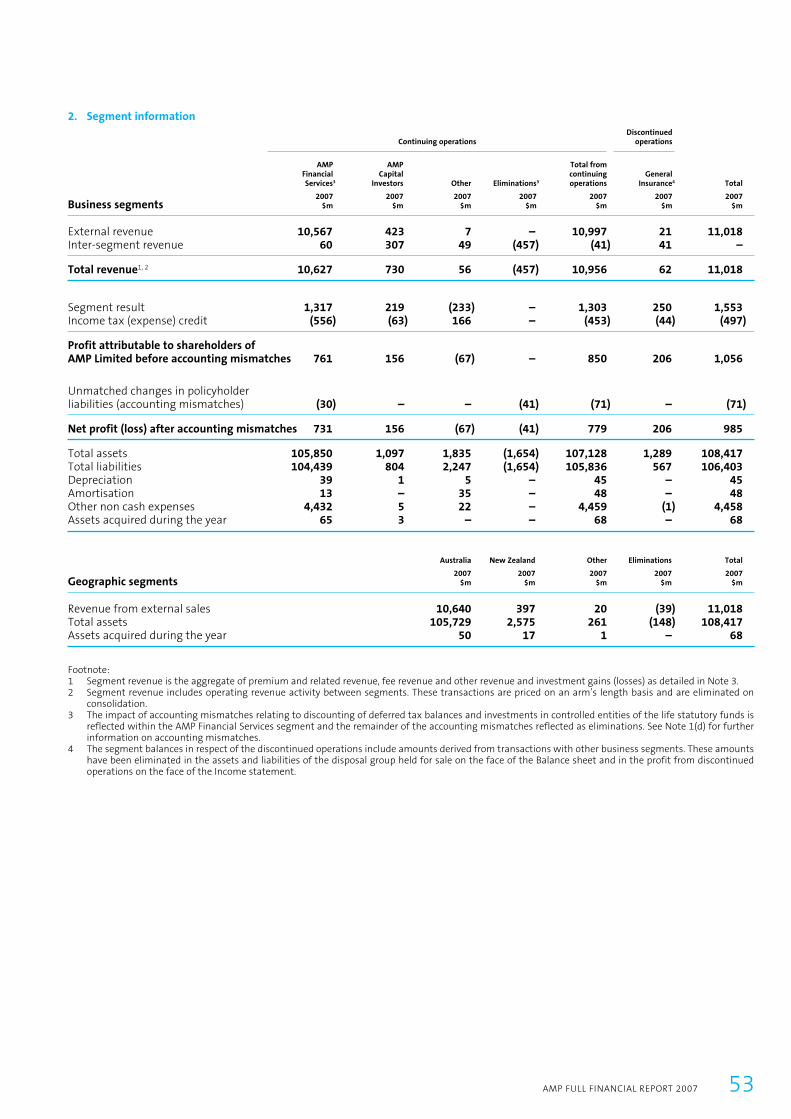
2. Segment information
Continuing operationsDiscontinued
operations
Business segments
AMP Financial Services3
2007$m
AMP Capital
Investors
2007$m
Other
2007$m
Eliminations3
2007$m
Total from continuing operations
2007$m
General Insurance4
2007$m
Total
2007$m
External revenue 10,567 423 7 – 10,997 21 11,018Inter-segment revenue 60 307 49 (457) (41) 41 –
Total revenue1, 2 10,627 730 56 (457) 10,956 62 11,018
Segment result 1,317 219 (233) – 1,303 250 1,553 Income tax (expense) credit (556) (63) 166 – (453) (44) (497)
Profit attributable to shareholders of AMP Limited before accounting mismatches 761 156 (67) – 850 206 1,056
Unmatched changes in policyholder liabilities (accounting mismatches) (30) – – (41) (71) – (71)
Net profit (loss) after accounting mismatches 731 156 (67) (41) 779 206 985
Total assets 105,850 1,097 1,835 (1,654) 107,128 1,289 108,417 Total liabilities 104,439 804 2,247 (1,654) 105,836 567 106,403 Depreciation 39 1 5 – 45 – 45 Amortisation 13 – 35 – 48 – 48 Other non cash expenses 4,432 5 22 – 4,459 (1) 4,458 Assets acquired during the year 65 3 – – 68 – 68
Australia New Zealand Other Eliminations Total
2007 2007 2007 2007 2007Geographic segments $m $m $m $m $m
Revenue from external sales 10,640 397 20 (39) 11,018 Total assets 105,729 2,575 261 (148) 108,417 Assets acquired during the year 50 17 1 – 68
Footnote:1 Segment revenue is the aggregate of premium and related revenue, fee revenue and other revenue and investment gains (losses) as detailed in Note 3.2 Segment revenue includes operating revenue activity between segments. These transactions are priced on an arm’s length basis and are eliminated on
consolidation.3 The impact of accounting mismatches relating to discounting of deferred tax balances and investments in controlled entities of the life statutory funds is
reflected within the AMP Financial Services segment and the remainder of the accounting mismatches reflected as eliminations. See Note 1(d) for further information on accounting mismatches.
4 The segment balances in respect of the discontinued operations include amounts derived from transactions with other business segments. These amounts have been eliminated in the assets and liabilities of the disposal group held for sale on the face of the Balance sheet and in the profit from discontinued operations on the face of the Income statement.
AMP FULL FINANCIAL REPORT 2007 53
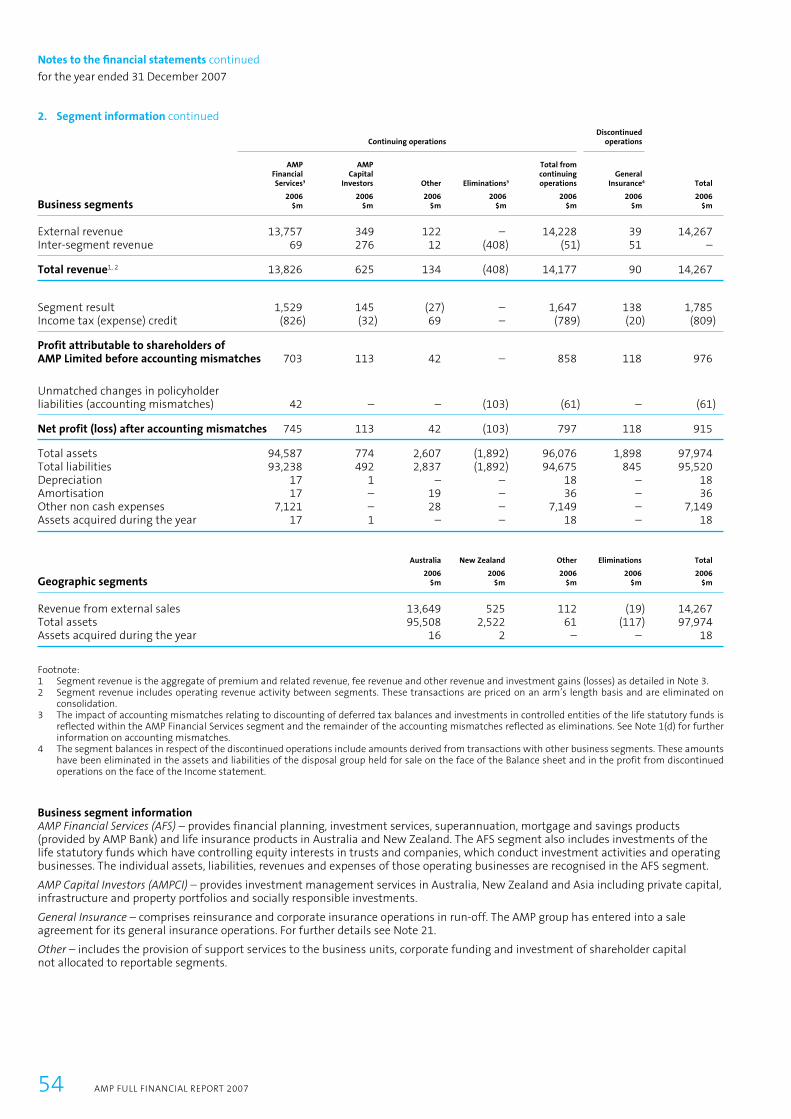
2. Segment information continued
Continuing operationsDiscontinued
operations
Business segments
AMP Financial Services3
2006$m
AMP Capital
Investors
2006$m
Other
2006$m
Eliminations3
2006$m
Total from continuing operations
2006$m
General Insurance4
2006$m
Total
2006$m
External revenue 13,757 349 122 – 14,228 39 14,267 Inter-segment revenue 69 276 12 (408) (51) 51 –
Total revenue1, 2 13,826 625 134 (408) 14,177 90 14,267
Segment result 1,529 145 (27) – 1,647 138 1,785 Income tax (expense) credit (826) (32) 69 – (789) (20) (809)
Profit attributable to shareholders of AMP Limited before accounting mismatches 703 113 42 – 858 118 976
Unmatched changes in policyholder liabilities (accounting mismatches) 42 – – (103) (61) – (61)
Net profit (loss) after accounting mismatches 745 113 42 (103) 797 118 915
Total assets 94,587 774 2,607 (1,892) 96,076 1,898 97,974 Total liabilities 93,238 492 2,837 (1,892) 94,675 845 95,520 Depreciation 17 1 – – 18 – 18 Amortisation 17 – 19 – 36 – 36 Other non cash expenses 7,121 – 28 – 7,149 – 7,149 Assets acquired during the year 17 1 – – 18 – 18
Australia New Zealand Other Eliminations Total
2006 2006 2006 2006 2006Geographic segments $m $m $m $m $m
Revenue from external sales 13,649 525 112 (19) 14,267 Total assets 95,508 2,522 61 (117) 97,974 Assets acquired during the year 16 2 – – 18
Footnote:1 Segment revenue is the aggregate of premium and related revenue, fee revenue and other revenue and investment gains (losses) as detailed in Note 3.2 Segment revenue includes operating revenue activity between segments. These transactions are priced on an arm’s length basis and are eliminated on
consolidation.3 The impact of accounting mismatches relating to discounting of deferred tax balances and investments in controlled entities of the life statutory funds is
reflected within the AMP Financial Services segment and the remainder of the accounting mismatches reflected as eliminations. See Note 1(d) for further information on accounting mismatches.
4 The segment balances in respect of the discontinued operations include amounts derived from transactions with other business segments. These amounts have been eliminated in the assets and liabilities of the disposal group held for sale on the face of the Balance sheet and in the profit from discontinued operations on the face of the Income statement.
Business segment informationAMP Financial Services (AFS) – provides financial planning, investment services, superannuation, mortgage and savings products (provided by AMP Bank) and life insurance products in Australia and New Zealand. The AFS segment also includes investments of the life statutory funds which have controlling equity interests in trusts and companies, which conduct investment activities and operating businesses. The individual assets, liabilities, revenues and expenses of those operating businesses are recognised in the AFS segment.
AMP Capital Investors (AMPCI) – provides investment management services in Australia, New Zealand and Asia including private capital, infrastructure and property portfolios and socially responsible investments.
General Insurance – comprises reinsurance and corporate insurance operations in run-off. The AMP group has entered into a sale agreement for its general insurance operations. For further details see Note 21.
Other – includes the provision of support services to the business units, corporate funding and investment of shareholder capital not allocated to reportable segments.
54 AMP FULL FINANCIAL REPORT 2007
Notes to the fi nancial statements continued
for the year ended 31 December 2007
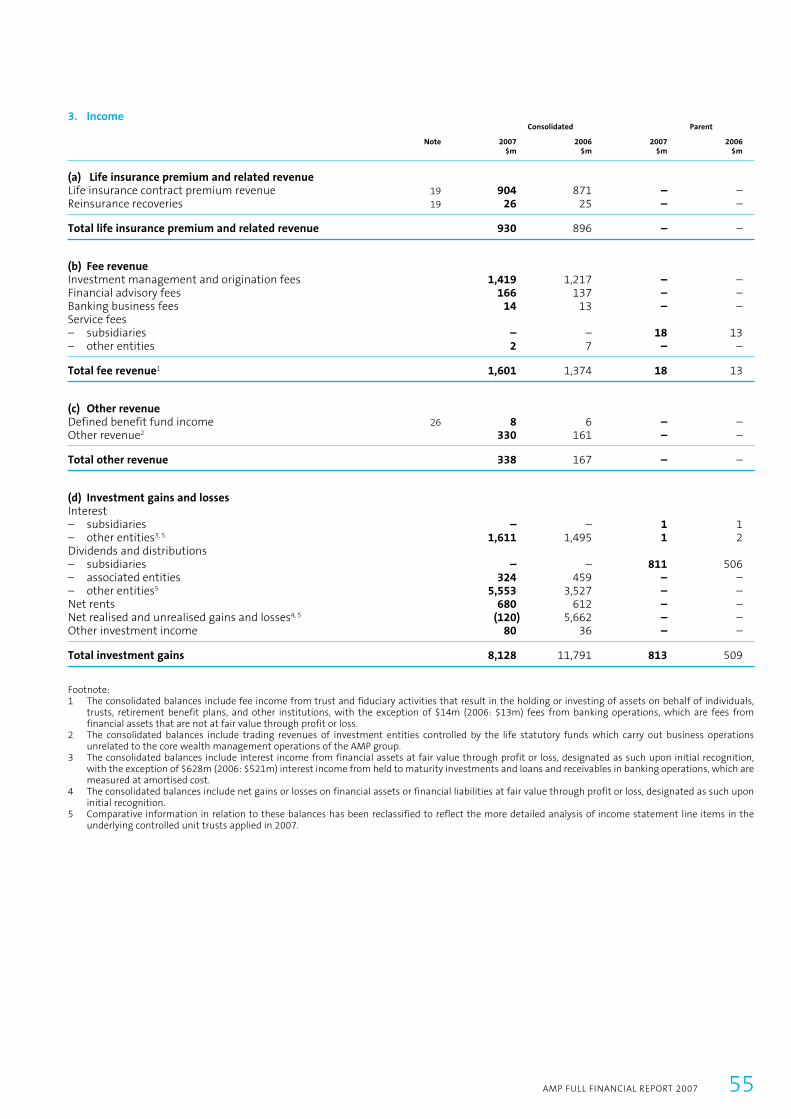
3. Income Consolidated Parent
Note 2007 2006 2007 2006 $m $m $m $m
(a) Life insurance premium and related revenueLife insurance contract premium revenue 19 904 871 – –Reinsurance recoveries 19 26 25 – –
Total life insurance premium and related revenue 930 896 – –
(b) Fee revenue Investment management and origination fees 1,419 1,217 – –Financial advisory fees 166 137 – –Banking business fees 14 13 – –Service fees – subsidiaries – – 18 13 – other entities 2 7 – –
Total fee revenue1 1,601 1,374 18 13
(c) Other revenue Defined benefit fund income 26 8 6 – –Other revenue2 330 161 – –
Total other revenue 338 167 – –
(d) Investment gains and lossesInterest– subsidiaries – – 1 1– other entities3, 5 1,611 1,495 1 2Dividends and distributions– subsidiaries – – 811 506– associated entities 324 459 – –– other entities5 5,553 3,527 – –Net rents 680 612 – –Net realised and unrealised gains and losses4, 5 (120) 5,662 – –Other investment income 80 36 – –
Total investment gains 8,128 11,791 813 509
Footnote:1 The consolidated balances include fee income from trust and fiduciary activities that result in the holding or investing of assets on behalf of individuals,
trusts, retirement benefit plans, and other institutions, with the exception of $14m (2006: $13m) fees from banking operations, which are fees from financial assets that are not at fair value through profit or loss.
2 The consolidated balances include trading revenues of investment entities controlled by the life statutory funds which carry out business operations unrelated to the core wealth management operations of the AMP group.
3 The consolidated balances include interest income from financial assets at fair value through profit or loss, designated as such upon initial recognition, with the exception of $628m (2006: $521m) interest income from held to maturity investments and loans and receivables in banking operations, which are measured at amortised cost.
4 The consolidated balances include net gains or losses on financial assets or financial liabilities at fair value through profit or loss, designated as such upon initial recognition.
5 Comparative information in relation to these balances has been reclassified to reflect the more detailed analysis of income statement line items in the underlying controlled unit trusts applied in 2007.
AMP FULL FINANCIAL REPORT 2007 55
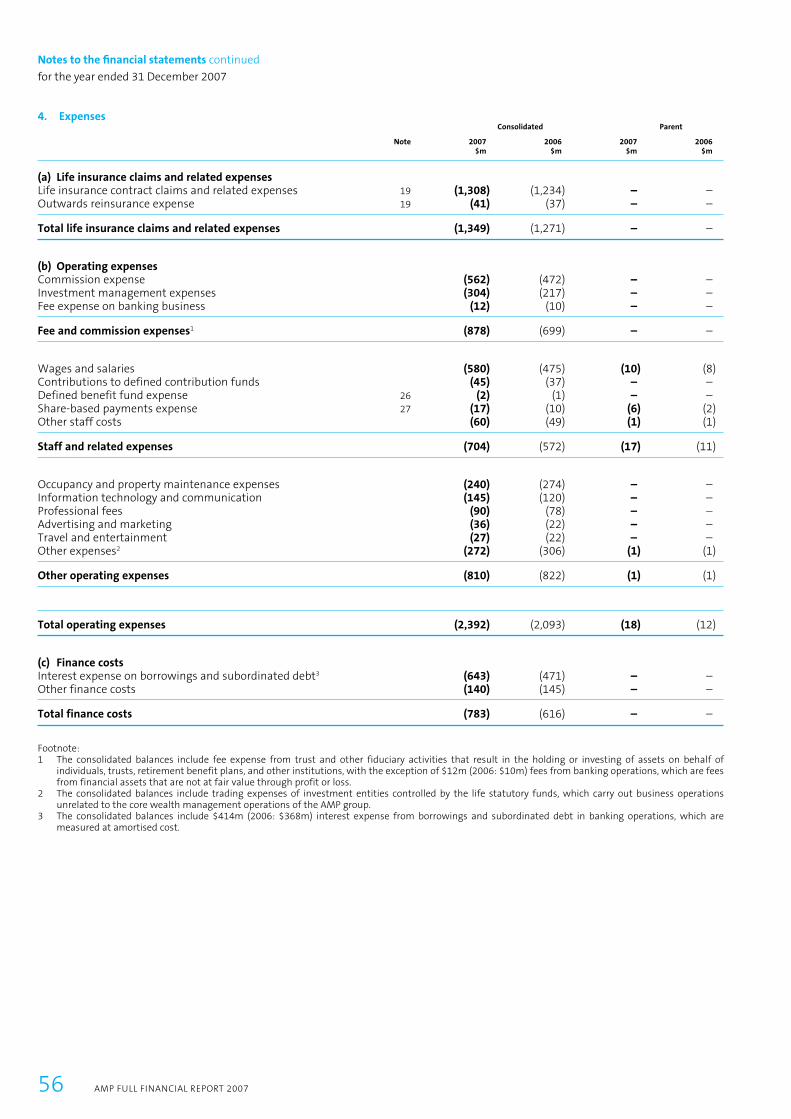
4. Expenses Consolidated Parent
Note 2007 2006 2007 2006 $m $m $m $m
(a) Life insurance claims and related expenses Life insurance contract claims and related expenses 19 (1,308) (1,234) – – Outwards reinsurance expense 19 (41) (37) – –
Total life insurance claims and related expenses (1,349) (1,271) – –
(b) Operating expenses Commission expense (562) (472) – –Investment management expenses (304) (217) – –Fee expense on banking business (12) (10) – –
Fee and commission expenses1 (878) (699) – –
Wages and salaries (580) (475) (10) (8)Contributions to defined contribution funds (45) (37) – –Defined benefit fund expense 26 (2) (1) – –Share-based payments expense 27 (17) (10) (6) (2)Other staff costs (60) (49) (1) (1)
Staff and related expenses (704) (572) (17) (11)
Occupancy and property maintenance expenses (240) (274) – –Information technology and communication (145) (120) – –Professional fees (90) (78) – –Advertising and marketing (36) (22) – –Travel and entertainment (27) (22) – –Other expenses2 (272) (306) (1) (1)
Other operating expenses (810) (822) (1) (1)
Total operating expenses (2,392) (2,093) (18) (12)
(c) Finance costs Interest expense on borrowings and subordinated debt3 (643) (471) – –Other finance costs (140) (145) – –
Total finance costs (783) (616) – –
Footnote:1 The consolidated balances include fee expense from trust and other fiduciary activities that result in the holding or investing of assets on behalf of
individuals, trusts, retirement benefit plans, and other institutions, with the exception of $12m (2006: $10m) fees from banking operations, which are fees from financial assets that are not at fair value through profit or loss.
2 The consolidated balances include trading expenses of investment entities controlled by the life statutory funds, which carry out business operations unrelated to the core wealth management operations of the AMP group.
3 The consolidated balances include $414m (2006: $368m) interest expense from borrowings and subordinated debt in banking operations, which are measured at amortised cost.
56 AMP FULL FINANCIAL REPORT 2007
Notes to the fi nancial statements continued
for the year ended 31 December 2007

5. Income tax Consolidated Parent
2007 2006 2007 2006 $m $m $m $m
(a) Analysis of income tax (expense) credit Current tax (606) (711) 3 3 (Decrease) increase in deferred tax assets (16) 69 47 39 Decrease (increase) in deferred tax liabilities 190 (150) – –Over (under) provided in previous years (13) 11 40 15
Income tax (expense) credit (445) (781) 90 57
(b) Relationship between income tax expense and accounting profitThe following table provides a reconciliation of differences between prima facie tax calculated as 30% of the profit before income tax for the period and the actual income tax expense recognised in the Income statement for the period. The income tax expense amount reflects the impact of both income tax attributable to shareholders as well as income tax attributable to policyholders.
In respect of income tax expense attributable to shareholders, the tax rate which applies in both 2007 and 2006 is 30% for Australia and 33% for New Zealand. There are certain differences between the amounts of income and expenses recognised in the Financial Report and the amounts recognised for income tax purposes.
Income tax attributable to policyholders is based on investment income allocated to policyholders less expenses deductible against that investment income. The impact of the tax is charged against policyholder liabilities. A number of different tax rate regimes apply to policyholders. In Australia, certain classes of policyholder life insurance income and superannuation earnings are taxed at 15%, and certain classes of income on some annuity business are tax-exempt. Rates applicable to New Zealand life insurance business range between 30–33%.
During the period the New Zealand government announced a change in the company tax rate from 33% to 30% for the 2008/2009 tax year. Deferred tax assets and deferred tax liabilities expected to be realised or settled after the change in tax rate has taken effect, have been remeasured to reflect the announced tax rate.
Consolidated Parent
2007 2006 2007 2006 $m $m $m $m
Profit before income tax from continuing operations 1,237 1,608 813 510 Policyholder tax recognised as a charge to policyholdersin determining profit before income tax (242) (531) – –
Profit before income tax from continuing operations excluding tax charged to policyholders 995 1,077 813 510
Prima facie tax at the rate of 30% (2006: 30%) (299) (323) (244) (153)
Tax effect of differences between amounts of income and expenses recognised for accounting and the amounts deductible/(taxable) in calculating taxable income: Shareholder impact of par-business tax treatment 13 (22) – – Non-deductible expenses (28) (17) – – Non-taxable income 22 19 – – Tax offsets and credits 17 14 1 3 Dividend income from controlled entities – – 243 153 Other items (18) 17 – –Over (under) provided in previous years after excluding amounts attributable to policyholders 37 16 40 15 Benefit arising from previously unrecognised tax losses 56 47 50 39 Difference in overseas tax rates (3) (1) – –
Income tax (expense) credit attributable to shareholders (203) (250) 90 57 Income tax (expense) credit attributable to policyholders (242) (531) – –
Income tax (expense) credit per Income statement (445) (781) 90 57
AMP FULL FINANCIAL REPORT 2007 57

5. Income tax continued Consolidated Parent
2007 2006 2007 2006 $m $m $m $m
(c) Analysis of deferred tax asset Expenses deductible and income recognisable in future years 158 173 1 6 Unrealised movements on borrowings and derivatives 26 18 – –General insurance claims costs – 24 – –Losses available for offset against future taxable income – 36 84 76 Other 125 77 2 –
Total deferred tax assets 309 328 87 82
(d) Analysis of deferred tax liabilityUnrealised investment gains 1,683 1,782 – –Unrealised movements on borrowings and derivatives 67 29 – –Amounts recognised directly in equity 7 12 – –Other 54 41 – –
Total deferred tax liability 1,811 1,864 – –
(e) Unused tax losses and deductible temporary differences not recognisedRevenue losses 226 257 206 232 Capital losses 667 581 667 581
6. Receivables Consolidated Parent
Note 2007 2006 2007 2006 $m $m $m $m
Investment income and sales proceeds receivable 367 825 – –Life and general insurance contract premiums receivable2 281 291 – – Reinsurance and other recoveries receivable2 21 – 92 – – Reinsurers’ share of life insurance contract liabilities 47 35 – –Trade debtors1 242 121 – –Other receivables– subsidiaries – tax related amounts – – 291 490 – subsidiaries – other – – 8 17 – associated entities 1 1 – –– other entities 242 170 – –
Total receivables3, 4 1,180 1,535 299 507
Footnote:1 The consolidated balances include trade debtors of investment entities controlled by the life statutory funds, which carry out business operations unrelated
to the core wealth management operations of the AMP group.2 Amounts in relation to the general insurance operations are included within the comparative balances. In 2007, these operations have been classified as
discontinued operations held for sale and consequently amounts in relation to 2007 are not included within these balances but are included within Assets of discontinued operations held for sale on the face of the Balance sheet.
3 $198m (2006: $571m) of Total receivables is expected to be realised 12 months or more from the reporting date.4 All receivables are at fair value through profit or loss, designated as such upon initial recognition.
58 AMP FULL FINANCIAL REPORT 2007
Notes to the fi nancial statements continued
for the year ended 31 December 2007

7. Equity, debt and property securities and other fi nancial assets Consolidated Parent
2007 2006 2007 2006 $m $m $m $m
Equity securitiesDirectly held– associated entities 378 338 – –– other entities1 32,336 30,991 – –Held via unit trusts – associated entities 1,098 769 – –– other entities1 10,030 9,278 – –
Total equity securities2 43,842 41,376 – –
Debt securities3
Interest bearing securities directly held1 23,488 21,792 – –Interest bearing securities held via unit trusts – associated entities – 161 – –– other entities1 3,326 1,713 – –Secured loans– other entities 9,004 7,899 – –Unsecured loans– subsidiaries – – 204 517 – associated entities 122 1 – –– other entities 325 412 1 –Convertible notes 22 29 – –
Total debt securities4 36,287 32,007 205 517
Property securitiesHeld via unit trusts – associated entities 2,469 2,156 – –– other entities 2,831 3,470 – –
Total property securities1, 2 5,300 5,626 – –
Other financial assetsCash securities held via unit trusts 1,173 1,025 – –Other financial assets1, 5 6,323 5,609 – –
Total other financial assets2 7,496 6,634 – –
Investments in controlled entities – – 7,022 7,443
Footnote:1 Comparative information has been reclassified to reflect the look through of balanced trusts only to the extent that they are controlled entities. In prior
periods all balanced trusts were allocated into their constituent equity, debt and property components. 2 All equity and property securities, and other financial assets are at fair value through profit or loss, designated as such upon initial recognition.3 All debt securities are recorded at fair value, with the exception of $8,582m (2006: $7,592m) of interest bearing securities and secured loans held by banking
operations, which are recorded at amortised cost.4 Total debt securities includes $5,551m (2006: $4,976m) of debt securities in consolidated securitisation vehicles.5 The other category includes balanced trusts, derivative financial assets and investments held via vehicles such as joint ventures and partnerships.
AMP FULL FINANCIAL REPORT 2007 59

8. Investment property Consolidated Parent
2007 2006 2007 2006 $m $m $m $m
Investment propertyDirectly held 9,333 7,841 – –
Total investment property 9,333 7,841 – –
Movements in investment propertyBalance at the beginning of the period 7,841 5,766 – –Additions– through direct acquisitions1 741 834 – –– subsequent expenditure recognised in carrying amount 56 223 – –Acquisitions through business combinations 128 225 – –Disposals1 (311) (162) – –Net gains (losses) from fair value adjustments2 888 956 – –Foreign currency exchange differences (10) (1) – –
Balance at the end of the period 9,333 7,841 – –
Footnote:1 Additions through direct acquisitions and Disposals include amounts for investment entities in which the life statutory funds hold a controlling equity
interest.2 Investment property is held at fair value, see Note 1(l) for further details regarding the valuation policies for investment property.
60 AMP FULL FINANCIAL REPORT 2007
Notes to the fi nancial statements continued
for the year ended 31 December 2007

9. Property, plant and equipment Owner-Occupied Leasehold Plant & Property1 Improvements Equipment2 Total2007 $m $m $m $m
Property, plant and equipmentGross carrying amount 342 71 331 744 Less: accumulated depreciation and impairment losses – (42) (116) (158)
Property, plant and equipment at written down value 342 29 215 586
Movements in property, plant and equipmentBalance at the beginning of the period 300 30 172 502 Additions– through direct acquisitions – 5 63 68 – subsequent expenditure recognised in carrying amount 4 – – 4 Acquisitions through business combinations – – 17 17 Disposals – – (4) (4)Increases from revaluations and impairment losses recognised directly in equity 43 – – 43 Depreciation expense for the period (5) (6) (34) (45)Foreign currency exchange differences – – 1 1
Balance at the end of the period 342 29 215 586
Owner-Occupied Leasehold Plant & Property Improvements Equipment2 Total2006 $m $m $m $m
Property, plant and equipmentGross carrying amount 300 66 280 646 Less: accumulated depreciation and impairment losses – (36) (108) (144)
Property, plant and equipment at written down value 300 30 172 502
Movements in property, plant and equipmentBalance at the beginning of the period 261 34 41 336 Additions– through direct acquisitions – 1 17 18 – subsequent expenditure recognised in carrying amount 4 – – 4 Acquisitions through business combinations – – 143 143 Disposals – – (16) (16)Increases from revaluations and impairment losses recognised directly in equity 35 – – 35 Depreciation expense for the period – (5) (13) (18)
Balance at the end of the period 300 30 172 502
Footnote:1 Owner-occupied property is carried at fair value; had the asset been measured at historic cost the amortised carrying value would have been $203m.2 The consolidated balances include operating assets of investment entities controlled by the life statutory funds, which carry out business operations
unrelated to the core wealth management operations of the AMP group.
10. Other assets Consolidated Parent
2007 2006 2007 2006 $m $m $m $m
Inventories 86 41 – –Prepayments 76 62 – –Other assets 29 52 – –
Total other assets1, 2 191 155 – –
Footnote:1 $56m (2006: $95m) of Total other assets is expected to be realised 12 months or more from the reporting date.2 The consolidated balances include other assets of investment entities controlled by the life statutory funds, which carry out business operations unrelated
to the core wealth management operations of the AMP group.
AMP FULL FINANCIAL REPORT 2007 61

11. Intangibles Capitalised Management Other Goodwill1 costs2 rights intangibles Total 2007 $m $m $m $m $m
IntangiblesGross carrying amount 798 325 26 44 1,193 Less: accumulated amortisation and/or impairment losses (5) (169) (2) (12) (188)
Intangibles at written down value 793 156 24 32 1,005
Movements in intangibles Balance at the beginning of the period 731 109 22 – 862 Additions through acquisitions of controlled entities1 140 – 2 32 174 Additions through separate acquisition – – – – – Additions through internal development – 106 – – 106 Disposals (73) – – – (73)Amortisation expense for the period – (48) – – (48)Impairment losses (recognised) or reversed in profit (5) (8) – – (13)Other movements – (3) – – (3)
Balance at the end of the period 793 156 24 32 1,005
Capitalised Management Other Goodwill costs2 rights intangibles Total 2006 $m $m $m $m $m
IntangiblesGross carrying amount 731 232 24 – 987 Less: accumulated amortisation and/or impairment losses – (123) (2) – (125)
Intangibles at written down value 731 109 22 – 862
Movements in intangiblesBalance at the beginning of the period 517 109 6 – 632 Additions through acquisitions of controlled entities 214 2 – – 216 Additions through separate acquisition – – 16 – 16 Additions through internal development – 59 – – 59 Amortisation expense for the period – (36) – – (36)Impairment losses (recognised) or reversed in profit – (28) – – (28)Other movements – 3 – – 3
Balance at the end of the period 731 109 22 – 862
Footnote:1 The net increase in goodwill during 2007 of $67m arose on acquisitions of investment entities controlled by the life statutory funds which carry out business
operations unrelated to the core wealth management operations of the AMP group. Goodwill of $517m is attributable to the shareholders of AMP Limited.2 Capitalised costs are required to be amortised over their estimated useful lives as well as being assessed for indicators of impairment at each reporting date.
Impairment testing carried out during the period indicated that the carrying value of some capitalised costs exceeded their recoverable amount due to such factors as obsolescence or reassessment of the assets’ estimated useful lives. Consequently these capitalised costs were written down to their recoverable amount.
Impairment testing for goodwillGoodwill attributable to shareholdersThe goodwill amount arose from a Life Act Part 9 transfer into the life statutory funds of AMP Life. The amount of goodwill recognised represented the value of in-force business, the value of new business and the benefits of cost synergies obtained as a result of the integration of the business into AMP Life. AMP Life is deemed to be the cash generating unit for the purposes of impairment testing required by accounting standards. The carrying value of $517m was determined on 1 January 2004 according to the rules applying on adoption of AIFRS.
The amount of goodwill is subject to annual impairment testing at the cash generating unit level.
Key financial indicators are considered when testing goodwill for impairment including: cash flows, AMP Life margins and embedded value of the AMP Life business.
An analysis of these key financial indicators and other valuations performed at 31 December 2007 confirmed that there has been no impairment in the value of goodwill at that date.
Goodwill attributable to policyholdersThe policyholder goodwill amount arose during the period on acquisitions of investment entities controlled by the life statutory funds, which carry out business operations unrelated to the core wealth management operations of the AMP group.
The amount of goodwill is subject to annual impairment testing, which is carried out at the level of each of the operating entities acquired. Impairment testing is carried out by comparing the recoverable amount of the investment in each operating entity with their fair values less costs to sell. Fair value is established using valuation techniques including the use of recent arm’s length transactions and valuations based on earning multiples. As a result of impairment testing during the period the goodwill attributable to policyholders was impaired by $5m.
62 AMP FULL FINANCIAL REPORT 2007
Notes to the fi nancial statements continued
for the year ended 31 December 2007

12. Payables Consolidated Parent
2007 2006 2007 2006 $m $m $m $m
Investment purchases payable1 3,173 374 – –Life insurance and investment contracts in process of settlement 217 204 – –Accrued expenses 124 109 – –Interest payable 59 90 – –Trade creditors2 147 81 – –Other payables– associated entities – 2 – –– other entities 474 695 2 2
Total payables3 4,194 1,555 2 2
Footnote:1 The increase in Investment purchases payable is due to timing of investment settlements around the balance date in respect of the normal investment
activities of the investment entities controlled by the life statutory funds.2 The consolidated balances include Trade creditors of investment entities controlled by the life statutory funds, which carry out business operations
unrelated to the core wealth management operations of the AMP group.3 $183m (2006: $554m) of Total payables is expected to be settled 12 months or more from the reporting date.
13. Provisions Consolidated Parent
2007 2006 2007 2006 $m $m $m $m
(a) ProvisionsEmployee entitlements 226 212 4 5 Restructuring 8 10 – –Other 172 168 – –
Total provisions1 406 390 4 5
Employee entitlements Restructuring Other Total $m $m $m $m
(b) Movements in provisions – consolidatedBalance at the beginning of the period 212 10 168 390 Additional provisions recognised 249 5 129 383 Reductions from remeasurement or settlement without cost (23) (2) (104) (129)Payments/other sacrifices of economic benefits (212) (5) (16) (233)Additions (reductions) through foreign exchange movements – – 11 11 Additions (reductions) through acquisition or disposal – – (16) (16)
Balance at the end of the period 226 8 172 406
Employee entitlements Restructuring Other Total $m $m $m $m
(b) Movements in provisions – parentBalance at the beginning of the period 5 – – 5 Additional provisions recognised 5 – – 5 Payments/other sacrifices of economic benefits (6) – – (6)
Balance at the end of the period 4 – – 4
Footnote:1 $26m (2006: $59m) of Total provisions is expected to be settled 12 months or more from the reporting date.
AMP FULL FINANCIAL REPORT 2007 63
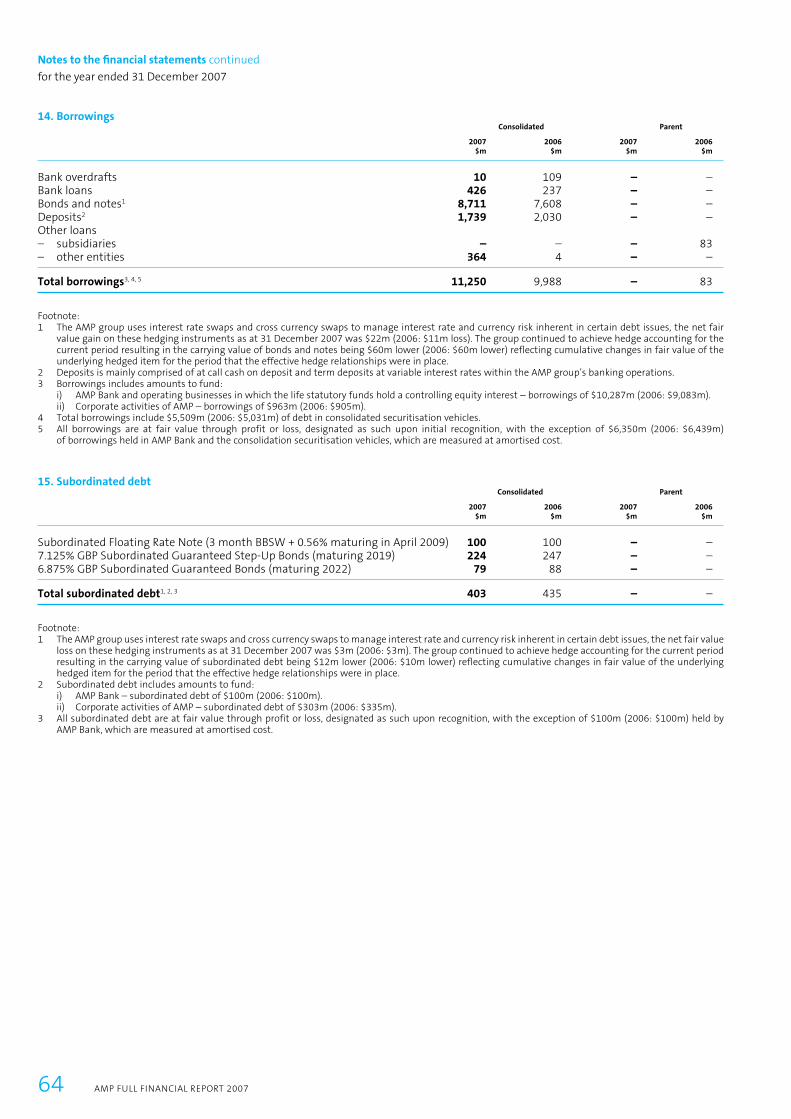
14. Borrowings Consolidated Parent
2007 2006 2007 2006 $m $m $m $m
Bank overdrafts 10 109 – –Bank loans 426 237 – –Bonds and notes1 8,711 7,608 – –Deposits2 1,739 2,030 – –Other loans– subsidiaries – – – 83 – other entities 364 4 – –
Total borrowings3, 4, 5 11,250 9,988 – 83
Footnote:1 The AMP group uses interest rate swaps and cross currency swaps to manage interest rate and currency risk inherent in certain debt issues, the net fair
value gain on these hedging instruments as at 31 December 2007 was $22m (2006: $11m loss). The group continued to achieve hedge accounting for the current period resulting in the carrying value of bonds and notes being $60m lower (2006: $60m lower) reflecting cumulative changes in fair value of the underlying hedged item for the period that the effective hedge relationships were in place.
2 Deposits is mainly comprised of at call cash on deposit and term deposits at variable interest rates within the AMP group’s banking operations.3 Borrowings includes amounts to fund:
i) AMP Bank and operating businesses in which the life statutory funds hold a controlling equity interest – borrowings of $10,287m (2006: $9,083m).ii) Corporate activities of AMP – borrowings of $963m (2006: $905m).
4 Total borrowings include $5,509m (2006: $5,031m) of debt in consolidated securitisation vehicles.5 All borrowings are at fair value through profit or loss, designated as such upon initial recognition, with the exception of $6,350m (2006: $6,439m)
of borrowings held in AMP Bank and the consolidation securitisation vehicles, which are measured at amortised cost.
15. Subordinated debt Consolidated Parent
2007 2006 2007 2006 $m $m $m $m
Subordinated Floating Rate Note (3 month BBSW + 0.56% maturing in April 2009) 100 100 – –7.125% GBP Subordinated Guaranteed Step-Up Bonds (maturing 2019) 224 247 – –6.875% GBP Subordinated Guaranteed Bonds (maturing 2022) 79 88 – –
Total subordinated debt1, 2, 3 403 435 – –
Footnote:1 The AMP group uses interest rate swaps and cross currency swaps to manage interest rate and currency risk inherent in certain debt issues, the net fair value
loss on these hedging instruments as at 31 December 2007 was $3m (2006: $3m). The group continued to achieve hedge accounting for the current period resulting in the carrying value of subordinated debt being $12m lower (2006: $10m lower) reflecting cumulative changes in fair value of the underlying hedged item for the period that the effective hedge relationships were in place.
2 Subordinated debt includes amounts to fund:i) AMP Bank – subordinated debt of $100m (2006: $100m).ii) Corporate activities of AMP – subordinated debt of $303m (2006: $335m).
3 All subordinated debt are at fair value through profit or loss, designated as such upon recognition, with the exception of $100m (2006: $100m) held by AMP Bank, which are measured at amortised cost.
64 AMP FULL FINANCIAL REPORT 2007
Notes to the fi nancial statements continued
for the year ended 31 December 2007

16. Dividends Consolidated Parent
2007 2006 2007 2006 $m $m $m $m
Final dividends paid 2006 paid in 2007: 21 cents per ordinary share franked to 85% (2005 paid in 2006: 18 cents per ordinary share franked to 75%) 394 337 394 337
Interim dividends paid 2007: 22 cents per ordinary share franked to 85% (2006: 19 cents per ordinary share franked to 85%) 412 356 412 356
Total dividends paid1, 2 806 693 806 693
Final dividend proposed but not recognised2007: 24 cents per ordinary share franked to 85% 450 n/a 450 n/a
Consolidated Parent
2007 2006 2007 2006 $m $m $m $m
Dividend franking account3, 4
Franking credits available to shareholders of AMP Limited (at 30%) 249 239 249 239
Footnote:1 Total dividends paid includes dividends paid on ‘treasury shares’. See Note 18 for further information regarding the impact of ‘treasury shares’ on dividends
paid and retained profits.2 All dividends are franked at a tax rate of 30%.3 The above available amounts are based on the balance of the dividend franking account at year end adjusted for:
a) franking credits that will arise from the payment of the current tax liabilityb) franking debits that will arise from the payment of dividends recognised as a liability at the year endc) franking credits that will arise from the receipt of dividends recognised as receivables by the tax consolidated group at the year endd) franking credits that the entity may be prevented from distributing in subsequent years.
4 The company’s ability to utilise the franking account credits depends on there being sufficient available profits to declare dividends. The impact of the proposed dividend will be to reduce the balance of the franking credit account by $164m.
AMP FULL FINANCIAL REPORT 2007 65

17. Contributed equity Consolidated Parent
2007 2006 2007 2006 $m $m $m $m
Movements in issued capitalBalance at the beginning of the period 4,253 4,959 4,253 4,959 Transfer of Capital Reserve to Issued Capital1 509 – 509 – Reduction in share capital through Capital return2 (750) (750) (750) (750)Nil (2006: 4,957,739) shares issued under Dividend Reinvestment Plan3 – 44 – 44 1,369 (2006: 1,829) shares issued to former members of the AMP Society4 – – – –
Balance at the end of the period 4,012 4,253 4,012 4,253
Total issued capital1,874,852,944 (2006: 1,874,851,575) ordinary shares fully paid 4,012 4,253 4,012 4,253
Movements in ‘treasury shares’5
Balance at the beginning of the period (186) (210) – –Decrease (increase) in cost of ‘treasury shares’ due to sales and purchases (11) 13 – – Decrease in cost of ‘treasury shares’ due to capital return 12 11 – –
Balance at the end of the period (185) (186) – –
Total contributed equity1,849,660,382 (2006: 1,847,637,683) ordinary shares fully paid5 3,827 4,067 4,012 4,253
Ordinary shares have the right to receive dividends as declared and, in the event of the winding up of the company, to participate in the proceeds from the sale of all surplus assets in proportion to the number of and amounts paid up on shares held. Ordinary shares have no par value.
Footnote:1 During the period the entire balance of the Capital reserve was transferred to Issued capital in accordance with section 23 of ATO Class Ruling 2007/30. The
amount transferred was subsequently used to fund part of the capital return made during the period (see footnote 2 below).2 On 15 February 2007, AMP announced a proposed capital return of 40 cents per share to the shareholders of AMP Limited. The capital return was approved
by shareholders at the annual general meeting on 17 May 2007. The record date for determining entitlement to the capital return was 25 May 2007 and payment was made on 18 June 2007.
On 16 February 2006, AMP announced a proposed capital return of 40 cents per share to the shareholders of AMP Limited. The capital return was approved by shareholders at the annual general meeting on 18 May 2006. The record date for determining entitlement to the capital return was 25 May 2006 and payment was made on 19 June 2006.
3 Under the terms of the Dividend Reinvestment Plan (DRP), shareholders may elect to have part of their dividend entitlements satisfied in shares rather than being paid in cash. Shares were issued under the DRP for the 2005 final dividend (paid in April 2006) at $8.78 per share. No shares were issued in relation to the 2006 or 2007 interim dividends and 2006 final dividend. Shares were purchased on market and transferred to DRP participants.
4 The former members of AMP Society exchanged their membership rights for shares in AMP Limited on demutualisation. 1,043,356,440 (2006: 1,043,355,071) shares have been issued since demutualisation to former members at an issue price of $3.00 per share. Ongoing minor adjustments represent shares issued to former members from the Capital reserve up until the point of the transfer of the reserve to issued capital (see Note 18).
5 Of the ordinary shares on issue, AMP Life Limited (a wholly owned controlled entity) holds 25,192,562 (2006: 27,213,892) shares in AMP Limited on behalf of policyholders. ASIC has granted relief from restrictions in the Corporations Act 2001 to allow AMP Life Limited to hold and trade shares in AMP Limited as part of the policyholder funds’ investment activities. The cost of the investment in these ‘treasury shares’ is reflected as a deduction from total contributed equity.
66 AMP FULL FINANCIAL REPORT 2007
Notes to the fi nancial statements continued
for the year ended 31 December 2007

18. Reserves and retained earnings Consolidated Parent
2007 2006 2007 2006 $m $m $m $m
Capital reserve1
Balance at the beginning of the period 509 510 509 510 Transfer of Capital reserve to Issued capital1 (509) – (509) –Other movements1 – (1) – (1)
Balance at the end of the period – 509 – 509
Equity contribution reserve2
Balance at the beginning of the period 1,019 1,019 – –Movements during the period – – – –
Balance at the end of the period 1,019 1,019 – –
Share-based payments reserve3
Balance at the beginning of the period 8 19 1 5 Expense during the period 17 10 6 2 Share purchases (31) (21) (8) (6)
Balance at the end of the period (6) 8 (1) 1
Cash flow hedges reserve4
Balance at the beginning of the period 18 3 – –Gains from changes in fair value 23 15 – –
Balance at the end of the period 41 18 – –
Owner-occupied property revaluation reserve5
Balance at the beginning of the period 61 26 – –Revaluations during the period 40 35 – –
Balance at the end of the period 101 61 – –
Foreign currency translation reserve6
Balance at the beginning of the period (13) 6 – –Net translation adjustment on self sustaining foreign operations (3) (19) – –
Balance at the end of the period (16) (13) – –
Demerger loss reserve7
Balance at the beginning of the period (3,585) (3,585) – –Movements during the period – – – –
Balance at the end of the period (3,585) (3,585) – –
Total reserves (2,446) (1,983) (1) 510
AMP FULL FINANCIAL REPORT 2007 67
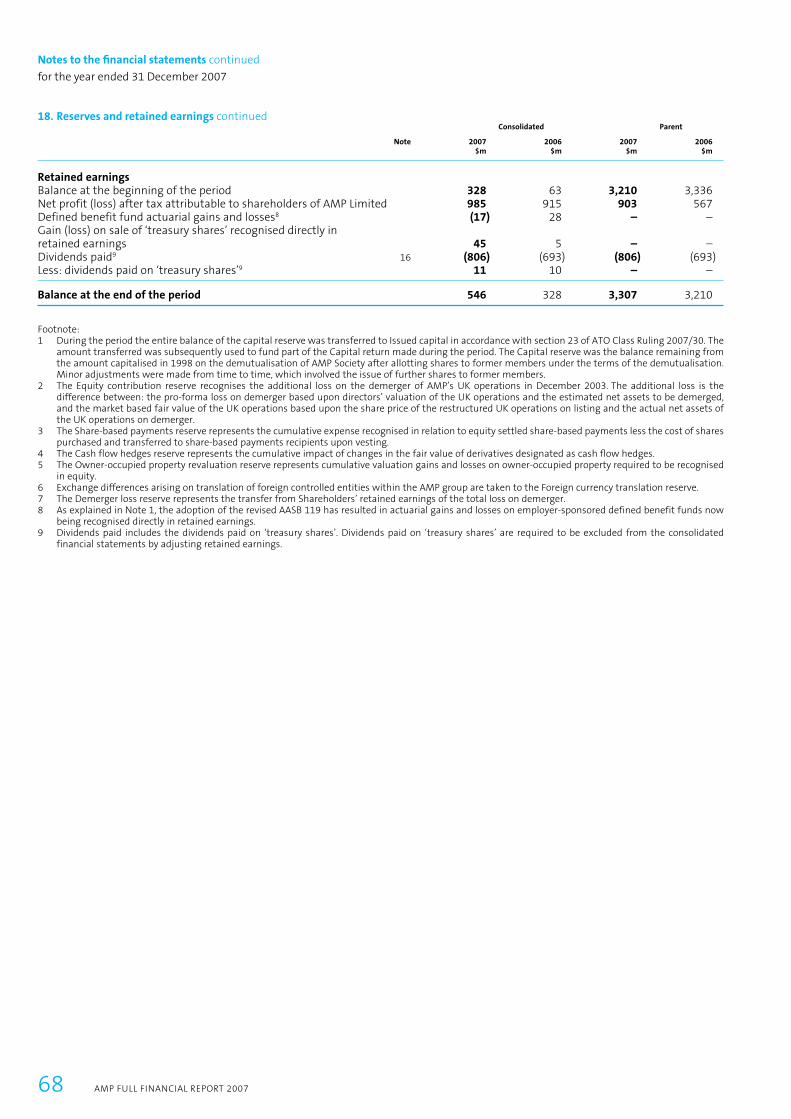
18. Reserves and retained earnings continued Consolidated Parent
Note 2007 2006 2007 2006 $m $m $m $m
Retained earningsBalance at the beginning of the period 328 63 3,210 3,336 Net profit (loss) after tax attributable to shareholders of AMP Limited 985 915 903 567 Defined benefit fund actuarial gains and losses8 (17) 28 – – Gain (loss) on sale of ‘treasury shares’ recognised directly in retained earnings 45 5 – – Dividends paid9 16 (806) (693) (806) (693)Less: dividends paid on ‘treasury shares’9 11 10 – –
Balance at the end of the period 546 328 3,307 3,210
Footnote:1 During the period the entire balance of the capital reserve was transferred to Issued capital in accordance with section 23 of ATO Class Ruling 2007/30. The
amount transferred was subsequently used to fund part of the Capital return made during the period. The Capital reserve was the balance remaining from the amount capitalised in 1998 on the demutualisation of AMP Society after allotting shares to former members under the terms of the demutualisation. Minor adjustments were made from time to time, which involved the issue of further shares to former members.
2 The Equity contribution reserve recognises the additional loss on the demerger of AMP’s UK operations in December 2003. The additional loss is the difference between: the pro-forma loss on demerger based upon directors’ valuation of the UK operations and the estimated net assets to be demerged, and the market based fair value of the UK operations based upon the share price of the restructured UK operations on listing and the actual net assets of the UK operations on demerger.
3 The Share-based payments reserve represents the cumulative expense recognised in relation to equity settled share-based payments less the cost of shares purchased and transferred to share-based payments recipients upon vesting.
4 The Cash flow hedges reserve represents the cumulative impact of changes in the fair value of derivatives designated as cash flow hedges.5 The Owner-occupied property revaluation reserve represents cumulative valuation gains and losses on owner-occupied property required to be recognised
in equity. 6 Exchange differences arising on translation of foreign controlled entities within the AMP group are taken to the Foreign currency translation reserve.7 The Demerger loss reserve represents the transfer from Shareholders’ retained earnings of the total loss on demerger. 8 As explained in Note 1, the adoption of the revised AASB 119 has resulted in actuarial gains and losses on employer-sponsored defined benefit funds now
being recognised directly in retained earnings.9 Dividends paid includes the dividends paid on ‘treasury shares’. Dividends paid on ‘treasury shares’ are required to be excluded from the consolidated
financial statements by adjusting retained earnings.
68 AMP FULL FINANCIAL REPORT 2007
Notes to the fi nancial statements continued
for the year ended 31 December 2007

19. Life insurance contracts
(a) Assumptions and methodology applied in the valuation of life insurance contract liabilities Life insurance contract liabilities, and hence the net profit from life insurance contracts, are calculated by applying the principles of Margin on Services (MoS). Refer to Note 1(x) for a description of MoS and the methods for calculating life insurance contract liabilities.
The methods and profit carriers used to calculate life insurance contract liabilities for particular policy types are as follows:
Business type Method Profit carriers (for business valued using projection method)
Conventional Projection BonusesInvestment account Modified accumulation N/ARisk1 Projection/accumulation Expected premiumsParticipating allocated annuities Accumulation/modified accumulation N/ALife annuities Projection Annuity payments
Footnote:1 For 2007 the profit carrier for Risk has changed from expected claims to expected premiums. The impact in 2007 is that $15m more profit has been
recognised than would have been recognised if expected claims had been used as the profit carrier.
Key assumptions used in the calculation of life insurance contract liabilities are as follows:
(i) Risk-free discount rates Except where benefits are contractually linked to the performance of the assets held, a risk-free discount rate based on current observable, objective rates that relate to the nature, structure and term of the future obligations is used. The rates are determined as shown in the following table.
31 December 2007 31 December 2006
Business type Basis Australia New Zealand Australia New Zealand
Retail risk 10 year government bond rate 6.4% 6.5% 6.0% 6.0%
Group risk Outstanding claims 2 year government bond rate 7.0% n/a 6.3% n/a
Life annuities Non-CPI Zero coupon interbankswap curve 6.9%–7.6% 4.9%–6.3% 6.1%–6.7% n/a
CPI Commonwealth indexed bond curve + 20 bp 2.8%–3.8% n/a 2.9%–3.2% n/a
New Zealand Government bond curve + 45 bp n/a n/a n/a 4.3%–4.8%
(ii) Participating business discount rates Where benefits are contractually linked to the performance of the assets held, as is the case for participating business, a discount rate based on the expected market return on backing assets is used. The assumed earning rates for backing assets for participating business are largely driven by long-term (e.g. 10 year) government bond yields. The 10 year government bond yields used at the relevant valuation dates are as noted above.
Assumed earning rates for each asset sector are determined by adding to the bond yield various risk premia which reflect the relative differences in expected future earning rates for different asset sectors. For products backed by mixed portfolio assets, the assumption varies with the proportion of each asset sector backing the product. The risk premia applicable at the valuation date are shown in the following table. Local International Corporate Other fixed equities equities Property bonds interest Cash
Australia31 December 2007 3.0% 2.5% 2.0% 0.5% 0.0% (0.5%)31 December 2006 3.0% 2.5% 2.0% 0.5% 0.0% (0.5%)
New Zealand31 December 2007 3.0% 2.5% 2.0% 0.5% 0.0% (0.5%)31 December 2006 3.0% 2.5% 2.0% 0.5% 0.0% (0.5%)
These risk premia do not include any allowance for imputation credits as they are explicitly allowed for in deriving net of tax investment earning assumptions.
AMP FULL FINANCIAL REPORT 2007 69

19. Life insurance contracts continued
The averages of the asset mixes assumed for the purpose of setting investment assumptions at the valuation date for participating business are as shown in the following table. These asset mixes are not necessarily the same as the actual asset mix at the valuation date, as they reflect long-term assumptions. Equities Property Fixed interest Cash
Australia31 December 2007 35% 15% 34% 16%31 December 2006 31% 12% 41% 16%
New Zealand31 December 2007 45% 19% 29% 7%31 December 2006 38% 17% 38% 7%
Where an assumption used is net of tax, the tax on investment income is allowed for at rates appropriate to the class of business and asset sector, including any allowance for imputation credits on equity income. For this purpose, the total return for each asset sector is split between income and capital gains. The actual split has varied at each valuation date as the total return has varied.
(iii) Future participating benefitsFor participating business, the total value of future bonuses (and the associated shareholders’ profit margin) included in life insurance contract liabilities is the amount supported by the value of the supporting assets, after allowing for the assumed future experience. The pattern of bonuses and shareholders’ profit margin assumed to emerge in each future year depends on the assumed relationship between reversionary bonuses (or interest credits) and terminal bonuses. This relationship is set to reflect the philosophy underlying actual bonus declarations.
Actual bonus declarations are determined to reflect, over time, the investment returns of the particular fund and other factors in the emerging experience and management of the business. These factors include:– allowance for an appropriate degree of benefit smoothing– reasonable expectations of policyholders– equity between generations of policyholders applied across different classes and types of business– ongoing solvency and capital adequacy.
Given the many factors involved, the range of bonus structures and rates for participating business is extremely diverse.
Typical supportable bonus rates on major product lines are as follows (31 December 2006 in parentheses).
Reversionary bonus Bonus on sum insured Bonus on existing bonus
Australia 1.2%–1.6% (1.2%–1.5%) 1.6%–2.2% (1.5%–2.2%)New Zealand 0.9%–1.2% (0.5%–0.7%) 0.9%–1.2% (0.5%–0.7%)
Terminal bonusThe terminal bonus scales are complex and vary by duration, product line, class of business and country.
Crediting rates (investment account)
Australia 4.4%–8.2% (3.7%–7.2%)New Zealand 3.5%–4.6% (3.1%–4.3%)
(iv) Future maintenance and investment expenses Unit maintenance costs are based on budgeted expenses in the year following the reporting date (including GST, as appropriate, and excluding one-off expenses). For future years, these are increased for inflation as described in (v) below. These expenses include fees charged to the life statutory funds by service companies in the AMP Life group. Unit costs vary by product line and class of business based on an apportionment that is supported by expense analyses.
Future investment expenses are based on the fees currently charged by the asset managers.
(v) Inflation and indexationBenefits and premiums under many regular premium policies are automatically indexed by the published Consumer Price Index (CPI). Assumed future take-up of these indexation options is based on AMP’s own experience with the annual CPI rates derived from:– the difference between long-term government bonds and indexed government bonds for Australia – long-term government bonds for New Zealand.
The assumptions for expense inflation have regard to these rates, recent expense performance, AMP’s current plans and the terms of the relevant service company agreement, as appropriate.
The assumed annual indexation and inflation rates at the valuation date are: Australia New Zealand
31 December 2007 3.5% CPI, 3.0% Expenses 2.2% CPI, 3.0% Expenses31 December 2006 3.2% CPI, 3.0% Expenses 2.6%
70 AMP FULL FINANCIAL REPORT 2007
Notes to the fi nancial statements continued
for the year ended 31 December 2007

19. Life insurance contracts continued
(vi) Bases of taxationThe bases of taxation (including deductibility of expenses) are assumed to continue in accordance with legislation current at the valuation date for Australia, and in accordance with legislation changes effective from 1 January 2008 for New Zealand.
(vii) Voluntary discontinuanceAssumptions for the incidence of withdrawals, paid ups and premium dormancy are primarily based on investigations of AMP Life’s own experience over the past three years. These rates are based upon the assessed global rate for each of the individual products (or product groups) and then, where appropriate, further adjusted for duration, age attained or short-term market and business effects. Given the variety of influences affecting discontinuance for different product groups, the range of voluntary discontinuance rates across AMP Life is extremely diverse.
Future rates of discontinuance used at 31 December 2007 are unchanged from those assumed at 31 December 2006 except for:– Australia – higher withdrawal rates for Flexible Lifetime Super (FLS) and Allocated Pensions, Term insurance and FLS risk.
Changes to duration-based withdrawal rates for FLS risk business that has transferred from corporate superannuation business. – New Zealand – higher withdrawal rates on disability income business.
Future rates of discontinuance for the major classes of life insurance contracts are assumed to be as shown in the following table.
31 December 2007 31 December 2006
Business type Australia New Zealand Australia New Zealand
Conventional 3.3%–4.0% 2.2% 3.4%–4.0% 2.3%Investment account n/a n/a 10%–15% n/aRetail risk 10%–11% 6.8%–8.1% 10%–11% 6.7%–7.6%FLS risk business (ultimate rate) 7.5% n/a 7.0% n/a
(viii) Surrender valuesThe surrender bases assumed are those current at the reporting date. There have been no changes to the bases during the year (or the prior year) that would materially affect the valuation results.
(ix) Mortality and morbidity Standard mortality tables, based on national or industry wide data, are used (e.g. IA95-97 and IM(F)80 in Australia and New Zealand). These are then adjusted by factors that take account of AMP Life’s own experience, primarily over the past three years. For annuity business, adjustment is also made for mortality improvements prior to and after the valuation date.
Rates of mortality assumed at 31 December 2007 are unchanged from those assumed at 31 December 2006 in Australia and New Zealand. Rates of annuitant mortality in Australia are unchanged but those in New Zealand have been aligned with those used in Australia.
Typical mortality assumptions, in aggregate, are as follows:
Conventional – % of IA95-97 Term – % of IA95-97
Risk products Male Female Male Female
Australia 80% 80% 67% 67%New Zealand 78% 78% 67% 67%
Annuities Male – % of IM80 Female – % of IF80
Australia 72% 61%
For disability income business, the claim assumptions are currently based on CIDA85, which is derived from North American experience. It is adjusted for AMP Life’s experience, with the adjustment dependent on age, sex, waiting period, occupation, smoking status and claim duration. For New Zealand, the incidence rates have increased, and, for both Australia and New Zealand termination rates have been decreased as at 31 December 2007 compared to those at 31 December 2006.
For trauma cover, standard tables are not available and so assumptions are mostly based on Australian population statistics, with adjustment for smoking status as well as AMP Life’s recent claim experience. Assumptions at 31 December 2007 are unchanged from those used at 31 December 2006.
The Actuarial tables used were:
IA95-97 A mortality table developed by the Institute of Actuaries of Australia based on Australian insured lives experience from 1995–1997.
IM80* / IF80* IM80 and IF80 are mortality tables developed by the Institute of Actuaries and the Faculty of Actuaries based on United Kingdom annuitant lives experience from 1979–1982. The tables refer to male and female lives, respectively, and incorporate factors that allow for mortality improvements since the date of the investigation.*IM80 and IF80 are these published tables amended for some specific AMP experience.
CIDA85 A disability table developed by the Society of Actuaries based on North American disability income experience from 1973–1979.
AMP FULL FINANCIAL REPORT 2007 71
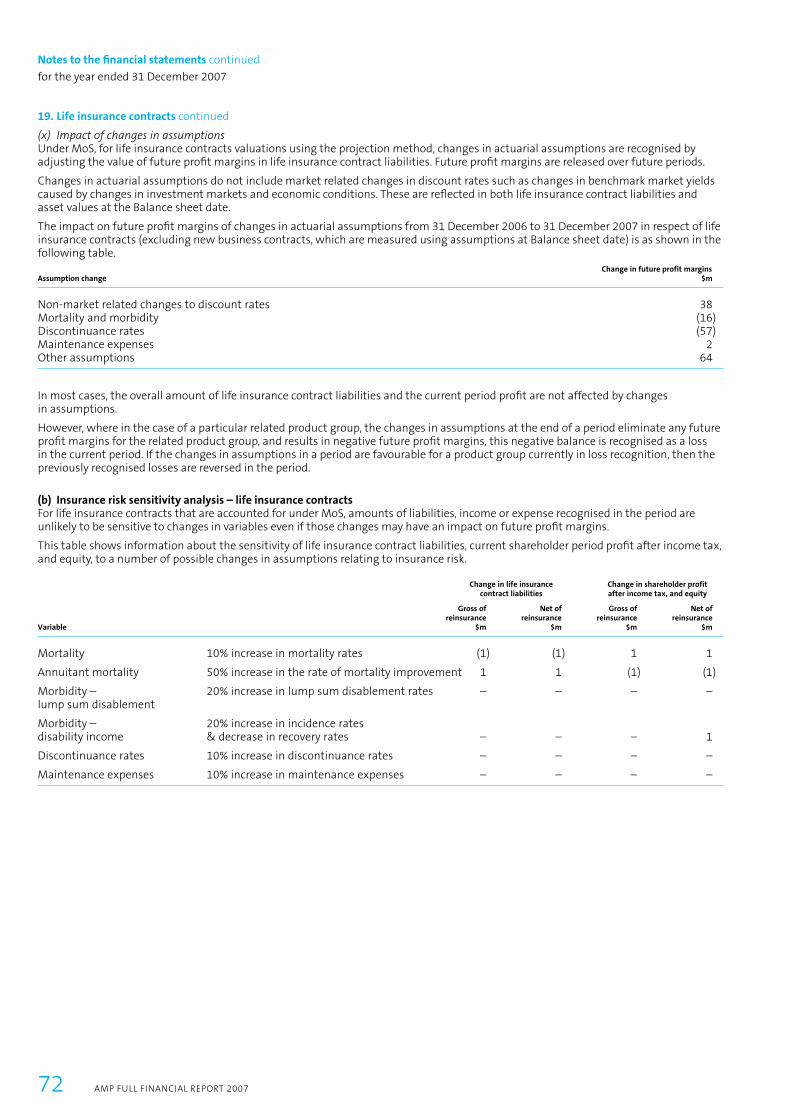
19. Life insurance contracts continued
(x) Impact of changes in assumptions Under MoS, for life insurance contracts valuations using the projection method, changes in actuarial assumptions are recognised by adjusting the value of future profi t margins in life insurance contract liabilities. Future profi t margins are released over future periods.
Changes in actuarial assumptions do not include market related changes in discount rates such as changes in benchmark market yields caused by changes in investment markets and economic conditions. These are refl ected in both life insurance contract liabilities and asset values at the Balance sheet date.
The impact on future profi t margins of changes in actuarial assumptions from 31 December 2006 to 31 December 2007 in respect of life insurance contracts (excluding new business contracts, which are measured using assumptions at Balance sheet date) is as shown in the following table. Change in future profit marginsAssumption change $m
Non-market related changes to discount rates 38Mortality and morbidity (16)Discontinuance rates (57)Maintenance expenses 2Other assumptions 64
In most cases, the overall amount of life insurance contract liabilities and the current period profi t are not affected by changes in assumptions.
However, where in the case of a particular related product group, the changes in assumptions at the end of a period eliminate any future profi t margins for the related product group, and results in negative future profi t margins, this negative balance is recognised as a loss in the current period. If the changes in assumptions in a period are favourable for a product group currently in loss recognition, then the previously recognised losses are reversed in the period.
(b) Insurance risk sensitivity analysis – life insurance contractsFor life insurance contracts that are accounted for under MoS, amounts of liabilities, income or expense recognised in the period are unlikely to be sensitive to changes in variables even if those changes may have an impact on future profi t margins.
This table shows information about the sensitivity of life insurance contract liabilities, current shareholder period profi t after income tax, and equity, to a number of possible changes in assumptions relating to insurance risk. Change in life insurance Change in shareholder profit contract liabilities after income tax, and equity
Gross of Net of Gross of Net of reinsurance reinsurance reinsurance reinsurance Variable $m $m $m $m
Mortality 10% increase in mortality rates (1) (1) 1 1
Annuitant mortality 50% increase in the rate of mortality improvement 1 1 (1) (1)
Morbidity – 20% increase in lump sum disablement rates – – – –lump sum disablement
Morbidity – 20% increase in incidence rates disability income & decrease in recovery rates – – – 1
Discontinuance rates 10% increase in discontinuance rates – – – –
Maintenance expenses 10% increase in maintenance expenses – – – –
72 AMP FULL FINANCIAL REPORT 2007
for the year ended 31 December 2007
Notes to the fi nancial statements continued

19. Life insurance contracts continued Consolidated Parent
2007 2006 2007 2006 $m $m $m $m
(c) Analysis of life insurance contract premium and related revenue Total life insurance contract premiums received and receivable 2,014 1,964 – – Less: component recognised as a change in life insurance contract liabilities (1,110) (1,093) – –
Life insurance contract premium revenue1 904 871 – – Reinsurance recoveries 26 25 – –
Total life insurance contract premium and related revenue 930 896 – –
(d) Analysis of life insurance contract claims and related expenses Total life insurance contract claims paid and payable (2,879) (3,024) – – Less: component recognised as a change in life insurance contract liabilities 1,571 1,790 – –
Life insurance contract claims expense (1,308) (1,234) – – Outwards reinsurance expense (41) (37) – –
Total life insurance contract claims and related expenses (1,349) (1,271) – –
(e) Analysis of life insurance contract operating expenses Life insurance contract acquisition expenses – Commission (44) (42) – – – Other (72) (73) – – Life insurance contract maintenance expenses – Commission (67) (62) – – – Other (261) (263) – – Investment management expenses (47) (49) – –
Footnote:1 Life insurance contract premium revenue consists entirely of direct insurance premiums, there is no inward reinsurance component.
AMP FULL FINANCIAL REPORT 2007 73

19. Life insurance contracts continued Consolidated Parent
2007 2006 2007 2006 Note $m $m $m $m
(f) Life insurance contract liabilities Life insurance contract liabilities determined using projection method Best estimate liability – Value of future life insurance contract benefits 10,790 11,949 – – – Value of future expenses 2,359 2,487 – – – Value of future premiums (8,422) (8,498) – – Value of future profits – Life insurance contract holder bonuses 3,235 3,079 – – – Shareholders’ profit margins 2,538 2,475 – –
Total life insurance contract liabilities determined using the projection method1 10,500 11,492 – –
Life insurance contract liabilities determined using accumulation method Best estimate liability – Value of future life insurance contract benefits 8,190 7,608 – – – Value of future acquisition expenses (16) (21) – –
Total life insurance contract liabilities determined using accumulation method1 8,174 7,587 – –
Value of declared bonus 549 515 – – Unvested life insurance contract holder benefits2 1,448 1,346 – –
Total life insurance contract liabilities before reinsurance 20,671 20,940 – –
Add: Reinsurers share of life insurance contract liabilities 43 34 – –
Total life insurance contract liabilities per the Life Act 20(e) 20,714 20,974 – –
Less: deferred tax balances separately disclosed on the balance sheet (79) – – –
Total life insurance contract liabilities 20(e) 20,635 20,974 – –
Footnote:1 During 2007 a number of products, representing approximately $700m of insurance contract liabilities, have moved from a projection method of liability
measurement to an accumulation method.2 For life statutory funds which include participating business, part of the assets in excess of the life insurance contract and other liabilities calculated under
MoS is attributed to policyholders. Under the Life Act, this is referred to as Policy owner retained profits. For the purpose of reporting under AASB 1038 Life Insurance Contracts, this amount is referred to as Unvested life insurance contract holder benefits and is included within Life insurance contract liabilities even though it is yet to be vested in specific policyholder entitlements.
Consolidated Parent
Note 2007 2006 2007 2006 $m $m $m $m
(g) Reconciliation of changes in life insurance contract liabilities Total life insurance contract liabilities at the beginning of the period 20,974 20,942 – –Change in life insurance contract liabilities recognised in the Income statement 201 794 – –Premiums recognised as an increase in life insurance contract liabilities 19(c) 1,110 1,093 – –Claims recognised as a decrease in life insurance contract liabilities 19(d) (1,571) (1,790) – –Deferred tax balances separately disclosed on the Balance sheet 20(e) (79) – – –Change in reinsurers share of life insurance contract liabilities 9 (9) – –Foreign exchange adjustment (9) (56) – –
Total life insurance contract liabilities at the end of the period 19(f) 20,635 20,974 – –
74 AMP FULL FINANCIAL REPORT 2007
for the year ended 31 December 2007
Notes to the fi nancial statements continued
19. Life insurance contracts continued
(h) Life insurance riskThe life insurance activities of AMP Life involve a number of non-fi nancial risks concerned with the pricing, acceptance and management of the mortality, morbidity and longevity risks accepted from policyholders, often in conjunction with the provision of wealth-management products. Risks and management policies in relation to AMP Life’s use of fi nancial instruments are discussed in Note 22.
The design of products carrying insurance risk is managed to ensure that policy wording and promotional materials are clear, unambiguous and do not leave AMP Life open to claims from causes that were not anticipated. Product prices are set through a process of fi nancial analysis, including review of previous AMP Life and industry experience and specifi c product design features. The variability inherent in insurance risk is managed by having a large portfolio of individual risks, underwriting and the use of reinsurance.
Underwriting is managed through a dedicated underwriting department, with formal underwriting limits and appropriate training and development of underwriting staff. Individual policies carrying insurance risk are underwritten on their merits and are generally not issued without having been examined and underwritten individually. Group risk insurance policies meeting certain criteria are underwritten on the merits of the employee group as a whole.
Claims are managed through a dedicated claims management team, with formal claims acceptance limits and appropriate training and development of staff to ensure payment of all genuine claims. Claims experience is assessed regularly and appropriate actuarial reserves are established to refl ect up-to-date experience and any anticipated future events. This includes reserves for claims incurred but not yet reported.
AMP Life reinsures (cedes) to specialist reinsurance companies a proportion of its portfolio or certain types of insurance risk. This serves primarily to:– reduce the net liability on large individual risks– obtain greater diversifi cation of insurance risks – provide protection against large losses.
The specialist reinsurance companies are regulated by APRA or industry regulators in other jurisdictions and have strong credit ratings from A+ to AAA.
Terms and conditions of life insurance contractsThe nature of the terms of the life insurance contracts written by AMP Life is such that certain external variables can be identifi ed on which related cash fl ows for claim payments depend. The following table provides an overview of the key variables upon which the timing and uncertainty of future cash fl ows of the various life insurance contracts issued by AMP Life depend.
Type of contract Detail of contract workings Nature of compensation for claims Key variables affecting future cash flows
Non-participating life insurance contracts with fixed and guaranteed terms (term life and disability)
These policies provide guaranteed benefits, which are paid on the death or ill-health, that are fixed and not at the discretion of AMP Life.
Benefits, defined by the insurance contract, are not directly affected by the performance of underlying assets or the performance of any associated investment contracts as a whole.
Mortality, morbidity, lapses, expenses and market earning rates on assets backing the liabilities.
Life annuity contracts
In exchange for an initial single premium, these policies provide a guaranteed regular income for the life of the insured.
The amount of the guaranteed regular income is set at inception of the policy, including any indexation.
Longevity, expenses and market earning rates on assets backing the liabilities.
Conventional life insurance contracts with discretionary participating benefits (endowment and whole of life)
These policies combine life insurance and savings. The policyholder pays a regular premium and receives the specified sum assured plus any accruing bonuses on death or maturity. The sum insured is specified at inception and guaranteed. Reversionary bonuses are added annually, which once added (vested) are guaranteed. A further terminal bonus may be added on death or maturity.
Operating profit arising from these contracts is allocated 80:20% between the policyholders and shareholder in accordance with the Life Act. The amount allocated to policyholders is held as an unvested policy liability until it is distributed to specific policyholders as bonuses.
Market earning rates on assets backing the liabilities, lapses, expenses, and mortality.
Investment account contracts with discretionary participating features
The gross value of premiums received is invested in the investment account with fees and premiums for any associated insurance cover being deducted from the account balance. Interest is credited regularly.
The payment of the account balance is generally guaranteed, although it may be subject to certain penalties on early surrender or limited adjustment in adverse markets. Operating profit arising from these contracts is allocated between the policyholders and shareholders in accordance with the Life Act. The amount allocated to policyholders is held as an unvested policy liability until it is distributed to specific policyholders as interest credits.
Fees, lapses, expenses and market earning rates on the assets backing the liabilities.
AMP FULL FINANCIAL REPORT 2007 75
19. Life insurance contracts continued
Liquidity risk and future net cash outflowsThe following table shows the estimated timing of future net cash outfl ows resulting from insurance contract liabilities. This includes estimated future surrenders, death/disability claims and maturity benefi ts, offset by expected future premiums or contributions and reinsurance recoveries. All values are discounted to the current date using the assumed future investment earning rate for each product. Up to 1 1 to 5 Over 5 year years years Total $m $m $m $m
31/12/2007 1,351 3,739 7,139 12,22931/12/2006 1,368 3,864 7,351 12,583
20. Other life insurance and investment contracts disclosures Consolidated Parent
2007 2006 2007 2006 $m $m $m $m
(a) Analysis of life insurance and investment contract profit Components of profit related to life insurance and investment contract liabilities: – Planned margins of revenues over expenses released 446 363 – – – Profits (losses) arising from difference between actual and assumed experience1 21 150 – –
Profit related to life insurance and investment contract liabilities 467 513 – – Attributable to: – Life insurance contracts 282 285 – – – Investment contracts 185 228 – –
Investment earnings on assets in excess of life insurance and investment contract liabilities 91 103 – –
Footnote:1 Experience profits include the impact of the reversal of discounting of deferred tax in unit prices of investment contract liabilities (refer Note 1(d) (a profit
of $7m in 2007, $62m in 2006). Other experience profits arise from the differences in actual mortality, morbidity, voluntary discontinuance and investment experience compared to that assumed.
(b) Restrictions on assetsInvestments held in the life statutory funds can only be used in accordance with the relevant regulatory restrictions imposed under the Life Act and associated rules and regulations. The main restrictions are that the assets in a life statutory fund can only be used to meet the liabilities and expenses of that life statutory fund, to acquire investments to further the business of the life statutory fund or as distributions when solvency, capital adequacy and other regulatory requirements are met.
(c) Capital guarantees Consolidated Parent
2007 2006 2007 2006 $m $m $m $m
Life insurance contracts with a discretionary participating feature– Amount of the liabilities that relate to guarantees 14,602 14,810 – –
Investment linked contracts– Amount of the liabilities subject to investment performance guarantees 1,159 1,115 – –
Other life insurance contracts with a guaranteed termination value– Current termination value 564 173 – –
76 AMP FULL FINANCIAL REPORT 2007
for the year ended 31 December 2007
Notes to the fi nancial statements continued

20. Other life insurance and investment contracts disclosures continued
(d) Solvency and capital adequacy Registered life insurance entities are required to hold prudential reserves, over and above their life insurance contract and investment contract liabilities, as a buffer against adverse experience and poor investment returns. These prudential reserving requirements are specifi ed by the Life Act and accompanying Actuarial Standards. AMP Life holds additional amounts of reserves to provide a higher level of security for policyholder benefi ts than would be achieved by holding the statutory minimum.
Under the Life Act, there are two requirements for each life statutory fund:– the solvency requirement, and– the capital adequacy requirement.
Solvency requirementsThe solvency requirement is the absolute minimum that must be satisfi ed for the business to be allowed to continue to operate. Its purpose is to ensure, as far as practicable, that at any time the fund will be able to meet all existing life insurance contract liabilities, investment contract liabilities and other liabilities as they become due.
The Appointed Actuary of AMP Life has confi rmed that the available assets of each life statutory fund have exceeded the solvency reserve required at all times during the reporting period. Across all the life statutory funds, the excess assets, expressed as a percentage of the solvency reserve, at 31 December 2007, were 82% (31 December 2006: 71%).
Capital adequacy requirementsThe capital adequacy requirement is a separate requirement (usually higher) that must be satisfi ed for the life entity to be allowed to make distributions to its shareholders and to operate without regulatory intervention. Its purpose is to ensure, as far as practicable, that there is suffi cient capital in each life statutory fund for the continued conduct of the life insurance business, including writing new business, in a way which is in the interests of policyholders and in accordance with the Life Act.
The Appointed Actuary of AMP Life has confi rmed that the available assets of each life statutory fund have exceeded the capital adequacy reserve required at all times during the reporting period. For this purpose, the capital adequacy reserve is defi ned as the solvency reserve, plus the difference between the capital adequacy requirement and the solvency requirement. Across all the life statutory funds, the excess assets, expressed as a percentage of the capital adequacy reserve, as at 31 December 2007, was 13% (31 December 2006: 12%).
(e) Actuarial informationMr Rocco Mangano, as the Appointed Actuary of AMP Life, is satisfi ed as to the accuracy of the data used in the valuations in the Financial Report and in the tables in this Note and Note 19.
Other than in respect of the treatment of tax on deferred acquisition costs within the New Zealand branch of statutory fund 1 (see below), the policy liabilities (being the sum of the life insurance contract and investment contract liabilities, including any asset or liability arising in respect of the management services element of an investment contract) and solvency reserves have been determined at the reporting date in accordance with the Life Act.
Deferred tax on acquisition costs Australian and New Zealand accounting standards both require the tax effect of transactions to be separately disclosed. In Australia the tax and accounting recognition of acquisition costs is the same, hence there is no deferred tax arising from their deferral and inclusion as part of the MoS liability. However, in New Zealand the tax regime recognises a deduction for acquisition expenses as they are incurred rather than over the life of the policy. This results in a difference in the tax and accounting recognition and creates a deferred tax liability.
For accounting purposes this amount (2007: $79m) is removed from the life insurance contract liability and included within the deferred tax liability. The actuarial standards for life insurance contracts require the policy liabilities to be calculated using the present value of future cashfl ows net of any tax effect. As a result, the amount of policy liabilities determined in accordance with the Life Act ($20,714m) includes the deferral of the tax deduction for acquisition expenses and differs from the amount recognised in this Financial Report ($20,635m) by this amount.
(f) Amounts expected to be recovered or settled no more than 12 months after the reporting date Based on assumptions as to likely withdrawal patterns of the various product groups, it is estimated that approximately $11,445m (2006: $9,305m) of policy liabilities may be settled within 12 months of the reporting date.
(g) Disaggregated informationAs describe in Note 1(a), the Life Act requires the life insurance business of AMP Life to be conducted within statutory funds that are separate to the AMP Life shareholder’s fund. The fi nancial statements of AMP Life (which are lodged with the relevant Australian regulators) disclose all major components of the fi nancial statements disaggregated between the various life insurance statutory funds and the shareholder’s fund, as well as by investment-linked and non-investment-linked business.
AMP FULL FINANCIAL REPORT 2007 77

21. Discontinued operations held for sale
(a) Details of discontinued operations held for saleOn 11 December 2007, the AMP group entered into a sale agreement for its closed reinsurance and general insurance operations, Cobalt/Gordian. The sale once finalised will represent a complete exit from this business by the AMP group.
The Cobalt/Gordian business includes:– the residual general insurance portfolios including the international reinsurance business and the old AMP Corporate insurance
portfolios not divested in 2001– Cobalt Solutions, a specialist management service organisation, which manages the run off of the AMP group’s general insurance
business.
The operations have been closed to new business since 1999 and there have been no new general insurance contracts issued in the seven years prior to and including this Financial Report. The sale is subject to a number of regulatory approvals, including the Australian Prudential Regulatory Authority and is expected to be finalised by 31 March 2008. As at 31 December 2007, Cobalt/Gordian was classified as a discontinued operation held for sale. 2007 2006 $m $m
(b) Financial performance of discontinued operations held for sale The results of the discontinued operations held for sale are presented below: Revenue 21 42 Expenses1 223 75
Profit (loss) before tax from discontinued operations held for sale 244 118
Income tax expense (51) (30)
Profit (loss) after tax from discontinued operations held for sale 193 88
Footnote: 1 The net negative expenses include releases of provisions.
2007 2006 $m $m
(c) Assets and liabilities of discontinued operations held for sale The major classes of assets and liabilities of the discontinued operations held for sale are as follows:
Assets1 Cash and cash equivalents 37 Reinsurance and other recoveries receivable 66 Trade and other receivables 11 Debt securities 570 Other financial assets 26 Deferred tax assets 37
Total assets of discontinued operations held for sale 747
Liabilities1 Trade and other payables 8 Current tax liability 24 Outstanding claims liability 525 Other financial liabilities 115
Total liabilities of discontinued operations held for sale 672
Net assets attributable to discontinued operations held for sale 75
Footnote:1 The assets and liabilities of the discontinued operations are after excluding asset and liability balances with other controlled entities of the AMP group.
78 AMP FULL FINANCIAL REPORT 2007
for the year ended 31 December 2007
Notes to the fi nancial statements continued

21. Discontinued operations held for sale continued 2007 2006 $m $m
(d) Cash flow information – discontinued operations held for sale The net cash flows of the discontinued operations held for sale are as follows: Net cash inflow (outflow) from operating activities (98) (101)Net cash inflow (outflow) from investing activities 285 273 Net cash inflow (outflow) from financing activities – –
Net cash inflow (outflow) of discontinued operations held for sale 187 172
2007 20061
$m $m
(e) Reinsurance and other recoveries receivable Reinsurance recoveries receivable on the outstanding claims liability 50 76 Reinsurance recoveries receivable on paid claims 16 16
Total reinsurance and other recoveries receivable 66 92
Footnote:1 As discussed in Note 1(jj), the 2006 comparative balances in relation to discontinued operations have not been restated. The amounts presented are for
comparative purposes only.
2007 20061
$m $m
(f) Analysis of outstanding claims Gross central estimate of present value of future claims payments 452 686 Risk margin 73 119
Total outstanding claims liability 525 805
Percentage risk margin adopted in determining the outstanding claims liability 16% 17%Probability of sufficiency achieved by the risk margin 75% 75%
The expected settlement pattern of the outstanding claims liability is as follows: Current 107 143 Non-current 418 662
Total outstanding claims liability 525 805
The liability for outstanding claims is segmented as follows: Direct insurance 252 416 Inwards reinsurance 273 389
Total outstanding claims liability 525 805
Footnote:1 As discussed in Note 1(jj), the 2006 comparative balances in relation to discontinued operations have not been restated. The amounts presented are for
comparative purposes only.
Amounts expected to be recovered or settled no more than 12 months after the reporting date Investment assets in the form of debt securities are held to back the liability for outstanding claims and are realised on a regular basis to meet claims. The amount of claims likely to be settled within 12 months of the reporting date is set out above.
AMP FULL FINANCIAL REPORT 2007 79
21. Discontinued operations held for sale continued
(g) Assumptions and methodology applied in the valuation of general insurance contract liabilitiesActuarial methods and assumptionsThe AMP group’s general insurance operations have written both direct insurance business and inwards reinsurance business. The process for determining the value of outstanding claims liabilities is generally consistent between the two classes. This process is described below.
Claims estimates are derived from analysis of the results of several different actuarial models. These models take case estimates as well as payments into account and assume that reported incurred amounts or reported payment amounts will develop steadily from period to period. Other models adopt an ultimate loss ratio for each year that refl ects both the long-term expected level, as well as incorporating recent experience. The analysis is performed by underwriting year for the inwards reinsurance class and by accident year for the direct insurance class.
Claims are fi rst estimated on an undiscounted basis and are then discounted to allow for the time value of money.
The valuation methods adopted include an implicit allowance for future infl ation but do not identify the explicit rate. This allows for both general economic infl ation as well as any superimposed infl ation detected in the modelling of payments experience. Superimposed infl ation arises from non-economic factors such as developments of legal precedent.
The product liability class of business may be subject to the emergence of new types of latent claims, but no specifi c allowance is included for this as at the Balance sheet date. Such uncertainties are considered when setting the risk margin appropriate for this class.
A description of the processes used to determine the key assumptions is provided below:– average weighted term to settlement is calculated separately by class of business, based on historical settlement patterns.– reinsurance percentage for the direct insurance business is calculated based on past reinsurance recovery rates and the structure
of the reinsurance arrangements in place.– discount rates are derived from market yields on government securities as at the balance date, in the currency of the expected
claim payments.– Expense rate. Claim handling expenses are calculated based on the projected costs of administering the remaining claims until
expiry.– ultimate to incurred claims ratio is derived by accident year or underwriting year based on the historical development of claims
from period to period.
Process for determining risk marginThe risk margin was determined initially for each portfolio, allowing for the uncertainty of the outstanding claims estimate for each portfolio. Uncertainty was analysed for each portfolio, taking into account:– past volatility in general insurance claims– potential uncertainties relating to the actuarial models and assumptions– the quality of the underlying data used in the models– the general insurance environment.
The estimate of uncertainty is generally greater for long tail classes when compared to short tail classes due to the longer time until settlement of outstanding claims.
The overall risk margin was determined allowing for diversifi cation between the different portfolios and the relative uncertainty of each portfolio. The assumptions regarding uncertainty for each class were applied to the net central estimates, and the results were aggregated, allowing for diversifi cation, in order to arrive at an overall provision that is intended to have a 75% probability of adequacy.
80 AMP FULL FINANCIAL REPORT 2007
for the year ended 31 December 2007
Notes to the fi nancial statements continued

22. Risk management and financial instruments information
Financial Risk Management objectivesThe principal objective of the AMP group’s Financial Risk Management (FRM) strategy is to establish a robust structure for the determination of risk appetite and the measuring, monitoring, reporting and escalation of financial risks. The AMP group seeks to manage financial risks to maximise the return on shareholder capital, while ensuring:– that the AMP group remains solvent– there is suffi cient cash fl ow available to execute the operational strategy set by the AMP Limited Board of Directors (the board).
The AMP group’s FRM is carried out in accordance with policies set by the AMP Limited Board. These policies are set out in the AMP group’s FRM Policy and they provide a clear structure for managing financial risks including delegations, escalations and reporting. The FRM Policy also outlines the AMP group’s financial risk management objectives and identifies organisational responsibilities for the implementation of the FRM Policy. The FRM Policy provides an overview of each of the key financial risks including the nature of the risk, objectives in seeking to manage the risk, the key policy variables for the management of the risk and the business unit responsibility for managing and reporting the risk.
Financial Risk Management structureThe board has ultimate responsibility for risk management and governance, including ensuring an appropriate risk framework is in place and is operating effectively. There are, however, other bodies and individuals within AMP group that manage and monitor fi nancial risks.
The boardThe board is responsible for the approval of the FRM Policy, shareholder capital investment strategy, capital and fi nancing plans, approval of transactions outside of FRM policy and setting the fi nancial risk appetite.
The Audit CommitteesThe AMP Limited Audit Committee (AMP AC) is responsible for ensuring the existence of effective fi nancial risk management policies and procedures, and oversight of the execution of the FRM Policy. The AMP Life, AMP Capital Investors (AMPCI), AMP Bank, and General Insurance Audit Committees, are delegated this responsibility for the elements specifi c to their respective business units.
AMP group Asset and Liability CommitteeThe AMP group Asset and Liability Committee (Group ALCO) provides advice to the Board on FRM Policy, shareholder capital investment strategy, capital and fi nancing plans, and the execution of approved plans. It also monitors and reports to the AMP AC on compliance with the FRM Policy and risks undertaken by subsidiary entities that present a risk to shareholder capital.
AMP group TreasuryAMP group Treasury (AMP Treasury) is responsible for the execution of FRM Policy and capital/fi nancing plans in compliance with board approved targets and limits. AMP Treasury is also responsible for the execution of approved investment strategy for AMP shareholder capital, for analysis and reporting of fi nancial risks and capital position to Group ALCO, AMP AC and the board, for monitoring and compliance of FRM Policy in relation to fi nancial risk management and identifying and reporting breaches of policy to Group ALCO and the board.
Internal auditInternal audit has the responsibility for audit compliance with the FRM Policy as part of its ongoing audit cycle. It is required to review the policy effectiveness and report to the AMP AC.
Controlled entity boardsThe directors and boards of various AMP Limited operating controlled entities are required to comply with the board approved risk appetite. The AMP Limited operating controlled entities are also responsible for approving, where relevant, policyholder asset and liability strategy, and allocated subsidiary shareholder capital investment and for reporting to the AMP AC, entity audit committees and Group ALCO on fi nancial risks.
Appointed ActuaryThe Appointed Actuary is responsible for reporting to the AMP Life Board, AMP AC, Group ALCO and APRA on the fi nancial condition of AMP Life, including solvency, capital adequacy and target surplus. The Appointed Actuary is also responsible for giving advice to the company on distribution of profi ts, premium rates, charges, policy conditions and reinsurance arrangements. The Life Insurance Act also imposes obligations on the Appointed Actuary to bring to the attention of the company, or in some circumstances, APRA, any matter that the Appointed Actuary thinks requires action to be taken to avoid prejudice to the interests of policyholders.
Approved ActuaryThe Approved Actuary is responsible for reporting to the ‘Cobalt Gordian’ Boards, AMP AC and APRA on solvency and capital adequacy of the general insurance and reinsurance entities. A Financial Condition Report (FCR) and an Insurance Liability Valuation Report (ILVR) must be provided to the board and APRA at least annually, and the ILVR must be peer reviewed by an external independent actuary. The Insurance Act also imposes obligations on the Approved Actuary to bring to the attention of the company, or in some circumstances, APRA, any matter that the Approved Actuary thinks requires action to be taken to avoid prejudice to the interests of policyholders.
Risks and mitigationThe AMP group’s activities expose it to a variety of financial risks:– market risk, including interest rate risk, currency risk, equity price risk and investment risk– liquidity and re-financing risk– credit risk.
The AMP group uses derivative fi nancial instruments, such as foreign exchange contracts, and interest-rate swaps, to hedge certain risk exposures. The major risks associated with fi nancial instruments and the AMP group’s policies for managing these risks are set out below.
AMP FULL FINANCIAL REPORT 2007 81
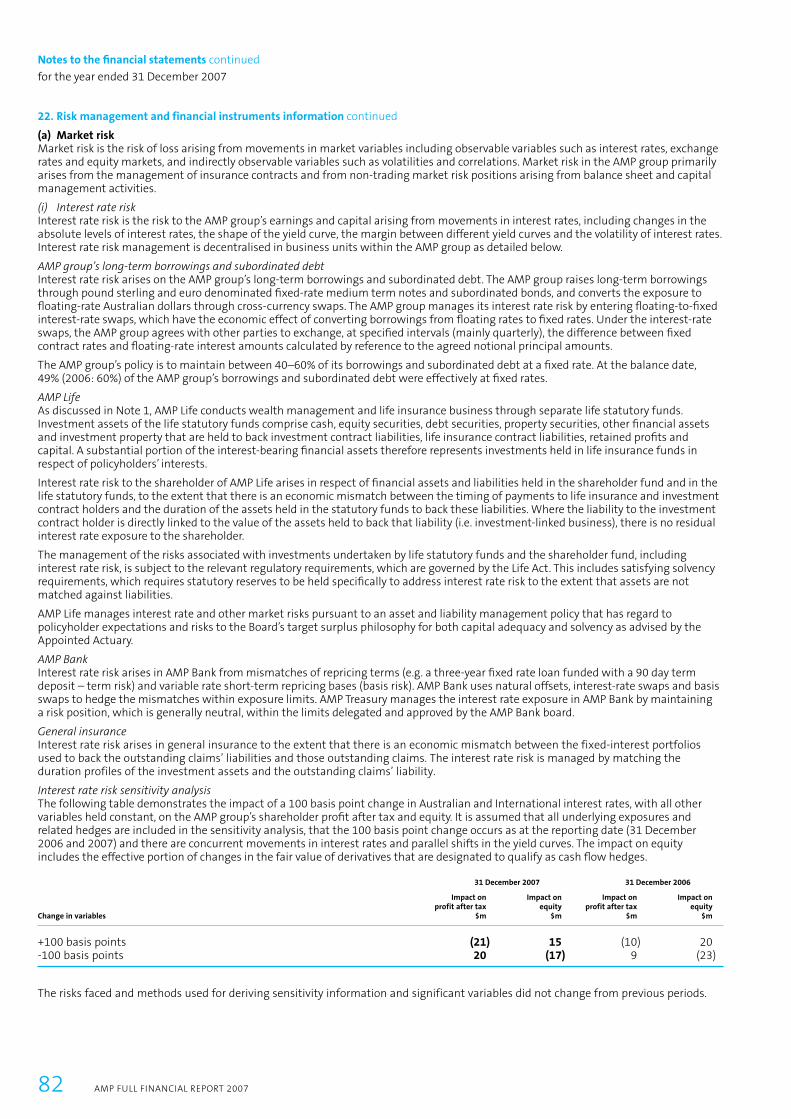
22. Risk management and financial instruments information continued
(a) Market riskMarket risk is the risk of loss arising from movements in market variables including observable variables such as interest rates, exchange rates and equity markets, and indirectly observable variables such as volatilities and correlations. Market risk in the AMP group primarily arises from the management of insurance contracts and from non-trading market risk positions arising from balance sheet and capital management activities.
(i) Interest rate riskInterest rate risk is the risk to the AMP group’s earnings and capital arising from movements in interest rates, including changes in the absolute levels of interest rates, the shape of the yield curve, the margin between different yield curves and the volatility of interest rates. Interest rate risk management is decentralised in business units within the AMP group as detailed below.
AMP group’s long-term borrowings and subordinated debtInterest rate risk arises on the AMP group’s long-term borrowings and subordinated debt. The AMP group raises long-term borrowings through pound sterling and euro denominated fi xed-rate medium term notes and subordinated bonds, and converts the exposure to fl oating-rate Australian dollars through cross-currency swaps. The AMP group manages its interest rate risk by entering fl oating-to-fi xed interest-rate swaps, which have the economic effect of converting borrowings from fl oating rates to fi xed rates. Under the interest-rate swaps, the AMP group agrees with other parties to exchange, at specifi ed intervals (mainly quarterly), the difference between fi xed contract rates and fl oating-rate interest amounts calculated by reference to the agreed notional principal amounts.
The AMP group’s policy is to maintain between 40–60% of its borrowings and subordinated debt at a fi xed rate. At the balance date, 49% (2006: 60%) of the AMP group’s borrowings and subordinated debt were effectively at fi xed rates.
AMP Life As discussed in Note 1, AMP Life conducts wealth management and life insurance business through separate life statutory funds. Investment assets of the life statutory funds comprise cash, equity securities, debt securities, property securities, other fi nancial assets and investment property that are held to back investment contract liabilities, life insurance contract liabilities, retained profi ts and capital. A substantial portion of the interest-bearing fi nancial assets therefore represents investments held in life insurance funds in respect of policyholders’ interests.
Interest rate risk to the shareholder of AMP Life arises in respect of fi nancial assets and liabilities held in the shareholder fund and in the life statutory funds, to the extent that there is an economic mismatch between the timing of payments to life insurance and investment contract holders and the duration of the assets held in the statutory funds to back these liabilities. Where the liability to the investment contract holder is directly linked to the value of the assets held to back that liability (i.e. investment-linked business), there is no residual interest rate exposure to the shareholder.
The management of the risks associated with investments undertaken by life statutory funds and the shareholder fund, including interest rate risk, is subject to the relevant regulatory requirements, which are governed by the Life Act. This includes satisfying solvency requirements, which requires statutory reserves to be held specifi cally to address interest rate risk to the extent that assets are not matched against liabilities.
AMP Life manages interest rate and other market risks pursuant to an asset and liability management policy that has regard to policyholder expectations and risks to the Board’s target surplus philosophy for both capital adequacy and solvency as advised by the Appointed Actuary.
AMP Bank Interest rate risk arises in AMP Bank from mismatches of repricing terms (e.g. a three-year fi xed rate loan funded with a 90 day term deposit – term risk) and variable rate short-term repricing bases (basis risk). AMP Bank uses natural offsets, interest-rate swaps and basis swaps to hedge the mismatches within exposure limits. AMP Treasury manages the interest rate exposure in AMP Bank by maintaining a risk position, which is generally neutral, within the limits delegated and approved by the AMP Bank board.
General insurance Interest rate risk arises in general insurance to the extent that there is an economic mismatch between the fixed-interest portfolios used to back the outstanding claims’ liabilities and those outstanding claims. The interest rate risk is managed by matching the duration profiles of the investment assets and the outstanding claims’ liability.
Interest rate risk sensitivity analysisThe following table demonstrates the impact of a 100 basis point change in Australian and International interest rates, with all other variables held constant, on the AMP group’s shareholder profi t after tax and equity. It is assumed that all underlying exposures and related hedges are included in the sensitivity analysis, that the 100 basis point change occurs as at the reporting date (31 December 2006 and 2007) and there are concurrent movements in interest rates and parallel shifts in the yield curves. The impact on equity includes the effective portion of changes in the fair value of derivatives that are designated to qualify as cash fl ow hedges.
31 December 2007 31 December 2006
Impact on Impact on Impact on Impact on profit after tax equity profit after tax equityChange in variables $m $m $m $m
+100 basis points (21) 15 (10) 20 -100 basis points 20 (17) 9 (23)
The risks faced and methods used for deriving sensitivity information and significant variables did not change from previous periods.
82 AMP FULL FINANCIAL REPORT 2007
for the year ended 31 December 2007
Notes to the fi nancial statements continued

22. Risk management and financial instruments information continued
(ii) Currency riskLosses in value may result from translating the AMP group’s capital invested in overseas operations into Australian dollars at balance date (translation risk) or from adverse foreign currency exchange rate movements on specific cash flow transactions (transaction risk).
Subject to materiality discretions, the AMP group:– does not hedge the capital invested in overseas operations, thereby accepting the foreign currency translation risk
on invested capital– converts all corporate debt to Australian dollars through cross-currency swaps– hedges individual investment assets backing shareholder capital, with the exception of the international equities portfolio– hedges expected foreign currency receipts and payments once the value and timing of the expected cash flow is known.
Currency risk sensitivity analysisThe analysis below demonstrates the impact of a 10% movement of currency rates against the Australian dollar with all other variables held constant, on the AMP group’s shareholder profit after tax (due to changes in fair value of currency sensitive monetary assets and liabilities) and equity. It is assumed that the relevant change occurs as at the reporting date.
31 December 2007 31 December 2006
Impact on Impact on Impact on Impact on profit after tax equity profit after tax equityChange in variables $m $m $m $m
10% 3 3 3 3 –10% (3) (3) (3) (3)
The risks faced and methods used for deriving sensitivity information and significant variables did not change from previous periods.
(iii) Equity price riskEquity price risk is the risk that the fair value of equities will decrease as a result of changes in levels of equity indices and the value of individual stocks. The AMP group holds all of its equities at fair value through profi t or loss.
Sensitivity analysisThe analysis below demonstrates the impact of a 10% movement in Australian and International equities. This sensitivity analysis has been performed to assess the direct risk of holding equity instruments, therefore any potential indirect impact on fees from AMP group’s investment linked business has been excluded. It is assumed that the relevant change occurs as at the reporting date.
31 December 2007 31 December 2006
Impact on Impact on Impact on Impact on profit after tax equity profit after tax equityChange in variables $m $m $m $m
10% increase in Australian equities 32 32 49 4910% increase in International equities 25 25 31 3110% decrease in Australian equities (27) (27) (47) (47)10% decrease in International equities (23) (23) (28) (28)
The risks faced and the methods used for deriving sensitivity information and signifi cant variables did not change from previous periods.
(iv) Investment riskInvestment risk is the risk of volatility in the AMP group’s net investment earnings and value that result in a reduced ability to implement corporate strategy. Investment earnings arise from the AMP group’s investment of shareholder capital. Investment classes include equities, property and interest bearing instruments, so the management of investment risk encompasses equity price risk and interest rate risk. AMP Capital Finance Limited, a wholly owned controlled entity, was established as part of the investment risk strategy of the AMP group, to assist business growth through the acquisition of assets to seed new funds or opportunities. AMP group seeks to generate future revenues from the subsequent on-sale of these assets to clients through new or existing funds.
For the purposes of the FRM Policy, investment risk management involves decisions made regarding the allocation of investment assets across asset classes and/or markets and includes the management of risks within these asset classes. Investment risk management relates to the investment allocation decisions made by the AMP group in relation to the investment of shareholder capital.
The investment risk in the shareholder funds are managed by reference to the probability of loss over a one year time horizon at a 99% confidence level (Value at Risk). This loss tolerance is currently set at 3% of shareholder funds (with a tolerance range of + or – 0.5%) under a fat-tailed distribution. Further, the loss tolerance on any single asset may not exceed 0.5%.
AMP FULL FINANCIAL REPORT 2007 83
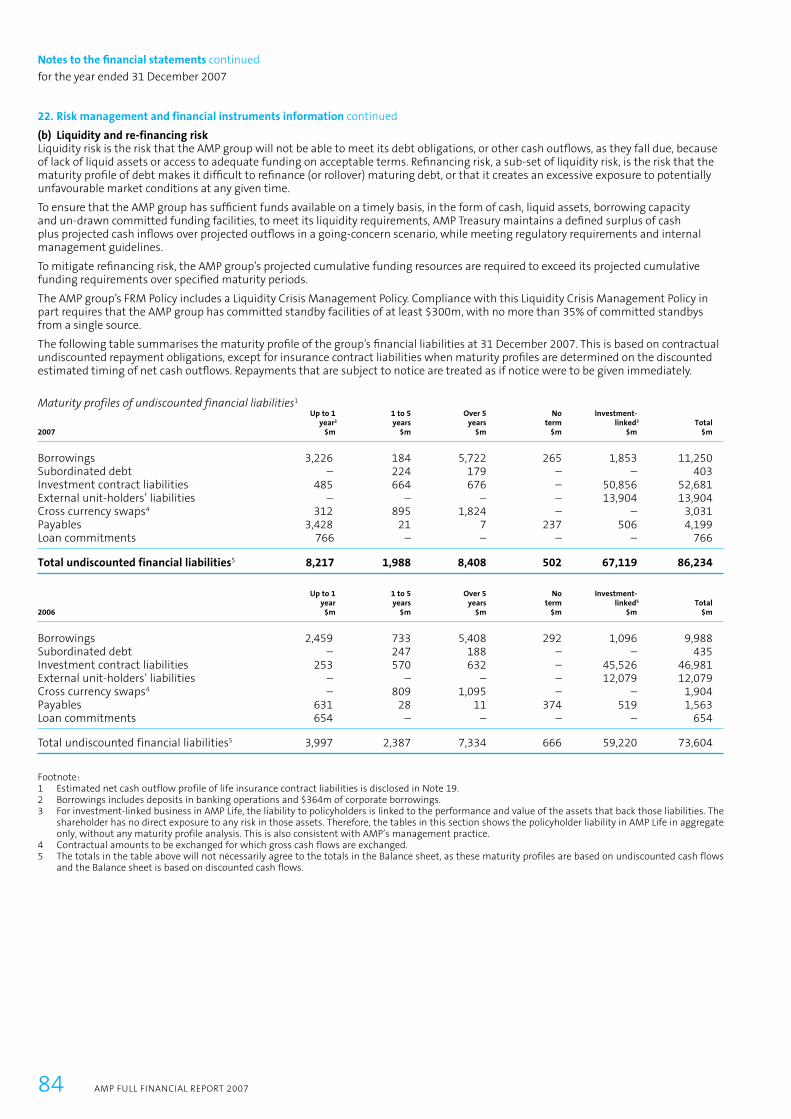
22. Risk management and financial instruments information continued
(b) Liquidity and re-financing riskLiquidity risk is the risk that the AMP group will not be able to meet its debt obligations, or other cash outfl ows, as they fall due, because of lack of liquid assets or access to adequate funding on acceptable terms. Refi nancing risk, a sub-set of liquidity risk, is the risk that the maturity profi le of debt makes it diffi cult to refi nance (or rollover) maturing debt, or that it creates an excessive exposure to potentially unfavourable market conditions at any given time.
To ensure that the AMP group has suffi cient funds available on a timely basis, in the form of cash, liquid assets, borrowing capacity and un-drawn committed funding facilities, to meet its liquidity requirements, AMP Treasury maintains a defi ned surplus of cash plus projected cash infl ows over projected outfl ows in a going-concern scenario, while meeting regulatory requirements and internal management guidelines.
To mitigate refi nancing risk, the AMP group’s projected cumulative funding resources are required to exceed its projected cumulative funding requirements over specifi ed maturity periods.
The AMP group’s FRM Policy includes a Liquidity Crisis Management Policy. Compliance with this Liquidity Crisis Management Policy in part requires that the AMP group has committed standby facilities of at least $300m, with no more than 35% of committed standbys from a single source.
The following table summarises the maturity profi le of the group’s fi nancial liabilities at 31 December 2007. This is based on contractual undiscounted repayment obligations, except for insurance contract liabilities when maturity profi les are determined on the discounted estimated timing of net cash outfl ows. Repayments that are subject to notice are treated as if notice were to be given immediately.
Maturity profiles of undiscounted financial liabilities1
Up to 1 1 to 5 Over 5 No Investment- year2 years years term linked3 Total2007 $m $m $m $m $m $m
Borrowings 3,226 184 5,722 265 1,853 11,250 Subordinated debt – 224 179 – – 403 Investment contract liabilities 485 664 676 – 50,856 52,681 External unit-holders’ liabilities – – – – 13,904 13,904 Cross currency swaps4 312 895 1,824 – – 3,031 Payables 3,428 21 7 237 506 4,199 Loan commitments 766 – – – – 766
Total undiscounted financial liabilities5 8,217 1,988 8,408 502 67,119 86,234
Up to 1 1 to 5 Over 5 No Investment- year years years term linked5 Total2006 $m $m $m $m $m $m
Borrowings 2,459 733 5,408 292 1,096 9,988 Subordinated debt – 247 188 – – 435 Investment contract liabilities 253 570 632 – 45,526 46,981 External unit-holders’ liabilities – – – – 12,079 12,079 Cross currency swaps4 – 809 1,095 – – 1,904 Payables 631 28 11 374 519 1,563 Loan commitments 654 – – – – 654
Total undiscounted financial liabilities5 3,997 2,387 7,334 666 59,220 73,604
Footnote:1 Estimated net cash outflow profile of life insurance contract liabilities is disclosed in Note 19.2 Borrowings includes deposits in banking operations and $364m of corporate borrowings.3 For investment-linked business in AMP Life, the liability to policyholders is linked to the performance and value of the assets that back those liabilities. The
shareholder has no direct exposure to any risk in those assets. Therefore, the tables in this section shows the policyholder liability in AMP Life in aggregate only, without any maturity profile analysis. This is also consistent with AMP’s management practice.
4 Contractual amounts to be exchanged for which gross cash flows are exchanged.5 The totals in the table above will not necessarily agree to the totals in the Balance sheet, as these maturity profiles are based on undiscounted cash flows
and the Balance sheet is based on discounted cash flows.
84 AMP FULL FINANCIAL REPORT 2007
for the year ended 31 December 2007
Notes to the fi nancial statements continued

22. Risk management and financial instruments information continued
(c) Credit riskCredit risk is the risk of loss that arises from a counterparty failing to meet their contractual commitments in full and on time, or from losses arising from the change in value of a traded fi nancial instrument as a result of changes in credit risk on that instrument.
The AMP group’s FRM Policy sets out the assessment and determination of what constitutes credit risk for the AMP group. The policy has set exposure limits for each counterparty, credit rating and industry type. Compliance with this policy is monitored and exposures and breaches are escalated to the AMP group Treasurer (Group Treasurer), CFO and CEO through the weekly FRM Report.
Credit risk management is decentralised in business units within the AMP group; however, credit risk directly impacting shareholder capital is measured and managed by AMP Treasury by aggregating risk from credit exposures taken in business units as detailed below.
AMP Life Credit risk on the invested fi xed income portfolios in the AMP Life statutory funds is managed by the AMP Capital Investors Compliance and Business Risk team (AMP Capital B&CR) and reported to the fund managers, within specifi ed credit criteria in the mandate approved by the AMP Life board. The portion of credit risk on the assets backing pure life risk insurance contracts are included in aggregate with assets held in the shareholder fund and reported to AMP group ALCO by AMP Treasury.
AMP Capital Investors (AMPCI)Credit risk on fi xed Income portfolios managed by AMPCI (consistent with interest rate and foreign currency risk) is managed by the AMP Capital B&CR team and reported to the fi xed income desk. This credit risk arises as part of a broader portfolio of investments under investment mandates with AMP Capital and to the extent relating directly to shareholder funds, is included in the aggregation by AMP Treasury and reported to AMP group ALCO.
AMP BankCredit risk arising in AMP Bank as part of lending activities and management of liquidity is managed as prescribed by AMP Bank’s Risk Management Systems Description (RMSD) and reported to AMP Bank Policy ALCO monthly. Exposures relating directly to shareholder funds are included in the aggregation by AMP Treasury and reported to AMP group ALCO.
General insuranceCredit risk in Gordian Runoff Limited (Gordian) and TGI Australia Limited (TGI) is managed by the AMP Capital B&CR team according to a separate investment mandate approved by the Gordian and TGI boards which aims to duration band match the Gordian and TGI Insurance liability profi le within specifi ed credit criteria constraints. Compliance with the mandate is reported to the Gordian and TGI board of directors. The portfolio includes assets supporting both technical reserves and shareholder funds on a co-mingled basis; therefore there is no segregation of funds from an investment management perspective.
Maximum exposure to credit riskAMP group’s maximum exposure to credit risk without taking account of any collateral or other credit enhancements as of 31 December 2007 was A$46,913m (2006: A$39,286m), including potential exposure under any fi nancial guarantees of A$1,445m (2006: A$1,353m) and loan commitments of A$766m (2006: A$654m).
Management of credit risk concentrationConcentration of credit risk arises when a number of fi nancial instruments or contracts are entered into with the same counterparty or where a number of counterparties are engaged in similar business activities that would cause their ability to meet contractual obligations to be similarly affected by changes in economic or other conditions. Concentration of credit risk in the AMP group is managed by individual counterparty, by credit rating and by industry type. AMP group’s maximum credit exposure to any non-sovereign counterparty as at 31 December 2007 was A$705m (2006: A$769m) with a currently AA rated counterparty.
At balance date, the AMP group had no specifi c concentration of credit risk with a single counterparty arising from the use of fi nancial instruments, other than the normal clearing-house exposures associated with dealings through recognised exchanges.
The counterparties to non-exchange traded contracts are limited to companies with investment grade credit (BBB or greater). The credit risks associated with these counter parties are assessed under the same management policies as applied to direct investments in the AMP group’s portfolio.
AMP group manages credit exposures to individual counterparty limits determined on the basis of credit rating. AMP group looks to diversify its credit risk exposure by managing credit risk, where there is a direct risk to shareholder capital, by credit rating, and industry type to certain exposure limits. Compliance is monitored and exposures and breaches are escalated to the Group Treasurer, CFO and CEO through the weekly FRM Report.
AMP FULL FINANCIAL REPORT 2007 85

22. Risk management and financial instruments information continued
Credit exposure by credit ratingThe following table provides information regarding the credit risk exposures of the AMP group at 31 December 2007 according to the credit ratings of the counterparties, where there is a direct risk to shareholder capital, these exposures are managed within limits set by the AMP group’s FRM policy: 2007 2006 $m $m
AAA 5,652 6,339AA 6,757 5,058A 1,254 1,651BBB 430 750Below BBB 146 156
Total financial assets with credit risk exposure managed by Treasury 14,239 13,954Financial assets with credit risk exposure not managed by Treasury1 32,867 24,764Other assets2 61,311 59,256
Total assets 108,417 97,974
Footnote:1 Balance includes financial assets of investment linked business in AMP Life, where the liability to policyholders is linked to the performance and value of
the assets that back those liabilities. The shareholder has no direct exposure to any credit risk in those assets. Balance also includes receivables of $1,180m (2006: $1,536m) and secured loans held by banking operations of $8,103m (2006: $7,209m), which are not managed by Treasury in accordance with the AMP group’s FRM policy.
2 Balance represents all other financial and non-financial assets, with no credit risk exposure.
Credit exposure by industry typeThe following table provides information regarding the credit risk exposures of the AMP group at 31 December 2007 according to industry type, where there is a direct risk to shareholder capital. These exposures are managed within limits set by the AMP group’s FRM policy: 2007 2006 $m $m
Australian Sovereign 1,291 1,070 Other Governments 2,641 3,121 Banks 6,451 5,083 Finance 932 1,027 Building/Construction 238 385 Other 2,686 3,268
Total financial assets with credit risk exposure managed by Treasury 14,239 13,954 Financial assets with credit risk exposure not managed by Treasury1 32,867 24,764 Other2 61,311 59,256
Total assets 108,417 97,974
Footnote:1 Balance includes financial assets of investment linked business in AMP Life, where the liability to policyholders is linked to the performance and value of
the assets that back those liabilities. The shareholder has no direct exposure to any credit risk in those assets. Balance also includes receivables of $1,180m (2006: $1,536m) and secured loans held by banking operations of $8,103m (2006: $7,209m), which are not managed by Treasury in accordance with the AMP group’s FRM policy.
2 Balance represents all other financial and non-financial assets, with no credit risk exposure.
86 AMP FULL FINANCIAL REPORT 2007
for the year ended 31 December 2007
Notes to the fi nancial statements continued

22. Risk management and financial instruments information continued
Credit risk of the loan portfolio in AMP BankAMP Bank is predominantly a lender for residential properties – both owner-occupied and for investment. In every case AMP Bank completes a credit assessment, which includes cost of living allowance and requires valuation of the proposed security property by a qualified independent valuer. A large portion of AMP Bank’s residential loan portfolio is securitised and all loans in securitisation vehicles are mortgage insured thereby further mitigating the risk. As well, AMP Bank’s Credit Committee and Board oversee trends in lending exposures and compliance with concentration limits as a further basis of limiting lending risk. AMP Bank secures its loan portfolio with mortgages over relevant properties and as a result manages credit risk on its loan portfolio by loan to value ratio (LVR). The LVR is calculated by dividing the total loan amount by the lower of AMP Bank’s approved valuation amount or the purchase price. The average LVR of AMP Bank’s loan portfolio for existing and new business is set out in the following table.
Existing New Existing New Business Business Business BusinessLVR 2007 2007 2006 2006
0 – 50 29.10% 9.07% 29.06% 7.52%51 – 60 12.84% 7.03% 13.07% 10.70%61 – 70 16.75% 9.46% 17.66% 14.20%71 – 80 30.95% 60.76% 30.13% 54.01%81 – 95 9.91% 7.63% 10.08% 13.58%> 95 0.45% 6.05% – –
Past due but not impaired financial assets of the AMP groupThe following table provides an aged analysis of financial assets of the AMP group that are past due as at reporting period but not impaired. Past due but not impaired
Less than 31 to 61 to More than 31 days 60 days 90 days 91 days Total2007 $m $m $m $m $m
Receivables – Trade debtors 1 – – 2 3 – Other receivables 10 3 2 13 28 Debt securities – Loans secured 224 37 12 24 297
Total1 235 40 14 39 328
Past due but not impaired
Less than 31 to 61 to More than 31 days 60 days 90 days 91 days Total2006 $m $m $m $m $m
Receivables – Life and general insurance contract premiums receivable – – – 6 6 – Reinsurance and other recoveries receivable – 1 – 4 5 – Trade debtors 8 1 – 2 11 – Other receivables 4 1 1 4 10 Debt securities – Loans secured 170 34 15 23 242
Total1 182 37 16 39 274
Footnote:1 For investment-linked business in AMP Life, the liability to policyholders is linked to the performance and value of the assets that back those liabilities.
The shareholder has no direct exposure to any credit risk in those assets. Therefore, the tables in this section do not show the past due financial assets backing investment-linked business in AMP Life.
(d) Derivative financial instrumentsDerivative fi nancial instruments are carried at fair value and recorded in the Balance sheet as assets and liabilities. Asset and liability values on different transactions are only netted if the transactions are with the same counterparty and the cash fl ows will be settled on a net basis. Changes in values of derivative fi nancial instruments are recognised in the Income statement unless they qualify as hedges for accounting purposes, as set out in Note 1(u).
AMP FULL FINANCIAL REPORT 2007 87

22. Risk management and financial instruments information continued
Derivative transactions undertaken by life insurance controlled entities as part of life insurance operationsThe AMP group uses derivative fi nancial instruments including fi nancial futures, forward foreign exchange contracts, exchange traded and other options and forward rate agreements to hedge the impact of market movements on the value of assets in the investment portfolios, and to effect a change in the asset mix of investment portfolios. Derivative fi nancial instruments are held for risk and asset management purposes within mandates, and not for the purpose of speculation.
In respect of the risks associated with the use of derivative fi nancial instruments, price risk is controlled by exposure limits, which are subject to monitoring and review. Foreign exchange hedges are monitored on a regular basis to ensure they are effective in the reduction of price risk.
Derivative transactions undertaken by non life insurance controlled entitiesAMP group treasury and banking operations use derivative fi nancial instruments to hedge fi nancial risk from movements in interest rates and foreign exchange rates. Swaps, forwards, futures and options in the interest rate and foreign exchange markets may be used. A description of each of these derivatives is given below.
i) Swaps – a swap transaction obliges the two parties to the contract to exchange a series of cash fl ows at specifi ed payment or settlement dates. Swap transactions undertaken by the AMP group are:– interest-rate swaps which involve the contractual exchange of fi xed and fl oating interest rate payments in a single currency
based on a notional amount and a reference rate, e.g. BBSW – cross-currency swaps which involve the exchange of interest payments based on two different currency principal balances and
reference interest rates and generally also entail exchange of principal amounts at the start and/or end of the contract.
ii) Forward and futures contracts – these are agreements between two parties establishing a contract interest rate on a notional principal over a specifi ed period, commencing at a future date. Forward contracts are tailor-made agreements that are transacted between counter parties in the over-the-counter market (OTC), whereas futures are standardised contracts transacted on regulated exchanges.
iii) Options – an option contract gives the option buyer the right, but not the obligation, to buy or sell a specifi ed amount of a given commodity or fi nancial instrument at a specifi ed price during a certain period or on a specifi c date. The seller of the option contract is obliged to perform if the holder exercises the right contained therein. Options may be traded OTC or on a regulated exchange.
As stated above, derivative transactions are entered for the purposes of hedging assets, liabilities, forecast transactions, cash fl ows, and credit exposures. The accounting treatment of hedge transactions varies according to the nature of the instrument hedged and whether the hedge qualifi es as such for accounting purposes.
Derivative transactions may qualify for hedges for accounting purposes if they are fair value or cash fl ow hedges. The group’s accounting policies for derivatives designated and accounted for as hedging instruments are explained in Note 1(u), where terms used in the following section are also explained.
The AMP group also enters into derivative transactions that provide economic hedges but do not meet the requirements for hedge accounting treatment.
Fair value hedgesThe AMP group’s fair value hedges principally consist of cross-currency swaps and interest-rate swaps that are used to protect against changes in the fair value of fi xed-rate long-term debt due to movements in market interest rates and exchange rates.
The AMP group achieved fair value hedge accounting on various corporate and AMP Bank borrowings and subordinated debt effective from 1 January 2005. For the year ended 31 December 2007, the AMP group recognised a net gain of $7m (2006: $10m gain) representing the ineffective portion of fair value hedges. The fair values of outstanding derivatives designated as fair value hedges was a net liability of $38m at 31 December 2007 (2006: $36m liability).
Cash flow hedges of forecast transactionsThe AMP group is exposed to variability in future interest cash fl ows on debt securities held by AMP Bank, which bear interest at variable rates. Gains and losses on the effective portions of derivatives designated as cash fl ow hedges of forecast transactions are initially recorded in the cash fl ow hedges reserve and are transferred to the Income statement when the forecast cash fl ows are realised. The gains and losses on the ineffective portions of these derivatives are recognised immediately in the Income statement. The AMP group achieved cash fl ow hedge accounting effective from 1 January 2005. In 2007, no gains or losses from hedge ineffectiveness arose.
As at 31 December 2007, the fair values of outstanding derivatives recognised as cash fl ow hedges of forecast transactions were a net asset of $57m (2006: $22m asset).
At 31 December 2007, the notional principal amounts and period of expiry of the interest rate swap contracts are as follows:
2007 2006 $m $m
0 – 1 years 3,572 3,550 1 – 2 years 902 640 2 – 3 years 780 872 3 – 4 years 310 105 4 – 5 years 330 310
Total notional principal amounts 5,894 5,477
88 AMP FULL FINANCIAL REPORT 2007
for the year ended 31 December 2007
Notes to the fi nancial statements continued
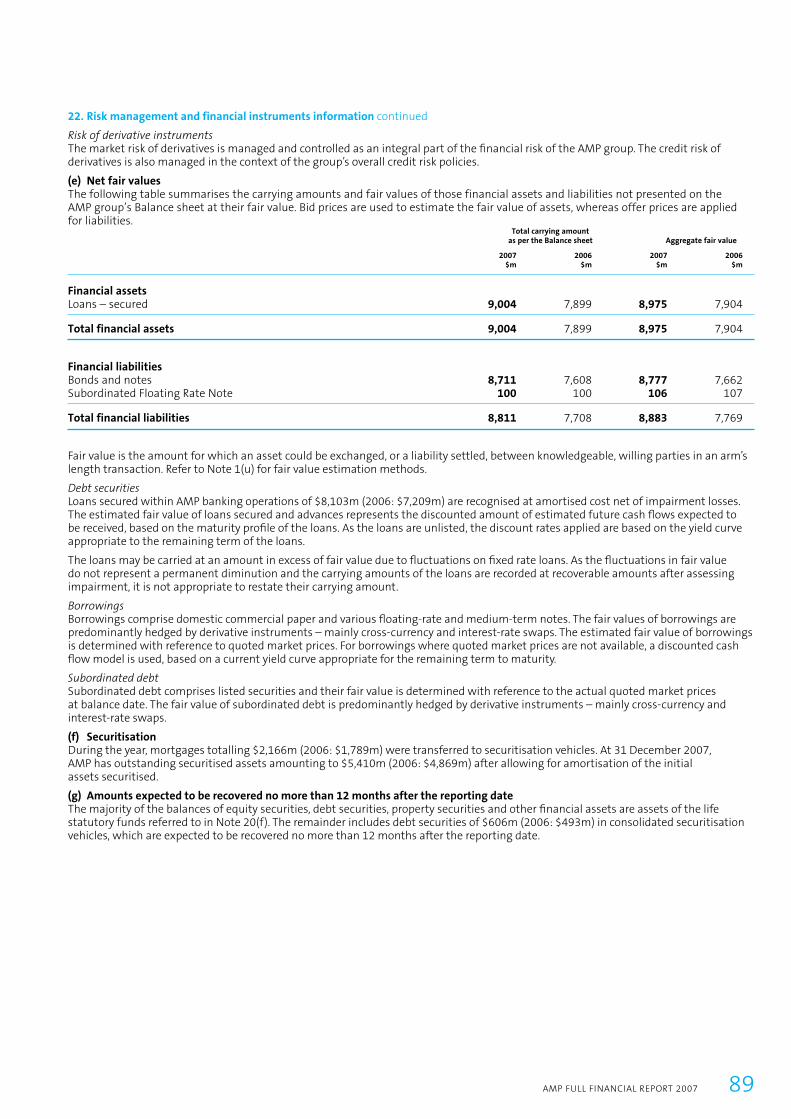
22. Risk management and financial instruments information continued
Risk of derivative instrumentsThe market risk of derivatives is managed and controlled as an integral part of the fi nancial risk of the AMP group. The credit risk of derivatives is also managed in the context of the group’s overall credit risk policies.
(e) Net fair valuesThe following table summarises the carrying amounts and fair values of those financial assets and liabilities not presented on the AMP group’s Balance sheet at their fair value. Bid prices are used to estimate the fair value of assets, whereas offer prices are applied for liabilities. Total carrying amount as per the Balance sheet Aggregate fair value
2007 2006 2007 2006 $m $m $m $m
Financial assets Loans – secured 9,004 7,899 8,975 7,904
Total financial assets 9,004 7,899 8,975 7,904
Financial liabilities Bonds and notes 8,711 7,608 8,777 7,662 Subordinated Floating Rate Note 100 100 106 107
Total financial liabilities 8,811 7,708 8,883 7,769
Fair value is the amount for which an asset could be exchanged, or a liability settled, between knowledgeable, willing parties in an arm’s length transaction. Refer to Note 1(u) for fair value estimation methods.
Debt securities Loans secured within AMP banking operations of $8,103m (2006: $7,209m) are recognised at amortised cost net of impairment losses. The estimated fair value of loans secured and advances represents the discounted amount of estimated future cash fl ows expected to be received, based on the maturity profi le of the loans. As the loans are unlisted, the discount rates applied are based on the yield curve appropriate to the remaining term of the loans.
The loans may be carried at an amount in excess of fair value due to fl uctuations on fi xed rate loans. As the fl uctuations in fair value do not represent a permanent diminution and the carrying amounts of the loans are recorded at recoverable amounts after assessing impairment, it is not appropriate to restate their carrying amount.
Borrowings Borrowings comprise domestic commercial paper and various fl oating-rate and medium-term notes. The fair values of borrowings are predominantly hedged by derivative instruments – mainly cross-currency and interest-rate swaps. The estimated fair value of borrowings is determined with reference to quoted market prices. For borrowings where quoted market prices are not available, a discounted cash fl ow model is used, based on a current yield curve appropriate for the remaining term to maturity.
Subordinated debtSubordinated debt comprises listed securities and their fair value is determined with reference to the actual quoted market prices at balance date. The fair value of subordinated debt is predominantly hedged by derivative instruments – mainly cross-currency and interest-rate swaps.
(f) SecuritisationDuring the year, mortgages totalling $2,166m (2006: $1,789m) were transferred to securitisation vehicles. At 31 December 2007, AMP has outstanding securitised assets amounting to $5,410m (2006: $4,869m) after allowing for amortisation of the initial assets securitised.
(g) Amounts expected to be recovered no more than 12 months after the reporting date The majority of the balances of equity securities, debt securities, property securities and other fi nancial assets are assets of the life statutory funds referred to in Note 20(f). The remainder includes debt securities of $606m (2006: $493m) in consolidated securitisation vehicles, which are expected to be recovered no more than 12 months after the reporting date.
AMP FULL FINANCIAL REPORT 2007 89
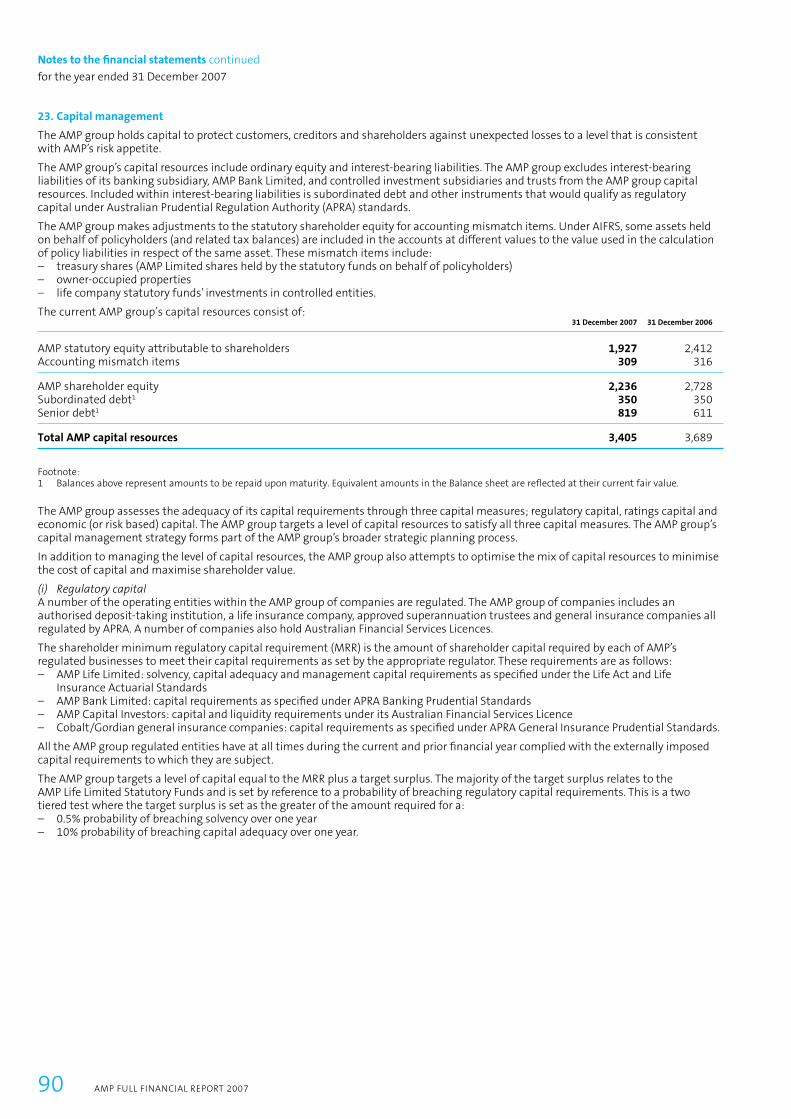
23. Capital management
The AMP group holds capital to protect customers, creditors and shareholders against unexpected losses to a level that is consistent with AMP’s risk appetite.
The AMP group’s capital resources include ordinary equity and interest-bearing liabilities. The AMP group excludes interest-bearing liabilities of its banking subsidiary, AMP Bank Limited, and controlled investment subsidiaries and trusts from the AMP group capital resources. Included within interest-bearing liabilities is subordinated debt and other instruments that would qualify as regulatory capital under Australian Prudential Regulation Authority (APRA) standards.
The AMP group makes adjustments to the statutory shareholder equity for accounting mismatch items. Under AIFRS, some assets held on behalf of policyholders (and related tax balances) are included in the accounts at different values to the value used in the calculation of policy liabilities in respect of the same asset. These mismatch items include:– treasury shares (AMP Limited shares held by the statutory funds on behalf of policyholders)– owner-occupied properties– life company statutory funds’ investments in controlled entities.
The current AMP group’s capital resources consist of: 31 December 2007 31 December 2006
AMP statutory equity attributable to shareholders 1,927 2,412Accounting mismatch items 309 316
AMP shareholder equity 2,236 2,728Subordinated debt1 350 350Senior debt1 819 611
Total AMP capital resources 3,405 3,689
Footnote:1 Balances above represent amounts to be repaid upon maturity. Equivalent amounts in the Balance sheet are reflected at their current fair value.
The AMP group assesses the adequacy of its capital requirements through three capital measures; regulatory capital, ratings capital and economic (or risk based) capital. The AMP group targets a level of capital resources to satisfy all three capital measures. The AMP group’s capital management strategy forms part of the AMP group’s broader strategic planning process.
In addition to managing the level of capital resources, the AMP group also attempts to optimise the mix of capital resources to minimise the cost of capital and maximise shareholder value.
(i) Regulatory capitalA number of the operating entities within the AMP group of companies are regulated. The AMP group of companies includes an authorised deposit-taking institution, a life insurance company, approved superannuation trustees and general insurance companies all regulated by APRA. A number of companies also hold Australian Financial Services Licences.
The shareholder minimum regulatory capital requirement (MRR) is the amount of shareholder capital required by each of AMP’s regulated businesses to meet their capital requirements as set by the appropriate regulator. These requirements are as follows:– AMP Life Limited: solvency, capital adequacy and management capital requirements as specifi ed under the Life Act and Life
Insurance Actuarial Standards– AMP Bank Limited: capital requirements as specifi ed under APRA Banking Prudential Standards– AMP Capital Investors: capital and liquidity requirements under its Australian Financial Services Licence– Cobalt/Gordian general insurance companies: capital requirements as specifi ed under APRA General Insurance Prudential Standards.
All the AMP group regulated entities have at all times during the current and prior fi nancial year complied with the externally imposed capital requirements to which they are subject.
The AMP group targets a level of capital equal to the MRR plus a target surplus. The majority of the target surplus relates to the AMP Life Limited Statutory Funds and is set by reference to a probability of breaching regulatory capital requirements. This is a two tiered test where the target surplus is set as the greater of the amount required for a:– 0.5% probability of breaching solvency over one year– 10% probability of breaching capital adequacy over one year.
90 AMP FULL FINANCIAL REPORT 2007
for the year ended 31 December 2007
Notes to the fi nancial statements continued

23. Capital management continued
(ii) Ratings capitalThe AMP group’s capital management strategy is framed against an objective of maintaining the AMP group’s ‘A’ range credit ratings. In line with the target credit rating the AMP group maintains an AA range fi nancial strength rating for its wholly owned life insurance company, AMP Life Limited. The AMP group targets a level of gearing, interest coverage and capital in line with rating agency guidelines for an A range credit rating and AA range fi nancial strength rating.
The key ratings for the AMP group companies, as published by Standard & Poor’s and Moody’s Investor Services, at 31 December 2007 were as follows. Standard & Poor’s Moody’s
Company Credit rating Financial strength rating Credit rating Financial strength rating
AMP Group Holdings Limited A/Positive/A-1 n/a A2/Stable n/aAMP Life Limited AA-/Positive AA-/Positive Aa2/Stable Aa2/StableAMP Bank Limited A-/Stable/A-2 n/a A2/Stable/P-1 n/a
(iii) Economic capitalRisk based capital (RBC) in the AMP group is an internal measure of economic capital adequacy. The AMP group is under no obligation to maintain RBC capital adequacy, because it is an internal measure and not a regulatory capital requirement.
RBC resources consist of net tangible assets and the value of in-force business. Subordinated debt and the expected value of new business are not included.
RBC requirements consist of modelled economic losses over a 12-month period arising from risks of various kinds taken on by the AMP group. The risk types modelled are market, credit, operational, competitive, and claims risks on life and general insurance.
AMP FULL FINANCIAL REPORT 2007 91
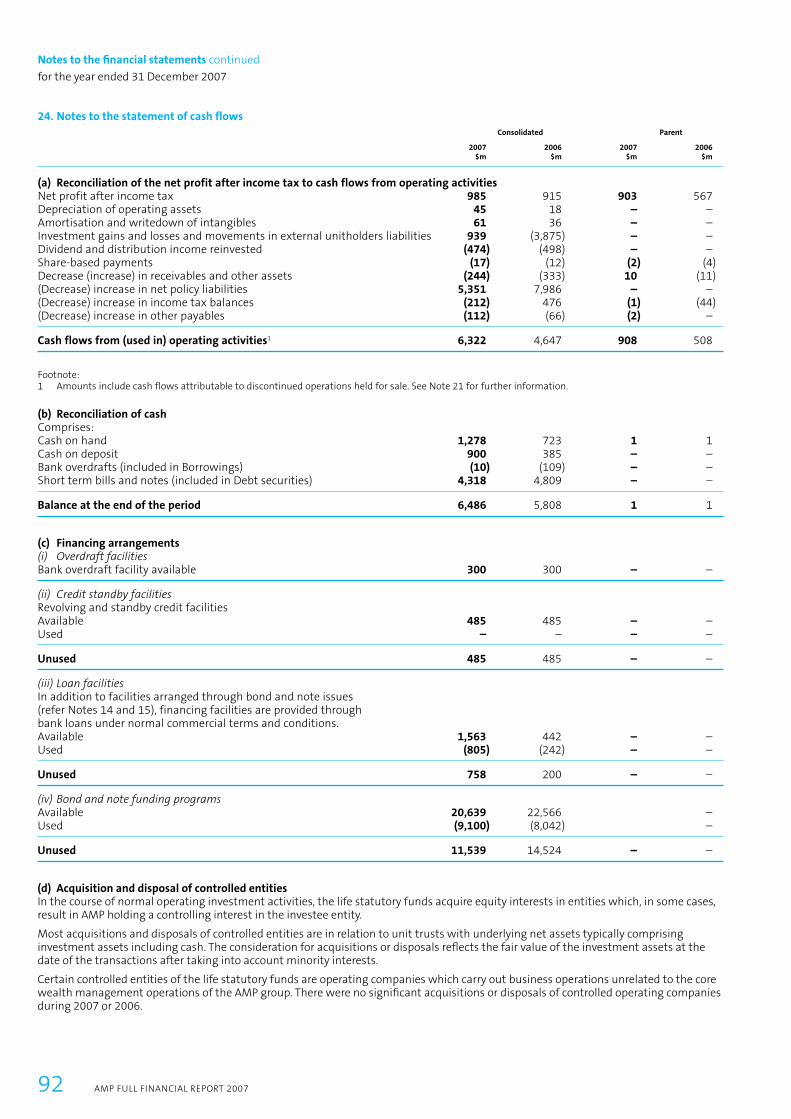
24. Notes to the statement of cash flows Consolidated Parent
2007 2006 2007 2006 $m $m $m $m
(a) Reconciliation of the net profit after income tax to cash flows from operating activitiesNet profit after income tax 985 915 903 567 Depreciation of operating assets 45 18 – – Amortisation and writedown of intangibles 61 36 – – Investment gains and losses and movements in external unitholders liabilities 939 (3,875) – – Dividend and distribution income reinvested (474) (498) – – Share-based payments (17) (12) (2) (4)Decrease (increase) in receivables and other assets (244) (333) 10 (11)(Decrease) increase in net policy liabilities 5,351 7,986 – – (Decrease) increase in income tax balances (212) 476 (1) (44)(Decrease) increase in other payables (112) (66) (2) –
Cash flows from (used in) operating activities1 6,322 4,647 908 508
Footnote:1 Amounts include cash flows attributable to discontinued operations held for sale. See Note 21 for further information.
(b) Reconciliation of cash Comprises: Cash on hand 1,278 723 1 1 Cash on deposit 900 385 – – Bank overdrafts (included in Borrowings) (10) (109) – – Short term bills and notes (included in Debt securities) 4,318 4,809 – –
Balance at the end of the period 6,486 5,808 1 1
(c) Financing arrangements (i) Overdraft facilities Bank overdraft facility available 300 300 – –
(ii) Credit standby facilities Revolving and standby credit facilities Available 485 485 – – Used – – – –
Unused 485 485 – –
(iii) Loan facilities In addition to facilities arranged through bond and note issues (refer Notes 14 and 15), financing facilities are provided through bank loans under normal commercial terms and conditions. Available 1,563 442 – – Used (805) (242) – –
Unused 758 200 – –
(iv) Bond and note funding programs Available 20,639 22,566 – Used (9,100) (8,042) –
Unused 11,539 14,524 – –
(d) Acquisition and disposal of controlled entitiesIn the course of normal operating investment activities, the life statutory funds acquire equity interests in entities which, in some cases, result in AMP holding a controlling interest in the investee entity.
Most acquisitions and disposals of controlled entities are in relation to unit trusts with underlying net assets typically comprising investment assets including cash. The consideration for acquisitions or disposals refl ects the fair value of the investment assets at the date of the transactions after taking into account minority interests.
Certain controlled entities of the life statutory funds are operating companies which carry out business operations unrelated to the core wealth management operations of the AMP group. There were no signifi cant acquisitions or disposals of controlled operating companies during 2007 or 2006.
92 AMP FULL FINANCIAL REPORT 2007
for the year ended 31 December 2007
Notes to the fi nancial statements continued

25. Earnings per share
(a) Classification of equity securitiesOrdinary shares have been included in the calculation of basic earnings per share.
In accordance with AASB 133 Earnings per Share, options over unissued ordinary shares and performance rights have been classifi ed as potential ordinary shares and have been considered in the calculation of diluted earnings per share. As all options were out of the money for 2007 and 2006, they have been determined not to be dilutive for those periods. Performance rights have been determined to be dilutive in 2007 and 2006. Although performance rights have been determined to be dilutive in accordance with AASB 133 Earnings per Share, if these instruments vest and are exercised, it is AMP’s policy to buy AMP shares ‘on market’ so there will be no dilutive effect on the value of AMP shares.
Since the end of the fi nancial year and up to the date of the report, no performance rights have been issued, 26,320 performance rights have been exercised and no performance rights have lapsed. During the same period no options have been issued or exercised however, 140,000 options have lapsed. There have been no movements in number of shares on issue.
Of the ordinary shares on issue, AMP Life (a wholly owned controlled entity) holds 25,192,562 (2006: 27,213,892) shares in AMP Limited on behalf of policyholders. ASIC has granted relief from restrictions in the Corporations Act 2001 to allow AMP Life Limited to hold and trade shares in AMP Limited as part of the policyholder funds’ investment activities. In determining the weighted average number of ordinary shares used in the calculation of earnings per share, a reduction is made for the average number of shares held by AMP Life in AMP Limited during the period. Consolidated
2007 2006 million million
(b) Weighted average number of ordinary shares used Weighted average number of ordinary shares used in calculation of basic earnings per share 1,849 1,844 Add: potential ordinary shares considered dilutive 8 11 Weighted average number of ordinary shares used in calculation of diluted earnings per share 1,857 1,855
$m $m
(c) Level of earnings used Basic from continuing operations before accounting mismatches 863 888 Diluted from continuing operations before accounting mismatches 863 888 Basic from continuing operations after accounting mismatches 792 827 Diluted from continuing operations after accounting mismatches 792 827 Basic after accounting mismatches 985 915 Diluted after accounting mismatches 985 915
cents cents
(d) Earnings per share Basic from continuing operations before accounting mismatches 46.7 48.1 Diluted from continuing operations before accounting mismatches 46.5 47.9 Basic from continuing operations after accounting mismatches 42.8 44.8 Diluted from continuing operations after accounting mismatches 42.7 44.6 Basic after accounting mismatches 53.3 49.6 Diluted after accounting mismatches 53.1 49.3
AMP FULL FINANCIAL REPORT 2007 93

26. Superannuation funds
AMP contributes to two employer-sponsored superannuation funds that exist to provide benefi ts for employees and their dependants on resignation, retirement, disability or death of the employee. The funds consist of both defi ned contribution sections and defi ned-benefi t sections.
The defi ned contribution sections receive fi xed contributions from AMP group companies and the group’s legal obligation is limited to these contributions.
The defi ned-benefi t sections provide members with a choice of lump sum benefi ts or pension benefi ts based on years of membership and fi nal salary. New employees are only offered defi ned contribution-style benefi ts.
The following disclosures relate only to the defi ned-benefi t sections of the plans.
The following tables summarise the components of the net amount recognised in the consolidated Income statement, the movements in the defi ned-benefi t obligation and plan assets, and the net amounts recognised in the consolidated Balance sheet for the defi ned-benefi t funds. Consolidated
2007 2006 $m $m
(a) Defined-benefit income (expense) Current service cost (2) (2)Interest cost (17) (16)Expected return on plan assets1,2,3 25 23
Total defined-benefit income (expense) 6 5
(b) Movements in defined benefit obligation Balance at the beginning of the period (356) (368)Current service cost (2) (2)Interest cost (17) (16)Contributions by plan participants (1) (1)Actuarial gains and losses4 (33) 7 Benefits paid 22 24
Balance at the end of the period (387) (356)
(c) Movement in fair value of plan assets Balance at the beginning of the period 382 348 Expected return on plan assets 25 23 Actuarial gains and losses4 10 34 Contributions by plan participants 1 1 Benefits paid (22) (24)
Balance at the end of the period 396 382
Footnote:1 The expected return on plan assets is determined at the beginning of the period, and is based on financial modelling of expected real returns for each of the
major asset classes, combined with the price inflation assumption to develop nominal returns.2 The actual return on fund assets for the period in Australia was $34m (2006: $51m).3 The actual return on fund assets for the period in New Zealand was $1m (2006: $7m).4 As explained in Note 1, actuarial gains and losses are recognised directly in retained profits.
94 AMP FULL FINANCIAL REPORT 2007
for the year ended 31 December 2007
Notes to the fi nancial statements continued

26. Superannuation funds continued Consolidated
2007 2006 $m $m
(d) Defined-benefit (deficit) surplus Present value of wholly funded defined-benefit obligations (387) (356)Less: Fair value of plan assets 396 382 Plus: Past service costs not yet recognised – –
Net defined-benefit (deficit) surplus recognised in the Balance sheet 9 26
Movement in net defined-benefit (deficit) surplus (Deficit) surplus at the beginning of the period 26 (20)Plus: Total income (expenses) recognised in income 6 5 Plus: Employer contributions – –Plus: Actuarial gains (losses) recognised in the Statement of recognised income and expense1 (23) 41
(Deficit) surplus at the end of the period2 9 26
Footnote:1 The cumulative amount of the actuarial gains and losses recognised in the Statement of recognised income and expense is $106m (2006: $129m).2 All actuarial gains and losses, and past service costs have been recognised in the Balance sheet.
(e) Historical analysis of defined-benefit (deficit) surplus Consolidated
2007 2006 2005 2004 $m $m $m $m
Australian defined-benefit (deficit) surplus Present value of wholly funded defined-benefit obligations (342) (309) (324) (334)Less: Fair value of plan assets 352 334 303 284
Balance sheet 10 25 (21) (50)
Actuarial gains and losses arising on plan liabilities (35) 10 5 (9)Actuarial gains and losses arising on plan assets 11 30 20 (53)
New Zealand defined-benefit (deficit) surplus Present value of wholly funded defined-benefit obligations (45) (47) (44) (41)Less: Fair value of plan assets 44 48 45 45
Balance sheet (1) 1 1 4
Actuarial gains and losses arising on plan liabilities 1 (3) – 2 Actuarial gains and losses arising on plan assets (2) 4 1 1
AMP FULL FINANCIAL REPORT 2007 95

26. Superannuation funds continued
(f) Principal actuarial assumptionsThe following table sets out the principal actuarial assumptions used as at the reporting date in measuring the defined-benefit obligations of the Australian and New Zealand defined-benefit funds: Australia New Zealand
2007 2006 2007 2006
Discount rate (before tax) 6.3% 5.9% 6.9% 5.8%Expected return on assets (before tax) 7.8% 6.8% 5.3% 5.3%Expected rate of pension increases 3.0% 3.0% 1.9% 1.9%Expected rate of salary increases 4.5% 4.5% n/a n/aProportion of benefits expected to be taken as pensions 60.0% 60.0% n/a n/aInflation increases n/a n/a 2.5% 2.5%
(g) Arrangements for employer contributions for funding defined-benefit fundsThe information set out in Note 26(a) and (b) regarding the measurement and recognition of defi ned-benefi t funds’ surpluses or defi cits is determined in accordance with AASB 119 Employee Benefits. However, for the purposes of recommending contributions to the defi ned-benefi t funds, fund actuaries consider the positions of the funds as measured under AAS 25 Financial Reporting by Superannuation Plans which determines the funds’ liabilities according to different measurement rules. The surplus determined under AAS 25 differs from the net defi cit recognised in the Balance sheet under AASB 119, largely due to the use of different discount rates in valuing benefi ts.
At the dates of the most recent fi nancial reports of the plans, the surplus measured as the difference between the net market value of plan assets and the accrued benefi ts of the plans was $23m (2006: $44m) for the Australian defi ned-benefi t fund and $4m (2006: $4m) for the New Zealand defi ned-benefi t fund.
Funding methods and current recommendations – AustraliaThe Australian defi ned-benefi t funds’ funding policy is intended to fully cover benefi ts by the time they become payable. The method of funding benefi ts adopted is the attained age normal method. This funding method aims to spread the cost of future benefi ts for current members evenly over their future working lifetimes.
The economic assumptions used to determine the current contribution recommendations are the same as the actuarial assumptions in Part (f) above, except for the discount rate which is assumed to be 6.75% (before tax) for the purposes of determining accrued benefi ts.
Funding methods and current recommendations – New ZealandThe New Zealand defi ned-benefi t funds’ funding policy is intended to fully cover benefi ts by the time they become payable. The main group of benefi ts is pension rights of retired members and their spouses. The retirement benefi ts of active members are valued on a simplifi ed actuarial projection basis as they are not material to the valuation of the fund.
As at 1 January 2006, the date of the last triennial valuation, the fund was considered to be in a sound fi nancial position with assets exceeding the value of accrued benefi ts. As such the actuarial advice at that time was for AMP to take a contribution holiday until 1 July 2007. The actuary also recommended that an informal actuarial report be prepared at 1 January 2007 and this recommended the contribution holiday be extended until 1 July 2008. The next formal actuarial valuation will be conducted as at 1 January 2009 and will be completed by 31 July 2009.
(h) Allocation of assetsShown in the following table are the asset allocations of the defined-benefit funds. Australia1 New Zealand1
2007 2006 2007 2006
Equity 46% 44% 63% 59%Property 18% 19% 19% 13%Fixed interest 22% 26% 9% 20%Cash 5% 3% 9% 8%Alternative growth assets 10% 9% 0% 0%
Footnote:1 The investment assets of the plans may at times include either direct or indirect investments in AMP Limited shares. These investments are part of normal
investment mandates within the plans and are not significant in relation to total plan assets. The plans do not hold any other assets which are occupied or used by AMP Limited.
96 AMP FULL FINANCIAL REPORT 2007
for the year ended 31 December 2007
Notes to the fi nancial statements continued

27. Share-based payments
(a) Summary of AMP’s share-based payment plansAMP has a number of employee share-based payment plans. These long-term incentive plans form part of AMP’s overall remuneration strategy, and are necessary for AMP to attract, motivate and retain high performing employees who contribute to the success of the business. Long-term incentives represent an ‘at risk’ component of remuneration.
A number of share-based payment plans are no longer offered to employees as part of AMP’s long-term incentive program. This is in line with AMP’s strategy to simplify the choice of long-term incentive plans offered to employees. Whilst some plans are no longer offered, due to the requirement to record the share-based payments expense over the vesting period of the payments, the plans do form part of the share-based payments expense for the period. As such, information about these plans is provided below as well as plans which AMP currently offers as part of its long-term incentive program.
On adoption of AIFRS, exemptions were permitted which allowed AMP to only recognise a share-based payments expense for equity instruments that were granted after 7 November 2002 and that had not vested on or before 1 January 2005. All plans described below form part of the share-based payments expense recorded in the Income statement except the Employee and Executive Option Plan which ceased to be offered prior to 7 November 2002. Details of this plan have been provided below, however no expense has been recorded in relation to these instruments. The following table provides a list of AMP’s share-based payment plans and the share-based payments expense recorded in relation to those plans during the year: Consolidated
2007 2006 $’000 $’000
Plans currently offered Performance rights 13,916 7,884 Restricted shares 2,655 1,890 Employee share acquisition plan – matching shares 77 60 Plans no longer offered Executive Short-term Incentive Program – matching shares 79 471 Employee and Executive Option Plan n/a n/a
Total share-based payments expense 16,727 10,305
(b) Performance rightsPlan descriptionPerformance rights are granted to those executives considered to have the most direct infl uence on AMP’s business performance.
A performance right is a right to acquire one fully paid ordinary share in AMP after a three-year performance period, provided a specifi c performance hurdle is met. Prior to exercise, performance rights holders do not receive dividends or have other shareholder benefi ts (including any voting rights).
In 2002, 2003, 2004 and 2007 AMP offered share bonus rights to employees in overseas domiciles where it was not possible or tax-effi cient to grant performance rights. The terms and conditions of the share bonus rights are identical to the terms and conditions of the performance rights, except settlement is in cash rather than equity instruments.
The performance hurdleThe number of performance rights that vest is determined by a vesting schedule based on the performance of AMP relative to a comparator group of companies listed on the ASX over a three-year performance period. The performance measure is Total Shareholder Return (TSR) relative to the top 50 industrials in the Standard & Poor’s/Australian Stock Exchange (S&P/ASX) 100 Index as at the start of the performance period. The performance hurdle and vesting schedule were chosen because they align executives’ remuneration with the creation of shareholder value relative to peer companies.
At the end of the performance period, AMP’s Remuneration Committee receives data from an independent external consultant to determine AMP’s TSR performance relative to the comparator group. An independent external consultant is appointed so as to ensure objectivity in measuring AMP’s performance. The Remuneration Committee then determines the number of performance rights that vest by applying this data to the vesting schedule.
Exercising performance rightsExecutives have two years from the end of the performance period to exercise any performance rights that vest at a nominal exercise price ($1 per tranche of shares acquired). If the performance hurdle is not achieved the performance rights lapse immediately without re-testing of the performance hurdle.
When executives exercise performance rights, these AMP shares are bought on market so there is no dilutionary effect on the value of existing AMP shares.
Treatment of performance rights on ceasing employmentUnvested performance rights will lapse when an executive resigns from AMP. All performance rights, whether vested or unvested, will also lapse on termination due to misconduct or inadequate performance. In other cases, such as redundancy and retirement, performance rights continue to be held subject to the same performance hurdle and performance period.
AMP FULL FINANCIAL REPORT 2007 97

27. Share-based payments continued
Plan valuation The fair value of performance rights has been calculated as at the grant date, by external consultants using a simulation technique known as a Monte Carlo simulation. Fair value has been discounted for the probability of not meeting the TSR performance hurdles.
In determining the share-based payments expense for the period, the number of instruments expected to vest has been adjusted to refl ect the number of employees expected to remain with AMP until the end of the performance period.
For the purposes of the valuation it is assumed that performance rights are exercised as soon they have vested. Assumptions regarding the dividend yield and volatility have been estimated based on AMP’s actual historic dividend yield and volatility over an appropriate period.
The following table shows the factors which were considered in determining the independent fair value of the performance rights granted during the current period and the comparative period: Share Contractual Dividend Risk-free Performance Grant date price life yield Volatility rate hurdle discount Fair value
21/09/2007 $10.32 4.9 years 4.3% 20% 6.4% 45% $5.6505/09/2007 $10.70 4.9 years 4.3% 20% 6.3% 44% $6.0109/03/2007 $9.98 4.9 years 4.3% 20% 6.0% 54% $4.6408/09/2006 $9.00 4.9 years 4.5% 20% 5.8% 54% $4.13
The following table shows the movements during the period of all performance rights: Exercise Balance at Exercised Granted Lapsed Balance atGrant date Exercise period price 1 Jan 2007 during the year1 during the year during the year 31 Dec 20072
23/10/2003 30/08/2006 – 29/08/2008 Nil 265,175 233,057 – – 32,118 18/03/2004 30/08/2006 – 29/08/2008 Nil 53,248 46,799 – – 6,449 06/09/2004 01/08/2007 – 31/07/2009 Nil 2,171,818 1,984,740 – 15,279 171,799 01/09/2005 31/07/2008 – 31/07/2010 Nil 2,237,611 – – 124,773 2,112,838 08/09/2006 01/08/2009 – 31/07/2011 Nil 2,663,225 – – 114,960 2,548,265 09/03/2007 01/01/2010 – 31/12/2011 Nil – – 553,940 – 553,940 05/09/2007 01/08/2010 – 31/07/2012 Nil – – 2,661,041 – 2,661,041 21/09/2007 01/08/2010 – 31/07/2012 Nil – – 68,448 – 68,448
Total 7,391,077 2,264,596 3,283,429 255,012 8,154,898
Footnote:1 The weighted average share price at the time of exercise of these performance rights was $10.31.2 The weighted average remaining contractual life of performance rights outstanding at the end of the period is 3.4 years.
Since the end of the financial year and up to the date of the report, no performance rights have been issued, 26,320 performance rights have been exercised; and no performance rights have lapsed. Of the performance rights outstanding at the end of the period, 32,118 granted on 23/10/2003, 6,449 granted on 18/03/2004 and 145,479 granted on 06/09/2004 have vested and are exercisable.
2005, 2006 and 2007 capital returnsTo compensate for the reduction in the value of performance rights resulting from the 2005, 2006 and 2007 capital returns, the arrangements with holders were altered so that, in respect of each capital return, they are entitled to be paid 40 cents for each performance right held immediately prior to the relevant capital return that subsequently vests and is converted into an AMP share. For example, an executive holding performance rights granted in 2005 will be entitled to a payment of 80 cents for each performance right granted in 2005 that vests, i.e after the three-year performance period and if the performance criteria are met. Executives who held performance rights granted in 2004 that vested in 2007 received $1.20 for each of those performance rights. No other terms described above were altered. The fair value of each grant of performance rights immediately prior to the alteration was the same as the fair value immediately after the alteration.
(c) Restricted sharesPlan descriptionA restricted share is an ordinary AMP share that has a holding lock in place until the three-year vesting period ends.
Restricted shares are offered to selected high performing employees who contribute significantly to AMP’s overall business success. The purpose of the grant is to recognise such employees and assist in retaining them. While restricted shares are offered to selected employees, they are no longer offered to the CEO and his direct reports.
98 AMP FULL FINANCIAL REPORT 2007
for the year ended 31 December 2007
Notes to the fi nancial statements continued
27. Share-based payments continued
As this program is designed as a means of recognising and retaining employees, no performance hurdles apply. However, the shares are subject to a holding lock until the end of a three-year vesting period. If the individual resigns from AMP during the holding period, the shares are forfeited. In the case of retrenchment, the individual retains their restricted shares; however the holding lock remains in place until the end of the three-year vesting period. Restricted shares are bought on market and granted at no cost to employees.
Plan valuation The fair value of restricted shares has been determined using the share price of AMP ordinary shares on the grant date. As employees holding restricted shares are entitled to dividend payments no adjustment has been made to the fair value in respect of future dividend payments. In determining the share-based payments expense for the period, the number of instruments expected to vest has been adjusted to refl ect the number of employees expected to remain with AMP until the end of the vesting period.
The following table shows the number of restricted shares that have been granted during the current period and comparative period and the fair value of restricted shares as at the grant date.
Grant date Number granted Weighted average fair value
05/09/20071 451,589 $10.7908/09/20061 370,058 $8.91
Footnote:1 In 2006 and 2007, AMP offered share bonus rights to employees in overseas domiciles where it was not possible or tax-efficient to grant restricted shares.
The terms and conditions of the share bonus rights are identical to the terms and conditions of the restricted shares except the share bonus rights are not entitled to dividends and settlement is in cash rather than equity instruments.
2005, 2006 and 2007 capital returnsNo adjustments were made to the restricted shares for the 2005, 2006 and 2007 capital returns.
(d) Employee Share Acquisition PlanPlan descriptionAMP currently offers all eligible employees and executives the opportunity to become shareholders in AMP through the Employee Share Acquisition Plan (ESAP). Under ESAP participants can elect to receive part of their base salary (and any short-term incentive payments) in the form of AMP shares. There are no performance hurdles applied to this part of the plan as participants sacrifi ce part of their salary to acquire these shares.
As an additional incentive to acquire shares, participants are entitled to receive (at no cost to the participant) one matching share for every 10 shares acquired (up to a maximum of 100 matching shares in any 12 month period). To receive the full entitlement to matching shares, shares must be held in the plan for a minimum of three years. There are no performance conditions for receiving matching shares as ESAP is primarily designed to encourage employee share ownership, through participation in the plan. Matching shares are bought on market.
Participants who cease to be employed within the AMP group within the three-year holding period may lose their entitlement to some or all of their matching shares, depending on the reason for leaving the company.
Plan valuation Under ESAP, participating employees receive matching shares at the end of a three-year vesting period. During this vesting period, the employee has no right to the matching shares and does not receive the dividends on the matching shares. Each matching share has been valued by external consultants as the face value of an AMP ordinary share at grant date less the present value of the expected dividends (not received). The number of matching shares expected to be granted is estimated based on the average number of shares held in the ESAP by each employee at the beginning of each year. In determining the share-based payments expense for the period, the number of matching shares expected to be granted has been adjusted to refl ect the number of employees expected to remain with AMP until the end of the three-year vesting period.
The following table shows the number of matching shares expected to be granted based on the shares purchased by employees under the ESAP during the current period and the comparative period and the fair value of matching shares as at the grant date.
Estimated number of matching Weighed averageGrant date shares to be granted fair value
2007 – various 28,320 $9.112006 – various 24,432 $7.87
AMP FULL FINANCIAL REPORT 2007 99
27. Share-based payments continued
2005, 2006 and 2007 capital returnsTo compensate for the reduction in the value of entitlements to matching shares resulting from the 2005, 2006 and 2007 capital returns, the arrangements with ESAP participants were altered so that, in respect of each capital return, they are entitled to be paid 40 cents for each matching share entitlement held in ESAP immediately prior to the relevant capital return that vests and is converted into an AMP share. For example, participants who held matching share entitlements under the plan immediately prior to the 2005 capital return will be paid $1.20 for each matching share that vests in 2008. The fair value of matching share entitlements immediately prior to the alteration was the same as the fair value immediately after the alteration. The fair value of each grant of performance rights immediately prior to the alteration was the same as the fair value immediately after the alteration.
(e) Executive Short-term Incentive ProgramPlan descriptionAt the time the program was offered, AMP invited selected executives to nominate up to 25% of any 2002 and 2003 short-term incentive to be allocated as AMP shares. In addition, selected senior executives were required to take 30% of their 2002 and 2003 short-term incentive as shares. As executives salary sacrifi ced their short-term incentive for AMP shares, no performance hurdles applied after the short-term incentive was granted.
For shares acquired on 10 March 2004, as part of the 2003 Executive Short-term Incentive Program, a three-year holding lock was imposed on these shares and executives who remained employed for three years received a full entitlement of one matching share (for no cash consideration) for each share held in the plan for three years. There were no performance criteria attached to receiving matching shares as the program was designed primarily as a retention tool. Participants who ceased employment with AMP during the three-year holding period lost their entitlement to receive some or all of their matching shares, depending on the reason their employment ceased.
Matching shares valuationUnder the Executive Short-term Incentive Program, participating executives receive matching shares at the end of a three-year vesting period. During this vesting period, the executive has no right to the matching shares and does not receive the dividends on the matching shares. Each matching share entitlement has been valued by external consultants as the face value of an AMP ordinary share at grant date (date of the deferral of the short-term incentive into the Executive Short-term Incentive Program) less the present value of the expected dividends (not received). In determining the share-based payments expense for the period, the number of matching shares expected to be granted has been adjusted to refl ect the number of employees expected to remain with AMP until the end of the three-year vesting period.
The following table shows the number of matching shares expected to be granted based on the shares purchased by employees under the Executive Short-term Incentive Program and the fair value of matching shares as at the grant date.
Estimated number of matching Weighed averageGrant date shares to be granted fair value
2005 and 2006 and 2007 – not offered n/a n/a10/03/2004 253,319 $4.5229/03/2004 34,188 $5.6828/03/2003 168,760 $5.9306/06/2003 102,993 $5.03
Impact of capital returnsTo compensate for the reduction in the value of entitlements to matching shares resulting from the capital returns made in 2005 and 2006, arrangements with participants in the program were altered so that, in respect of each of those capital returns, they were paid 40 cents for each matching share entitlement that vested and was converted into an AMP share. For shares acquired on 10 March 2004 as part of the 2003 Executive Short-term Incentive Program, a payment of 80 cents per share was made to each eligible participant when their matching share entitlements vested on 10 March 2007. No compensation was paid for the 2007 capital return as all matching shares under this program had vested by this time. The fair value of matching share entitlements immediately prior to the alteration was the same as the fair value immediately after the alteration.
(f) Employee and Executive Option PlanPlan descriptionIn the past, employees and executives were granted options to purchase AMP shares, subject to various performance hurdles. However, options have not been offered since 2002.
The ability to exercise options is subject to a performance hurdle that is tested at the end of a three-year performance period. Prior to their exercise, option holders do not receive dividends or have other shareholder benefi ts (including any voting rights). The performance hurdle is Total Shareholder Return (TSR) relative to a group of comparable companies by size. The number of options that vest is determined by a vesting schedule based on the level of company performance relative to the comparator group.
100 AMP FULL FINANCIAL REPORT 2007
for the year ended 31 December 2007
Notes to the fi nancial statements continued
27. Share-based payments continued
At the end of the performance period, AMP’s Remuneration Committee uses data from an independent external consultant to determine AMP’s TSR performance relative to the comparator group. The use of an independent external consultant ensures objectivity in measuring AMP’s performance. If some or all options do not vest at this time, then the performance period is extended by two years. Options that have not vested at the end of the extended performance period lapse. Options that have vested can be exercised up to 10 years from the grant date.
As mentioned previously, all options were granted prior to 7 November 2002 and are therefore exempt from being included in the calculation of the share-based payments expense which is recorded in the Income statement.
The current exercise prices of outstanding options are generally above the current market price of AMP shares.
Details of options over unissued ordinary shares of AMP Limited are as follows:
Exercise Balance at Exercised Granted Lapsed Balance atGrant date Exercise period price1 1 Jan 2007 during the year during the year during the year 31 Dec 2007
Executive Option Plan 26/06/1999 26/06/2002 – 25/06/2009 $11.44 978,212 – – 10,000 968,21228/08/1999 26/06/2002 – 25/06/2009 $11.17 16,538 – – – 16,53830/10/1999 30/10/2002 – 29/10/2009 $10.83 20,000 – – – 20,00018/12/1999 18/12/2002 – 17/12/2009 $11.35 40,000 – – – 40,00001/01/2000 01/01/2003 – 31/12/2009 $11.90 29,544 – – – 29,54419/02/2000 19/02/2003 – 18/02/2010 $9.91 30,000 – – – 30,00021/03/2001 21/03/2004 – 20/03/2011 $14.19 39,791 – – – 39,79121/07/2001 21/07/2004 – 20/07/2011 $14.75 58,500 – – 49,500 9,00015/12/2001 15/12/2004 – 14/12/2011 $12.89 4,040 – – 4,040 – 23/03/2002 23/03/2005 – 22/03/2012 $13.80 100,000 – – 100,000 –
Employee Option Plan26/06/1999 26/06/2002 – 25/06/2009 $11.44 526,070 – – 2,000 524,07028/08/1999 20/08/2002 – 25/06/2009 $11.17 13,624 – – – 13,62401/01/2000 01/01/2003 – 31/12/2009 $11.90 217,432 – – – 217,43230/06/2000 30/06/2003 – 29/06/2010 $11.57 1,362,060 – – – 1,362,06028/10/2000 28/10/2003 – 27/10/2010 $12.29 31,406 – – – 31,40609/12/2000 09/12/2003 – 08/12/2010 $13.65 10,000 – – – 10,00021/07/2001 21/07/2004 – 20/07/2011 $14.75 748,205 – – – 748,20515/12/2001 15/12/2004 – 14/12/2011 $12.89 1,294 – – – 1,294
Total 4,226,716 – – 165,540 4,061,176
Footnote:1 The exercise prices shown in this column became effective on 17 May 2007. To compensate for the impact of the 2007 capital return of 40 cents per share
the exercise prices of outstanding options were reduced by 40 cents per share in accordance with ASX listing rules.2 The weighted average remaining contractual life of options outstanding at the end of the period is 2.3 years.
Since the end of the fi nancial year and up to the date of the report, 100,000 executive options granted on 26/06/2002 and 40,000 executive options granted on 18/12/2002 have lapsed and no options have been exercised. The total number of options on issue at the date of the report is 3,921,176.
2005, 2006 and 2007 capital return In accordance with the ASX listing rules and the rules of the plan, the exercise prices of outstanding options were reduced by 40 cents per option following the 2005, 2006 and 2007 capital returns of 40 cents per share to shareholders. The terms and conditions of the options were not altered as a result of the capital returns as the reduction in exercise prices occurred under their original terms.
AMP FULL FINANCIAL REPORT 2007 101

28. Group controlled entity holdings
Details of investments in controlled entities are as follows: Country of % HoldingsName of entity incorporation Share type Footnote 2007 2006
1 York Street Holdings Pty Ltd Australia Ord 100 100 140 St Georges Terrace Pty Limited Australia Ord 100 100 255 George Street Investment A Pty Ltd Australia Ord 100 100 255 George Street Investment B Pty Ltd Australia Ord 100 100 35 Ocean Keys Pty Limited Australia Ord 100 100 A.C.N. 086 091 643 Pty Limited Australia Ord 100 100 Abbey Capital Real Estate Pty Limited Australia Ord 100 100 ABN 43 102 756 990 Limited [formerly Magnify Financial Planners Limited] Australia Ord 2 – 100 ACPP Industrial Pty Ltd Australia Ord 100 100 ACPP Office Pty Ltd Australia Ord 100 100 ACPP Retail Pty Ltd Australia Ord 100 100 AG Australia Holdings Limited Australia Ord 4 100 100 Allmarg Corporation Limited NZ Ord, Pref 100 100 AMP (UK) Finance Services Plc UK Ord 100 100 AMP ASAL Pty Ltd Australia Ord 100 100 AMP Australia Nominees Pty Limited Australia Ord 3 100 100 AMP Australian Financial Services Holdings Limited Australia Ord 100 100 AMP Bank Limited Australia Ord 100 100 AMP Capital Bayfair Pty Limited Australia Ord 100 100 AMP Capital Finance Limited Australia Ord 1 100 – AMP Capital Global Property Securities Pty Limited Australia Ord 100 100 AMP Capital Holdings Limited Australia Ord 100 100 AMP Capital Investments Limited NZ Ord A & B, Pref 100 100 AMP Capital Investments No. 2 Limited NZ Ord A & B, Pref 100 100 AMP Capital Investments No. 4 Limited NZ Ord A & B, Pref 2 – 100 AMP Capital Investments No. 8 Limited NZ Ord A & B, Pref 100 100 AMP Capital Investments No. 11 Limited NZ Ord A & B 100 100 AMP Capital Investments No. 14 Limited NZ Ord A & B 100 100 AMP Capital Investments No. 15 Limited NZ Ord 2 – 100 AMP Capital Investors Advisory (Beijing) Limited Republic of China Ord 1 100 – AMP Capital Investors (C.I.) Limited Jersey Ord 100 100 AMP Capital Investors (New Zealand) Limited NZ Ord 100 100 AMP Capital Investors (Property Funds Management Jersey) Limited Jersey Ord 100 100 AMP Capital Investors (Singapore) Pte Ltd Singapore Ord 100 100 AMP Capital Investors (Singapore) REIT Management Limited Singapore Ord 1 100 – AMP Capital Investors (UK) Limited UK Ord 100 100 AMP Capital Investors International Holdings Limited Australia Ord 100 100 AMP Capital Investors Japan KK Japan Ord 1 100 – AMP Capital Investors Limited Australia Ord 100 100 AMP Capital Lifestyle Limited Australia Ord 1 100 – AMP Capital Office and Industrial Pty Limited Australia Ord 100 100 AMP Capital Office and Industrial (Singapore) Pte Limited Singapore Ord 1 100 – AMP Capital Palm Pty Limited Australia Ord 1 100 – AMP Capital Property Nominees Ltd Australia Ord 100 100 AMP Capital Research (India) Private Limited India Ord 100 100 AMP Capital Retirement Properties Limited (formerly AMP NZ Retirement Properties Limited) NZ Ord 99 100AMP Capital Shopping Centre Pty Limited Australia Ord 100 100 AMP CMBS No. 1 Pty Limited Australia Ord 100 100 AMP CMBS No. 2 Pty Limited Australia Ord 100 100 AMP Crossroads Pty Limited Australia Ord 100 100 AMP Custodial Investments No. 1 Limited NZ Ord A & B, Pref 100 100 AMP Custodian Services (NZ) Limited NZ Ord 100 100 AMP Davidson Road Pty Limited Australia Ord 100 100 AMP Finance Limited Australia Ord 100 100 AMP Finance Services Limited Australia Ord 100 100 AMP Financial Investment Group Holdings Limited Australia Ord 100 100 AMP Financial Planning Pty Limited Australia Ord 100 100 AMP Financial Services (Asia) Pte Ltd Singapore Ord 2 – 100 AMP Financial Services Holdings Limited Australia Ord 100 100 AMP GBS Limited Australia Fixed 100 100 AMP GDPF Pty Limited Australia Ord 100 100 AMP General Insurance Holdings Limited Australia Ord 4 100 100 AMP General Insurance Limited Australia Ord 4 100 100
102 AMP FULL FINANCIAL REPORT 2007
for the year ended 31 December 2007
Notes to the fi nancial statements continued

28. Group controlled entity holdings continued Country of % HoldingsName of entity incorporation Share type Footnote 2007 2006
AMP GI Distribution Pty Limited Australia Ord 100 100 AMP Global Property Investments Pty Ltd Australia Ord 100 100 AMP Group Finance Services Limited Australia Ord 100 100 AMP Group Holdings Limited Australia Ord 100 100 AMP Group Services Limited Australia Ord 100 100 AMP Guardians Pty Limited Australia Ord 100 100 AMP Holdings Limited Australia Ord A, Ord B, 100 100 Red Pref B Class AMP Insurance Investment Holdings Pty Limited Australia Ord 100 100 AMP Investment Management (NZ) Limited NZ Ord 100 100 AMP Investment Services No. 2 Pty Limited Australia Ord 100 100 AMP Investment Services Pty Limited Australia Ord 100 100 AMP Investments Chile Limitada Chile Ord 100 100 AMP Lending Services Limited Australia Ord 100 100 AMP Life Limited Australia Ord 100 100 AMP Macquarie Holding Pty Limited Australia Ord 100 100 AMP Macquarie Pty Limited Australia Ord 100 100 AMP NZ Retirement Properties Limited NZ Ord 100 100 AMP Pacific Fair Pty Limited Australia Ord 100 100 AMP Papamoa Beach Gardens Limited NZ Ord 2 – 100 AMP Personal Investment Services Limited Australia Ord 100 100 AMP Private Advice Limited Australia Ord 2 – 100 AMP Private Capital Funds Holdings Limited NZ Ord, Pref 100 100 AMP Private Capital New Zealand Limited NZ Ord 100 100 AMP Private Capital No. 2 Pty Limited Australia Ord 100 100 AMP Private Capital Pty Limited Australia Ord 100 100 AMP Private Investments Pty Limited Australia Ord 100 100 AMP Property Investments (Qld) Pty. Ltd. Australia Ord 100 100 AMP Real Estate Pty Ltd Australia Ord 100 100 AMP Remuneration Reward Plans Nominees Pty. Limited Australia Ord 100 100 AMP Riverside Plaza Pty Limited Australia Ord 100 100 AMP Royal Randwick Pty Limited Australia Ord 100 100 AMP Services (NZ) Limited NZ Ord 100 100 AMP Services Holdings Limited Australia Ord 100 100 AMP Services Limited Australia Ord 100 100 AMP Superannuation (NZ) Limited NZ Ord 100 100 AMP Superannuation Limited Australia Ord 100 100 AMP Warringah Mall Pty Ltd Australia Ord 100 100 AMP/ERGO Mortgage and Savings Limited NZ Ord 100 100 AMPG (1992) Ltd Australia Ord 4 100 100 Arrive Wealth Management Limited Australia Ord 100 100 Arthur Ellis & Co. Limited NZ Ord 100 100 Arthur Ellis Limited NZ Ord 100 100 Auburn Mega Mall Pty Limited Australia Ord 100 100 Australian Mutual Provident Society Pty Limited Australia Ord 100 100 Australian Securities Administration Limited Australia Ord 100 100 AWOF New Zealand Office Pty Limited Australia Ord 100 100 Balclutha Holdings Limited NZ Ord, Pref 2 – 100 Cobalt Solutions Australia Limited Australia Ord 4 100 100 Cobalt Solutions Services Limited Australia Ord 1 100 – Collins Place No. 2 Pty Ltd Australia Ord 100 100 Collins Place Pty Limited Australia Ord 100 100 Donaghys Australia Pty Limited NZ Ord 75 75 Donaghys Industries Limited NZ Ord 75 75 Donaghys International Limited NZ Ord 75 75 Donaghys Limited NZ Ord, Pref 75 75 Donaghys Sarlon Pty Limited NZ Ord 75 75 ERGO Personal Financial Services Limited NZ Ord 100 100 Genlis Pty Limited Australia Ord 2 – 100 Glendenning Pty Limited Australia Ord 1 100 – Gordian RunOff (UK) Limited UK Ord 4 100 100 Gordian RunOff Limited Australia Ord 4 100 100 Hillross Financial Services Limited Australia Ord 100 100 Honeysuckle 231 Pty Limited Australia Ord 60 60 INSSA Pty Limited Australia Ord 100 100 Inversiones Mineras Los Andes Limitada Chile Ord 100 100 Investment Services Nominees Pty Limited Australia Ord 100 100
AMP FULL FINANCIAL REPORT 2007 103
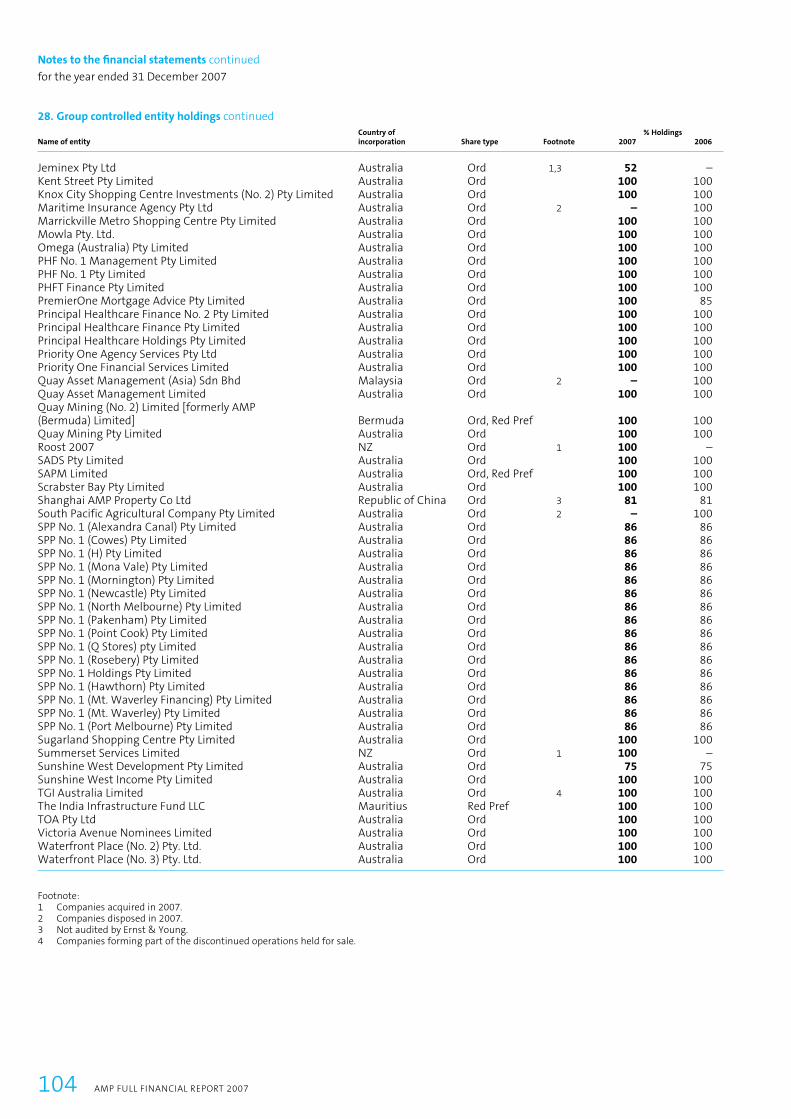
28. Group controlled entity holdings continued Country of % HoldingsName of entity incorporation Share type Footnote 2007 2006
Jeminex Pty Ltd Australia Ord 1,3 52 – Kent Street Pty Limited Australia Ord 100 100 Knox City Shopping Centre Investments (No. 2) Pty Limited Australia Ord 100 100 Maritime Insurance Agency Pty Ltd Australia Ord 2 – 100 Marrickville Metro Shopping Centre Pty Limited Australia Ord 100 100 Mowla Pty. Ltd. Australia Ord 100 100 Omega (Australia) Pty Limited Australia Ord 100 100 PHF No. 1 Management Pty Limited Australia Ord 100 100 PHF No. 1 Pty Limited Australia Ord 100 100 PHFT Finance Pty Limited Australia Ord 100 100 PremierOne Mortgage Advice Pty Limited Australia Ord 100 85 Principal Healthcare Finance No. 2 Pty Limited Australia Ord 100 100 Principal Healthcare Finance Pty Limited Australia Ord 100 100 Principal Healthcare Holdings Pty Limited Australia Ord 100 100 Priority One Agency Services Pty Ltd Australia Ord 100 100 Priority One Financial Services Limited Australia Ord 100 100 Quay Asset Management (Asia) Sdn Bhd Malaysia Ord 2 – 100 Quay Asset Management Limited Australia Ord 100 100 Quay Mining (No. 2) Limited [formerly AMP (Bermuda) Limited] Bermuda Ord, Red Pref 100 100 Quay Mining Pty Limited Australia Ord 100 100 Roost 2007 NZ Ord 1 100 – SADS Pty Limited Australia Ord 100 100 SAPM Limited Australia Ord, Red Pref 100 100 Scrabster Bay Pty Limited Australia Ord 100 100 Shanghai AMP Property Co Ltd Republic of China Ord 3 81 81 South Pacific Agricultural Company Pty Limited Australia Ord 2 – 100 SPP No. 1 (Alexandra Canal) Pty Limited Australia Ord 86 86 SPP No. 1 (Cowes) Pty Limited Australia Ord 86 86 SPP No. 1 (H) Pty Limited Australia Ord 86 86 SPP No. 1 (Mona Vale) Pty Limited Australia Ord 86 86 SPP No. 1 (Mornington) Pty Limited Australia Ord 86 86 SPP No. 1 (Newcastle) Pty Limited Australia Ord 86 86 SPP No. 1 (North Melbourne) Pty Limited Australia Ord 86 86 SPP No. 1 (Pakenham) Pty Limited Australia Ord 86 86 SPP No. 1 (Point Cook) Pty Limited Australia Ord 86 86 SPP No. 1 (Q Stores) pty Limited Australia Ord 86 86 SPP No. 1 (Rosebery) Pty Limited Australia Ord 86 86 SPP No. 1 Holdings Pty Limited Australia Ord 86 86 SPP No. 1 (Hawthorn) Pty Limited Australia Ord 86 86 SPP No. 1 (Mt. Waverley Financing) Pty Limited Australia Ord 86 86 SPP No. 1 (Mt. Waverley) Pty Limited Australia Ord 86 86 SPP No. 1 (Port Melbourne) Pty Limited Australia Ord 86 86 Sugarland Shopping Centre Pty Limited Australia Ord 100 100 Summerset Services Limited NZ Ord 1 100 – Sunshine West Development Pty Limited Australia Ord 75 75 Sunshine West Income Pty Limited Australia Ord 100 100 TGI Australia Limited Australia Ord 4 100 100 The India Infrastructure Fund LLC Mauritius Red Pref 100 100 TOA Pty Ltd Australia Ord 100 100 Victoria Avenue Nominees Limited Australia Ord 100 100 Waterfront Place (No. 2) Pty. Ltd. Australia Ord 100 100 Waterfront Place (No. 3) Pty. Ltd. Australia Ord 100 100
Footnote:1 Companies acquired in 2007.2 Companies disposed in 2007.3 Not audited by Ernst & Young.4 Companies forming part of the discontinued operations held for sale.
104 AMP FULL FINANCIAL REPORT 2007
for the year ended 31 December 2007
Notes to the fi nancial statements continued
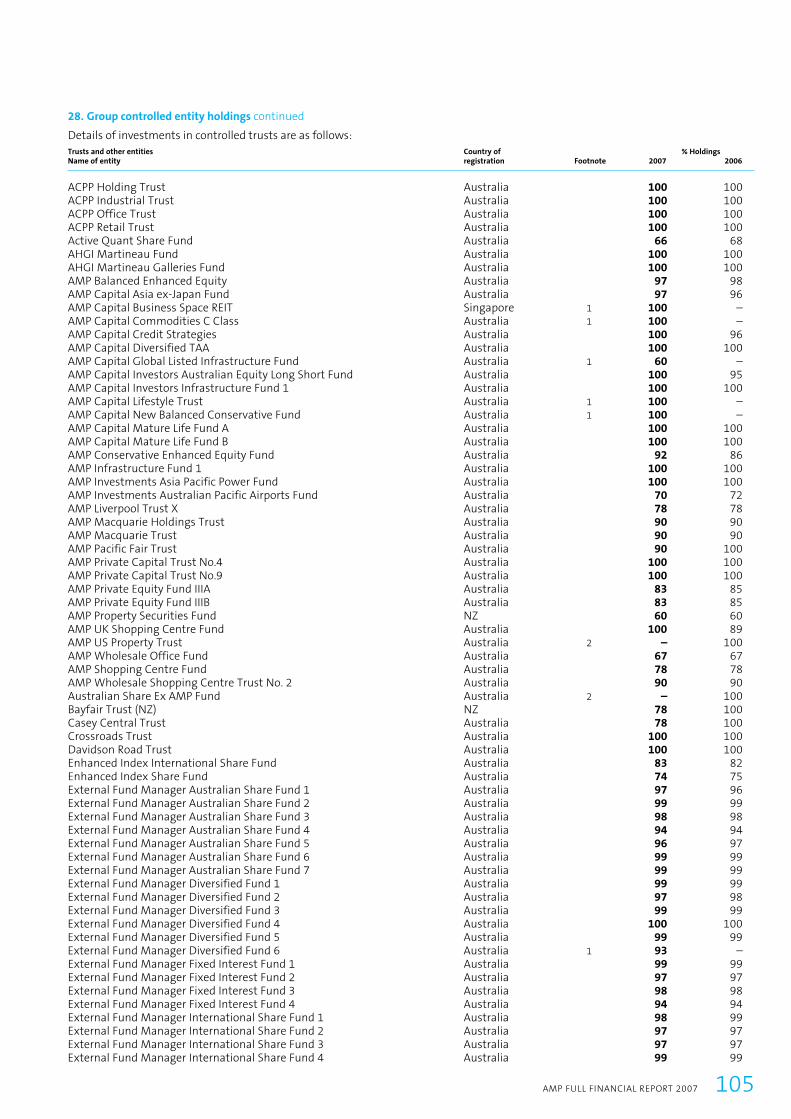
28. Group controlled entity holdings continued
Details of investments in controlled trusts are as follows:Trusts and other entities Country of % HoldingsName of entity registration Footnote 2007 2006
ACPP Holding Trust Australia 100 100ACPP Industrial Trust Australia 100 100ACPP Office Trust Australia 100 100ACPP Retail Trust Australia 100 100Active Quant Share Fund Australia 66 68AHGI Martineau Fund Australia 100 100AHGI Martineau Galleries Fund Australia 100 100AMP Balanced Enhanced Equity Australia 97 98AMP Capital Asia ex-Japan Fund Australia 97 96AMP Capital Business Space REIT Singapore 1 100 –AMP Capital Commodities C Class Australia 1 100 –AMP Capital Credit Strategies Australia 100 96AMP Capital Diversified TAA Australia 100 100AMP Capital Global Listed Infrastructure Fund Australia 1 60 –AMP Capital Investors Australian Equity Long Short Fund Australia 100 95AMP Capital Investors Infrastructure Fund 1 Australia 100 100AMP Capital Lifestyle Trust Australia 1 100 –AMP Capital New Balanced Conservative Fund Australia 1 100 –AMP Capital Mature Life Fund A Australia 100 100AMP Capital Mature Life Fund B Australia 100 100AMP Conservative Enhanced Equity Fund Australia 92 86AMP Infrastructure Fund 1 Australia 100 100AMP Investments Asia Pacific Power Fund Australia 100 100AMP Investments Australian Pacific Airports Fund Australia 70 72AMP Liverpool Trust X Australia 78 78AMP Macquarie Holdings Trust Australia 90 90 AMP Macquarie Trust Australia 90 90AMP Pacific Fair Trust Australia 90 100AMP Private Capital Trust No.4 Australia 100 100AMP Private Capital Trust No.9 Australia 100 100AMP Private Equity Fund IIIA Australia 83 85AMP Private Equity Fund IIIB Australia 83 85AMP Property Securities Fund NZ 60 60AMP UK Shopping Centre Fund Australia 100 89AMP US Property Trust Australia 2 – 100AMP Wholesale Office Fund Australia 67 67AMP Shopping Centre Fund Australia 78 78AMP Wholesale Shopping Centre Trust No. 2 Australia 90 90Australian Share Ex AMP Fund Australia 2 – 100Bayfair Trust (NZ) NZ 78 100Casey Central Trust Australia 78 100Crossroads Trust Australia 100 100Davidson Road Trust Australia 100 100Enhanced Index International Share Fund Australia 83 82Enhanced Index Share Fund Australia 74 75External Fund Manager Australian Share Fund 1 Australia 97 96External Fund Manager Australian Share Fund 2 Australia 99 99External Fund Manager Australian Share Fund 3 Australia 98 98 External Fund Manager Australian Share Fund 4 Australia 94 94 External Fund Manager Australian Share Fund 5 Australia 96 97 External Fund Manager Australian Share Fund 6 Australia 99 99 External Fund Manager Australian Share Fund 7 Australia 99 99 External Fund Manager Diversified Fund 1 Australia 99 99 External Fund Manager Diversified Fund 2 Australia 97 98 External Fund Manager Diversified Fund 3 Australia 99 99 External Fund Manager Diversified Fund 4 Australia 100 100 External Fund Manager Diversified Fund 5 Australia 99 99 External Fund Manager Diversified Fund 6 Australia 1 93 – External Fund Manager Fixed Interest Fund 1 Australia 99 99 External Fund Manager Fixed Interest Fund 2 Australia 97 97 External Fund Manager Fixed Interest Fund 3 Australia 98 98 External Fund Manager Fixed Interest Fund 4 Australia 94 94 External Fund Manager International Share Fund 1 Australia 98 99 External Fund Manager International Share Fund 2 Australia 97 97 External Fund Manager International Share Fund 3 Australia 97 97 External Fund Manager International Share Fund 4 Australia 99 99
AMP FULL FINANCIAL REPORT 2007 105

28. Group controlled entity holdings continuedTrusts and other entities Country of % HoldingsName of entity registration Footnote 2007 2006
External Fund Manager International Share Fund 5 Australia 96 97 External Fund Manager International Share Fund 6 Australia 100 100 External Fund Manager Listed Property Fund 1 Australia 96 96 Floating Rate Income Fund [formerly AMP Capital Investors Enhanced Income Fund] Australia 63 64 Future Direction Australian Bond Fund Australia 92 92 Future Directions Australian Share Fund Australia 88 86 Future Directions Australian Share Fund 1 Australia 97 96 Future Directions Australian Share Fund 2 Australia 93 92 Future Directions Australian Share Fund 3 Australia 87 88 Future Directions Australian Small Company Fund Australia 84 85 Future Directions Balanced Fund Australia 95 95 Future Directions Conservative Fund Australia 84 81 Future Directions Core International Fund 2 Australia 54 55 Future Directions Enhanced Index International Share Fund Australia 92 90 Future Directions Geared Australian Share Fund Australia 87 86 Future Directions Global Property Securities Fund 1 Australia 91 91 Future Directions Growth Fund Australia 91 89 Future Directions High Growth Fund Australia 90 86 Future Directions International Bond Fund Australia 92 81 Future Directions International Bond Fund 1 Australia 81 81 Future Directions International Bond Fund 2 Australia 2 – 81 Future Directions International Bond Fund 3 Australia 83 83 Future Directions International Bond Fund 4 Australia 2 – 84 Future Directions International Share Fund Australia 89 88 Future Directions International Share Fund 1 Australia 92 91 Future Directions International Share Fund 2 Australia 84 82 Future Directions International Share Fund 3 Australia 99 99 Future Directions International Share Fund 4 Australia 97 97 Future Directions International Share Fund 5 Australia 98 98 Future Directions Moderate Conservative Fund Australia 99 88 Future Directions Property Feeder Fund Australia 90 90 Future Directions Total Return Fund Australia 94 88 Future Directions Total Return Fund – 1 Australia 1 89 – Glendenning Trust Australia 1 100 – Global Credit Strategies Fund Australia 90 85 Global Defender Fund NZ 90 100 Global Growth Opportunities Fund Australia 93 91 Hedged International Share Fund Australia 94 88 International Bond Fund Australia 89 88 International Share Fund Australia 81 77 International Unlisted Investment Fund Australia 100 100 Kent Street Investment Trust Australia 100 100 Kent Street Unit Trust Australia 100 100 Listed Property Trusts Fund Australia 56 52 Loftus Street Trust Australia 67 67 Macquarie Australian Enhanced Australia 2 – 55 Macquarie Life Capital Stable Fund Australia 2 – 68 Managed Treasury Fund Australia 76 77 Merrill Lynch Mercury Balanced Pooled Super Fund Australia 76 74 Monash House Trust Australia 100 100 Ocean Keys Holding Trust Australia 78 100 Ocean Keys Trust Australia 78 100 Principal Healthcare Holding Trust Australia 100 100 Progress 1997-1 Trust Australia 2 – 100 Progress Warehouse Trust No 1 Australia 100 100 Progress Warehouse Trust No 2 Australia 100 100 Progress 2002-1 Trust Australia 100 100 Progress 2003-1 Trust Australia 100 100 Progress 2003 E1 Trust Australia 100 100 Progress 2004 – E1 Trust Australia 100 100 Progress 2004 – 2 Trust Australia 100 100 Progress 2005 – 1 Trust Australia 100 100 Progress 2005 – 2 Trust Australia 100 100 Progress 2006-1 Trust Australia 100 100 Progress 2007-1 G Australia 1 100 – Responsible Investment Leaders Australian Share Fund Australia 57 71
106 AMP FULL FINANCIAL REPORT 2007
for the year ended 31 December 2007
Notes to the fi nancial statements continued
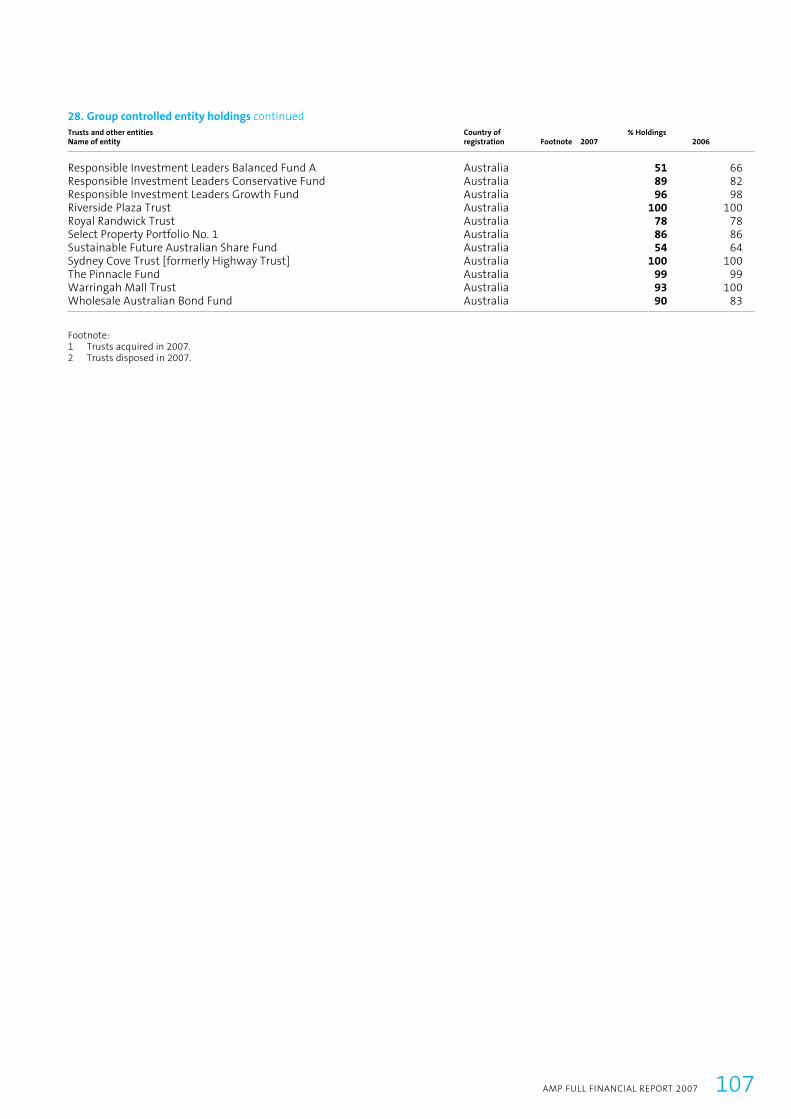
28. Group controlled entity holdings continuedTrusts and other entities Country of % HoldingsName of entity registration Footnote 2007 2006
Responsible Investment Leaders Balanced Fund A Australia 51 66 Responsible Investment Leaders Conservative Fund Australia 89 82 Responsible Investment Leaders Growth Fund Australia 96 98 Riverside Plaza Trust Australia 100 100 Royal Randwick Trust Australia 78 78 Select Property Portfolio No. 1 Australia 86 86 Sustainable Future Australian Share Fund Australia 54 64 Sydney Cove Trust [formerly Highway Trust] Australia 100 100 The Pinnacle Fund Australia 99 99 Warringah Mall Trust Australia 93 100 Wholesale Australian Bond Fund Australia 90 83
Footnote:1 Trusts acquired in 2007.2 Trusts disposed in 2007.
AMP FULL FINANCIAL REPORT 2007 107
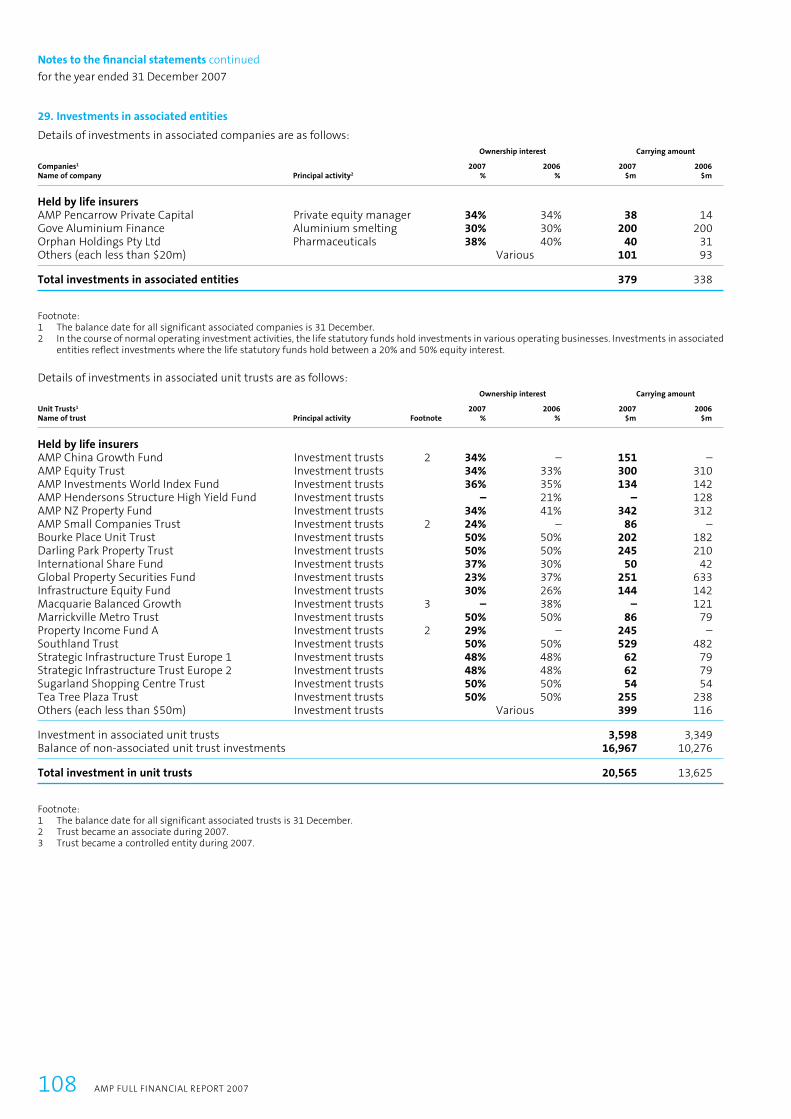
29. Investments in associated entities
Details of investments in associated companies are as follows: Ownership interest Carrying amount
Companies1 2007 2006 2007 2006Name of company Principal activity2 % % $m $m
Held by life insurers AMP Pencarrow Private Capital Private equity manager 34% 34% 38 14Gove Aluminium Finance Aluminium smelting 30% 30% 200 200 Orphan Holdings Pty Ltd Pharmaceuticals 38% 40% 40 31 Others (each less than $20m) Various 101 93
Total investments in associated entities 379 338
Footnote:1 The balance date for all significant associated companies is 31 December. 2 In the course of normal operating investment activities, the life statutory funds hold investments in various operating businesses. Investments in associated
entities reflect investments where the life statutory funds hold between a 20% and 50% equity interest.
Details of investments in associated unit trusts are as follows: Ownership interest Carrying amount
Unit Trusts1 2007 2006 2007 2006Name of trust Principal activity Footnote % % $m $m
Held by life insurers AMP China Growth Fund Investment trusts 2 34% – 151 – AMP Equity Trust Investment trusts 34% 33% 300 310AMP Investments World Index Fund Investment trusts 36% 35% 134 142AMP Hendersons Structure High Yield Fund Investment trusts – 21% – 128AMP NZ Property Fund Investment trusts 34% 41% 342 312AMP Small Companies Trust Investment trusts 2 24% – 86 –Bourke Place Unit Trust Investment trusts 50% 50% 202 182Darling Park Property Trust Investment trusts 50% 50% 245 210International Share Fund Investment trusts 37% 30% 50 42Global Property Securities Fund Investment trusts 23% 37% 251 633Infrastructure Equity Fund Investment trusts 30% 26% 144 142Macquarie Balanced Growth Investment trusts 3 – 38% – 121Marrickville Metro Trust Investment trusts 50% 50% 86 79Property Income Fund A Investment trusts 2 29% – 245 –Southland Trust Investment trusts 50% 50% 529 482Strategic Infrastructure Trust Europe 1 Investment trusts 48% 48% 62 79Strategic Infrastructure Trust Europe 2 Investment trusts 48% 48% 62 79Sugarland Shopping Centre Trust Investment trusts 50% 50% 54 54Tea Tree Plaza Trust Investment trusts 50% 50% 255 238Others (each less than $50m) Investment trusts Various 399 116
Investment in associated unit trusts 3,598 3,349 Balance of non-associated unit trust investments 16,967 10,276
Total investment in unit trusts 20,565 13,625
Footnote:1 The balance date for all significant associated trusts is 31 December. 2 Trust became an associate during 2007.3 Trust became a controlled entity during 2007.
108 AMP FULL FINANCIAL REPORT 2007
for the year ended 31 December 2007
Notes to the fi nancial statements continued
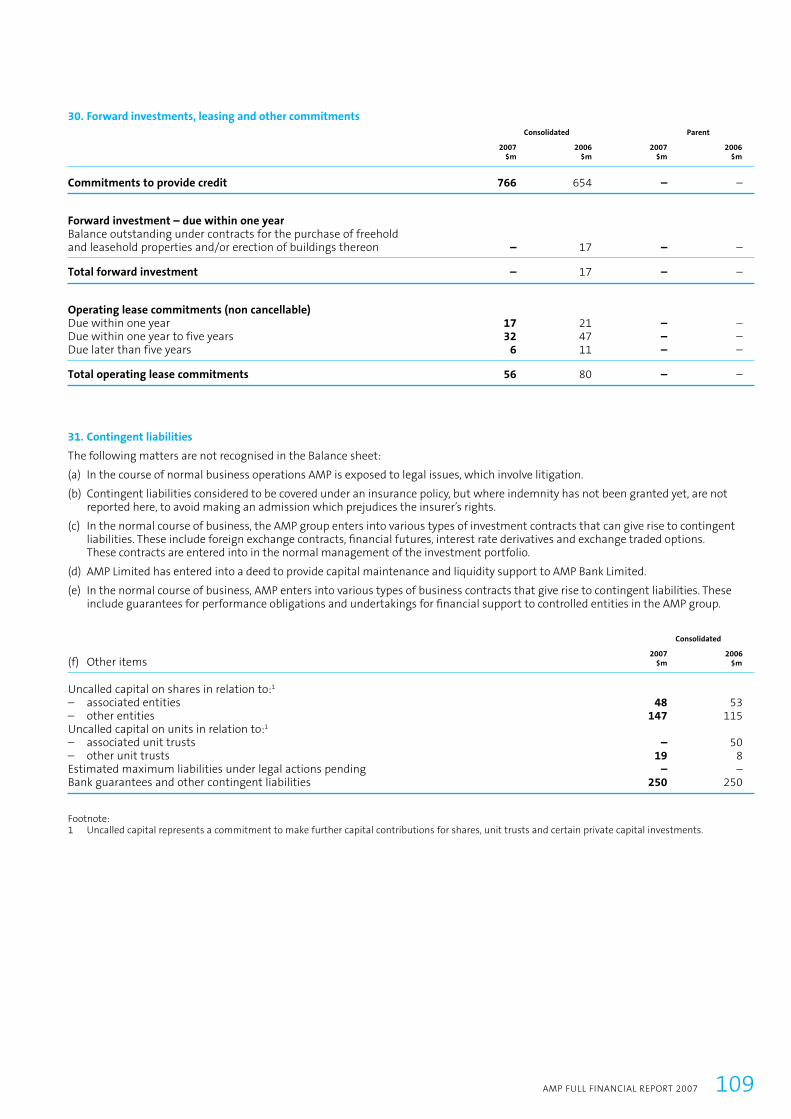
30. Forward investments, leasing and other commitments Consolidated Parent
2007 2006 2007 2006 $m $m $m $m
Commitments to provide credit 766 654 – –
Forward investment – due within one year Balance outstanding under contracts for the purchase of freehold and leasehold properties and/or erection of buildings thereon – 17 – –
Total forward investment – 17 – –
Operating lease commitments (non cancellable) Due within one year 17 21 – – Due within one year to five years 32 47 – – Due later than five years 6 11 – –
Total operating lease commitments 56 80 – –
31. Contingent liabilities
The following matters are not recognised in the Balance sheet:
(a) In the course of normal business operations AMP is exposed to legal issues, which involve litigation.
(b) Contingent liabilities considered to be covered under an insurance policy, but where indemnity has not been granted yet, are not reported here, to avoid making an admission which prejudices the insurer’s rights.
(c) In the normal course of business, the AMP group enters into various types of investment contracts that can give rise to contingent liabilities. These include foreign exchange contracts, fi nancial futures, interest rate derivatives and exchange traded options. These contracts are entered into in the normal management of the investment portfolio.
(d) AMP Limited has entered into a deed to provide capital maintenance and liquidity support to AMP Bank Limited.
(e) In the normal course of business, AMP enters into various types of business contracts that give rise to contingent liabilities. These include guarantees for performance obligations and undertakings for fi nancial support to controlled entities in the AMP group.
Consolidated
2007 2006(f) Other items $m $m
Uncalled capital on shares in relation to:1 – associated entities 48 53– other entities 147 115Uncalled capital on units in relation to:1 – associated unit trusts – 50 – other unit trusts 19 8 Estimated maximum liabilities under legal actions pending – –Bank guarantees and other contingent liabilities 250 250
Footnote:1 Uncalled capital represents a commitment to make further capital contributions for shares, unit trusts and certain private capital investments.
AMP FULL FINANCIAL REPORT 2007 109
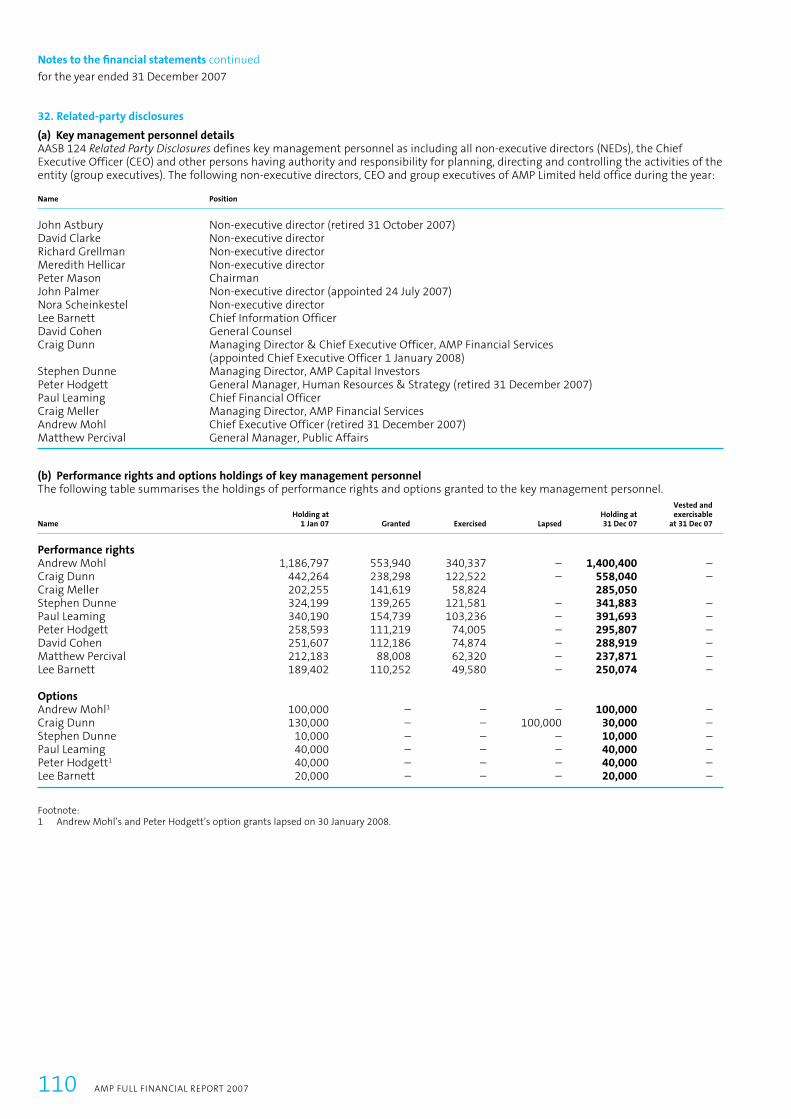
32. Related-party disclosures
(a) Key management personnel detailsAASB 124 Related Party Disclosures defines key management personnel as including all non-executive directors (NEDs), the Chief Executive Officer (CEO) and other persons having authority and responsibility for planning, directing and controlling the activities of the entity (group executives). The following non-executive directors, CEO and group executives of AMP Limited held office during the year:
Name Position
John Astbury Non-executive director (retired 31 October 2007)David Clarke Non-executive directorRichard Grellman Non-executive director Meredith Hellicar Non-executive directorPeter Mason ChairmanJohn Palmer Non-executive director (appointed 24 July 2007)Nora Scheinkestel Non-executive directorLee Barnett Chief Information OfficerDavid Cohen General CounselCraig Dunn Managing Director & Chief Executive Officer, AMP Financial Services
(appointed Chief Executive Officer 1 January 2008)Stephen Dunne Managing Director, AMP Capital InvestorsPeter Hodgett General Manager, Human Resources & Strategy (retired 31 December 2007)Paul Leaming Chief Financial OfficerCraig Meller Managing Director, AMP Financial ServicesAndrew Mohl Chief Executive Officer (retired 31 December 2007)Matthew Percival General Manager, Public Affairs
(b) Performance rights and options holdings of key management personnelThe following table summarises the holdings of performance rights and options granted to the key management personnel. Vested and Holding at Holding at exercisableName 1 Jan 07 Granted Exercised Lapsed 31 Dec 07 at 31 Dec 07
Performance rights Andrew Mohl 1,186,797 553,940 340,337 – 1,400,400 – Craig Dunn 442,264 238,298 122,522 – 558,040 – Craig Meller 202,255 141,619 58,824 285,050 Stephen Dunne 324,199 139,265 121,581 – 341,883 – Paul Leaming 340,190 154,739 103,236 – 391,693 – Peter Hodgett 258,593 111,219 74,005 – 295,807 – David Cohen 251,607 112,186 74,874 – 288,919 – Matthew Percival 212,183 88,008 62,320 – 237,871 – Lee Barnett 189,402 110,252 49,580 – 250,074 –
Options Andrew Mohl1 100,000 – – – 100,000 – Craig Dunn 130,000 – – 100,000 30,000 – Stephen Dunne 10,000 – – – 10,000 – Paul Leaming 40,000 – – – 40,000 – Peter Hodgett1 40,000 – – – 40,000 – Lee Barnett 20,000 – – – 20,000 –
Footnote:1 Andrew Mohl’s and Peter Hodgett’s option grants lapsed on 30 January 2008.
110 AMP FULL FINANCIAL REPORT 2007
for the year ended 31 December 2007
Notes to the fi nancial statements continued
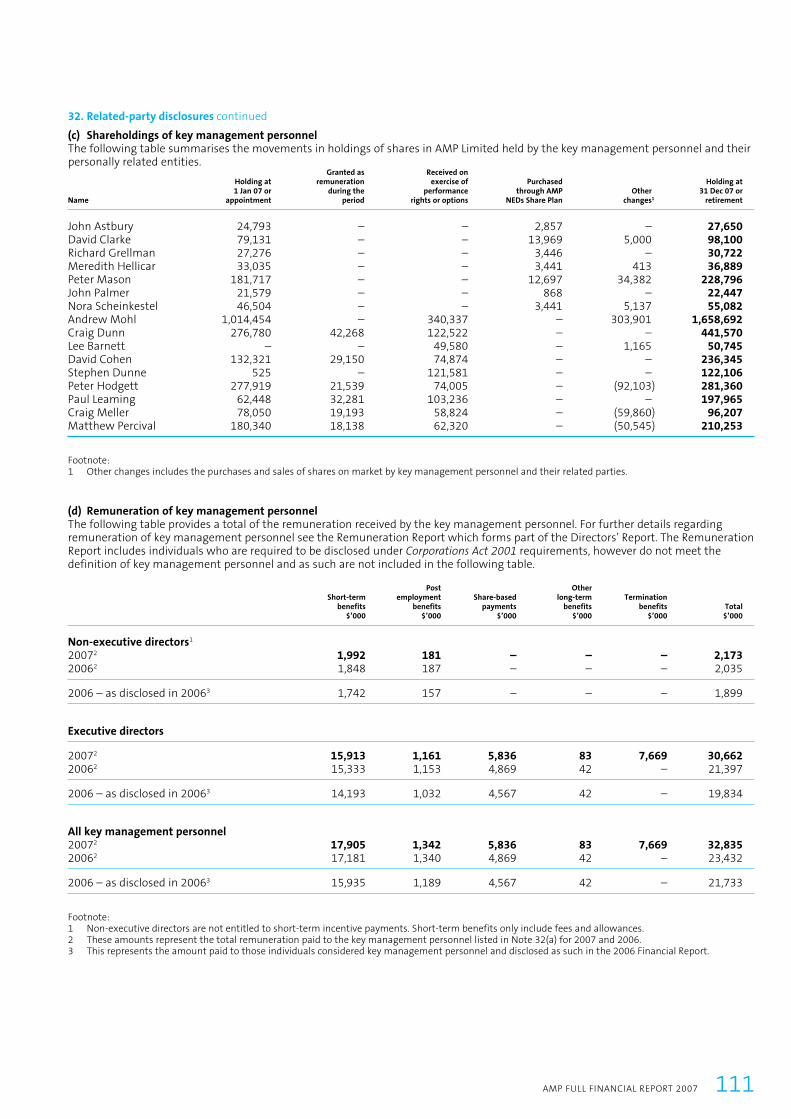
32. Related-party disclosures continued
(c) Shareholdings of key management personnelThe following table summarises the movements in holdings of shares in AMP Limited held by the key management personnel and their personally related entities. Granted as Received on Holding at remuneration exercise of Purchased Holding at 1 Jan 07 or during the performance through AMP Other 31 Dec 07 or Name appointment period rights or options NEDs Share Plan changes1 retirement
John Astbury 24,793 – – 2,857 – 27,650 David Clarke 79,131 – – 13,969 5,000 98,100 Richard Grellman 27,276 – – 3,446 – 30,722 Meredith Hellicar 33,035 – – 3,441 413 36,889 Peter Mason 181,717 – – 12,697 34,382 228,796 John Palmer 21,579 – – 868 – 22,447 Nora Scheinkestel 46,504 – – 3,441 5,137 55,082 Andrew Mohl 1,014,454 – 340,337 – 303,901 1,658,692 Craig Dunn 276,780 42,268 122,522 – – 441,570 Lee Barnett – – 49,580 – 1,165 50,745 David Cohen 132,321 29,150 74,874 – – 236,345 Stephen Dunne 525 – 121,581 – – 122,106 Peter Hodgett 277,919 21,539 74,005 – (92,103) 281,360 Paul Leaming 62,448 32,281 103,236 – – 197,965 Craig Meller 78,050 19,193 58,824 – (59,860) 96,207 Matthew Percival 180,340 18,138 62,320 – (50,545) 210,253
Footnote:1 Other changes includes the purchases and sales of shares on market by key management personnel and their related parties.
(d) Remuneration of key management personnelThe following table provides a total of the remuneration received by the key management personnel. For further details regarding remuneration of key management personnel see the Remuneration Report which forms part of the Directors’ Report. The Remuneration Report includes individuals who are required to be disclosed under Corporations Act 2001 requirements, however do not meet the definition of key management personnel and as such are not included in the following table.
Post Other Short-term employment Share-based long-term Termination benefits benefits payments benefits benefits Total $’000 $’000 $’000 $’000 $’000 $’000
Non-executive directors1 20072 1,992 181 – – – 2,173 20062 1,848 187 – – – 2,035
2006 – as disclosed in 20063 1,742 157 – – – 1,899
Executive directors
20072 15,913 1,161 5,836 83 7,669 30,662 20062 15,333 1,153 4,869 42 – 21,397
2006 – as disclosed in 20063 14,193 1,032 4,567 42 – 19,834
All key management personnel 20072 17,905 1,342 5,836 83 7,669 32,835 20062 17,181 1,340 4,869 42 – 23,432
2006 – as disclosed in 20063 15,935 1,189 4,567 42 – 21,733
Footnote:1 Non-executive directors are not entitled to short-term incentive payments. Short-term benefits only include fees and allowances.2 These amounts represent the total remuneration paid to the key management personnel listed in Note 32(a) for 2007 and 2006.3 This represents the amount paid to those individuals considered key management personnel and disclosed as such in the 2006 Financial Report.
AMP FULL FINANCIAL REPORT 2007 111

32. Related-party disclosures continued
(e) Transactions with key management personnelDuring the year, key management personnel and their personally related entities have entered into transactions with the disclosing entity or its subsidiaries. All such transactions have occurred within a normal employee, customer or supplier relationship on terms and conditions no more favourable than those that it is reasonable to expect AMP would have adopted if dealing at arm’s length with an unrelated individual. These transactions include:– normal personal banking with AMP Bank Limited including the provision of credit cards– the purchase of AMP insurance and investment products– fi nancial investment services.
Information about such transactions does not have the potential to affect adversely decisions about the allocation of scarce resources made by users of this Financial Report, or the discharge of accountability by the specifi ed executives or specifi ed directors.
The following tables provide details of loans made to key management personnel by AMP or any of its subsidiaries.
All loans to key management personnel Balance Net advances Balance at Interest Interest 1 Jan 07 Written off (repayments) 31 Dec 07 charged not charged Number $’000 $’000 $’000 $’000 $’000 $’000 in group
Key management personnel1 7,814 – 496 8,310 606 – 5
Individuals with loans above $100,000 during reporting period Highest Balance Net advances Balance at Interest Interest indebtedness 1 Jan 07 Written off (repayments) 31 Dec 07 charged not charged in period $’000 $’000 $’000 $’000 $’000 $’000 $’000
Andrew Mohl 4,455 – 381 4,836 342 – 4,935 Stephen Dunne 950 – 250 1,200 83 – 1,208 Lee Barnett 296 – 469 765 49 – 777 Craig Meller 2,081 – (594) 1,487 130 – 2,254
Footnote:1 All loans to key management personnel are on terms no more favourable than those that it is reasonable to expect AMP would have adopted if dealing at
arm’s length with an unrelated individual. No guarantees are given or received in relation to these loans.
(f) Other related-party transactionsAMP controlled entities provide management services to associated unit trusts at normal commercial rates. Shares and other financial securities have been traded between AMP and respective trusts at market value. AMP controlled entities provide management services to operating trusts with fees determined on a cost recovery basis. Interests held in associated entities (including percentage ownership) are set out in Note 29.
112 AMP FULL FINANCIAL REPORT 2007
for the year ended 31 December 2007
Notes to the fi nancial statements continued

33. Auditors’ remuneration Consolidated Parent
2007 2006 2007 2006 $’000 $’000 $’000 $’000
Amounts received or due and receivable by Auditors of AMP Limited for: Auditing the fi nancial statements of AMP Limited and its controlled entities Half year review 500 500 – – Full year audit 3,950 3,600 140 140
Total financial statement audits 4,450 4,100 140 140 Other audit services Audit of trusts and superannuation funds 3,153 2,274 – – Audit of statutory returns 439 242 – – Other audit work1 1,140 1,736 – –
Total other audit services 4,732 4,252 – –
Total audit services 9,182 8,352 140 140
Technical advice 10 – – – Independent accountant’s report – – – – Other assurance services2 1,209 1,567 – –
Total assurance related services 1,219 1,567 – – Other services Transaction support 100 4 – – Tax and compliance advice 89 136 – – Actuarial assistance – – – – Other services 74 124 – –
Total other services 263 264 – –
Total non audit services 1,482 1,831 – –
Total amounts received or due and receivable by Auditors of AMP Limited3,4 10,664 10,183 140 140
Footnote:1 Other audit work includes fees for reviews of the full year and half year Investor Reports, compliance audits and other audit procedures performed for
multiple investment vehicles owned by the life statutory funds.2 Other assurance services includes fees for fund prospectus reviews, AMP Bank securitisation opinions and other procedures performed for multiple
investment vehicles owned by the life statutory funds. In the comparative period the amount includes fees attributable to a significant review of investment pricing systems.
3 Includes fees paid to Ernst & Young affiliates overseas.4 Periodically, the AMP group gains control of entities whose incumbent auditor is an audit firm other than Ernst & Young. In addition to the audit fees paid
to Ernst & Young for auditing the AMP group, immaterial audit fees are also paid to these non-Ernst & Young audit firms in relation to the audits of those periodically controlled entities. The non-Ernst & Young audit firms are also independently contracted to provide other services to other controlled entities of the AMP group, unrelated to their audit work.
34. Events occurring after reporting date
At the date of this report, the directors are not aware of any matter or circumstance that has arisen since the end of the period which has signifi cantly affected or may signifi cantly affect the operations of the consolidated entity, the results of its operations or its state of affairs, which is not already refl ected in this report other than the following.
DividendsOn 14 February 2008, AMP proposed a final dividend on ordinary shares.
AMP FULL FINANCIAL REPORT 2007 113

In accordance with a resolution of the directors of AMP Limited, we state for the purposes of Section 295(4) of the Corporations Act 2001 that, in the opinion of the directors:(a) The fi nancial statements and the notes to the fi nancial statements comply with the accounting standards; (b) The fi nancial statements and notes give a true and fair view of the fi nancial position and performance of the company and the
consolidated entity for the fi nancial year ended 31 December 2007;(c) There are reasonable grounds to believe that the company will be able to pay its debts as and when they become due and payable; (d) The fi nancial statements and notes are in accordance with the Corporations Act 2001 (Cth), including Section 296 (compliance with
accounting standards) and Section 297 (true and fair view); and(e) The directors have been given the declarations required by Section 295A of the Corporations Act 2001 (Cth).
Peter Mason Craig DunnChairman Managing Director and Chief Executive Offi cer
Sydney, 14 February 2008
114 AMP FULL FINANCIAL REPORT 2007
for the year ended 31 December 2007
Directors’ declaration
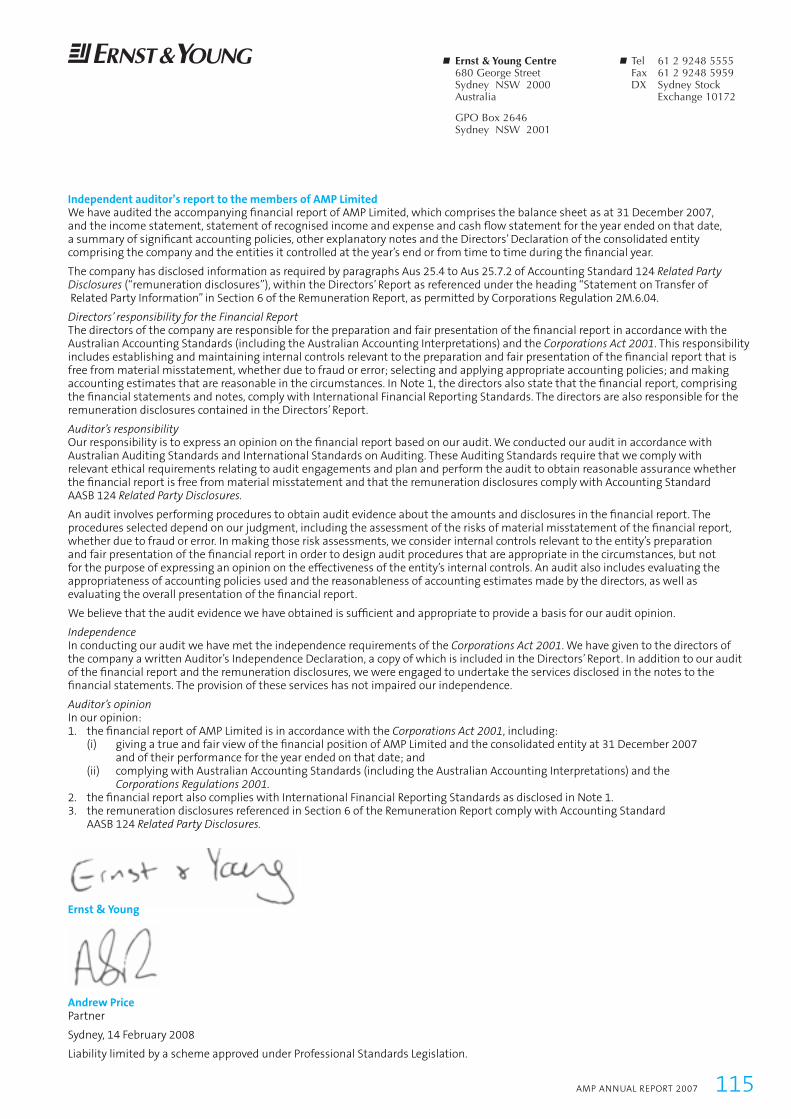
Independent auditor’s report to the members of AMP LimitedWe have audited the accompanying fi nancial report of AMP Limited, which comprises the balance sheet as at 31 December 2007, and the income statement, statement of recognised income and expense and cash fl ow statement for the year ended on that date, a summary of signifi cant accounting policies, other explanatory notes and the Directors’ Declaration of the consolidated entity comprising the company and the entities it controlled at the year’s end or from time to time during the fi nancial year.
The company has disclosed information as required by paragraphs Aus 25.4 to Aus 25.7.2 of Accounting Standard 124 Related Party Disclosures (“remuneration disclosures”), within the Directors’ Report as referenced under the heading “Statement on Transfer of Related Party Information” in Section 6 of the Remuneration Report, as permitted by Corporations Regulation 2M.6.04.
Directors’ responsibility for the Financial ReportThe directors of the company are responsible for the preparation and fair presentation of the fi nancial report in accordance with the Australian Accounting Standards (including the Australian Accounting Interpretations) and the Corporations Act 2001. This responsibility includes establishing and maintaining internal controls relevant to the preparation and fair presentation of the fi nancial report that is free from material misstatement, whether due to fraud or error; selecting and applying appropriate accounting policies; and making accounting estimates that are reasonable in the circumstances. In Note 1, the directors also state that the fi nancial report, comprising the fi nancial statements and notes, comply with International Financial Reporting Standards. The directors are also responsible for the remuneration disclosures contained in the Directors’ Report.
Auditor’s responsibilityOur responsibility is to express an opinion on the fi nancial report based on our audit. We conducted our audit in accordance with Australian Auditing Standards and International Standards on Auditing. These Auditing Standards require that we comply with relevant ethical requirements relating to audit engagements and plan and perform the audit to obtain reasonable assurance whether the fi nancial report is free from material misstatement and that the remuneration disclosures comply with Accounting Standard AASB 124 Related Party Disclosures.
An audit involves performing procedures to obtain audit evidence about the amounts and disclosures in the fi nancial report. The procedures selected depend on our judgment, including the assessment of the risks of material misstatement of the fi nancial report, whether due to fraud or error. In making those risk assessments, we consider internal controls relevant to the entity’s preparation and fair presentation of the fi nancial report in order to design audit procedures that are appropriate in the circumstances, but not for the purpose of expressing an opinion on the effectiveness of the entity’s internal controls. An audit also includes evaluating the appropriateness of accounting policies used and the reasonableness of accounting estimates made by the directors, as well as evaluating the overall presentation of the fi nancial report.
We believe that the audit evidence we have obtained is suffi cient and appropriate to provide a basis for our audit opinion.
IndependenceIn conducting our audit we have met the independence requirements of the Corporations Act 2001. We have given to the directors of the company a written Auditor’s Independence Declaration, a copy of which is included in the Directors’ Report. In addition to our audit of the fi nancial report and the remuneration disclosures, we were engaged to undertake the services disclosed in the notes to the fi nancial statements. The provision of these services has not impaired our independence.
Auditor’s opinionIn our opinion: 1. the fi nancial report of AMP Limited is in accordance with the Corporations Act 2001, including: (i) giving a true and fair view of the fi nancial position of AMP Limited and the consolidated entity at 31 December 2007
and of their performance for the year ended on that date; and (ii) complying with Australian Accounting Standards (including the Australian Accounting Interpretations) and the
Corporations Regulations 2001.2. the fi nancial report also complies with International Financial Reporting Standards as disclosed in Note 1.3. the remuneration disclosures referenced in Section 6 of the Remuneration Report comply with Accounting Standard
AASB 124 Related Party Disclosures.
Ernst & Young
Andrew PricePartner
Sydney, 14 February 2008
Liability limited by a scheme approved under Professional Standards Legislation.
Ernst & Young Centre680 George StreetSydney NSW 2000Australia
Tel 61 2 9248 5555Fax 61 2 9248 5959DX Sydney Stock Exchange 10172
GPO Box 2646Sydney NSW 2001
AMP ANNUAL REPORT 2007 115

116 AMP AnnuAl REPORT 2007
Shareholder information
Distributionofshareholdingsat29February2008Range Numberofholders Units %ofissuedcapital
1–1000 637,420 254,469,997 13.57281,001–5,000 178,495 358,378,331 19.11505,001–10,000 15,314 109,254,613 5.827410,001–100,000 7,292 151,986,945 8.1066100,001 and over 274 1,000,763,189 53.3782
Totals 838,795 1,874,853,075 100
The total number of shareholders holding less than a marketable parcel of 63 is 35,533.
Twentylargestshareholdingsasat29February2008Rank Nameandaccount Ordinaryshares %ofissuedcapital
1 HSBC Custody nominees (Australia) limited 297,033,412 15.842 JP Morgan nominees Australia limited 259,118,377 13.823 national nominees limited 134,513,055 7.174 Citicorp nominees Pty limited 95,535,259 5.095 AnZ nominees limited <Cash Income A/C> 35,701,576 1.906 Cogent nominees Pty limited 29,874,381 1.597 Queensland Investment Corporation 17,518,517 0.938 AMP life limited 17,347,852 0.939 PSS Board 11,145,082 0.5910 Australian Foundation Investment Company limited 9,531,388 0.5111 ARGO Investments limited 6,780,954 0.3612 RBC Global Services Australia nominees Pty limited 5,514,359 0.2913 Merrill lynch (Australia) nominees Pty limited 3,998,382 0.2114 uBS Private Clients Australia nominees Pty ltd 3,903,713 0.2115 Djerriwarrh Investments limited 3,245,072 0.1716 AMP Foundation limited 2,126,387 0.1117 Bond Street Custodians limited 2,011,072 0.1118 Blackrock Investment Mgt <separately managed accounts> 1,594,342 0.0919 Carramar Pty ltd 1,550,000 0.0820 IAG nominees Pty limited 1,503,840 0.08
Totals 939,547,020 50.08
SubstantialshareholdersThe Company has received no substantial shareholding notices.
TotalnumberofholdersofordinarysharesandtheirvotingrightsAs at 29 February 2008, the share capital of AMP limited consisted of 1,874,853,075 ordinary shares held by 838,795 holders. The voting rights attaching to the shares are that each registered holder of shares present in person (or by proxy, attorney or representative) at a meeting of shareholders has one vote on a vote taken by a show of hands, and one vote for each fully paid share held on a vote taken on a poll.
TotalnumberofoptionsoverunissuedsharesandoptionholdersAs at 29 February 2008, AMP limited had on issue 3,919,176 options over unissued ordinary shares in AMP limited held by 2,586 option holders.
StockexchangelistingsAMP limited is listed on the Australian Stock Exchange and on the new Zealand Stock Exchange.
RestrictedsecuritiesThere are no restricted securities on issue.
Buy-backThere is no current on-market buy-back.

Glossary
Closed bookA book of business that is not open to new customers.
CommutationA settlement agreement reached between two or more parties that effectively terminates the obligation under an insurance/reinsurance contract.
Contingent liabilitiesA situation existing at balance date, where a potential future claim may occur, but the liability is not suffi ciently probable or reliably measurable to warrant recognition in the fi nancial statements at balance date.
Controllable costsCosts that AMP incurs in running its business. Controllable costs include operational and project costs, but exclude variable distribution costs, investment management fees and interest on group debt.
Cost to income ratioA measure of the proportion of earnings used to pay AMP’s controllable costs.
DemergerAMP’s demerger on 23 December 2003 created separate businesses; AMP in Australasia and HHG (now called Henderson Group) in the United Kingdom.
Earnings per share (EPS)This represents the profi t made by AMP, divided by the number of shares on issue.
Embedded value (EV)A calculation for the AFS business of the value of the shareholder equity and the future profi ts expected to emerge from the business currently in-force. The value is expressed in today’s dollars.
Franked dividendsDividends paid which have franking credits attached. The franking credits represent the income tax paid by the company paying the dividend, which can be used as a tax credit by Australian resident shareholders receiving the dividend.
Investment performanceA measure of how well we manage funds on behalf of our customers. The percentage of Australian assets managed by AMP which met or exceeded their respective benchmarks for the year.
Long-term incentiveA long-term incentive is an award usually provided in the form of equity, such as performance rights or restricted shares, to align an executive’s interest with long-term company performance. Long-term incentives at AMP are subject to a performance hurdle and/or a service requirement.
Mismatch itemsUnder accounting standards, accounting mismatches arise because the recognition and measurement rules for certain policyholder assets differ from the recognition and measurement rules for the actual liability to policyholders in respect of the same assets. Mismatch items have no impact on the group’s underlying profi t, cash fl ow or value.
Operating earningsOperating earnings are the profi ts earned by AMP’s operating businesses. Operating earnings exclude investment income on funds held as capital within AMP’s operating businesses.
OptionA right to acquire an AMP share at a pre-determined price during an exercise period, subject to meeting performance hurdles. AMP has not offered options under its Employee or Executive Option Plans since 2002.
Performance rightThis is a form of executive remuneration designed to reward long-term performance. Performance rights are a contractual promise to deliver a pre-set number of AMP shares at the end of a three-year performance period, as long as a specifi c performance hurdle is met.
Restricted share This is a form of remuneration designed to reward long-term performance. A restricted share is an ordinary AMP share that has a holding lock in place until a three-year vesting period ends.
Return on invested capital (RoIC)Is the return that shareholders have earned on the capital invested in our businesses.
Short-term incentiveA cash payment based on performance during the year against pre-defi ned business objectives aligned to company strategy.
Underlying profitUnderlying profi t (which smoothes out the effect of investment market volatility) is calculated by aggregating operating earnings, corporate costs, interest expense on group debt, earnings from discontinued businesses, recognition of tax losses and underlying investment income. Underlying investment income is based on average long-term rates of return. Actual investment income can be higher or lower than the long-term rate from year to year.
Underlying return on equity (RoE)A measure of the return a company makes on shareholder equity. Calculated as underlying profi t divided by average monthly shareholder equity during the year.
Value of new business (VNB)A measure for the AFS business of the future profi ts (expressed in today’s dollars) expected to emerge from new business written during the year.
VestingRemuneration term defi ning the point at which any performance hurdles have been met and a fi nancial benefi t may be realised by the recipient.

NS1
247
03/0
8
Need help? Contact the AMP Share Registry
Email [email protected] www.amp.com.au/shareholdercentre
Australia AMP Share Registry Reply Paid 2980 MELBOURNE VIC 8060Phone 1300 654 442Fax 1300 301 721
New Zealand AMP Share RegistryPO Box 91543 Victoria Street WestAUCKLAND 1142
Phone 0800 448 062Fax 09 488 8787
Other countries AMP Share Registry GPO Box 2980 MELBOURNE VIC 3001 AUSTRALIAPhone +613 9415 4051Fax +612 8234 5002
Registered office of AMP LimitedLevel 24, 33 Alfred Street, Sydney NSW 2000, AustraliaPhone +612 9257 5000Fax +612 9257 7178
AMP is incorporated and domiciled in AustraliaBoard Executive and Company Secretary: Sharyn Page


![BIO-MEDICAL-ELECTRONICS, OPERATIONAL-AMPLIFIER’S[or OP-AMP’s], BIO-MEDICAL-DESINING-PROBLEMS-WITH OP-AMP’s, PART-2-OF-5](https://static.documents.pub/doc/80x56/577ce6951a28abf103932234/bio-medical-electronics-operational-amplifiersor-op-amps-bio-medical-desining-problems-with.jpg)


