Page 1
© Crown copyright Met Office© Crown copyright Met Office
Vicky Pope input from Brian Golding, Nigel Roberts, Clive Pierce, Peter Buchanan
May 2012
Met Office work and future research relevant to flooding
Page 2
© Crown copyright Met Office
Carlisle Flood 2005 - Observed & Forecast Accumulations
12 km
4 km 1 km
Hand analysis of gauges and radar
12 km 1 km
Model Orography
Page 3
© Crown copyright Met Office
Coupling to hydrological models
Flood warning level
Flow forecasts using 1 km model rainfall is of similar quality to those using observed rain rain gauges.
Nigel Roberts, Richard Forbes (MetO) Steve Cole & Bob Moore (CEH) Wallingford Dan Boswell (EA) Northwest Met. Apps., In Press
- Observed flow- Raingauge- 1km model- 4km model- 12km model
7th Jan 2005 Caldew
9am
3pm
Page 4
© Crown copyright Met Office© Crown copyright Met Office
Insufficient ensemble size leaves gapsConstructing a probability forecast
12 member 2.2km resolution ensemble forecast
Page 5
© Crown copyright Met Office© Crown copyright Met Office
Constructing a probability forecast
12 member 2.2km resolution ensemble forecast
Probability of rain in period around the time of interest
Page 6
© Crown copyright Met Office
User requirement
• High resolution ensemble precipitation forecast with a range of ~2 days for pluvial & fluvial flood prediction and warning
• ≤ 2 km resolution
• rapid update nowcast
• 50-100 members
Page 7
© Crown copyright Met Office
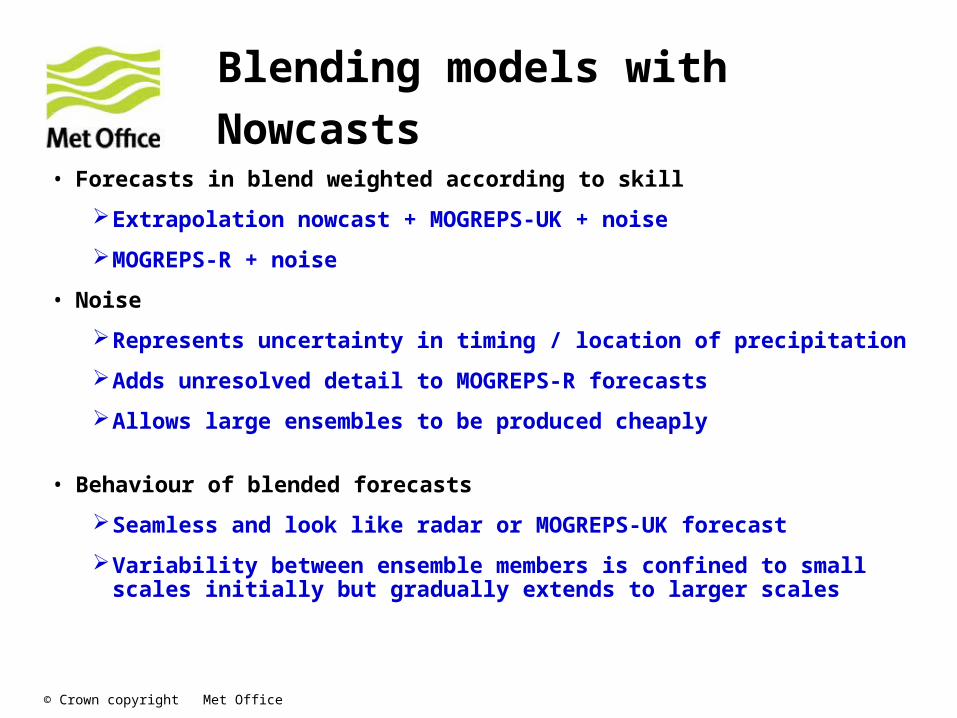
• Forecasts in blend weighted according to skill
Extrapolation nowcast + MOGREPS-UK + noise
MOGREPS-R + noise
• Noise
Represents uncertainty in timing / location of precipitation
Adds unresolved detail to MOGREPS-R forecasts
Allows large ensembles to be produced cheaply
• Behaviour of blended forecasts
Seamless and look like radar or MOGREPS-UK forecast
Variability between ensemble members is confined to small scales initially but gradually extends to larger scales
Blending models with Nowcasts
Page 8
© Crown copyright Met Office
Enhancing our rainfall prediction capability
Current
• Met office Global and Regional Ensemble Prediction System – MOGREPS:
• 60km and 18km
• UKV single forecast
• 1.5km
• Ensemble Nowcasts
New
• UK Ensemble Prediction System – MOGREPS-UK
• 2.2km 12 member ensemble -
• Blending with ensemble Nowcasts
Page 9
© Crown copyright Met Office
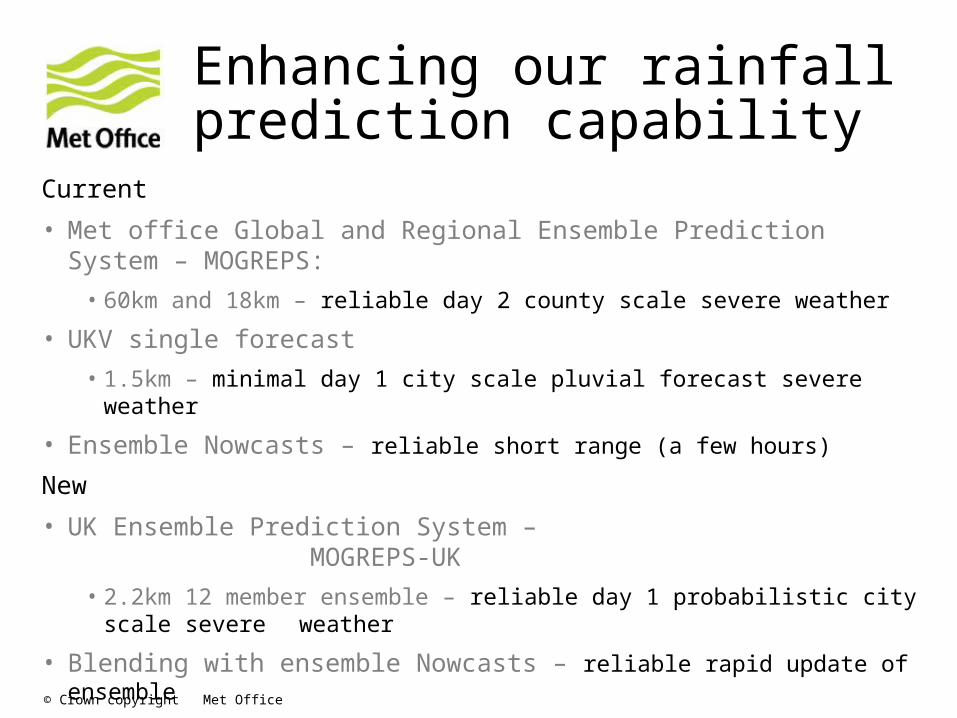
Enhancing our rainfall prediction capability
Current
• Met office Global and Regional Ensemble Prediction System – MOGREPS:
• 60km and 18km – reliable day 2 county scale severe weather
• UKV single forecast
• 1.5km – minimal day 1 city scale pluvial forecast severe weather
• Ensemble Nowcasts – reliable short range (a few hours)
New
• UK Ensemble Prediction System – MOGREPS-UK
• 2.2km 12 member ensemble – reliable day 1 probabilistic city scale severe weather
• Blending with ensemble Nowcasts – reliable rapid update of ensemble
Page 10
© Crown copyright Met Office
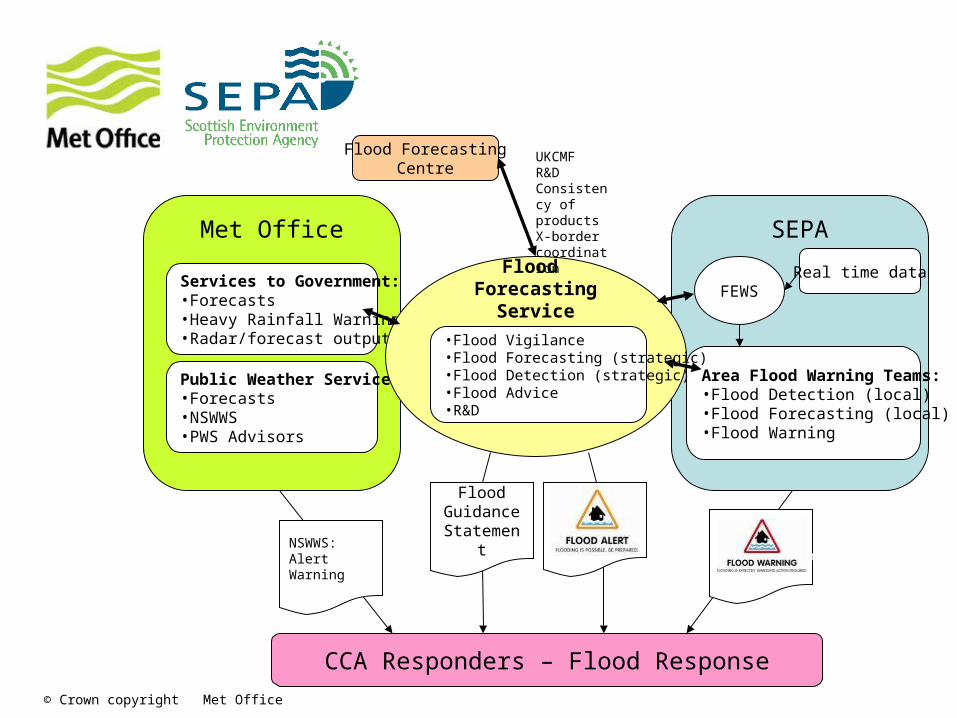
SEPA
Area Flood Warning Teams:•Flood Detection (local)•Flood Forecasting (local)•Flood Warning
Real time dataFEWS
Met Office
Services to Government:•Forecasts•Heavy Rainfall Warnings•Radar/forecast output
Public Weather Service:•Forecasts•NSWWS•PWS Advisors
CCA Responders – Flood Response
Flood ForecastingCentre
NSWWS:AlertWarning
Flood Warning
Forecasts and Alerts under contract
Flood Forecasting Service
•Flood Vigilance•Flood Forecasting (strategic)•Flood Detection (strategic)•Flood Advice•R&D
UKCMFR&DConsistency of productsX-border coordination
Flood GuidanceStatement
Page 11
© Crown copyright Met Office© Crown copyright Met Office
Questions
Page 12
© Crown copyright Met Office© Crown copyright Met Office
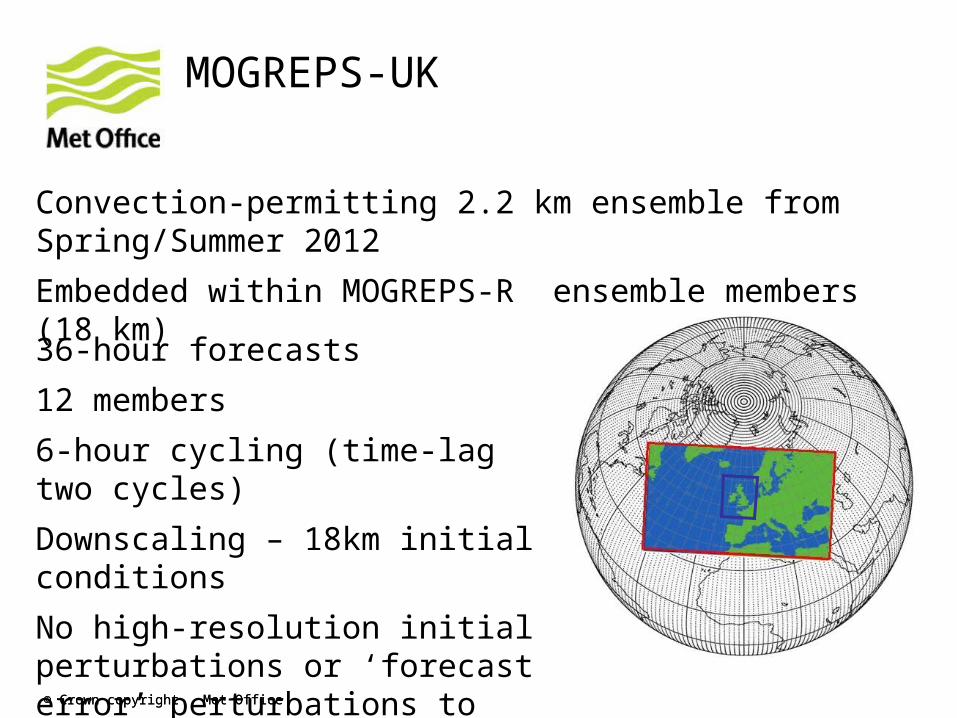
Convection-permitting 2.2 km ensemble from Spring/Summer 2012
Embedded within MOGREPS-R ensemble members (18 km)
MOGREPS-UK
36-hour forecasts
12 members
6-hour cycling (time-lag two cycles)
Downscaling – 18km initial conditions
No high-resolution initial perturbations or ‘forecast error’ perturbations to start with
Page 13
© Crown copyright Met Office
Sector / Capability Enabler Option 2009 2010 2011 2012 2013 2014
Reliable Day 2 county scale forecast of severe weather
16 km 48hr NAE ensemble
C
● ● ● ● ● ● ● ● ●
Minimal Day 1 city scale pluvial forecast of severe weather
Single 1.5 km model
C
● ● ● ● ● ● ● ● ●
Reliable Day 3-4 county scale forecast of severe weather
12 km T+120 NAE ensemble
C
● ●
Reliable Day 1 probabilistic city scale forecast of severe weather risk
1.5 km (now 2.2km) ensemble
C
● ●
Hourly 12-hour nowcasts of severe weather
Hourly 1.5km nowcast
C
Reliable Day 1 probabilistic town scale forecast
800m ensemble
C
High Performance Computing upgrade benefits forecast
█ insufficient computer power, █ research, █ real-time trialling, • operational
Page 14
© Crown copyright Met Office
Coupling to hydrological models
Flood warning level
Flow forecasts using 1 km model rainfall is of similar quality to those using observed rain rain gauges.
Nigel Roberts, Richard Forbes (MetO)Steve Cole & Bob Moore (CEH) WallingfordDan Boswell (EA) NorthwestMet. Apps., In Press
Page 15
© Crown copyright Met Office
55 mm 55 mm 96 mm
Highest 6-hour totals
x x x
MOGREPS-R output: 18 km model (top) UKV 6-hour accumulations:1.5 km model (bottom)
Computed on 4.5km grid – Changgui Wang Nigel Roberts
30/10/08
Page 16
© Crown copyright Met Office
Convective-scale ensembles
w
950 hPa
Ottery-St-Mary storm
○ 1.5km model storms
Page 17
© Crown copyright Met Office
All pixels exceeding critical thresholds 1.5km model
Computed on 4.5km grid – Changgui Wang
‘Extreme’ threshold for surface water flooding
1 in 30 years
1 in 10 years
Nigel Roberts
Page 18
© Crown copyright Met Office
Ottery-St-Mary flood event Probability of getting the top 1% or 5% of rainfall amounts. Peak values exceeded extreme rainfall thresholds. Produced from 24 forecasts from the 1.5 km UKV model. X marks Ottery.
Page 19
© Crown copyright Met Office
Probability of an ‘extreme’ event within 36x36km squares
Traditional clustering method found wanting – weighted sampling should be better
Nigel Roberts
Page 20
© Crown copyright Met Office
How about other situations
5-6th September 2008
Morpeth flood
Northumberland
Probability of exceeding 100 mm in 18 hours within 10 miles of each pixel
Frontal, orographically enhanced rain
More predictable
Likewise – Cumbria floods
Probability of more than 100 mm of rain in 18 hours within 10 miles of any location
Page 21
© Crown copyright Met Office
Morpeth flood event 5-6 Sept 2008
Probability of exceeding 50mm in 17 hours
UKV 24 members 2.2km 24 members
Neighbourhood 13.5 x 13.5 km (3x4.5km pixels)
Page 22
© Crown copyright Met Office
Using the ensemble for probabilities
Page 23
© Crown copyright Met Office
Maximum 3hr rainfall total within 10 and 25km from Edinburgh for each UKV2.2. member.
How many ‘extreme’ totals near to Edinburgh ?
40 mm in 3 hours - surface water flooding likely (especially urban) Halcrow report – used for Extreme Rainfall Alerts
Page 24
© Crown copyright Met Office
Cartoon time
training notestraining notes
Impact
Useful forecast? Probabilities can be tricky
Communication Partnership
Page 25
© Crown copyright Met Office© Crown copyright Met Office
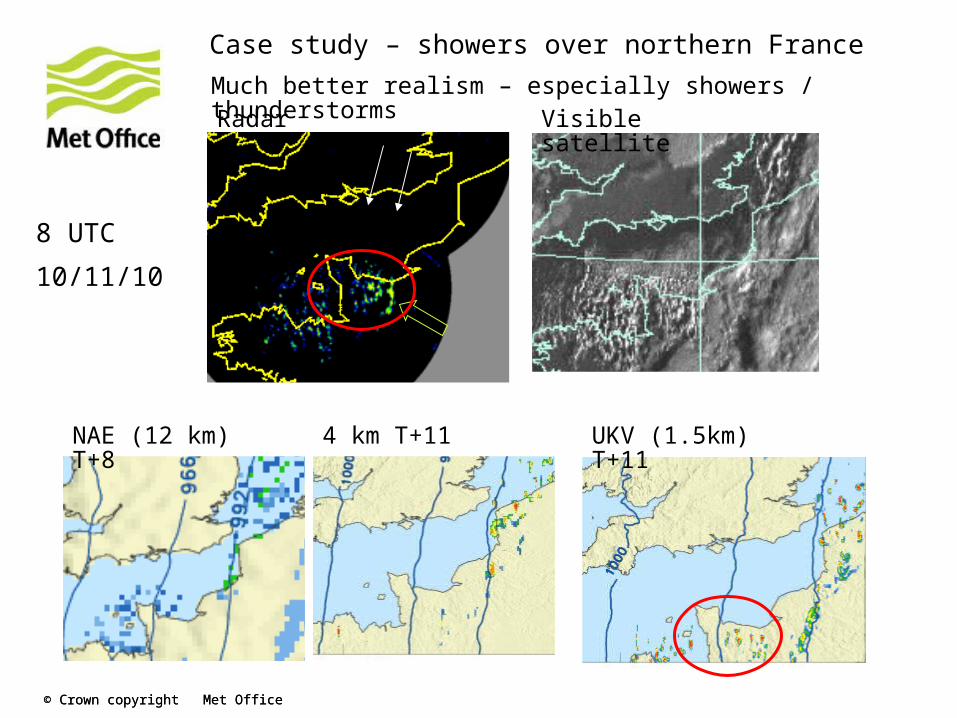
Case study – showers over northern France
Radar Visible satellite
NAE (12 km) T+8 4 km T+11 UKV (1.5km) T+11
8 UTC
10/11/10
Much better realism – especially showers / thunderstorms
Page 26
© Crown copyright Met Office© Crown copyright Met Office
Does higher resolution give more skilful forecasts?
Apparently not! What’s going on?
April to Oct 2010
Equitable Threat Score (ETS)
Using gauges
M Mittermaier, N Roberts & S Thompson submitted to Met Apps
UKV 1.5 km
UK 4 km
NAE 12 km
Global ~25 km
Marion Mittermaier
Page 27
© Crown copyright Met Office© Crown copyright Met Office
Misplaced by ~35 km
Misplaced by ~30 km
(better)
NAE 12 km compared to 4 km
4 km
NAE
1.5 km is better again
M Mittermaier, N Roberts & S Thompson submitted to Met AppsMarion Mittermaier
90th percentile
T+24 6-hour accumulation
Page 28
© Crown copyright Met Office© Crown copyright Met Office
Schwartz et al 2009 Oklahoma Univ + NOAA
2-month period
Next day forecasts hourly accumulations
- a big ask!
What about in the US?
Big storms, unhelpful topography, difficult thresholds
100 km75 km 125 km
150 km 200 km >300 km
Page 29
© Crown copyright Met Office© Crown copyright Met Office
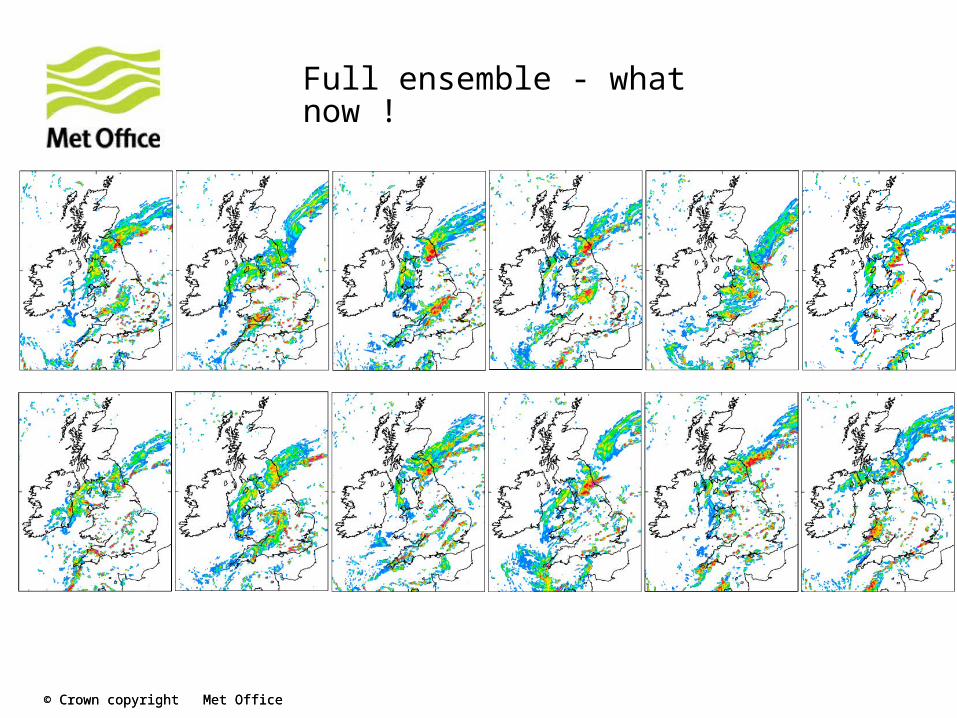
New Met Office 12-member 2.2 km ensemble
Case study – three of the members T+24
Embedded within MOGREPS-R 18 km ensemble (Bowler et al 2008)
Giovanni Leoncini , Changgui Wang, Sarah Beare, Neill Bowler
Page 30
© Crown copyright Met Office© Crown copyright Met Office
Full ensemble - what now !
Page 31
© Crown copyright Met Office© Crown copyright Met Office
Insufficient ensemble size leaves gaps
Constructing a probability forecast
Page 32
© Crown copyright Met Office© Crown copyright Met Office
Constructing a probability forecast
Probability of rain in period around the time of interest
Page 33
© Crown copyright Met Office
Outline
• Long term progress: Verification of surface pressure
• Recent progress: Carlisle, Cockermouth & Cornwall
• Routine rainfall verification
• The Fractions Skill Score
Page 34
© Crown copyright Met Office
Long term progress in reducing forecast errors
RMS surface pressure error over the NE Atlantic
© Crown copyright Met Office
Page 35
© Crown copyright Met Office
International comparisons12-month running mean RMS error of Northern
Hemisphere MSLP in Pa
100
150
200
250
300
350
400
2003
01
2004
01
2005
01
2006
01
2007
01
2008
01
2009
01
2010
01
2011
01
Met OfficeECMWFUSAFranceGermanyJapanCanada
Page 36
© Crown copyright Met Office
Carlisle Flood 2005 - Observed & Forecast Accumulations
12 km
4 km 1 km
Hand analysis of gauges and radar
12 km 1 km
Model Orography
Page 37
© Crown copyright Met Office
Coupling to hydrological models
Flood warning level
Flow forecasts using 1 km model rainfall is of similar quality to those using observed rain rain gauges.Nigel Roberts, Richard Forbes
(MetO)
Steve Cole & Bob Moore (CEH) Wallingford
Dan Boswell (EA) Northwest
Met. Apps., In Press
Page 38
© Crown copyright Met Office
Cumbria flood 2009: 2-day forecast Probability of exceeding 50mm in 24hrs
Page 39
© Crown copyright Met Office
Cumbria flood 2009: Extreme Rainfall Alert to emergency services
Issued 2131 UTC 18/11/2009
Page 40
© Crown copyright Met Office
UK4 vs UK1.5 accumulations for Cumbrian floods 2009
Page 41
The Cornish Floods, November 2010: 8-hour rainfall totals
RadarUK1.5UK4
© Crown copyright Met Office
Page 42
© Crown copyright Met Office
The ‘Morpeth Flood’, 06/09/2008Prototype 1.5 km forecast
12 km L50
1.5 km L70
‘Morpeth flood’06/09/2008
Provisional NCIC 3 day totals
Morpeth
0600 UTC
Page 43
© Crown copyright Met Office
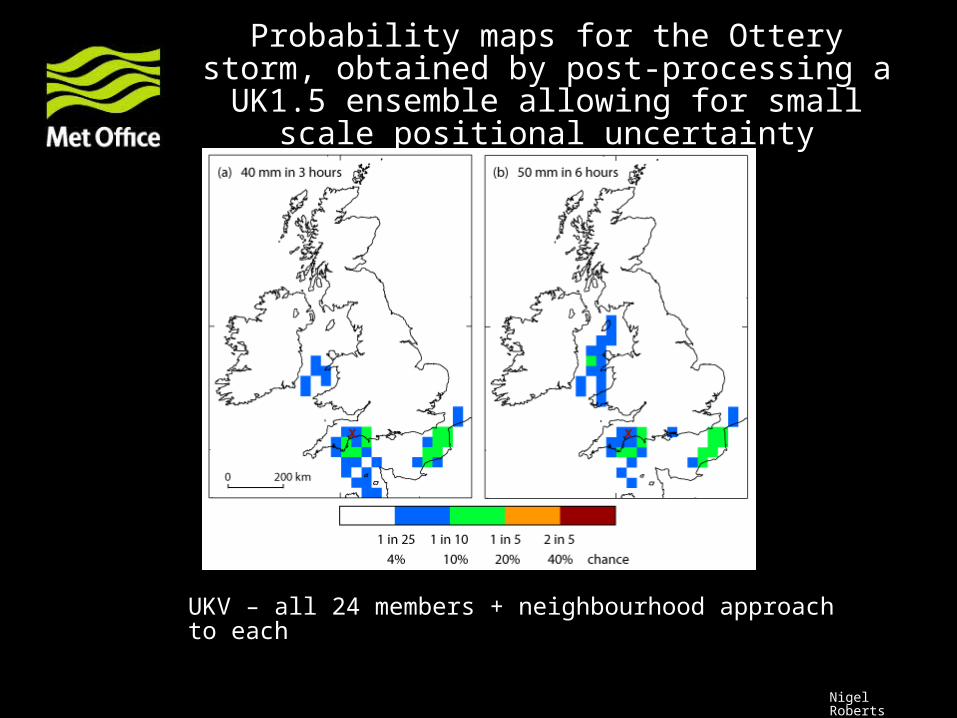
Probability maps for the Ottery storm, obtained by post-processing a UK1.5 ensemble allowing
for small scale positional uncertainty
UKV – all 24 members + neighbourhood approach to each
Nigel Roberts
Page 44
© Crown copyright Met Office
Precipitation verification summary
• Existing scores sensitive to frequency. Significance gets worse the higher the threshold.
• New scores allow for positional uncertainty & represent skill better, but are sensitive to radar biases.
• Current scores at low thresholds match timeline document & HPC case.
• Predictability depends on precip mechanism. More frontal & orographic events in 2007-9 enhanced the scores.
• Benefits of 4km convincingly demonstrated. Benefits of 1.5km smaller, but model still being optimised.
Page 45
© Crown copyright Met Office
Lead time
Model/grid QPF Capability: space/time scales represented accurately
Contribution to flood prediction
0-1hr Radar/STEPS1km/2km
Rate, accumulation & type for existing storms. 5km / 10min
Distributed small catchment models with response > ~2hrs; Lead time too short for pluvial.
1-3hr STEPS2km
Rate, accumulation, type for existing storms. Prob of exceeding threshold accum.15km/ 40min
Small catchment models > 400km2. Pluvial flooding areas.
3-12hr STEPS/UK42km/4km
Accumulation & type. Prob of exceeding threshold accum. 40km/ 2hr
Catchment models >1600 km2. Alert of pluvial / flash floods in smaller catchments.
12-36hr UK4/ MOGREPS-R4km/18km
Accumulation & type. Prob of exceeding threshold accumulations. 100km/ 6hr
Catchment models >5000 km2; early warning major river floods. Alert smaller catchment floods.
36-96hr Global UM + ECMWF EPS40km/50km
Prob of exceeding threshold accumulations. 250km/ 1day
Probability of large scale floods in EA region
4-10day ECMWF EPS50km
Prob of wet spell. 500km/ 2days England & Wales alert of large scale floods
1-4week Monthly ensemble
Accumulation anomaly quintiles. 1000km/ 1week
UK alert to possibility of wet spell
1-4mon Seasonal ensemble
Accumulation anomaly quintiles. 3000km/ 1month
UK alert to possibility of wet season
Page 46
© Crown copyright Met Office
ETS T+18-24 >4mmmonthly
0.0000
0.0500
0.1000
0.1500
0.2000
0.2500
0.3000
0.3500
0.4000
0.4500
Jan-
01
Jul-0
1
Jan-
02
Jul-0
2
Jan-
03
Jul-0
3
Jan-
04
Jul-0
4
Jan-
05
Jul-0
5
Jan-
06
Jul-0
6
Jan-
07
Jul-0
7
Jan-
08
Jul-0
8
Jan-
09
Jul-0
9
Jan-
10
Jul-1
0
Jan-
11
Page 47
© Crown copyright Met Office
ETS 6hr accum > 4mm3yr accum values
0.150.160.170.180.19
0.20.210.220.230.240.250.260.270.280.29
0.30.310.320.330.340.350.360.370.380.39
0.4
Jan-
04
May
-04
Sep-0
4
Jan-
05
May
-05
Sep-0
5
Jan-
06
May
-06
Sep-0
6
Jan-
07
May
-07
Sep-0
7
Jan-
08
May
-08
Sep-0
8
Jan-
09
May
-09
Sep-0
9
Jan-
10
May
-10
Sep-1
0
Jan-
11
6
12
18
24
30
36
42
48
Page 48
© Crown copyright Met Office
ETS 6hr accum > 16mmmonthly
0
0.05
0.1
0.15
0.2
0.25
Dec-0
6M
ar-0
7Ju
n-07
Sep-0
7Dec
-07
Mar
-08
Jun-
08Sep
-08
Dec-0
8M
ar-0
9Ju
n-09
Sep-0
9Dec
-09
Mar
-10
Jun-
10Sep
-10
Dec-1
0
UK4 T+3-9
NAE T+6-12
NAE T+0-6
Page 49
© Crown copyright Met Office
Scale dependence of T+24 FSS 4mm threshold, NAE vs UK4
Page 50
© Crown copyright Met Office
Skilful scale for >4mm in 6hrNAE vs UK412m running mean
Page 51
© Crown copyright Met Office
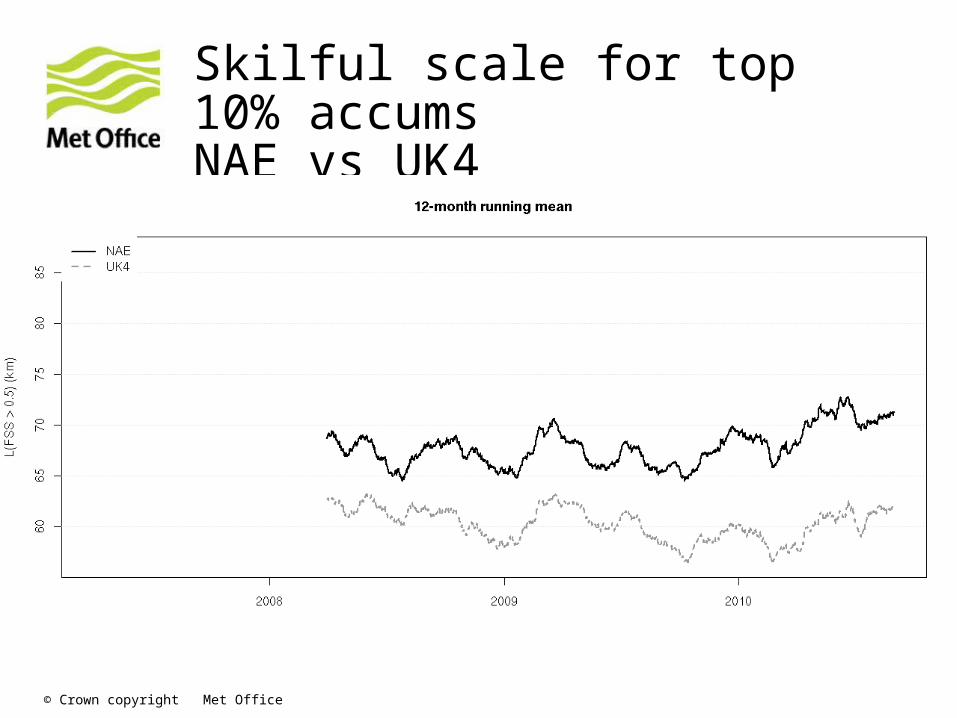
Skilful scale for top 10% accumsNAE vs UK412m running mean
Page 52
© Crown copyright Met Office
Forecasting is like a digital camera
• If a weather system is like a face:
• One pixel has one colour
• Many pixels are needed to define a face
• Many more are needed to distinguish a particular face
• The UK 1.5km grid model:
• Has one value of temperature, humidity etc. in each 1.5km grid box
• Represents recognisable weather features with 5x5 pixels (7.5km x 7.5km)
• Requires more pixels to distinguish an average from an extreme feature
• Initially, is able to distinguish average features on a scale of about 30km x 30km (“city scale”) up to about 12 hours ahead, but there is more uncertainty in the location of extreme convective storms
Page 53
© Crown copyright Met Office
Forecasting is like a game of billiards
• If a weather forecast is like a game of billiards:
• A one day forecast is like hitting the white to pot the red
• A three day forecast is like hitting the white to hit another ball to pot the red
• A five day forecast is like hitting the white to hit another ball to hit another ball to pot the red
• …
• Each impact makes the end result harder to control, especially when balls are close to each other
• In meteorology, each new weather system that develops will make the forecast less predictable
• We can estimate how much by comparing several slightly different forecasts
Page 54
© Crown copyright Met Office
Background• WWRP FDP Sydney 2000
• Short Term Ensemble Prediction System, 20022006Bowler, N. E., Pierce, C. E., and A. W. Seed, 2006. STEPS: A probabilistic precipitation forecasting scheme which merges an extrapolation nowcast with downscaled NWP. Q. J. R. Meteorol. Soc., 132, 2127–2155.
• Blending convective scale NWP with ensemble nowcasts, 2008-2012
Page 55
© Crown copyright Met Office
Blending algorithm formulation – modelling of errors
• Radar observation errors
Z-R and VPR errors
Radar-gauge error covariance model
Errors modelled as additive perturbations to the extrapolation cascade
• Nowcast errorsLagrangian evolution of the extrapolation nowcast on cascade levels
Advection errors
• NWP forecast errorsDomain average estimate of skill on cascade levels
Page 56
© Crown copyright Met Office
Achievements software
• Produces a range of seamless control and ensemble products
Extrapolation nowcast + one or more NWP precipitation forecasts e.g. UKV + MOGREPS-R
Downscaling NWP precipitation forecasts e.g. MOGREPS-R
• Makes configuration changes to NWP models transparent to users
Page 57
© Crown copyright Met Office
Achievements - scientific
• Better understanding of performance characteristics of NWP models
• Two configurations of blended forecast evaluated
Extrapolation nowcast + UKV + noise
MOGREPS-R + noise
• Blended forecasts demonstrate the following capabilities
Seamless evolution
Skilful relative to components
Ensembles well calibrated