Page 1
© Debiopharm Group 2012
Communicating Project and Portfolio Risks and Rewards
8th Annual Project & Portfolio Management, Nov 2012Debiopharm SA C. Deuschel V.P. Project and Portfolio Management
Page 2
2 © Debiopharm Group 201219.04.23
Drug development efficiency!
PCAST, Report to the President, Sept. 2012
Cost per New molecular Entity
Page 3
3 © Debiopharm Group 201219.04.23
R&D Model to successfully discover and develop a single new molecular entity
24.3
80% 75% 85% 69% 54% 34% 70% 91%
19.4 14.6 12.4 8.6 4.6 1.6 1.1
Target to hit
Hit to leadLead optimization
Preclinal Phase IPhase II Phase III Submission
to launchLaunch
1
Capitalized cost for one NME launched: $ 1.8 billion
Source: Nature Review_Drug discovery_Volume 9_March 2010 : How to improve R&D Productivity: the pharmaceutical industry’s grand challenge?
Number of molecules per phase for one launch
Probability of successful transition from one stage to the next
Page 4
4 © Debiopharm Group 201219.04.23
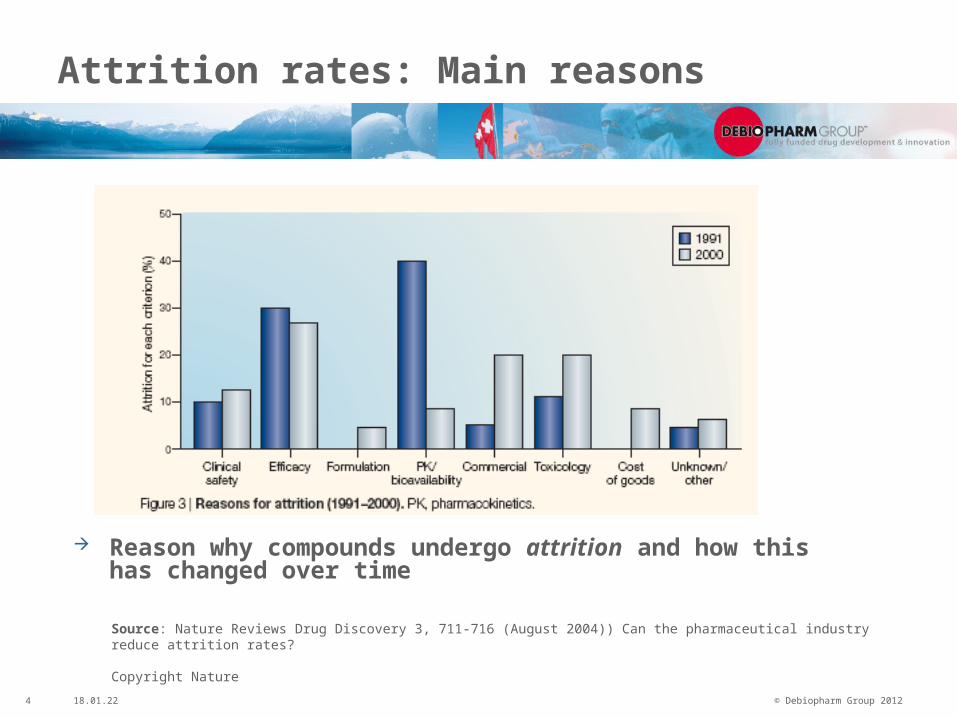
Attrition rates: Main reasons
Reason why compounds undergo attrition and how this has changed over time
Source: Nature Reviews Drug Discovery 3, 711-716 (August 2004)) Can the pharmaceutical industry reduce attrition rates?
Copyright Nature
Page 5
5 © Debiopharm Group 201219.04.23
ValueValue
COSTCOST
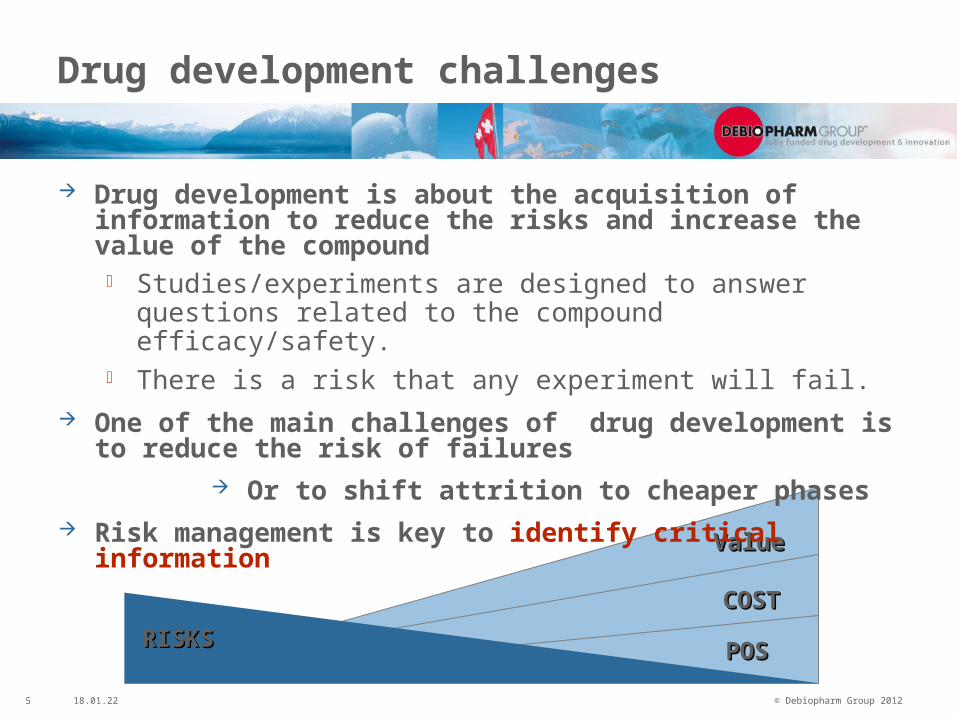
Drug development challenges
Drug development is about the acquisition of information to reduce the risks and increase the value of the compound Studies/experiments are designed to answer questions related
to the compound efficacy/safety. There is a risk that any experiment will fail.
One of the main challenges of drug development is to reduce the risk of failures
Or to shift attrition to cheaper phases Risk management is key to identify critical information
POSPOSRISKSRISKS
Page 6
6 © Debiopharm Group 201219.04.23
Debiopharm Group™
Over 30 year of experience in drug development in collaboration with pharma
Two major marketed products Eloxatin ® Gold standard & blockbuster Decapetyl ® sustained release formulation (1, 3, 6 months)
About us Based in Switzerland Family owned Financial independent Team: staff over 300 Extensive international network of partners: over 400
Page 7
7 © Debiopharm Group 201219.04.23
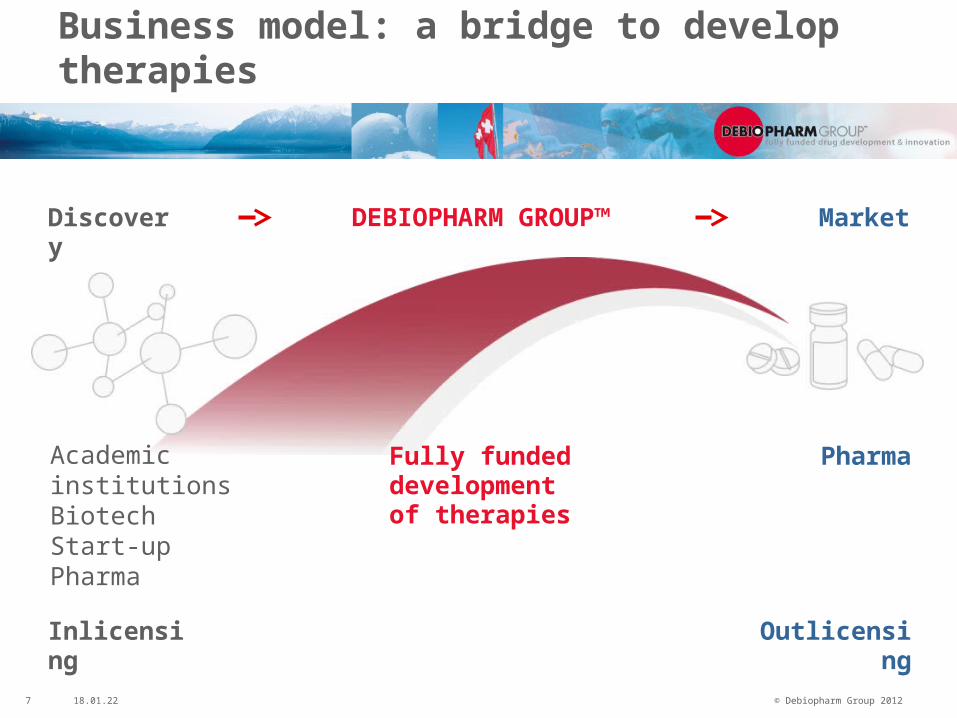
Business model: a bridge to develop therapies
Fully fundeddevelopment of therapies
Discovery
Pharma
DEBIOPHARM GROUP™
Inlicensing Outlicensing
Market
Academic institutionsBiotechStart-upPharma
Page 8
8 © Debiopharm Group 201219.04.23
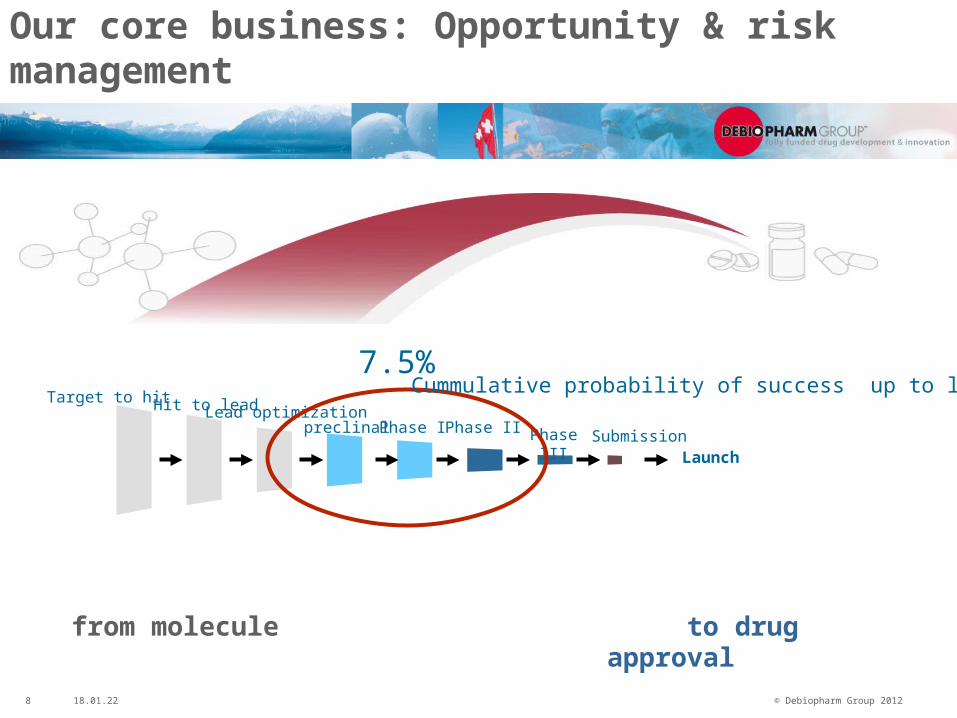
Our core business: Opportunity & risk management
7.5%Target to hit Hit to leadLead optimization
preclinal Phase I Phase II Phase III
SubmissionLaunch
from molecule to drug approval
Cummulative probability of success up to launch
Page 9
9 © Debiopharm Group 201219.04.23
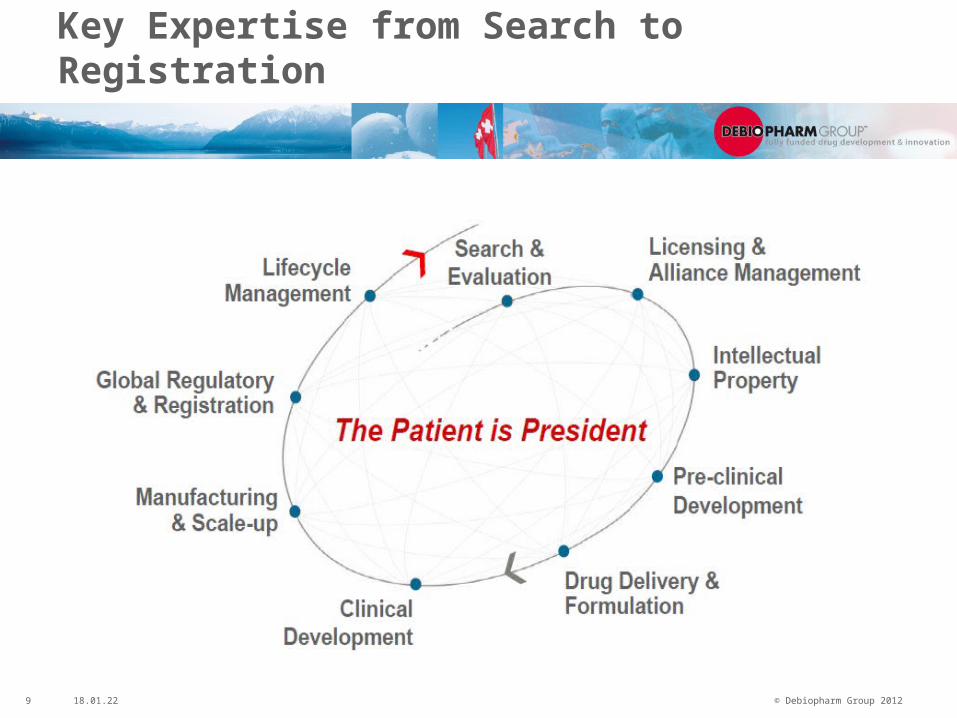
Key Expertise from Search to Registration
Page 10
10 © Debiopharm Group 201219.04.23
Two development programmes have led to… …Five products currently commercialised internationally:
Eloxatin® / Elplat® / Dacotin® / Dacplat® Decapeptyl® / Trelstar® / Pamorelin® 1-month Decapeptyl® / Trelstar® / Pamorelin® 3-month Decapeptyl® / Trelstar® / Pamorelin ® 6-month Moapar® / Salvacyl® 3-month
Debiopharm Group’s achievements
Page 11
11 © Debiopharm Group 201219.04.23
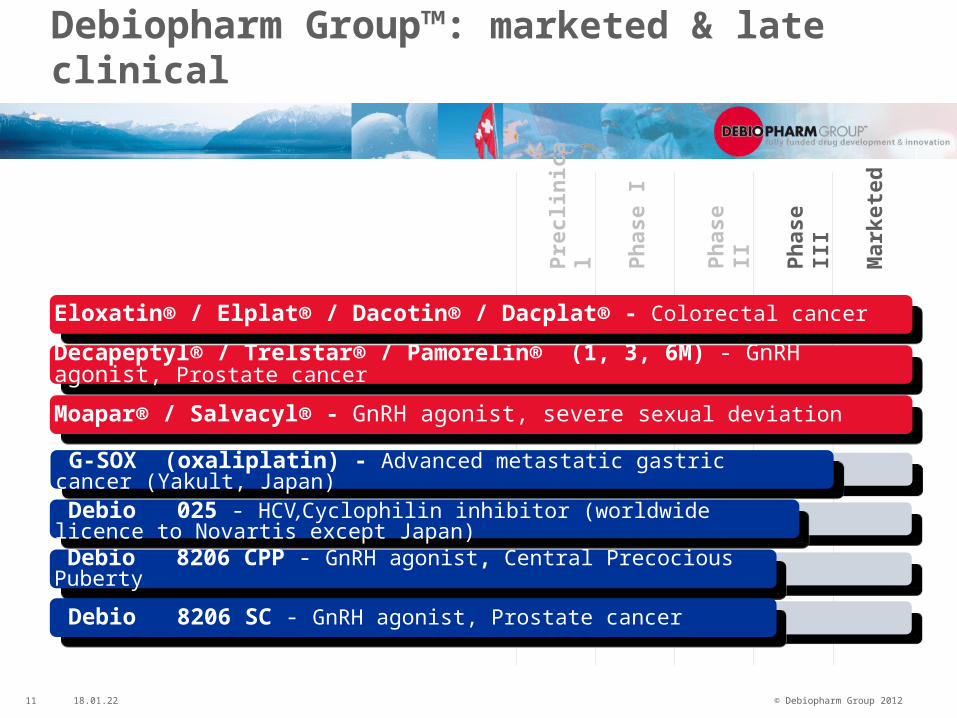
Debiopharm Group™: marketed & late clinical
Prec
linic
al
Phas
e I
Phas
e II
Phas
e III
Mar
kete
d
Decapeptyl® / Trelstar® / Pamorelin® (1, 3, 6M) - GnRH agonist, Prostate cancer
Eloxatin® / Elplat® / Dacotin® / Dacplat® - Colorectal cancer
Debio 8206 CPP - GnRH agonist, Central Precocious Puberty
Debio 025 - HCV,Cyclophilin inhibitor (worldwide licence to Novartis except Japan)
Debio 8206 SC - GnRH agonist, Prostate cancer
G-SOX (oxaliplatin) - Advanced metastatic gastric cancer (Yakult, Japan)
Moapar® / Salvacyl® - GnRH agonist, severe sexual deviation
Page 12
12 © Debiopharm Group 201219.04.23
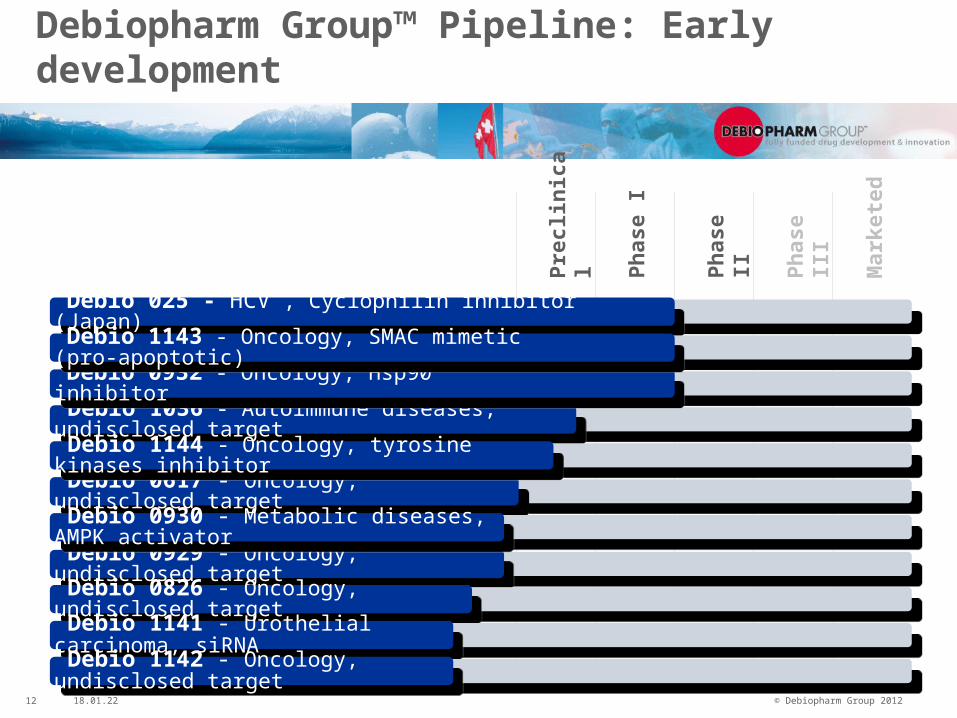
Debiopharm Group™ Pipeline: Early development
Prec
linic
al
Phas
e I
Phas
e II
Phas
e III
Mar
kete
d
Debio 0929 - Oncology, undisclosed target
Debio 0617 - Oncology, undisclosed target
Debio 0826 - Oncology, undisclosed target
Debio 0930 - Metabolic diseases, AMPK activator
Debio 025 - HCV , Cyclophilin inhibitor (Japan)
Debio 1036 - Autoimmune diseases, undisclosed target
Debio 1141 - Urothelial carcinoma, siRNA
Debio 1142 - Oncology, undisclosed target
Debio 0932 - Oncology, Hsp90 inhibitor
Debio 1144 - Oncology, tyrosine kinases inhibitor
Debio 1143 - Oncology, SMAC mimetic (pro-apoptotic)
Page 13
13 © Debiopharm Group 201219.04.23
Global development plan
Target Product Profile
TimeCost
RisksRisks
Risks and opportunity management shall be fully integrated in the global development plan
Page 14
14 © Debiopharm Group 201219.04.23
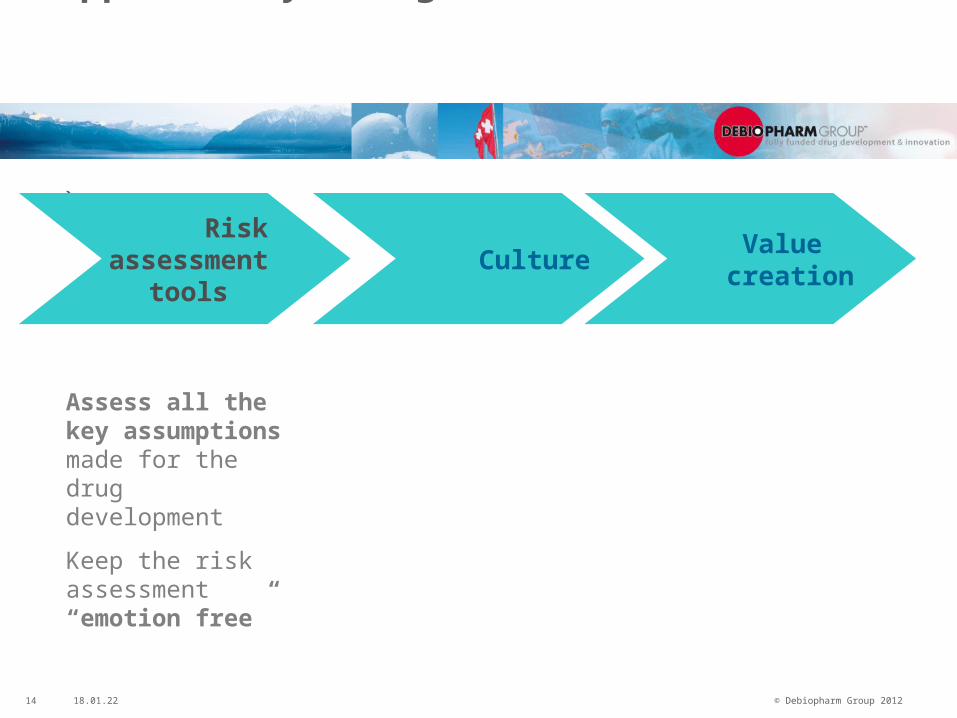
Opportunity Management
Assess all the key assumptions made for the drug development
Keep the risk assessment “emotion free”
Culture Value
creation
Risk assessment
tools
Page 15
15 © Debiopharm Group 201219.04.23
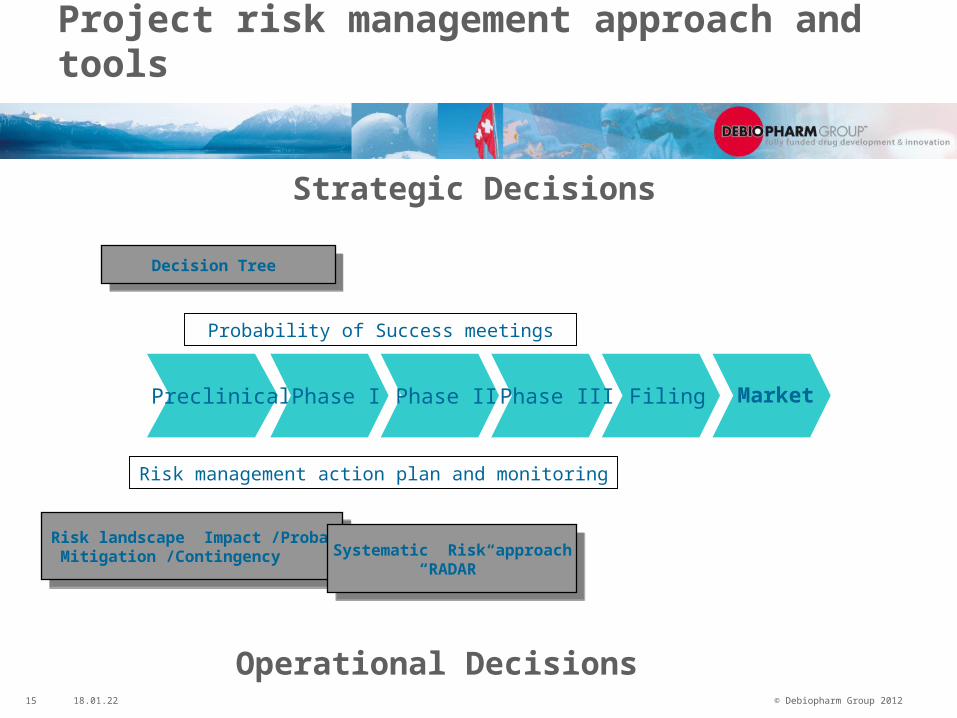
Project risk management approach and tools
Preclinical Phase I Phase II Phase III Filing Market
Risk landscape Impact /Probability Mitigation /Contingency
Risk landscape Impact /Probability Mitigation /Contingency Systematic Risk approach
“RADAR”
Systematic Risk approach“RADAR”
Decision Tree Decision Tree
Strategic Decisions
Operational Decisions
Probability of Success meetings
Risk management action plan and monitoring
Page 16
16 © Debiopharm Group 201219.04.23
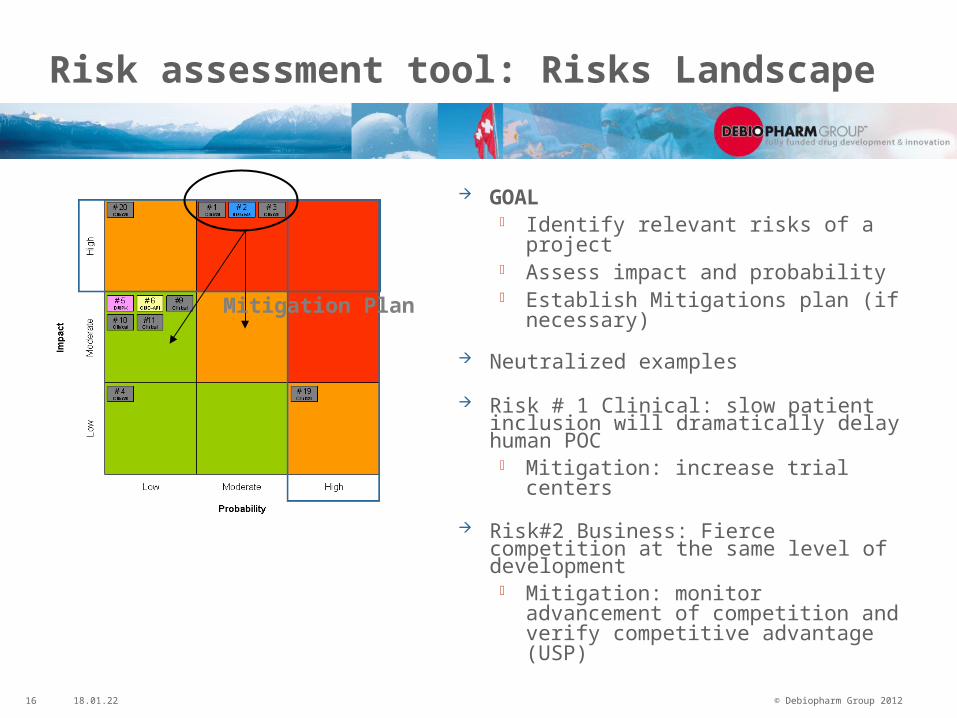
Risk assessment tool: Risks Landscape
Mitigation Plan
GOAL Identify relevant risks of a project Assess impact and probability Establish Mitigations plan (if
necessary)
Neutralized examples
Risk # 1 Clinical: slow patient inclusion will dramatically delay human POC
Mitigation: increase trial centers
Risk#2 Business: Fierce competition at the same level of development
Mitigation: monitor advancement of competition and verify competitive advantage (USP)
Page 17
17 © Debiopharm Group 201219.04.23
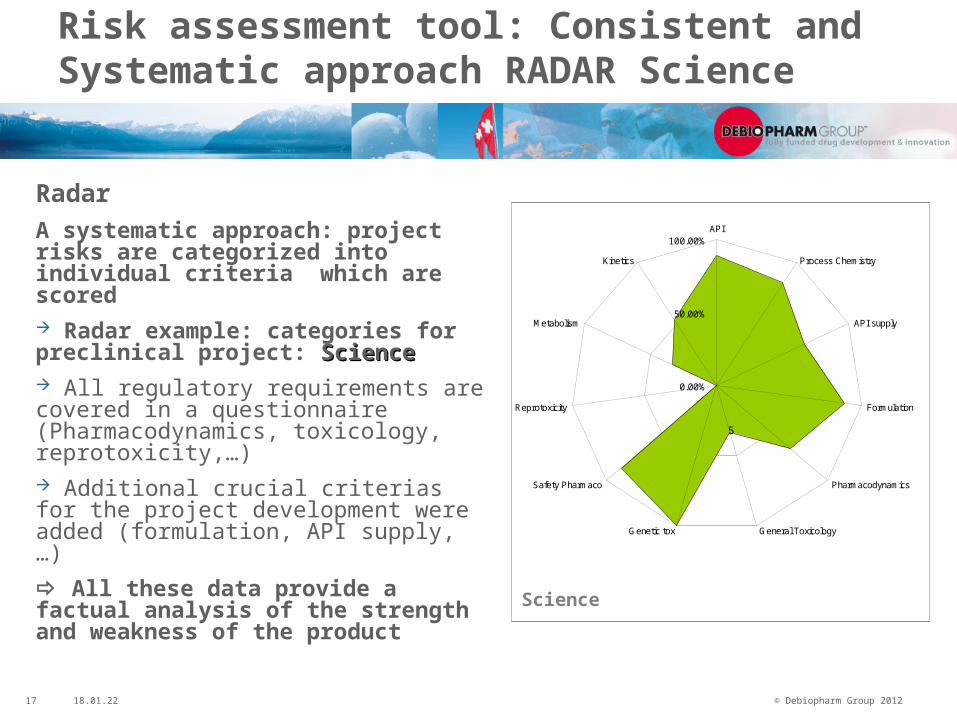
Risk assessment tool: Consistent and Systematic approach RADAR Science
0.00%
50.00%
100.00%API
Process Chemistry
API supply
Formulation
Pharmacodynamics
General ToxicologyGenetic tox
Safety Pharmaco
Reprotoxicity
Metabolism
Kinetics
5
Science
Radar
A systematic approach: project risks are categorized into individual criteria which are scored Radar example: categories for preclinical project: Science Science All regulatory requirements are covered in a questionnaire (Pharmacodynamics, toxicology, reprotoxicity,…) Additional crucial criterias for the project development were added (formulation, API supply, …)
All these data provide a factual analysis of the strength and weakness of the product
Page 18
18 © Debiopharm Group 201219.04.23
Systematic approach RADAR allows follow up of project
0.00%
50.00%
100.00%API
Process Chemistry
API supply
Formulation
Pharmacodynamics
General ToxicologyGenetic tox
Safety Pharmaco
Reprotoxicity
Metabolism
Kinetics
5
0.00%
50.00%
100.00%API
Process Chemistry
API supply
Formulation
Pharmacodynamics
General ToxicologyGenetic tox
Safety Pharmaco
Reprotoxicity
Metabolism
Kinetics
5
0.00%
50.00%
100.00%API
Process Chemistry
API supply
Formulation
Pharmacodynamics
General ToxicologyGenetic tox
Safety Pharmaco
Reprotoxicity
Metabolism
Kinetics
5
Situation February 2011 Situation February 2012
Evolution 2011/2012
Page 19
19 © Debiopharm Group 201219.04.23
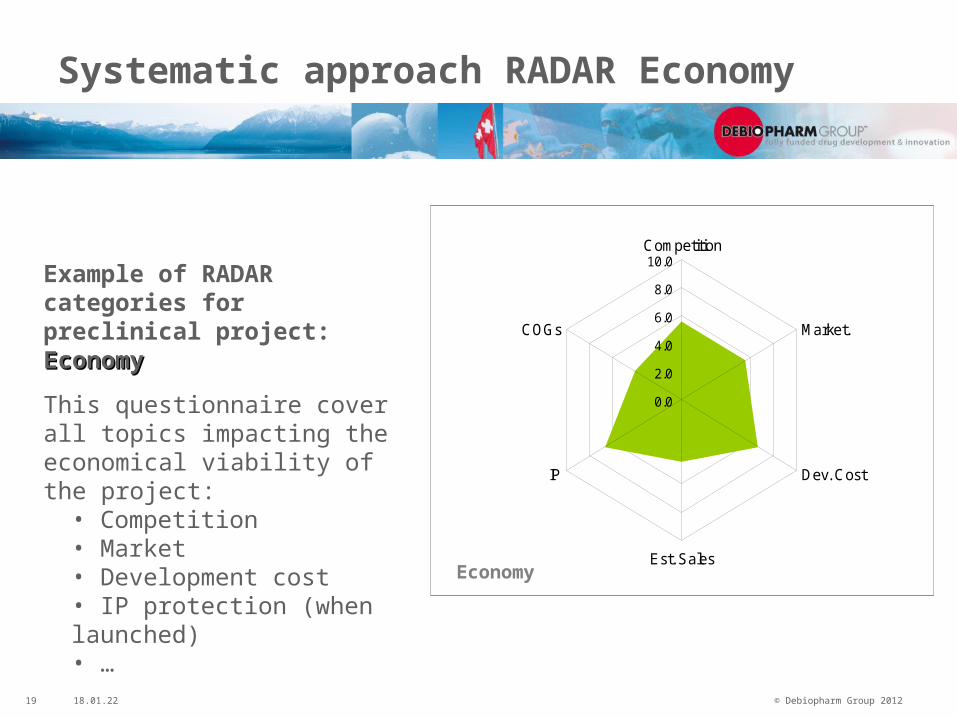
Systematic approach RADAR Economy
0.0
2.0
4.0
6.0
8.0
10.0Competition
Market.
Dev. Cost
Est. Sales
IP
COGs
Economy
Example of RADAR categories for preclinical project: EconomyEconomy
This questionnaire cover all topics impacting the economical viability of the project:
• Competition• Market • Development cost • IP protection (when launched)• …
Page 20
20 © Debiopharm Group 201219.04.23
Risks analysis: Systematic approach RADAR: Economy
0.0
2.0
4.0
6.0
8.0
10.0Competition
Market.
Dev. Cost
Est. Sales
IP
COGs
0.0
2.0
4.0
6.0
8.0
10.0Competition
Market.
Dev. Cost
Est. Sales
IP
COGs
0.0
2.0
4.0
6.0
8.0
10.0Competition
Market.
Dev. Cost
Est. Sales
IP
COGs
Situation February 2011 Situation February 2012
Evolution 2011/2012
Page 21
21 © Debiopharm Group 201219.04.23
Risk assessment tool: Decision tree
Attrition rates Phase I to market approval
0.00%
5.00%
10.00%
15.00%
20.00%
25.00%
30.00%
2002(Buchanan
2002)
period 81-86(DiMasi2001)
period 87-92 (DiMasi
2001)
period 93-04 (Parexel2011/2012
p221)
period 93-04 (Parexel2011/2012,
p270)
2004 (Tuftsoct 2010,vol12, n° 5)
2004 (Kolaet al 2004)
2011 (Parexel2011/2012,
p265)
period 95-10(Paul et al,
2010)
average
Probability of Success Decision tree meetings are
performed at each project gate (Go/NoGo next project gate)
Outside expertise to ensure objectivity
Comparison with benchmark There is no unique benchmark!
Is the PoS of the project higher or lower than the benchmark? If yes, why?
Page 22
22 © Debiopharm Group 201219.04.23
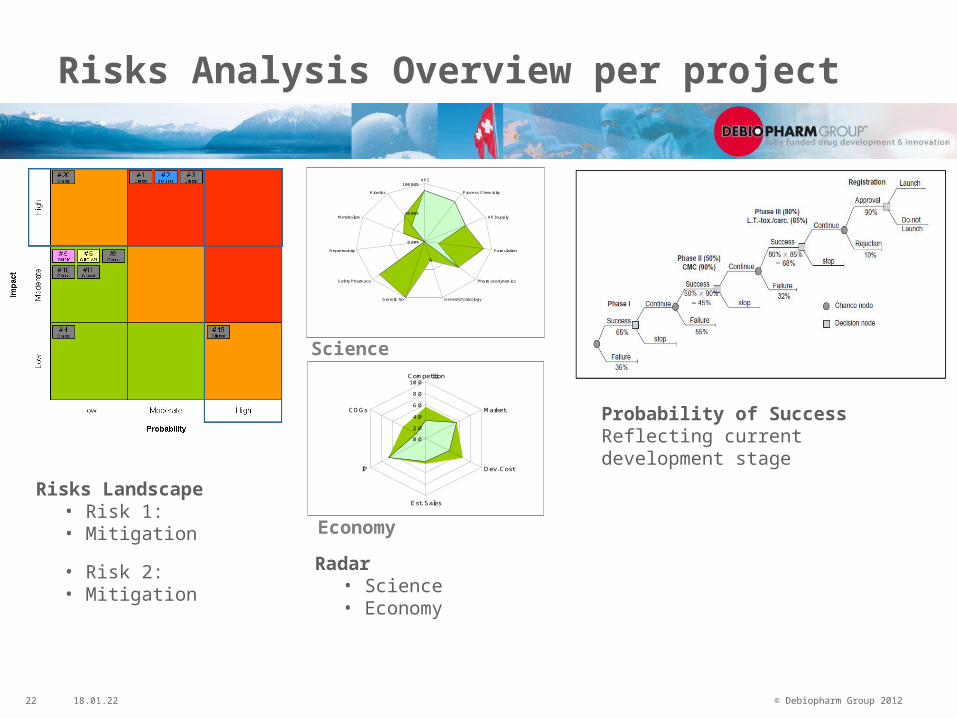
Risks Analysis Overview per project
Risks Landscape• Risk 1: • Mitigation
• Risk 2:• Mitigation
Radar • Science• Economy
0.00%
50.00%
100.00%API
Process Chemistry
API supply
Formulation
Pharmacodynamics
General ToxicologyGenetic tox
Safety Pharmaco
Reprotoxicity
Metabolism
Kinetics
5
Science
0.0
2.0
4.0
6.0
8.0
10.0Competition
Market.
Dev. Cost
Est. Sales
IP
COGs
Economy
Probability of SuccessReflecting current development stage
Page 23
23 © Debiopharm Group 201219.04.23
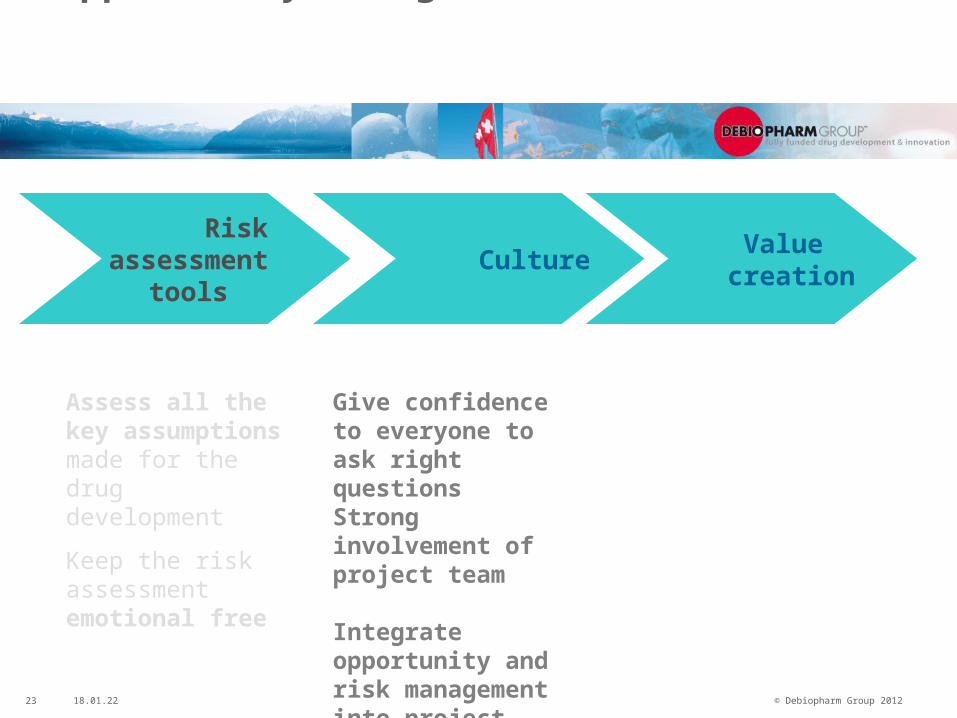
Opportunity Management
Give confidence to everyone to ask right questions Strong involvement of project team Integrate opportunity and risk management into project lifecycle
Assess all the key assumptions made for the drug development
Keep the risk assessment emotional free
Culture Value
creation
Risk assessment
tools
Page 24
24 © Debiopharm Group 201219.04.23
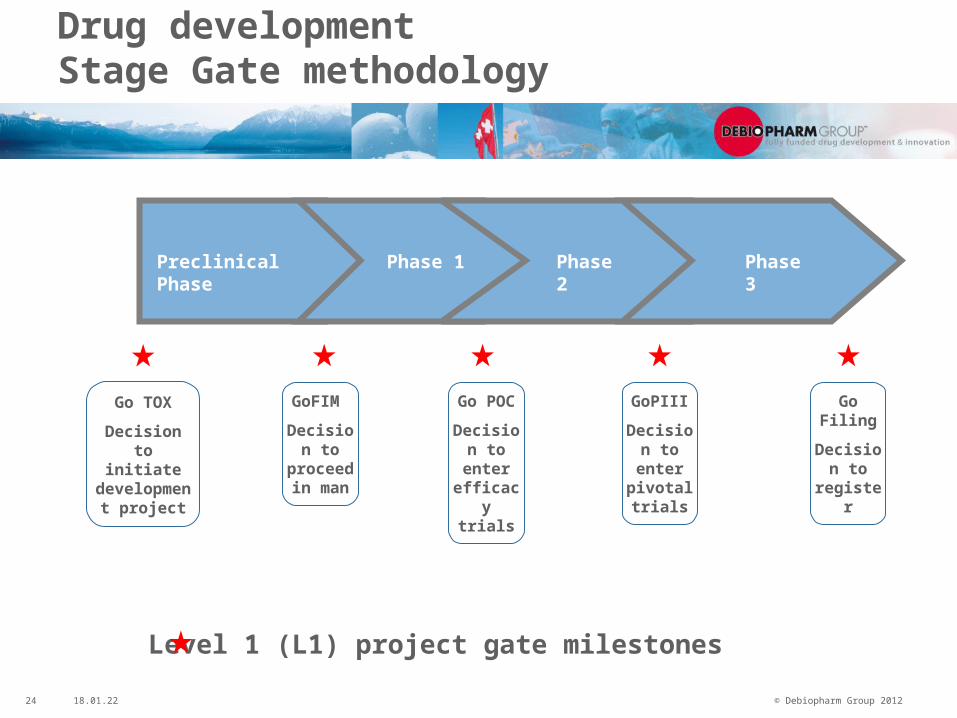
Drug development Stage Gate methodology
Preclinical Phase Phase 1 Phase 3Phase 2
GoFIM
Decision to
proceed in man
Go TOX
Decision to initiate
development project
Go POC
Decision to enter efficacy
trials
GoPIII
Decision to enter pivotal trials
Go Filing
Decision to
register
Level 1 (L1) project gate milestones
Page 25
25 © Debiopharm Group 201219.04.23
Differentiation of the level of responsabilities
L1: Top management needs a clear overview on the value creation milestones
L2: Project team is responsible for reaching the objectives/deliverables associated with the critical activities
L3: Team members are accountable for the detailed tasks to complete the critical network activities
L1 Project Gate
L2Critical
network activities
L3
Detailed tasksrisks
risks
risks
Risk assessment Relevant Go/NoGo and “what if scenarios” are discussed at each level
Page 26
26 © Debiopharm Group 201219.04.23
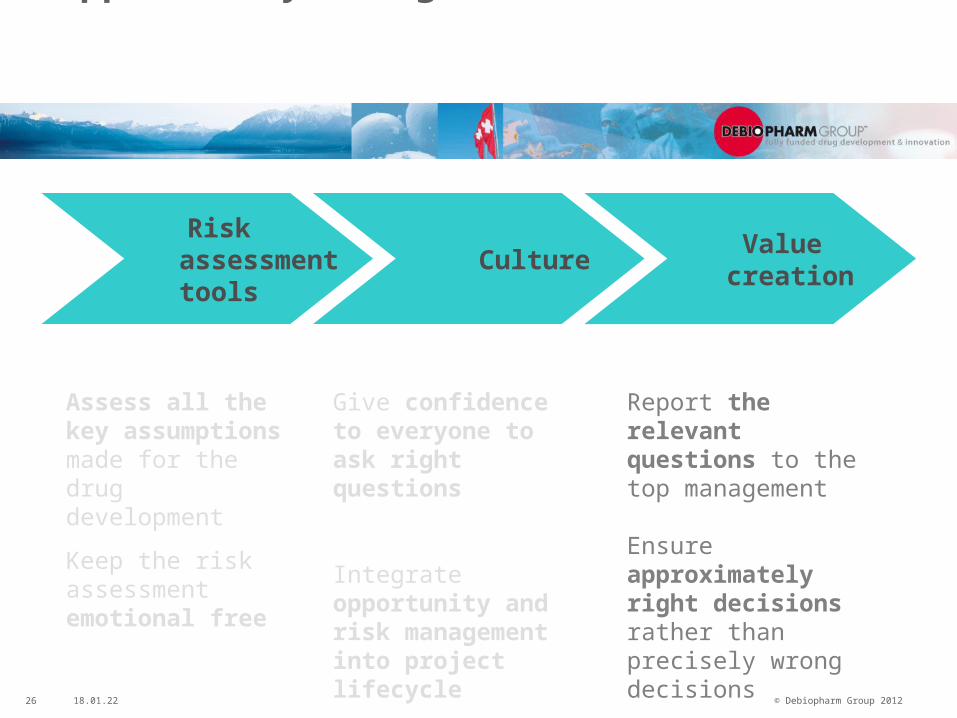
Opportunity Management
Give confidence to everyone to ask right questions
Integrate opportunity and risk management into project lifecycle
Assess all the key assumptions made for the drug development
Keep the risk assessment emotional free
Report the relevant questions to the top management
Ensure approximately right decisions rather than precisely wrong decisions
Culture Value
creation
Risk assessment
tools
Page 27
27 © Debiopharm Group 201219.04.23
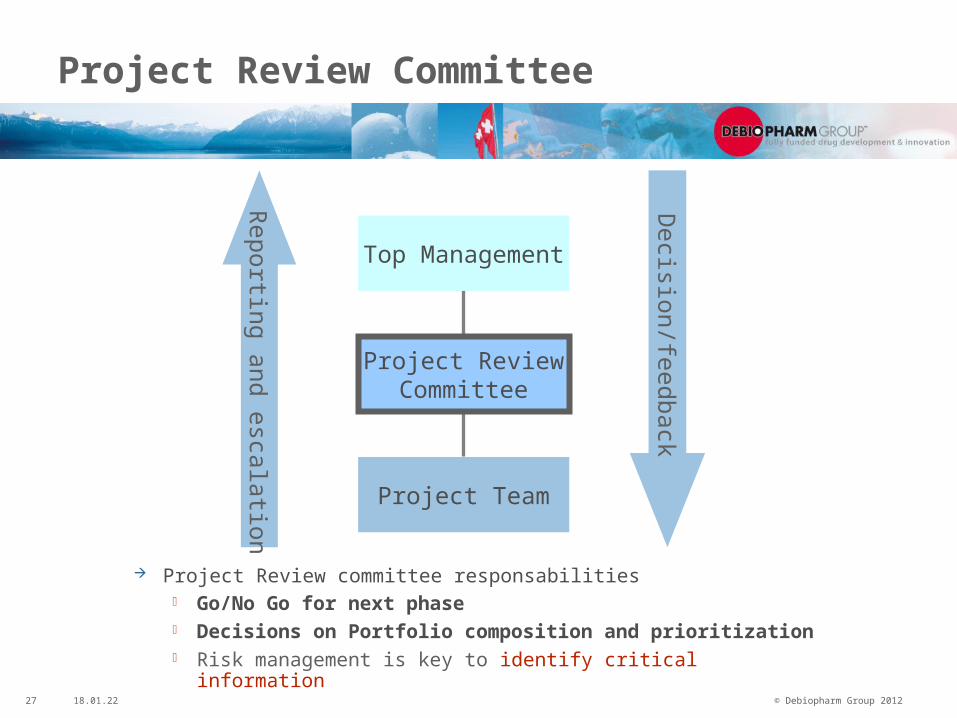
Project Review Committee
Project Review committee responsabilities Go/No Go for next phase Decisions on Portfolio composition and prioritization Risk management is key to identify critical information
Top Management
Project ReviewCommittee
Project Team
Reporting and escalation
Decision/feedback
Page 28
28 © Debiopharm Group 201219.04.23
Preparation for the Project review Committee
Risk analysis of
Go/NoGo criteria for decision making
Recommendation of the project team
Critical information for each L1 gate
Early Project•…•…•…
GoTox.•…•…•…
GoFIM•…•…•…
GoPOC•…•…•…
Project review committee
Clear decision criteria
Page 29
29 © Debiopharm Group 201219.04.23
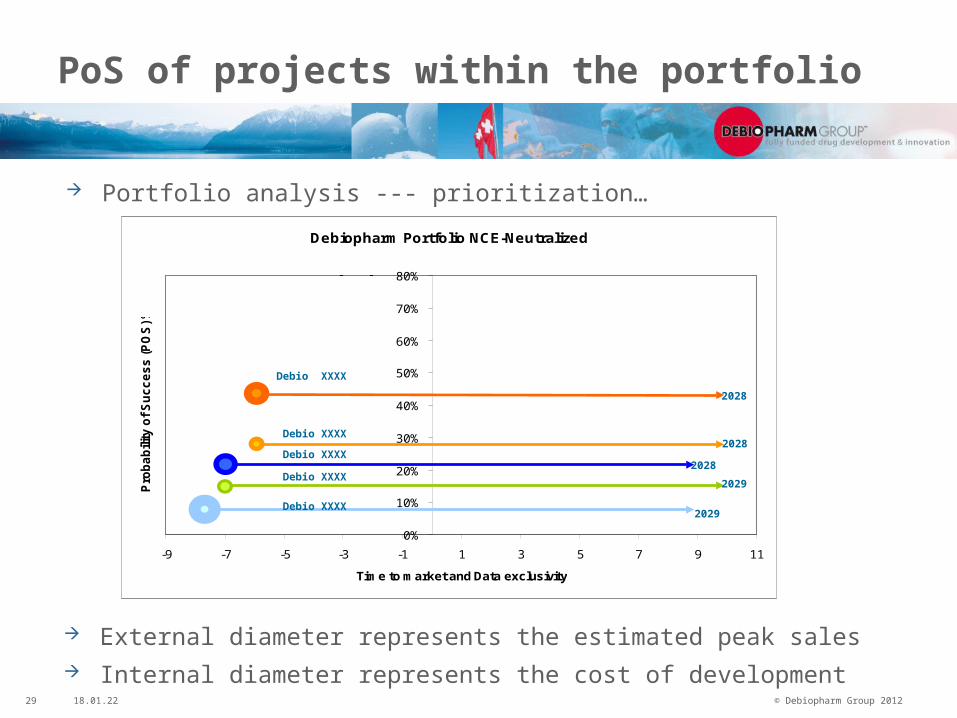
PoS of projects within the portfolio
External diameter represents the estimated peak sales Internal diameter represents the cost of development
Portfolio analysis --- prioritization…
Debiopharm Portfolio NCE-Neutralized
0%
10%
20%
30%
40%
50%
60%
70%
80%
-9 -7 -5 -3 -1 1 3 5 7 9 11
Time to market and Data exclusivity
Pro
ba
bili
ty o
f S
uc
ce
ss
(P
OS
) %
2028
2028
2029
2028
2029
Debio XXXX
Debio XXXX
Debio XXXX
Debio XXXX
Debio XXXX
Page 30
30 © Debiopharm Group 201219.04.23
Value creation
Project risks are categorized into individual criterias which are scored
Project and portfolio metrics are based on risk and opportunity management
3 level of responsibilities (L1, L2, L3) are established to optimize project monitoring and management
Opportunity and risk management needs to be integrated into project lifecycle
Transparent view of risks and opportunities is shared through the whole organization
Focus on relevant risks which are escaladed to the top management
Check that the warning about the relevant risks and their associated opportunities are well understood by the top management
Page 31
31 © Debiopharm Group 201219.04.23
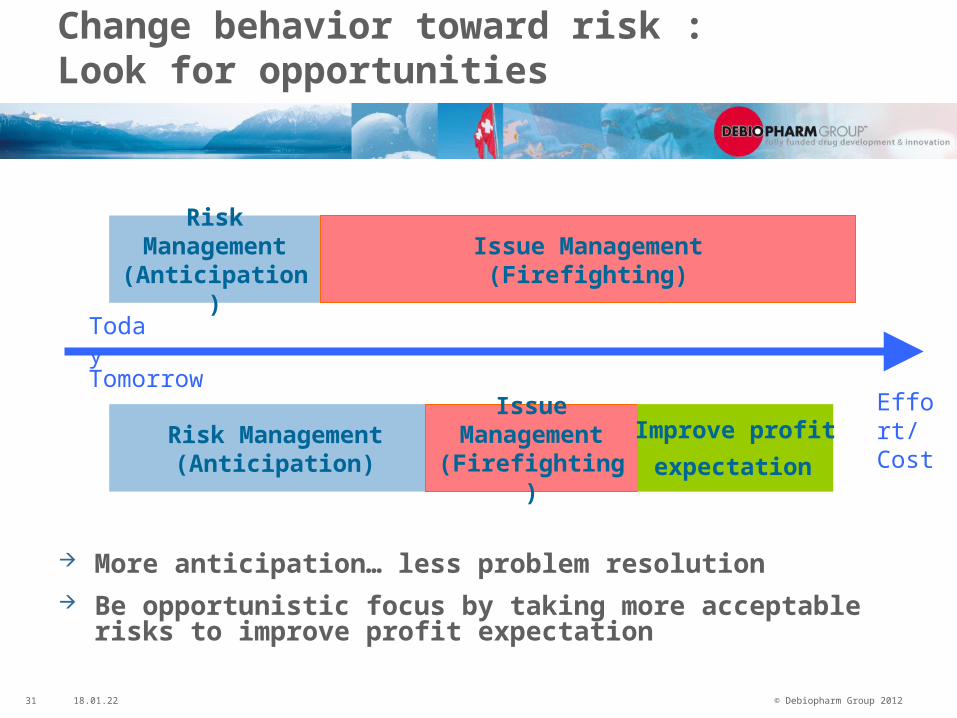
Change behavior toward risk : Look for opportunities
More anticipation… less problem resolution Be opportunistic focus by taking more acceptable risks to
improve profit expectation
Risk Management(Anticipation)
Issue Management(Firefighting)
Risk Management(Anticipation)
Issue Management(Firefighting)
Today
TomorrowEffort/ CostImprove profit
expectation
Page 32
32 © Debiopharm Group 201219.04.23
Page 33
33 © Debiopharm Group 201219.04.23
Special thanks to
Pierre Daram - Project Manager