23
S Effect of Physical Activity on Reaction Time. Michael Anselmo
| Date post: | 03-Jan-2016 |
| Category: |
Documents |
| Upload: | clinton-rodgers |
| View: | 214 times |
| Download: | 0 times |

S
Effect of Physical Activity on Reaction Time.
Michael Anselmo

Introduction
The sensory system is part of the nervous system, and is responsible for processing sensory information.
A sensory system contains sensory receptors, neural pathways, and parts of the brain involved in sensory perception.
The five sense include – vision, hearing, somatic sensation (touch), taste, and olfaction (smell).

Anatomy of a Neuron
Neurons are the basic functional unit of the nervous system.
Synaptic terminals: Bring chemical signals from other neurons; transmits signals to other neurons.
Dendrites: Receive signals from other neurons.
Cell body: Integrates signals; coordinates metabolic activities.
Axon Hillock: Neuron action potential initiated here.
Axon: Transmits the action potential.
Myelin: Insulates axon, speeds Action potential conduction.

How do nerve cells work?
The cell body receives signals from other neurons through its dendrites. That signal is processed within the cell body.
The cell body then initiates an action potential at the axon hillock. The action potential then travels down the axon.
The action potentials signal the release of neurotransmitters from at the synaptic terminals.

How do nerve cells produce and transmit signals?
The electrical charge inside a neuron changes during an action potential.
A neurons electrical charge is the result of a voltage difference across the plasma membrane.
When a neuron is not stimulated and inactive, its potential is called the resting potential.

Neurons Communicating at Synapses
Signals that either excite or inhibit the next neuron are produced at synapses.
Excitatory and inhibitory signals are integrated in the cell body.
The nervous system uses many neurotransmitters to produce excitatory and inhibitory signals at the synapse.

How Does the Nervous System Process Information?
The intensity of a stimulus is coded by the frequency of signals, or action potentials.

Sensory Receptors
Sensory receptors relay information from outside the body into to the brain.
Transducer receptor cells receive a stimulus.
When a threshold potential is reached, an action potential occurs.
Stimuli is interpreted based on four aspects, modality, intensity, location, and duration.
The brain interprets information and sends out instructions the rest of the body.
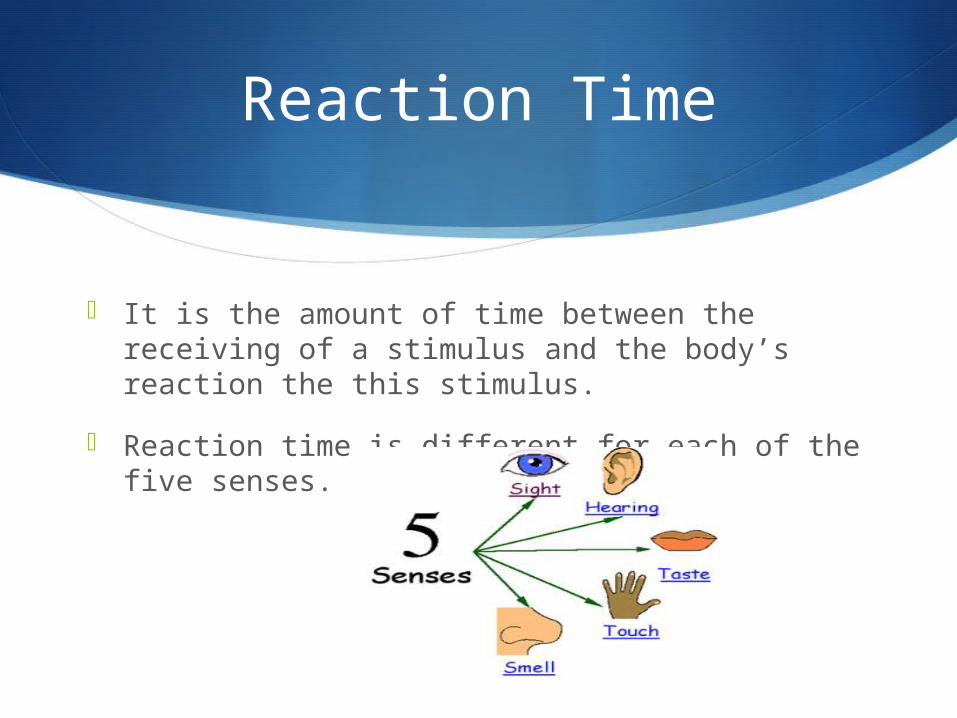
Reaction Time
It is the amount of time between the receiving of a stimulus and the body’s reaction the this stimulus.
Reaction time is different for each of the five senses.

Physical Activity Effect on Reaction Time.
Studies have been done in order to see if alcohol and age have an effect on a persons reaction time.
In this experiment a subject will undergo a variety of physical activities including running for a mile, push-ups and sit-ups and then will have their reaction time tested.
Purpose
To test the effects of physical activity on human reaction time.
Hypothesis
Null: Physical activity will not have a significant effect on human reaction time.
Alternative: Physical activity will have a significant effect on human reaction time.

Materials
Meter stick
Flat wall
Subject to perform physical activities
Track course to run mile
Person to drop the meter stick
Procedure
1. Held the meter stick on the wall with subject’s hand even with the end of the meter stick.
2. Did not speak or distract the subject in any way before dropping the meter stick.
3. Informed the subject to hold their hand against the wall, stopping the meter stick when they see the stick drop.
4. Dropped the meter stick and recorded how many centimeters it dropped before the subject was able to stop the stick.
5. Record the resulting averages and plain results of 35 trials.
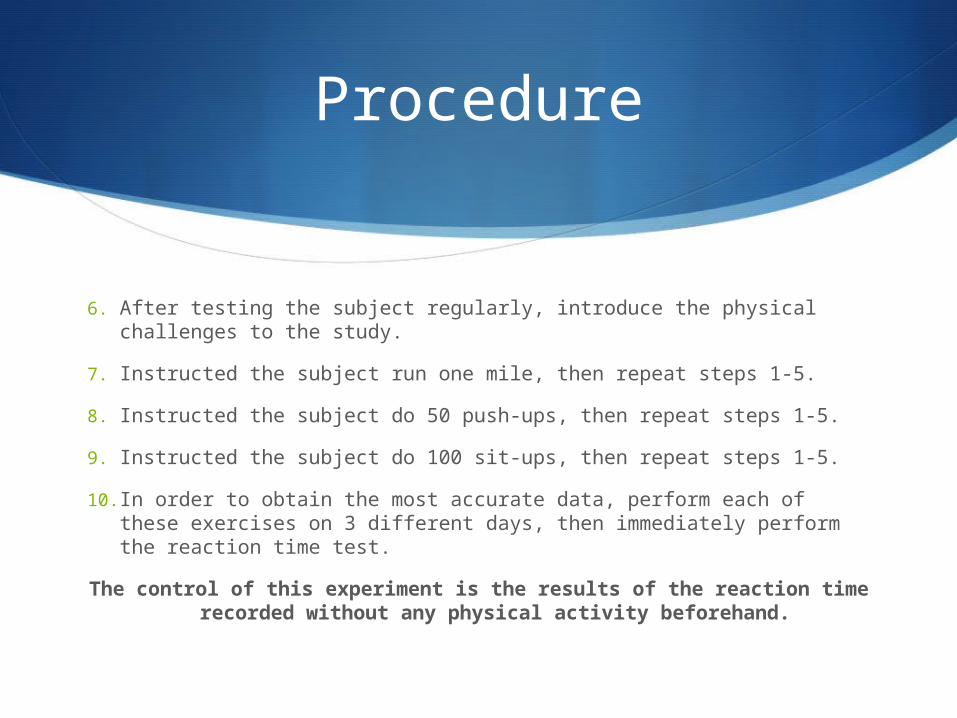
Procedure
6. After testing the subject regularly, introduce the physical challenges to the study.
7. Instructed the subject run one mile, then repeat steps 1-5.
8. Instructed the subject do 50 push-ups, then repeat steps 1-5.
9. Instructed the subject do 100 sit-ups, then repeat steps 1-5.
10. In order to obtain the most accurate data, perform each of these exercises on 3 different days, then immediately perform the reaction time test.
The control of this experiment is the results of the reaction time recorded without any physical activity beforehand.
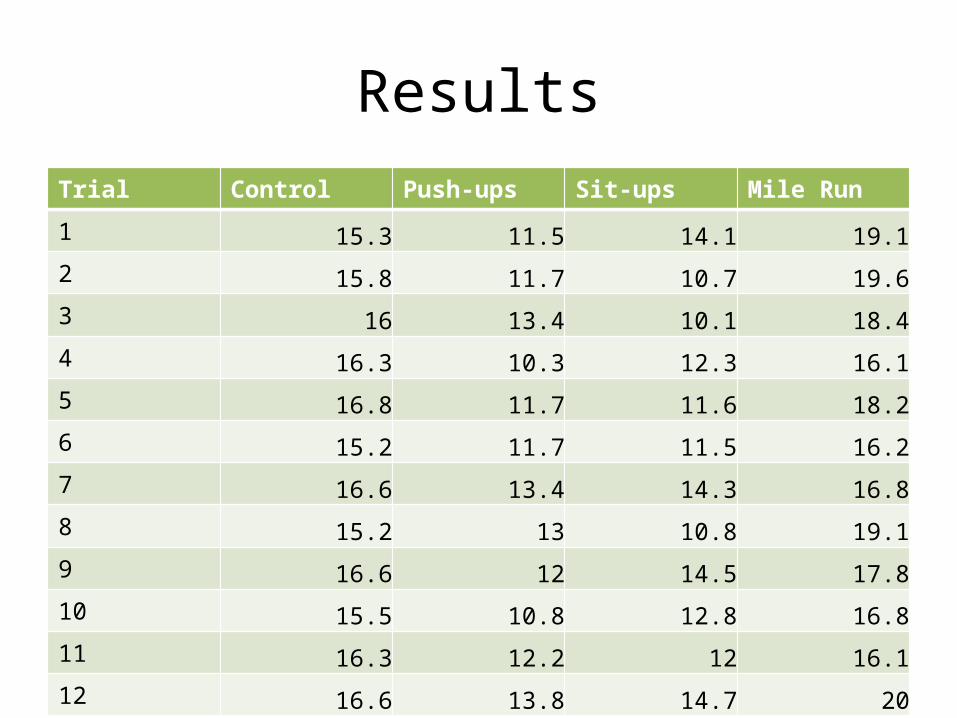
ResultsTrial Control Push-ups Sit-ups Mile Run
1 15.3 11.5 14.1 19.12 15.8 11.7 10.7 19.63 16 13.4 10.1 18.44 16.3 10.3 12.3 16.15 16.8 11.7 11.6 18.26 15.2 11.7 11.5 16.27 16.6 13.4 14.3 16.88 15.2 13 10.8 19.19 16.6 12 14.5 17.810 15.5 10.8 12.8 16.811 16.3 12.2 12 16.112 16.6 13.8 14.7 20

ResultsTrial Control Push-ups Sit-ups Mile Run
13 15.5 10.2 14.8 16.814 15.3 13.1 10.2 18.515 16.3 11.1 12.8 1616 16.5 11.7 11.1 19.717 15.4 13 12.5 19.618 15 11.7 14.5 16.519 16.1 10.6 14.5 18.820 16.8 13.4 11.4 18.221 15.6 10.9 14.2 16.122 15.2 13.6 13.4 20.523 16.9 11.6 14 20.524 16.5 11.4 12.2 19.5

ResultsTrial Control Push-ups Sit-ups Mile Run
25 16.6 9.6 10.9 19.826 16.5 13.1 10.8 20.927 16.2 10.3 13 18.628 16.6 11.6 10.2 20.129 16 9.1 11.6 19.730 15.9 11 12.2 16.531 16.4 9.6 12.2 17.132 15.5 9.7 10.2 19.533 16.8 13.5 11.7 16.934 17 12.2 12 20.435 16.4 10.1 11.5 16.9Average 16.2 11.4 12.4 18.5

Control Push-Ups Sit-Ups Mile0
2
4
6
8
10
12
14
16
18
20
16.2
11.412.4
18.5
Exercise Effect on Human Reaction Time
Exercise
Centi
met
ers
Dis
plac
ed (R
eacti
on T
ime)
Average of 35 Trials

Anova: Single Factor
SUMMARY
Groups Count Sum Average Variance
Column 1 35 563.2 16.09143 0.348454
Column 2 35 407.6 11.64571 1.755496
Column 3 35 431.3 12.32286 2.195933
Column 4 35 641.3 18.32286 2.474756
ANOVA
Source of Variation SS df MS F P-value F crit
Between Groups 1049.9 3 349.9666 206.6334 1.88E-50 2.671178
Within Groups 230.3377 136 1.69366
Total 1280.237 139
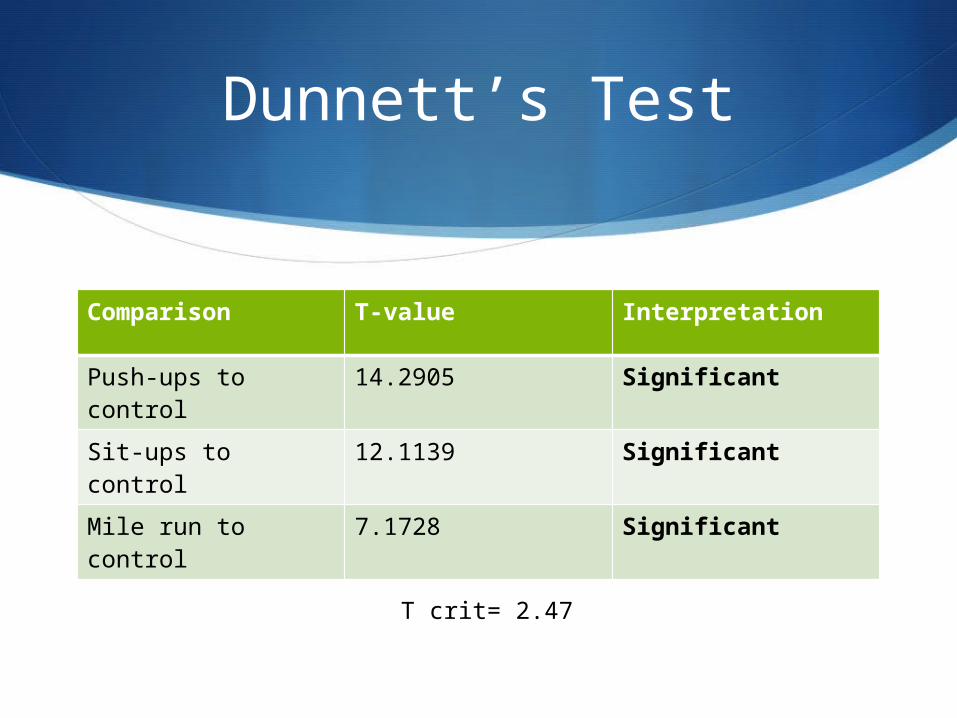
Dunnett’s Test
Comparison T-value Interpretation
Push-ups to control 14.2905 Significant
Sit-ups to control 12.1139 Significant
Mile run to control 7.1728 Significant
T crit= 2.47

Conclusions
ANOVA suggested significant variation, thus warranting the use of a Dunnett’s test to compare each data set to the control. These statistical analyses indicated significant variation.
Thus, the null hypothesis can be rejected for push-ups, sit-ups, and mile run.
In other words, each of these exercises had a significant effect on reaction time.

Future Studies
Possible limitations of this study:
Only one subject was used
Subjects of different ages may lead to results that vary
Ways to further this study:
Test different senses
Test subjects of different ethnic backgrounds


![Organocatalytic asymmetric domino Michael- Henry reaction ... · Organocatalytic asymmetric domino Michael- Henry reaction for the synthesis of substituted bicyclo[3.2.1]octan-2-ones](https://static.documents.pub/doc/80x56/5fd3a830323355709074018a/organocatalytic-asymmetric-domino-michael-henry-reaction-organocatalytic-asymmetric.jpg)


![[E-book - ITA] - Gianni Anselmo - Drinks.pdf](https://static.documents.pub/doc/80x56/577c77f61a28abe0548e2c0c/e-book-ita-gianni-anselmo-drinkspdf.jpg)
