Estudios sobre la Economía Española - 2017/25 Recent trends in the use of temporary contracts in Spain Florentino Felgueroso (FEDEA) José-Ignacio García-Pérez (Universidad Pablo de la Olavide y FEDEA) Marcel Jansen (Universidad Autónoma de Madrid, IZA y FEDEA) David Troncoso-Ponce (Universidad Pablo de la Olavide) fedea Las opiniones recogidas en este documento son las de sus autores y no coinciden necesariamente con las de FEDEA.
Transcript
Estudios sobre la Economía Española - 2017/25
Recent trends in the use of temporary contracts in Spain
Florentino Felgueroso (FEDEA)
José-Ignacio García-Pérez (Universidad Pablo de la Olavide y FEDEA)
Marcel Jansen (Universidad Autónoma de Madrid, IZA y FEDEA)
David Troncoso-Ponce (Universidad Pablo de la Olavide)
fedea
Las opiniones recogidas en este documento son las de sus autores y no coinciden necesariamente con las de FEDEA.
Tendencias recientes en el uso de los contratos temporales en España
Durante las tres últimas décadas, España ha liderado el ranking europeo de los indicadores del empleo temporal. Como consecuencia de la reforma laboral aprobada a mediados de los años 80, la tasa de temporalidad explotó, alcanzando un máximo con la burbuja inmobiliaria. Ninguna de las numerosas reformas aprobada desde entonces consiguió aliviar este problema de forma significativa. Durante la Gran Recesión, sin embargo, este indicador experimentó una mejoría notable, aunque no suficiente para dejar las posiciones más altas del ranking europeo. En este documento, mostramos que dicha evolución de las tasas de temporalidad no muestra una mejoría real de la precariedad laboral en el mercado de trabajo español.
La duración media de los contratos es cada vez más corta. En especial, el uso
de los contratos de muy corta duración (de unas horas, hasta menos de una semana) tienen hoy en día un mayor peso que en el período pre-crisis. No obstante, este fenómeno no es totalmente captado por indicadores como la tasa de temporalidad cuando se calcula con datos procedentes de la Encuesta de Población Activa, ocultando parte de la precariedad laboral real. Indicadores y fuentes de datos alternativas que si permiten captarlo, muestran todo lo contrario.
Una forma de evaluar si el mayor uso de contratos de corta duración y el
aumento del número de contratos por persona está afectando a las trayectorias de empleo es analizar si los cambios en la contratación temporal han empeorado el de por sí muy limitado acceso al empleo indefinido.
Nuestro análisis se centra en los jóvenes menores de treinta años. En un primer
ejercicio demostramos que la acumulación de contratos favorece la consecución de primeros empleos con contratos temporales. Sin embargo, la duración esperada de estos contratos es menor para jóvenes que han acumulado más contratos y a partir de unos 7 a 8 contratos se reduce la probabilidad de acceder a un contrato indefinido. Esta evidencia apunta al riesgo para determinados colectivos de quedar atrapados en ciclos de contratos de (muy) corta duración.
El segundo, y mas llamativo ejercicio, estima directamente el tiempo que los
jóvenes necesitan para encontrar su primer empleo indefinido desde su entrada en el mercado laboral. Los datos muestra claramente que el acceso al empleo indefinido se ha hecho más difícil en comparación con el período previo a la Gran Recesión, tanto en términos del tiempo transcurrido hasta el primer contrato indefinido como en el número de contratos temporales previos. Además en términos relativos el deterioro ha sido mayor para las personas menos cualificadas.
Tendencias recientes en el uso de los contratos temporales en España
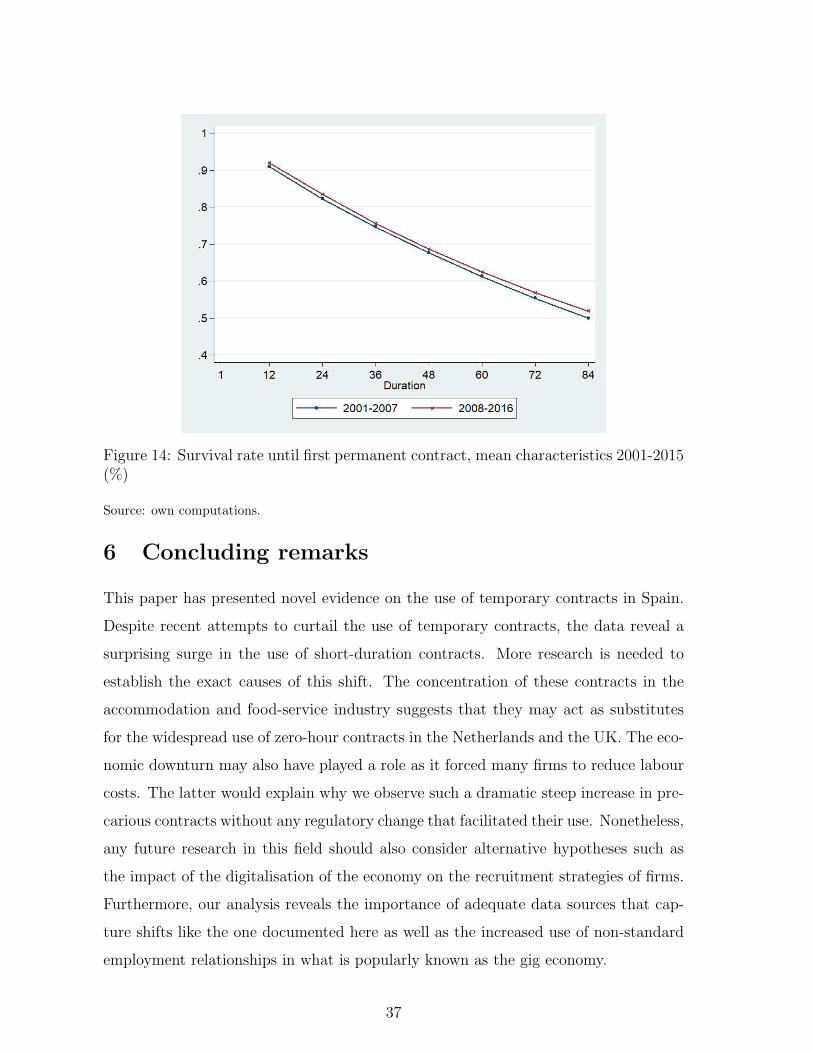
Las diferencias persisten cuando controlamos por las características individuales y del primer empleo. En concreto, mostramos que la probabilidad que un individuo con características medias continúe sin haber encontrado un empleo indefinido es significativamente mayor a partir del año 2008. Sin embargo, las diferencias desaparecen casi por completo si eliminamos también el efecto del ciclo económico. Por tanto, los resultados parecen indicar que el deterioro en el acceso al empleo indefinido se debe principalmente al aumento en la tasa de paro y no a los cambios en la contratación temporal o las reformas laborales de 2010 y 2012. Pero, y esto es clave, estas mismas reformas tampoco han servido para mejorar el acceso al empleo indefinido.
Recent trends in the use of temporary contracts inSpain
Florentino FelguerosoFEDEA
Jose-Ignacio Garcıa-PerezUniversidad Pablo de la Olavide and FEDEA
Marcel Jansen∗
Universidad Autonoma de Madrid, IZA and FEDEA
David Troncoso-PonceUniversidad Pablo de la Olavide
September 2017
Abstract
This paper documents recent trends in the use of temporary contracts in Spain.Until the outbreak of the recent economic and financial crisis, Spain was leadingthe ranking of countries with the largest share of temporary employees. Duringthe crisis this share has fallen to its lowest level in decades, but in the recoverythe share of temporary employees is on the rise again. Indeed, last year Spanishemployers formalised more contracts than ever before. A particularly strikingfeature is the steep rise in fixed-duration contracts lasting less than a week. Wedocument these trends and discuss the relevance of institutional factors for thehigh incidence of temporary employment in Spain. In addition, we perform vari-ous econometric exercises to assess whether the surge of short-duration contractshas led to a further deterioration in the access to permanent employment.
Keywords: Temporary jobs, Great Recession, dual labour markets constraints.JEL codes: D92, G33, J23.
∗Corresponding author. Universidad Autonoma de Madrid. Departamento de Analisis Economico:Teorıa Economica e Historia Economica. Campus Universitario. 28049 Cantoblanco (Madrid). Spain.Tel. +34914973907. [email protected]
1 Introduction
Since the late eighties, Spain is struggling with the consequences of an exceptionally
high share of temporary employees. In the recent crisis this share has fallen to its lowest
level in almost thirty years, but in the recovery the share of temporary employees is
on the rise again. Indeed, in 2016 more employment contracts were formalised than
ever before in Spanish history, while aggregate employment continues well below its
pre-crisis peak. A particularly striking phenomenon is the strong rise in the number
of fixed-duration contracts that last less than a week. The objective of this paper is to
document these recent trends and to offer a tentative assessment of the implications
of the rising importance of short-duration jobs for the access to stable regular jobs.
The recent crisis has revived the debate about the determinants and the conse-
quences of the high incidence of temporary employment in Spain. The origin of the
problem can be traced back to a reform in the eighties that temporarily liberalised
the use of temporary contracts. The reform was intended to spur job creation, but
ended up causing a structural shift in the composition of contracts. Despite various
countervailing reforms, the share of temporary employment stabilised at levels above
30 percent and remained there until 2008.
The excessive use of temporary contracts comes at a high cost. At a macroeco-
nomic level it is associated with high unemployment volatility and low productivity
growth. According to research by the IMF, Spanish employment is more sensitive to
changes in the growth rate of GDP than employment in any other industrialised coun-
try (IMF, 2010). Moreover, temporary employees receive less training than permanent
employees, which negatively affects productivity growth. At the individual level, the
main victims are youth. A large body of research has established that temporary
contracts fail to act as stepping-stones to regular employment for many entrants in
Spain (e.g. Amuedo-Dorantes (2000), Guell and Petrongolo (2007) or Garcıa-Perez
and Munoz-Bullon (2011)). Moreover, recent research by Garcıa-Perez, Marinescu
and Vall Castello (2016) suggests that the 1984 reform imposed lifetime losses on
low-educated entrants in the form of lower earnings and fewer days of work.
In this paper we update some of this evidence with the use of data from adminis-
1
trative sources and the Spanish Labour Force Survey (LFS). The analysis is divided
in four parts and pays particular attention to the recent rise in the number of short-
duration contracts.
The first part of the analysis offers an account of the institutional factors that
contribute to the high incidence of temporary employment in Spain. The discussion
highlights the key role of the dual nature of Spain’s employment protection legislation
(EPL). Historically, the Spanish legislation offered comparatively high levels of pro-
tection for employees with permanent jobs, while the use of temporary contracts is de
facto almost liberalised since 1984. This large gap in the stringency of EPL provides
a strong incentive for the creation of temporary jobs and induces a high degree of
rotation since firms are reluctant to upgrade temporary workers to a permanent job.
Recent reforms have reduced the size of the gap, but these measures have not resolved
the problem.
The second part of the analysis offers basic comparative evidence on the use of
temporary contracts. A prime objective of this part is to show that the comparatively
high incidence of temporary contracts in Spain cannot be attributed to economic fun-
damentals such as the sectoral composition of GDP or employment. Seasonal activities
make up a larger share of employment than in most other European countries, but
a straightforward decomposition of the international differences in the share of tem-
porary employment indicates that this feature explains less than 20% of the observed
differences. The remaining 80% is due to within-sector differences in the share of
temporary contracts, with Spain heading the ranking in most sectors and occupations.
After this first exploration of the data, we proceed with a detailed analysis of the
recent rise in the share of short-duration contracts. Using official administrative data
we document a strong rise in the number of contracts that last less than a week.
Nowadays, these contracts make up more than 25% of all employment contracts, and
in parallel we observe a decline in the number of temporary contracts with an unknown
termination date or a planned duration of more than three months. Average contract
length is therefore diminishing which explains why the total number of contracts is
breaking historical records while total employment is still well below its pre-crisis peak.
Interestingly, the Spanish LFS fails to capture this trend. Due to its quarterly
2
frequency, the LFS captures only a fraction of the short-duration employment spells.
This feature generates a time-aggregation bias that seems to have become stronger
in recent years. It is important to stress that the rise in short-duration contracts
is unrelated to the reforms adopted during the crisis. The growth in short-duration
jobs started well before the crisis and is concentrated among low-educated workers
and in sectors like accommodation and food service activities. To some extent, short-
duration contracts may therefore act as an alternative for the zero-hour contracts
that are increasingly used in countries like the Netherlands or the UK. Furthermore,
outsourcing and recent technological advances may have made it easier for firms to
hire workers for the exact duration of specific tasks. The latter might explain why 11%
of the shortest contracts are formalised by firms in the manufacturing sector, which is
a sector that tends to offer high levels of employment stability.
Our data do not allow us to distinguish between these potential explanations. In-
stead, we use discrete-time duration models to analyse the implications of the rise in
the number of short-duration jobs for the already poor access to permanent employ-
ment. The analysis focuses on young workers below 30. Our results indicate that the
exit rate from unemployment to temporary employment is monotonically increasing
in the number of previous employment spells. By contrast, the exit to permanent em-
ployment follows an inverted-U pattern, suggesting that the accumulation of a large
number of employment spells penalises job seekers. Finally, in an extension we di-
rectly estimate the time it takes entrants to find their first permanent job. The results
confirm the deterioration in the access to permanent employment, but the bulk of the
effect is due to the deterioration in the aggregate labour market conditions.
2 Institutional background
As mentioned in the Introduction, the Spanish labour market is characterised by
marked differences in the stringency of employment protection for permanent and
temporary jobs. The dual nature of EPL can be traced back to reforms in the early
eighties.
At the time, the first democratic governments were struggling to find viable ways to
dismantle the rigid system of industrial relations prevailing under the Franco regime.
3
The 1980 Workers’ Statute had introduced a system of collective bargaining and more
generous unemployment insurance, but it had preserved the existing EPL provisions
and imposed strong limits on the use of temporary contracts. However, the deterio-
ration of the labour market in the aftermath of the oil crises forced the authorities
to implement further reforms. In 1984, this resulted in the far-reaching decision to
liberalise the use of fixed-term contracts, a classic example of a partial reform that
introduces flexibility at the margin and preserves the rights of incumbents.
The liberalisation was achieved through the introduction a new temporary contract
(contrato temporal de fomento de empleo) with low levels of protection that could
be used for any kind of activity, while the stringency of employment protection on
permanent contracts was left unchanged. Besides stringent judicial control, the Law
entitled permanent employees to generous redundancy payments that amounted to 45
days of salary per year of service with a maximum of 42 monthly wages in case of
an unfair dismissal. The Law also contained provisions for fair dismissals with lower
severance pay — 20 days of salary and a maximum of one year of salary — but access
to the fair dismissal procedure was only granted on rare occasions. It is therefore
no surprise that soon after the reform almost all hires were channeled via fixed-term
contracts.
Faced with this unforeseen explosion in the number of temporary contracts, the
Spanish authorities have adopted a string of countervailing reforms1, but none of them
were a success. The first mayor reform, in 1994, added economic distress of the firm
to the objective causes for dismissal and suppressed the contrato temporal de fomento
de empleo — which was originally conceived to be in place for three years. De jure,
the reform once again restricted the use of temporary contracts to seasonal and fixed-
duration activities, including training, but de facto these causality conditions have
hardly been enforced since 1984. All later reforms adopted similar measures to reduce
the gap in EPL between permanent and temporary jobs and the most recent reforms
increased the degree of internal flexibility in order to offer firms alternative channels
of adjustments (hours adjustments, geographic and functional mobility etc.).
1For a detailed description of the reforms in the period between 1980 and 2006, see Bentolila etal. 2008.
4
The 1997 reform introduced a new open-ended contract (contrato de fomento de la
contratacion indefinida) with reduced redundancy pay provisions for unfair dismissal
— 33 days of wages per year of service with a maximum of two years of salary — for
targeted groups. At the same time, the reform strengthened the causality principle for
temporary contracts. Four years later the coverage of the new permanent contract was
extended and a 2002 reform introduced a fast-track dismissal procedure for permanent
employees. Law 45/2002 allowed firms to bypass judicial control and the need to pay
interim wages by acknowledging the unfair nature of the dismissal and by paying the
worker the corresponding severance payment. Finally, in 2006 the coverage of the new
permanent contract was once again extended to include more groups and this measure
was combined with the introduction of generous social security rebates to promote the
creation of permanent jobs.
The above system was in place at the start of the recent economic and financial
crisis. Since that time, Spain has enacted three more reforms. The 2012 reform is
doubtlessly the most profound one. Insofar as EPL is concerned, the reform gener-
alised the permanent contract with reduced severance pay (33 days) and redefined the
economic causes for fair dismissals. Under the current rules dismissals are deemed fair
if a firm suffers a persistent drop in the value of its ordinary sales or revenues during
three consecutive quarters. Moreover, strictly speaking, the 2012 reform limits the
intervention of judges to the verification of the existence of the objective causes for
dismissal and the compliance with the procedural rules.2 The new definition of the
objective causes applies to all layoffs and in the case of collective dismissals the reform
suppressed the need for prior administrative approval. Finally, the reform reinstated
a maximum limit of two years for temporary contracts — which had been suppressed
under the pressure of the Troika — while the 2010 introduced a minor and gradual
increase in the level of redundancy pay on temporary contracts from 8 to 12 days of
salary.
The overall result is a significant reduction in the stringency of employment pro-
2The reform also suppressed the fast-track dismissal procedure, but this measure is of little prac-tical importance because the reform also eliminated the need to pay interim wages to workers in caseof an unfair dismissal. Nowadays firms only have to pay interim wages in case a dismissal is declarednull due to a violation of a worker’s fundamental rights.
5
tection on regular (permanent) jobs. The current value of the OECD indicator for the
strictness of EPL on regular jobs is close to the OECD average and substantially lower
than the corresponding indicator for the Netherlands (see Figure 1). By contrast,
the EPL indicator for temporary jobs is still far above the OECD average, but it is
important to take into account that the indicator measures the de jure strictness of
EPL. Hence, the lack of enforcement of the causality of temporary jobs is not reflected
in the indicator (e.g. Bentolila et al. 2012). Similarly, the indicator for regular jobs
overstates the impact of the 2012 reform as it does not reflect various posterior rulings
of Spanish courts that reintroduced key conditions for fair dismissals that had been
eliminated by the 2012 reform.3
Figure 1: OECD indicators for the strictness of employment protection on regular andtemporary jobs, 2008 vs. 2013
3Two examples are the principles of proportionality and the “reasonableness” of dismissals. Bothconditions were removed from the Law by the 2012 reform. The new regulation of the economicreasons for dismissal simply require a drop in the firm’s results without any reference to the size ofthe drop or the need of a proportional response.
6
Source: Own elaboration with data from the OECD Employment Protection Database. The indicator
for the strictness of EPL on regular jobs corresponds to the variable EPRC V3.
3 Comparative evidence
In this section we report elementary data to illustrate the comparatively strong use of
temporary contracts in Spain.
As a starting point for the analysis, Figure 2 illustrates the evolution of the share of
temporary jobs in a selected group of countries. In the case of Spain, we observe a
strong rise in the share of temporary jobs in the aftermath of their liberalisation in
1984. In the early nineties, the share of temporary jobs stabilised at a level of around
one-third of total salaried employment and, despite the numerous reforms, it remained
at this level until the start of the recent crisis. During the crisis we observe a marked
decrease in the share of temporary jobs to levels below that of Poland, but this drop is
driven by the disproportionate destruction of temporary jobs during the crisis. From
peak to through the drop in temporary jobs accounted for almost two-thirds of the
drop in employment while they only accounted for one-third of total employment at
the onset of the crisis. Moreover, since the start of the recovery in 2014, the share of
temporary jobs is on the rise again and nowadays Spain is creating more temporary jobs
than ever (See Section 4). These strong cyclical movements in the share of temporary
jobs contrast with the gradual increase in the weight of temporary jobs in Netherlands
and the rather stable share in Portugal and the rest of Europe. Spanish employers
clearly use temporary jobs as a buffer stock against shifts in their demand.
7
Figure 2: Percentage of temporary employees in selected European countries, 1987-2016 (%)
Source: Own elaboration with European Labour Force Survey data of Eurostat. Temporary employees
is measured as percentage of total number of employees aged 15 to 64 [lfsa etpga].
Besides the marked movements in the share of temporary jobs, there are no noticeable
trends in non-standard employment in Spain, as illustrated by Figure 3. The share of
self-employed is high by international standards, but relatively stable for more than a
decade, while part-time jobs are under-utilised compared to most European countries.
The overall implication is that full-time open-ended positions made up only 50% of
total employment in 2005. Nowadays, this figure is somewhat higher due to the drop
in the number of temporary positions, but even so the share of standard jobs still
lies below 54 or 58%, depending on whether or not voluntary part-time positions are
considered to be part of standard employment.
8
Figure 3: Non-standard employment in Spain, 2005-2017 (% of total employment)
Source: Own elaboration with European Labour Force Survey data from Eurostat. NACE Rev. 2
classification of sectors.
The differences are not restricted to worker characteristics. Similar patterns are ob-
served when we consider a breakdown by firm or job characteristics. Due to space
limitations, we restrict attention to the sector of activity.5 Inspection of Figure 4
shows that Spain has substantially higher shares of temporary jobs in all sectors when
5Eurostat offers comparative data on the share of temporary jobs by occupation. Among theEU15 countries, Spain ranks first in six out of nine occupations. Moreover, in relative terms thedifferences are largest for skilled occupations like managers, professionals and craft workers. Eurostatdoes not offer comparative data on the share of temporary employment by firm size, but the dataof the Encuesta de Coyuntura Laboral reveal that the shares of temporary employees converged tolevels above 30% for firms of all sizes in the years prior to the crisis. This convergence arose througha strong rise in the share of temporary jobs in large firms with more than 250 employees, from a levelof 20% in 1993 to levels above 30% in 2006. By contrast, the share of temporary employees in smallfirms with less than 10 employees dropped by 15 pp between its peak in 1997 and the start of the
11
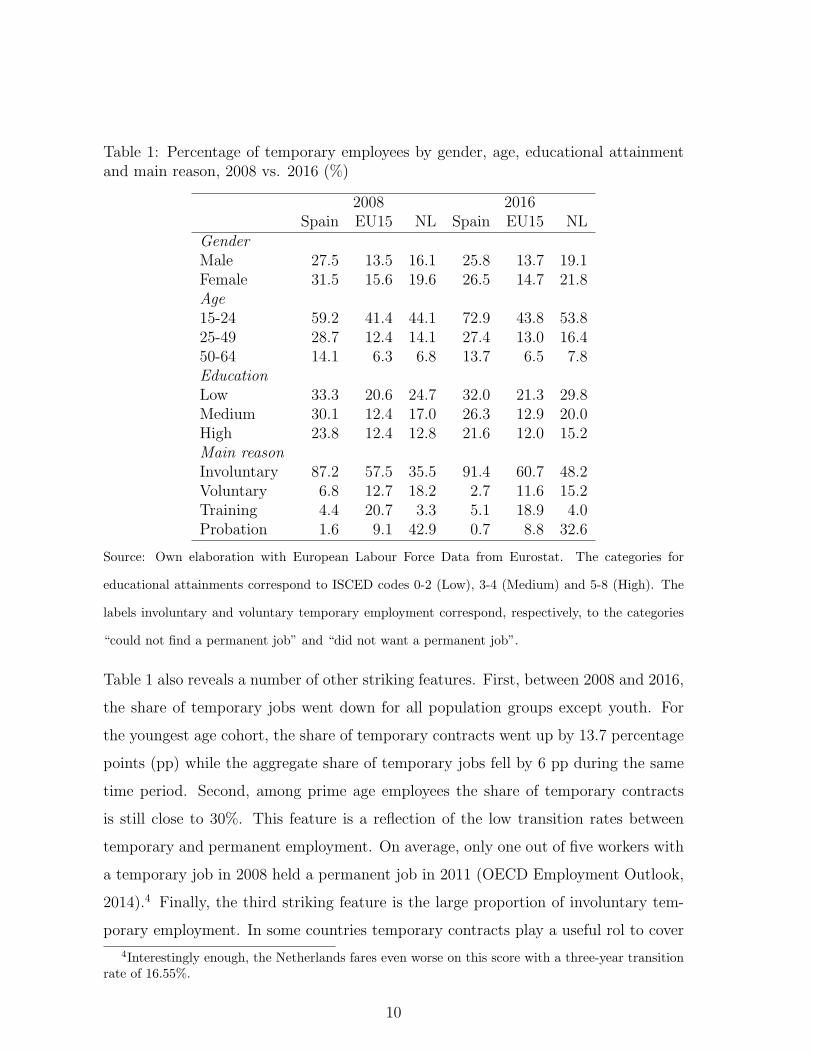
compared to the average shares for the EU15 Member States. Traditionally, Spanish
employment is also more concentrated in seasonal activities, like construction or ac-
commodation and foodservice activities, than employment elsewhere in Europe. How-
ever, the differences in the sectoral composition of employment contribute much less
to the cross-country differences in the aggregate shares of temporary employment than
the within-sector differences in the shares of temporary jobs. In other words, Spain
does not have a higher share of temporary jobs because construction or the foodservice
industry make up a larger share of total employment than elsewhere in Europe, but
because employers in these sectors make a more intensive use of temporary contracts
than their counterparts in the rest of Europe.
To formalise this point, one can perform a simple shift-share analysis. In particular, let
T j and T ji denote the aggregate and sector-specific shares of temporary employment
in a given country j and let ωji denote the share of employment in sector i in total
salaried employment in country j. This allows us to decompose the pairwise difference
between the share of temporary jobs in Spain and some other country j as follows:
T sp − T j =∑i
T spi (ωsp
i − ωji ) +
∑i
ωji (T
spi − T
ji )
The first term on the right-hand side measures the contribution of the differences in
the sectoral weights of employment while the second term measures the contribution
of the within-sector differences in the share of temporary employment to the overall
differences in the shares of temporary employment. The results are reported in Table
7 in the Appendix. Inspection of the Table confirms that the differences in the compo-
sition of employment play at best a modest role. For seven out of fourteen countries,
they account for less than 10% of the observed differences in the aggregate shares of
temporary jobs and for all but two countries they contribute less than 20%. Once
more, the case of the Netherlands is a noteworthy exception. Besides being the coun-
try with the second-largest share of temporary jobs behind Spain, the Netherlands
crisis in 2008 and this is followed by another 10 pp drop in the period between 2008 and 2012. Hence,the stable share of temporary employees in the pre-crisis periods hides important changes in the useof temporary employees by firms of different sizes. Another striking change in the composition oftemporary employment that is not reflected here is the strong rise in the use of temporary jobs inthe public sector.
12
is also the only country for which the differences in the sectoral composition of jobs
explain more than half (59.01%) of the observed differences in the shares of temporary
jobs.
Finally, the relatively stable share of temporary employment in the pre-crisis periods
hides a number of relevant shifts, such as the convergence in the shares of temporary
employees of large and small firms, or the increasing share of temporary employment in
the public sector (see footnote 5). But in the next sections we will focus our attention
on the recent surge in short-duration jobs.
4 The recent rise in short-duration contracts
The evidence presented so far allowed us to show that Spain is an outlier regarding
the use of temporary contracts, but the labour force survey data offer an incomplete
picture. The survey data indicate that the share of temporary employees is lower than
before the crisis. Total employment is also lower than before the crisis, but as shown
below, the total number of new contracts is breaking all-time records. To understand
this apparent contradiction, we need to rely on official contract data and social security
records. These administrative data sources capture all employment spells, while the
LFS data underestimates the number of short-duration spells due to a time aggregation
bias that seems to have aggravated in recent times.
Figure 5 illustrates the apparent paradox. The dashed line in the left panel reproduces
the evolution of the share of temporary employees. At the start of 2016, this indicator
was still around 7 percentage points below its pre-crisis peak. By contrast, the number
of temporary contracts has reached a record level in 2016 and we observe no significant
changes in the share of temporary contracts. For the last 20 years or so, the annual
share of temporary contracts has been constant at around 91.5%.6
6The transitory reduction in the period 2006-2008 is a reflection of a reform in that introducedtemporary incentives for the creation of permanent jobs.
13
Figure 5: Total number of employees and new contracts by contract type, 1985-2016
Note: The data on contracts exclude household staff. Sources: Spanish Labour Force Survey (EPA,
INE) and Estadıstica de contratos (SEPE).
The explanation for the apparent contradiction presented above is a reduction in the
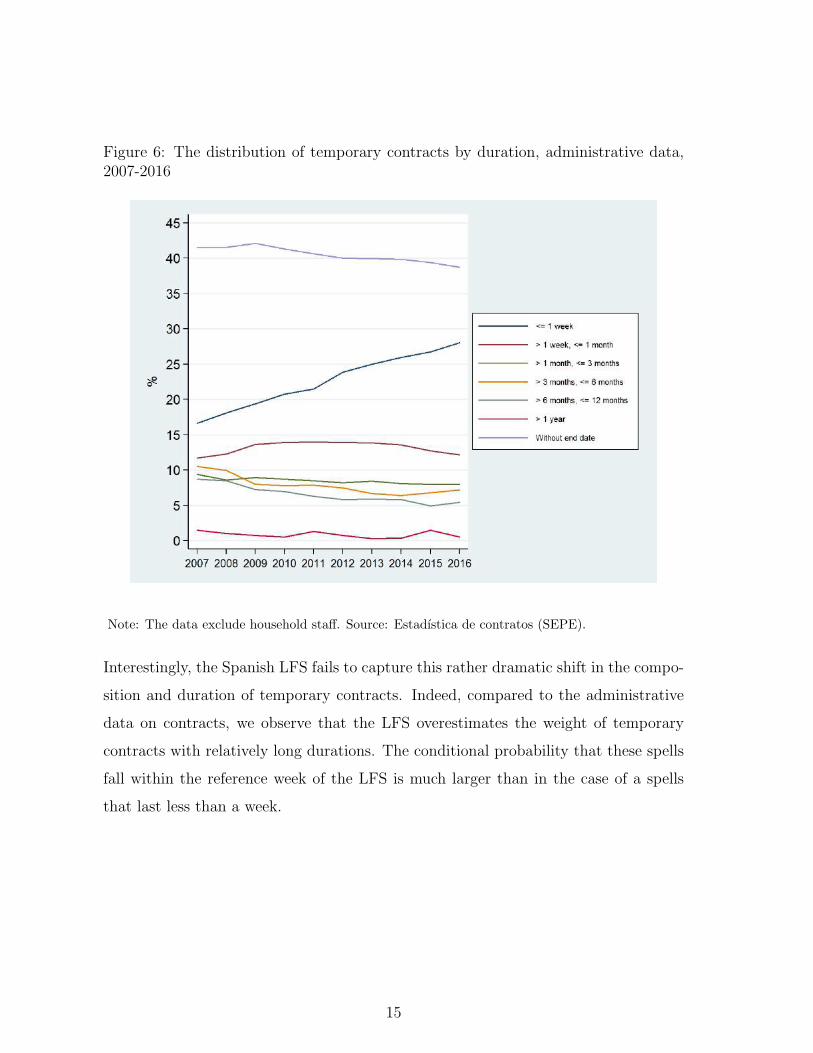
average duration of contracts. This is illustrated in Figure 6. During the last ten
years, both the fixed-term contracts with the longest durations (above 3 months) and
the temporary contracts without a specified termination date (contratos de obra and
servicio) have lost weight and, in parallel, we observe a steep increase in the number
of fixed-duration contracts that last less than a week. At current, more than one out
of four new contracts in Spain lasts between one and seven days.
14
Figure 6: The distribution of temporary contracts by duration, administrative data,2007-2016
Note: The data exclude household staff. Source: Estadıstica de contratos (SEPE).
Interestingly, the Spanish LFS fails to capture this rather dramatic shift in the compo-
sition and duration of temporary contracts. Indeed, compared to the administrative
data on contracts, we observe that the LFS overestimates the weight of temporary
contracts with relatively long durations. The conditional probability that these spells
fall within the reference week of the LFS is much larger than in the case of a spells
that last less than a week.
15
Figure 7: The distribution of temporary contracts by duration, LFS data, 2007-2016
Source: The Spanish Labour Force Survey (EPA, INE).
Similarly, a casual observation of the LFS data would suggest that on an annual basis
less than 30% of employees is working on a temporary contract. However, the actual
figure is much bigger as shown in Figure 8. The blue line represents the share of
workers who appear as employed at some point during a year and who have had least
one temporary contract. This alternative indicator follows the same pattern as the
annual average of the share of temporary employees constructed with LFS data, but
the difference between the two indicators is almost 15 percentage points. Moreover,
the share of individuals who have only worked on temporary contracts during a given
year (red line) also dropped during the crisis, but this indicator has already recovered
its pre-crisis values in contrast to the two previous indicators.
16
Figure 8: Alternative indicators of temporary employment
Sources: The Spanish Labour Force Survey (EPA, INE) and social security records (MCVL).
This last feature clearly seems related to the increase in the degree of rotation on the
Spanish labour market due to the increase in the number of short-duration contracts.
To corroborate this claim, Figure 9 reports the distribution of the number of contracts
per individual who signed a new contract in any given year. Inspection of the Figure
shows a trend decrease in the share of individuals who signed one contract per year
and a rise in the average number of contracts per person starting in 2010. Almost
one-third of the workers who were hired in 2016 signed three or more contracts during
that calendar year.
17
Figure 9: The distribution of number of contracts per new employee, yearly averages.2009-2016
Note: The data exclude household staff. Source: Estadıstica de contratos (SEPE).
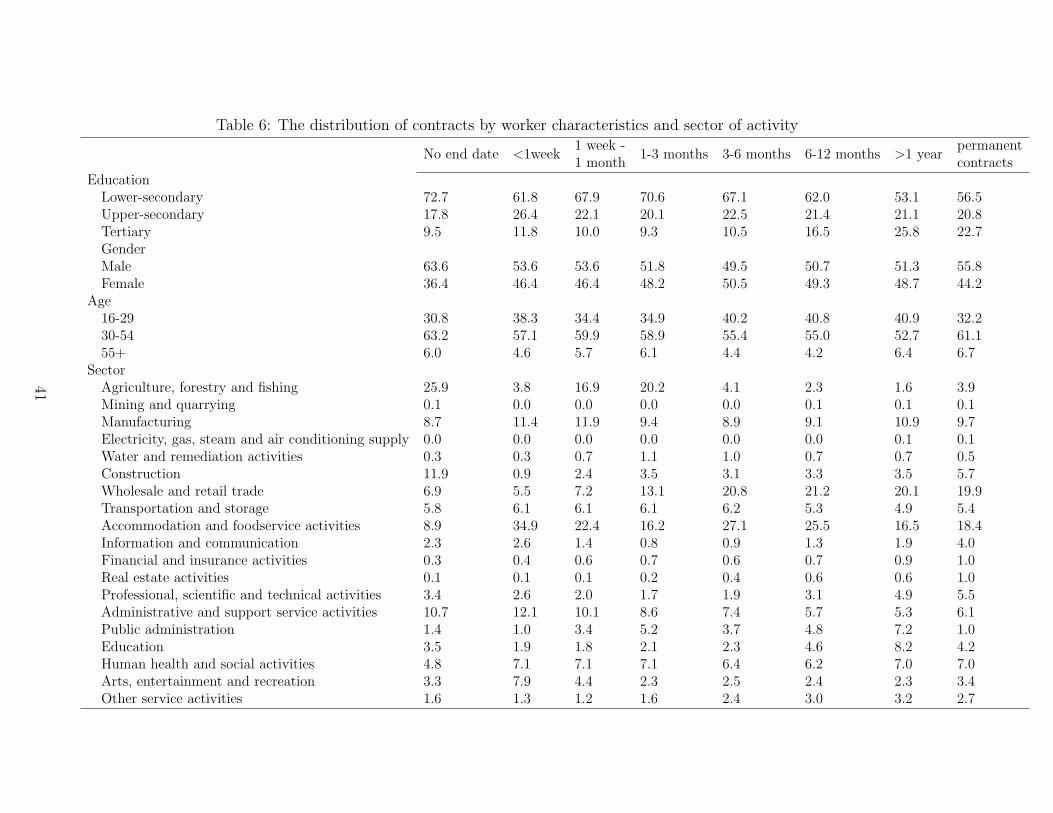
Next, in Table 6 (Appendix) we report the distribution of contract length by worker
characteristics and sector of activity. Inspection of the Table shows that the short-
duration contracts of less than a week are concentrated among low-educated workers
and employees in the accommodation and foodservice sector. This sector has experi-
enced relatively strong growth in recent years, but even so it accounts for less than
9% of total employment, while the employers in this sector have formalised more than
one-third of all the contracts that lasted less than a week in 2016. Moreover, in many
cases the workers repeatedly sign short-duration contracts with the same employer.
Nonetheless, it would be a mistake to conclude that that the surge in short-duration
contract simply reflects a boom in the tourism sector. Almost twelve percent of the
fixed-term contracts of less than a week are formalised in the manufacturing sector,
which is a sector that typically offers a relatively high level of employment stability to
18
its employees.
Finally, so far, we have not made a distinction between regular employment contracts
and contracts with Temporary Work Agencies. The data, presented in Figure 10 reveal
that the former explain the bulk of the increase in the number of short-duration con-
tracts. By contrast, the short-duration contracts offered by Temporary Work Agencies
only experienced a modest increase over the last eight years, and nowadays they make
up a much smaller fraction of the short-duration contracts in Spain than before the
outbreak of the crisis.
Figure 10: Short-duration contracts by type of employer, firms vs. temporary workagencies. 2008-2016
Source: Estadıstica de contratos (SEPE).
The evidence presented in this Section documented a clear increase in the extent of
precarious temporary contracts. The average duration of temporary contracts has
decreased and a growing number of individuals rotate on short-duration contracts,
mostly against their will. This has important implications for income inequality, be-
cause temporary contracts offer worse conditions than permanent contracts and these
differences have widened during the crisis due to the sharp decrease in hiring wages.
Moreover, it is important to stress that the deterioration in the stability of temporary
contracts started before the crisis. Hence, it would be a mistake to attribute this phe-
19
nomenon to the labour market reforms adopted in the crisis, although these reforms
neither managed to mitigate the deterioration.
The answer therefore has to be sought in changes in the employment policies of firms.
In particular, the digital revolution not only facilitates the matching process between
firms and job seekers, it also facilitates the increasing use of work on demand. Call
or zero-hour contracts are not permitted in Spain, but firms can achieve virtually the
same flexibility through the use of short-duration contracts. But this has the drawback
that the workers do not benefit from the protection of a contract between one task and
the next. We leave the analysis of this issue for later work. In the rest of the analysis
we want to assess how the rise in the number of short-duration contracts has affected
the transition from temporary to permanent employment.
5 Empirical analysis
This section presents our empirical results on the impact of temporary contracts on
the transition to permanent employment. Previous research for Spain (Guell and
Petrongolo (2007), Garcıa-Perez and Munoz-Bulon (2011)) has shown that temporary
contracts fail to act as stepping stones to permanent jobs for broad categories of labour
market entrants. The key objective of this section is to assess whether the recent surge
in short-duration contracts has widened the gap between temporary and permanent
jobs even further. We begin this section by explaining our empirical approach, we
then move on to describe the key characteristics of the sample, and we end the section
with a discussion of our main results.
5.1 Estimation strategy
We assume that individuals move between three mutually exclusive states, unemploy-
ment (or, more rigorously, nonemployment), temporary employment and permanent
employment. Since we are interested in analysing the transitions between these labor
states, our empirical model will consider the joint estimation of the exit or hazard
rates out of both employment and unemployment.
We specify these hazard rates, denoted by h(t), using a discrete-time duration model
20
(Jenkins 1995):
h(t) = Pr(T = t | T ≥ t),
where T is a discrete random variable denoting either employment or unemployment
duration. The hazard h(t) therefore measures the conditional probability of a transi-
tion for a person who has remained in the same state for exactly t periods. We allow
multiple destinations from each state, i.e. we employ a competing risks model for each
state and throughout the analysis we control for unobserved heterogeneity using the
approach of Heckman and Singer (1984).
Our framework is similar to the one used in Bentolila, Garcıa-Perez and Jansen (2017)
which, in turn, builds on Carrasco and Garcıa-Perez (2015) and Rebollo and Garcıa-
Perez (2015). The main difference with these studies is that our expressions for the
hazard rates include controls for the entire employment history of the young individ-
uals in our sample. This is captured by a set of dummies for the number of previous
employment spells since a person’s entrance into the labour market. The inclusion of
these dummies allows us to verify how the recurrence of temporary contracts affects
the job finding probability of the unemployed, the subsequent length of a spell of tem-
porary employment and, last but not least, the likelihood of a transition to permanent
employment.
Besides these controls for the previous employment history, the hazard rate of unem-
ployed individuals depends on unemployment duration, t, and on a vector of variables
x(t) that includes a set of individual, sectoral, and aggregate variables described below.
It also depends on the person’s unemployment benefit entitlement, which is captured
by two variables. The first one is a dummy variable, b(t), that takes the value one
when the worker is receiving an unemployment subsidy in period t. The second one is
a discrete variable e(t) that captures the remaining months of entitlement for persons
who are eligible to contribution-based unemployment benefits and who exercised this
right.7 These two benefits variables and some variables in x(t) are allowed to have
heterogeneous effects over the unemployment spell through their time-varying coeffi-
cients, αi(t), which feature an interaction with log duration. In the case of e(t) this
7Individuals may optimally decide not to exercise their right to unemployment benefits or maybe unaware of their entitlements. In both cases we are treating the individuals as if they are notentitled.
21
is modelled by allowing α3(t) to be a cubic polynomial in log duration.8 Accordingly,
the unemployment hazard rate has the following structure:
hju(t) = Pr(Tu = t | Tu ≥ t, x(t), b(t), e(t), ηu) = F (αj0(t)+α
j1(t)x(t)+αj
2(t)b(t)+αj3(t)e(t)+η
u)
where j = eT , eP denotes, respectively, the two alternative exits from unemployment,
i.e. employment with a temporary contract and with a permanent contract. The last
term in the formula captures time-invariant unobserved heterogeneity and is discussed
below.
The exit from employment is also estimated using a competing risks model and all co-
efficients in these hazard rates are allowed to differ between temporary and permanent
employees. The two competing risks for employed workers are moving to a perma-
nent job, ep and moving to unemployment, u. Direct transitions between temporary
contracts, without an intervening spell of unemployment, are treated as continued em-
ployment. This assumption allows us to focus on the role of temporary contracts as
stepping stones to permanent jobs.
Accordingly, the employment hazard rate has the following specification:
hke(t) = Pr(Te = t | Te ≥ t, x(t), ηe) = F (βk0 (t) + βk
1 (t)x(t) + ηe)
where k = ep, u and e = eT , eP . The vector x(t) is the same as in the unemployment
hazard except that it also includes a set of dummies to control for the length of the
last unemployment spell.
Following Bover et al. (2002) and Garcıa-Perez and Munoz-Bulon (2011), we use
a logistic distribution to model all hazard rates.9 Moreover, as we are considering
competing risks models for both employment and unemployment, exit from a given
state needs to be specified as a multinomial logit model with two alternative risks for
each state:
hu(t) = heTu (t) + hePu (t)
8This is a departure from Rebollo and Garcıa-Perez (2015), who assume linearity.9We could have alternatively used the extreme value distribution. As explained in van den Berg
(2001), this distribution allows the model to verify the mixed proportional hazard assumption. Ourapproach departs from the proportionality assumption, at the cost of imposing more structure, be-cause we want to allow the potential impact of duration and of both observed and unobserved het-erogeneity on the exit from employment and unemployment not to be proportional.
22
he(t) = hepe (t) + hue (t)
Lastly, as mentioned before, we control for unobserved heterogeneity affecting the
flows both to and from unemployment. This is captured by the terms ηu and ηe in
the expressions for the hazards. In particular, we allow a four-mass-point distribution
function, namely two different points for each state, ηu1 and ηu2 for unemployment,
and ηe1 and ηe2 for employment, so that four different types may emerge with joint
probabilities, namely: (ηu1 , ηe1), (ηu1 , ηe2), (ηu2 , ηe1), and (ηu2 , ηe2). Standard errors for the
estimated coefficients are computed using the delta method.
5.2 Data, sample selection and control variables
Our initial data set is a 20% random sample of young males aged 16 to 30 whose
records appear in the nine waves of the Continuous Sample of Working Lives (Mues-
tra Continua de Vidas Laborales or MCVL) corresponding to the period 2006-2016.
The MCVL is an administrative dataset with longitudinal social security records that
cover the entire working history of a random sample of 4% of the persons who pay
Social Security contributions. This includes the employed and the non-employed who
receive unemployment benefits or subsidies. The MCVL does not provide information
about job search activity, and so we cannot distinguish between unemployment and
inactivity. Moreover, nonemployed individuals drop out of the records if they stop
receiving benefits. This is however not a problem, since the length of completed spells
of nonemployment can be reconstructed using the information on the subsequent job.
Finally, to exclude persistent nonparticipation, we limit nonemployment duration to
three years, after which spells are treated as censored. With this caveat in mind, we
take the license of referring to individuals without employment as unemployed rather
than as nonemployed.
Against this potential drawback, the MCVL data have crucial advantages vis-a-vis the
flow data from the labour force survey. They allow us to follow workers since the start
of their working careers –whereas the LFS only follows individuals for six quarters–
and they have a daily frequency, which permits the observation of all employment
spells –while many labor market transitions are missed in the LFS due to its quarterly
frequency.
23
In order to avoid problems concerning attrition, we only analyze employment spells in
the general Social Security regime, thus excluding special regimes such as agriculture
or public employment and treat exits from unemployment to these states as right-
censored (Garcıa-Perez 2008). Moreover, in the case of workers who are recalled to
the same firm, a feature which has become increasingly important in Spain (Arranz
and Garcıa-Serrano 2014), we only consider intervening unemployment spells lasting
more than 30 days.10 Lastly, to maximise the probability of observing the individual’s
complete work history, we exclude foreign-born individuals.
Our set of control variables includes both individual characteristics and aggregate
variables. The former comprise: (a) Age (measured in months) (c) Skill, divided into
high, medium-high, medium-low and low, and proxied by grouped Social Security tax
categories.11 (d) Actual experience, measured by the number of months employed
divided by the number of months of potential experience (i.e. those elapsed since the
person entered the labor market). (e) A dummy variable that captures whether the
worker was fired from his previous job. (f) A dummy variable that captures whether
the worker was working for a Temporary Help Agency (THA) in his previous job or
not. (g) Our controls for benefit entitlement.12 (g) Two sets of dummies for the
number of previous employment spells and the length of the last unemployment spell.
The aggregate variables included in the model are as follows: (i) Employment growth,
defined as the monthly growth rate of the number of employees by province. (ii) 17
region dummies. (iii) 6 industry dummies. (iv) 12 monthly dummies. And (v) two
step dummy variables for the labor reforms in June 2010 and February 2012, that take
the value one from those dates onwards.
Finally, the following variables are interacted with log duration: age, education, skill,
10Accordingly, two employment spells with the same firm which have an intervening unemploymentspell lasting less than 30 days are treated as a single employment spell.
11High skill includes college and junior college graduates (groups 1 to 3 in the Social Securityclassification), medium-high skill includes top and middle managers (groups 4 to 6), medium-low skillincludes administrative assistants and so-called first- and second-level officers (groups 7 and 8), andlow skill includes third-level officers and unskilled workers (groups 9 and 10), see Garcıa-Perez (1997).
12As explained before, contributory benefits are measured by the remaining months of entitlementin each month. The latter is computed from each individual’s employment and insurance claimhistory (since residual benefits not claimed in one unemployment spell can be claimed in a laterspell). Workers having access to two different sets of benefit entitlements must choose between them.We assume that they choose the one with the higher length. For more information see Rebollo andGarcıa-Perez (2015).
24
the THA dummy, unemployment benefits (linear and quadratic), unemployment sub-
sidies, employment growth, national unemployment rate, and industry.
5.3 Descriptive statistics
Table 2 shows the main characteristics of the individuals in our sample when they
enter unemployment. We separately report statistics for the expansion (2001-2007)
and the recession (2008-2016).13
Inspection of the Table shows the prevalence of individuals with low levels of educa-
tional attainments and skills. In the expansion, 63.2% of the individuals had no more
than mandatory education and three out of four held a job in the lowest two occupa-
tional categories. As the reported data refer to worker inflows rather than stocks, we
are over-sampling low-skill workers as they move in and out of unemployment more fre-
quently than high-skill workers. On average, the individuals are employed around 65%
of the time and this number only changes marginally in the recession. The majority
of the individuals in the sample have accumulated up to four employment spells, but
22.5% of the individuals had accumulated more than 7 spells in the expansion and in
the recession this number increased to 29.5%, in part due to the increase in the age of
the unemployed. Furthermore, we observe a marked shift in the distribution by sector
of activity. The most notable change is the drop in the percentage of unemployed from
the construction sector, but we also observe a decline in the share of manufacturing
and a strong increase in the share of service sectors. Finally, the vast majority of the
unemployed are not entitled to benefits.
13The period “2008-2016” includes the double-dip recession (2008-2013) and the start of the recov-ery (2014-2016). However, for the sake of brevity we refer to this period as recession.
25
Table 2: Descriptive statistics of worker characteristics, Males (%)
Expansion RecessionMean St. dev. Mean St. dev.
Age16-20 years old 27.3 (44.6) 17.4 (37.9)21-25 years old 40.3 (49.0) 40.2 (49.0)26-30 years old 32.4 (46.8) 42.3 (49.4)
C. Hazard rates out of unemployment (%)Exit to a temporary job
No benefits 15.3 8.7Contributory benefits 8.3 5.5Assistance benefits 7.8 5.3
Exit to a permanent jobNo benefits 1.1 0.8Contributory benefits 0.7 0.6Assistance benefits 0.7 0.5
Number of spells 73,480 64,475
Note: The sample is made up of males aged 16-30 years old. The expansion corresponds to the period
2001-2007 and the recession to 2008-2016. Shares of spells add to 100 by column.
28
5.4 Baseline empirical results
We now proceed with a discussion of our estimation results. The coefficient estimates
are reported in Tables 8-11 which offer the results for the two possible exits from un-
employment and temporary employment.14 Once again we offer separate results for
the expansion and the recession. This is important because the role of co-variates
like educational attainment has changed significantly since the outbreak of the cri-
sis. In particular, for many years the boom in the construction sector generated a
strong demand for low-educated workers. This feature helps to explain the negative
coefficients of post-mandatory secondary and tertiary education in the exit rates from
unemployment during the period 2001-2007. In the recession these coefficients have a
positive change sign and for the exit from unemployment to permanent employment
(Table 9) we obtain the standard monotonic relationship between the exit rate and
education. This feature is illustrated in Figure 11. The reported hazard rates are
derived by setting all co-variates except education and duration at their average value
during the sample period. Inspection of the Figure shows that the monthly hazards
start at levels below 2% and quickly decay with duration.
14Results for permanent employment are available from the authors upon request.
29
Figure 11: Exit from unemployment to permanent employment by level of educationalattainment and duration, monthly hazard rates, 2008-2016 (%)
Source: own computations.
The rest of the co-variates has the expected sign. The exit rates out of unemployment
increase with the skill level and experience of the workers and decrease with duration.
Moreover, unemployment benefits delay the exit to both types of jobs, while stronger
employment growth fosters quicker exits from unemployment, especially in the reces-
sion. Finally, the interactions between unemployment duration and local employment
growth and remaining unemployment benefit entitlement are highly significant.
Turning now to the role of temporary contracts, we obtain a number of suggestive
results. First, the exit rate from unemployment to temporary employment is mono-
tonically increasing in the number of previous employment spells. Hence, other things
equal, the unemployed are more likely to exit to a temporary job if they have accu-
mulated a larger number of employment spells. This pattern is observed in both the
expansion and the recession and the coefficient estimates are highly significant. By
contrast, the exit rate from unemployment to permanent employment exhibits an in-
verted U-pattern. It reaches a maximum when a worker has accumulated, respectively,
5 to 6 employment spells in the expansion and 7 to 8 spells in the recession. In other
words, beyond a certain number of spells, further spells of temporary employment pe-
30
0.0
05
.01
.015
.02
3 6 9 12 15 18 21 24 27 30 33 36Unempl. Duration
1−2 Temp. C. 7−8 Temp. C.
11+ Temp. C.
Figure 12: Exit from unemployment to permanent employment by duration and num-ber of previous temporary contracts, monthly hazard rates, 2008-2016 (%)
Source: own computations.
nalise the unemployed. This feature is illustrated in Figure 12. It shows that the exit
rate from unemployment to permanent employment is lower for individuals with 11
spells of temporary employment than for similar individuals with at most 8 previous
employment spells.
The apparently negative effects of the accumulation of a large number of contracts
also show up in the transitions from temporary unemployment to unemployment. The
results reported in Table 10 indicate a negative relationship between the duration
of a temporary contract and the number of previous employment spells. The latter
suggests that individuals who have signed many short-duration contracts in the recent
past are also more likely to be engaged in short-duration temporary contracts in the
future. However, it is important to stress that our estimations do not allow a causal
interpretation. Some individuals may have a preference for temporary jobs and the
causality between the number of employment spells and the expected duration of
temporary contracts may even go in the opposite direction. In particular, the fact that
short-duration contracts are prevalent in specific sectors or occupations may explain
that the workers in these sectors tend to accumulate a large number of employment
spells. We intend to control for these features through the introduction of sector and
31
occupation fixed effects and controls for differences in observable and unobservable
characteristics. But this does not solve the fundamental problem that the number and
the length of employment spells is an endogenous choice variable.15
Last but not least, the number of previous employment spells seems to play less of
a role in the direct transitions from temporary to permanent contracts (see Table
11). Most of the coefficients for the variable that captures the number of previous
employment spells are insignificant in the expansion and at best border-line significant
in the recession.
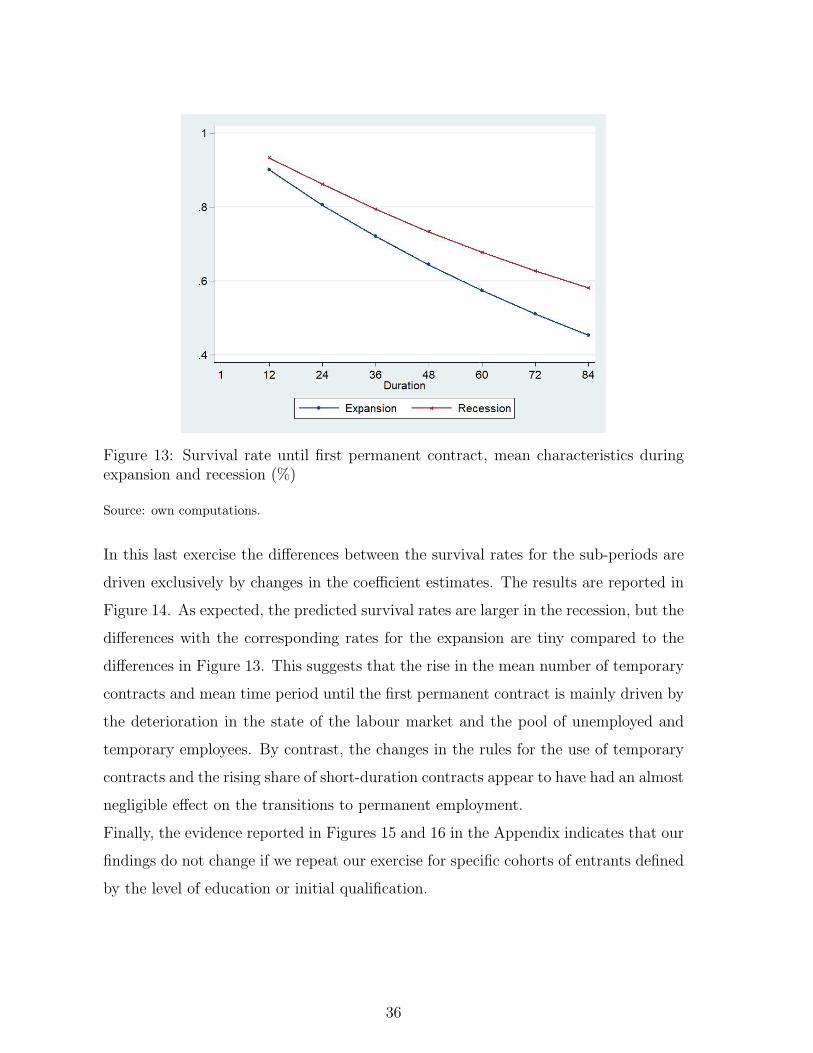
Survival rates
To finish our discussion of the baseline results, Table 4 reports the survival rates in
unemployment at 12 months.16 These survival rates are a convenient way to asses
the marginal impact of individual characteristics and to quantify the risk of long-term
unemployment for individuals with different employment histories. Long-term unem-
ployment increased strongly during the crisis in Spain and our results indicate that the
risk of entering long-term unemployment is substantially reduced by the accumulation
of work experience in temporary contracts. In the expansion the risk of long-term un-
employment is four times bigger for entrants with no more than two contracts previous
than for individuals who have accumulated 9 to 10 contracts. In the recession the dif-
ferences are smaller in relative terms but in absolute terms, the effects are bigger than
during the expansion. In this respect it is important to recall that we are comparing
individuals of the same age and with similar work experience. On average, the indi-
viduals with fewer contracts have spent more time in unemployment and this exerts
a negative impact on their exit rate from unemployment due to duration dependence.
In other words, the accumulation of a large number of temporary contracts may harm
an individual’s chances on a permanent job, but at the same time temporary contracts
seem to provide an effective way to reduce the risk of long-term unemployment in the
aftermath of the crisis.
15We think the proper way to deal with this issue could be the time-to-event approach as developedin de Graaf-Zijl et al. (2011).
16Apart from the average survival rates reported in the top row, the survival rates are constructedby varying one characteristic at a time and fixing all other variables at their average value.
32
Table 4: Survival rates in unemployment at 12 months (%)
Expansion RecessionOverall 14.2 26.3Age
18 years old 18.2 30.123 years old 14.2 27.028 years old 10.4 23.5
EducationPrimary or less 10.2 31.8Secondary, 1st stage 9.6 23.1Secondary, 2nd stage 15.2 25.9College 26.6 27.3
Note: The sample is made up of males aged 16-30 years old. The expansion corresponds to the period
2001-2007 and the recession to 2008-2016.
33
5.5 Time elapsed until first permanent contract
So far, we have analysed the determinants of individual transitions between unem-
ployment and fixed-term and permanent employment. But our ultimate interest is
to understand the pathways to permanent employment, which often involve multiple
transitions between unemployment and temporary employment. Moreover, we would
like to assess whether these pathways have changed due to the recent growth in the
use of short-duration contracts.
To achieve these goals, we proceed by estimating the time it takes an entrant to find
his or her first permanent job. We use the same sample as before, but now we restrict
attention to the initial stages of each individual’s working career, starting with the
first contract and ending with the first permanent contract. In this second exercise
the unemployed and the employed on temporary contracts are grouped together, al-
lowing us to estimate a unique hazard for the transitions to permanent employment
conditional on the same list of personal and aggregate characteristics as before plus
the characteristics of the person’s entry job.17
Table 5 provides the raw data. Before the crisis, entrants signed on average 6.2 tempo-
rary contracts spread over a period of almost five years before they encountered their
first permanent job, compared to 9 contracts over a time period of 94 months during
the recession. These numbers clearly indicate that entrants face substantially more
difficulties than before to access a permanent job.
17To avoid problems of endogeneity we do not include any control related to intermediate spells.Furthermore, the model is estimated without controls for unobserved heterogeneity.
34
Table 5: Time elapsed and number of temporary contracts until first permanent job(%)