30
CONNECTICUT FY 2018, FY 2019, FY 2020 THREE YEAR BUDGET REPORT DANNEL P. MALLOY, GOVERNOR February 18, 2015

CONNECTICUT
FY 2018, FY 2019, FY 2020
THREE YEAR BUDGET REPORT
DANNEL P. MALLOY, GOVERNOR
February 18, 2015


(in millions)
Current Services
General Fund 2015-16 2016-17 2017-18 2018-19 2019-20
Revenues 18,005.0$ 18,556.2$ 18,946.8$ 19,597.5$ 20,327.4$ Expenditures 18,001.8 18,551.2 19,342.6 19,782.7 20,468.4
Surplus/(Deficit)(1) 3.2$ 5.0$ (395.8)$ (185.2)$ (141.0)$
Special Transportation Fund
Revenues 1,503.6$ 1,514.4$ 1,626.8$ 1,769.8$ 1,914.9$ Expenditures 1,438.2 1,504.5 1,597.9 1,727.9 1,831.2
Surplus/(Deficit) 65.4$ 9.9$ 28.9$ 41.9$ 83.7$
Other Funds (2)
Revenues 229.6$ 231.2$ 236.8$ 242.7$ 250.0$ Expenditures 229.3 230.8 236.5 242.3 248.4
Surplus/(Deficit) 0.3$ 0.4$ 0.3$ 0.4$ 1.5$
Total All Appropriated Funds
Revenues 19,738.2$ 20,301.8$ 20,810.4$ 21,610.0$ 22,492.3$ Expenditures 19,669.3 20,286.5 21,176.9 21,752.9 22,548.0
Surplus/(Deficit) 68.9$ 15.3$ (366.5)$ (142.9)$ (55.7)$
Expenditure Cap Results
Total All Appropriated Funds 19,669.3$ 20,286.5$ 21,176.9$ 21,752.9$ 22,548.0$ Allowed Appropriations per Cap 19,675.7 20,422.3 21,085.0 21,705.1 22,612.2
Over/(Under) the Cap (6.3)$ (135.8)$ 91.9$ 47.8$ (64.2)$
Revenues and the Expenditure Cap
Revenues - All Funds 19,738.2$ 20,301.8$ 20,810.4$ 21,610.0$ 22,492.3$ Allowed Appropriations per Cap 19,675.7 20,422.3 21,085.0 21,705.1 22,612.2
Revenues Less Allowed Approps. 62.5$ (120.5)$ (274.6)$ (95.1)$ (119.9)$
(1) Article 3 section 18 of the State Constitution requires a balanced budget.
(2) Other funds include the: a) Mashantucket Pequot and Mohegan Fund, b) Regional Market Operating Fund,
c) Banking Fund, d) Insurance Fund, e) Consumer Counsel and Public Utility Fund,
f) Workers' Compensation Fund, g) Criminal Injuries Compensation Fund.
Recommended
Financial Summary of Funds
THREE YEAR BUDGET REPORT
This report has been prepared in accordance with Section 4-71 of the Connecticut General Statutes.It contains the estimated revenues and projected expenditures for the three fiscal years next ensuing the 2015-17 biennium.
INTRODUCTION
- 1 -

ASSUMPTIONS
Assumptions Used to Develop Expenditure Estimates
The three out years have been developed based on the assumption that the 2016 - 2017 Governor’s Recommended
Budget, with all attending legislation, is adopted by the Legislature.
GENERAL ASSUMPTIONS Personal Services and wage-related costs were inflated by 4.5% each year. Other Expenses costs were not inflated.
AGENCY SPECIFIC ASSUMPTIONS
State Comptroller - Miscellaneous • Adjudicated Claims: Reflects level funding. • Nonfunctional Change to Accruals: Reflects level funding in all funds.
State Comptroller - Fringe Benefits • State Employee Retirement Contributions: Reflects estimates of the actuarially determined employer contributions provided by the pension actuary. • Higher Ed Alternate Retirement System and Employer's Social Security Tax: Reflect wage inflation. • Judges and Compensation Commissioners Retirement: Reflects a 4.3% average increase per year. • State Employee and Retired Employee Health Service Costs: Reflect medical inflation. • Other Post Employment Benefits: Reflects wage inflation, and the estimated matching state contribution commencing FY 2018 per the 2011 SEBAC Agreement.
Office of Policy and Management • Increase in Caseload for Renters' Rebate Program: Reflects an increase in caseload of 6.25%, which is the average growth rate for the program over the past five fiscal years.
Reserve for Salary Adjustments • Reserve for Salary Adjustments: Reflects wage inflation.
Department of Emergency Services and Public Protection • Remove Funds for One-Time Expenditures: Funding related to the purchase of hazardous chemical suits and gas masks are removed in FY 2018 as these are one-time purchases every 10 years.
Department of Housing • IT Maintenance Costs: Removes one time funding in FY 2017 for IT maintenance costs. • Congregate Facilities Operation: Annualization for new congregate units which are anticipated to open in October 2016. • Rental Assistance Program: Annualizes Rental Assistance Program vouchers for individuals transitioning from Money Follows the Person and for the continued commitment to public housing revitalization.
Department of Public Health • Immunization Services: Reflects Personal Services inflation applied to salary and fringe benefits components of account. Vaccine costs reflect anticipated changes in Centers for Disease Control and Prevention price schedule. • Breast and Cervical Cancer Detection and Treatment, Children's Health Initiatives: Reflect Personal Services inflation applied to salary component of account.
Budget Report
- 2 -

Department of Developmental Services • Employment Opportunities and Day Services: Reflects prior year annualization and caseload growth for age outs and High School Graduates. • Community Residential Services: Reflects prior year annualization and caseload growth for community placements, including age outs, Money Follows the Person and Messier-related placements.
Department of Mental Health and Addiction Services • Personal Services: Reflects adjustment for wage-related inflation on the Personal Services component of funds budgeted in the Department of Social Services - DMHAS/Disproportionate Share account. • Managed Service System, General Assistance Managed Care, Young Adult Services, TBI Community Services, Jail Diversion, Prison Overcrowding, Home and Community Based Services: Reflects wage- related inflation adjustments for the salary component of these accounts. • General Assistance Managed Care, Young Adult Services, Discharge and Diversion Services, Home and Community Based Services: Reflect anticipated caseload growth and prior year annualization.
Department of Transportation • Pick Up of Congestion Mitigation and Air Quality (CMAQ) Funding - Other Expenses: Funding is appropriated to compensate for the expiration of the CMAQ funding. The CMAQ funding covers 80% of costs in the first three years of an initiative's operation. The funding represents $360,000 for CTfastrak Truck Rental and $1,600,000 for Marketing and Outreach for Transportation Initiatives. • Pick Up of Congestion Mitigation and Air Quality (CMAQ) Funding - Rail Program: Funding is appropriated to compensate for the expiration of the CMAQ funding. The CMAQ funding covers 80% of costs in the first three years of an initiative's operation. The funding represents the pick up of the operational cost of CT Rail. • Pick Up of Congestion Mitigation and Air Quality (CMAQ) Funding - Bus Initiatives: Funding is appropriated to compensate for the expiration of the CMAQ funding. The CMAQ funding covers 80% of costs in the first three years of an initiative's operation. The funding represents $13,125,000 for CTfastrak operations and $5,000,000 for bus service expansions.
Department of Social Services • State-Funded Supplemental Nutrition Assistance Program, HUSKY B Program, Medicaid, Old Age Assistance, Aid to the Blind, Aid to the Disabled, Temporary Assistance to Families, Connecticut Home Care Program, and State Administered General Assistance: Reflects anticipated caseload changes based on current trends, as well as annualization of adjustments. • Medicaid, Old Age Assistance, Aid to the Blind, Aid to the Disabled: Reflects leap year payments in FY 2020. • Medicaid: Reflects decrease in federal reimbursement for the Medicaid expansion population (HUSKY D) in accordance with the provisions of the Affordable Care Act (from 100% in FY 2016 to 95% in FY 2017, 94% in FY 2018, 93% in FY 2019 and 90% in FY 2020). • Medicaid: Reflects annualization of costs related to the recent federal mandate requiring coverage of medically necessary services for children and youth with autism spectrum disorder. • Other Expenses: Reflects annualization of information technology projects and adjustments.
Department of Education • Development of Mastery Exams, Longitudinal Data Systems, School Accountability, Sheff Settlement, Regional Vocational-Technical School System, Talent Development, Adult Education and Interdistrict Cooperation: Reflect wage inflation for the Personal Services components of these accounts.
University of Connecticut • Next Generation Connecticut: Assumes level funding of $7,894,737 for FY 2018, FY 2019 and FY 2020.
Budget Report
- 3 -

University of Connecticut Health Center • Bioscience CT Initiative: Based on the rollout of Bioscience CT, the FY 2018 costs are $11.9 million which is continued for FY 2019 and FY 2020.
Teachers' Retirement Board • Retirement Contributions: Reflects a 4% increase per year. • Retirees Health Service Cost: Reflects the state share returning to one-third of costs starting in FY 2018 and medical inflation in FYs 2019 and 2020. • Municipal Retiree Health Insurance Cost: Reflects the state share returning to one-third of the subsidy starting in FY 2018 and level funding in FYs 2019 and 2020 due to flat volume. Board of Regents for Higher Education • Transform CSCU 2020: This initiative is level funded at $10,894,737 each year.
Department of Children and Families • Pre-Adjudicated Juvenile and Family Services: Reflects Personal Services inflation applied to salary component of account. • Board and Care for Children - Foster & Adoption: Reflects annualization of prior years' placements and anticipated growth in the number of children in subsidized adoption/guardianship homes/foster homes.
Budget Report
- 4 -

Budget Report
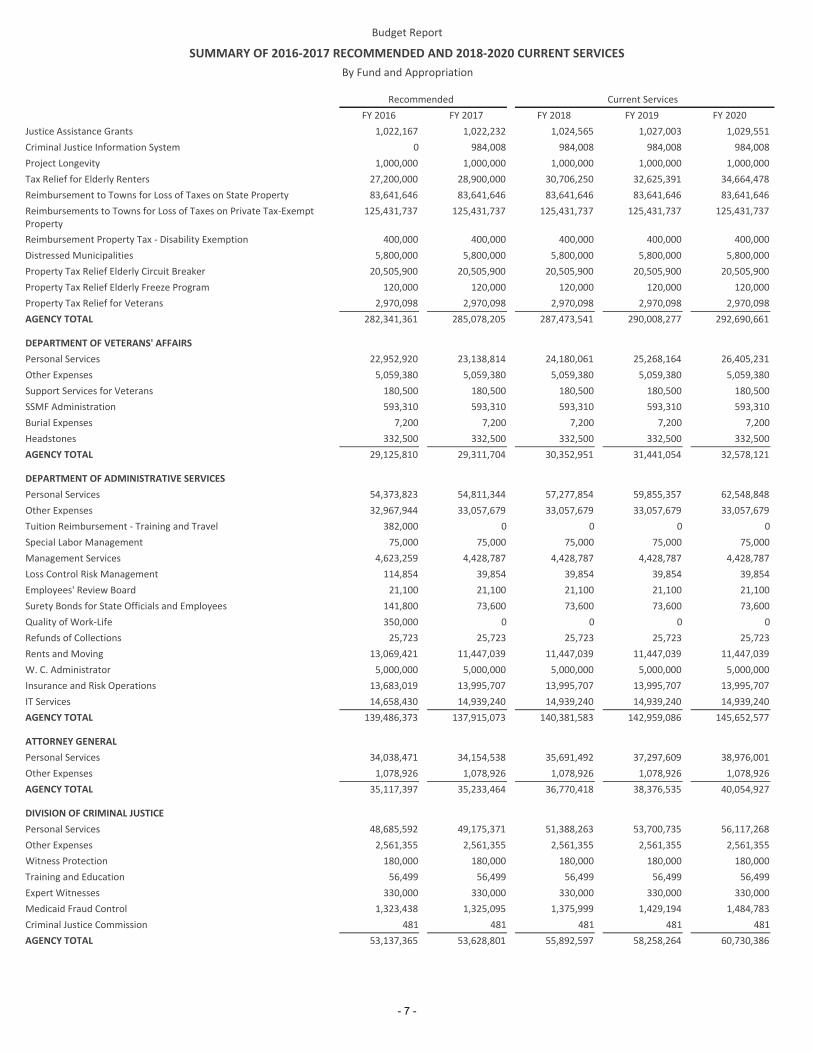
SUMMARY OF 2016‐2017 RECOMMENDED AND 2018‐2020 CURRENT SERVICES
Recommended Current ServicesFY 2016 FY 2017 FY 2018 FY 2019 FY 2020
By Fund and Appropriation
GENERAL FUND
LEGISLATIVE
LEGISLATIVE MANAGEMENT
51,867,728 54,601,263 57,058,320 59,625,944 62,309,111Personal Services18,131,802 19,782,727 19,782,727 19,782,727 19,782,727Other Expenses1,648,600 544,600 544,600 544,600 544,600Equipment
75,000 75,000 75,000 75,000 75,000Flag Restoration2,305,000 500,000 500,000 500,000 500,000Minor Capitol Improvements
641,942 493,898 493,898 493,898 493,898Interim Salary/Caucus Offices599,710 620,620 620,620 620,620 620,620Old State House415,040 431,640 431,640 431,640 431,640Interstate Conference Fund189,250 194,925 194,925 194,925 194,925New England Board of Higher Education
75,874,072 77,244,673 79,701,730 82,269,354 84,952,521AGENCY TOTAL
AUDITORS OF PUBLIC ACCOUNTS
12,475,412 12,500,473 13,062,994 13,650,829 14,265,116Personal Services437,355 449,991 449,991 449,991 449,991Other Expenses10,000 10,000 10,000 10,000 10,000Equipment
12,922,767 12,960,464 13,522,985 14,110,820 14,725,107AGENCY TOTAL
COMMISSION ON AGING
450,082 478,607 500,144 522,650 546,169Personal Services43,433 44,944 44,944 44,944 44,944Other Expenses2,000 2,000 2,000 2,000 2,000Equipment
495,515 525,551 547,088 569,594 593,113AGENCY TOTAL
PERMANENT COMMISSION ON THE STATUS OF WOMEN
664,544 706,552 738,347 771,573 806,294Personal Services86,726 82,381 82,381 82,381 82,381Other Expenses2,000 2,000 2,000 2,000 2,000Equipment
753,270 790,933 822,728 855,954 890,675AGENCY TOTAL
COMMISSION ON CHILDREN
803,460 849,814 888,056 928,019 969,780Personal Services117,680 119,923 119,923 119,923 119,923Other Expenses
2,000 2,000 2,000 2,000 2,000Equipment
923,140 971,737 1,009,979 1,049,942 1,091,703AGENCY TOTAL
LATINO AND PUERTO RICAN AFFAIRS COMMISSION
517,399 550,030 574,781 600,646 627,675Personal Services107,164 77,968 77,968 77,968 77,968Other Expenses
2,000 2,000 2,000 2,000 2,000Equipment
626,563 629,998 654,749 680,614 707,643AGENCY TOTAL
AFRICAN‐AMERICAN AFFAIRS COMMISSION
404,948 429,099 448,408 468,586 489,672Personal Services33,172 35,103 35,103 35,103 35,103Other Expenses2,000 2,000 2,000 2,000 2,000Equipment
440,120 466,202 485,511 505,689 526,775AGENCY TOTAL
ASIAN PACIFIC AMERICAN AFFAIRS COMMISSION
315,884 335,601 350,703 366,485 382,977Personal Services118,348 111,300 111,300 111,300 111,300Other Expenses
2,000 2,000 2,000 2,000 2,000Equipment
436,232 448,901 464,003 479,785 496,277AGENCY TOTAL
- 5 -

Budget Report
SUMMARY OF 2016‐2017 RECOMMENDED AND 2018‐2020 CURRENT SERVICES
Recommended Current ServicesFY 2016 FY 2017 FY 2018 FY 2019 FY 2020
By Fund and Appropriation
92,471,679 94,038,459 97,208,773 100,521,752 103,983,814TOTALLEGISLATIVE
GENERAL GOVERNMENT
GOVERNOR'S OFFICE
2,402,418 2,407,998 2,516,358 2,629,594 2,747,926Personal Services203,265 203,265 203,265 203,265 203,265Other Expenses107,625 107,625 107,625 107,625 107,625New England Governors' Conference128,155 128,155 128,155 128,155 128,155National Governors' Association
2,841,463 2,847,043 2,955,403 3,068,639 3,186,971AGENCY TOTAL
SECRETARY OF THE STATE
2,988,939 3,008,115 3,143,480 3,284,937 3,432,759Personal Services1,542,745 1,542,745 1,542,745 1,542,745 1,542,745Other Expenses5,583,728 5,611,861 5,774,089 5,942,617 6,120,194Commercial Recording Division
10,115,412 10,162,721 10,460,314 10,770,299 11,095,698AGENCY TOTAL
LIEUTENANT GOVERNOR'S OFFICE
648,014 649,519 678,747 709,291 741,209Personal Services69,555 69,555 69,555 69,555 69,555Other Expenses
717,569 719,074 748,302 778,846 810,764AGENCY TOTAL
STATE TREASURER
3,300,795 3,313,919 3,463,045 3,618,882 3,781,732Personal Services155,995 155,995 155,995 155,995 155,995Other Expenses
3,456,790 3,469,914 3,619,040 3,774,877 3,937,727AGENCY TOTAL
STATE COMPTROLLER
24,125,768 24,125,768 25,211,428 26,345,942 27,531,509Personal Services5,551,377 4,929,660 4,929,660 4,929,660 4,929,660Other Expenses
29,677,145 29,055,428 30,141,088 31,275,602 32,461,169AGENCY TOTAL
DEPARTMENT OF REVENUE SERVICES
61,009,154 61,451,942 64,217,279 67,107,057 70,126,875Personal Services7,720,265 7,722,172 7,722,172 7,722,172 7,722,172Other Expenses
68,729,419 69,174,114 71,939,451 74,829,229 77,849,047AGENCY TOTAL
OFFICE OF GOVERNMENTAL ACCOUNTABILITY
846,468 857,351 895,932 936,249 978,380Personal Services82,220 84,720 84,720 84,720 84,720Other Expenses
107,668 107,915 112,691 117,682 122,898Child Fatality Review Board40,000 40,000 40,000 40,000 40,000Information Technology Initiatives
3,631,915 3,695,456 3,835,784 3,982,427 4,135,669Elections Enforcement Commission
1,629,844 1,671,905 1,739,498 1,810,133 1,883,947Office of State Ethics1,734,020 1,747,450 1,819,367 1,894,520 1,973,055Freedom of Information Commission
314,368 314,932 326,431 338,448 351,006Contracting Standards Board146,265 148,294 153,551 159,045 164,786Judicial Review Council93,100 93,279 96,738 100,352 104,129Judicial Selection Commission
562,664 563,559 587,855 613,245 639,777Office of the Child Advocate462,544 465,972 485,023 504,931 525,735Office of Victim Advocate127,959 128,422 133,572 138,954 144,578Board of Firearms Permit Examiners
9,779,035 9,919,255 10,311,162 10,720,706 11,148,680AGENCY TOTAL
OFFICE OF POLICY AND MANAGEMENT
12,986,179 13,038,950 13,625,703 14,238,860 14,879,609Personal Services1,216,413 1,216,413 1,216,413 1,216,413 1,216,413Other Expenses
47,221 47,221 47,221 47,221 47,221Automated Budget System and Data Base Link
- 6 -
Budget Report
SUMMARY OF 2016‐2017 RECOMMENDED AND 2018‐2020 CURRENT SERVICES
Recommended Current ServicesFY 2016 FY 2017 FY 2018 FY 2019 FY 2020
By Fund and Appropriation
1,022,167 1,022,232 1,024,565 1,027,003 1,029,551Justice Assistance Grants0 984,008 984,008 984,008 984,008Criminal Justice Information System
1,000,000 1,000,000 1,000,000 1,000,000 1,000,000Project Longevity27,200,000 28,900,000 30,706,250 32,625,391 34,664,478Tax Relief for Elderly Renters83,641,646 83,641,646 83,641,646 83,641,646 83,641,646Reimbursement to Towns for Loss of Taxes on State Property
125,431,737 125,431,737 125,431,737 125,431,737 125,431,737Reimbursements to Towns for Loss of Taxes on Private Tax‐Exempt Property
400,000 400,000 400,000 400,000 400,000Reimbursement Property Tax ‐ Disability Exemption
5,800,000 5,800,000 5,800,000 5,800,000 5,800,000Distressed Municipalities
20,505,900 20,505,900 20,505,900 20,505,900 20,505,900Property Tax Relief Elderly Circuit Breaker120,000 120,000 120,000 120,000 120,000Property Tax Relief Elderly Freeze Program
2,970,098 2,970,098 2,970,098 2,970,098 2,970,098Property Tax Relief for Veterans282,341,361 285,078,205 287,473,541 290,008,277 292,690,661AGENCY TOTAL
DEPARTMENT OF VETERANS' AFFAIRS
22,952,920 23,138,814 24,180,061 25,268,164 26,405,231Personal Services5,059,380 5,059,380 5,059,380 5,059,380 5,059,380Other Expenses180,500 180,500 180,500 180,500 180,500Support Services for Veterans593,310 593,310 593,310 593,310 593,310SSMF Administration
7,200 7,200 7,200 7,200 7,200Burial Expenses332,500 332,500 332,500 332,500 332,500Headstones
29,125,810 29,311,704 30,352,951 31,441,054 32,578,121AGENCY TOTAL
DEPARTMENT OF ADMINISTRATIVE SERVICES
54,373,823 54,811,344 57,277,854 59,855,357 62,548,848Personal Services32,967,944 33,057,679 33,057,679 33,057,679 33,057,679Other Expenses
382,000 0 0 0 0Tuition Reimbursement ‐ Training and Travel 75,000 75,000 75,000 75,000 75,000Special Labor Management
4,623,259 4,428,787 4,428,787 4,428,787 4,428,787Management Services114,854 39,854 39,854 39,854 39,854Loss Control Risk Management
21,100 21,100 21,100 21,100 21,100Employees' Review Board141,800 73,600 73,600 73,600 73,600Surety Bonds for State Officials and Employees
350,000 0 0 0 0Quality of Work‐Life25,723 25,723 25,723 25,723 25,723Refunds of Collections
13,069,421 11,447,039 11,447,039 11,447,039 11,447,039Rents and Moving
5,000,000 5,000,000 5,000,000 5,000,000 5,000,000W. C. Administrator
13,683,019 13,995,707 13,995,707 13,995,707 13,995,707Insurance and Risk Operations14,658,430 14,939,240 14,939,240 14,939,240 14,939,240IT Services
139,486,373 137,915,073 140,381,583 142,959,086 145,652,577AGENCY TOTAL
ATTORNEY GENERAL
34,038,471 34,154,538 35,691,492 37,297,609 38,976,001Personal Services1,078,926 1,078,926 1,078,926 1,078,926 1,078,926Other Expenses
35,117,397 35,233,464 36,770,418 38,376,535 40,054,927AGENCY TOTAL
DIVISION OF CRIMINAL JUSTICE
48,685,592 49,175,371 51,388,263 53,700,735 56,117,268Personal Services2,561,355 2,561,355 2,561,355 2,561,355 2,561,355Other Expenses180,000 180,000 180,000 180,000 180,000Witness Protection56,499 56,499 56,499 56,499 56,499Training and Education
330,000 330,000 330,000 330,000 330,000Expert Witnesses
1,323,438 1,325,095 1,375,999 1,429,194 1,484,783Medicaid Fraud Control481 481 481 481 481Criminal Justice Commission
53,137,365 53,628,801 55,892,597 58,258,264 60,730,386AGENCY TOTAL
- 7 -

Budget Report
SUMMARY OF 2016‐2017 RECOMMENDED AND 2018‐2020 CURRENT SERVICES
Recommended Current ServicesFY 2016 FY 2017 FY 2018 FY 2019 FY 2020
By Fund and Appropriation
664,525,139 666,514,796 681,045,850 696,261,414 712,196,728TOTALGENERAL GOVERNMENT
REGULATION AND PROTECTION
DEPARTMENT OF EMERGENCY SERVICES AND PUBLIC PROTECTION
149,692,228 149,999,937 156,749,934 163,803,681 171,174,847Personal Services29,103,216 29,720,532 29,133,588 29,133,588 29,133,588Other Expenses
93,990 93,990 93,990 93,990 93,990Equipment
25,354 25,354 25,354 25,354 25,354Stress Reduction6,877,690 7,572,005 7,572,005 7,572,005 7,572,005Fleet Purchase4,638,787 4,638,787 4,638,787 4,638,787 4,638,787Workers' Compensation Claims
23,918 23,918 23,918 23,918 23,918Maintenance of County Base Fire Radio Network15,919 15,919 15,919 15,919 15,919Maintenance of State‐Wide Fire Radio Network
190,000 190,000 190,000 190,000 190,000Police Association of Connecticut194,711 194,711 194,711 194,711 194,711Connecticut State Firefighter's Association
190,855,813 192,475,153 198,638,206 205,691,953 213,063,119AGENCY TOTAL
MILITARY DEPARTMENT
3,146,928 3,179,977 3,323,076 3,472,614 3,628,882Personal Services2,731,768 2,740,358 2,740,358 2,740,358 2,740,358Other Expenses
72,000 50,000 50,000 50,000 50,000Veterans' Service Bonuses5,950,696 5,970,335 6,113,434 6,262,972 6,419,240AGENCY TOTAL
DEPARTMENT OF CONSUMER PROTECTION
16,233,765 16,368,008 17,104,568 17,874,274 18,678,616Personal Services1,361,444 1,464,066 1,464,066 1,464,066 1,464,066Other Expenses
17,595,209 17,832,074 18,568,634 19,338,340 20,142,682AGENCY TOTAL
LABOR DEPARTMENT
9,434,317 9,515,435 9,943,630 10,391,093 10,858,692Personal Services1,132,381 1,132,381 1,132,381 1,132,381 1,132,381Other Expenses469,017 470,618 481,234 492,328 503,921CETC Workforce
31,284,295 31,284,295 31,284,295 31,284,295 31,284,295Workforce Investment Act500,000 500,000 500,000 500,000 500,000Jobs Funnel Projects
3,750,000 3,750,000 3,750,000 3,750,000 3,750,000Connecticut's Youth Employment Program18,040,423 18,043,703 18,072,183 18,101,945 18,133,045Jobs First Employment Services
560,500 560,500 560,500 560,500 560,500STRIDE
583,896 584,977 608,721 633,532 659,460Apprenticeship Program166,061 166,909 174,211 181,842 189,817Connecticut Career Resource Network403,339 403,339 403,339 403,339 403,339Incumbent Worker Training
2,131,250 2,131,250 2,131,250 2,131,250 2,131,250Employment Services1,500,000 1,500,000 1,500,000 1,500,000 1,500,000Second Chance Initiatives
69,955,479 70,043,407 70,541,744 71,062,505 71,606,700AGENCY TOTAL
COMMISSION ON HUMAN RIGHTS AND OPPORTUNITIES
6,218,520 6,284,805 6,567,621 6,863,164 7,172,006Personal Services319,255 319,255 319,255 319,255 319,255Other Expenses
6,318 6,318 6,318 6,318 6,318Martin Luther King, Jr. Commission
6,544,093 6,610,378 6,893,194 7,188,737 7,497,579AGENCY TOTAL
OFFICE OF PROTECTION AND ADVOCACY FOR PERSONS WITH DISABILITIES
2,339,429 2,354,131 2,460,067 2,570,770 2,686,455Personal Services194,654 194,654 194,654 194,654 194,654Other Expenses
2,534,083 2,548,785 2,654,721 2,765,424 2,881,109AGENCY TOTAL
- 8 -

Budget Report
SUMMARY OF 2016‐2017 RECOMMENDED AND 2018‐2020 CURRENT SERVICES
Recommended Current ServicesFY 2016 FY 2017 FY 2018 FY 2019 FY 2020
By Fund and Appropriation
293,435,373 295,480,132 303,409,933 312,309,931 321,610,429TOTALREGULATION AND PROTECTION
CONSERVATION AND DEVELOPMENT
DEPARTMENT OF AGRICULTURE
3,973,923 4,024,226 4,205,316 4,394,555 4,592,310Personal Services723,103 723,103 723,103 723,103 723,103Other Expenses364,857 364,928 364,928 364,928 364,928Senior Food Vouchers
855 855 855 855 855Tuberculosis and Brucellosis Indemnity
174,886 174,886 174,886 174,886 174,886WIC Coupon Program for Fresh Produce5,237,624 5,287,998 5,469,088 5,658,327 5,856,082AGENCY TOTAL
DEPARTMENT OF ENERGY AND ENVIRONMENTAL PROTECTION
30,953,707 31,127,987 32,528,746 33,992,540 35,522,204Personal Services3,089,978 3,089,978 3,089,978 3,089,978 3,089,978Other Expenses272,597 272,841 282,482 292,556 303,084Mosquito Control488,344 488,344 488,344 488,344 488,344State Superfund Site Maintenance
153,705 153,705 153,705 153,705 153,705Laboratory Fees142,981 143,144 149,575 156,285 163,308Dam Maintenance
7,278,320 7,326,885 7,618,824 7,961,671 8,319,946Emergency Spill Response3,833,992 3,848,128 3,940,524 4,037,078 4,137,977Solid Waste Management
1,040,293 1,047,927 1,094,954 1,144,098 1,195,453Underground Storage Tank4,512,197 4,543,783 4,710,154 4,884,012 5,065,693Clean Air7,223,185 7,261,945 7,404,386 7,553,237 7,708,786Environmental Conservation
10,247,411 10,315,610 10,638,945 10,976,830 11,329,920Environmental Quality48,783 48,783 48,783 48,783 48,783Interstate Environmental Commission
28,827 28,827 28,827 28,827 28,827New England Interstate Water Pollution Commission
3,295 3,295 3,295 3,295 3,295Northeast Interstate Forest Fire Compact
32,395 32,395 32,395 32,395 32,395Connecticut River Valley Flood Control Commission
48,281 48,281 48,281 48,281 48,281Thames River Valley Flood Control Commission
69,398,291 69,781,858 72,262,198 74,891,915 77,639,979AGENCY TOTAL
DEPARTMENT OF ECONOMIC AND COMMUNITY DEVELOPMENT
8,410,102 8,476,385 8,857,822 9,256,424 9,672,963Personal Services587,717 567,717 567,717 567,717 567,717Other Expenses
10,000,000 10,000,000 10,000,000 10,000,000 10,000,000Statewide Marketing
367,739 367,739 367,739 367,739 367,739Small Business Incubator Program243,473 243,712 243,712 243,712 243,712Office of Military Affairs166,250 166,250 166,250 166,250 166,250Hydrogen/Fuel Cell Economy
695,644 695,644 695,644 695,644 695,644CCAT‐CT Manufacturing Supply Chain9,064,370 9,064,370 9,064,370 9,064,370 9,064,370Capitol Region Development Authority558,963 558,963 558,963 558,963 558,963CONNSTEP
131,007 131,007 131,007 131,007 131,007Development Research and Economic Assistance5,707,939 5,707,939 5,707,939 5,707,939 5,707,939Arts Commission
359,776 359,776 359,776 359,776 359,776Amistad Vessel36,292,980 36,339,502 36,720,939 37,119,541 37,536,080AGENCY TOTAL
DEPARTMENT OF HOUSING
2,234,652 2,242,842 2,343,770 2,449,240 2,559,456Personal Services173,266 194,266 173,266 173,266 173,266Other Expenses
1,058,144 1,058,144 1,058,144 1,058,144 1,058,144Elderly Rental Registry and Counselors2,406,000 2,455,000 2,455,000 2,455,000 2,455,000Subsidized Assisted Living Demonstration
7,783,636 8,054,279 8,104,745 8,104,745 8,104,745Congregate Facilities Operation Costs416,575 416,575 416,575 416,575 416,575Housing Assistance and Counseling Program
2,162,504 2,162,504 2,162,504 2,162,504 2,162,504Elderly Congregate Rent Subsidy
- 9 -

Budget Report
SUMMARY OF 2016‐2017 RECOMMENDED AND 2018‐2020 CURRENT SERVICES
Recommended Current ServicesFY 2016 FY 2017 FY 2018 FY 2019 FY 2020
By Fund and Appropriation
68,700,306 74,919,513 79,925,600 85,083,171 90,240,742Housing/Homeless Services640,398 640,398 640,398 640,398 640,398Housing/Homeless Services
85,575,481 92,143,521 97,280,002 102,543,043 107,810,830AGENCY TOTAL
AGRICULTURAL EXPERIMENT STATION
6,475,649 6,590,800 6,887,386 7,197,318 7,521,197Personal Services1,000,197 1,000,197 1,000,197 1,000,197 1,000,197Other Expenses503,987 507,516 522,703 538,345 554,455Mosquito/Viral Disease Surveil
7,979,833 8,098,513 8,410,286 8,735,860 9,075,849AGENCY TOTAL
204,484,209 211,651,392 220,142,513 228,948,686 237,918,820TOTALCONSERVATION AND DEVELOPMENT
HEALTH AND HOSPITALS
DEPARTMENT OF PUBLIC HEALTH
38,431,341 38,761,411 40,505,674 42,328,429 44,233,208Personal Services7,010,230 7,250,597 7,250,597 7,250,597 7,250,597Other Expenses1,968,685 1,972,746 1,983,769 1,995,785 2,008,341Children's Health Initiatives1,037,429 1,037,429 1,037,429 1,037,429 1,037,429Children with Special Health Care Needs1,508,515 1,508,515 1,508,515 1,508,515 1,508,515Community Health Services422,008 422,008 422,008 422,008 422,008Rape Crisis211,066 211,066 211,066 211,066 211,066Genetic Diseases Programs
4,692,648 4,692,648 4,692,648 4,692,648 4,692,648Local and District Departments of Health11,024,576 10,783,602 10,783,602 10,783,602 10,783,602School Based Health Clinics66,306,498 66,640,022 68,395,308 70,230,079 72,147,414AGENCY TOTAL
OFFICE OF THE CHIEF MEDICAL EXAMINER
4,825,259 4,857,946 5,076,554 5,304,999 5,543,724Personal Services1,129,054 1,129,054 1,129,054 1,129,054 1,129,054Other Expenses
19,226 19,226 19,226 19,226 19,226Equipment
26,047 26,047 26,047 26,047 26,047Medicolegal Investigations5,999,586 6,032,273 6,250,881 6,479,326 6,718,051AGENCY TOTAL
DEPARTMENT OF DEVELOPMENTAL SERVICES
267,209,799 269,307,937 281,426,794 294,091,000 307,325,095Personal Services20,894,381 20,894,381 20,894,381 20,894,381 20,894,381Other Expenses3,738,222 3,738,222 3,738,222 3,738,222 3,738,222Family Support Grants
24,544,841 24,477,566 24,477,566 24,477,566 24,477,566Cooperative Placements Program3,493,844 3,493,844 3,493,844 3,493,844 3,493,844Clinical Services
15,246,035 15,246,035 15,246,035 15,246,035 15,246,035Workers' Compensation Claims
2,552,272 2,848,961 2,848,961 2,848,961 2,848,961Autism Services12,986,713 18,889,987 18,889,987 18,889,987 18,889,987Voluntary Services5,108,116 5,108,116 5,108,116 5,108,116 5,108,116Supplemental Payments for Medical Services5,130,212 5,130,212 5,130,212 5,130,212 5,130,212Rent Subsidy Program
222,545,262 225,053,762 234,797,444 249,404,682 264,011,920Employment Opportunities and Day Services480,961,682 493,447,748 512,676,678 539,655,320 566,633,962Community Residential Services
1,064,411,379 1,087,636,771 1,128,728,240 1,182,978,326 1,237,798,301AGENCY TOTAL
DEPARTMENT OF MENTAL HEALTH AND ADDICTION SERVICES
205,578,670 208,141,328 220,982,522 234,401,570 248,424,475Personal Services28,716,563 28,752,852 28,752,852 28,752,852 28,752,852Other Expenses23,221,576 24,221,576 24,221,576 24,221,576 24,221,576Housing Supports and Services61,471,758 61,618,442 62,036,363 62,473,090 62,929,470Managed Service System
546,029 546,029 546,029 546,029 546,029Legal Services7,637,002 7,637,002 7,637,002 7,637,002 7,637,002Connecticut Mental Health Center
11,488,898 11,488,898 11,488,898 11,488,898 11,488,898Professional Services
- 10 -

Budget Report
SUMMARY OF 2016‐2017 RECOMMENDED AND 2018‐2020 CURRENT SERVICES
Recommended Current ServicesFY 2016 FY 2017 FY 2018 FY 2019 FY 2020
By Fund and Appropriation
41,991,862 43,075,573 44,802,501 46,598,682 48,466,894General Assistance Managed Care11,990,126 11,990,126 11,990,126 11,990,126 11,990,126Workers' Compensation Claims
591,645 591,645 591,645 591,645 591,645Nursing Home Screening80,206,667 85,961,827 90,002,835 94,104,541 98,269,675Young Adult Services10,400,667 10,412,737 10,447,935 10,484,717 10,523,154TBI Community Services4,595,351 4,617,881 4,714,955 4,816,397 4,922,404Jail Diversion5,860,641 5,860,641 5,860,641 5,860,641 5,860,641Behavioral Health Medications
6,330,189 6,352,255 6,427,638 6,506,413 6,588,733Prison Overcrowding4,816,334 4,803,175 4,803,175 4,803,175 4,803,175Medicaid Adult Rehabilitation Option
24,447,924 27,347,924 30,247,924 33,147,924 36,047,924Discharge and Diversion Services20,566,913 26,901,275 33,977,592 40,872,398 47,769,366Home and Community Based Services
500,000 500,000 500,000 500,000 500,000Persistent Violent Felony Offenders Act485,000 485,000 485,000 485,000 485,000Nursing Home Contract
17,567,934 17,567,934 17,567,934 17,567,934 17,567,934Grants for Substance Abuse Services58,325,041 58,325,041 58,325,041 58,325,041 58,325,041Grants for Mental Health Services10,417,204 10,417,204 10,417,204 10,417,204 10,417,204Employment Opportunities
637,753,994 657,616,365 686,827,388 716,592,855 747,129,218AGENCY TOTAL
PSYCHIATRIC SECURITY REVIEW BOARD
261,587 262,916 274,747 287,111 300,031Personal Services29,525 29,525 29,525 29,525 29,525Other Expenses
291,112 292,441 304,272 316,636 329,556AGENCY TOTAL
1,774,762,569 1,818,217,872 1,890,506,089 1,976,597,222 2,064,122,540TOTALHEALTH AND HOSPITALS
HUMAN SERVICES
DEPARTMENT OF SOCIAL SERVICES
133,204,508 131,516,031 137,434,252 143,618,793 150,081,639Personal Services148,127,650 155,200,842 159,337,521 159,337,521 159,337,521Other Expenses
122,506 122,506 122,506 122,506 122,506Genetic Tests in Paternity Actions483,100 460,800 477,000 492,855 509,236State‐Funded Supplemental Nutrition Assistance Program
33,690,000 36,250,000 37,340,000 38,460,000 39,610,000HUSKY B Program2,446,290,000 2,505,490,000 2,647,190,000 2,755,690,000 2,876,560,000Medicaid
37,636,440 37,779,320 38,368,677 38,967,228 39,667,817Old Age Assistance743,550 741,289 759,000 777,000 798,000Aid to the Blind
60,387,585 60,134,440 60,856,053 61,586,326 62,460,292Aid to the Disabled102,625,380 102,058,030 102,047,824 102,047,824 102,047,824Temporary Assistance to Families ‐ TANF
1 1 1 1 1Emergency Assistance11,400 11,400 11,400 11,400 11,400Food Stamp Training Expenses
108,935,000 108,935,000 108,935,000 108,935,000 108,935,000DMHAS – Disproportionate Share41,230,000 38,040,000 35,490,000 36,200,000 36,920,000Connecticut Home Care Program
476,599 478,300 480,691 483,094 485,509Protective Services to the Elderly885,358 705,452 705,452 705,452 705,452Safety Net Services112,500 112,500 112,500 112,500 112,500Refunds of Collections353,865 353,865 353,865 353,865 353,865Services for Persons with Disabilities329,637 302,811 302,811 302,811 302,811Nutrition Assistance
4,826,384 4,698,287 4,698,287 4,698,287 4,698,287Domestic Violence Shelters22,342,040 24,005,550 25,314,963 26,702,941 28,174,197State Administered General Assistance15,579,200 15,579,200 15,579,200 15,579,200 15,579,200Connecticut Children's Medical Center
803,226 803,226 803,226 803,226 803,226Community Services71,616 71,616 71,616 71,616 71,616Community Services
3,159,267,545 3,223,850,466 3,376,791,845 3,496,059,446 3,628,347,899AGENCY TOTAL
STATE DEPARTMENT ON AGING
- 11 -

Budget Report
SUMMARY OF 2016‐2017 RECOMMENDED AND 2018‐2020 CURRENT SERVICES
Recommended Current ServicesFY 2016 FY 2017 FY 2018 FY 2019 FY 2020
By Fund and Appropriation
2,427,209 2,450,501 2,560,774 2,676,009 2,796,429Personal Services222,210 222,210 222,210 222,210 222,210Other Expenses
5,695,980 5,695,980 5,695,980 5,695,980 5,695,980Programs for Senior Citizens8,345,399 8,368,691 8,478,964 8,594,199 8,714,619AGENCY TOTAL
DEPARTMENT OF REHABILITATION SERVICES
5,191,611 5,231,501 5,466,919 5,712,930 5,970,012Personal Services1,576,205 1,576,205 1,576,205 1,576,205 1,576,205Other Expenses
1,522 1,522 1,522 1,522 1,522Part‐Time Interpreters4,514,363 4,553,755 4,713,674 4,880,789 5,055,424Educational Aid for Blind and Visually Handicapped Children1,246,294 1,246,294 1,246,294 1,246,294 1,246,294Employment Opportunities6,845,892 6,845,892 6,845,892 6,845,892 6,845,892Vocational Rehabilitation ‐ Disabled
74,762 74,762 74,762 74,762 74,762Supplementary Relief and Services699,402 699,402 699,402 699,402 699,402Vocational Rehabilitation286,581 286,581 286,581 286,581 286,581Special Training for the Deaf Blind
20,436,632 20,515,914 20,911,251 21,324,377 21,756,094AGENCY TOTAL
3,188,049,576 3,252,735,071 3,406,182,060 3,525,978,022 3,658,818,612TOTALHUMAN SERVICES
EDUCATION
DEPARTMENT OF EDUCATION
19,998,653 20,166,925 21,074,437 22,022,787 23,013,812Personal Services3,766,142 3,766,142 3,766,142 3,766,142 3,766,142Other Expenses
17,024,201 17,037,108 17,138,128 17,243,693 17,354,009Development of Mastery Exams Grades 4, 6 and 8427,209 427,209 427,209 427,209 427,209Primary Mental Health240,687 240,687 240,687 240,687 240,687Adult Education Action159,661 159,661 159,661 159,661 159,661Resource Equity Assessment
1,206,490 1,208,477 1,213,433 1,218,612 1,224,024Longitudinal Data Systems
1,786,639 1,794,808 1,816,314 1,838,788 1,862,273School Accountability11,861,044 12,192,038 12,275,374 12,362,460 12,453,465Sheff Settlement
166,779,468 170,902,813 178,032,913 185,239,033 192,769,428Regional Vocational‐Technical School System12,800,000 12,800,000 12,800,000 12,800,000 12,800,000Commissioner’s Network
339,000 420,000 420,000 420,000 420,000New or Replicated Schools2,619,944 2,619,944 2,619,944 2,619,944 2,619,944K‐3 Reading Assessment Pilot9,552,199 9,559,701 9,593,960 9,629,760 9,667,171Talent Development
5,985,000 5,985,000 5,985,000 5,985,000 5,985,000Common Core1,510,361 1,010,361 1,010,361 1,010,361 1,010,361Special Master
1,000,000 1,000,000 1,000,000 1,000,000 1,000,000School‐Based Diversion Initiative10,659,030 10,659,030 10,659,030 10,659,030 10,659,030American School for the Deaf1,107,725 1,107,725 1,107,725 1,107,725 1,107,725Regional Education Services8,051,914 8,051,914 8,051,914 8,051,914 8,051,914Family Resource Centers2,354,000 2,354,000 2,354,000 2,354,000 2,354,000Child Nutrition State Match
11,017,600 11,017,600 11,017,600 11,017,600 11,017,600Vocational Agriculture24,884,748 24,884,748 24,884,748 24,884,748 24,884,748Transportation of School Children20,635,200 20,637,392 20,646,020 20,655,037 20,664,459Adult Education4,297,500 4,297,500 4,297,500 4,297,500 4,297,500Health and Welfare Services Pupils Private Schools
2,142,371,422 2,151,603,422 2,151,603,422 2,151,603,422 2,151,603,422Education Equalization Grants1,916,130 1,916,130 1,916,130 1,916,130 1,916,130Bilingual Education
40,702,571 40,702,571 40,702,571 40,702,571 40,702,571Priority School Districts229,330 229,330 229,330 229,330 229,330Young Parents Program
4,576,590 4,576,644 4,581,140 4,585,839 4,590,749Interdistrict Cooperation2,379,962 2,379,962 2,379,962 2,379,962 2,379,962School Breakfast Program
139,805,731 139,805,731 139,805,731 139,805,731 139,805,731Excess Cost ‐ Student Based
- 12 -

Budget Report
SUMMARY OF 2016‐2017 RECOMMENDED AND 2018‐2020 CURRENT SERVICES
Recommended Current ServicesFY 2016 FY 2017 FY 2018 FY 2019 FY 2020
By Fund and Appropriation
3,595,500 3,595,500 3,595,500 3,595,500 3,595,500Non‐Public School Transportation38,796,250 43,714,700 43,714,700 43,714,700 43,714,700OPEN Choice Program
329,604,896 327,035,401 327,035,401 327,035,401 327,035,401Magnet Schools5,063,286 5,063,286 5,063,286 5,063,286 5,063,286After School Program
3,049,106,083 3,064,923,460 3,073,219,273 3,081,643,563 3,090,446,944AGENCY TOTAL
OFFICE OF EARLY CHILDHOOD
8,785,880 8,876,246 9,275,677 9,693,082 10,129,271Personal Services349,943 349,943 349,943 349,943 349,943Other Expenses
10,232,306 10,232,306 10,232,306 10,232,306 10,232,306Children's Trust Fund10,609,270 10,609,270 10,609,270 10,609,270 10,609,270Early Childhood Program24,686,804 24,686,804 24,686,804 24,686,804 24,686,804Birth to Three18,614,289 18,614,289 18,614,289 18,614,289 18,614,289Child Care Services
451,250 451,250 451,250 451,250 451,250EvenStart
5,630,593 5,630,593 5,630,593 5,630,593 5,630,593Head Start Services125,816,808 127,016,808 127,016,808 127,016,808 127,016,808Child Care Services‐TANF/CCDBG
3,098,212 3,098,212 3,098,212 3,098,212 3,098,212Child Care Quality Enhancements
1,300,000 1,300,000 1,300,000 1,300,000 1,300,000Early Head Start‐Child Care Partnership4,935,863 4,935,863 4,935,863 4,935,863 4,935,863School Readiness Quality Enhancement
81,630,709 81,630,709 81,630,709 81,630,709 81,630,709School Readiness296,141,927 297,432,293 297,831,724 298,249,129 298,685,318AGENCY TOTAL
STATE LIBRARY
5,374,203 5,444,676 5,689,686 5,945,722 6,213,279Personal Services652,716 652,716 652,716 652,716 652,716Other Expenses
1,890,367 1,890,367 1,890,367 1,890,367 1,890,367State‐Wide Digital Library282,393 286,621 297,713 309,235 321,202Interlibrary Loan Delivery Service747,263 747,263 747,263 747,263 747,263Legal/Legislative Library Materials
8,946,942 9,021,643 9,277,745 9,545,303 9,824,827AGENCY TOTAL
OFFICE OF HIGHER EDUCATION
1,800,433 1,800,433 1,881,452 1,966,117 2,054,592Personal Services100,307 100,307 100,307 100,307 100,307Other Expenses
2,188,526 2,188,526 2,194,238 2,199,965 2,205,707Minority Advancement Program315,756 315,756 321,440 327,226 333,116National Service Act447,806 447,806 447,806 447,806 447,806Minority Teacher Incentive Program
37,423,498 34,423,498 34,423,498 34,423,498 34,423,498Governor's Scholarship42,276,326 39,276,326 39,368,741 39,464,919 39,565,026AGENCY TOTAL
UNIVERSITY OF CONNECTICUT
211,482,283 211,482,283 220,998,986 230,943,940 241,336,417Operating Expenses7,894,737 7,894,737 7,894,737 7,894,737 7,894,737Next Generation Connecticut
219,377,020 219,377,020 228,893,723 238,838,677 249,231,154AGENCY TOTAL
UNIVERSITY OF CONNECTICUT HEALTH CENTER
124,347,180 125,519,573 131,167,954 137,070,512 143,238,685Operating Expenses13,000,000 12,500,000 11,900,000 11,900,000 11,900,000Bioscience Connecticut
137,347,180 138,019,573 143,067,954 148,970,512 155,138,685AGENCY TOTAL
TEACHERS' RETIREMENT BOARD
1,784,268 1,801,590 1,882,662 1,967,382 2,055,914Personal Services539,810 539,810 539,810 539,810 539,810Other Expenses
975,578,000 1,012,162,000 1,052,648,480 1,094,754,419 1,138,544,596Retirement Contributions14,714,000 14,714,000 32,760,000 34,070,400 35,433,216Retirees Health Service Cost5,447,370 5,447,370 6,838,010 6,838,010 6,838,010Municipal Retiree Health Insurance Costs
998,063,448 1,034,664,770 1,094,668,962 1,138,170,021 1,183,411,546AGENCY TOTAL
- 13 -

Budget Report
SUMMARY OF 2016‐2017 RECOMMENDED AND 2018‐2020 CURRENT SERVICES
Recommended Current ServicesFY 2016 FY 2017 FY 2018 FY 2019 FY 2020
By Fund and Appropriation
BOARD OF REGENTS FOR HIGHER EDUCATION
2,733,385 2,769,156 2,893,768 3,023,988 3,160,067Charter Oak State College163,171,028 164,460,874 171,861,613 179,595,386 187,677,178Regional Community ‐ Technical Colleges159,309,488 157,983,871 165,093,145 172,522,337 180,285,842Connecticut State University
666,038 666,038 696,010 727,330 760,060Board of Regents for Higher Education10,894,737 10,894,737 10,894,737 10,894,737 10,894,737Transform CSCU
336,774,676 336,774,676 351,439,273 366,763,778 382,777,884AGENCY TOTAL
5,088,033,602 5,139,489,761 5,237,767,395 5,321,645,902 5,409,081,384TOTALEDUCATION
CORRECTIONS
DEPARTMENT OF CORRECTION
443,070,649 445,690,859 465,746,948 486,705,561 508,607,311Personal Services76,583,227 76,033,227 76,033,227 76,033,227 76,033,227Other Expenses26,136,219 26,136,219 26,136,219 26,136,219 26,136,219Workers' Compensation Claims
92,083,307 93,377,416 93,377,416 93,377,416 93,377,416Inmate Medical Services7,123,925 7,204,143 7,513,921 7,837,020 8,174,012Board of Pardons and Paroles
123,233,532 127,377,207 131,198,523 135,134,479 139,188,513Probation and Alternatives to Incarceration8,575 8,575 8,575 8,575 8,575Aid to Paroled and Discharged Inmates
827,065 827,065 827,065 827,065 827,065Legal Services to Prisoners41,435,777 41,435,777 41,435,777 41,435,777 41,435,777Community Support Services
810,502,276 818,090,488 842,277,671 867,495,339 893,788,115AGENCY TOTAL
DEPARTMENT OF CHILDREN AND FAMILIES
291,047,234 293,905,124 307,130,855 320,951,743 335,394,571Personal Services35,361,354 34,219,151 34,219,151 34,219,151 34,219,151Other Expenses10,716,873 10,716,873 10,716,873 10,716,873 10,716,873Workers' Compensation Claims
984,582 984,582 984,582 984,582 984,582Family Support Services2,515,707 2,515,707 2,515,707 2,515,707 2,515,707Homeless Youth8,286,191 8,286,191 8,286,191 8,286,191 8,286,191Differential Response System1,719,500 1,719,500 1,719,500 1,719,500 1,719,500Regional Behavioral Health Consultation
114,340,682 118,168,678 121,019,664 123,998,944 127,112,292Pre‐Adjudicated Juvenile and Family Svcs1,015,002 1,015,002 1,015,002 1,015,002 1,015,002Health Assessment and Consultation
15,483,393 15,483,393 15,483,393 15,483,393 15,483,393Grants for Psychiatric Clinics for Children6,783,292 6,783,292 6,783,292 6,783,292 6,783,292Day Treatment Centers for Children
12,199,027 12,199,027 12,199,027 12,199,027 12,199,027Juvenile Justice Outreach Services8,599,177 8,599,177 8,599,177 8,599,177 8,599,177Child Abuse and Neglect Intervention7,858,769 7,858,769 7,858,769 7,858,769 7,858,769Community Based Prevention Programs
1,797,591 1,797,591 1,797,591 1,797,591 1,797,591Family Violence Outreach and Counseling13,908,020 13,908,020 13,908,020 13,908,020 13,908,020Supportive Housing2,233,340 2,316,642 2,316,642 2,316,642 2,316,642No Nexus Special Education5,735,278 5,735,278 5,735,278 5,735,278 5,735,278Family Preservation Services9,817,303 9,817,303 9,817,303 9,817,303 9,817,303Substance Abuse Treatment
1,591,373 1,591,373 1,591,373 1,591,373 1,591,373Child Welfare Support Services94,356,756 95,666,397 96,903,944 98,112,929 99,339,340Board and Care for Children ‐ Adoption
124,643,643 125,568,483 127,535,997 127,666,611 127,797,359Board and Care for Children ‐ Foster109,037,361 108,900,959 108,900,959 108,900,959 108,900,959Board and Care for Children ‐ Residential
9,413,324 9,413,324 9,413,324 9,413,324 9,413,324Individualized Family Supports37,716,720 37,716,720 37,716,720 37,716,720 37,716,720Community KidCare2,300,000 2,300,000 2,300,000 2,300,000 2,300,000Youth Service Bureaus
929,461,492 937,186,556 956,468,334 974,608,101 993,521,436AGENCY TOTAL
1,739,963,768 1,755,277,044 1,798,746,005 1,842,103,440 1,887,309,551TOTALCORRECTIONS
- 14 -

Budget Report
SUMMARY OF 2016‐2017 RECOMMENDED AND 2018‐2020 CURRENT SERVICES
Recommended Current ServicesFY 2016 FY 2017 FY 2018 FY 2019 FY 2020
By Fund and Appropriation
JUDICIAL
JUDICIAL DEPARTMENT
376,144,123 397,514,672 415,402,832 434,095,959 453,630,277Personal Services71,112,718 75,849,011 75,849,011 75,849,011 75,849,011Other Expenses1,441,460 1,441,460 1,441,460 1,441,460 1,441,460Forensic Sex Evidence Exams
56,504,295 56,504,295 56,504,295 56,504,295 56,504,295Alternative Incarceration Program545,828 545,828 545,828 545,828 545,828Justice Education Center, Inc.
28,442,478 28,442,478 28,442,478 28,442,478 28,442,478Juvenile Alternative Incarceration3,136,361 3,136,361 3,136,361 3,136,361 3,136,361Juvenile Justice Centers
14,819,000 17,415,000 17,415,000 17,415,000 17,415,000Probate Court18,177,084 18,177,084 18,177,084 18,177,084 18,177,084Youthful Offender Services
9,402 9,402 9,402 9,402 9,402Victim Security Account582,250 582,250 582,250 582,250 582,250Children of Incarcerated Parents
1,660,000 1,660,000 1,660,000 1,660,000 1,660,000Legal Aid2,250,000 2,250,000 2,250,000 2,250,000 2,250,000Youth Violence Initiative109,838 109,838 109,838 109,838 109,838Children's Law Center150,000 150,000 150,000 150,000 150,000Juvenile Planning
575,084,837 603,787,679 621,675,839 640,368,966 659,903,284AGENCY TOTAL
PUBLIC DEFENDER SERVICES COMMISSION
44,709,273 45,009,344 47,034,764 49,151,328 51,363,138Personal Services1,926,663 1,970,558 1,970,558 1,970,558 1,970,558Other Expenses
24,848,601 24,848,601 24,848,601 24,848,601 24,848,601Assigned Counsel ‐ Criminal
3,022,090 3,022,090 3,022,090 3,022,090 3,022,090Expert Witnesses
165,000 165,000 165,000 165,000 165,000Training and Education125,000 125,000 125,000 125,000 125,000Contracted Attorneys Related Expenses
74,796,627 75,140,593 77,166,013 79,282,577 81,494,387AGENCY TOTAL
649,881,464 678,928,272 698,841,852 719,651,543 741,397,671TOTALJUDICIAL
NON‐FUNCTIONAL
DEBT SERVICE ‐ STATE TREASURER
1,650,954,823 1,765,932,976 1,891,449,954 1,821,951,451 1,951,588,052Debt Service143,382,944 157,057,219 170,129,919 182,037,943 194,780,599UConn 2000 ‐ Debt Service
5,500,000 5,500,000 5,500,000 5,500,000 5,500,000CHEFA Day Care Security132,732,646 119,597,971 140,219,021 118,390,521 118,390,521Pension Obligation Bonds ‐ Teachers' Retirement System
1,932,570,413 2,048,088,166 2,207,298,894 2,127,879,915 2,270,259,172AGENCY TOTAL
STATE COMPTROLLER ‐ MISCELLANEOUS
4,100,000 4,100,000 4,100,000 4,100,000 4,100,000Adjudicated Claims
44,784,293 22,392,147 22,392,147 22,392,147 22,392,147Nonfunctional ‐ Change to Accruals48,884,293 26,492,147 26,492,147 26,492,147 26,492,147AGENCY TOTAL
STATE COMPTROLLER ‐ FRINGE BENEFITS
7,474,000 6,410,300 6,410,300 6,410,300 6,410,300Unemployment Compensation
1,097,613,344 1,125,480,680 1,129,639,000 1,172,993,000 1,214,256,000State Employees Retirement Contributions8,359,234 8,924,234 9,325,825 9,745,487 10,184,034Higher Ed Alternative Retirement System1,709,519 1,760,804 1,760,804 1,760,804 1,760,804Pensions and Retirements ‐ Other Statutory
18,258,707 19,163,487 19,987,517 20,846,980 21,743,400Judges and Compensation Commissioners Retirement
8,496,100 8,641,100 8,641,100 8,641,100 8,641,100Insurance ‐ Group Life230,093,600 238,472,555 249,203,820 260,417,992 272,136,802Employers Social Security Tax679,787,987 729,338,587 758,512,130 788,852,615 820,406,720State Employees Health Services Cost686,397,000 751,109,000 781,153,360 812,399,494 844,895,474Retired Employees Health Service Cost
3,127,500 0 0 0 0Tuition Reimbursement ‐ Training and Travel
- 15 -

Budget Report
SUMMARY OF 2016‐2017 RECOMMENDED AND 2018‐2020 CURRENT SERVICES
Recommended Current ServicesFY 2016 FY 2017 FY 2018 FY 2019 FY 2020
By Fund and Appropriation
0 0 129,500,000 135,327,500 141,417,238Other Post Employment Benefits2,741,316,991 2,889,300,747 3,094,133,856 3,217,395,272 3,341,851,872AGENCY TOTAL
RESERVE FOR SALARY ADJUSTMENTS
22,940,302 130,524,913 136,398,534 142,536,468 148,950,609Reserve for Salary Adjustments
22,940,302 130,524,913 136,398,534 142,536,468 148,950,609AGENCY TOTAL
WORKERS' COMPENSATION CLAIMS ‐ DEPARTMENT OF ADMINISTRATIVE SERVICES
29,987,707 29,987,707 29,987,707 29,987,707 29,987,707Workers' Compensation Claims
29,987,707 29,987,707 29,987,707 29,987,707 29,987,707AGENCY TOTAL
4,775,699,706 5,124,393,680 5,494,311,138 5,544,291,509 5,817,541,507TOTALNON‐FUNCTIONAL
STATEWIDE
STATEWIDE ‐ LAPSES
‐91,676,192 ‐91,676,192 ‐91,676,192 ‐91,676,192 ‐91,676,192Unallocated Lapse‐3,028,105 ‐3,028,105 ‐3,028,105 ‐3,028,105 ‐3,028,105Unallocated Lapse ‐ Legislative‐7,400,672 ‐7,400,672 ‐7,400,672 ‐7,400,672 ‐7,400,672Unallocated Lapse ‐ Judicial‐9,678,316 ‐9,678,316 ‐9,678,316 ‐9,678,316 ‐9,678,316General Lapse ‐ Executive‐282,192 ‐282,192 ‐282,192 ‐282,192 ‐282,192General Lapse ‐ Judicial‐39,492 ‐39,492 ‐39,492 ‐39,492 ‐39,492General Lapse ‐ Legislative
‐20,000,000 ‐20,000,000 ‐20,000,000 ‐20,000,000 ‐20,000,000Municipal Opp and Reg Efficiencies Prg‐30,920,000 ‐30,920,000 ‐30,920,000 ‐30,920,000 ‐30,920,000Statewide Hiring Reduction ‐ Executive‐3,310,000 ‐3,310,000 ‐3,310,000 ‐3,310,000 ‐3,310,000Statewide Hiring Reduction ‐ Judicial‐770,000 ‐770,000 ‐770,000 ‐770,000 ‐770,000Statewide Hiring Reduction ‐ Legislative
‐3,863,606 ‐4,744,027 ‐4,744,027 ‐4,744,027 ‐4,744,027Reduce Funding in Excess of Current Svcs ‐ Legislative‐17,927,401 ‐24,669,556 ‐24,669,556 ‐24,669,556 ‐24,669,556Reduce Funding in Excess of Current Svcs ‐ Judicial
‐67,960 ‐110,878 ‐110,878 ‐110,878 ‐110,878Reduce Funding in Excess of Current Svcs ‐ FOI, ELE, ETH‐4,289,179 ‐4,289,179 ‐4,289,179 ‐4,289,179 ‐4,289,179Eliminate PDSC Funding for Requested Expansions
‐14,819,000 ‐17,415,000 ‐17,415,000 ‐17,415,000 ‐17,415,000Eliminate Probate Court Subsidy‐258,232,842 ‐266,897,702 ‐266,897,702 ‐266,897,702 ‐266,897,702Transfer Adult and Juvenile Svcs from CSSD to DOC and DCF
‐3,198,500 ‐344,500 ‐344,500 ‐344,500 ‐344,500Provide Capital Funding for Legislative Equipment
‐469,503,457 ‐485,575,811 ‐485,575,811 ‐485,575,811 ‐485,575,811AGENCY TOTAL
‐469,503,457 ‐485,575,811 ‐485,575,811 ‐485,575,811 ‐485,575,811TOTALSTATEWIDE
18,001,803,628 18,551,150,668 19,342,585,797 19,782,733,610 20,468,405,245TOTALGENERAL FUND
SPECIAL TRANSPORTATION FUND
GENERAL GOVERNMENT
DEPARTMENT OF ADMINISTRATIVE SERVICES
8,728,170 8,960,575 8,960,575 8,960,575 8,960,575Insurance and Risk Operations8,728,170 8,960,575 8,960,575 8,960,575 8,960,575AGENCY TOTAL
8,728,170 8,960,575 8,960,575 8,960,575 8,960,575TOTALGENERAL GOVERNMENT
REGULATION AND PROTECTION
DEPARTMENT OF MOTOR VEHICLES
49,455,023 49,918,630 52,164,968 54,512,392 56,965,450Personal Services16,469,767 16,435,656 16,435,656 16,435,656 16,435,656Other Expenses
768,200 802,000 802,000 802,000 802,000Equipment
212,109 214,676 214,676 214,676 214,676Commercial Vehicle Information Systems and Networks Project
- 16 -

Budget Report
SUMMARY OF 2016‐2017 RECOMMENDED AND 2018‐2020 CURRENT SERVICES
Recommended Current ServicesFY 2016 FY 2017 FY 2018 FY 2019 FY 2020
By Fund and Appropriation
66,905,099 67,370,962 69,617,300 71,964,724 74,417,782AGENCY TOTAL
66,905,099 67,370,962 69,617,300 71,964,724 74,417,782TOTALREGULATION AND PROTECTION
CONSERVATION AND DEVELOPMENT
DEPARTMENT OF ENERGY AND ENVIRONMENTAL PROTECTION
1,993,313 2,031,640 2,123,064 2,218,602 2,318,439Personal Services750,000 750,000 750,000 750,000 750,000Other Expenses
2,743,313 2,781,640 2,873,064 2,968,602 3,068,439AGENCY TOTAL
2,743,313 2,781,640 2,873,064 2,968,602 3,068,439TOTALCONSERVATION AND DEVELOPMENT
TRANSPORTATION
DEPARTMENT OF TRANSPORTATION
178,994,582 183,129,519 191,370,347 199,982,013 208,981,204Personal Services56,309,517 56,409,517 56,409,517 58,369,517 58,369,517Other Expenses2,419,007 1,327,886 1,327,886 1,327,886 1,327,886Equipment
475,000 475,000 475,000 475,000 475,000Minor Capital Projects3,246,823 3,246,823 3,317,434 3,391,223 3,468,332Highway Planning and Research
181,871,446 168,262,955 168,318,684 179,173,712 179,234,569Rail Operations152,681,619 157,914,575 158,792,508 176,919,946 176,922,494Bus Operations
1,500,000 1,500,000 1,500,000 1,500,000 1,500,000Tweed‐New Haven Airport Grant34,928,044 37,041,190 37,041,190 37,041,190 37,041,190ADA Para‐transit Program
576,361 576,361 576,361 576,361 576,361Non‐ADA Dial‐A‐Ride Program32,822,153 32,839,106 33,044,756 33,259,660 33,484,235Pay‐As‐You‐Go Transportation Projects3,272,322 3,272,322 3,272,322 3,272,322 3,272,322CAA Related Funds5,000,000 0 0 0 0Air Service Expansion119,506 239,011 239,011 239,011 239,011Port Authority
0 100,000 100,000 100,000 100,000Transit Corridor Development Authority10,000,000 0 0 0 0Plow Truck Fleet
664,216,380 646,334,265 655,785,016 695,627,841 704,992,121AGENCY TOTAL
664,216,380 646,334,265 655,785,016 695,627,841 704,992,121TOTALTRANSPORTATION
NON‐FUNCTIONAL
DEBT SERVICE ‐ STATE TREASURER
501,950,536 562,993,251 640,423,986 719,321,148 801,981,623Debt Service501,950,536 562,993,251 640,423,986 719,321,148 801,981,623AGENCY TOTAL
STATE COMPTROLLER ‐ MISCELLANEOUS
3,258,893 1,629,447 1,629,447 1,629,447 1,629,447Nonfunctional ‐ Change to Accruals3,258,893 1,629,447 1,629,447 1,629,447 1,629,447AGENCY TOTAL
STATE COMPTROLLER ‐ FRINGE BENEFITS
280,200 308,400 308,400 308,400 308,400Unemployment Compensation
122,254,000 129,339,800 129,818,000 134,800,000 139,542,000State Employees Retirement Contributions277,300 285,500 285,500 285,500 285,500Insurance ‐ Group Life
17,295,600 17,745,400 18,543,943 19,378,420 20,250,449Employers Social Security Tax52,018,500 57,098,700 59,382,648 61,757,954 64,228,272State Employees Health Services Cost
192,125,600 204,777,800 208,338,491 216,530,274 224,614,621AGENCY TOTAL
RESERVE FOR SALARY ADJUSTMENTS
1,896,280 13,301,186 13,899,739 14,525,227 15,178,862Reserve for Salary Adjustments
- 17 -

Budget Report
SUMMARY OF 2016‐2017 RECOMMENDED AND 2018‐2020 CURRENT SERVICES
Recommended Current ServicesFY 2016 FY 2017 FY 2018 FY 2019 FY 2020
By Fund and Appropriation
1,896,280 13,301,186 13,899,739 14,525,227 15,178,862AGENCY TOTAL
WORKERS' COMPENSATION CLAIMS ‐ DEPARTMENT OF ADMINISTRATIVE SERVICES
7,344,481 7,344,481 7,344,481 7,344,481 7,344,481Workers' Compensation Claims
7,344,481 7,344,481 7,344,481 7,344,481 7,344,481AGENCY TOTAL
706,575,790 790,046,165 871,636,144 959,350,577 1,050,749,034TOTALNON‐FUNCTIONAL
STATEWIDE
STATEWIDE ‐ LAPSES
‐11,000,000 ‐11,000,000 ‐11,000,000 ‐11,000,000 ‐11,000,000Unallocated Lapse‐11,000,000 ‐11,000,000 ‐11,000,000 ‐11,000,000 ‐11,000,000AGENCY TOTAL
‐11,000,000 ‐11,000,000 ‐11,000,000 ‐11,000,000 ‐11,000,000TOTALSTATEWIDE
1,438,168,752 1,504,493,607 1,597,872,099 1,727,872,319 1,831,187,951TOTALSPECIAL TRANSPORTATION FUND
BANKING FUND
REGULATION AND PROTECTION
DEPARTMENT OF BANKING
10,828,191 10,891,111 11,381,211 11,893,365 12,428,566Personal Services1,611,490 1,461,490 1,461,490 1,461,490 1,461,490Other Expenses
35,000 35,000 35,000 35,000 35,000Equipment
8,554,271 8,603,978 8,991,157 9,395,759 9,817,851Fringe Benefits167,151 167,151 167,151 167,151 167,151Indirect Overhead
21,196,103 21,158,730 22,036,009 22,952,765 23,910,058AGENCY TOTAL
LABOR DEPARTMENT
500,000 500,000 500,000 500,000 500,000Opportunity Industrial Centers 200,000 200,000 200,000 200,000 200,000Individual Development Accounts
1,000,000 1,000,000 1,000,000 1,000,000 1,000,000Customized Services1,700,000 1,700,000 1,700,000 1,700,000 1,700,000AGENCY TOTAL
22,896,103 22,858,730 23,736,009 24,652,765 25,610,058TOTALREGULATION AND PROTECTION
CONSERVATION AND DEVELOPMENT
DEPARTMENT OF HOUSING
500,000 500,000 500,000 500,000 500,000Fair Housing500,000 500,000 500,000 500,000 500,000AGENCY TOTAL
500,000 500,000 500,000 500,000 500,000TOTALCONSERVATION AND DEVELOPMENT
JUDICIAL
JUDICIAL DEPARTMENT
6,278,724 6,664,325 6,664,325 6,664,325 6,664,325Foreclosure Mediation Program6,278,724 6,664,325 6,664,325 6,664,325 6,664,325AGENCY TOTAL
6,278,724 6,664,325 6,664,325 6,664,325 6,664,325TOTALJUDICIAL
NON‐FUNCTIONAL
STATE COMPTROLLER ‐ MISCELLANEOUS
- 18 -

Budget Report
SUMMARY OF 2016‐2017 RECOMMENDED AND 2018‐2020 CURRENT SERVICES
Recommended Current ServicesFY 2016 FY 2017 FY 2018 FY 2019 FY 2020
By Fund and Appropriation
190,355 95,178 95,178 95,178 95,178Nonfunctional ‐ Change to Accruals190,355 95,178 95,178 95,178 95,178AGENCY TOTAL
190,355 95,178 95,178 95,178 95,178TOTALNON‐FUNCTIONAL
29,865,182 30,118,233 30,995,512 31,912,268 32,869,561TOTALBANKING FUND
INSURANCE FUND
GENERAL GOVERNMENT
OFFICE OF POLICY AND MANAGEMENT
312,051 313,882 328,007 342,767 358,192Personal Services5,750 6,012 6,012 6,012 6,012Other Expenses
199,491 200,882 209,922 219,372 229,244Fringe Benefits517,292 520,776 543,941 568,151 593,448AGENCY TOTAL
517,292 520,776 543,941 568,151 593,448TOTALGENERAL GOVERNMENT
REGULATION AND PROTECTION
INSURANCE DEPARTMENT
15,037,381 15,145,396 15,826,939 16,539,151 17,283,413Personal Services2,052,428 2,052,428 2,052,428 2,052,428 2,052,428Other Expenses
95,000 92,500 92,500 92,500 92,500Equipment
11,729,157 11,813,409 12,345,012 12,900,538 13,481,062Fringe Benefits248,930 248,930 248,930 248,930 248,930Indirect Overhead
29,162,896 29,352,663 30,565,809 31,833,547 33,158,333AGENCY TOTAL
OFFICE OF THE HEALTHCARE ADVOCATE
2,428,478 2,488,457 2,600,438 2,717,458 2,839,744Personal Services2,691,267 2,691,267 2,691,267 2,691,267 2,691,267Other Expenses
15,000 15,000 15,000 15,000 15,000Equipment
2,259,927 2,256,227 2,256,227 2,256,227 2,256,227Fringe Benefits142,055 142,055 142,055 142,055 142,055Indirect Overhead
7,536,727 7,593,006 7,704,987 7,822,007 7,944,293AGENCY TOTAL
36,699,623 36,945,669 38,270,796 39,655,554 41,102,626TOTALREGULATION AND PROTECTION
HEALTH AND HOSPITALS
DEPARTMENT OF PUBLIC HEALTH
459,416 459,416 459,416 459,416 459,416Needle and Syringe Exchange4,890,686 4,890,686 4,890,686 4,890,686 4,890,686AIDS Services2,145,586 2,150,565 2,163,578 2,177,510 2,192,069Breast and Cervical Cancer Detection and Treatment
32,728,052 34,000,718 35,362,477 36,778,785 38,251,827Immunization Services1,115,148 1,115,148 1,115,148 1,115,148 1,115,148X‐Ray Screening and Tuberculosis Care197,171 197,171 197,171 197,171 197,171Venereal Disease Control
41,536,059 42,813,704 44,188,476 45,618,716 47,106,317AGENCY TOTAL
DEPARTMENT OF MENTAL HEALTH AND ADDICTION SERVICES
435,000 435,000 435,000 435,000 435,000Managed Service System435,000 435,000 435,000 435,000 435,000AGENCY TOTAL
41,971,059 43,248,704 44,623,476 46,053,716 47,541,317TOTALHEALTH AND HOSPITALS
- 19 -

Budget Report
SUMMARY OF 2016‐2017 RECOMMENDED AND 2018‐2020 CURRENT SERVICES
Recommended Current ServicesFY 2016 FY 2017 FY 2018 FY 2019 FY 2020
By Fund and Appropriation
HUMAN SERVICES
STATE DEPARTMENT ON AGING
475,000 475,000 475,000 475,000 475,000Fall Prevention475,000 475,000 475,000 475,000 475,000AGENCY TOTAL
475,000 475,000 475,000 475,000 475,000TOTALHUMAN SERVICES
NON‐FUNCTIONAL
STATE COMPTROLLER ‐ MISCELLANEOUS
233,889 116,945 116,945 116,945 116,945Nonfunctional ‐ Change to Accruals233,889 116,945 116,945 116,945 116,945AGENCY TOTAL
233,889 116,945 116,945 116,945 116,945TOTALNON‐FUNCTIONAL
79,896,863 81,307,094 84,030,158 86,869,366 89,829,336TOTALINSURANCE FUND
CONSUMER COUNSEL AND PUBLIC UTILITY CONTROL FUND
REGULATION AND PROTECTION
OFFICE OF CONSUMER COUNSEL
1,422,103 1,433,306 1,497,805 1,565,206 1,635,640Personal Services282,907 282,907 282,907 282,907 282,907Other Expenses12,200 2,200 2,200 2,200 2,200Equipment
1,208,788 1,218,310 1,273,134 1,330,425 1,390,294Fringe Benefits97,613 97,613 97,613 97,613 97,613Indirect Overhead
3,023,611 3,034,336 3,153,659 3,278,351 3,408,654AGENCY TOTAL
3,023,611 3,034,336 3,153,659 3,278,351 3,408,654TOTALREGULATION AND PROTECTION
CONSERVATION AND DEVELOPMENT
DEPARTMENT OF ENERGY AND ENVIRONMENTAL PROTECTION
12,030,389 12,110,378 12,655,345 13,224,836 13,819,954Personal Services1,479,367 1,479,367 1,479,367 1,479,367 1,479,367Other Expenses
19,500 19,500 19,500 19,500 19,500Equipment
9,383,703 9,446,095 9,871,169 10,315,372 10,779,564Fringe Benefits467,009 467,009 467,009 467,009 467,009Indirect Overhead
23,379,968 23,522,349 24,492,390 25,506,084 26,565,394AGENCY TOTAL
23,379,968 23,522,349 24,492,390 25,506,084 26,565,394TOTALCONSERVATION AND DEVELOPMENT
NON‐FUNCTIONAL
STATE COMPTROLLER ‐ MISCELLANEOUS
179,317 89,658 89,658 89,658 89,658Nonfunctional ‐ Change to Accruals179,317 89,658 89,658 89,658 89,658AGENCY TOTAL
179,317 89,658 89,658 89,658 89,658TOTALNON‐FUNCTIONAL
26,582,896 26,646,343 27,735,707 28,874,093 30,063,706TOTALCONSUMER COUNSEL AND PUBLIC UTILITY CONTROL FUND
WORKERS' COMPENSATION FUND
- 20 -

Budget Report
SUMMARY OF 2016‐2017 RECOMMENDED AND 2018‐2020 CURRENT SERVICES
Recommended Current ServicesFY 2016 FY 2017 FY 2018 FY 2019 FY 2020
By Fund and Appropriation
GENERAL GOVERNMENT
DIVISION OF CRIMINAL JUSTICE
402,519 405,969 424,238 443,329 463,279Personal Services10,000 10,428 10,428 10,428 10,428Other Expenses
336,390 339,273 354,540 370,494 387,166Fringe Benefits748,909 755,670 789,206 824,251 860,873AGENCY TOTAL
748,909 755,670 789,206 824,251 860,873TOTALGENERAL GOVERNMENT
REGULATION AND PROTECTION
LABOR DEPARTMENT
686,418 687,148 690,224 693,439 696,799Occupational Health Clinics686,418 687,148 690,224 693,439 696,799AGENCY TOTAL
WORKERS' COMPENSATION COMMISSION
10,044,172 10,240,361 10,701,177 11,182,730 11,685,953Personal Services4,828,747 4,269,747 4,269,747 4,269,747 4,269,747Other Expenses107,500 41,000 41,000 41,000 41,000Equipment
8,035,338 8,192,289 8,560,942 8,946,184 9,348,762Fringe Benefits464,028 464,028 464,028 464,028 464,028Indirect Overhead
23,479,785 23,207,425 24,036,894 24,903,689 25,809,490AGENCY TOTAL
24,166,203 23,894,573 24,727,118 25,597,128 26,506,289TOTALREGULATION AND PROTECTION
HUMAN SERVICES
DEPARTMENT OF REHABILITATION SERVICES
529,629 534,113 558,148 583,265 609,512Personal Services53,822 53,822 53,822 53,822 53,822Other Expenses
1,261,913 1,261,913 1,261,913 1,261,913 1,261,913Rehabilitative Services407,053 410,485 410,485 410,485 410,485Fringe Benefits
2,252,417 2,260,333 2,284,368 2,309,485 2,335,732AGENCY TOTAL
2,252,417 2,260,333 2,284,368 2,309,485 2,335,732TOTALHUMAN SERVICES
NON‐FUNCTIONAL
STATE COMPTROLLER ‐ MISCELLANEOUS
144,597 72,298 72,298 72,298 72,298Nonfunctional ‐ Change to Accruals144,597 72,298 72,298 72,298 72,298AGENCY TOTAL
144,597 72,298 72,298 72,298 72,298TOTALNON‐FUNCTIONAL
27,312,126 26,982,874 27,872,990 28,803,162 29,775,192TOTALWORKERS' COMPENSATION FUND
MASHANTUCKET PEQUOT AND MOHEGAN FUND
GENERAL GOVERNMENT
OFFICE OF POLICY AND MANAGEMENT
61,779,907 61,779,907 61,779,907 61,779,907 61,779,907Grants to Towns61,779,907 61,779,907 61,779,907 61,779,907 61,779,907AGENCY TOTAL
61,779,907 61,779,907 61,779,907 61,779,907 61,779,907TOTALGENERAL GOVERNMENT
- 21 -

Budget Report
SUMMARY OF 2016‐2017 RECOMMENDED AND 2018‐2020 CURRENT SERVICES
Recommended Current ServicesFY 2016 FY 2017 FY 2018 FY 2019 FY 2020
By Fund and Appropriation
61,779,907 61,779,907 61,779,907 61,779,907 61,779,907TOTALMASHANTUCKET PEQUOT AND MOHEGAN FUND
REGIONAL MARKET OPERATION FUND
CONSERVATION AND DEVELOPMENT
DEPARTMENT OF AGRICULTURE
425,294 430,138 449,494 469,721 490,858Personal Services273,007 273,007 273,007 273,007 273,007Other Expenses357,247 361,316 377,575 394,566 412,321Fringe Benefits
1,055,548 1,064,461 1,100,076 1,137,294 1,176,186AGENCY TOTAL
1,055,548 1,064,461 1,100,076 1,137,294 1,176,186TOTALCONSERVATION AND DEVELOPMENT
NON‐FUNCTIONAL
STATE COMPTROLLER ‐ MISCELLANEOUS
5,689 2,845 2,845 2,845 2,845Nonfunctional ‐ Change to Accruals5,689 2,845 2,845 2,845 2,845AGENCY TOTAL
5,689 2,845 2,845 2,845 2,845TOTALNON‐FUNCTIONAL
1,061,237 1,067,306 1,102,921 1,140,139 1,179,031TOTALREGIONAL MARKET OPERATION FUND
CRIMINAL INJURIES COMPENSATION FUND
JUDICIAL
JUDICIAL DEPARTMENT
2,851,675 2,934,088 2,934,088 2,934,088 2,934,088Criminal Injuries Compensation Fund2,851,675 2,934,088 2,934,088 2,934,088 2,934,088AGENCY TOTAL
2,851,675 2,934,088 2,934,088 2,934,088 2,934,088TOTALJUDICIAL
2,851,675 2,934,088 2,934,088 2,934,088 2,934,088TOTALCRIMINAL INJURIES COMPENSATION FUND
19,669,322,266 20,286,480,120 21,176,909,179 21,752,918,952 22,548,024,017STATEWIDE TOTAL
- 22 -

Budget Report
PROJECTED REVENUES(in millions)
Taxes 2015-16 2016-17 2017-18 2018-19 2019-20Personal Income Tax 9,761.3$ 10,313.2$ 10,898.0$ 11,490.1$ 12,146.5$ Sales & Use Tax 4,321.4 4,420.9 4,458.6 4,626.8 4,801.5 Corporation Tax 900.5 824.2 831.1 858.0 880.1 Public Service Tax 308.7 317.2 325.8 334.6 343.9 Inheritance & Estate Tax 177.4 182.7 188.5 194.9 201.9 Insurance Companies Tax 259.9 262.4 243.9 248.0 252.2 Cigarettes Tax 336.7 320.5 306.1 292.3 279.2 Real Estate Conveyance Tax 194.7 200.8 207.8 213.6 220.0 Oil Companies Tax - - 7.1 41.3 58.1 Alcoholic Beverages Tax 63.0 63.4 63.7 64.0 64.3 Admissions & Dues Tax 38.7 40.0 40.4 40.8 41.3 Health Provider Tax 650.1 651.0 654.2 658.2 663.8 Miscellaneous Tax 20.9 21.4 21.9 22.4 22.9 Total Taxes 17,033.3$ 17,617.7$ 18,247.1$ 19,085.0$ 19,975.7$ Less Refunds of Tax (1,165.2) (1,214.9) (1,266.9) (1,306.0) (1,358.0) Less Earned Income Tax (127.4) (133.9) (151.7) (153.0) (155.0) Less R&D Credit Exchange (7.1) (7.4) (7.8) (8.0) (8.0) Total - Taxes Less Refunds 15,733.6$ 16,261.5$ 16,820.7$ 17,618.0$ 18,454.7$
Other RevenueTransfers-Special Revenue 329.8$ 339.3$ 349.2$ 360.1$ 371.6$ Indian Gaming Payments 260.7 254.3 190.8 187.0 184.2
Licenses, Permits, Fees 311.8 292.0 319.4 295.8 324.6 Sales of Commodities 44.6 45.8 47.1 48.0 49.2 Rents, Fines, Escheats 119.9 121.8 123.8 125.7 127.5 Investment Income 2.8 5.9 7.5 7.5 7.5 Miscellaneous 168.3 170.4 172.5 177.1 181.8 Less Refunds of Payments (74.2) (75.1) (75.9) (77.0) (79.0) Total - Other Revenue 1,163.7$ 1,154.4$ 1,134.4$ 1,124.2$ 1,167.4$
Other SourcesFederal Grants 1,272.4$ 1,291.4$ 1,299.2$ 1,308.4$ 1,305.9$ Transfer From Tobacco Settlement 107.1 99.0 71.8 69.2 66.7 Transfers From/(To) Other Funds (233.6) (232.5) (379.3) (522.3) (667.3) Transfers to the Resources of the STF. (38.2) (17.6) - - - Total - Other Sources 1,107.7$ 1,140.3$ 991.7$ 855.3$ 705.3$
Total - General Fund Revenues 18,005.0$ 18,556.2$ 18,946.8$ 19,597.5$ 20,327.4$
Taxes 2015-16 2016-17 2017-18 2018-19 2019-20Motor Fuels Tax 502.0$ 499.8$ 497.2$ 494.7$ 492.2$ Oil Companies Tax 339.1 359.7 377.3 377.3 377.3 Sales Tax - DMV 84.0 85.0 85.9 87.0 88.0 Total Taxes 925.1$ 944.5$ 960.4$ 959.0$ 957.5$ Less Refunds of Taxes (7.2) (7.4) (7.6) (7.8) (8.0) Total - Taxes Less Refunds 917.9$ 937.1$ 952.8$ 951.2$ 949.5$
Other SourcesMotor Vehicle Receipts 245.8$ 246.6$ 247.4$ 248.1$ 248.9$ Licenses, Permits, Fees 139.2 139.9 140.5 141.1 141.6 Interest Income 7.8 8.6 9.6 10.5 11.3 Federal Grants 12.1 12.1 12.1 12.1 12.1 Transfers From (To) Other Funds 146.3 156.3 268.3 411.3 556.3 Transfers From the General Fund 38.2 17.6 - - - Less Refunds of Payments (3.7) (3.8) (3.9) (4.4) (4.8) Total - Other Sources 585.7$ 577.3$ 674.0$ 818.6$ 965.4$
Total - STF Revenues 1,503.6$ 1,514.4$ 1,626.8$ 1,769.8$ 1,914.9$
General Fund
Special Transportation Fund
- 23 -

Budget Report
PROJECTED REVENUES(in millions)
Transfers from the General Fund 61.8$ 61.8$ 61.8$ 61.8$ 61.8$ Total - Mashantucket Pequot and Mohegan Fund Revenues 61.8$ 61.8$ 61.8$ 61.8$ 61.8$
Rentals 1.1$ 1.1$ 1.2$ 1.2$ 1.2$ Total - Regional Market Operating Fund Revenues 1.1$ 1.1$ 1.2$ 1.2$ 1.2$
Fees and Assessments 29.9$ 30.2$ 31.0$ 32.0$ 33.0$ Total - Banking Fund Revenues 29.9$ 30.2$ 31.0$ 32.0$ 33.0$
Assessments 79.9$ 81.4$ 84.1$ 86.9$ 90.0$ Total - Insurance Fund Revenues 79.9$ 81.4$ 84.1$ 86.9$ 90.0$
Fees and Assessments 26.6$ 26.7$ 27.8$ 28.9$ 31.0$ Total -Consumer Counsel and Public Utility Fund Revenues 26.6$ 26.7$ 27.8$ 28.9$ 31.0$
Fees and Assessments 27.4$ 27.0$ 27.9$ 28.9$ 30.0$ Total - Workers' Compensation Fund Revenues 27.4$ 27.0$ 27.9$ 28.9$ 30.0$
Fines 2.9$ 3.0$ 3.0$ 3.0$ 3.0$ Total - Criminal Injuries Fund Revenues 2.9$ 3.0$ 3.0$ 3.0$ 3.0$
Total - All Appropriated Funds Revenues 19,738.2$ 20,301.8$ 20,810.4$ 21,610.0$ 22,492.3$
Workers' Compensation Fund
Criminal Injuries Compensation Fund
Regional Market Operating Fund
Banking Fund
Insurance Fund
Mashantucket Pequot and Mohegan Fund
Consumer Counsel and Public Utility Fund
- 24 -

Budget Report
Governor's Revenue Proposals
February 18, 2015
General Fund
(In Millions)
Fiscal Fiscal Fiscal Fiscal Fiscal
Tax Type Legislative Proposals 2016 2017 2018 2019 2020
Personal Income Tax Delay Singles Exemption for Three Years 12.7$ 8.5$ 4.3$ -$ -$
Sales and Use Tax Reduce rate: 6.20% on 11/1/2015, 5.95% on 4/1/2017 (70.1)$ (154.9)$ (299.5)$ (310.9)$ (322.6)$
Eliminate Clothing Exemption 138.0 142.1 146.4 150.8 155.3
Alter Sales Tax free week, exempt clothing <$100 1.0 1.1 1.2 1.3 1.4
Impact of Alcoholic Beverages Changes 1.5 1.5 1.5 1.5 1.5
Sub-Total - Sales and Use Tax 70.4$ (10.2)$ (150.4)$ (157.3)$ (164.4)$
Corporation Tax Maintain surcharge at 20% permanently 44.4$ 75.0$ 75.0$ 75.0$ 75.0$
Cap use of Net Operating Losses at 50% of liability 156.3 90.1 90.1 90.1 90.1
Credit caps- IY 15: 35%, IY 16: 45%, IY 17 and later, 60% 72.5 29.3 26.2 26.2 26.2
Eliminate the Business Entity Tax - (40.0) - (40.0) -
Sub-Total - Corporation Tax 273.2$ 154.4$ 191.3$ 151.3$ 191.3$
Public Utilities Tax Reduce transfer to CT-N 0.7$ 0.7$ 0.7$ 0.7$ 0.7$
Insurance Companies Tax Maintain 3 Tier Credit Cap for Two Years 18.7$ 18.7$ -$ -$ -$
Continue Film Moratorium for Two Years 4.0 4.0 - - -
Sub-Total - Insurance Companies Tax 22.7$ 22.7$ -$ -$ -$
Alcoholic Beverages Extend sale hours 0.3$ 0.3$ 0.3$ 0.3$ 0.3$
Revise minimum pricing 1.5 1.5 1.5 1.5 1.5
Sub-Total - Alcoholic Beverages 1.8$ 1.8$ 1.8$ 1.8$ 1.8$
Health Provider Taxes Update the Hospital Net Revenue Tax 165.2$ 165.2$ 165.2$ 165.2$ 165.2$
Credit caps- FY 16: 35%, FY 17: 45%, FY 18 and later: 60% 5.0 3.8 3.1 3.1 3.1
Sub-Total - Health Provider Tax 170.2$ 169.0$ 168.3$ 168.3$ 168.3$
Refunds of Taxes Delay EITC for Two Years @ 27.5% 11.0$ 11.0$ -$ -$ -$
License, Permits, Fees Increase SOTS fees for pass-through entities by $80 10.0 12.8 12.8 12.8 12.8
Increase DEEP Fee for Solid Waste Transport by $1 5.3 5.3 5.3 5.3 5.3 Transfer Palliative Use of Marijuana to General Fund 0.6 0.6 0.6 0.6 0.6
Sub-Total - License, Permits, Fees 15.9$ 18.7$ 18.7$ 18.7$ 18.7$
Miscellaneous Revenue Charge towns 100% for Resident State Troopers 4.6$ 4.6$ 4.6$ 4.6$ 4.6$
Federal Grants Revenue loss resulting from expenditure changes (25.7)$ (30.6)$ (30.6)$ (30.6)$ (30.6)$
Transfers - Tobacco Settlement Eliminate Tobacco Health Trust Fund Transfer 12.0$ 12.0$ 6.0$ 6.0$ 6.0$
Eliminate Biomedical Trust Fund Transfer 4.0 4.0 4.0 4.0 4.0
Reduce transfer to Early Childhood Education Program 5.0 - - - -
Sub-Total - Transfers - Tobacco Settlement 21.0$ 16.0$ 10.0$ 10.0$ 10.0$
Transfers - Other Funds GF Transfer to STF - Let's Go CT -$ -$ (112.0)$ (255.0)$ (400.0)$
GAAP Amortization (47.6) (47.6) (47.6) (47.6) (47.6)
Intercept Community Investment Act Revenue 13.5 27.0 - - -
CHEFA grant program - loan servicing fees 3.5 3.5 - - -
Private Occupational School Student Protection Account 2.5 - - - -
Divert PEGPETIA transfer 4.2 4.3 - - - Divert Municipal Video Competition Trust Acct. transfer 3.0 3.0 3.0 3.0 3.0
Sub-Total - Transfers - Other Funds (20.9)$ (9.8)$ (156.6)$ (299.6)$ (444.6)$
General Fund -- Total 557.6$ 356.8$ 62.1$ (132.1)$ (244.2)$
Special Transportation Fund
(In Millions)
Fiscal Fiscal Fiscal Fiscal Fiscal
Tax Type Legislative Proposals 2016 2017 2018 2019 2020
Transfers - Other Funds GF Transfer to STF - Let's Go CT -$ -$ 112.0$ 255.0$ 400.0$
Special Transportation Fund -- Total -$ -$ 112.0$ 255.0$ 400.0$
- 25 -
Budget Report
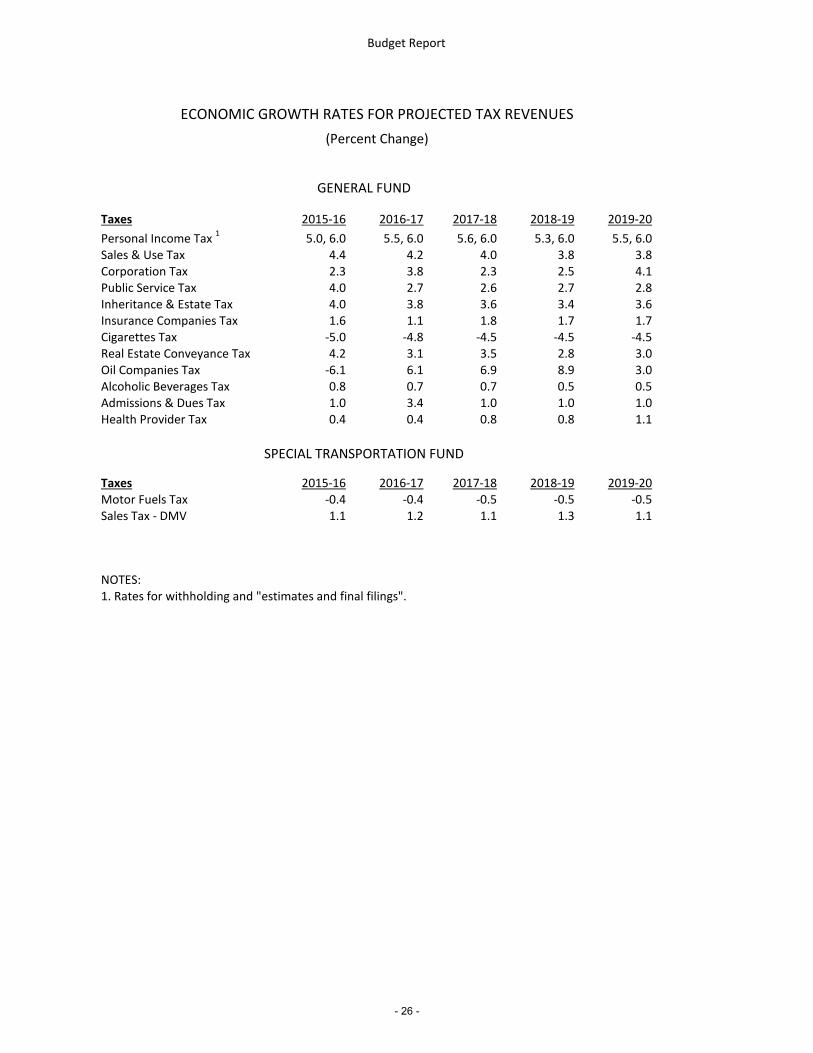
Taxes 2015-16 2016-17 2017-18 2018-19 2019-20
Personal Income Tax 1 5.0, 6.0 5.5, 6.0 5.6, 6.0 5.3, 6.0 5.5, 6.0Sales & Use Tax 4.4 4.2 4.0 3.8 3.8Corporation Tax 2.3 3.8 2.3 2.5 4.1Public Service Tax 4.0 2.7 2.6 2.7 2.8Inheritance & Estate Tax 4.0 3.8 3.6 3.4 3.6Insurance Companies Tax 1.6 1.1 1.8 1.7 1.7Cigarettes Tax -5.0 -4.8 -4.5 -4.5 -4.5Real Estate Conveyance Tax 4.2 3.1 3.5 2.8 3.0Oil Companies Tax -6.1 6.1 6.9 8.9 3.0Alcoholic Beverages Tax 0.8 0.7 0.7 0.5 0.5Admissions & Dues Tax 1.0 3.4 1.0 1.0 1.0Health Provider Tax 0.4 0.4 0.8 0.8 1.1
Taxes 2015-16 2016-17 2017-18 2018-19 2019-20Motor Fuels Tax -0.4 -0.4 -0.5 -0.5 -0.5Sales Tax - DMV 1.1 1.2 1.1 1.3 1.1
NOTES:1. Rates for withholding and "estimates and final filings".
ECONOMIC GROWTH RATES FOR PROJECTED TAX REVENUES
(Percent Change)
GENERAL FUND
SPECIAL TRANSPORTATION FUND
- 26 -

Budget Report
Fiscal Fiscal Fiscal Fiscal Fiscal2015-16 2016-17 2017-18 2018-19 2019-20
Expenditure cap (1) 2.98% 3.45% 3.33% 3.63% 3.91%
Personal Income Growth Fiscal Fiscal Fiscal Fiscal Fiscal2009-14 2010-15 2011-16 2012-17 2013-18
Beginning Personal Income 192,589$ 195,735$ 205,007$ 212,280$ 219,015$
Ending Personal Income 223,076$ 231,950$ 241,449$ 253,691$ 265,343$
Personal Income 5-year Growth 2.98% 3.45% 3.33% 3.63% 3.91%
Consumer Price Index -0.06% 2.31% 2.37% 2.40% 2.50%
(1) The Expenditure Cap is the greater of the Personal Income Growth or the growth in the Consumer Price Index in the above Table.
Fiscal Fiscal Fiscal Fiscal Fiscal2015-16 2016-17 2017-18 2018-19 2019-20
UNITED STATESGross Domestic Product 4.4% 4.8% 4.7% 4.8% 5.0%Real Gross Domestic Product 2.6% 2.9% 2.7% 2.6% 2.9%G.D.P. Deflator 2.0% 2.0% 1.9% 1.9% 2.1%Housing Starts (M) 1.25 1.42 1.49 1.55 1.61 Unemployment Rate 5.4% 5.2% 5.1% 5.1% 5.0%New Vehicle Sales (M) 17.07 17.37 17.43 17.10 16.96 Consumer Price Index 0.8% 2.7% 2.6% 2.6% 2.4%
CONNECTICUTPersonal Income 3.9% 4.9% 4.9% 4.2% 4.7%Total Nonfarm Employment 1.3% 1.0% 0.3% 0.2% 0.5%Unemployment Rate 5.7% 5.4% 5.2% 5.2% 5.1%
M Denotes million units
ESTIMATED EXPENDITURE CAP GROWTH RATE(Based on Current Statutes)
ASSUMPTIONS USED TO DEVELOP REVENUE ESTIMATES
- 27 -

Budget Report
CONSTITUTIONAL EXPENDITURE CAP
The Constitutional Expenditure Cap was ratified as an Amendment to Article 3 of the State Constitution, November 3, 1992. The Constitutional Expenditure Cap provides that General Budget Expenditures authorized for any fiscal year shall not exceed estimated revenue for such fiscal year. The cap also ensures that the General Assembly shall not authorize an increase in general budget expenditures by the greater of the increase in personal income or the increase in inflation. The General Assembly is required to define by law the increase in personal income, the increase in inflation and general budget expenditures. Such definitions require a vote of at least 3/5ths of the members of each chamber to be enacted or amended. However, general budget expenditures shall not include payments of bonds, notes or other evidences of indebtedness. The Constitutional Cap includes two exceptions: a declaration of an emergency by the Governor or the existence of extraordinary circumstances. If either event occurs, the General Assembly can authorize an increase in general budget expenditures higher than the increase in personal income or the increase in inflation only with a vote of at least 3/5ths of the members of each chamber. The Constitutional Expenditure Cap provides that all unappropriated surpluses shall be used to fund a budget reserve fund, reduce bonded indebtedness or for any other purpose authorized by at least 3/5ths of the members of each chamber.
STATUTORY CAP - SECTION 2-33A
The Statutory Expenditure Cap was passed as a part of Public Act 91-3 during the 1991 June Special Session. The provisions of this section were applicable with fiscal years beginning July 1, 1992. The Statutory Cap provides that the General Assembly shall not authorize an increase in general budget expenditures above general budget expenditures authorized for the previous fiscal year by the greater of-
Increase in personal income - which is defined as the average of the annual increase in personal income in the state for the preceding five years; or
Increase in inflation - which is defined as the increase in the consumer price index for urban consumers during the preceding 12 month period.
General budget expenditures are appropriated funds authorized by public or special acts of the General Assembly. General budget expenditures do not include principal and interest on bonds, notes or other evidences of indebtedness; expenditures under Section 4-30a (Budget Reserve Fund); current or increased expenditures for statutory grants to distressed municipalities which were in effect 7/l/91; and expenditures for implementation of federal mandates or court orders in their first year. Federal mandates are programs or services in which the state must participate, or in which they participated as of July 1, 1991, and in which the state must meet federal entitlement and eligibility criteria in order to receive federal reimbursement. Federal mandates do not include optional program and service components. Expenditures above the increase in personal income or inflation can be authorized by the General Assembly, by a vote of at least 3/5ths of the members of each chamber if the Governor has declared an emergency or the existence of extraordinary circumstances. Any such exception to the cap, shall include the specific nature of the emergency or circumstances and may provide that such proposed additional expenditures shall not be considered general budget expenditures for the current fiscal year for the purposes of determining general budget expenditures for the next fiscal year. Any act of the General Assembly authorizing such expenditures can also contain this provision.
- 28 -


![Addiction and Health [Read-Only]](https://static.documents.pub/doc/80x56/623e58161d1cbb39b518abda/addiction-and-health-read-only.jpg)


