63
77, "P11 F E 6~ C4 DEC 24 19 U US"M M I "a ON R*ý,C" MM ARSOM~~ IL10* jj UTE IMA Y>v= "a f &O a.;I~y *ft W. ; ~ Thi doi'nrt r c~noprcv~ 4 ~ Oo~ M "r pwf ow~r:'* 'V ae:isL
77,
"P11
F E6~
C4DEC 24 19 U
US"M M I
"a ON R*ý,C" MMARSOM~~ IL10* jj UTE
IMA Y>v= "a f
&O a.;I~y *ft W. ; ~
Thi doi'nrt r c~noprcv~ 4 ~ Oo~
M "r pwf ow~r:'* 'V ae:isL

*4 .
2 ¼k~'> >~4~ 4t
A ~ '2*...Moltr""o
¶1' &k~'(.,yr~~. ,' q ttt'.4:,~i~W *414~'
si'st :'- *P\ C.4
A 'i ' .'S. 4 ¶.;~~' .,4.
-.- r t'tx L . \ '
J7'" '¶A,.' . 4 tS. t" ' *{~.i

Final Report to*United States Army
Toxic and Hazardous* Materials Agency
August 1988
Bench-Scale Glassification Teston Rocky Mountain Arsenal
* Basin F Material
3 (Task Order Number 8)
il Final Report
II A.A. Balasco N, .Program Manager As-o,.:,: ,.iT--i.i
J:J ...;; :.....".
J.I. Stevens - Task LeaderJ.W. Adams ..........R. Brouns (Battelle Pacific Northwest) . . .
* D.L. Cerundolo . .C.H. Summers ,":"Principal Investigators
Iji| Dist'ibution Unlimited
/t Arthur D. Little, Inc.Contract No. DAAK1 1-85-D-0008Reference 54148USA THAMA Reference AMXTH-TE-CR-88015
o i' ' )" -
U UNCLASSIFIEDSECURITY CLASSIFICATION OF THS PAGE
REPORT DOCUMENTATION PAGEla. REPORT SECURITY CLASSIFICATION lb. RESTRICTIVE MARKINGS
UNCLASSIFIED2a. SECURITY CLASSIFICATION AUTHORITY 3 DISTRIBUTION IAVAILABIUTY OF REPORT
Unlimited2b. DECLASSIFICATION / DOWNGRADING SCHEDULE
4. PERFORMING ORGANIZATION REPORT NUMBER(S) S. MONITORING ORGANIZATION REPORT NUMBER(S)
Reference: 54148 AMXTH-TE-CR-88015
6a. NAME OF PERFORMING ORGANIZATION 6b OFFICE SYMBOL 7a. NAME OF MONITORING ORGANIZATION
Arthur D. Little, Inc. (If applicable) U.S. Army Toxic and Hazardous Materials Agenc
6c. ADDRESS (City, State, and ZIPCode) 7b. ADDRESS (City, State, and ZIP Code)Acorn Park Attn: CETH-TE-DCambridge, Massachusetts 02140-2390 Aberdeen Proving Ground, Maryland 21010-5401
-a. NAME OF FUNDING/SPONSORING 8b. OFFICE SYMBOL 9. PROCUREMENT INSTRUMENT IDENTIFICATION NUMBER
ORGANIZATION U.S. Army Toxic & (If applicable) Contract No. DAAKIl-85-D-0008
Hazardous Materials Agency CETH-TE-D Task Order No. 8Sc. ADDRESS (City, State, and ZIP Code) 10. SOURCE OF FUNDING NUMBERS
Attn: CETH-TE-D PROGRAM PROJECT TASK WORK UNITAberdeen Proving Ground, Maryland 21010-5401 ELEMENT NO. NO. NO. ACCESSION NO.
I 811 TITLE (include Secunrty Classfication)
Bench-Scale Glassification Test on Rocky Mountain Arsenal Basin F Material
12 PERSONAL AUTHOR(S) A.A. Balasco, J.I. Stevens, J.W. Adams, R. Brouns, D.L. Cerundolo and
13a. TYPE OF REPORT 13b. TIME COVERED 14. DATE OF REPORT (Year. Month.Day) S'. PAGE COUNTFinal TROM_12T 31 August 1988 59
16. SUPPLEMENTARY NOTATION
17 COSATI COOTS 18. SUBJECT TERMS (Continue on revere if necessuy and identify by block number)FIELD GROUP SUB-ROUP Rocky Mountain Arsenal 0 Basin F a Classification
Technology Evaluation * Technology Development/Testing
Soil Decontamination e Site Remediation19. ABSTRACT (Continue on reverse if necessary and identify by block number) Increasing public and regulatory atten-
tion focused on the growing problems with hazardous chemical waste disposal has prompted theexamination of radioactive waste treatment methods and their applicability to confine hazard-ous chemical wastes. The joule-heated ceramic-lined melter (JHCM) developed by the PacificNorthwest Laboratory is a good example of radioactive waste treatment technology that hasbegun to show excellent promise in the hazardous chemical waste treatment field. Wastematerials are blended with glass-forming minerals and processed through a high-temperaturefurnace to produce a highly durable glass product that immobilizes any hazardous species.
A bench-scale demonstration of this treatment technique was conducted for Arthur D. Little,Inc., to support their evaluation of innovative technologies for treating hazardous materialsfrom the U.S. Army's Basin F at the Rocky Mountain Arsenal near Denver, Colorado. During aone-day experiment at Battelle, Pacific Northwest Laboratories, more than 50 lbs of Basin Fmaterial were converted to glass in a bench-scale melter.
20. DISTRIBUTION/AVAILABILITY OF ABSTRACT " 21. ABSTRACT SECURITY CLASSIFICATIONMUNCLASSIFIED/fJNLIMITED 0 SAME AS RPT. COTIC USERS I UNCLASSIFIED
22a NAME OF RESPONSIGý.E INDIVIDUAL 22b. TELEPHONE (•ncluae Area Code) 22c. OFFICE SYMBOLCraig W. MacPhee ,(301) 671-20!54 CEIH-T-_
DO FORM 1473, 84 MAR 83 APR edition may be used until exhausted. )ECIURITY CLASSIFICATION OF THIS PAGEAll other editions are obsolete tIlrT A c q TrT n
UNCLASTIIED ISECURITY CLASSIFICATION OF THIS PAGE
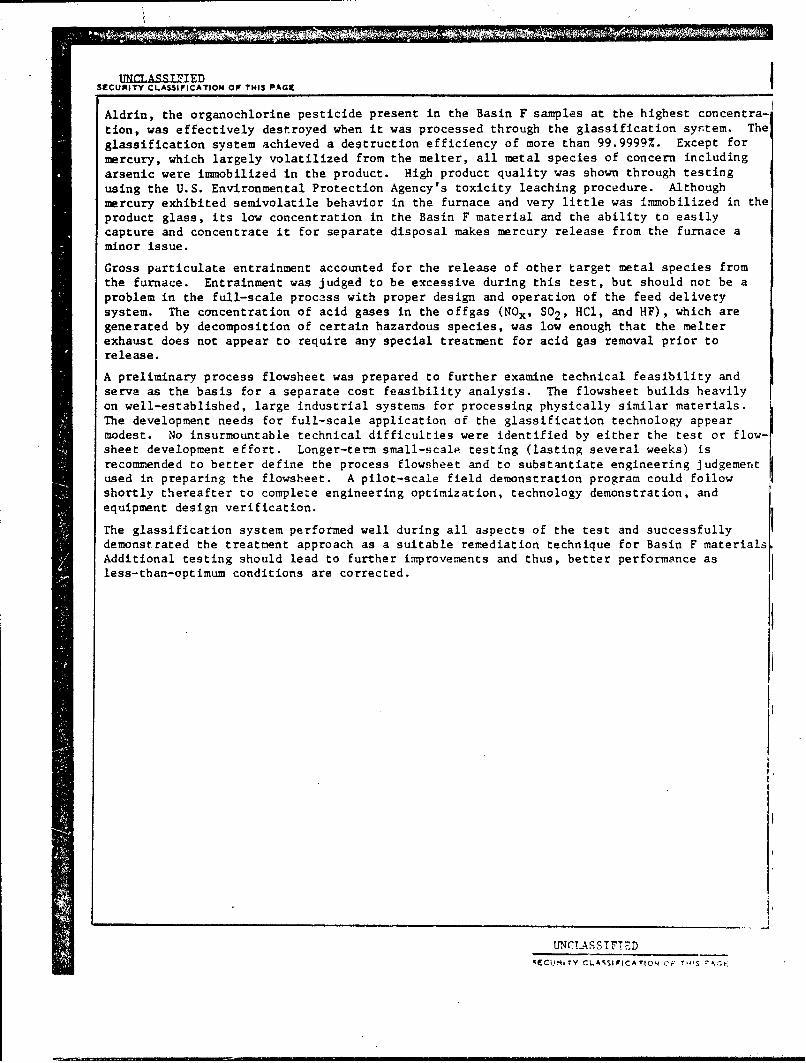
Aldrin, the organochlorine pesticide present in the Basin F samples at the highest concentra-
tion, was effectively destroyed when it was processed through the glassification syntem. The
glassification system achieved a destruction efficiency of more than 99.9999%. Except for
mercury, which largely volatilized from the melter, all metal species of concern including
arsenic were immobilized in the product. High product quality was shown through testing
using the U.S. Environmental Protection Agency's toxicity leaching procedure. Although
mercury exhibited semivolatile behavior in the furnace and very little was immobilized in theproduct glass, its low concentration in the Basin F material and the ability to easily
capture and concentrate it for separate disposal makes mercury release from the furnace a
minor issue.
Gross particulate entrainment accounted for the release of other target metal species fromthe furnace. Entrainment was judged to be excessive during this test, but should not be aproblem in the full-scale process with proper design and operation of the feed delivery
system. The concentration of acid gases in the offgas (NOx, SO 2 , HCl, and HF), which aregenerated by decomposition of certain hazardous species, was low enough that the melterexhaust does not appear to require any special treatment for acid gas removal prior torelease.
A preliminary process flowsheet was prepared to further examine technical feasibility andserve as the basis for a separate cost feasibility analysis. The flowsheet builds heavilyon well-established, large industrial systems for processing physically similar materials.The development needs for full-scale application of the glassification technology appearmodest. No insurmountable technical difficulties were identified by either the test or flow-sheet development effort. Longer-term small-scale testing (lasting several weeks) isrecommended to better define the process flowsheet and to substantiate engineering Judgementused in preparing the flowsheet. A pilot-scale field demonstration program could follow
shortly thereafter to complete engineering optimization, technology demonstration, and
equipment design verification.
The glassification system performed well during all aspects of the test and successfullydemonstrated the treatment approach as a suitable remediation technique for Basin F materials.
Additional testing should lead to further improvements and thus, better performance as
less-than-optimum conditions are corrected.
UNCLASSIFlETOD%ECij-flrY CL.ASSIFICATtOM ,; TWS' -AGE
This report was prepared by Bat telle Pacific NorthwestLaboratories for Arthur D. Little, Inc., in fulfillmentof a requirement for Task Order Number 8 underContract DAAKll-85-D-0008.
P ,

SUMMARY
Increasing public and regulatory attention focused on the growing problems
with hazardous chemical waste disposal has prompted the examination of radio-
active waste treatment methods and their applicability to confine hazardous
chemical wastes. The joule-heated ceramic-lined melter (JHCM) developed by the
Pacific Northwest Laboratory(a) is a good example of radioactive waste treat-
ment technology that has begun to show excellent promise in the hazardous chem-
ical waste treatment field. Waste materials are blended with glass-forming
minerals and processed through a high-temperature furnace to produce a highly
durable glass product that immobilizes any hazardous species.
A bench-scale demonstration of this treatment technique was conducted for
Arthur D. Little, Inc., to support their evaluation of innovative technologies
for treating hazardous materials from the U.S. Army's Basin F at the Rocky
Mountain Arsenal near Denver, Colorado. During a one-day experiment at
Battelie, Pacific Northwest Laboratories, more than 50 lbs of Basin F material
were converted to glass in a bench-scale melter.
Aldrin, the organochlorine pesticide present in the Basin F samples at the
highest concentration, was effectively destroyed when it was processed through
the glassification system. The glassification system achieved a destruction
efficiency of more than 99.9999%. Except for mercury, which largely volatil-
ized from the melter, all metal species of concern including arsenic, were
immobilized in the product. High product quality was shown through testing
using the U.S. Environmental Protection Agency's toxicity leaching procedure.
Although mercury exhibited semivolatile behavior in the furnace and very little
was immobilized in the product glass, its low concentration in the Basin F
material and the ability to easily capture and concentrate it for separate dis-
posal makes mercury release from the furnace a minor issue.
Gross particulate entrainment accounted for the release of other target
metal species from the furnace. Entrainment was judged to be excessive during
(a) Operated for the U.S. Department of Energy by Battelle MemorialInstitute. Battelle, Pacific Northwest Laboratories is a division ofBattelle Memoril Institute.
II this test, but should not be a problem in the full-scale process with proper
design and operation of the feed delivery system. The concentration of acid
gases in the off gas (NOX, SO2, HCl, and HF), which are generated by decomposi-
tion of certain hazardous species, was low enough that the melter exhaust does
not appear to require any speci'l treatment for acid gas removal prior to
release.
A preliminary process flowsheet was prepared to further examine technical
I feasibility and serve as the basis for a separate cost feasibility analysis.
The flowsheet builds heavily on well-established, large industrial systems for
processing physically similar materials. The development needs for full-scale
application uf the glassification technology appear modest. No insurmountable
technical difficulties were identified by either the test or flowsheet develop-
ment effort. Longer-term small-scale testing (lasting several weeks) is recom-
mended to better define the process flowsheet and to substantiate engineering
judgement used in preparing the flowsheet. A pilot-scale field demonstration
program could follow shortly thereafter to complete engineering optimization,
technology demonstration, and equipment design verification.
The glassification system performed well during all aspects of the test
and successfully demonstrated the treatment approach as a suitable remediationtechnique for Basin F materials. Additional testing should lead to further
improvements and thus, better performance as less-than-optimum conditions are
corrected.
IIIII iii
I1 CONTENTS
SSUMMARY .. ... . .. .. . .. . . ... . . .... . .. . . .. . . i
1.0 INTRODUCTION ................................... 1
I 2.0 DESCRIPTION OF TEST FACILITIES .......... .................... 2.1
2.1 PROCESS DESCRITION ............................ ........... 2.1
1 2.2 TEST EQUIPMENT DESCRIPTION .................................... 2.4
3.0 TEST PROGRAM PROCEDURE ........ ..................................... 3.1
3.1 GLASS FORMULATION ........... 3.1
3.2 SOIL PREPARATION ................... ...... 3.2
3.3 EQUIPMENT SHAKEDOWN TESTS ..................................... 3.3
I 3.4 GENERAL TEST OPERATION ........................................ 3.5
3.5 DATA AND SAMPLE COLLECTION ....................... ............. 3.8
3.5.1 Basin F Material ....................................... 3.9
1 3.5.2 Chemical Additives ........... 3.10
3.5.3 Melter Glass ............................. . 3.10
3.5.4 Off-Gas Scrub Solution ................................. 3.10
S3.5.5 Off Gas ........................... o o.. 4... .. .. .. ..... 3.10
3.6 OFF-GAS SAMPLNG METHODOLOGY DETAILS ........................... 3.11
3.6.1 Modified Method 5 Train ................................ 3.11
3.6.2 Nonvolatile and Volatile Metal Sampling Train .......... 3.12
3.6.3 Sampling System Operation .............................. 3.14
3.6.4 Sample Train Precleaning ............................... 3.15
4.0 TEST RESULTS ......................................................... 4.1
4.1 GENERAL SYSTEM PERFORMANCE ..................... ............. 4.1
1 4.2 BASIN F MATERIAL ANALYSIS ............... ....................... 4.3
iv

I4.3 APPARENT DESTRUCTION/IMMOBILIZATION EFFICIENCIES FOR
TARGET CONTAMINANT SPECIES .................................... 4.5
4.4 NONCONDENSABLE GAS ANALYSIS .................................. 4.7
4.5 PRODUCT LEACH TESTING ..... 48....-... 4.8
o 4.6 ACID GAS EVAL!.TION ........... *. ....... **..... ..... ... *....... 4.8
4;7 PARTICULATE LOADIMGS .... .... .................................. 4.9
5.0 DISCUSSION OF RESULTS ........... ................................ *** 5.1
I 6.0 PROCESS FLOWSHEET AND MATERIAL BALANCE DEVELOPMENT ................ 6.1
7.0 RECOMMENDATIONS FOR FUTURE WORK .................................... 7.1IIIIIlIII
II
I,, V I I I I '
FIGURES
2.1 Glass Melting Process for Liquid Waste Treatment ................... 2.3
2.2 ESCM High-Temperature Furnace ................................ 4 .... 2.5
2.3 ESCM Off-Gas Treatment System ...................................... 2.7
2.4 ESCM Feed Delivery System Schedule ................................. 2.10
3.1 Sampling Plan for Glassification Test .............................. 3.9
3.2 Modified Method 5 Sampling Train ................................... 3.13
6.1 Preliminary Process Flowsheet for Glassification ................... 6.3
TABLES
3.1 Element Composition of Background RMA Soil Sample ................ 3.2
3.2 Off-Gas Sampling Equipment .............. ....... 0..... ............. 3.11
4.1 Summary of Sampling Conditions for MM5 and Method IGIA ... 4.2
4.2 Analysis of Basin F Feed Material and Glass Formers ................ 4.4
4.3 Summary of Contaminant Destruction/Immobilization Efficiencies ..... 4.6
4.4 Summary of Continuous Gas Analyzer Data .................... ...... 4.7
4.5 Glass Product TCLP Results ............................ . ........... 4.9
4.6 Summary of Acid Gas Analysis .................. ..................... 4.10
6.1 Material Balance for Glassification, Basis: Tons Per Day ......... 6.2
6.2 Assumed Glass Formulation for Solidifying Basin F Materials ........ 6.5
Vi

1.0 INTRODUCTION
The Process Development Branch oF the U.S. Army Toxic and Haza'uc..' Mate-
rials Agency (USATHAMA) issued Task Order No. 8 entitled "Innovati ; Tecnn'ogy
Development for Rocky Mountain Arsenal Environmental Control/Conc2,c E 'Itua-
tion" to Arthur D. Little, Inc. The objectives of this task orrir are to
review the industrial database of promising hazardous materli.. tre~tm(*.t tech-
nologies for application at Basin F of Rocky Mountain Arsene ýPR.iA); eviluate
the candidate technologies (a maximum of three) through labc-atcry ,
bench-scale testing on RMA Basin F material; and prepare prelinlna-y; -ýocess
designs and cost estimates for the most promising technologies.
An initial survey was completed, the candidate technologies W.ie ranked,
and the selected technologies for testing were identified.(a) Glassification
was one of three promising technologies chosen for further evaluation.
Battelle Pacific Northwest Laboratories (Battelle Northwest) was awarded a sub-
contract to perform a bench-scale feasibility test for this technology.
A quality control and a test plan were developed by Arthur D. Little, Inc.
to control the data collection and sample analyses. Battelle Northwest, with
assistance from Arthur D. Little, Inc., developed the specific test plan forglassification that established test parameters and procedures. During the
test period, Arthur D. Little, Inc. personnel observed operations and assisted
in sample collection.
The online exhaust gas sampling was performed for Battelle Northwest by
NHS, Inc. (a subsidiary of the Hanford Environmental Health Foundation). The
collected samples were analyzed in the Arthur D. Little, Inc. laboratories,
which are certified by USATHAMA for the chemical analyses of concern, and the
results provided to Battelle Northwest for evaluation. Test results are
incorporated in this report along with a aescription of the test conditions and
a discussion of the results.
(a) A final report entitled "Evaluation/Selection of Innovative Technologiesfor Testing with Basin F Material ," and dated February 28, 1987, wasprepared by Arthur D. Little, Inc.
1.1
(S7 73
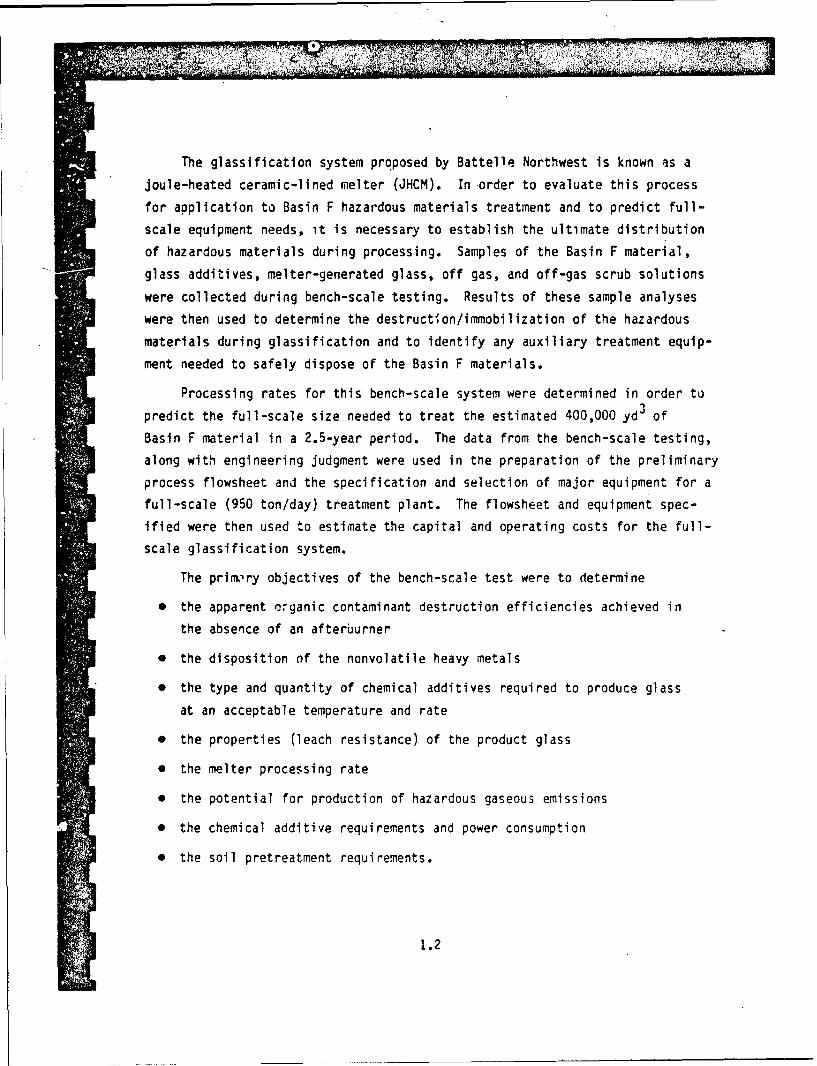
The glassification system proposed by Battelle Northwest is known as a
joule-heated ceramic-lined melter (JHCM). In order to evaluate this process
for application to Basin F hazardous materials treatment and to predict full-
scale equipment needs, it is necessary to establish the ultimate distribution
of hazardous materials during processing. Samples of the Basin F material,
glass additives, melter-generated glass, off gas, and off-gas scrub solutions
were collected during bench-scale testing. Results of these sample analyses
were then used to determine the destructlon/immobilization of the hazardous
materials during glassification and to identify any auxiliary treatment equip-
ment needed to safely dispose of the Basin F materials.
Processing rates for this bench-scale system were determined in order to
predict the full-scale size needed to treat the estimated 400,000 yd 3 of
Basin F material in a 2.5-year period. The data from the bench-scale testing,
along with engineering judgment were used in the preparation of the preliminary
process flowsheet and the specification and selection of major equipment for a
full-scale (950 ton/day) treatment plant. The flowsheet and equipment spec-
ified were then used to estimate the capital and operating costs for the full-
scale glassification system.
The primwry objectives of the bench-scale test were to determine
"" the apparent organic contaminant destruction efficiencies achieved in
the absence of an afterburner
"" the disposition of the nonvolatile heavy metals
"" the type and quantity of chemical additives required to produce glass
at an acceptable temperature and rate
"" the properties (leach resistance) of the product glass
"* the melter processing rate
"" the potential for production of hazardous gaseous emissions
"" the chemical additive requirements and power consumption
"* the soil pretreatment requirements.
1.2

7 7--
2.0 DESCRIPTION OF TEST FACILITIES
The glassification system under study is a JHCM developed by the U.S.
Department of Energy for treating highly radioactive wastes generated during
the reprocessing of spent nuclear fuel. This section describes the JHCM
process and facilities.
2.1 PROCESS DESCRIPTION
The melter operates by passing an alternating electric current between
metallic electroaes separated by a pool of molten glass. At elevated tempera-
tures, glass becomes a good electrical conductor and thus, serves as the resis-
tance heating element for the furnace. The melting furnace is a refractory-
lined chamber that resists corrosion by the glass and serves as an electrical
Isolator to permit joule heating of the glass.
The furnace is typically operated below 1250*C, although higher tempera-
tures are possible with a change in the electrode material. Waste materials to
be processed, either dry solids or liquids, are mixed with the appropriate
glass formers, typically silica, borax, soda ash, and lime (or a preformulated
glass frit). This mixture forms the basic glass structure that allows the
Inorganic waste materials to be dissolved. The mixing of glass formers and
waste can be done either prior to feeding the melter or in the melting cavity
itself.
As depicted in Figure 2.1 for the case where the feed is a slurry, waste
materials are reacted inside the melter by heat from the glass pool. Water is
evaporated and the waste materials are converted to oxides, releasing some gas-
eous species such as C02 , NOx, S02, and HCl. The asi from oxidation of the
waste species is fluxed by the glass formers and is incorporated into the mol-
ten glass pool, which is periodically discharged to waste disposal canisters.
In a full-scale system, the process is typically continuous with evaporation,
decomposition, and fluxing occurring simultaneously in the furnace. The size
of the molten glass pool is adjustable by design of the furnace, but is gener-
ally set to achieve a mean residence time of greater than 1 day. This
2.1

"Off Gas System
FeedNozzle
Steam and Gasesof Decomposition
Dried Crust
Electrode
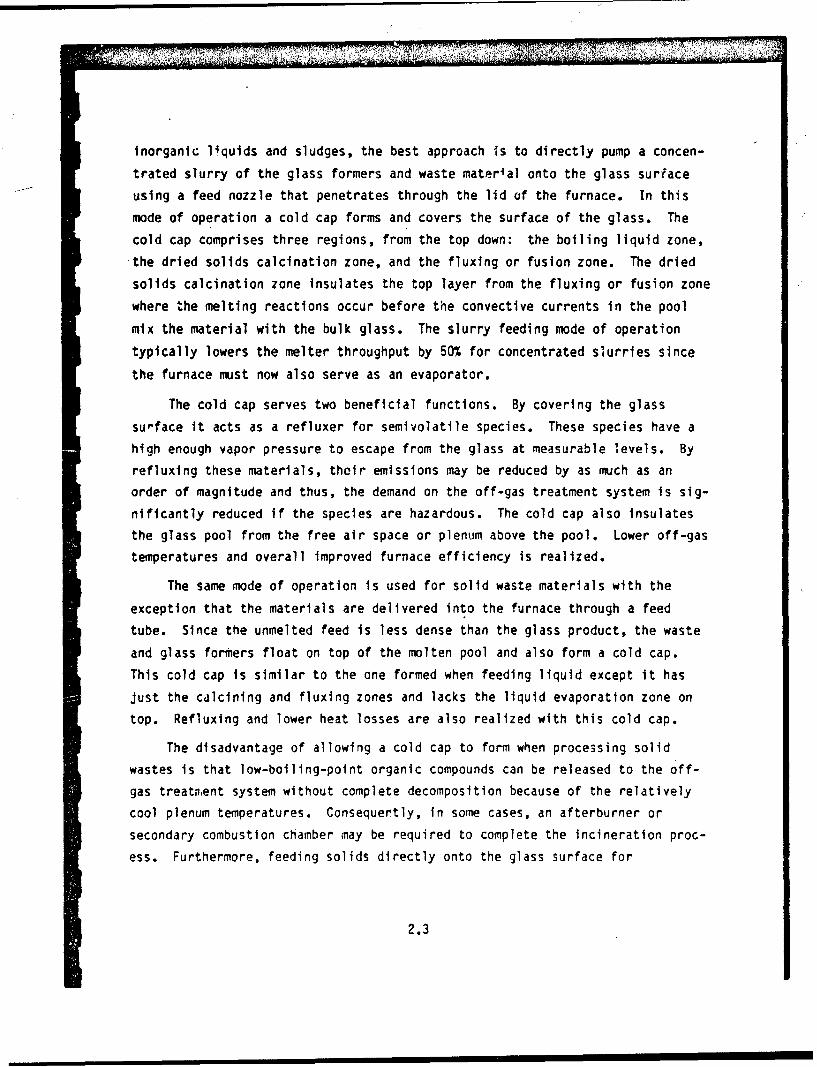
FIGURE 2.1. Glass Melting Process for Liquid Waste Treatment(Source: Battelle Northwest)
adjustment is made so a high quality homogeneous glass is consistently
delivered to the disposal container and feed compositional variations are
dampened out.Several options are available for feeding waste and glass formers to the
furnace, and the option chosen depends upon on the nature of the waste. For
2.2
7 771I- M I
inorganic liquids and sludges, the best approach is to directly pump a concen-
trated slurry of the glass formers and waste material onto the glass surface
using a feed nozzle that penetrates through the lid of the furnace. In this
mode of operation a cold cap forms and covers the surface of the glass. The
cold cap comprises three regions, from the top down: the boiling liquid zone,the dried solids calcination zone, and the fluxing or fusion zone. The dried
solids calcination zone insulates the top layer from the fluxing or fusion zone
where the melting reactions occur before the convective currents in the pool
mix the material with the bulk glass. The slurry feeding mode of operation
typically lowers the melter throughput by 50% for concentrated slurries since
the furnace must now also serve as an evaporator.
The cold cap serves two beneficial functions. By covering the glass
surface it acts as a refluxer for semivolatile species. These species have ahigh enough vapor pressure to escape from the glass at measurable levels. By
refluxing these materials, their emissions may be reduced by as much as an
order of magnitude and thus, the demand on the off-gas treatment system is sig-
nificantly reduced if the species are hazardous. The cold cap also insulates
the glass pool from the free air space or plenum above the pool. Lower off-gas
temperatures and overall improved furnace efficiency is realized.
The same mode of operation is used for solid waste materials with the
exception that the materials are delivered into the furnace through a feed
tube. Since the unmelted feed is less dense than the glass product, the waste
and glass formers float on top of the molten pool and also form a cold cap.This cold cap is similar to the one formed when feeding liquid except it has
just the calcining and fluxing zones and lacks the liquid evaporation zone on
top. Refluxing and lower heat losses are also realized with this cold cap.
The disadvantage of allowing a cold cap to form when processing solid
wastes is that low-boiling-point organic compounds can be released to the off-
gas treatnent system without complete decomposition because of the relatively
cool plenum temperatures. Consequertly, in some cases, an afterburner or
secondary combustion chamber may be required to complete the incineration proc-
ess. Furthermore, feeding solids directly onto the glass surface for
2.3

combustion could tend to increase the entrainment of fine particulates which
must then be collected and possibly recycled by the off-gas treatment system.
An alternative feeding technique, specially developed for waste streams
high in solid combustible materials, uses a feed tube which penetrates the
glass surface end introduces the wastes within the molten glass pool. This
technique allows for better material/glass contact and increased residence time
at high temperatures. As the waste particles rise to the glass surface, they
begin to pyrolyze and release low carbon chain gases that readily burn once
exposed to the plenum air. The molten pool doubles as a first stage off-gas
treatment by helping to capture the dust and ash materials like a wet scrubber.
The vigorous bubbling action in the melt, primarily caused by the feed injection
system, keeps the surface relatively free of a cold cap so plenum temperatures
are high enough for combustion without auxiliary heating. Volatility and heat
losses are also higher with this mode of feeding. Process rates are generally
increased because of the more rapid heat transfer to the incoming waste feed.
The off-gas treatment system is also tailored somewhat to the specific
waste stream. If the waste is a slurry or contains a large amount of moisture,
the first-stage treatment is commonly a wet scrubbing operation to condense the
liquid and capture the bulk of the entrained particulate. The condensing
action of the water vapor in the off-gas stream as it is treated in the
scrubber helps to improve the particulate removal efficiency. If necessary,
the off gases will then be further filtered and treated to remove acid gases
and fumes before release to the atmosphere.
2.2 TEST EQUIPMENT DESCRIPTION
The major purposes of the test program were to demonstrate feasibility and
to collect sufficient data for preparing a preliminary process flowsheet and
cost estimate that would compare glassification and other technology alter-
natives being considered to treat the RMA Basin F material. The small-scale
continuously fed, Joule-heated experimental melter known as the ESCM (Fig-
ure 2.2) was judged to be well suited to treat the RMA Basin F material.
This melter has a nominal glass volume of approximately 8.2 L (0.29 ft 3)
with an exposed glass surface area of 0.054 m2 (0.58 4t 2 ) and a typical
2.4

II
q~ 4,
2.5D

operating glass depth of 15.2 cm (6.0 in.). Energy needed to convert solid
material to glass, as well as to maintain operating temperatures in the melter,
is supplied by alternating current passed between two Inconel 6909 plate elec-
trodes. Glass temperatures are maintained in the range of 11500 to 1250*C by
manually controlling power input to the electrodes. A thermocouple located in
one of the electrodes is used to monitor temperature within this melter. The
electrode temperature typically operates 1000 to 150°C below the glass tempera-
tures in the center of the melting tank so the control point is 10500 to
1100°C. Two factors contribute to the lower electrode temperature: one side
of each electrode is in direct contact with the cooler furnace walls; a large
portion of the electrode extends above the melt level and serves as a coolingfin that radiates heat to the vapor space above the melt. Operating conditions
in the melter are monitored and recorded on continuous strip chart recorders.
The inside of the furnace is lined with a high density refractory brick
composed of chromium and aluminum oxides that resists corrosive attack by themolten glass. Additional layers of insulating refractory materials provide
backup to prevent glass leakage and reduce heat losses. The refractories are
surrounded by a sealed stainless steel shell that controls air inleakage and
allows the melter to be operated under a partial vacuum to collect and control
off gases generated by processing hazardous materials.
The melter is connected to an off-gas treatment system that provides the
source of vacuum and removes hazardous species present in the melter exhaust.
Pressure in the melting cavity is maintained at a partial vacuum of less than-2.5 cm water column (-I in. W.C.) to contain the exhaust gases.
Prior to release to the environment, the off gas is routed through an
ejector-venturi wet scrubber to remove large particulates and condensable
vapors (including soil moisture). The off gas is then passed through a heat
exchanger, a demister pad, a high-efficiency particulate air (HEPA) filter and
an activated carbon filter prior to discharge (see Figure 2.3). The HEPA fil-ter removes submicron particulates and aerosols while the carbon filter
*Trademark of Huntington Alloys Inc., Huntington, West Virginia.
2.6

UU
- - - z
0
c0
CCD6
000
.41J
E' -
-4
1
CL- 0)
LU
u. 0
LL&.
LUU
CL ,
2.7

collects organic vapors. Condensate that builds up in the scrub water recircu-
lation system is drained from the scrubber reservoir for disposal.
The exhaust line from the melter is a 7.6-cm (3-in.) schedule 40 pipe
which is reduced to a 5.1-cm (2-in.) pipe after the gas is quenched through the
ejector-venturi wet scrubber. From the melter exhaust port on the melter lid,
the off-gas line rises vertically for about 56 cm (22 in.) to a tee in the
line. The off-gas line then makes a 90' turn and runs horizontally for 132 cm
(52 in.) to the inlet of the ejector. The off-gas sample probe was positioned
In the center of the vertical section, 20 cm (8 in.) upstream of the tee. The
Pitot tube used for flow measurement was positioned 61 cm (24 in.) downstream
of the tee in the horizontal section of pipe. Positioning of the Pitot tube
on the vertical centerline of the pipe was established before the test to cor-
respond with the point where the velocity matched the measured velocity at the
sample point under the expected flow conditions. This resulted in a position
slightly above the pipe center.
Positioning the sample probe in the vertical section of the pipe allowed
the gas stream to be sampled as close to the pipe entrance as was reasonable to
minimize the loss of particulate through impaction with the pipe wall. The
Pitot tube was positioned further downstream of the line entrance to more
accurately measure flow rates. A thermocouple inserted through the off-gas
line into the gas stream measured the gas temperature near the sample nozzle.
The sample point selected for the continuous monitoring of noncondensable
gas species was located downstream from the wet scrubber and filters. This
location was selected so the gas would he dry and free of contaminants which
might otherwise damage the analyzers. The removal efficiency for NOx' CO, anj
CO2 gases by the water scrubber was judged to be low.
Near the floor of the melting cavity is an opening, through the refractory
wall, which leads to a separate riser and pour trough for draining glass. When
the level of the melter approaches its natural overflow depth of 15 cm (6 in.),
the glass level is lowered a few centimeters by the transfer of the molten
glass through this drain system to steel canisters. Resistance heating ele-
ments located in the vapor space surrounding the trough maintain the glass
2.8

stream above 10000 C to achieve acceptable pouring behavior. A view port on the
front of the melter allows direct access to the pour stream for monitoring the
pour and collecting glass samples.
The feed system for delivering dry waste feed material to the melter is
located on the level above the melter inside a ventilated plastic hood known as
a temporary greenhouse. The greenhouse isolates the hazardous materials from
the main building while they are transferred from their shipping drums to the
sealed feed hopper. The feeder is a belt-driven gravimetric system which
meters material from the hopper to a nominal 5.1-cm (2-in.) diameter pipe feed
tube as shown In Figure 2.4. Solids fall by gravity onto the glass surface
through the feed tube. The feed tube is sealed where it penetrates the lid of
the melter to minimize inleakage and is adjustable in length to permit lowering
it below the melt surface for submerged feeding. The capability exists for air
injection through the feed tube to aid the submerged feeding mode and to
introduce excess comhustion air.
2.9

III
Dust ContainmentSealed Hood (Greenhouse)I Hopper
Sealed Gravimetric
I Vibrator Belt Feeder
Ventilation
II
.• Beaker
ChemicalAdditivesFeeder
Adjustable FeedTube (Nominal 2 in. Pipe)
I-- Joule-Heater Ceramic
Molten Glass Lined Melter
Sample Port
IUMolten Glass Stream Drain
Canister
FIGURE 2.4. ESCM Feed Delivery System Schematic(Source: Battelle Northwest)
2.10
3.0 TEST PROGRAM PROCEDURE
This section discusses the test program procedure, including glass formu-
lation, soil p. eparation, equipment shakedown tests, general test operation,
data and sample collection, and off-gas sampling methodology.
I 3.1 GLASS FORMULATION
Samples of the Basin F contaminated material were provided in 4, partially
m filled 55-gal drums. The drums were labeled: "RMA Basin F Composite 87014
Soil," and were sequentially numbered N5883 #13 through N5886 #16. A small
sample was collected from the surface of Drum #13 and analyzed for inorganic
composition using ion coupled plasma spectroscopy. In addition, soil from an
uncontaminated region adjacent to the Basin F was also obtained and analyzed.
3 Both samples showed similar chemical composition for the major glass-forming
constituents and so, to avoid special handling requirements, the uncontaminated
l .soil was used for all laboratory crucible-scale melting work in order to for-
mulate the product glass.
3 The main objective of this effort was to lower the melting temperature of
the soil so it could be processed efficiently below 1200°C in the bench-scale
3 furnace. Some borax, instead of soda ash alone, was added to lower the glassviscosity and improve its ability to dissolve the refractory waste materials
l without dramatically decreasing the electrical resistance and chemical dur-
ability of the product. Lime could also have been used to improve fluidity and
product durability, however, this was viewed as an optimization step and out-
side the required scope of work. The glass formulation work was intended to bea minor effort at this level of study and so, only a few simple glasses were
I tested.
As shown in Table 3.1, the material contains mostly silica and alumina.
Additional fluxes in the form of soda ash and borax were needed to lower the
melting temperature and generate a suitable glass composition. Several cruci-l ble-scale melts with various combinations of glass-former additives and uncon-
taminated soil were made. A mixture consisting of 65 wt% dry soil, 20 wt%Na2O, and 15 wt% B203 was selected.
I 3.1
I

I
TABLE 3.1. Element Composition of Background RMA Soil Sample (wt%)(Source: Battelle Northwest)
I Element wt%Aluminum 6.60
I Boron 0.06
Barium 0.08
Calcium 0.58
Copper 0.04
Iron 2.76
Potassium 1.9
Magnesium 0.58
I Manganese 0.08
Sodium 1.31
I Silicon 31.4
Tin 0.02
I Titanium 0.30
Zirconium 0.02
Others(a) 54.3
100.03
1 (a) Includes oxygen, organics,nitrates and other traceg elements.
3.2 SOIL PREPARATION
In order to test the handling, blending, and feeding characteristics, a
mixture of 75 wt% local Hanford sand and 25 wt% bentonite clay was prepared to
simulate the Basin F material. Based on a moisture analysis of the soil sample
from one of the drums, 20 wt% water was added to the simulated soil mixture.
I Blending of tmis mixture using a barrel tumbler created a solid mass that stuck
firmly to the walls of the drum. When the sample from Drum #13 (actual Basin F
soil) was also mixed on the barrel tumbler, it behaved similarly.
The simulated Basin F soil was removed from the 55-gal drum and placed on
I plastic sheets to air dry for several days. This material was then tumbled
I 3.2
I

again in the barrel until a free flowing granular material with only a few
small (pea-sized) soil agglomerates was produced. This material was judged to
produce desirable feeding characteristics and so was adopted as the reference
pretreatment procedure.
Following the same procedure, roughly equal parts from each drum of actual
Basin F soil were spread on plastic sheets in a well ventilated room and
allowed to dry for 4 to 5 days. During all handling of the Basin F material,
personnel wore protective clothing and fresh-air breathing apparatus. Material
from Drum #13, which had previously been tumbled and appeared to have the high-
est moisture content, remained in large pieces when removed from the drum. The
large pieces were broken up with a shovel to speed up the drying of material
from Drum #13.
The air dried soil was then placed in a 55-gal drum dlOng with several
large river rocks and tumbled for 5 hours. The rocks were added to help crush
any remaining soil agglomerates. The resulting soil consisted of a fine powder
that was largely homogeneous. A 1-L samole jar was then collected from the top
surface soil and analyzed in the Arthur D. Little, Inc., USATHAMA-certified
laboratory for the target hazardous species. Results of the analysis are pre-
sented later in this report. This drum of pretreated soil served as the feed
material for the bench-scale test.
3.3 EQUIPMENT SHAKEDOWN TESTS
Equipment shakedown tests were performed to establish operating parameters
and the feeding technique for the controlled experiment. These tests were
typically short runs of several hours duration each using the simulated Basin F
material rather than the actual Basin F material to prevent contamination of
the test apparatus until all major equipment and procedure problems were iden-
tified and corrected.
Testing started by feeding simulated Basin F material directly onto the
glass surface with the feed tube exit point positioned about 6 in. above the
melt. During this test the glass former fluxes were mixed directly with thesimulated feed prior to feeding. Waste feeding onto the melt surface resulted
in noticeable entrainment of fine powder type particulate by the off gases.,
3.3

7M7-7j' _V.111 r! 7 T-77
The off-gas wet scrubber solution quickly became clouded with entrained parti-
culates and the presence of heavy dust in the melter plenum space was obvious
I shortly after the feeding operation started.
Feeding was changed to the submerged drop tube technique to reduce the
S dusting problem. With the glass formers and simulated Basin F material mixed
together, the drop tube rapidly plugged. Examination of this plug revealed
I premature partial melting of the mixture and subsequent sticking to the inside
of the feed tube. The batching of glass-former fluxes onto the surface through
U a separate feed tube largely eliminated the plugging problem but again resulted
in glass former entrainment. Without the glass formers, feed rates up to about
1.5 kg/h (3.3 lb/h) of simulated Basin F material could be maintained withoutplugging.
* With a full-scale feed system and subsequently larger diameter feed tube
the noted plugging is not expected to be a problem. Material that sticks to
the walls of the feed tube should drop off before it reaches a significant
thickness. In this small-scale demonstration however, it became necessary to
feed the glass formers as a separate stream outside the soil feed tube.
I The exit point of the special glass former feed tube was nearly 61 cm
(2 ft) above the melt surface on the inside of the lid. The lower temperature
3 in this region along with the change to batch feeding helped to eliminate
plugging of this feed tube. Plugging was only experienced when the fluxes were
metered at a slow rate into the melter. Batch feeding every 15 min was done by
quickly opening the feed hopper valve to avoid plugging problems. The entrain-
ment of the glass former fluxes appeared to be acceptable when operated in this
batch mode even though they were released relatively high above the surface.
To further reduce the dusting, a small amount of water was added to the glass
formers. This procedure involved spreading the dry materials on a plastic tarp
and using a fine water spray gun to dampen the surface. When the surface
dried, the glass formers were stirred and the procedure was repeated a few
times.
imsFor the greatest residence time and thus, best organic destruction and
removal, th3 feed tube should be submerged as far as possible below the glass
surface. In the ESCM this is equivalent to about 12.7 cm (5 in.) below the
* i 3.4
I
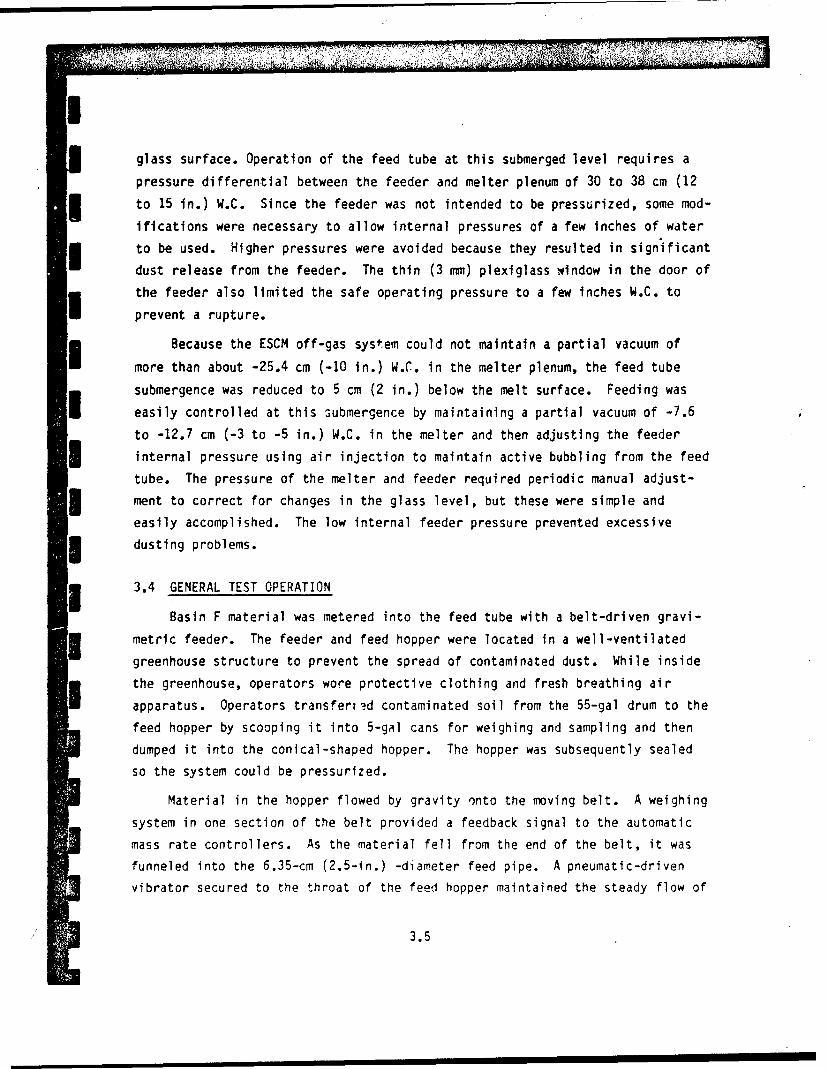
glass surface. Operation of the feed tube at this submerged level requires a
pressure differential between the feeder and melter plenum of 30 to 38 cm (12
to 15 in.) W.C. Since the feeder was not intended to be pressurized, some mod-
ifications were necessary to allow internal pressures of a few inches of water
to be used. Higher pressures were avoided because they resulted in significant
dust release from the feeder. The thin (3 mm) plexiglass window in the door of
the feeder also limited the safe operating pressure to a few inches W.C. to
prevent a rupture.
Because the ESCM off-gas system could not maintain a partial vacuum of
more than about -25.4 cm (-10 in.) W.C. in the melter plenum, the feed tube
submergence was reduced to 5 cm (2 in.) below the melt surface. Feeding was
easily controlled at this submergence by maintaining a partial vacuum of -7.6
to -12.7 cm (-3 to -5 in.) W.C. in the melter and then adjusting the feeder
3 internal pressure using air injection to maintain active bubbling from the feed
tube. The pressure of the melter and feeder required periodic manual adjust-
3 ment to correct for changes in the glass level, but these were simple and
easily accomplished. The low internal feeder pressure prevented excessive
U dusting problems.
I 3.4 GENERAL TEST OPERATION
Basin F material was metered into the feed tube with a belt-driven gravi-
3 metric feeder. The feeder and feed hopper were located In a well-ventilated
greenhouse structure to prevent the spread of contaminated dust. While inside
the greenhouse, operators wore protective clothing and fresh breathing air
apparatus. Operators transferred contaminated soil from the 55-gal drum to the
feed hopper by scooping it into 5-gAl cans for weighing and sampling and then
dumped it into the conical-shaped hopper. The hopper was subsequently sealed
so the system could be pressurized.
Material in the hopper flowed by gravity onto the moving belt. A weighing
system in one section of the belt provided a feedback signal to the automatic
mass rate controllers. As the material fell from the end of the belt, it was
funneled into the 6.35-cm (2.5-in.) -diameter feed pipe. A pneumatic-driven
vibrator secured to the throat of the feed hopper maintained the steady flow of
3.5

material onto the moving belt. Without the vibrator, soil occasionally stuck
in the throat and left gaps on the belt. Prior tothe test, the automatic feed
rate control was verified by metering material into a bucket. At the end of
the test all remaining material was removed from the feeder and reweighed to
determine the total mass of material processed and to recalibrate the feed con-
trol set point.
The separate glass former flux feeder system consisted of a double valve
air lock assembly on the lid of the melter. During operation, the glass
formers were added manually every 15 min.
Technical grade chemicals were used to supply the necessary glass former
fluxes. The soda ash and borax were added in the correct proportions to a
steel drum and blended with the drum tumbler. A sample of this mix was col-
lected with a scoop from the surface after blending.
During Basin F material processing through the melter, the required quan-
tity of glass formers was weighed and added to the feed chamber with the top
valve open and the lower one closed. After closing the top valve, the lower
one was quickly opened to dump the batch into the melter plenum where it fell
to the melt surface. When the valve was opened slowly, the fluxes tended to
stick and plug on the wall of the short pipe section leading through the melter
lid. A momentary loss of negative pressure in the melter was experienced dur-
ing this operation as residual air in the feeding chamber was evacuated to the
melter, and the glass formers rapidly decomposed in the melter, which released
some CO2 and water vapor.
This technique of feeding glass formers and Basin F feed material to the
melter separately was imprecise and produced larger variations in the glass
product composition than would normally occur in a glassification process.
Since close control of the product glass composition was not considered neces-
sary for this application, the simplest, most direct approach was adopted.
Adequate product quality control was judged to be possible through a sim-
ple visual assessment of the glass pouring behavior during canister filling and
3.6

product sampling. When the operator observed the glass becoming obviously more
or less viscous, the glass former additions were appropriately adjusted until
the problem was corrected.
The glass pouring operation was controlled by injecting air in the over-
flow riser section of the melter. This technique of glass transfer is known as
airlifting. Approximately every 2 hours during normal operation, the airlift
m3 was turned on to a set value and allowed to run for about 15 min. The basis
for selecting this pouring frequency was to empty between 1.3 to 2.5 cm (0.5 to
1 in.) of glass in the melter in order to minimize system perturbations. A
2.5 cm (1-in.) level change is equivalent to about 3.5 kg (7.7 lb) of glass.
mm Because the glass pumping rate is strongly affected by the submergence of
the air injection point and the air rate, this method of operation tends to
self-regulate. If the glass level was low from the previous pouring or from
not processing feed, the pour rate would automatically be reduced, and conse-
quently, not as much glass would be transferred during the 15-min pouring
period. The reverse was true in the case of a high glass level and so, thelevel variations were dampened out. As a backup, the operators would visually
monitor for the initiation of glass pouring by gravity overflow. This condi-
tion would Indicate glass had reached the high control point and airlift opera-
tion should be started. The bubbling behavior of the feed tube when it was
operated in the submerged mode was a secondary glass level indicator.
The melter pressure was controlled by a valve downstream of the off-gas
treatment equipment. A differential pressure gauge connected across the melter
plenum space and the atmosphere served as the control point for manually
adjusting the valve as required. Three sources of air contributed to the mel-
3i ter off-gas volume in addition to the gases generated by the decomposition and
drying of the Basin F feed. Air from inleakage around the various melter
flanges and the injection air used to operate the submerged feed tube accounted
for part of the off gas. The major air source was however, a constant
10-standard cubic feet per minute (scfm) source injected at the entrance to
the off-gas pipe. This air was added to stabilize flow fluctuations, simplify
the vacuum control, and increase velocity in the off-gas pipe so it could moreaccurately be measured for material balance purposes. Although this had the
3.7
Iresult of reducing the concentrations of species in the off gas, sufficiently
long sampling periods were used to collect an adequate sample. The dilution
I air also provided added assurance that flammability limits for combustible
gases were not reached in the off-gas piping if incomplete combustion occurred.
3 The test was started using the submerged tube feeding technique. In less
than 1 hour of operation the stack gas sampling filter was loaded with particu-
Elate and had to be replaced. The lack of a cold cap with this mode of opera-
tion and the vigorous bubbling action of the submerged feed tube presumably
combined to strip large quantities of semivolatile salt compounds from the
melt. These salts condensed in the off-gas steam to form small particulates
that easily passed through the gas sampling system cyclone. Removal and
recycle of these materials from the melter exhaust should be easily accomp-
lished with conventional filtration or wet scrubbing techniques; however, forI the purpose of this feasibility test, the particulate level was judged to be
unacceptably high and prevented reasonable off-gas sampling. Feeding was con-
I sequently changed to the surface feeding technique and a thin cold cap of
unmelted Basin F material was allowed to form on the melt surface. The pres-sure in the melter was reduced to about 2.5 cm (1 in.) W.C. so that inleakage
and thus, feed entrainment, would be minimized. Melter power was controlled tol maintain an electrode temperature above 1050°C and below 1100°C and subse-
quently a glass temperature between 11500 and 1250*C.
I 3.5 DATA AND SAMPLE COLLECTION
Operational parameters that describe the experimental conditions, such
as feed rate and electrode power, and are used to control the process were
recorded by continuous strip chart recorders or on data sheets. Hazardous3 materials present in the melter exhaust gas were sampled by a combination of
two standard U.S. Environmental Protection Agency (EPA) sampling trains, Mod-
I ified Method 5 (MM5) and Method 101A, and a series of continuous gas analyzers
[CO, C02 , 02, SO2 , and NOx compounds (nitric oxide and nitrogen dioxide)].
3 The process streams identified in Figure 3.1 were sampled and the total
quantities processed or produced were determined for overall material balance
purposes. With the exception of glass product samples and sample train
I 3.8
I

IWet
Scrubber Off-Gas,I__Uquor
Material lsifcto
I ,
3~ indicates stream wassampled and analyzed
FIGURE 3.1. Sampling Plan for Glassification Test(Source: Arthur D. Little, Inc.)
I filters, all solid and liquid samples were placed in glass bottles with
Teflon*-lined lids. Each sample container was precleaned, using a soap-
I and-water wash, a distilled-water rinse, and an organic-solvent wash. The gas
sampling train filters were placed in glass petri dishes and the glass product
I grab samples were placed in paper envelopes. The MM5 organic sorbent resin
remained in the sorbent module for shipment to Arthur D. Little, Inc. analyt-
ical laboratories.
3.5.1 Basin F Material
j Material received from Basin F was blended as previously described. Fol-
lowing blending, a O.5-L sample was collected in a 1-L jar by simply scooping
I
3 • Trademark of E. I. duPont de Nemours and Company, Wilmington, Delaware.
3.9
I

3I the surface. A second sample was collected when Basin F material was trans-
ferred to the feed hopper. Multiple samples were collected and combined to
make up a composite sample.
3.5.2 Chemical Additives
A single batch of glass formers was blended with the drum tumbler and then
sampled using the same method as described for the Basin F material sample.
3.5.3 Melter Glass
Glass removed from the melter using a batch pour method was sampled with a
graphite sampling boat inserted directly in the pour stream. The sample, in
the form of an ingot (approximately 20 g), was allowed to cool and removed from
the boat. Three samples were collected during each of the seven pouring
periods for the test.
3.5.4 Off-Gas Scrub Solution
A sample of the off-gas wet scrubber solution was obtained using a tap on
the pipe that recycled the collection reservoir solution to the scrubber. This
process stream was sampled for general comparison purposes and to obtain anapproximate estimate of the wet scrubber effectiveness in removing hazardous
species from the melter exhaust. The scrubber and collection reservoir were
drained before starting the test, and fresh water was added. After circulating
the solution for more than 5 min, a sample was collected and the quantity of
solution in the reservoir was recorded. At the end of the test, a sample was
again taken and the solution quantity was determined.
3.5.5 Off Gas
Sampling of the off gases generated during the processing of the Basin F
material were accomplished using the equipment and methods outlined in
Table 3.2.
The MM5 sampling train was used to collect semivolatile organics, nonvola-
tile organics (constituents with boiling points >100 0C), and acid gases (hydro-
chloric, hydrofluoric, and phosphoric) for subsequent analysis. Particulate
3.10

TABLE 3.2. Off-Gas Sampling Equipment
Off-Gas Component Equipment/MethodParticulate, Semivolatile and EPA MM5 sampling trainNonvolatile Organics, Acid Gases
Semivolatile, and Nonvolatile EPA Reference Method 101AMetals
CO On-line analyzer, Infrared IndustriesModel IR-703-D-445
ft CO2 On-line analyzer, Infrared IndustriesModel IR-703-D-355
02 On-line analyzer, Infrared Industries
Model IR-2100
NO/NOX On-line analyzer, Beckman Model 953
SO2 On-line analyzer, Beckman Model 951A
emission rates were also determined using this method. The EPA reference
Method 101A system was used to collect both nonvolatile and semivolatile (e.g.,
mercury) metals.
RN 3.6 OFF-GAS SAMPLING METHODOLOGY DETAILS
A description of the equipment and procedures used in association with
these sampling trains is presented in this section.
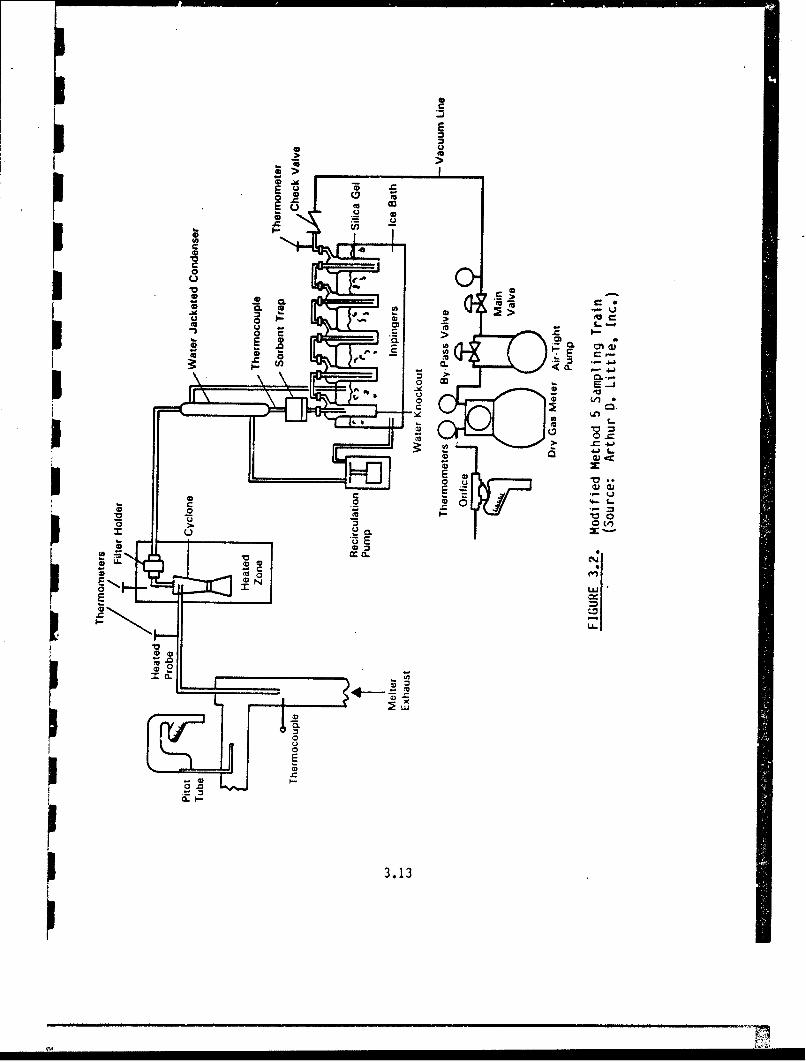
3.6.1 Modified Method 5 Train
The M45 sampling train was the primary extractive and concentrating sam-pling system used for sampling of the glass melter off gas. This system isbased upon the design of units that normally are employed for EPA referenceMethod 5 sampling. The modified system includes a sorbent module filled with a
porous polymeric resin XAD-20, which permits trapping of semivolatile organic
vapors.
* Trademark of Rohm and Haas Co., Philadelphia, Pennsylvania.
3.11
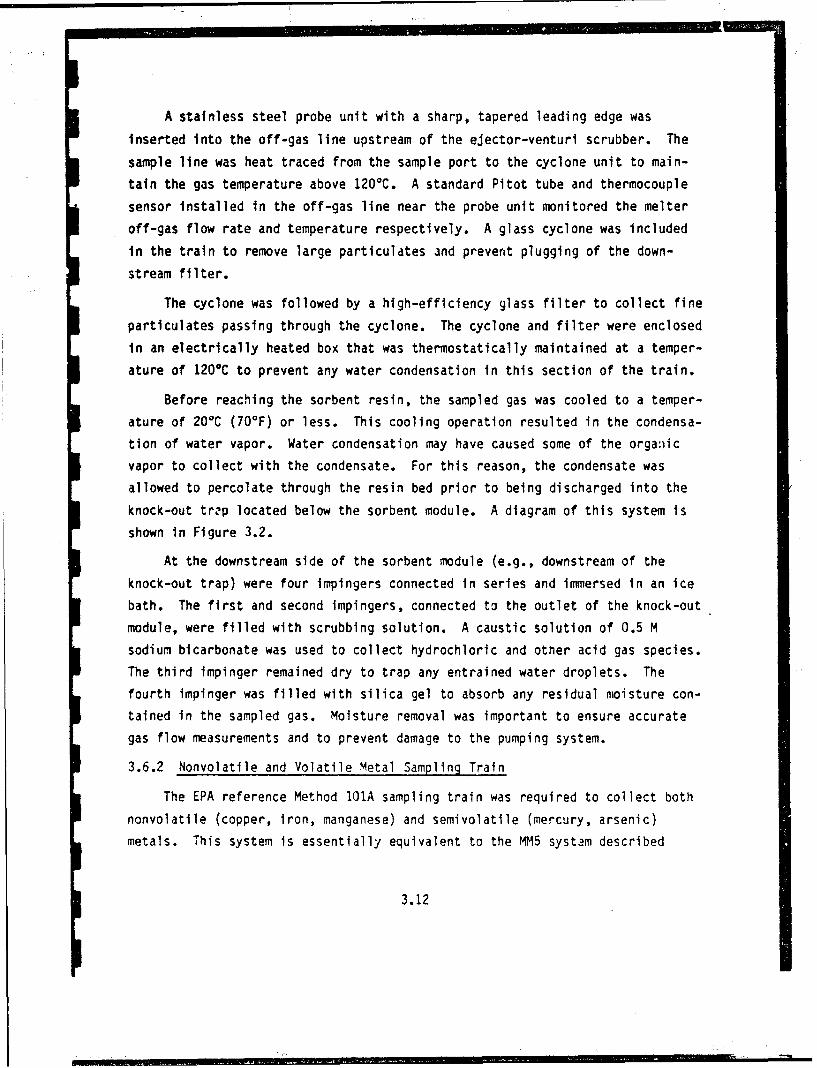
A stainless steel probe unit with a sharp, tapered leading edge was
inserted into the off-gas line upstream of the ejector-venturi scrubber. The
sample line was heat traced from the sample port to the cyclone unit to main-
tain the gas temperature above 120*C. A standard Pitot tube and thermocouple
sensor installed in the off-gas line near the probe unit monitored the melter
off-gas flow rate and temperature respectively. A glass cyclone was included
in the train to remove large particulates and prevent plugging of the down-
stream filter.
The cyclone was followed by a high-efficiency glass filter to collect fine
particulates passing through the cyclone. The cyclone and filter were enclosed
in an electrically heated box that was thermostatically maintained at a temper-
ature of 120*C to prevent any water condensation in this section of the train.
Before reaching the sorbent resin, the sampled gas was cooled to a temper-
ature of 20%C (70°F) or less. This cooling operation resulted in the condensa-
tion of water vapor. Water condensation may have caused some of the orga:iic
vapor to collect with the condensate. For this reason, the condensate was
allowed to percolate through the resin bed prior to being discharged into the
knock-out trzp located below the sorbent module. A diagram of this system is
shown in Figure 3.2.
At the downstream side of the sorbent module (e.g., downstream of the
knock-out trap) were four impingers connected in series and immersed in an ice
bath. The first and second impingers, connected to the outlet of the knock-out
module, were filled with scrubbing solution. A caustic solution of 0.5 M
sodium bicarbonate was used to collect hydrochloric and other acid gas species.
The third impinger remained dry to trap any entrained water droplets. The
fourth impinger was filled with silica gel to absorb any residual moisture con-
tained in the sampled gas. Moisture removal was important to ensure accurate
gas flow measurements and to prevent damage to the pumping system.
3.6.2 Nonvolatile and Volatile Metal Sampling Train
The EPA reference Method 101A sampling train was required to collect both
nonvolatile (copper, iron, manganese) and semivolatile (mercury, arsenic)
metals. This system is essentially equivalent to the MM5 system described
3.12
• ,.•,•, • ~ ~ ~ ~ ~ ~ ~ ~ ~ ~ ~ _01 MIw a''"JL•• " r • ,-•r-. • . . .
0
3*I
EE
0>
CL aC,
000 c
CD
C -
0 3.13

II above, with the principal difference being that the sorbent module (e.g., con-
denser, sorbent trap, and knock-out trap) was eliminated. Once the sampled gas
I passed through the heated high-efficiency fiber filter, where the nonvolatile
metals were removed, it passed directly into the impinger that was charged with
a 4% potassium permanganate in sulfuric acid solution. The second impinger was
also charged with the 4% potassium permanganate solution. The third impinger
was left empty again, while the fourth impinger was charged with silica gel.
3.6.3 Sampling System Operation
Normally, samples obtained using either the MM5 or Method 101A systems
would be obtained in a 12-in.-diameter or larger exhaust duct by compositing
sample aliquots from a number of traverse points. Each aliquot removed is
obtained at a rate that is identical (within a ±10% tolerance) to the locally
I prevailing gas velocity, and is measured by a Pitot tube firmly affixed to the
sampling probe.
As this program was undertaken to develop data that broadly assess the
capabilities and efficiencies of the candidate treatment technology, rather
than compliance testing, and involved bench-scale equipment with a 3-in.
exhaust line, minor sampling liberties were considered acceptable during the
performance of the work. The foremost of these liberties was that the sampling
system was not conducted utilizing full discharge duct traverses. Instead,
samples were obtained from a single point. This point was located at a posi-I tion typical of the average velocity measured during preliminary velocity
traverses.
The samples were obtained following procedures developed to collect a sam-
ple isokinetically. The linear velocity present at the selected sampling point
was determined and periodically monitored, and the sampling system was operated
to assure that the sampled gas entered the collection train at a rate that was
close to isokinetic conditions. The sample system was actually operated at 75%
of isokinetic conditions because of an initial error in calculating the off-gas
I flow rate from the Pitot tube data. This condition led to a higher proportion
of large particulate entering the sample nozzle and so the particulate mass
loadings were conservatively high.
1 3 .14
I

II 3.6.4 Sample Train Precleaning
Prior to the use of either comprehensive sampling system, all sample gas
wetted components were cleaned. The sample cleaning procedure required for all
components of the MM5 sampling system was specially designed to reduce likely
organic contaminants. The cleaning procedure for use with the Method 101A sys-
tem was designed to reduce metallic species contamination. For the MM5
precleaning system all surfaces were
0 washed with soap and warm water
* rinsed with tap water
* rinsed 3 times with Type I deionized, distilled reagent-grade water
* rinsed with methanol
rinsed with methylene chloride.
For the Method 101A System all surfaces were
I * rinsed with 50% HNO 3
* rinsed with tap water
j * rinsed with 8M HCl
* rinsed with tap water
j e rinsed 3 times with Type I deionized, distilled reagent-grade water.
I
3.15
4.0 TEST RESULTS
This section discusses results for the general system performance, contam-
inant destruction/immobilization efficiencies for target species, noncondens-
able gas analysis, product leach testing, acid gas evaluation, and particulate
loadings.
4.1 GENERAL SYSTEM PERFORMANCE
Immediately prior to starting the test, the off-gas sampling train was
connected to the melter exhaust and Basin F material was fed to determine mois-
ture content of the off gas for use in establishing isokinetic sampling condi-
tions. The sample train was then disassembled and cleaned. Residual material
in the feed hopper was removed and a preweighed quantity was added. Feeding
was restarted, and after approximately 1 hour when the sampling system leak
checks were complete and melting conditions were stabilized, the sample probewas installed in the off-gas line and the MM5 train started. The MM5 train was
run for a total of 377 min during which time 13.6 kg (30 lb) of air driedBasin F material was processed. Each kilogram of Basin F material resulted in
about 1.5 kg of glass product being formed. The average glass production rate
during this portion of the test was therefore, 3.2 kg/h (7.0 lb/h).
The MM5 sample train fiter required replacement twice because of exces-
sive pressure drop :onditions. Table 4.1 summarizes the sampling conditions
for each of three periods. Period*i lasted only 25 min as a high loading of
fine, light yellow particulate occurred in the melter off gas. As previously
discussed, the feeding technique was changed from the submerged drop tube
method to directly feeding on the melt surface for the remainder of the test.
Stack gas velocities were reduced after the first period because of the
decrease in melter vacuum and the lowering of off-gas temperatures with the
formation of a small cold cap. The vacuum was reduced to lower the dustingproblems. With the change in feeding technique, filter life was extended to
237 min for the second period. The third filter period was terminated when the
total sample volume exceeded the target level of 3 dry standard cubic meters
(dscm).
4.1
•~

TABLE 4.1. Summary of Sampling Conditions for MM5 and Method 101A(Source: Arthur D. Little, Inc.)
MM5
Filter 1 Filter 2 Filter 3 101ANozzle Diameter (in.) 0.4976 0.4976
Barometric Pressure (in. Hg) 29.42Net Sampling Time (min) 25 237 115 133
Sample Volume (ft 3 ) 10.62 71.968 31.939 34.306
Average Dry Gas Meter Temperature (°F) 80 81.3 83.9 90.4
Average Pressure Drip at Orfice (in W.C.) 0.616 0.309 0.255 0.215
Dry Gas Meter Accuracy 1.037 1.027
Volume of Water Collected (mL) 60.2 22.8
Volume of Water Vapor at STP (ft 3 at 2.838 1.07568*F, 29.92 in. Hg)
Volume of Dry Gas at STP (ft 3) 10.561 71.094 31.463 33.251
Moisture (%) 2.45 3.13
Dry Molecular Weight of Stack Gas(a) 29.252 29.252(lb/lb-mole)
Wet Molecular Weight of Stack Gas 28.976 28.900(lb/lb-mole)
Pressure of Stack Gas (in. Hg) 29.306 29.301 29.266 29.141
Average Stack Temperature (*F) 306 205 194 178
Average Stack Gas Velocity (ft/min) 629 389 357 319.7
Isokinetic (%) 75.5 75.2 73.7 74.2
(a) Assuming 19.5% 02, 1.2% C02, 0.2% CO, 80.1% N2.
At the completion of the MM5 sampling period, the gas sampling system was
removed and cleaned to recover any material coating the inside of the lines.
This same system was then reinstalled without the organic sorbent trap and used
for the Method 101A sampling period. Table 4.1 summarizes the test conditions
during this period. Only one filter was required since the total sample timewas only about one third as long (133 min). Based on the concentration of
metal species in the feed stream and their expected volatility, a sample volume
of about 1 dscm was considered adequate.
4.2
• • Jl ! lI4l'

Glass production rates were slightly lower, at approximately 2.5 kg/h
(5.5 lb/h), during this sample period. Feed rates were intentionally lowered
to prevent the cold cap from becoming too large. During both sampling phases
of the test (MM5 and Method 101A) the feed rate was adjusted by observation of
the unmelted feed pile (cold cap) conditions in the melter. Operators
attempted to maintain a condition where the cold cap remained with an orange
glow for about 2 to 3 cm around the perimeter. Since the melting cavity is
rectangular, with dimensions of 36 cm long from the face of each electrode by
15 cm wide, the orange glow tended to be wider near the electrodes. This con-
trol condition was selected to maintain high enough vapor space temperatures
for combustion of organic vapors. Under this condition flames on and just
above the cold cap surface were routinely observed.
Heat stored in the plenum refractories may have helped to maintain higher
processing rates initially, but as the test proceeded and the refractories
cooled, the cold cap slowly increased so the feed rate had to be reduced. The
gradual decrease in stack gas temperatures during the test are indicative of
this condition. Processing conditions appeared to stabilize after the feed
rate was reduced for the 101A sampling period.
4.2 BASIN F MATERIAL ANALYSIS
Analytical results for the two Basin F material samples collected after
the material was air dried and blended with roughly equal parts from each of
the four drums is presented in Table 4.2. Included for comparison are the
results from two other samples (Ogden and MTARRI), that represent material col-
lected from roughly the same area of Basin F. These samples were sent by
Arthur D. Little, Inc. to other companies for use in tests with two other
treatment technologies under consideration. The sample RMA 1019 more
accurately describes the Basin F material used during the test since it is the
composite sample collected when the material was added to the feed hopper. By
comparison, the Basin F material used for the glassification tests at Battelle
3 is significantly nigher in most hazardous constituents. The higher concentra-
tions, including the higher chloride content, which was nearly an order ofJ magnitude higher, might suggest that more free standing liquid from Basin F was
4.3
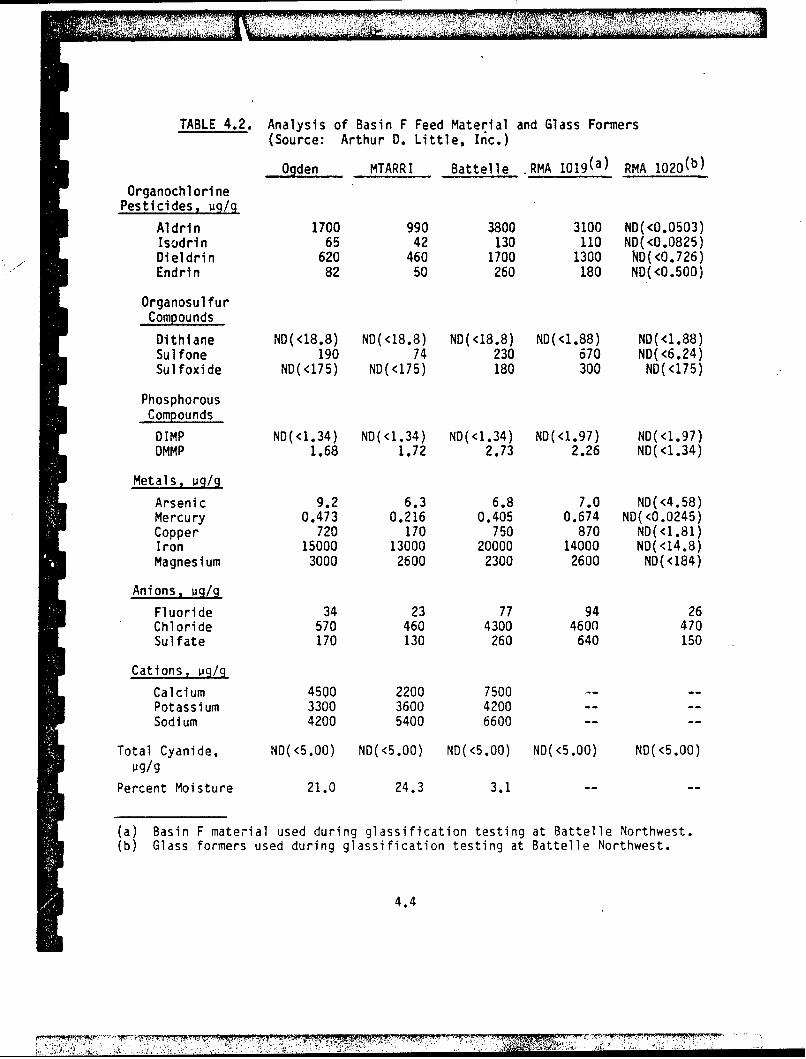
TABLE 4.2. Analysis of Basin F Feed Material and Glass Formers(Source: Arthur 0. Little, Inc.)
Ogden MTARRI Battelle -RMA 1019(a) RMA 1020(b)
Organochl on nePesticides. ijzg/g
Aldrin 1700 990 3800 3100 ND(<O.0503)Iscidrin 65 42 130 110 ND(<0.0825)Dieldrin 620 460 1700 1300 ND(<O.726)Endrin 82 50 260 180 ND(<0.500')
Organosul furCompounds
Dithiane ND(<18.8) ND(<18.8) ND(<18.8) ND(<1.88) ND(<1.88)Sulfone 190 74 230 670 ND(<6.24)Sulfoxide ND(<175) ND(<175) 180 300 ND(<175)
PhosphorousCompounds
DIMP ND(<1.34) ND(<1.34) ND(<1.34) ND(<1.97) ND(<1.97)DMMP 1.68 1.72 2.73 2.26 ND(<1.34)
Metals, pig/g
Arsenic 9.2 6.3 6.8 7.0 ND(<4.58)Mercury 0.473 0.216 0.405 0.674 ND(<0.0245)Copper 720 170 750 870 ND(<c1.81)Iron 15000 13000 20000 14000 ND( <14.8)Magnesium 3000 2600 2300 2600 ND(<184)
Anions, mg/g
Fluoride 34 23 77 94 26Chloride 570 460 4300 4600 470Sulfate 170 130 260 640 150
Cations, iig/g
Calcium 4500 2200 7500 -- --
Potassium 3300 3600 4200 --
Sodium 4200 5400 6600 --
Total Cyanide, ND(<5.00) ND(<5.00) ND(<5.00) ND(<5.00) ND(<5.00)1jg/g
Percent Moisture 21.0 24.3 3.1- -
(a) Basin F material used during glassification testing at Battelle Northwest.(b) Glass formers used during glassification testing at Battelle Northwest.
4.4

added to one or more of the drums sent to Battelle Northwest. The low moisture
content of the Battelle Northwest sample resulted from the air drying process
that was carried out to simplify solids handling operation.
Also included in Table 4.2 is the target chemicals analysis of the glass
forming additives (sample RMA 1020) composed of soda ash and borax. The only
detectable impurities of interest were fluoride, chloride, and sulfate.
4.3 APPARENT DESTRUCTION/IMMOBILIZATION EFFICIENCIES FOR TARGET CONTAMINANT
SPECIES
The off-gas sampling system collected about 1 part in 50 of the total mel-
ter exhaust. Target species in the sampled melter exhaust were removed by the
sample system and analyzed. Table 4.3 summarizes the sampling results and pro-
vides the calculated destruction/immobilization efficiency values realized dur-
ing the test for each of the major species of concern.
Most of the organic species were below analytic detection limits in the
sample system so a conservative estimate using the detection limit as the
assumed concentration was made. The reported destruction of these species are
therefore, worst case and presumed to be much lower than the actuals in some
cases,
The negative immobilization values reported for chloride, sulfate, and
mercury result from more material being detected in the exhaust than was actu-
ally fed to the melter. The only plausible explanations for this are:1) analysis error in either the feed or exhaust samples; 2) a concentration of
these species in the melter glass, plenum space or off-gas line from priorprocessing (e.g., shakedown testing) followed by release during the sample
period because of changes in the operating conditions; or 3) errors in measur-
ing the sampled and total exhaust flow of the system. Other explanations, for
example, errors from nonisokinetic sampling, were not considered plausible in
explaining the magnitude of these discrepancies.
Mercury is known to readily form volatile compounds at these melting teln-
peratures and past work at Battelle Northwest with simulated radioactive wastes
shows essentiilly all the mercury evolved during melting. Analysis of the
4.5

tq ~ ~ ~ ~ 4 C.I 0 4 4
SAW
v 0 -~- 40 4~N O~ () ,M 0 ,' MMI If t0C; = 0 Is ý,ag-iAMMA
0% A A
4- 0%0 v VOV 00-- - -;VVVv '0 (r. -' -U . n .4 Cdcý 0 17
0A LA
0j co 4- 1 1a in" . I- I 0 .
4 V 10 % 0 NQ %r
10 if 0',. -
0. -- -0 'g-N*j .aWa0 v v 4 4
C',2 000 0
Un 40 0OO OO ON 000 co 8 0N C 4-
9- 100" *010 000 0 %o 0aC f coo um o r ,08
0. LC X 4- up .4 - ~
4- IM o

product glass from this test shows only a very small amount of mercury, in the
parts per billion range, which represents over 90% volatilization from the
melt. If we assume an error in measuring the total melter exhaust flow was
made and that 100% of the meri;ury was actually lost, a new total exhaust volume
can be derived and used to adjust the immobilization values reported for the
other metals. Likewise sulfate, which has a relatively low solubility in the
glass product and would be evolved as S02 gas under reducing conditions, could
be assumed to have a 100% loss from the melter and back calculated to adjust
the organic and halide species. The adjusted destruction/immobilization values
based on these assumptions are also presented in Table 4.3. All values
increase as a result of this adjustment.
4.4 NONCONDENSABLE GAS ANALYSIS
Noncondensable gases were continuously monitored with a series of on-line
instruments. Since the samples were taken from a point downstream of the wet
scrubber, any removal of the gas in the scrubber must also be included.Results are summarized in Table 4.4 for each of the gases monitored. The low
CO/CO2 ratio indicates adequate oxygen present for completing combustion in the
melter plenum. Decomposition of the soda ash glass additive certainly contri-
buted to the high carbon dioxide levels recorded. Nitrate and sulfate
TABLE 4.4. Summary of Continuous Gas Analyzer Data(Source: Battelle Northwest)
TypicalOperating
Gas Scale Range, % Scale Maximum
CO 0% to 0.5% FS(a) 1 to 5 Occasional spikes to 10%
CO2 0% to 5% FS 20 to 50 A few spikes between 60% and 100%
02 0% to 100% FS 20 Constant at 20%
NOx 0% to 25 pm FS 40 to 60 Frequent spikes at -100%
S02 0% to 2 ppm FS changed 90 to 100 Frequently >100%to 0 to 4 ppm FS at8:36 on 4/2/87
(a) FS - full scale.
4.7
analysis of the scrub solution recycled through the ejector-venturi scrubber
shows minimal removal of the NOx but a substantial scrubbing of sulfate. If
all of the sulfate in solution were assumed to have come from S02 gas scrubb-
ing, then the melter exhaust concentration for S02 would increase from approx-
imately 5 to 25 ppm.
4.5 PRODUCT LEACH TESTING
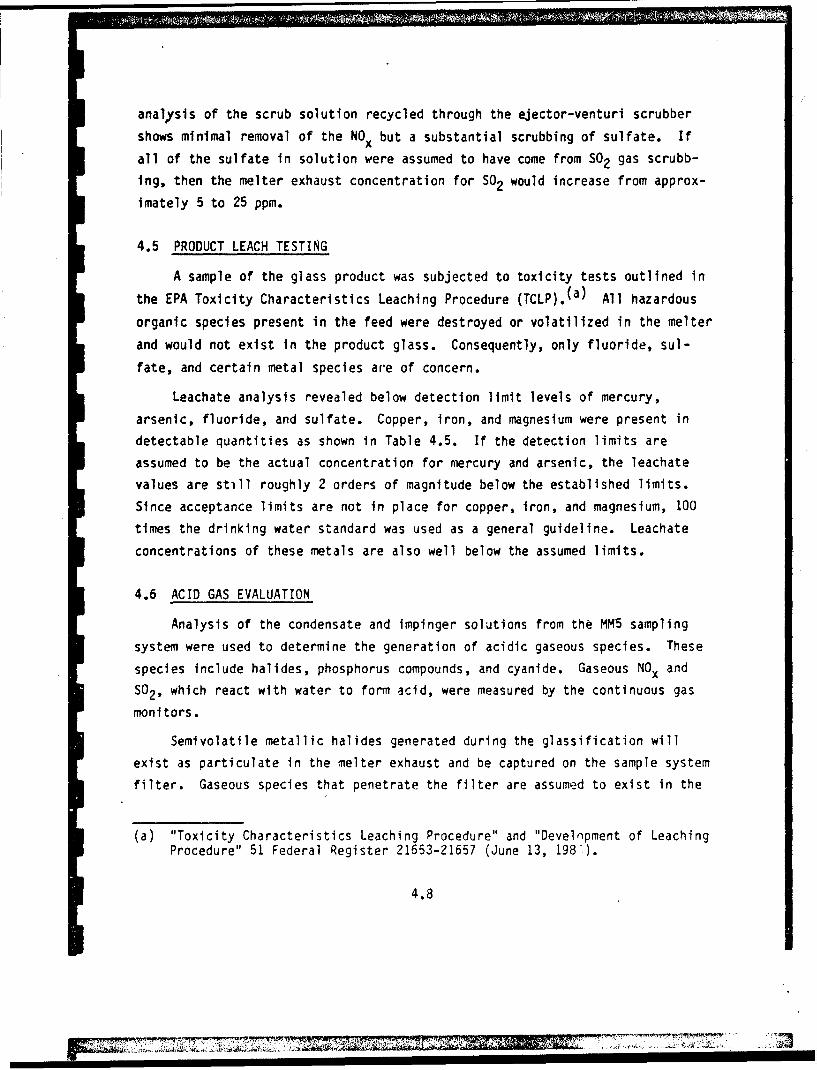
A sample of the glass product was subjected to toxicity tests outlined in
the EPA Toxicity Characteristics Leaching Procedure (TCLP).(a) All hazardous
organic species present in the feed were destroyed or volatilized in the melter
and would not exist in the product glass. Consequently, only fluoride, sul-
fate, and certain metal species are of concern.
Leachate analysis revealed below detection limit levels of mercury,
arsenic, fluoride, and sulfate. Copper, iron, and magnesium were present in
detectable quantities as shown in Table 4.5. If the detection limits are
assumed to be the actual concentration for mercury and arsenic, the leachate
values are still roughly 2 orders of magnitude below the established limits.
Since acceptance limits are not in place for copper, iron, and magnesium, 100
times the drinking water standard was used as a general guideline. Leachate
concentrations of these metals are also well below the assumed limits.
4.6 ACID GAS EVALUATION
Analysis of the condensate and impinger solutions from the MM5 sampling
system were used to determine the generation of acidic gaseous species. These
species include halides, phosphorus compounds, and cyanide. Gaseous NOx and
S02, which react with water to form acid, were measured by the continuous gas
monitors.
Semivolatile metallic halides generated during the glassification will
exist as particulate in the melter exhaust and be captured on the sample system
filter. Gaseous species that penetrate the filter are assumed to exist in the
(a) "Toxicity Characteristics Leaching Procedure" and "Development of LeachingProcedure" 51 Federal Register 21653-21657 (June 13, 198').
4.8
71 77ml
TABLE 4.5. Glass Product TCLP Results
(Source: Arthur 0. Little, Inc.)
AcceptanceLeachate Analysis Limits
Element ug/L PPM(a) PPM
Hg ND(<0.828) <0.001 0.2(T)
-As ND(<5.44) <0.005 5 (b)
Cu 34 . 3 (c) 0 . 0 34 (c) 100 (d)
Fe 66 4 . 3 (c) 0 . 6 64 (c) 30 (d)
Mg 332 0.332 14(d)
F- ND(<171) 0.171 NA
Cl" NA NA 1 (d)
S04" ND(<12900) 12.9 NA
Sa) Assumes leachate spg 1.b) Established EPA TCLP. limits.
(c) Corrected for blank.(d) 100 times the drinking water standard.NO - Not Detectable.NA z None Available.
form of hydrogen halides (acid gases) which will be collected with water in the
condensate trap or with sodium bicarbonate in the impingers. Efforts to dif-
ferentiate between other gaseous forms, for example F2 or C12 gas, were not
considered necessary for the purpose of this study.
Results of the acid gas analysis is presented in Table 4.6. Phosphorus
and cyanide were below detection limits in all samples and therefore, not
included.
4.7 PARTICULATE LOADINGS
Particulate is generated from the glassification system by two main mech-
anisms: gross entrainment and volatilization/condensation. With the surface
feeding and formation of a cold cap, gross entrainment is the predominant mode.
The fine dust created by drying and blending Basin F material in a barrel
4.9

TABLE 4.6. Summary of Acid Gas Analysis(Source: Arthur D. Little, Inc.)
Anion F- Cl" S04=
Total Wt. Collected 16.8 mg 1312.5 mg 586.9 mg
Total mg-Moles Collected 0.882 37.0 6.11
Acid HF HCl -HS04
Mass Collected 17.6 mg 1349 mg 599 mg
Concentration in Exhaust 0.268(10)-3 11.3(10)- 3 1.86(10)-
(g-moles/m 3) (6 ppm) (250 ppm) (42 ppm)
tumbler with large rocks was intended for use with the submerged feeding tech-
nique. Its use with the surface feeding method resulted in excessive entrain-
ment. As much as 10% of the waste feed material was carried with the exhaust
gas stream as a result of this dusting. Particulate from gross entrainment
tends to be relatively large material >10 pm and is easily removed from the gas
stream for recycle by simple filtration systems. It is therefore, of no
special concern.
Volatilization followed by condensation is the mechanism responsible for
producing small, submicron-size particles from semivolatile species like
sodium, boron, and mercury. Because of its size, this material is much more
difficult to capture and behaves like a gas in many wet scrubbing and filtra-
tion systems.
4.10

5.0 DISCUSSION OF RESULTS
Examination of the organic destruction and removal efficiencies suggests
the organic species of concern are readily decomposed in the glassification
process. Even with the large feed entrainment we observed for the selected
operating conditions and the surface feeding approach, temperatures and resi-
dence time in the melter plenum were apparently adequate for good destruction.
Aldrin, the only compound in sufficient concentration to measure actual
organic contaminant destruction values, had a destruction efficiency in excess
of 99.9999%. Use of the submerged feeding technique or an afterburner may not
be required if this level of destruction can be achieved on a large scale for
all the organic species. Further optimization of the operating conditions and
furnace design may lead to even higher destruction efficiency values for added
safety.
The data collected on arsenic suggest it behaves as a nonvolatile metal
and is released from the melter by gross entrainment only. Provided good
organic destruction can be maintained with wet or only partially dried feed
material, it should be possible to reduce the entrainment by as much as a fac-
tor of 10 and achieve 99% or better retention of the arsenic and other nonvola-
tile metals without recycle.
Mercury Is an exceition. Its semivolatile nature makes it necessary to
concentrate mercury as a secondary waste stream for separate disposal. Pre-
vious Battelle Northwest studies found that mercury readily combined with
halides during the glassification process. Continued recycling of mercury to
the furnace will lead to a buildup in the off gas with possible solids deposi-
tion in the piping, materials problems from the corrosive nature of mercuric
halides, and safety concerns resulting from the very toxic nature of these
materials. If it were necessary to separate mercury species from the rest of
the entrained waste materials it may be feasible to use a dual-stage filtration
system. The first stage roughing filter could remove only the relatively large
dust particles that make up the bulk of the entrained particulate. A cyclone
or baghouse is well suited for this application. Mercury, which should be
largely present as <10 izm particles, could then be removed in the next stage
5.1
high-efficiency particulate removal system such as an absolute HEPA filter or
an electrostatic precipitator. The total amount of mercury in the Basin F
appears to be quite small when compared with the quantity of glass frit thatwill be generated. Blending of any dust collected in the off-gas systems withthe frit may prove to be acceptable.
Sulfur solubility in glass is generally in the range of about 0.1 to
0.2 wt% and decreases under reducing conditions. If levels in the feed exceed
the solubility, a separate sulfate salt phase will form in the melter. The
presence of organic materials however, serve as reductants in the melter feed
that reduce sulfate to sulfur dioxide gas so it escapes with the exhaust gas.
Off-gas monitoring showed measurable levels of SO2 and a negative immobiliza-
tion value for sulfate, which suggests that all the sulfur volatilized. No
separate salt phases in the melter were observed after the test, so phase
separation does not appear to be a concern.
-To determine the maximum concentration of SO2 in the untreated melter
exhaust, the sulfate collected in the off-gas scrubber was assumed to have
evolved from the melter as SO2 (a worst-case estimate). For this case, the S02concentration in the melter exhaust is increased from the measured value of5 ppm downstream from the scrubber to roughly 25 ppm. Even so, this level is
still within normally accepted concentrations for release to the atmosphere.
Nitric oxide and nitrogen dioxide concentrations on the other hand are too high
for direct release at ground level. When measured in the exhaust gas from the
scrubber they approach the 25-ppm level. Very little of the NOX was removed bythe scrubber solution because neither the type of scrubber used nor the scrubb-
ing solution (tap water) were designed for NOx removal. Dispersion through a
stack or treatment will be needed.
Wet scrubbing systems have been used for NOx removal but tend to be very
inefficient with these relatively low concentrations and generate secondary
liquid waste to dispose of. A catalytic reduction system that operates dry and
converts the NOx to elemental nitrogen and oxygen is a more complex and costly
alternative that could be considered. The concentrations of hydrogen halides
also appear to be too high for untreated release at ground level. The release
through a stack should be adequate. If necessary a properly designed wet
5.2

Iscrubbing system could easily reduce the HF and HCl to acceptable levels. The
wet scrubber system could be placed downstream of the filtration equipment so
.. the scrub solution would be free of heavy metal contaminants that create
additional disposal problems.
cernLeach testing of the product glass has confirmed that contaminants of con-
cern are firmly fixed in the glass matrix. With the TCLP leachate concentra-
tion of regulated hazardous species well below the threshold values, it should
be possible to dispose of the product as a nonhazardous waste. Directly pour-
ing the molten glass into water will fracture it sufficiently for easy trans-
portation to a landfill, if so desired, or it can be poured into disposal drums
directly.
IiIIIIIII
I1m 5.3
I6.0 PROCESS FLOWSHEET AND MATERIAL BALANCE DEVELOPMENT
forThe bench-scale test program demonstrated feasibility and provided data
for evaluating the effectiveness of glassification as a treatment technology
o- f Basin F materials. Using data from this test in combination with engineer-
ing judgement and experience in developing waste treatment flowsheets for a.
variety of radioactive wastes, a material balance (Table 6.1) and process flow-
sheet (Figure 6.1) were prepared for the production-scale system. This flow-
sheet and material balance served as the basis for preparing a preliminary cost
analysis of the technology which was assembled by Arthur D. Little, Inc.
Development of the flowsheet also provided insight into the state of available
I technology and helped to define the system configuration and data needs for any
subsequent development work.
For purposes of the flowsheet development, it was assumed that the esti-
mated 400,000 yd 3 of soil, overburden and asphalt liner, and the 4 million gal
of liquid in Basin F would be processed in 2.5 years. Using an annual on-stream
factor of 75%, the design process rate of 950 tons of Basin F material per day
I was established.
A low melting temperature borosilicate glass formulation was used during
I the bench-scale test program. The boron in this glass improved the fluidity
and ability of the melt to flux waste materials. Improved melting and fluidity
could also have been achieved by increasing the furnace temperatures, but
because of a temperature limitation associated with some components of the
bench-scale furnace, this was not a feasible option. Any production-scale fur-
nace would, however, be designed for higher temperature operation so a lower
cost soda-lime silicate glass formulation could be used. The reference soda-
lime glass composition which was selected contained 15 wt% alkali (sodium and
potassium oxides), 15 wt% alkaline earth (calcijm and magnesium oxides) and
l 70 wt% other elements (primarily silica, alumina, and iron oxide). The soil
analysis previously presented in Table 3.1 established the chemical glass
former addition requirements to meet this reference glass. Soda ash and limeare assumed to provide the required sodium and calcium. Table 6.2 presents the
I assumed glass product composition.
I 6.1
I
7 '77

+0 c % 0 0 N
4- 0Cob% O
C3(14
I-
IAU
co *- 0
0 i 0:
An 'UC
in C -
.ie
4.04
.44-EU0
-C.4 U.4- -
0
~4.0 N0 x% 0
fn N
6.

Naturaml Gas >
Basi F LauidsFrom Storage Tank .udTase un
20 gorn 2 hop
Stainless Steel
Bar Type, Lump~ Storage Sn Soft Enclosed ElevatingBeeaket 50 ho Feet- IS' 0 ho p Balt Conveyor
Sto'Sorag .m IE o
100' x20' W xl5' HEouiove4 with 5 30' ScrewConsveyors.- 5 hp Each
Glass AdditivesFeed HooperQ3 Reo'd Eacfl 10*6 x 30' H
Melter Feed Belt(3 ReQ~dl 100' 5 hO
2 3
TruckUnlodingTo Atmos
200.000 Ibsih Storage Silo Lime Storage S-10100, 25*4 %100' H 25' x 00* H
Feed Macei 200 ho Pneumnatic Transoortof Lrn, to Feed H-ooper
Am (nioaagel200
ho
Electricinty -4801V
FIGURE 6.1. Preliminary Pro(Source: Batte
AT
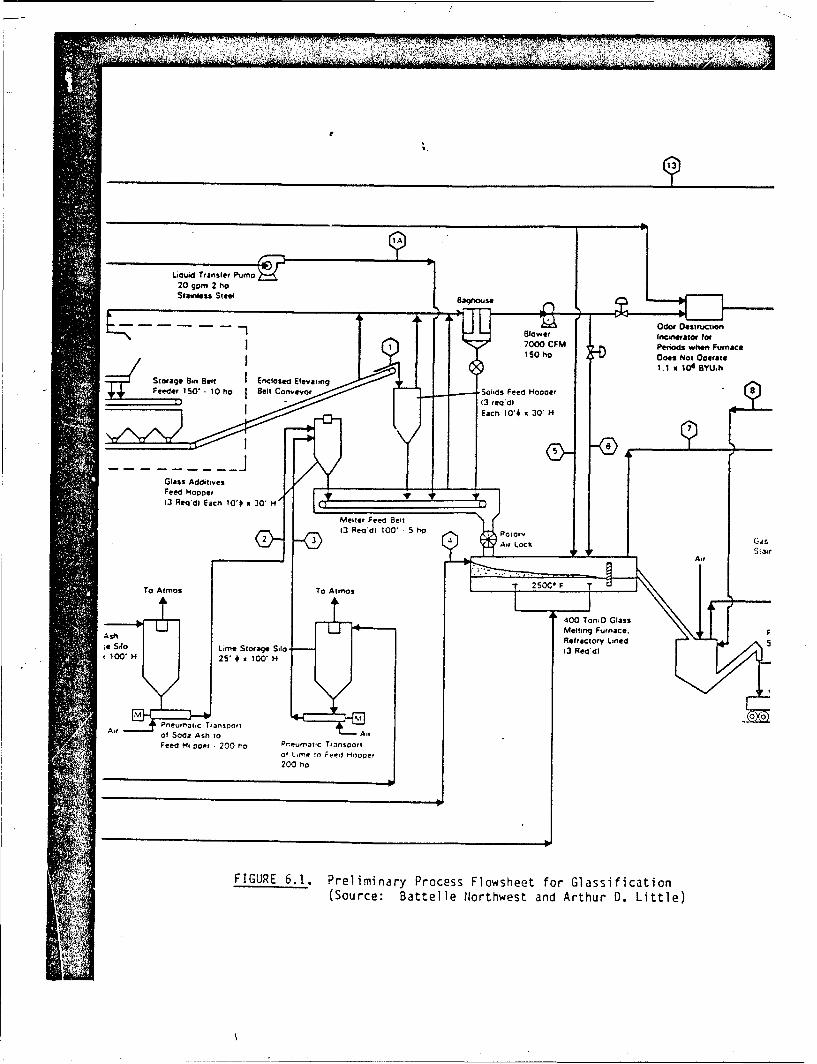
20 cuweat2 no
7000CFMPeriods wheni Furnace150 hoD0es Not Ovitrate
1. 1 x 10⁴ AYU~h
Feeder ISO' 10 ho Belt conveyor Solids Feed Hocooer
Feed H.ooper
Meetter Furnace. F
Rerctr 13e 5e'11 5h oa aAir SLorck Stai
2T 40 To00 Gls
Pnu0g UrM ltignF rnoe.
Ash Refacor Lineto
Feed H( ocer 200 ho P',einmratc Transoorwof Lane to Feed Hnooper200 ho
FIGURE 6.1. Preliminary Process Flowsheet for Glassification(Source: Battelle Northwest and Arthur 0. Little)
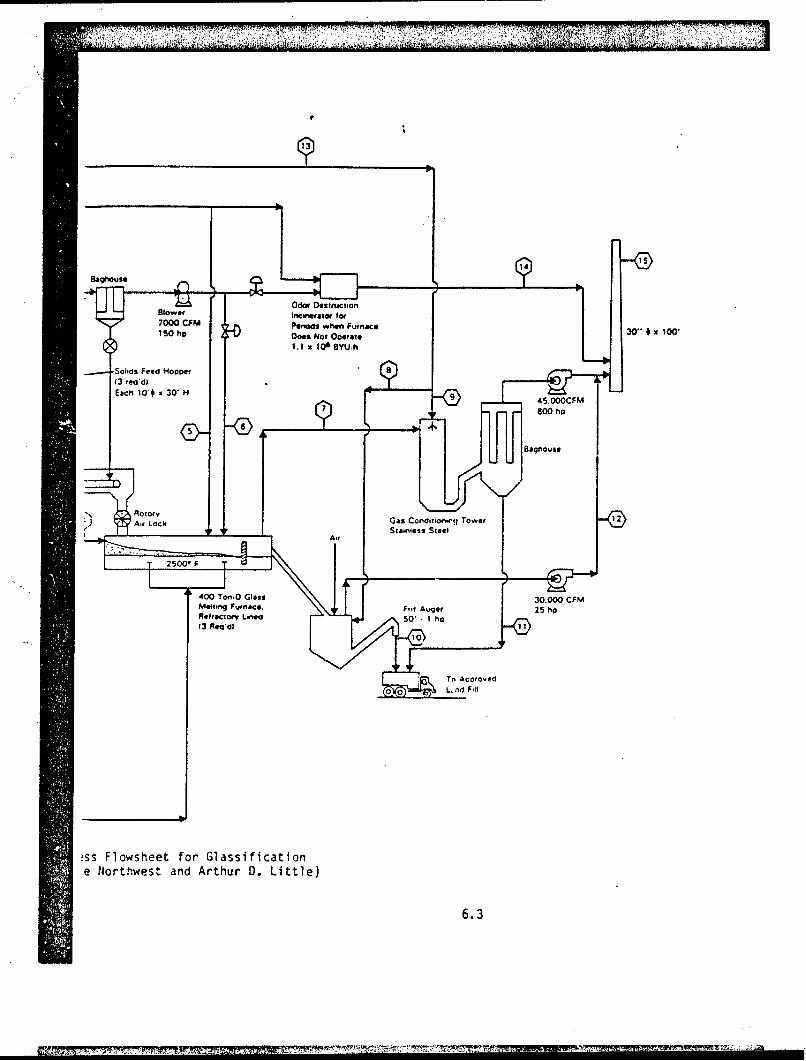
- ,4
.-- >-7
e ~ ~ ~ ~ ~ ~ Oo Nothet nZAthrD.Ltte
BIG-ofInewwaor6.3

7 , 7,g~. . ~
TABLE 6.2. Assumed Glass Formulation for Solidifying Basin F Materials(Source: Battelle Northwest)
Wt% From Wt% FromOxide Form Basin F Additions Total
A1203 10.5 -- 10.5
Fe2 03 3.3 -- 3.3
Na20 1.5 11.5 13.0
Si0 2 55.1 -- 55.1
K2 0 2.0 -- 2.0
CaO 0.7 13.5 14.2
MgO 0.8 -- 0.8
Others 1.1 -- 1.1
Total 75 25 100
Basin F solids mJst initially pass through a rough size reduction step so
they can be easily handled in conventional solids transfer systems. The pro-
posed melting furnaces are quite large by commercial glass making standards and
should easily accommodate reasonable variations in both particle size and com-
position. For this reason a simple approach to blending the additional chem-
ical additives with the Basin F solids was selected.
The Basin F solids and glass additives will be metered from two separate
feeders onto a common belt conveyor. It was assumed that the Basin F liquids
could be sprayed onto the dry feed materials as they passed along the conveyor
in an effort to reduce dusting problems in the feeding system and melter. Some
blending will also occur when the feed is passed throulgh a rotary air lock
feeder on its way to the melting furnace. The rotary air lock helps reduce
dusting associated with air inleakage to the furnace, and prevents flames from
moving into the feed system.
The Basin F materials handling systems are enclosed and vented to control
the release of toxins in the working place. The vent gas passes through a bag-
house filter to collect any dust generated by the handling operations and is
then sent to the melting furnace for destruction in the high-temperature plenum
space. Alternatively the gas can be routed to a separate odor destruction
6.4
incinerator for limiting the volatile organic vapors whenever the furnace is
not operational. Dusts from the baghouse are periodically added back to the
feed conveyor through a special air lock valve. A separate feed system is used
for each of the three melting furnaces.
Glass-former additives are delivered in bulk by rail car or truck. At the
unloading station these chem:cals will be pneumatically transferred into two
storage silos with the capacity for about a 1-week supply of glass additives.
Simultaneous pneumatic transfer to the feed hoppers will be used to blend the
chemicals. For the same reasons as previously discussed, adequate mixing is
expected from this simple operation and so, an elaborate blending and metering
system was not proposed.
Three melting furnaces that process 400 tons of glass per day are
required. The furnace is an electric melter design using direct joule heating
between metallic or graphite electrodes submerged in the molten glass pool.
The all-electric melter was selected because of its characteristically low
emission rates and high throughput per unit area. Alternating electric current
is passed between pairs of electrodes with the glass acting as a resistance
heater.
Glass must be molten to conduct electricity. The glass is heated to a
molten state by providing an auxiliary heat source such as hot combustion gases
in the vapor space above the melter. This glass heating or startup, as it is
commonly called, usually occurs only a few times during the life of a furnace.
Once the furnace is hot, power will be maintained between the electrodes during
most nonoperational periods such as general equipment maintenance.
Electric furnaces typically process less than 100 tons of glass per day
for commercial glass making. Therefore, a 400-ton per-day furnace is consid-
ered very large, but not unreasonable. Overhead-combustion-fired furnaces of
this size using oil or natural gas are common. The lower energy costs assoc-
iated with combustion firing is the primary reason why, large glass furnaces are
combustion-fired instead of electric-heated.
The Basin F feed and glass formers are introduced at one end of the fur-
nace and the molten glass product and off gas is removed from the opposite.
6.5

" I
With this arrangement, feed material such as decomposition gases and dust that
are released at the batching end will remain in the furnace long enough for
complete reaction. The vapor space near the off-gas end of the furnace serves
as a secondary combustion chamber to complete destruction of any organic
species present in the exhaust gas. Natural gas burners in this vapor space
are provided in order to ensure sufficient heat for complete combustion. Dur-
ing furnace operation, ventilation air from soil handling and transfer systems
will be used as a source of combustion air to the burners. This method of
operation will eliminate the need to operate the organic odor incinerator con-
tinuously. These burners will operate to maintain the off gases exiting the
furnace at about 1500°F, which should be more than adequate to oxidize the
"hazardous organic species present. The natural gas burners will also serve as
the heat source for furnace startup.
From the glass melters the off gases are passed through a gas conditioning
tower where a very fine water spray is introduced to achieve evaporative cool-
ing. The temperature of the exhaust gas is lowered in this cooler to reduce
flow rates through the remainder of the off-gas treatment system and to permit
the use of fabric filters in the baghouse for removing entrained particulates.
The baghouse dust, a relatively small quantity in comparison to the amount
of materials treated, will be sent for disposal with the glass product from the
melting furnace. After filtration in the baghouse, the gases are then passed
to the stack and released to the air. The required stack height is estimated
to be between 50 and 100 ft in order to ensure that NOx, S0 2 , HF and HCl fumes
generated by the destruction of certain Basin F materials will be dispersed to
ambient air quality concentrations at ground level. Regulatory limits for air
discharges from this glassification process are not established but data from
the bench-scale tests suggest that tUe level of pollutants could be easily
reduced below typical ambient air standards for breathing air quality without
the need for a special wet scrubbing system.
The molten glass from the furnace will be discharged into a water bath to
produce frit. The frit is a sand-like material that can then be easily trans-
ported to a land fill. Fracturing glass in this manner is a well-established,
6.6
I 77 7
common procedure in the glass making industry. Steam generated by this processwill also be sent to the stack and mixed with the process off gases.
I,III,IIIII,UiI
I,II
• 6.7

7.0 RECOMMENDATIONS FOR FUTURE WORK
All unit operations proposed for the glassification process to treat
Basin F materials are well-established industrial practices and should not
require major long-term development programs for full-scale application of the
technology. However, the flowsheet development work relied on engineering
judgement and limited data, and some basic design issues remain as to whether
the proposed materials handling and effluent treatment system are fully
adequate. Larger-scale tests with prototypic equipment are needed to address
these issues.
The recommended development program involves additional laboratory studies
to refine the glass formulation, followed by extended duration (2 to 4 weeks)
tests to examine organic destruction, study melting phenomena and establish
operating specifications. These latter tests could initially be done in small
engineering-scale equipment with a glass throughput capacity of a few tons per
day. The data from the small-scale tests would then allow an effective pilot-
scale field demonstration tj be planned.
Additional laboratory studies could be done in ceramic crucibles using
conventional high-temperature-radiant-heated furnaces. The principle focus of
this effort would be to formulate the best mixture of glass forming additives
and Basin F materials for rapid melting without producing secondary phases such
as sulfate salts of excessive crystals in the melt. The resulting glass must
have the proper viscosity and electrical conductivity to process through the
furnace. Refractory corrosion rates are also generally examined during the
glass formulation phase of the work. Techniques have been developed to study
melting kinetics at this scale. An examination of melting rate as a function
of feed particle size and degree of homogeneity is probably warranted for a
preliminary assessment of whether further feed pretreatment should be pursued.
Testing at the engineering-scale level would follow to confirm proper feed
formulation. In addition, these tests would identify atiy basic processing
problems associated with either glass melting or equipment design before a
pilot-scale field demonstration unit is developed. Furnace performance in
terms of throughput and destruction efficiency of organics can be established
7.1

in general for a wide range of variations in operating parameters. Process
control parameters for safe and efficient operation could be outlined at this
stage for confirmation during pilot-scale tests later on.
The pilot-scale field demonstrations are required to validate the process
and equipment design basis, prepare detailed operational procedures, and con-
duct engineering optimization before the full-scale process is fixed. A one
tenth-scale or larger field demonstration would typically be considered ade-
quate for meaningful results when attempting to validate the scale-up correla-
tions and relationships between equipment performance and process control
parameters.
Effluent characteristics must be more fully defined to confirm that the
proposed treatment system is appropriate for meet.ing regulatory release
requirements. The engineering-scale tests can not completely address this
issue because of significant differences in the furnace design and operation at
this small scale. Pilot-scale tests would provide the required data to answer
these questions as well as whether the natural gas burner is needed to complete
the volatile organic destruction in the melter. The pilot-scale field demon-
stration is also required to examine the adequacy of the Basin F materials size
reduction and transfer systems. Tests can be completed to help decide if any
improvements in melting efficiency associated with better blending and size
reduction are significant.
The fritted glass product will need to be studied for leaching behavior to
determine if it can pass requirements for direct disposal in municipal land
fills. The glass product from field demonstrations is preferred for use in
these tests.
7.2

DISTRIBUTION LIST
Defense Technical Information Center 12Cameron StationAlexandria, Virginia 22314
Defense Logistics Studies Information Exchange 2U.S. Army Logistics Management CenterFort Lee, Virginia 23801
Commande rU.S. Army Toxic and Haza-dous Materials Agency 2Attn: AMXTH-CO-PAberdeen Proving Ground, Maryland 21010-5401
CommanderU.S. Army Toxic and Hazardous Materials Agency 14Attn: AMXTH-TE-DAberdeen Proving Ground, Maryland 21010-5401
-------


