36
February 2021 INVESTOR PRESENTATION Human Interface and Display Technologies : HIMX
February 2021 INVESTOR PRESENTATION
Human Interface and Display Technologies
: HIMX

Factors that could cause actual events or results to differ materially include, but not limited to, general business and economic conditions and the state
of the semiconductor industry; market acceptance and competitiveness of the driver and non-driver products developed by the Company; demand for
end-use applications products; reliance on a small group of principal customers; the uncertainty of continued success in technological innovations; our
ability to develop and protect our intellectual property; pricing pressures including declines in average selling prices; changes in customer order
patterns; changes in estimated full-year effective tax rate; shortages in supply of key components; changes in environmental laws and regulations;
exchange rate fluctuations; regulatory approvals for further investments in our subsidiaries; our ability to collect accounts receivable and manage
inventory and other risks described from time to time in the Company's SEC filings, including those risks identified in the section entitled "Risk
Factors" in its Form 20-F for the year ended December 31, 2019 filed with the SEC, as may be amended. Images of devices depicted in this
presentation may be representative of those in which Himax has specification, or for reference-only and may not be associated with actual bill-of-
material or design-win in the displayed image. Any association of such, without a confirmed disclosure of such by the Company or the Company's
customer are coincidental. Himax is under strict customer disclosure guidelines on the release of such information.
Forward Looking Statements
2

March 2006Himax IPOs on Nasdaq.
Raised $147M with
Morgan Stanley
October 2004Formed Himax Display to
focus on LCOS
microdisplay technology
June 2001Himax Taiwan
formed by B.S.
Wu
December 2003 Himax Taiwan began
trading on Emerging
Stock Board (TW)
under "3222"
June 2013Himax completed taking
out financing of Chimei
February 2007Himax acquired Wisepal, and
forms Himax Semiconductor to
focus on small and medium sized
DDICs
2 0 1 0 - 2 0 1 2Non-driver sales increased gross
margins and sales opportunities
September 2015AR business hit
inflection point with
pilot production
shipment made to a
major US customer
2009GFC reduced sales ~$900 million to
~$700 million. Refocused effort on
non-driver products
August 2005Himax Taiwan delisted
from Emerging Stock
Board
July 2013Signed
investment
agreement
with Google
Founder B.S. Wu pioneers flat panel technologies at Chimei
Electronics as CTO
Chairman Wu establishes Himax to meet DDIC demand for large panels and fast-
growing medium and small panels
Himax gains market share with design wins with leading technology products
companies, worldwide
Himax leads WLO shipment and development with North American OEM customer, 3D sensing for Android . LCOS advancements for AR & HUD, CMOS for Notebook and Webcam, and WLO integration keep Himax at the forefront of AR/VR product design and pending product releases. Smart Sensing for Edge AI
2018 and Beyond1990s 2000s 2010s
2016Volume shipment of
AR related LCOS and
WLO, AMOLED DDIC,
and in-cell TDDI
August 2016Started expansion
for next generation
LCOS and WLO
production lines
2017Qualcomm & Himax
jointly announced
structured light-
based 3D depth
sensing solution
Corporate Timeline
For the last 30 years, we have worked with leading OEMs to develop the most recognized imaging and human interfacing technologies.
2H 2018TDDI ramped with
smartphone OEMs.
WLO shipment
Recognized Industry Leader
3
2H 2020WiseEye, our edge AI solution,
adopted by Google TensorFlow
Lite for micro controllers. More
joint efforts with AI allies
including Edge Impulse and
SparkFun
2020Tablet TDDI started MP in
Q1. Strong growth from
products including TDDI
for Smartphone and
Tablets as well as
Automotive drivers
2001 2002 2003 2004 2005 2006 2007 2008 2009 2010 2011 2012 2013 2014 2015 2016 2017 2018 2019 2020
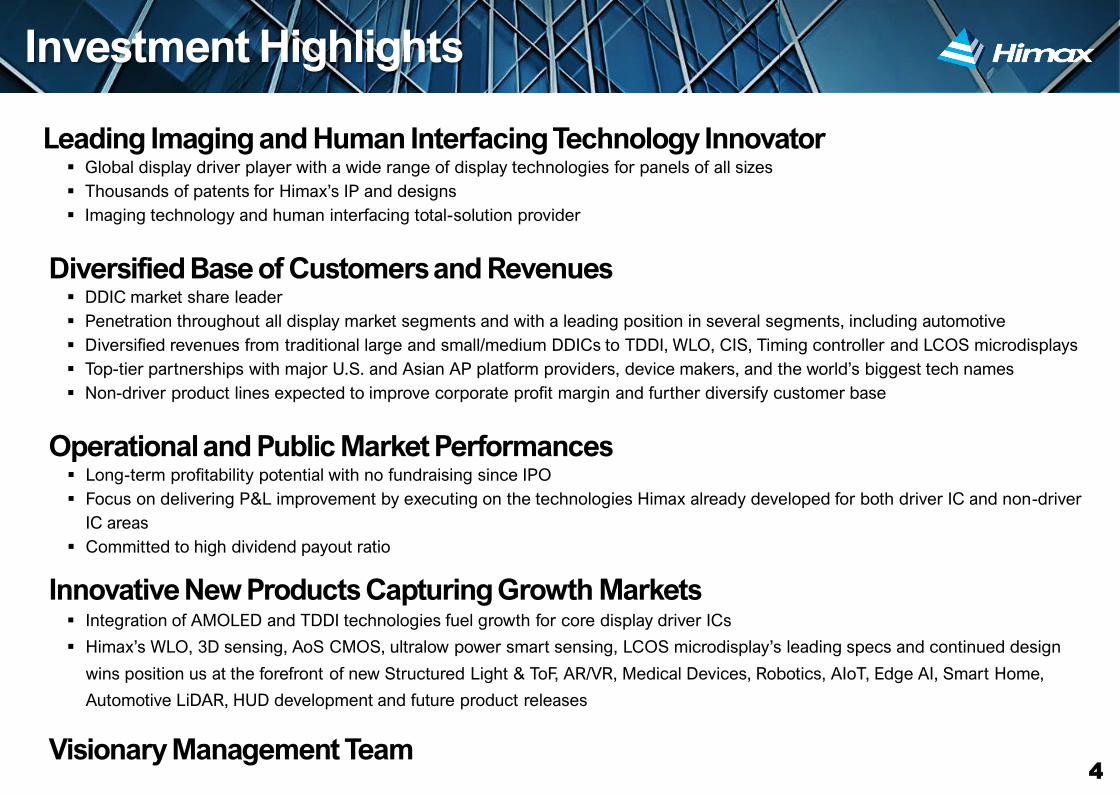
Leading Imaging and Human Interfacing Technology Innovator▪ Global display driver player with a wide range of display technologies for panels of all sizes
▪ Thousands of patents for Himax’s IP and designs
▪ Imaging technology and human interfacing total-solution provider
Diversified Base of Customers and Revenues▪ DDIC market share leader
▪ Penetration throughout all display market segments and with a leading position in several segments, including automotive
▪ Diversified revenues from traditional large and small/medium DDICs to TDDI, WLO, CIS, Timing controller and LCOS microdisplays
▪ Top-tier partnerships with major U.S. and Asian AP platform providers, device makers, and the world’s biggest tech names
▪ Non-driver product lines expected to improve corporate profit margin and further diversify customer base
Operational and Public Market Performances▪ Long-term profitability potential with no fundraising since IPO
▪ Focus on delivering P&L improvement by executing on the technologies Himax already developed for both driver IC and non-driver
IC areas
▪ Committed to high dividend payout ratio
Innovative New Products Capturing Growth Markets▪ Integration of AMOLED and TDDI technologies fuel growth for core display driver ICs
▪ Himax’s WLO, 3D sensing, AoS CMOS, ultralow power smart sensing, LCOS microdisplay’s leading specs and continued design
wins position us at the forefront of new Structured Light & ToF, AR/VR, Medical Devices, Robotics, AIoT, Edge AI, Smart Home,
Automotive LiDAR, HUD development and future product releases
Visionary Management Team
Investment Highlights
4

Credit Suisse Jerry Su
Mizuho Securities Asia Ltd. Kevin Wang
Nomura Securities Donnie Teng
Northland Securities, Inc. Tim Savageaux
Baird Equity Research Tristan Gerra
Fiscal Year December 31
Last-Traded Price (2/3/21) $11.18
Diluted Weighted Ave. Out. ADS 173.4M
Equivalent ADS Out 173.8M
Market Capitalization (2/3/21) $1,925M
Daily Volume (2/3/21) 2.76M
Insider Ownership* 24.0%
Analysts
Source: www.nasdaq.com
12 Month Trading Chart
Himax on NASDAQ
5
* Insider ownership includes executives and board members
Insider24.0%
Institutional3.1%
Mutual Fund2.5%
Hedge Fund6.6%
Retail63.8%
Shareholder Type
Date: As of Dec 31, 2020
Feb 3 2021

6
History of Dividend and Share Buyback
$50
$33
$50
$13
$12
2007 2008 2010 2011
Unutilized Portion Executed Share Buyback
Executed Share Buybacks from 2007-2020(US$M)
HAS BEEN RETURNED TO SHAREHOLDERS INCLUDING DIVIDENDS AND SHARE BUYBACKS SINCE IPO
*
$40
$67$56
$44
$21 $11
$42 $46 $51
$22
$41
$17
2007 2008 2009 2010 2011 2012 2013 2014 2015 2016 2017 2018 2019 2020
51.3% 61.4%75.0%
119.0%
63.2%
100.0%83.3% 75.0% 77.5% 89.0% 81.4%
61.7%
Dividend Payout Ratio (%) Total Payout (US$M)
NANA
Yield (%)EPS
Dividend per unit
Himax Dividend and Policy
▪ Company is committed to pay annual cash dividend
▪ Distributed a total of $458 million of cash dividend since IPO
▪ Dividends referenced primarily on prior year’s profitability and cash demand forfuture growth
▪ Typically pays out annual cash dividend at approximately the middle of the current
calendar year, e.g., 2018 dividend payouts in July was for fiscal year 2017
▪ In 2020, Himax did not pay an annual cash dividend for fiscal year 2019. The decision was made with full consideration of Himax’s 2020 operations and capital
requirement to support its future growth and to drive gains in market share
▪ Initiated four share buyback programs totaling $158
million since 2007
▪ Repurchased a total of 46.5 million ADSs through Sep
30, 2020 at average purchase price per ADS: $3.15
• Note: On 11/30/2018 Himax chairman announced share
purchase plan. Chairman Dr. Biing-Seng Wu intended to use
his personal funds to purchase up to approximately $5 million
of the Company's American Depositary Shares ("ADSs") in
the open market, subject to market conditions and other
factors
Himax Share Buyback
0.20 0.35 0.30 0.25 0.12 0.06 0.25 0.27 0.30 0.13 0.24 0.10 0.00 0.00
0.57 0.40 0.21 0.19 0.06 0.30 0.36 0.39 0.15 0.30 0.16 0.05 (0.08) 0.27
4.0 7.0 10.4 9.1 5.9 3.4 4.4 4.1 4.8 1.4 2.9 1.3 na na

Q4 Summary and Q1 Guidance
7
4Q2020 3Q2020 4Q2019 YoY QoQRevenues $275.8M $239.9M $174.9M +57.6% +14.9%
Gross Margin (%) 31.2% 22.3% 20.6% +10.6% +8.9%
IFRS Profit (Loss) $34.0M $8.5M $1.0M +3,182.4% +302.4%
IFRS Earnings (Loss) per ADS $0.195 $0.049 $0.006 +3,153.4% +300.8%
Non-IFRS Profit (Loss) $34.2M $12.6M $1.5M +2,161.6% +171.7%
Non-IFRS Earnings (Loss) per ADS $0.197 $0.073 $0.009 +2,141.6% +170.6%
2020 2019 YoY
Revenues $887.3M $671.8M +32.1%
Gross Margin (%) 24.9% 20.5% +4.4%
IFRS Profit (Loss) $47.1M ($13.6M) +446.2%
IFRS Earnings (Loss) per ADS $0.272 ($0.079) +444.6%
Non-IFRS Profit (Loss) $52.3M ($12.1M) +531.5%
Non-IFRS Earnings (Loss) per ADS $0.302 ($0.070) +529.4%
1Q2021 GuidanceRevenues Increase by 5% to10% sequentially
Gross Margin (%) 37% to 38%, depending on our final product mix
IFRS Profit To be around 30.0 cents to 34.0 cents
Non-IFRS Profit To be around 30.1 cents to 34.1 cents

Beijing, Shanghai, SuzhouFuzhou Ninbo, Foshan
Wuhan, Shenzhen, Hefei,Xiamen, Chongqing, Xian,
Chengdu, FuqingSales, Design, Technical Support
Irvine, CADesign
Investor Relations
Campbell, CASales
MinneapolisDesign, Manufacturing
Operations
Sales/Marketing
Tainan, Taipei, and Hsinchu in Taiwan
Headquarters
Design
Manufacturing
Operations
Sales/Marketing
Technical support
Asan, BundangSales Design
Technical Support
TokyoSales
Technical
SupportGivatayimDesign, Sales
▪ Fabless semiconductor company with
world leading visual imaging
processing technologies
▪ Global market leader in TFT-LCD
display driver and timing controller ICs
▪ 200+ customers across Taiwan, China,
Japan, Korea, U.S. and Europe
▪ 3,009 patents granted and 561 patents
pending approval worldwide as of
December 31, 2020
▪ NASDAQ-listed since March 2006
(HIMX)
▪ Around 2,000 employees worldwide;
more than 90% are engineers
▪ Headquartered in Tainan, Taiwan with 9
R&D centers in Taiwan, China, Korea,
Israel and U.S., out of a total of 24
offices across Taiwan, China, Japan,
Korea, Israel and U.S.
Himax’s Global Reach
HEADQUARTERSTainan, Taiwan
Forward Looking StatementsA Global Semiconductor Company
8
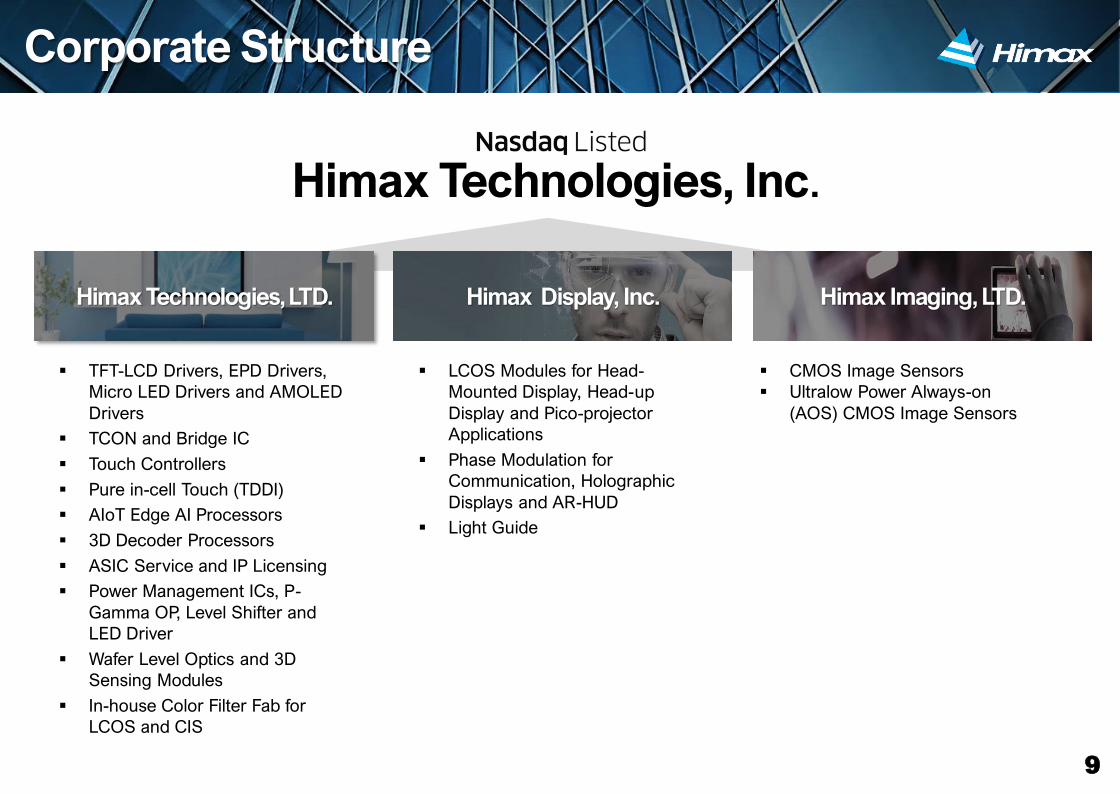
▪ TFT-LCD Drivers, EPD Drivers,
Micro LED Drivers and AMOLED
Drivers
▪ TCON and Bridge IC
▪ Touch Controllers
▪ Pure in-cell Touch (TDDI)
▪ AIoT Edge AI Processors
▪ 3D Decoder Processors
▪ ASIC Service and IP Licensing
▪ Power Management ICs, P-
Gamma OP, Level Shifter and
LED Driver
▪ Wafer Level Optics and 3D
Sensing Modules
▪ In-house Color Filter Fab for
LCOS and CIS
▪ LCOS Modules for Head-
Mounted Display, Head-up
Display and Pico-projector
Applications
▪ Phase Modulation for
Communication, Holographic
Displays and AR-HUD
▪ Light Guide
▪ CMOS Image Sensors
▪ Ultralow Power Always-on
(AOS) CMOS Image Sensors
Himax Technologies, Inc.
Himax Technologies, LTD. Himax Display, Inc. Himax Imaging, LTD.
Corporate Structure
9

Our Technologies Are
Used by Consumer Brands Worldwide
10

We are a leader in display driver ICs used to
enable large, small and medium-sized flat
panel displays in TFT and Touch
Who uses Himax DDICs
In what devices can you find Himax DDIC technologies
MARKETS WE SERVESmartphones, Tablets, Automotives, Monitors, Notebooks, TVs,
Gaming, Education, Industrial, Healthcare plus 100’s more
applications for markets and businesses that use all types of flat
panel displays
Display Driver IC (DDIC)
11
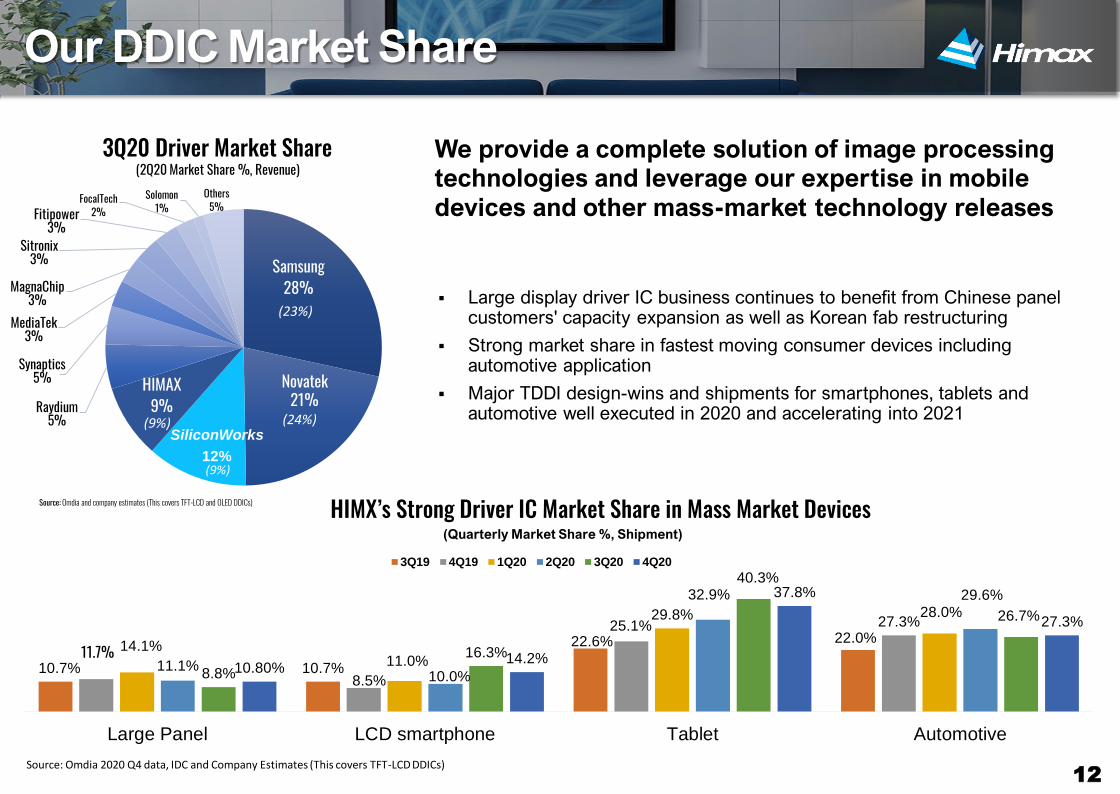
HIMX’s Strong Driver IC Market Share in Mass Market Devices
Samsung 28%
Novatek21%
SiliconWorks
12%
HIMAX9%Raydium
5%
Synaptics5%
MediaTek3%
MagnaChip3%
Sitronix3%
Fitipower3%
FocalTech2%
Solomon1%
Others5%
(23%)
(24%)
(9%)
3Q20 Driver Market Share(2Q20 Market Share %, Revenue)
▪ Large display driver IC business continues to benefit from Chinese panel customers' capacity expansion as well as Korean fab restructuring
▪ Strong market share in fastest moving consumer devices including automotive application
▪ Major TDDI design-wins and shipments for smartphones, tablets and automotive well executed in 2020 and accelerating into 2021
We provide a complete solution of image processing technologies and leverage our expertise in mobile devices and other mass-market technology releases
Source: Omdia and company estimates (This covers TFT-LCD and OLED DDICs)
Our DDIC Market Share
12Source: Omdia 2020 Q4 data, IDC and Company Estimates (This covers TFT-LCD DDICs)
(9%)
(Quarterly Market Share %, Shipment)
10.7% 10.7%
22.6% 22.0%11.7%
8.5%
25.1% 27.3%
14.1%11.0%
29.8% 28.0%
11.1%10.0%
32.9% 29.6%
8.8%
16.3%
40.3%
26.7%
10.80%14.2%
37.8%
27.3%
Large Panel LCD smartphone Tablet Automotive
3Q19 4Q19 1Q20 2Q20 3Q20 4Q20
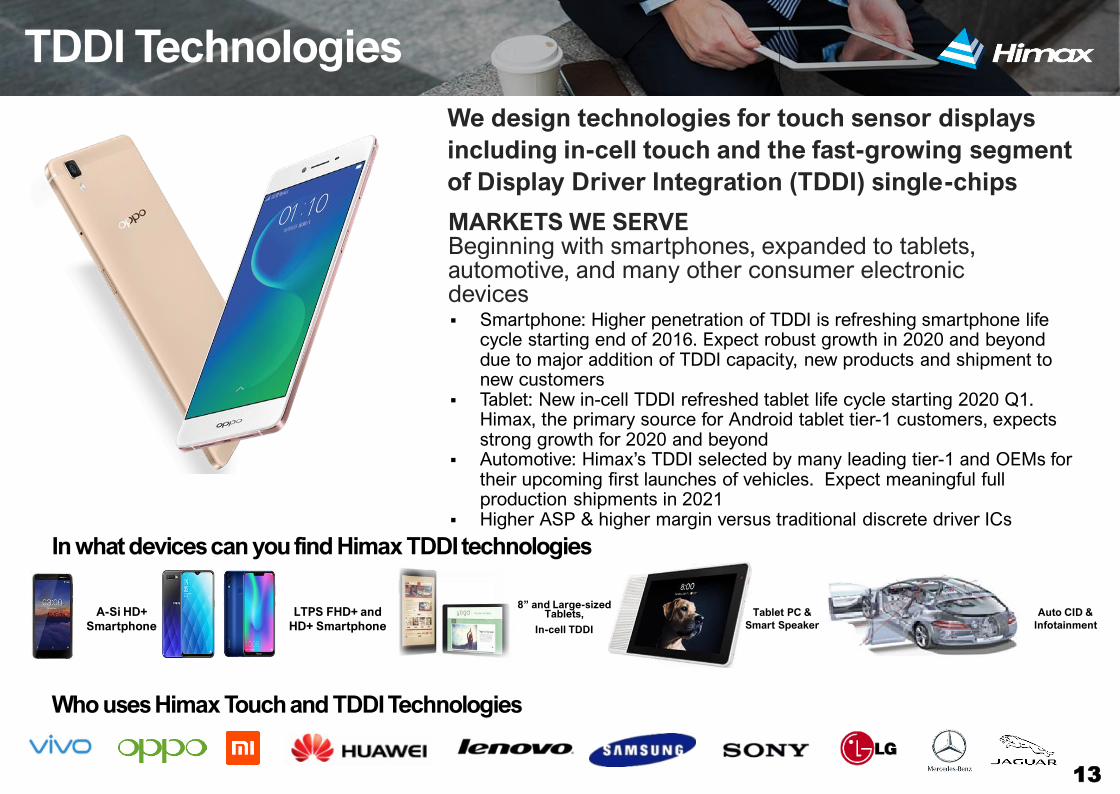
Who uses Himax Touch and TDDI Technologies
In what devices can you find Himax TDDI technologies
LTPS FHD+ and
HD+ Smartphone
Tablet PC &
Smart Speaker
A-Si HD+
Smartphone
8” and Large-sized Tablets,
In-cell TDDI
We design technologies for touch sensor displays
including in-cell touch and the fast-growing segment
of Display Driver Integration (TDDI) single-chips
MARKETS WE SERVEBeginning with smartphones, expanded to tablets, automotive, and many other consumer electronic devices▪ Smartphone: Higher penetration of TDDI is refreshing smartphone life
cycle starting end of 2016. Expect robust growth in 2020 and beyond due to major addition of TDDI capacity, new products and shipment to new customers
▪ Tablet: New in-cell TDDI refreshed tablet life cycle starting 2020 Q1. Himax, the primary source for Android tablet tier-1 customers, expects strong growth for 2020 and beyond
▪ Automotive: Himax’s TDDI selected by many leading tier-1 and OEMs for their upcoming first launches of vehicles. Expect meaningful full production shipments in 2021
▪ Higher ASP & higher margin versus traditional discrete driver ICs
TDDI Technologies
13
Auto CID &
Infotainment
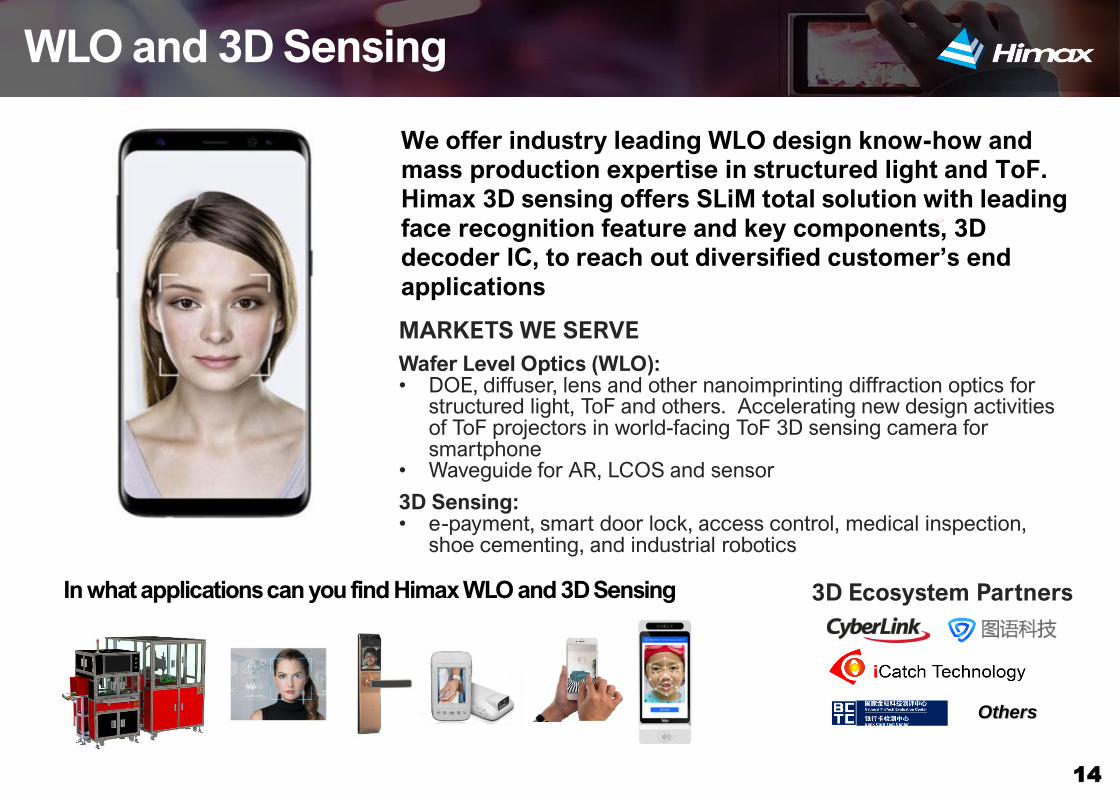
In what applications can you find Himax WLO and 3D Sensing
We offer industry leading WLO design know-how and mass production expertise in structured light and ToF. Himax 3D sensing offers SLiM total solution with leading face recognition feature and key components, 3D decoder IC, to reach out diversified customer’s end applications
MARKETS WE SERVE
Wafer Level Optics (WLO): • DOE, diffuser, lens and other nanoimprinting diffraction optics for
structured light, ToF and others. Accelerating new design activities of ToF projectors in world-facing ToF 3D sensing camera for smartphone
• Waveguide for AR, LCOS and sensor
3D Sensing: • e-payment, smart door lock, access control, medical inspection,
shoe cementing, and industrial robotics
WLO and 3D Sensing
3D Ecosystem Partners
Others
14

CIS and Ultralow Power Smart Sensing
Himax CMOS image sensors include RGB sensors for NB/Web Camera, near infrared (NIR) sensors for 3D sensing and ultralow power Always-on Sensor (AoS). Our smart sensing total solution brings computer vision and voice command AI to edge devices with extremely low power consumption. Our key component, AI processor, participated tier-1 edge-to-cloud ecosystems for broad market access
MARKETS WE SERVECIS: • Ultralow power AoS: Best for IoT/smart sensing in human/
occupancy detection, eye tracking & gesture control• CIS: NB and Web cam
Smart Sensing: • AIoT, notebook, doorbell, surveillance, TV, air conditioner,
home appliances, and smart building
In what applications can you find Himax 3D/Smart Sensing technologies
AI Ecosystem Partners
Lite for Microcontroller
Significant motion Face detection Head detection Head motion box
15

Who uses Himax LCoS micro display technologies
Front Lit LCS Technology Advantages
• Compact form factor, brightness, power efficiency,
• MP efficiency & Readiness
• Simplify light guide design and lower cost
We are the leader and long-term innovator of Liquid
Crystal on Silicon (LCoS) displays and the only
company capable of high-volume production runs of
LCoS displays for the launch of mass-market devices
MARKETS WE SERVE• LCoS and Front Lit LCoS
Industrial, consumer, shopping, search, gaming, sports, pico
projector, AR/VR smart glasses, automotive head-up displays,
tier-1 OEM’s market leading AR glasses
Phase Modulation and Beam Steering• Holographic display, AR-HUD, ADAS, LiDAR
LCoS Microdisplays
16
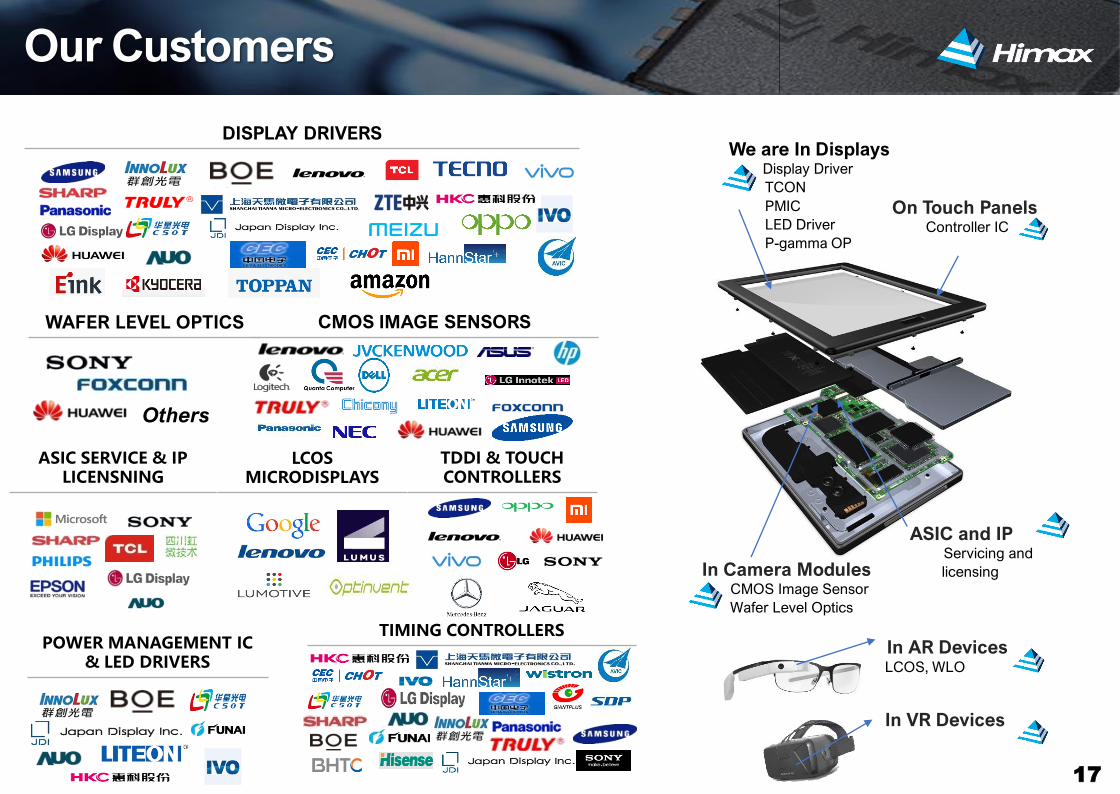
In Camera ModulesCMOS Image Sensor
Wafer Level Optics
We are In DisplaysDisplay Driver
TCON
PMIC
LED Driver
P-gamma OP
On Touch PanelsController IC
ASIC and IPServicing and
licensing
WAFER LEVEL OPTICS CMOS IMAGE SENSORS
ASIC SERVICE & IP LICENSNING
TIMING CONTROLLERS
LCOS MICRODISPLAYS
TDDI & TOUCH CONTROLLERS
POWER MANAGEMENT IC & LED DRIVERS
In AR DevicesLCOS, WLO
In VR Devices
Others
Our Customers
DISPLAY DRIVERS
17
Fabless Manufacturing Expertise
18
Display Driver
Chip Probe TestingProcessed Tape
Gold Bumping
Assembly and Testing
Wafer Fabrication Package
RW
Chip Probe Testing
CMOS Image Sensor Back-end
FT
SOC
Chip Probe Testing Package
FT
Market Opportunities by Product Application and Himax Strategies
19
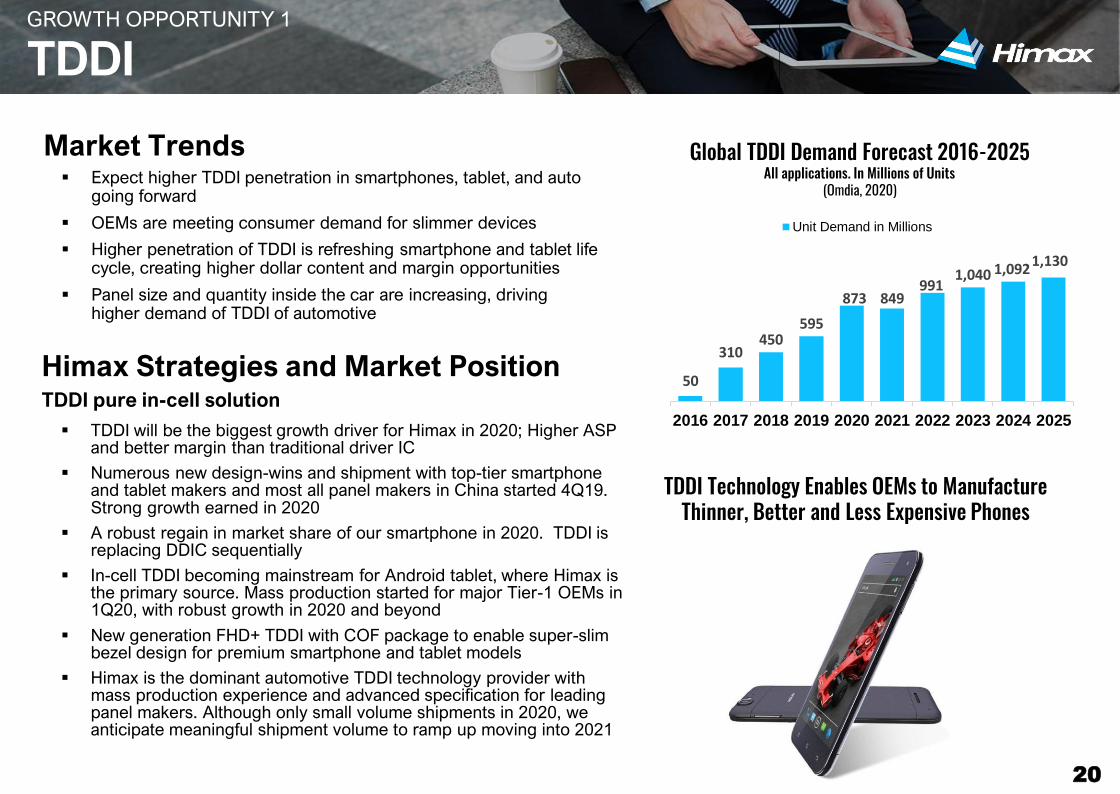
Himax Strategies and Market PositionTDDI pure in-cell solution
▪ TDDI will be the biggest growth driver for Himax in 2020; Higher ASP and better margin than traditional driver IC
▪ Numerous new design-wins and shipment with top-tier smartphone and tablet makers and most all panel makers in China started 4Q19. Strong growth earned in 2020
▪ A robust regain in market share of our smartphone in 2020. TDDI is replacing DDIC sequentially
▪ In-cell TDDI becoming mainstream for Android tablet, where Himax is the primary source. Mass production started for major Tier-1 OEMs in 1Q20, with robust growth in 2020 and beyond
▪ New generation FHD+ TDDI with COF package to enable super-slim bezel design for premium smartphone and tablet models
▪ Himax is the dominant automotive TDDI technology provider with mass production experience and advanced specification for leading panel makers. Although only small volume shipments in 2020, we anticipate meaningful shipment volume to ramp up moving into 2021
GROWTH OPPORTUNITY 1
TDDI
50
310450
595
873 849991
1,040 1,0921,130
2016 2017 2018 2019 2020 2021 2022 2023 2024 2025
Unit Demand in Millions
Global TDDI Demand Forecast 2016-2025All applications. In Millions of Units
(Omdia, 2020)
TDDI Technology Enables OEMs to Manufacture Thinner, Better and Less Expensive Phones
20
Market Trends ▪ Expect higher TDDI penetration in smartphones, tablet, and auto
going forward
▪ OEMs are meeting consumer demand for slimmer devices
▪ Higher penetration of TDDI is refreshing smartphone and tablet life cycle, creating higher dollar content and margin opportunities
▪ Panel size and quantity inside the car are increasing, driving higher demand of TDDI of automotive

Market Trends • Chinese panel makers, benefited from Korean fab restructuring and
increased their global market share, will procure more volume from
Taiwan DDIC supply chain
• Leading Chinese panel makers’ shipments continue to dominate the
market. China ranked the No. 1 position with its total TFT-LCD capacity
• 4K TV penetration accelerates; 8K TV started to emerge
• Demand for IT panel (monitor and NB) surged in 2020 due to the
pandemic
• Demands for more sophisticated and higher performing displays are rising
in the automotive segment
Himax Strategies and Market Position• Leading market share of large DDIC in China
• Major beneficiary of Industry and Korean fab restructuring which will
increase Chinese panel maker’s global market share
• Increased shipments of 4K solutions. Collaborate with major panel
makers on the development of next generation 8K TVs. 8K TV is a
strategic area for Himax due to its higher display driver and Tcon content
and high technical barrier of entry
• Leader in higher frame rate and low power solution in high end gaming
monitor and NB market
• Not only DDIC, Himax also provide comprehensive TCON lineups for a
total solution to meet demands of high resolution, high frame rate and low
power display
China Takes a Leading Role in Display Panel Manufacturing and DDIC Demand
GROWTH OPPORTUNITY 2
Display Driver IC (DDIC)
21

Market Trends ▪ Wafer-Level Optics (WLO) remains the best technology for structured
light, Time-of-Flight (ToF) related 3D sensing
▪ Very few companies can provide advanced WLO solutions to achieve optical high efficiency, small form factors, and eye safety regulations for consumer devices
▪ 3D sensing adoption is expected to be wider for Android smartphones, AR/VR and AIoT devices
GROWTH OPPORTUNITY 3
WLO and 3D Sensing
Himax Strategies and Market Position▪ WLO: Exceptional design know-how and mass production expertise
deliver consistent product quality and high yields for WLO anchor customer’s large-scale adoption since 2015 with ongoing shipment in 2020
▪ Continue to participate the most advanced 3D sensing projects covering structured light for non-smartphone application and ToF for smartphone 3D.
▪ ToF in main camera for Android smartphone will be the largest new growth opportunity for Himax moving forward. Collaborating with tier-1 laser and sensor partners to develop new world-facing 3D sensing camera for tier-1 OEM whereby we provide optical components and/or projectors, which are critical for the performance of the whole ToF solution
▪ Offer market leading 3D decoder ASIC to customers wishing to design own structured light 3D sensing solution to reach out broader market. Good achievement in e-payment engagement in China
▪ In non-smartphone, working with industry-leading facial recognition algorithm and application processor partners to develop new 3D sensing application for business access control, medical inspection, etc.
▪ 3D sensing will be the growth opportunity for Himax beyond 2020
22
Himax WLO for 3D Sensing
Mini Package Ultra Small Size & Package
Wafer Level ProcessIntegrated Optics
High Accuracy
Scalability In Production
WLO for 3D ToF / Structured Light

Market Trends ▪ Smart AI devices demand boosted, but very few companies can provide
ultralow power solutions in vision AI in the area of human detection, people tracking, people counting, and anti-peeking warning
▪ Adoption for AI-based, ultralow power smart sensing solution is expected to be wider in 2020 for AIoT applications, including smart home, smart building, and devices for industrial, tracking and AR/VR purposes
GROWTH OPPORTUNITY 4
Ultralow Power Smart Sensing and CIS
Himax Strategies and Market Position▪ Himax Ultralow Power CMOS Image Sensor (CIS):
▪ Industry first ultralow power and low latency back-illuminated CIS solution for always on, intelligent visual sensing
▪ Our CIS includes near infrared (NIR) sensors for 3D sensing and ultralow power computer vision Always-on-Sensor (AoS). Good for smart building and security applications, next generation NB, and AR/VR for mobile devices
▪ Support qqHD/QVGA/VGA AoS and industrial first 2-in-1 RGB/NIR/AI sensor
▪ Reference design win for Google TensorFlow Lite
▪ Himax Smart Sensing:
▪ WiseEye solution, containing Himax’s industry leading AoS, AI processor and TinyML AI algorithm, meets strong demands for edge AI devices with features of ultralow power and optimized computer vision-based total solutions in such application as NB, TV, air conditioner, surveillance, door lock, doorbell and many other.
▪ For WiseEye WE-I Plus, an edge AI computing ASIC solution, we proactively participate the edge-to-cloud ecosystem and work closely with machine learning framework provider, AI algorithm developers, cloud service providers and OEM/ODM to provide flexible and cost-effective AIoT platform to fulfill this booming but diversified market
▪ Collaborated with Google to offer TensorFlow Lite for Microcontrollers (TFLu) ecosystem, where developers can train and deploy the TFLu model/inference on to the TFLu kernel with ease
23
Best For IoT/Smart SensingFace/Body Detection,
Eye Tracking & Gesture Control,
3D Depth Sensing
Ultralow Power Sensor Applications
Lite for Microcontroller
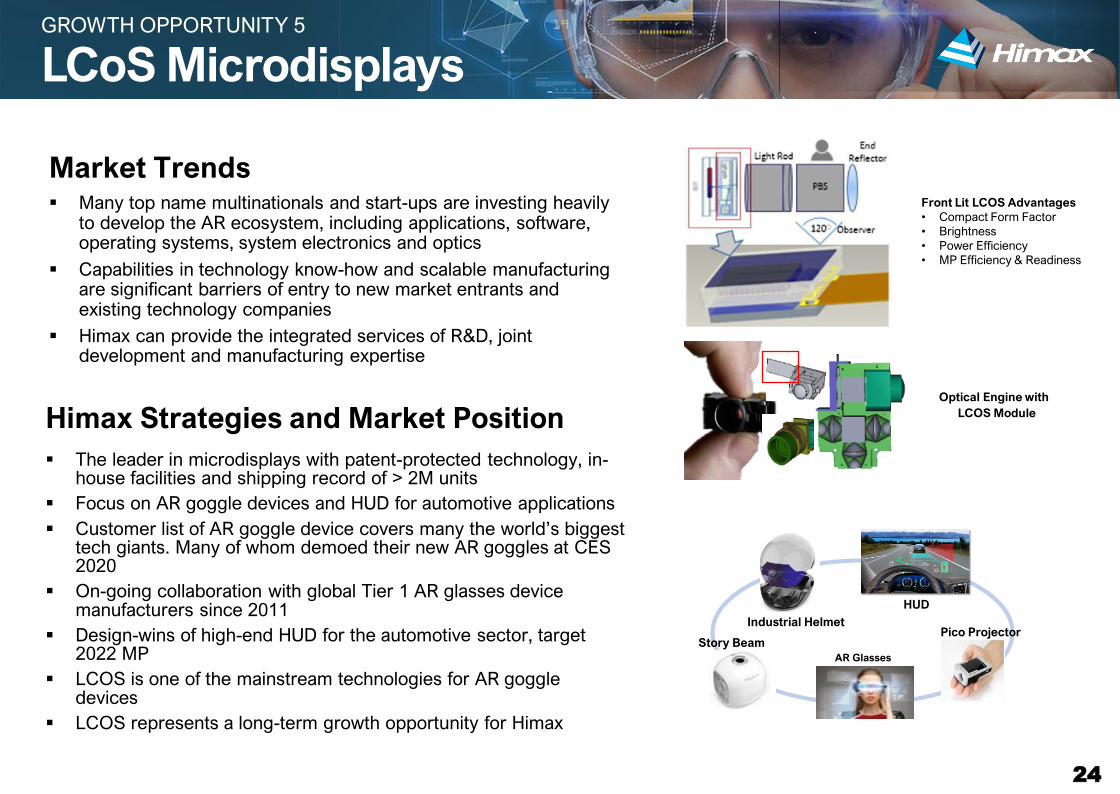
Market Trends ▪ Many top name multinationals and start-ups are investing heavily
to develop the AR ecosystem, including applications, software, operating systems, system electronics and optics
▪ Capabilities in technology know-how and scalable manufacturing are significant barriers of entry to new market entrants and existing technology companies
▪ Himax can provide the integrated services of R&D, joint development and manufacturing expertise
Himax Strategies and Market Position
▪ The leader in microdisplays with patent-protected technology, in-house facilities and shipping record of > 2M units
▪ Focus on AR goggle devices and HUD for automotive applications
▪ Customer list of AR goggle device covers many the world’s biggest tech giants. Many of whom demoed their new AR goggles at CES 2020
▪ On-going collaboration with global Tier 1 AR glasses device manufacturers since 2011
▪ Design-wins of high-end HUD for the automotive sector, target 2022 MP
▪ LCOS is one of the mainstream technologies for AR goggle devices
▪ LCOS represents a long-term growth opportunity for Himax
GROWTH OPPORTUNITY 2
TDDI Adoption Rate GrowthGROWTH OPPORTUNITY 5
LCoS Microdisplays
Front Lit LCOS Advantages
• Compact Form Factor
• Brightness
• Power Efficiency
• MP Efficiency & Readiness
Optical Engine with
LCOS Module
AR Glasses
HUD
Industrial Helmet
Story BeamPico Projector
24

2020 YTDFinancial Review

$300$540
$745$918
$833$692
$643 $633$737 $771 $841
$692$803
$685 $724$672
$887221
460
719
975 1,069
1,521
1,156 1,165 1,297 1,337
1,516
1,309 1,464
1,311 1,323 1,192 1,256
-100
100
300
500
700
900
1100
1300
1500
1700
$100
$300
$500
$700
$900
$1,100
$1,300
$1,500
$1,700
$1,900
2004 2005 2006 2007 2008 2009 2010 2011 2012 2013 2014 2015 2016 2017 2018 2019 2020
Revenue
Units Sold
Unit and Revenue History
Units Sold and Revenue (in millions of units and millions of USD)
We are One of the Leading Semiconductor Companies in the World
26
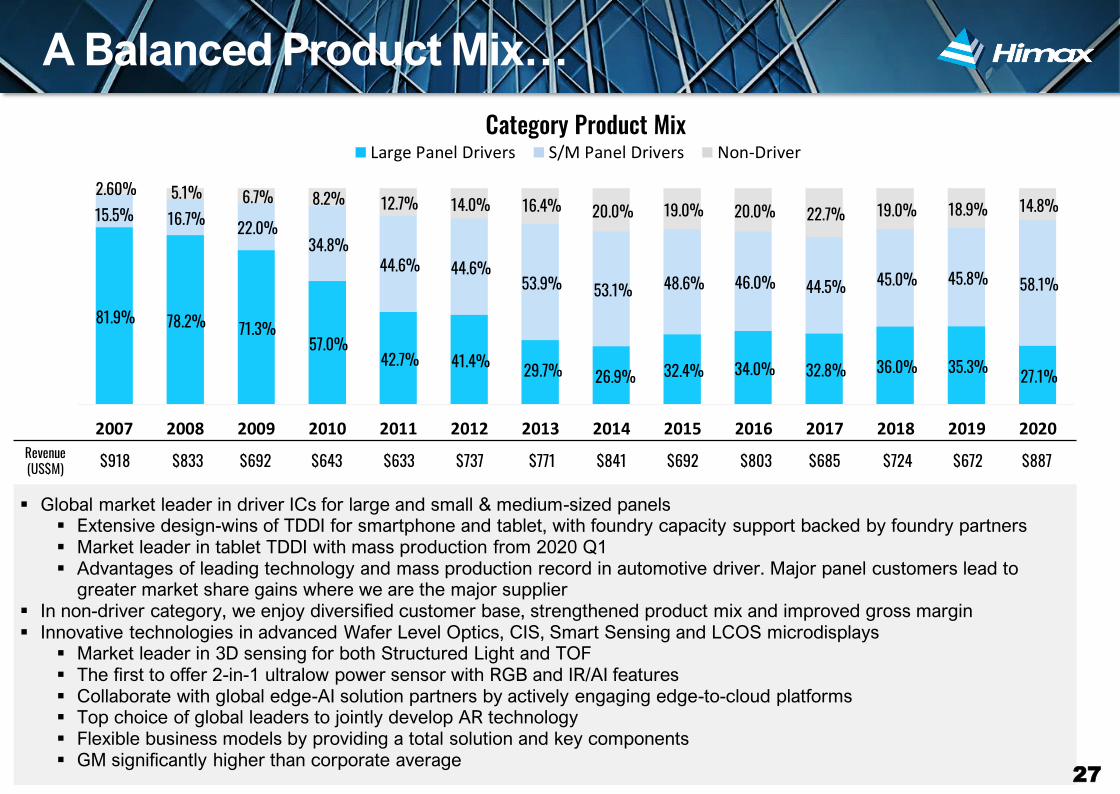
▪ Global market leader in driver ICs for large and small & medium-sized panels▪ Extensive design-wins of TDDI for smartphone and tablet, with foundry capacity support backed by foundry partners▪ Market leader in tablet TDDI with mass production from 2020 Q1▪ Advantages of leading technology and mass production record in automotive driver. Major panel customers lead to
greater market share gains where we are the major supplier▪ In non-driver category, we enjoy diversified customer base, strengthened product mix and improved gross margin▪ Innovative technologies in advanced Wafer Level Optics, CIS, Smart Sensing and LCOS microdisplays
▪ Market leader in 3D sensing for both Structured Light and TOF▪ The first to offer 2-in-1 ultralow power sensor with RGB and IR/AI features▪ Collaborate with global edge-AI solution partners by actively engaging edge-to-cloud platforms▪ Top choice of global leaders to jointly develop AR technology ▪ Flexible business models by providing a total solution and key components▪ GM significantly higher than corporate average
2007 2008 2009 2010 2011 2012 2013 2014 2015 2016 2017 2018 2019 2020
81.9% 78.2% 71.3%57.0%
42.7% 41.4% 29.7% 26.9% 32.4% 34.0% 32.8% 36.0% 35.3% 27.1%
15.5% 16.7% 22.0%34.8%
44.6% 44.6%53.9% 53.1% 48.6% 46.0% 44.5% 45.0% 45.8% 58.1%
2.60% 5.1% 6.7% 8.2% 12.7% 14.0% 16.4% 20.0% 19.0% 20.0% 22.7% 19.0% 18.9% 14.8%
Large Panel Drivers S/M Panel Drivers Non-Driver
Category Product Mix
A Balanced Product Mix…
27
Revenue (US$M) $918 $833 $692 $643 $633 $737 $771 $841 $692 $803 $685 $724 $672 $887

…and a Diversified Customer Base
0%
20%
40%
60%
80%
100%
2007 2008 2009 2010 2011 2012 2013 2014 2015 2016 2017 2018 2019 2020
59.6% 62.5% 64.6% 52.7% 40.8% 34.2% 22.6% 19.6% 21.1% 15.2% 15.5% 12.6% 8.9% 6.6%
40.4% 37.5% 35.4% 47.3% 59.2% 65.8% 77.4% 80.4% 78.9% 84.8% 84.5% 87.4% 91.1% 93.4%
Innolux Non-Innolux
28
Revenue (US$M) $918 $833 $692 $643 $633 $737 $771 $841 $692 $803 $685 $724 $672 $887
Largely reduced dependence on one single customer, Innolux
▪ Diversifying product revenues by non-driver product wins and leveraging existing customers
▪ Innolux disposed of its entire equity holding in Himax on June 19th, 2013, ending its status as Himax’s related party
▪ Growing shipment to new panel manufacturer customers in China, Korea and Taiwan since 2013
▪ Market share leadership in core driver IC business
▪ Benefited by China local sourcing and capacity expansion
▪ Expanding customer base to include many global top tier tech companies for new TDDI, OLED technology, LCOS microdisplay, Wafer Level Optics, 3D sensing, Smart Sensing and CMOS image sensors
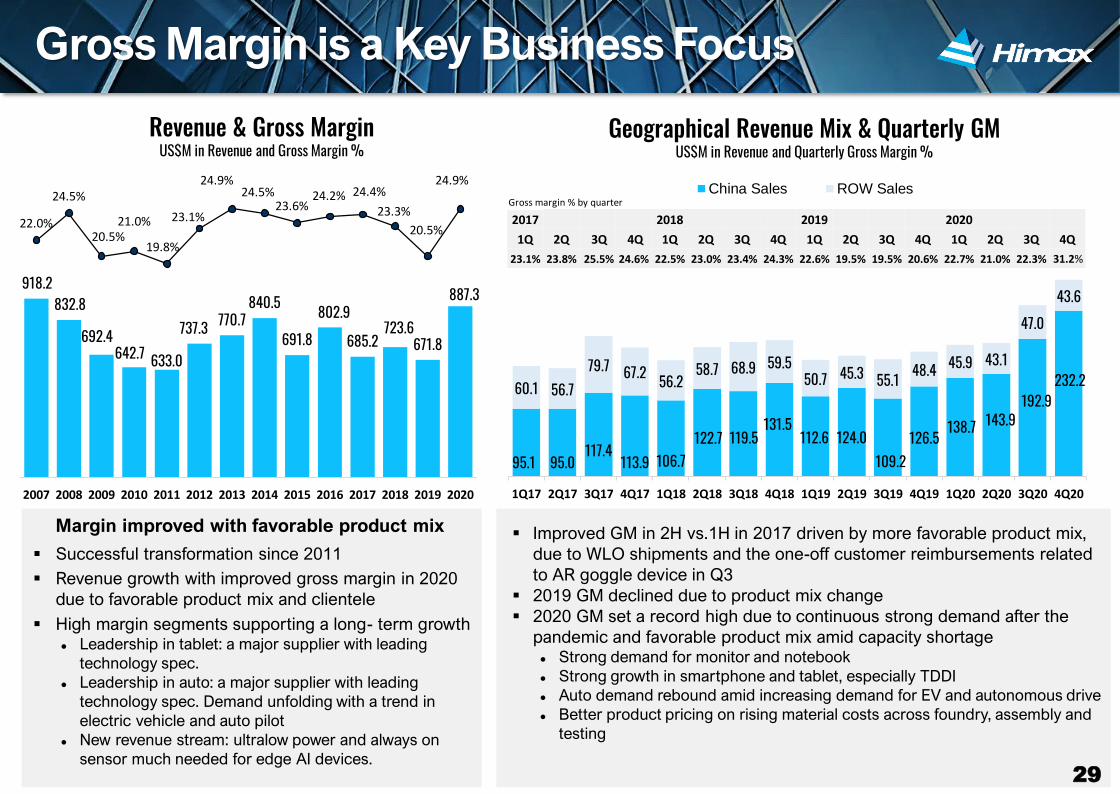
▪ Improved GM in 2H vs.1H in 2017 driven by more favorable product mix,
due to WLO shipments and the one-off customer reimbursements related
to AR goggle device in Q3
▪ 2019 GM declined due to product mix change
▪ 2020 GM set a record high due to continuous strong demand after the
pandemic and favorable product mix amid capacity shortage ⚫ Strong demand for monitor and notebook
⚫ Strong growth in smartphone and tablet, especially TDDI
⚫ Auto demand rebound amid increasing demand for EV and autonomous drive
⚫ Better product pricing on rising material costs across foundry, assembly and
testing
918.2 832.8
692.4 642.7 633.0
737.3 770.7 840.5
691.8
802.9
685.2 723.6
671.8
887.3
22.0%
24.5%
20.5%21.0%
19.8%
23.1%
24.9%24.5%
23.6%24.2% 24.4%
23.3%
20.5%
24.9%
0.0%
5.0%
10.0%
15.0%
20.0%
25.0%
30.0%
200.0
400.0
600.0
800.0
1000.0
1200.0
1400.0
2007 2008 2009 2010 2011 2012 2013 2014 2015 2016 2017 2018 2019 2020
▪ Successful transformation since 2011
▪ Revenue growth with improved gross margin in 2020
due to favorable product mix and clientele
▪ High margin segments supporting a long- term growth ⚫ Leadership in tablet: a major supplier with leading
technology spec.
⚫ Leadership in auto: a major supplier with leading
technology spec. Demand unfolding with a trend in
electric vehicle and auto pilot
⚫ New revenue stream: ultralow power and always on
sensor much needed for edge AI devices.
Revenue & Gross MarginUS$M in Revenue and Gross Margin %
Margin improved with favorable product mix
95.1 95.0 117.4
113.9 106.7 122.7 119.5
131.5 112.6 124.0
109.2 126.5
138.7 143.9 192.9
232.2 60.1 56.7 79.7 67.2 56.2
58.7 68.9 59.5 50.7 45.3 55.1 48.4 45.9 43.1
47.0 43.6
1Q17 2Q17 3Q17 4Q17 1Q18 2Q18 3Q18 4Q18 1Q19 2Q19 3Q19 4Q19 1Q20 2Q20 3Q20 4Q20
China Sales ROW Sales
Geographical Revenue Mix & Quarterly GM US$M in Revenue and Quarterly Gross Margin %
Gross Margin is a Key Business Focus
29
2017 2018 2019 2020
1Q 2Q 3Q 4Q 1Q 2Q 3Q 4Q 1Q 2Q 3Q 4Q 1Q 2Q 3Q 4Q
23.1% 23.8% 25.5% 24.6% 22.5% 23.0% 23.4% 24.3% 22.6% 19.5% 19.5% 20.6% 22.7% 21.0% 22.3% 31.2%
Gross margin % by quarter
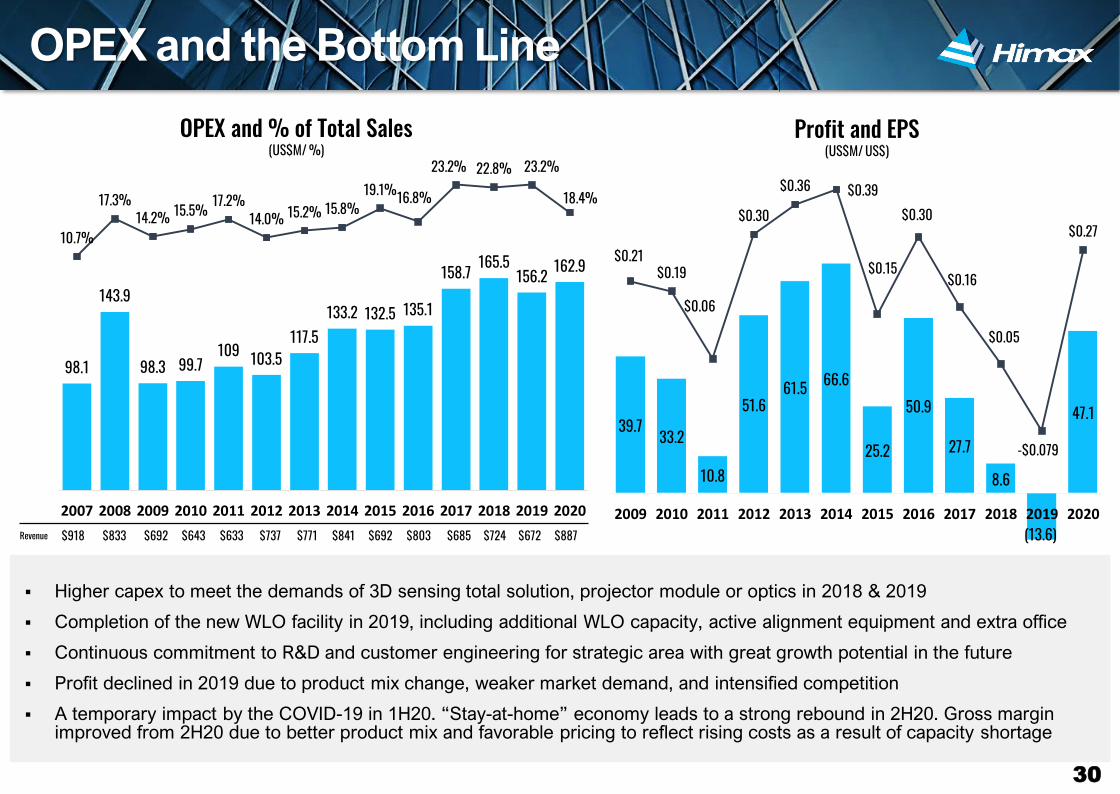
▪ Higher capex to meet the demands of 3D sensing total solution, projector module or optics in 2018 & 2019
▪ Completion of the new WLO facility in 2019, including additional WLO capacity, active alignment equipment and extra office
▪ Continuous commitment to R&D and customer engineering for strategic area with great growth potential in the future
▪ Profit declined in 2019 due to product mix change, weaker market demand, and intensified competition
▪ A temporary impact by the COVID-19 in 1H20. “Stay-at-home” economy leads to a strong rebound in 2H20. Gross margin improved from 2H20 due to better product mix and favorable pricing to reflect rising costs as a result of capacity shortage
Profit and EPS(US$M/ US$)
98.1
143.9
98.3 99.7109 103.5
117.5133.2 132.5 135.1
158.7 165.5156.2 162.9
10.7%
17.3%14.2% 15.5% 17.2%
14.0% 15.2% 15.8%19.1%16.8%
23.2% 22.8% 23.2%
18.4%
$30
$80
$130
$180
$230
2007 2008 2009 2010 2011 2012 2013 2014 2015 2016 2017 2018 2019 2020
OPEX and % of Total Sales(US$M/ %)
OPEX and the Bottom Line
30
39.7 33.2
10.8
51.6 61.5 66.6
25.2
50.9
27.7
8.6
(13.6)
47.1
$0.21$0.19
$0.06
$0.30
$0.36 $0.39
$0.15
$0.30
$0.16
$0.05
-$0.079
$0.27
-$ 15
$5
$2 5
$4 5
$6 5
$8 5
2009 2010 2011 2012 2013 2014 2015 2016 2017 2018 2019 2020
Revenue $918 $833 $692 $643 $633 $737 $771 $841 $692 $803 $685 $724 $672 $887
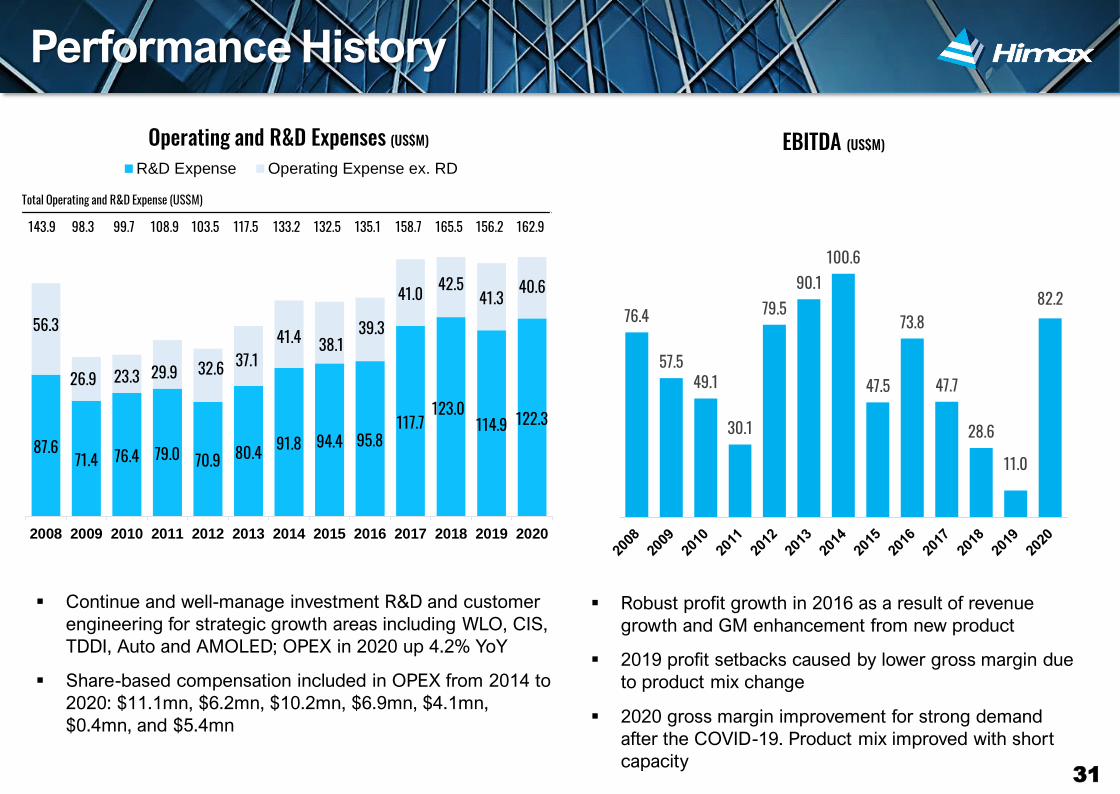
87.6 71.4 76.4 79.0 70.9 80.4 91.8 94.4 95.8
117.7 123.0
114.9 122.3
56.3
26.9 23.3 29.9 32.6 37.1 41.4 38.1
39.3
41.0 42.5 41.3 40.6
2008 2009 2010 2011 2012 2013 2014 2015 2016 2017 2018 2019 2020
R&D Expense Operating Expense ex. RD
▪ Robust profit growth in 2016 as a result of revenue
growth and GM enhancement from new product
▪ 2019 profit setbacks caused by lower gross margin due
to product mix change
▪ 2020 gross margin improvement for strong demand
after the COVID-19. Product mix improved with short
capacity
Operating and R&D Expenses (US$M) EBITDA (US$M)
▪ Continue and well-manage investment R&D and customer
engineering for strategic growth areas including WLO, CIS,
TDDI, Auto and AMOLED; OPEX in 2020 up 4.2% YoY
▪ Share-based compensation included in OPEX from 2014 to
2020: $11.1mn, $6.2mn, $10.2mn, $6.9mn, $4.1mn,
$0.4mn, and $5.4mn
Performance History
Total Operating and R&D Expense (US$M)
143.9 98.3 99.7 108.9 103.5 117.5 133.2 132.5 135.1 158.7 165.5 156.2 162.9
31
76.4
57.5 49.1
30.1
79.5 90.1
100.6
47.5
73.8
47.7
28.6
11.0
82.2

Income Statement
Income Statement
32
(US$'000, Except for Per Share Data)
For the Fiscal Period Ended4Q-2020
(Unaudited)
4Q-2019
(Unaudited)
3Q-2020
(Unaudited)
Y2020
(Unaudited)
Y2019
(Audited)
Revenues $275,770 $174,929 $239,934 $887,282 $671,835
Cost of revenues 189,774 138,838 186,329 666,501 533,916
Gross profit 85,996 36,091 53,605 220,781 137,919
Gross margin 31.2% 20.6% 22.3% 24.9% 20.5%
Operating expenses
Research and development 33,100 27,044 33,073 122,265 114,859
General and administrative 5,919 5,942 6,530 23,915 23,672
Sales and marketing 4,787 4,449 4,558 16,675 17,695
Total operating expenses 43,806 37,435 44,161 162,855 156,226
Operating income (loss) 42,190 (1,344) 9,444 57,926 (18,307)
Non-operating income (loss) (85) 2,325 (260) (1,054) 2,539
Profit (loss) before income taxes 42,105 981 9,184 56,872 (15,768)
Income tax expense 8,759 416 1,124 11,712 416
Profit (loss) for the period 33,346 565 8,060 45,160 (16,184)
Add: Loss attributable to noncontrolling interests 660 471 391 1,974 2,570
Profit (loss) attributable to Himax stockholders $34,006 $1,036 $8,451 $47,134 ($13,614)
Non-IFRS profit (loss) attributable to Himax stockholders $34,218 $1,513 $12,594 $52,330 ($12,128)
IFRS earnings (loss) per ADS attributable to Himax stockholders (in cents)
Basic 19.6 0.6 4.9 27.3 (7.9)
Diluted 19.5 0.6 4.9 27.2 (7.9)
Non-IFRS earnings (loss) per ADS attributable to Himax stockholders (in cents)
Basic 19.7 0.9 7.3 30.3 (7.0)
Diluted 19.7 0.9 7.3 30.2 (7.0)
* Short-term secured borrowing is guaranteed by restricted deposit
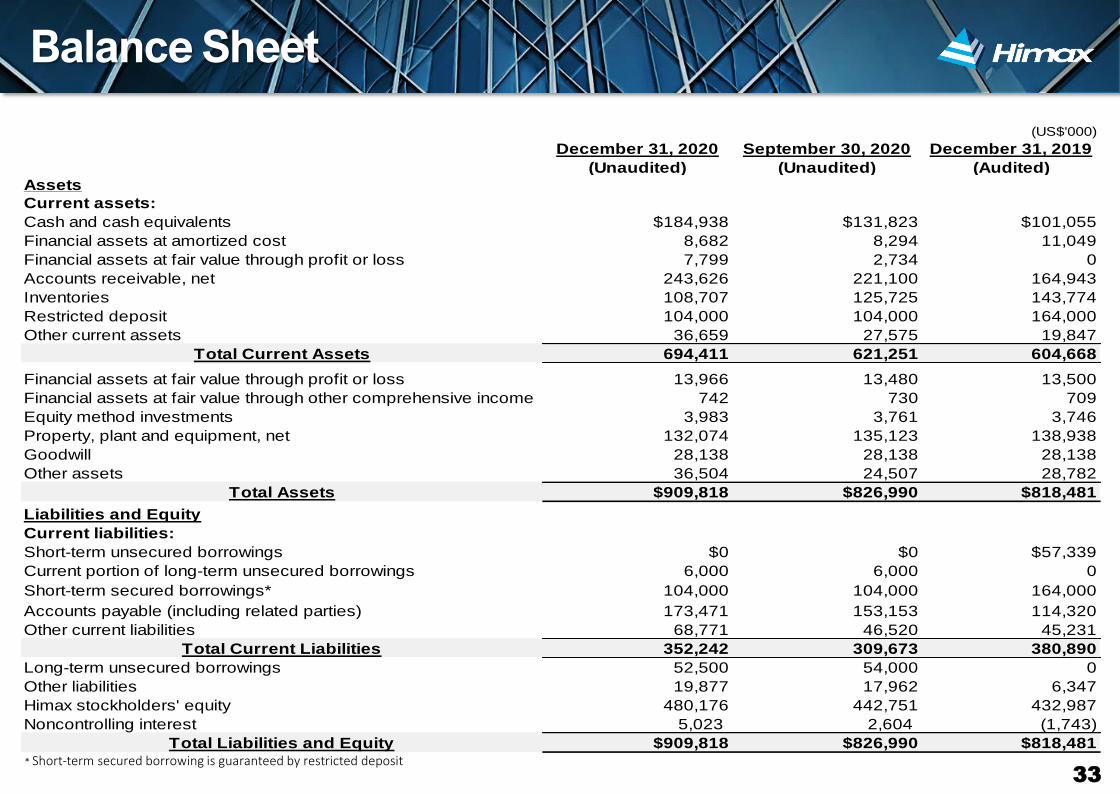
Balance Sheet
33
(US$'000)
December 31, 2020
(Unaudited)
September 30, 2020
(Unaudited)
December 31, 2019
(Audited)Assets
Current assets:
Cash and cash equivalents $184,938 $131,823 $101,055
Financial assets at amortized cost 8,682 8,294 11,049
Financial assets at fair value through profit or loss 7,799 2,734 0
Accounts receivable, net 243,626 221,100 164,943
Inventories 108,707 125,725 143,774
Restricted deposit 104,000 104,000 164,000
Other current assets 36,659 27,575 19,847
Total Current Assets 694,411 621,251 604,668
Financial assets at fair value through profit or loss 13,966 13,480 13,500
Financial assets at fair value through other comprehensive income 742 730 709
Equity method investments 3,983 3,761 3,746
Property, plant and equipment, net 132,074 135,123 138,938
Goodwill 28,138 28,138 28,138
Other assets 36,504 24,507 28,782
Total Assets $909,818 $826,990 $818,481
Liabilities and Equity
Current liabilities:
Short-term unsecured borrowings $0 $0 $57,339
Current portion of long-term unsecured borrowings 6,000 6,000 0
Short-term secured borrowings* 104,000 104,000 164,000
Accounts payable (including related parties) 173,471 153,153 114,320
Other current liabilities 68,771 46,520 45,231
Total Current Liabilities 352,242 309,673 380,890
Long-term unsecured borrowings 52,500 54,000 0
Other liabilities 19,877 17,962 6,347
Himax stockholders' equity 480,176 442,751 432,987
Noncontrolling interest 5,023 2,604 (1,743)
Total Liabilities and Equity $909,818 $826,990 $818,481
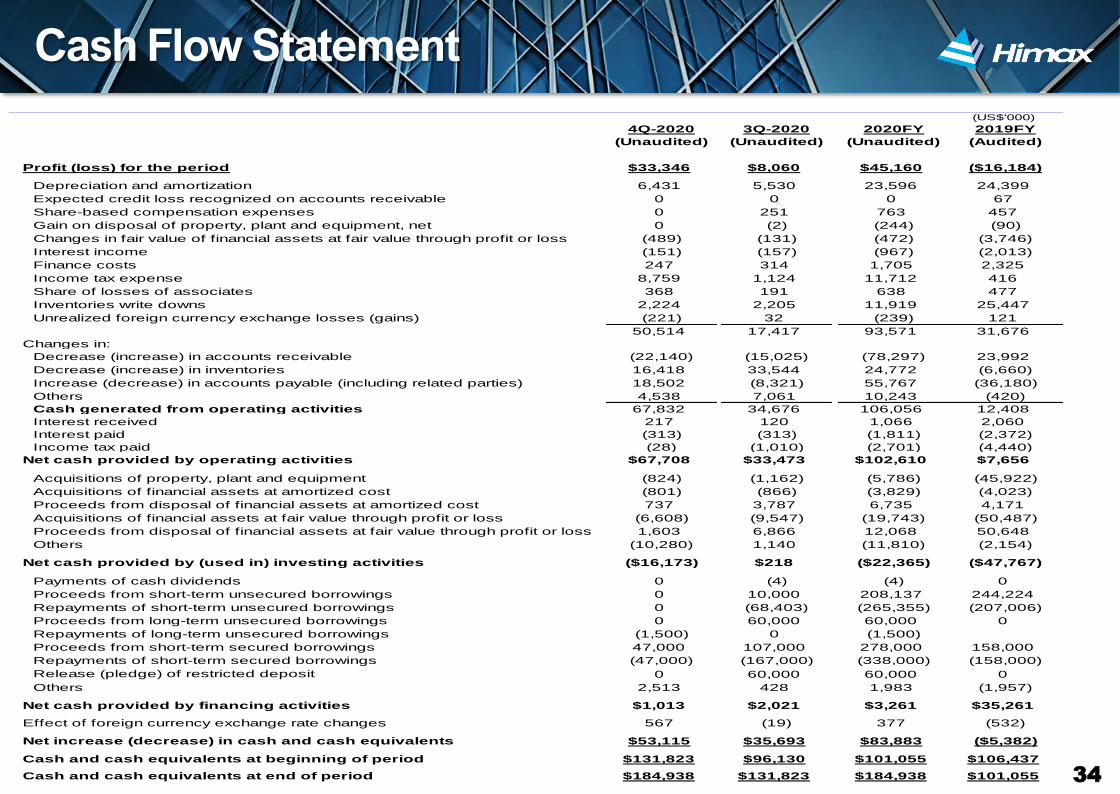
Cash Flow Statement
34
(US$'000)
4Q-2020
(Unaudited)
3Q-2020
(Unaudited)
2020FY
(Unaudited)
2019FY
(Audited)
Profit (loss) for the period $33,346 $8,060 $45,160 ($16,184)
Depreciation and amortization 6,431 5,530 23,596 24,399
Expected credit loss recognized on accounts receivable 0 0 0 67
Share-based compensation expenses 0 251 763 457
Gain on disposal of property, plant and equipment, net 0 (2) (244) (90)
Changes in fair value of financial assets at fair value through profit or loss (489) (131) (472) (3,746)
Interest income (151) (157) (967) (2,013)
Finance costs 247 314 1,705 2,325
Income tax expense 8,759 1,124 11,712 416
Share of losses of associates 368 191 638 477
Inventories write downs 2,224 2,205 11,919 25,447
Unrealized foreign currency exchange losses (gains) (221) 32 (239) 121
50,514 17,417 93,571 31,676
Changes in:
Decrease (increase) in accounts receivable (22,140) (15,025) (78,297) 23,992
Decrease (increase) in inventories 16,418 33,544 24,772 (6,660)
Increase (decrease) in accounts payable (including related parties) 18,502 (8,321) 55,767 (36,180)
Others 4,538 7,061 10,243 (420)
Cash generated from operating activities 67,832 34,676 106,056 12,408
Interest received 217 120 1,066 2,060
Interest paid (313) (313) (1,811) (2,372)
Income tax paid (28) (1,010) (2,701) (4,440)
Net cash provided by operating activities $67,708 $33,473 $102,610 $7,656
Acquisitions of property, plant and equipment (824) (1,162) (5,786) (45,922)
Acquisitions of financial assets at amortized cost (801) (866) (3,829) (4,023)
Proceeds from disposal of financial assets at amortized cost 737 3,787 6,735 4,171
Acquisitions of financial assets at fair value through profit or loss (6,608) (9,547) (19,743) (50,487)
Proceeds from disposal of financial assets at fair value through profit or loss 1,603 6,866 12,068 50,648
Others (10,280) 1,140 (11,810) (2,154)
Net cash provided by (used in) investing activities ($16,173) $218 ($22,365) ($47,767)
Payments of cash dividends 0 (4) (4) 0
Proceeds from short-term unsecured borrowings 0 10,000 208,137 244,224
Repayments of short-term unsecured borrowings 0 (68,403) (265,355) (207,006)
Proceeds from long-term unsecured borrowings 0 60,000 60,000 0
Repayments of long-term unsecured borrowings (1,500) 0 (1,500)
Proceeds from short-term secured borrowings 47,000 107,000 278,000 158,000
Repayments of short-term secured borrowings (47,000) (167,000) (338,000) (158,000)
Release (pledge) of restricted deposit 0 60,000 60,000 0
Others 2,513 428 1,983 (1,957)
Net cash provided by financing activities $1,013 $2,021 $3,261 $35,261
Effect of foreign currency exchange rate changes 567 (19) 377 (532)
Net increase (decrease) in cash and cash equivalents $53,115 $35,693 $83,883 ($5,382)
Cash and cash equivalents at beginning of period $131,823 $96,130 $101,055 $106,437
Cash and cash equivalents at end of period $184,938 $131,823 $184,938 $101,055
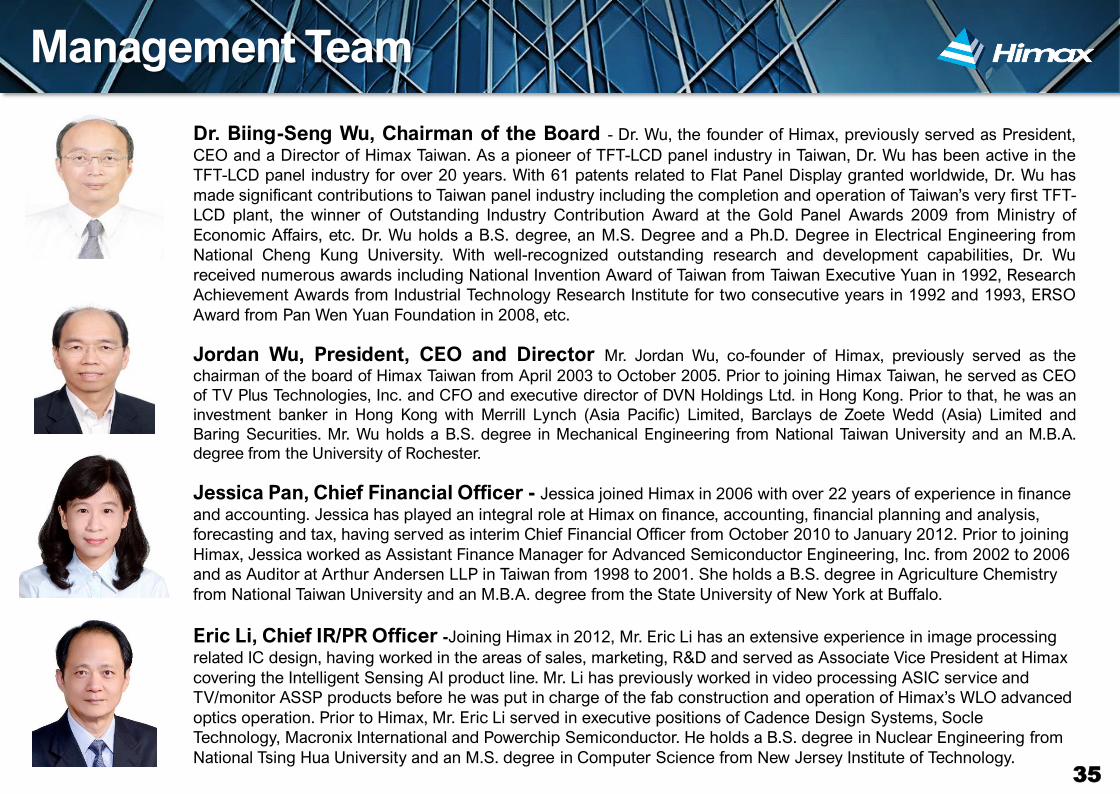
Dr. Biing-Seng Wu, Chairman of the Board - Dr. Wu, the founder of Himax, previously served as President,
CEO and a Director of Himax Taiwan. As a pioneer of TFT-LCD panel industry in Taiwan, Dr. Wu has been active in the
TFT-LCD panel industry for over 20 years. With 61 patents related to Flat Panel Display granted worldwide, Dr. Wu has
made significant contributions to Taiwan panel industry including the completion and operation of Taiwan’s very first TFT-
LCD plant, the winner of Outstanding Industry Contribution Award at the Gold Panel Awards 2009 from Ministry of
Economic Affairs, etc. Dr. Wu holds a B.S. degree, an M.S. Degree and a Ph.D. Degree in Electrical Engineering from
National Cheng Kung University. With well-recognized outstanding research and development capabilities, Dr. Wu
received numerous awards including National Invention Award of Taiwan from Taiwan Executive Yuan in 1992, Research
Achievement Awards from Industrial Technology Research Institute for two consecutive years in 1992 and 1993, ERSO
Award from Pan Wen Yuan Foundation in 2008, etc.
Jordan Wu, President, CEO and Director Mr. Jordan Wu, co-founder of Himax, previously served as the
chairman of the board of Himax Taiwan from April 2003 to October 2005. Prior to joining Himax Taiwan, he served as CEO
of TV Plus Technologies, Inc. and CFO and executive director of DVN Holdings Ltd. in Hong Kong. Prior to that, he was an
investment banker in Hong Kong with Merrill Lynch (Asia Pacific) Limited, Barclays de Zoete Wedd (Asia) Limited and
Baring Securities. Mr. Wu holds a B.S. degree in Mechanical Engineering from National Taiwan University and an M.B.A.
degree from the University of Rochester.
Jessica Pan, Chief Financial Officer - Jessica joined Himax in 2006 with over 22 years of experience in finance
and accounting. Jessica has played an integral role at Himax on finance, accounting, financial planning and analysis,
forecasting and tax, having served as interim Chief Financial Officer from October 2010 to January 2012. Prior to joining
Himax, Jessica worked as Assistant Finance Manager for Advanced Semiconductor Engineering, Inc. from 2002 to 2006
and as Auditor at Arthur Andersen LLP in Taiwan from 1998 to 2001. She holds a B.S. degree in Agriculture Chemistry
from National Taiwan University and an M.B.A. degree from the State University of New York at Buffalo.
Eric Li, Chief IR/PR Officer -Joining Himax in 2012, Mr. Eric Li has an extensive experience in image processing
related IC design, having worked in the areas of sales, marketing, R&D and served as Associate Vice President at Himax
covering the Intelligent Sensing AI product line. Mr. Li has previously worked in video processing ASIC service and
TV/monitor ASSP products before he was put in charge of the fab construction and operation of Himax’s WLO advanced
optics operation. Prior to Himax, Mr. Eric Li served in executive positions of Cadence Design Systems, Socle
Technology, Macronix International and Powerchip Semiconductor. He holds a B.S. degree in Nuclear Engineering from
National Tsing Hua University and an M.S. degree in Computer Science from New Jersey Institute of Technology.
Management Team
35

Eric Li, Chief IR/PR Officer
Tel: +886-6-505-0880
Karen Tiao, IR Relations
Tel: +886-2-2370-3999
Company
Auditor
SEC Legal
Counsel
Corporate
Counsel
Contact Us
36


