Hydrogenation Reactions of CO and CO2 : New Insights through In Situ X-ray Spectroscopy and Chemical Transient Kinetics Experiments on Cobalt Catalysts by Walter Thomas Ralston A dissertation submitted in partial satisfaction of the requirements for the degree of Doctor of Philosophy in Chemistry in the Graduate Division of the University of California, Berkeley Committee in charge: Professor Gabor A. Somorjai, Chair Professor Peidong Yang Professor F. Dean Toste Professor Enrique Iglesia Spring 2017
Transcript
Hydrogenation Reactions of CO and CO2: New Insights through In Situ X-ray Spectroscopy and
Chemical Transient Kinetics Experiments on Cobalt Catalysts
by
Walter Thomas Ralston
A dissertation submitted in partial satisfaction of the
requirements for the degree of
Doctor of Philosophy
in
Chemistry
in the
Graduate Division
of the
University of California, Berkeley
Committee in charge:
Professor Gabor A. Somorjai, Chair Professor Peidong Yang Professor F. Dean Toste Professor Enrique Iglesia
Hydrogenation Reactions of CO and CO2: New Insights through In Situ X-ray Spectroscopy and Chemical Transient Kinetics Experiments on Cobalt Catalysts
by
Walter Thomas Ralston
Doctor of Philosophy in Chemistry
University of California, Berkeley
Professor Gabor A. Somorjai, Chair
The catalytic hydrogenations of CO and CO2 to more useful chemicals is not only beneficial in producing more valuable products and reducing dependence on fossil fuels, but present a scientific challenge in how to control the selectivity of these reactions. Using colloidal chemistry techniques, a high level of control over the synthesis of nanomaterials can be achieved, and by exploiting this fact a simple model system can be realized to understand the reaction of CO and CO2 on a molecular level. Specifically, this dissertation focuses on understanding cobalt materials for the conversion of CO and CO2 into more useful, valuable chemicals.
Colloidally prepared cobalt nanoparticles with a narrow size distribution were supported in mesoporous SiO2 and TiO2 to study the effect of the support on the Co catalyzed hydrogenation of CO and CO2. The 10nm Co/SiO2 and Co/TiO2 catalysts were tested for CO and CO2 hydrogenation at 5 bar with a ratio to hydrogen of 1:2 and 1:3, respectively. In addition, the effect of Co oxidation state was studied by using different reduction pretreatment temperatures (250°C and 450°C). The results showed that for both hydrogenation reactions, Co/TiO2 had a high activity at both reduction temperatures compared to Co/SiO2. However, unlike Co/SiO2 which showed higher activity after 450°C reduction, Co/TiO2 had a higher activity after reduction at 250°C. Through synchrotron x-ray spectroscopy, it was concluded that the TiO2 was wetting the Co particle at higher reduction temperatures and dewetting at lower reduction temperatures. In addition to the wetting, CoO was observed to be the surface species on Co/TiO2 catalyst after reduction at low temperatures, which catalyzed both CO and CO2 hydrogenation reactions with higher activity than the Co metal obtained after reduction at 450°C.
Classical steady-state measurements are limited in so much as they are often unable to provide information on individual reaction steps in complex reaction pathways. To attempt to circumvent this, a chemical transient kinetics (CTK) reactor was designed and built. Verification of the reactor was performed by evaluating a catalyst from the literature and confirming the results. A CoMgO catalyst was used to accomplish this, and our original findings show that at short time scales steric hindrances at the surface may push the product distribution towards olefinic rather than branched compounds.
2
Continuing work on the CTK, two distinct particle sizes of Co nanoparticles were synthesized and tested under atmospheric conditions (H2:CO = 2:1) on the transient reactor. 4.3 nm Co and 9.5 nm Co were supported on MCF-17 to study the previously observed size effect, where Co nanoparticles lose activity at smaller sizes. It was found that indeed, the 4.3 nm Co are less active because they contain less CO dissociation sites, which are necessary for populating the surface with carbon monomers and spurring subsequent chain growth. The specific CO dissociation site was identified as the Co (221) step, of which larger Co particles have more and smaller Co particles have less. To continue investigating Co for CO2 hydrogenation, a series of catalysts was prepared which showed very interesting results. Co nanoparticles were not very active for the conversion of CO2, however, mesoporous cobalt oxide (Co3O4) exhibits an extremely high activity. When MnO nanoparticles, which selectively produce CO from CO2, are added to mesoporous Co3O4, the activity of the combined MnO/Co3O4 catalyst is greater than the sum of components. In addition, this catalyst produces methanol at much milder conditions (250°C 5 bar). Ex situ characterization determined the interfacial architecture of MnOx / CoOx / Co played a key role in determining the product selectivity, with methanol and ethylene being produced at a yield of ~0.4 s-1 and 0.08 s-1.
To investigate the nature of the MnO / Co3O4 interface, an in situ study using synchrotron radiation was undertaken. A sample of 6nm MnO nanoparticles loaded on mesoporous Co3O4 was studied with ambient pressure x-ray photoelectron spectroscopy, soft x-ray absorption spectroscopy at the Mn and Co L edges, and scanning transmission x-ray microscopy. X-ray measurements show that under reducing conditions of CO + H2, the MnO nanoparticles wet the Co surface until it is completely covered by a layer of MnO. Through the combination of techniques, it is shown that the system is catalytic active at the low pressures studied, and that the nature of the interface between MnO and Co3O4 is highly dependent on the temperature and gaseous environment it is prepared in.
Chapter 3 – Evidence of Highly Active Cobalt Oxide Catalyst for the Fischer-Tropsch Synthesis and CO2 Hydrogenation ................................................................. 21
Chapter 4 – Time Resolved (2s) Study of the Initial Steps of the Catalytic Hydrogenation of CO: From Branched Isomers to Unsaturated Molecules............. 33
Chapter 5 – Evidence of Structure Sensitivity in the Fischer-Tropsch Reaction on Model Cobalt Nanoparticles by Time-Resolved Chemical Transient Kinetics ......... 44
Chapter 7 – Soft X-ray Spectroscopy Studies of Adsorption and Reaction of CO in the Presence of H2 over 6nm MnO Nanoparticles Supported on Mesoporous Co3O4
Acknowledgments The research contained within this dissertation was supported by the U.S. Department of Energy, Office of Science, Office of Basic Energy Sciences, Chemical Sciences, Geosciences, and Biosciences Division, under contract DE-AC02-05CH11231.
I would like to thank Professor Gabor Somorjai for giving me the opportunity to work in his group and for providing research direction. His guidance extended to navigating the academic and industrial science world in addition to research. I would like to specifically thank Professor Somorjai for allowing me to pursue a variety of techniques while I was a graduate student, such that I was able to approach problems from many angles simultaneously. From my first project fixing the UHV chamber, getting a carbon-free Auger spectrum and LEED patterns on a single crystal, to designing in situ cells and running transient kinetic reactors, I have truly learned quite a lot in my time at UC Berkeley and Lawrence Berkeley National Lab.
During my time in the Somorjai group, I was taught by many people and I would like to thank the entire group from 2012 – 2017 for their help. Specifically, I would not be the scientist I am today without the instruction and guidance of Dr. Gerome Melaet and Dr. Selim Alayoglu - I am gratefully indebted to both of you. Our nights spent at the synchrotron were much more fun when we did the projects together.
In addition, I had a lot of fun with Wenchi Liu on Team W, the late night catalysis
subgroup meetings with Nate Musselwhite and Gerome Melaet, officemate Griffin Kennedy, and pool parties with the boys (Christophe Deraedt and Ji Su) – these made my graduate experience much more enjoyable. Last but not least, thanks to Yonatan Horowitz who always provided me with valuable advice and insight over beers.
An unexpected source of inspiration and encouragement came from the
undergraduate students working on research projects with me: Sujude Dalieh, Tommy Saephan, Alexis Flores-Betancourt, Danae Roberts, and Martin Liu. For teaching me to stop talking so much, thank you!
My acknowledgements would not be complete without Michelle Leuenberger. It
was tremendously beneficial to have a partner who understood what I was going through and I am very appreciative for all her support and patience. Thank you for putting up with me and many late nights!
Finally, my parents and my sisters, for being supportive and loving while I have
Almost everything in the world around us has at some point visited a catalyst or catalytic surface. From materials that accelerate and control the growth of polymer chains (plastics) to enzymes, which are biological catalysts inside living things, catalysts are very important to humanity[1]. Examples that most people are familiar with include the catalytic converter, used for cleaning automobile emissions, the Haber process, to synthesize ammonia, and the petroleum refining industry as a whole. With the growing energy demands of the world’s increasing population, catalysts and their efficient use will become even more important to meet the energy demands in an environmentally friendly way.
Catalysts take a variety of shapes and form. A catalyst in the same phase as the reactant molecule is called a homogeneous catalyst, and alternatively a heterogeneous catalyst is in a different phase than the reactant – typically gas phase reactants with a solid catalyst. In general, there are several criteria for determining a catalyst’s applicability for a given reaction. The activity of a given catalyst is a measure of how fast that catalyst converts the reactant into a product, and is most often defined by a turnover frequency (TOF). The TOF represents the number of turnovers, or reaction events, per active site per second. A second criteria for evaluating a catalyst’s performance is the selectivity. A catalyst’s selectivity is a description of what products the catalyst will preferentially form at a given condition. In addition, a catalyst that is used in the real world must be stable, such that the catalyst can be used for a long period of time before it must be replaced. Ideally, for a given process these three criteria can be maximized for the desired product output by choice of appropriate catalyst material and operating parameters.
To fully optimize a catalyst material, it is important to know what is happening on the surface – where the reaction is taking place. Surface science studies have investigated single crystal metals to obtain a molecular-level understanding of the surface of catalytic materials[2]; however, the experiments were mostly conducted under ultra-high vacuum (UHV). The single crystal surfaces under UHV present a model surface to study as the complexity of the system has been reduced to a few variables; however, these experiments are far from the conditions a functioning industrial catalyst would experience[3]. Building on classical surface science model systems, the use of colloidally prepared nanoparticles with a controlled size, shape, and composition present a model system[4,5] that is well characterized and can better replicate an industrial catalyst. This thesis uses nanoparticle systems as model catalysts to understand the effects of nanoparticle size and supporting material on the catalytic reaction – specifically hydrogenation reactions of CO and CO2.
2
1.2 Fischer-Tropsch The Fischer-Tropsch (FT) synthesis reaction was realized in the early 1900’s[6] for
the production of long chain hydrocarbons, or wax, from carbon monoxide and hydrogen (called synthesis gas). Iron, cobalt, and ruthenium[7,8] are common materials used to catalyze the reaction. The FT process is a valuable reaction for the production of fuels and chemicals, offering an alternative to crude oil for obtaining hydrocarbons. In addition, a variety of feedstock sources such as biomass[9], natural gas[10], or coal[11] can be used to produce the synthesis gas. Currently, industrial-scale FT processes occur in a variety of countries[8] with production exceeding hundreds of thousands of barrels per day[12].
Although the FT process is used industrially, the specific details of how the reaction proceeds are not well understood[13]. Scientifically, the mechanisms of both CO dissociation and C-C bond formation remain unclear[14]; the nature of the surface sites responsible for CO bond cleavage or C-C bond formation are unknown; and reasons why the catalyst surface deactivates over time are still uncertain. Similarities exist between the different catalysts used - CO activation on cobalt[15], iron[16], and ruthenium[17] catalysts has been shown computationally to be much more likely to occur via a hydrogen assisted route where H addition to the adsorbed CO species occurs before the C-O bond cleavage. The selectivity patterns of most FT catalysts are similar, producing mainly linear alkanes with alpha-olefin or beta-methyl branched products[8]. Differences between the catalyst materials have also been observed – Fe catalysts have been shown to have an Fe5C2
[18,19] active phase, whereas metallic Co and Ru[20–22] have been shown to be the active phase for FT. This dissertation focuses on understanding Co catalysts for the FT reaction.
Co catalysts are typically used for their higher selectivity to alkanes at slightly lower temperatures than Fe catalysts. The mechanistic details of the reaction and the mechanism of deactivation of Co catalysts remains under debate. Numerous experimental studies[23–25] have shown a dependence on the activity of Co catalysts based on their size – with smaller nanoparticles having a lower activity. This is contrary to intuition, as smaller nanoparticles are thought to be more reactive, having a higher concentration[26] of atoms with undercoordinated bonds. 1.3 CO2 Hydrogenation
The reduction of CO2 presents another challenge for heterogeneous catalysts[27]. With fossil fuels dominant in the energy sector, the conversion of CO2 into more valuable products is a practical route for reducing emissions[28,29]. The reaction of CO2 with H2 can produce different types of products: CO through the reverse water gas shift (RWGS), hydrocarbons through CO2 reduction combined with subsequent FT reaction, and finally selective hydrogenation to methanol. Each of these present various advantages but also require further improvements to become economically sustainable.
The RWGS reaction is useful as the CO produced can be used downstream in methanol (MeOH) synthesis and also for FT synthesis[27]. The drawback to this route is that RWGS is endothermic, requiring high temperatures, and that the conversion is equilibrium limited[30]. Selective hydrogenation of CO2 to methanol is advantageous in that it can be directly utilized as a fuel additive and is a feedstock for many commodity chemicals[31]. Active areas of investigation in CO2 conversion include the formulation of a catalyst which can catalyze both RWGS and subsequent methanol synthesis or subsequent FT chain growth; lower pressure, lower temperature catalysts; and catalysts
3
requiring less reactant hydrogen. Carbon free sources of hydrogen[32] are needed to make this technology economically and environmentally useful, as most of the hydrogen used to hydrogenate the CO2 has been produced from carbon sources.
1.4 Summary of Dissertation The experimental methods utilized in this dissertation are discussed in Chapter 2.
The details of the material synthesis, characterization, and catalytic measurements are covered. The material synthesis covers the procedures for preparing size controlled Co and Mn nanoparticles and preparing a variety of mesoporous oxides for use as a support. An overview of the characterization methods of the synthesized materials, both ex situ and in situ, are discussed next. Finally, a description of the catalytic reactors is given.
Chapters 3, 4, and 5 investigate Co catalyzed FT. The support dependence of 10 nm Co particles on SiO2 and TiO2 for both steady-state FT and CO2 reactions was studied in Chapter 3, and the effect of Co particle size for the FT reaction was studied with a transient kinetics reactor in Chapter 5. Chapter 4 is devoted to the characterization of the transient reactor by comparison with a Co catalyst from literature to establish the performance of the reactor.
Chapters 6 and 7 examine the reaction of CO2 on structured mesoporous Co oxides loaded with MnO nanoparticles. This specific system was found to have exceptionally high activity for hydrogenation of CO2. Chapter 6 investigates the catalytic performance of the various components, finding that the MnO nanoparticles and Co3O4 support have a synergistic effect when combined, giving an activity higher than the sum of the individual components. Chapter 7 takes a closer look at the MnO / Co3O4 catalyst under reducing conditions, to understand why this material is so active. A combination of synchrotron spectroscopy and ex-situ spectromicroscopy shows that the MnO nanoparticle completely wets the Co surface, creating a MnO overlayer on the catalyst under low-pressure working conditions.
1.5 References [1] I. Chorkendorff, J. W. Niemantsverdiret, Concepts of Modern Catalysis, Wiley-
VCH GmbH & Co. KGaA, Weinheim, 2003. [2] G. A. Somorjai, Y. Li, Introduction to Surface Chemistry and Catalysis, John
Wiley & Sons, Inc., Hoboken, New Jersey, 2010. [3] H. J. Freund, H. Kuhlenbeck, J. Libuda, G. Rupprechter, M. Baumer, H. Hamann,
Top. Catal. 2001, 15, 201–209. [4] F. (Feng) Tao, Ed. , Metal Nanoparticles for Catalysis, Royal Society Of
Chemistry, Cambridge, 2014. [5] K. An, S. Alayoglu, T. Ewers, G. A. Somorjai, J. Colloid Interface Sci. 2012, 373,
1–13. [6] R. B. Anderson, The Fischer-Tropsch Synthesis, Academic Press, 1984. [7] M. E. Dry, Appl. Catal. A Gen. 1996, 138, 319–344.
4
[8] M. E. Dry, Catal. Today 2002, 71, 227–241. [9] G. W. Huber, S. Iborra, A. Corma, Chem. Rev. 2006, 106, 4044–4098. [10] M. a. Pena, J. P. Gómez, J. L. G. Fierro, Appl. Catal. A Gen. 1996, 144, 7–57. [11] I. Wender, Fuel Process. Technol. 1996, 48, 189–297. [12] California Energy Commission: GTL Working Group Analysis, Sacramento, CA,
2004. [13] D. D. Eley, H. Pines, P. B. Weisz, Advances in Catalysis. Volume 30, Academic
Press, New York ;;London :, 1981. [14] R. A. Van Santen, I. M. Ciobica, E. Van Steen, M. M. Ghouri, Mechanistic Issues
in Fischer-Tropsch Catalysis, 2011. [15] O. R. Inderwildi, S. J. Jenkins, D. A. King, 2008, 1305–1307. [16] M. Ojeda, R. Nabar, A. U. Nilekar, A. Ishikawa, M. Mavrikakis, E. Iglesia, J.
Catal. 2010, 272, 287–297. [17] B. T. Loveless, C. Buda, M. Neurock, E. Iglesia, J. Am. Chem. Soc. 2013, 135,
6107–6121. [18] H. H. Podgurski, J. T. Kummer, T. W. DeWitt, P. H. Emmett, J. Am. Chem. Soc.
1950, 72, 5382–5388. [19] B. H. Davis, Catal. Today 2009, 141, 25–33. [20] D. L. King, J. Catal. 1978, 51, 386–397. [21] E. Iglesia, S. L. Soled, R. A. Fiato, J. Catal. 1992, 137, 212–224. [22] E. Iglesia, Appl. Catal. A Gen. 1997, 161, 59–78. [23] G. L. Bezemer, J. H. Bitter, H. P. C. E. Kuipers, H. Oosterbeek, J. E. Holewijn, X.
Xu, F. Kapteijn, A. J. Van Dillen, K. P. de Jong, J. Am. Chem. Soc. 2006, 128, 3956–3964.
[24] G. Melaet, A. E. Lindeman, G. a. Somorjai, Top. Catal. 2013, 57, 500–507. [25] J. Yang, E. Z. Tveten, D. Chen, A. Holmen, 2010, 228, 16558–16567. [26] R. Van Hardeveld, F. Hartog, Surf. Sci. 1969, 15, 189–230. [27] M. D. Porosoff, B. Yan, J. G. Chen, Energy Environ. Sci. 2015, 2, 303. [28] G. A. Olah, A. Goeppert, G. K. S. Prakash, J. Org. Chem. 2009, 74, 487–498. [29] G. A. Olah, A. Goeppert, G. K. S. Prakash, Beyond Oil and Gas: The Methanol
Economy, Wiley-VCH, 2005. [30] A. Wolf, A. Jess, C. Kern, Chem. Eng. Technol. 2016, 39, 1040–1048. [31] L. Bromberg, W. K. Cheng, Methanol as an Alternative Transportation Fuel in the
U.S.: Options for Sustainable and Energy-Secure Transportation, 2010. [32] N. Z. Muradov, T. N. Veziroǧlu, Int. J. Hydrogen Energy 2008, 33, 6804–6839.
5
Chapter 2 – Experimental Abstract This chapter provides an overview of the variety of experimental techniques utilized in this dissertation. First, the synthetic chemistry methods used to produce nanoparticles and mesoporous oxide supports is given. Details about the characterization instrumentation used to investigate the synthesized catalyst’s morphology, chemical composition, and surface structures under reaction conditions is provided, along with a brief description of the synchrotron spectroscopy conducted. Finally, a description of the home-built reactor systems with operating parameters and typical procedures.
6
2.1 Colloidal Synthesis of Nanoparticles The primary method of nanoparticle synthesis used in this work is by thermal
decomposition. Through a well-controlled decomposition of the precursor material, both Co and Mn nanoparticles of various sizes can be formed. The synthesis of both Co[1] and Mn[2] nanoparticles is described below.
Oleic acid capped cobalt nanoparticles were prepared via thermal decomposition of the Co2(CO)8 precursor. First, oleic acid is added to a 250mL round bottom flask connected to a condenser and a bump tramp and purged on a Schlenk line. 12 mL anhydrous o-dichlorbenzene is added to the reaction flask under Ar, and heated under inert atmosphere to a temperature between 160 – 171°C. The reaction temperature should be stable, as it determines the initial nucleation of the Co nanoparticles. Lower reaction temperature produces larger particles, while the highest reaction temperature (171°C – the boiling point of DCB) produces approximately 3 nm Co particles.
Once the temperature of the DCB has stabilized, 200mg Co2(CO)8 dissolved in 3mL anhydrous DCB is quickly injected into the reaction flask and the mixture is allowed to react for 20 minutes. After 20 minutes, the mixture is quickly cooled by the injection of another 12mL DCB and use of a fan to remove as much heat as possible. The resulting Co nanoparticles are precipitated from solution by the addition of ethanol, collected by centrifugation, and stored in chloroform for later use.
MnO nanoparticles are synthesized in two steps: first the preparation of a Mn-oleate precursor, and second the decomposition of the Mn-oleate precursor to form MnO nanoparticles.
To synthesize Mn-oleate[3] , MnCl2 · 4H2O and sodium oleate are mixed in a 1:2 molar ratio of Mn:Na in a solution of ethanol, deionized water, and n-hexane (1:1:2 by volume) at 70°C. The mixture is stirred for 4 hours, after which the organic phase was collected and the aqueous phase was discarded by separation funnel. The Mn-oleate salt was collected by using a rotary evaporator to remove the hexanes producing a reddish – purple solid.
The MnO nanoparticles are synthesized by decomposing the Mn-oleate precursor in octadecene. In a typical synthesis, 1.2 g Mn-oleate is dissolved in 10 g octadecene in a 50mL round bottom flask. The solution is degassed at 70°C and purged with Ar. Once the solution has been degassed and purged, the temperature is ramped to 320°C over one hour and refluxed for 10 minutes, after which the solution is quickly cooled to room temperature. The MnO nanoparticles are precipitated by addition of acetone, collected by centrifugation, and stored in chloroform for further use. To control the size of the MnO nanoparticles, various additional fatty acids[4] can be added to the starting solution to help control the size distribution.
2.2 Mesoporous Oxides Synthesis Mesoporous silica was used as a supporting material, as it is inert for the reactions
studied here. Mesocellular Foam-17 (MCF-17)[5] provides advantages in that it has a larger porous size than other silica materials, allowing for use of larger sized nanoparticles – specifically 10nm Co nanparticles. A general synthesis of MCF-17, used to make the oxide support material in this thesis, is given below. Pluronic 123 (polyethylene oxide – block polypropylene oxide – block polyethylene oxide) with a molecular weight Mw = ∼5800 Da along with 1,3,5
7
trimethylbenzene and concentrated HCL are added to deionized water. The solution was stirred for 4 hours while heating at 40°C. Tetraethoxysilane was added dropwise to the solution while stirring, and the solution was allowed to age at 40°C for 20 hours without stirring, following by the addition of NH4F. The solution was hydrothermally aged for 24 hours at 100°C. The resulting precipitate was filtered and washed with ethanol and water to remove excess polymer. As a final step, the precipitate was calcined at 550°C for 6 hours in air. In addition to MCF-17, KIT-6[6] was synthesized to use a hard template for producing porous metal oxides. For the typical synthesis of KIT-6, 27 g of P123 (Mw = ∼5800) and 43.5 ml of concentrated HCl were dissolved in 980 ml of water. Then, 33.3 ml of n-butanol was added to the solution at 35 °C with vigorous stirring. After 1 h of stirring, 58 g of tetraethoxysilane was added to the solution followed by stirring at 35 °C for 24 h. The mixture was reacted hydrothermally at 40 °C overnight. The filtered solid was dried and calcined at 550 °C for 6 h.
The pores of KIT-6 are actually interconnected[7] which allow use of the KIT-6 as an inverse templating structure. By filling the pores of the KIT-6 structure with a metal oxide precursor, one can obtain a metal oxide structure which is the inverse of the KIT-6 structure[7]. The procedure for producing these kinds of mesoporous metal oxides is given below.
To prepare mesoporous Co3O4 or MnO2[8], 4.7 g of cobalt (II) nitrate hexahydrate
(Co(NO3)2·6H2O, Sigma-Aldrich, 98%) or 4.0 g of manganese (II) nitrate tetrahydrate (Mn(NO3)2·4H2O, Sigma-Aldrich, 97%) dissolved in 8 mL of water was mixed with 4 g of KIT-6 and 50 mL of toluene at 65 °C. After evaporating the toluene and water, the solid was collected and calcined at 300 °C for 6 h in air. Then, 2 M NaOH aqueous solution at 60 °C was added to the solid and the solution was shaken to dissolve the silica template. After centrifugation, the precipitate was washed with deionized water. The washing with the NaOH solution and deionized water was repeated three times to remove the silica template completely. Mesoporous Co3O4 or MnO2 replicas were obtained after three cycles of centrifugation and drying.
As a variation on the hard template strategy, macroporous TiO2 was prepared via a polymer templating strategy.[9] The polystyrene beads, utilized as the polymer template, were synthesized through an emulsifier-free emulsion polymerization technique.[10] Briefly, 14 g of styrene monomer and 0.7 g of divinylbenzene (a crosslinker) were washed 4 times with 0.1 M NaOH solution and with DI water to remove inhibitors. The mixture of styrene and divinylbenzene was then stirred in 140 mL of DI water at 70 oC, followed by purging under Ar flow for 1 h. Finally, potassium persulfate (0.03 g, 1.0M) was added as an initiator for the polymerization. After reacting at 70 oC for 12 h, the polystyrene beads with an average diameter of 500 nm were collected by centrifugation at 4300 rpm.
Next 20 mmol of titanium isopropoxide is added (Sigma-Aldrich, 97%) to P123 dissolved in ethanol and HCl. The combined solution was stirred for 5 h after which the dried polystyrene beads (4 g) was added. The solvent was evaporated at 60 °C for 48 h, and the resulting flakes were calcined at 700 °C in air for 6 h. After calcination, highly crystalline macroporous TiO2 with an average pore size of 300 nm was obtained.
8
2.3 Characterization 2.3.1 ICP-AES To determine loading of nanoparticles on various supporting oxides, inductively
coupled plasma atomic emission spectroscopy (ICP-AES) was used. The ICP-AES equipment (Perkin-Elmer ICP Optima 7000 DV) uses an Ar plasma to excite the ionized sample of interest, generating element-specific emission lines. The intensity of the emission lines is related to the concentration of the element in the sample. In a given analysis, 10-20mg of supported catalyst is dissolved in acid, diluted with water, and centrifuged to ensure any remaining particulates are not introduced into the instrument. A set of standards of known concentrations are used to first construct a calibration curve on the instrument, after which the sample of interest is run.
2.3.2 Scanning and Transmission Electron Microscopes Transmission electron microscopy (TEM) is used in this thesis for imaging
nanomaterials to determine their size and shapes. In short, a high energy electron beam is focused onto a thin sample, and the transmitted electrons are imaged with a CCD camera. Many processes are occurring simultaneously when the electron beam hits the sample and these are illustrated in Figure 2–1 below. In addition, the TEM can be used in a direct imaging mode (bright field), whereby the transmitted beam is imaged by the CCD; or in an indirect mode (dark field) where only a diffracted beam is recorded. Bright field TEM gives “classical” microscopy images – the background is bright, with the sample being dark. Dark field TEM is the inverse – the background is dark, while features that scatter strongly are brighter. The differences between BF and DF can be seen in Figure 2–2. Most images are taken in the bright field mode, but dark field is good for imaging amorphous oxides with supported crystalline nanoparticles.
9
Figure 2 - 1. They variety of processes occurring when the incident electron beam (E0) strikes a thin sample surface. The majority of electrons pass through (unscattered electrons) while some are diffracted (elastically scattered) and a minor number contribute to back scattering, secondary electron processes, and photon creation.
Figure 2 - 2. The two different modes of obtaining an image on the CCD camera in TEM; a bright field (BF) image, where the unscattered beam goes to the detector; or a dark field (DF) image, where the incident beam is blocked and only a scattered/diffracted beam is imaged on the detector.
Within the two methods of forming an image, contrast is mainly obtained in the TEM by changes in the amplitude or phase of the incident electron wave. Amplitude contrast arises from differences in mass or thickness, because an area of sample that is
10
thicker will scatter more electrons than a thinner area. Alternatively, an area of the sample containing a denser material (more mass) will also scatter more electrons than an area of the sample with less dense material. So called Z-contrast refers to the fact that heavier elements will scatter electrons more, thus making heavier elements appear darker in classical bright field TEM images. Phase contrast is due to interferences between different electron waves travelling through the sample. This method of contrast generation often provides “fringes” – spaced contrast oscillations. The easiest way to conceptualize the phase contrast process is to consider the electron beam hitting a sample and producing two waves – one wave which has not interacted with sample, and one wave which has been scattered to angle Θ. When the objective lens in the TEM (electrostatic lens which provides the magnification power of the TEM) recombines the two waves in the image plane, the waves can add either constructively or destructively and produce characteristic spacing patterns (fringes) based on the sample. Phase contrast imaging is closely associated with high resolution TEM (HRTEM) but not limited to it.
Specific TEM instrumentation used in this thesis include a Hitachi 7200 (120kV) and a JEOL JEM 2100F (200kV) with both a Gatan Orius and Tridiem. Samples were prepared by sonication in ethanol, isopropanol, or chloroform and dropcast onto TEM grids (Ted Pella – carbon film on Cu grids, ultrathin carbon film on holey carbon). STEM/EDS measurements were also performed with this microscope, with probe size of 1 or 1.5 nm, with the sample tilted 15° to the detector.
Similar to the transmission electron microscope is the scanning electron microscope (SEM). The SEM is also used to image nanomaterials, but in a different way than the TEM. The SEM is designed to focus an electron beam into a very small spot and raster this spot across the surface. An image is formed by detecting either back-scattered electron (BSE) or secondary electron (SE) intensity as a function of pixel position on the raster map. The SEM does not require thin samples and can image the surface of a bulk material. This feature makes the SEM ideal for studying nanoparticles on thin films for spectroscopy studies requiring flat samples.
2.3.3 Energy Dispersive X-ray Spectroscopy One capability the TEM and SEM are lacking is chemical identification – the
images these microscopes form do not tell us what elements are there. However, when the incident beam hits the sample, electrons in the sample are excited and when these excited electrons relax back to their initial state, a photon is given off with an energy equal to the electronic transition. Thus characteristic x-ray emission lines are produced when the TEM and SEM beams hit the sample. By placing a detector inside the microscope chamber to detect these x-rays, information about the elemental composition of the sample can be obtained. In practice, a Si detector is able to separate and distinguish between the various x-ray emission lines being produced and can generate a map in the same way the SEM scans the sample and maps an intensity profile, the EDS can produce an elemental composition map.
11
2.3.4 X-ray Photoelectron Spectroscopy Opposite to the process of X-ray creation in EDS, X-ray photoelectron
spectroscopy (XPS) uses incident X-rays to excite and measure the electrons from various inner orbital shells. XPS relies on the photoelectric effect, in which electrons are emitted by a material upon absorbing incident photons with enough energy. The process is illustrated in Figure 2–3. By measuring the kinetic energies of the ejected electrons, the binding energy of that electron can be determined through the relation:
Where Ephoton is the energy of the incident photon, Ekinetic is the kinetic energy of the ejected electron, and 𝜙𝜙𝑊𝑊𝑊𝑊 is the work function. The binding energies are characteristic of each element, and are also sensitive to the specific environment the element is in.
Figure 2 - 3. Schematic of the x-ray photoemission process. An incident x-ray excited the 1s electron (K shell) with enough energy to eject it from the surface. The energy difference between the K shell and the Fermi level is defined as the binding energy. By conservation of energy (Equation 2), the incident x-ray photon (blue) transfers its energy to the K shell electron (red). The final energy of the ejected electron can be separated into the separate components (green) to determine the binding energy. In reality, the picture is more complicated as the work function is related to the difference between the sample and detector.
In order to measure the kinetic energies of all the ejected electrons, an electron energy analyzer is used. The electron energy analyzer first filters the incoming electrons to a specified pass energy in the lens system, at which point the electrons are passed to an electrostatic hemispherical analyzer. The hemispherical analyzer keeps a specific electric potential (related to the pass energy) between two concentric hemispheres with different radii, effectively dispersing the electrons by kinetic energy such that electrons which are faster or slower than the desired energy miss the detector at the end of the analyzer. The hemispherical energy analyzer is shown in Figure 2–4.
Figure 2 - 4. Hemispherical electron energy analyzer used to separate the various kinetic energy electrons created during an XPS measurement. The inner and outer hemispheres are shown with diameters a and b respectively.
Due to the nature of having to collect ejected electrons with a specific energy, the measurements are typically restricted to ultra-high vacuum as the electrons must travel to the detector without losing any energy to collisions with gas phase molecules. Thus the electrons can undergo elastic collisions, but must not undergo any inelastic collisions before reaching the detector. Electrons having low kinetic energies have a short inelastic mean free path, meaning they do not travel far before undergoing an inelastic collision in which they lose energy. Figure 2–5 illustrates this by showing the “universal curve” – the relationship between electron kinetic energy and mean free path. This fact explains the surface sensitivity of XPS measurements because the electrons only escape the top few nanometers of the surface.
13
Figure 2 - 5. “Universal curve” demonstrating the ‘universal’ relation between electron kinetic energy and the mean free path through a given solid material[11].
2.3.5 X-ray Diffraction X-rays diffraction (XRD) provides a way to identify and measure crystalline
materials. The basis of this technique relies on the ability of a crystalline material to scatter an incident beam of x-rays. The Bragg criterion (Equation 2-2) defines the relationship between the wavelength of the incident x-ray beam and the angles the material will scatter the beam to. By measuring the intensity and position of the various diffracted beams the structure and ordering of a material can be determined. In this thesis, XRD is used mainly for identification of crystalline phases by comparison with a database.
Equation 2-2 is known as Bragg’s Law, with 𝜆𝜆 = wavelength of the incident x-ray; 𝑑𝑑 = separation between the scattering planes; 𝜃𝜃 = angle between surface and incident beam; and n = a positive integer value.
2.3.6 Synchrotron Spectroscopy Lawrence Berkeley National Laboratory houses the Advanced Light Source (ALS)
a 1.9 GeV synchrotron ring producing high intensity x-ray beams. The work in this thesis used a variety of different end stations at the ALS including BL 6.3.1.2, 7.0.1, 8.0.1 (soft x-ray XAS); 10.3.2 (hard x-ray XAS); BL 9.3.2 and 11.0.1 (AP-XPS), and BL 12.2.2 (XRD). The advantage of using a synchrotron is that many of the observations require a very intense source of x-rays; in addition, the ALS provides an energy tunable source of x-rays so that experiments requiring a broad energy range can be accommodated. Below
𝑛𝑛 𝜆𝜆 = 2 𝑑𝑑 sin 𝜃𝜃 Eq. 2–2
14
are techniques that typically require synchrotron radiation or which have specialized applications using synchrotron radiation.
The synchrotron also makes available ambient-pressure XPS (AP-XPS) through a more sophisticated experimental apparatus in combination with the high x-ray flux. As discussed previously, electrons undergoing collisions in the gas phase decrease the signal obtained by XPS; thus measurements must be made in UHV. To overcome this issue and measure samples under more realistic pressures, there are two possible solutions: the first is to increase the number of ejected electrons (more signal) to overcome the loss, and the second is to limit the high pressure path length the electron must travel through to get to the detector. Both of these solutions are utilized to obtain XPS spectra under gas conditions on the order of 1 mbar (~1 torr). The synchrotron produces a high intensity x-ray beam while the electron energy analyzer is differentially pumped to maximize the electron throughput at high pressures. A schematic of the AP-XPS differentially pumped chambers is given in Figure 2–6.
Figure 2 - 6. Schematic the differentially pumped chamber for AP-XPS measurements. The pressure continually decreases in the order of P0 > P1 > P2 > P3 > analyzer such that the number of electrons which pass through each stage is maximized.
2.3.7 X-ray Absorption X-ray absorption spectroscopy (XAS) is a spectroscopic technique that probes the
electronic structure of a material. A tunable x-ray source is scanned across element specific absorption edges – corresponding to 1s (K edge) or 2s/2p (L edge) electronic transitions. The transmitted beam can be detected (transmission detection) but also the
15
electrons ejected during this process can be measured, as well as photons generated by the relaxation of electrons to fill unoccupied holes. These processes are illustrated in Figures 2–7 and their corresponding experimental measurements are called electron yield and fluorescence yield, respectively.
Figure 2 - 7. Processes occurring during an XAS experiment; the left panel shows how tuning the x-ray energy will eventually sweep across an absorption resonance (blue arrow matched to the top energy state) and show an increased absorption. The right panel shows how the core-hole left over from the excitation can be filled by an electron relaxing from a higher energy state – this process releases a photon based on the energy difference between the initial and final state.
Depending on the element and the edge under investigation, the energy of the x-ray can be between 50 – 50keV. X-rays having lower energies (called soft x-rays – less than 1000eV) suffer much higher attenuation as they traverse through almost all matter, making measurements of elements like C, N, and O difficult – as they have absorption edges of 285, 405, and 535 eV respectively. To overcome these problems, XAS measurements using soft x-rays are carried out in ultra-high vacuum, similar to the XPS measurements previously described. XAS measurements using higher energy x-rays (hard x-rays; typically on the order of 1000’s eV) are much simpler, as the x-ray can easily travel short distances through air making vacuum chambers not required for the sample.
For a given pressure and temperature condition, X-ray spectra or diffraction patterns were measured, usually for an hour or more, until no further change in the spectra or diffraction pattern was observed. The acquisition time of each X-ray technique is however different: 2 minutes for XRD (a bulk measurement); 20 min for XAS electron yield (a surface measurement); 160 min for hard x-ray XAS fluorescence yield (another bulk measurement). Likewise, typical exposure times for the AP-XPS experiments were
16
of the order of hours during which multiple measurements at various core and valence levels using different photon energies were made until no further change in the spectral features could be detected. No significant change was observed over the course of any experiment at any given condition. Specialized reactor cells for in situ measurements were built for 1) soft x-ray measurements; 2) hard x-ray measurements[12]; and 3) XRD measurements[12]. Cells 2 and 3 were built to operate in ambient conditions, with a stainless steel body, heating and thermocouple feedthroughs, and two gas inlets. The catalyst sample was mounted on the heating element and typically held in place by either an alumina ceramic piece, or a Ta ring, as the cell was mounted vertically at the beamline. A polyimide film (Kapton - DuPont) served as the x-ray transparent window for these cells. Cell 1 is different in that the operating environment was UHV; thus the inner (high pressure) portion of the reactor was sealed with high vacuum components before the measurements. The rest of the cell components are similar to cells 2 and 3; a heater and thermocouple, two gas inlets, and in addition two Ta plates which served as current collectors for electron yield measurements. The electron yield measurement is given in Figure 2–8 below, as it actually measures the compensating current from ground, not the ejected electrons.
Figure 2 - 8. Schematic of the electron yield measurements in XAS experiments. Instead of measuring ejected electrons (which would require UHV conditions) the current compensation from ground is measured to give a “total electron yield” measurement.
17
2.4 Catalytic Measurements 2.4.1 Steady State Reactor Steady state catalytic measurements were carried out in a lab scale fixed bed
reactor made of stainless steel (ID = 4.5mm). High purity gasses (Praxair 99.999%) were fed to mass flow controllers (Parker) that controlled the flow rate. Each mass flow controller was calibrated individually at the reactor outlet. The CO gas was fed through a high temperature carbonyl trap prior to the mass flow controller to decompose any Ni or Fe carbonyls formed.
A tube furnace (Supelco) in combination with a temperature programmer (Cole Parmer, Digi Sense PID control) was used to control temperature. Catalyst charges of 50 – 200 mg were retained between plugs of quartz wool and supported by acid-washed ground glass. The reactor outlet was connected to a low temperature trap to collect wax products produced during Fischer-Tropsch synthesis and finally a PID controlled needle valve to regulate the pressure in the reactor. The maximum operating parameters of the reactor are 298 – 1073 K, 1 – 60 bar, with individual gas flow rates between 2 – 60 sccm (mL/min). Figure 2–9 illustrates the setup of the reactor.
Figure 2 - 9. Schematic of the steady state Fischer-Tropsch reactor used in this dissertation.
For quantitative analysis of the reactants and products, a six-way valve was used to sample 2mL portions of the outlet flow to a gas chromatograph coupled to a mass
18
spectrometer (GC-MS, Agilent 7970A – 5975C). All flow lines between the reactor and GC were heated to 100°C to maintain all components in the vapor phase. The separation of reactants and products was achieved using two capillary columns (HP-Plot Q/HP Molesieve). At the outlet of the columns, the gases were split in two: a small volume was directed to the mass spectrometer for qualitative analysis whereas the rest was directed to the thermal conductivity detector (TCD) and the flame ionization detector (FID). A methanizer (Agilent, Ni catalyst) allowed for detection of CO and CO2 at the FID. Ar (2 sccm) was also fed to the reactant stream for use as an internal standard for GC analysis.
2.4.2 Chemical Transient Kinetics Reactor Chemical Transient Kinetic (CTK) experiments were carried out on a newly built
reactor at Lawrence Berkeley National Laboratory. The reactor combines two independent plug-flow circuits feeding a four-way valve which allows for selecting which circuit is directed through the reactor. An abrupt change in the gas composition can be obtained by switching from circuit 1 to circuit 2 using the four way valve. The piping of the system is made from 316 stainless steel having an outer diameter of 1/8”. The confirmation of plug flow in the CTK reactor is discussed and experimentally verified in Chapter 4.
The gases at the outlet of the reactor are continuously analyzed by an online quadrupole mass spectrometer (QMS; Stanford Research Systems RGA 200) via flow-through capillary and a differentially pumped introduction valve (Pfeiffer GES 010). The capillary and differentially pumped valve keeps the ionization chamber of the QMS under molecular flow conditions which allows for quantitative analysis, with a maximum sampling rate of 0.5 s. A schematic showing the reactor and detector setup is give in Figure 2–10.
19
Figure 2 - 10. Schematic of the chemical transient kinetics (CTK) reactor, built for non-steady state measurements. Inset at bottom shows the switching operation of the four way valve.
The mass spectrometer is operated in multiple ion detection mode for a series of mass/charge ratios. 14 different mass/charge ratios are monitored during the Fischer-Tropsch reaction, so that overlapping product peaks can be deconvoluted. Due to the large number of masses being followed, the effective time resolution of the reactor is closer to 2.2 seconds. The QMS used an emission of 1.0 mA with an electron energy of 70 eV. The focus plate was set to 90V, and the channel electron multiplier (CEM) was typically used. The QMS electronics were calibrated to the peak of m/z 40 using pure Ar. Individual gases (CO2, CH4, C2H4, C2H6, C3H6, C3H8, C4H10) were fed to the QMS to determine the sensitivity factors for each fragmentation peak for each gas to be quantitatively analyzed.
Because the Fischer-Tropsch product distribution is so diverse, the use of a GC-MS in combination with the online QMS provides a complete picture of the product distribution as a function of time. Samples for the GC-MS were collected and stored in a trapping selector valve (VICI) for analysis at a later time. By trapping the effluent reactor gas in 2mL loops, a time resolution similar to that in the QMS can be obtained.
2.5 References [1] V. Iablokov, S. K. Beaumont, S. Alayoglu, V. V Pushkarev, C. Specht, J. Guo, a P.
Alivisatos, N. H. Kruse, G. A. Somorjai, J. Gao, et al., Nano Lett. 2012, 12, 3091–3096.
[2] Y. Chen, E. Johnson, X. Peng, 2007, 10937–10947.
20
[3] C. C. Lin, C. J. Chen, R. K. Chiang, J. Cryst. Growth 2012, 338, 152–156.
[4] K. An, M. Park, J. H. Yu, H. Bin Na, N. Lee, J. Park, S. H. Choi, I. C. Song, W. K. Moon, T. Hyeon, Eur. J. Inorg. Chem. 2012, 2148–2155.
[5] P. Schmidt-Winkel, W. W. Lukens, D. Zhao, P. Yang, B. F. Chmelka, G. D. Stucky, J. Am. Chem. Soc. 1999, 121, 254–255.
[6] F. Kleitz, S. H. Choi, R. Ryoo, Chem. Commun. (Camb). 2003, 2136–2137.
[7] A. H. Lu, F. Schüth, Adv. Mater. 2006, 18, 1793–1805.
[8] C.-S. Li, G. Melaet, W. T. Ralston, K. An, C. Brooks, Y. Ye, Y.-S. Liu, J. Zhu, J. Guo, S. Alayoglu, et al., Nat. Commun. 2015, 6, 6538.
[9] K. An, S. Alayoglu, N. Musselwhite, S. Plamthottam, G. Melaet, A. E. Lindeman, G. A. Somorjai, J. Am. Chem. Soc. 2013, 135, 16689–16696.
[10] M. Park, K. Gandhi, L. Sun, R. Salovey, J. J. Aklonis, Polym. Eng. Sci. 1990, 30, 1158–1164.
[11] M. P. Seah, W. A. Dench, Surf. Interface Anal. 1979, 1, 46–55.
[12] S. Alayoglu, S. K. Beaumont, G. Melaet, A. E. Lindeman, N. Musselwhite, C. J. Brooks, M. A. Marcus, J. Guo, Z. Liu, N. Kruse, et al., J. Phys. Chem. C 2013, 117, 21803–21809.
21
Chapter 3 – Evidence of Highly Active Cobalt Oxide Catalyst for the Fischer-Tropsch Synthesis and CO2 Hydrogenation Abstract Hydrogenations of CO or CO2 are important catalytic reactions as they are interesting alternatives to produce fine chemical feedstock hence avoiding the use of fossil sources. Using size-controlled nanoparticle (NPs) catalysts, we have studied the CO/H2 (i.e. Fischer-Tropsch synthesis) and CO2/H2 reactions. Exploiting synchrotron based in situ characterization techniques such as X-ray absorption spectroscopy (XAS) and X-ray photoelectron spectroscopy (XPS), we were able to demonstrate that 10 nm Co NPs cannot be reduced under H2 at 250˚C while supported on TiO2 or SiO2 and that the complete reduction of cobalt can only be achieved at 450˚C. Interestingly, cobalt oxide performs better than fully reduced cobalt when supported on TiO2. In fact, the catalytic results indicate an enhancement of 10 fold for the CO2/H2 reaction rate and 2 fold for the CO/H2 reaction rate for the Co/TiO2 treated at 250˚C in H2 versus Co/TiO2 treated at 450˚C. Inversely, the activity of cobalt supported on SiO2 has a higher turnover frequency when cobalt is metallic. The product distributions could be tuned depending on the support and the oxidation state of cobalt. For oxidized cobalt on TiO2, we observed an increase of methane production for the CO2/H2 reaction whereas it is more selective to unsaturated products for the CO/H2 reaction. In situ investigation of the catalysts indicated wetting of TiO2 support by CoOx and partial encapsulation of metallic Co by TiO2-x. *This chapter covers similar material as in Melaet, G., Ralston, WT., Li, CS., Alayoglu, S., An, K., Musselwhite, N., Kalkan, B., Somorjai, GA. J. Am. Chem. Soc. 2014, 136 (6), 2260-2263. – reproduced with permission, copyright 2014 American Chemical Society.
22
3.1 Introduction Reforming of CO (i.e. FT synthesis) and CO2 to substitute dwindling fossil fuels
has gained a renewed scientific interest because of the recent crude oil crisis. The major drawback of these synthesis is their broad spectrum of products over Co catalysts: the hydrogenation of CO leads to formation of many high molecular weight products (C5 and above), while CO2 hydrogenation gives rise to gaseous products (i.e. C1-C4). Hence, both reactions represent a challenge to achieve 100% selectivity for a desired product. Accomplishing this will certainly enable “green” manufacturing with no generation of wasteful or polluting by-products. Along these lines, studies of size-controlled Co particles showed that larger particles (i.e. ≥ 10 nm) are the most active, but size has a modest effect on the selectivity.[1–3] Likewise, TiO2 supports were reported to enhance activity without altering selectivity.
The poor activity of smaller particles is often attributed to the ease with which these particles can be oxidized.[3,4] It is well known from surface science that metallic Co is necessary to dissociate CO, hence the metallic state is most likely to be the active state. In the present work, we report a cobalt oxide catalyst which is more active and more selective than its metallic equivalent. In fact, we observed multiple fold enhancement in turnover rates in the oxidized cubic CoO phase relative to metallic Co over TiO2 support. Inversely, metallic Co is more active when supported on SiO2. Nevertheless, the CoO/TiO2 performs better than the metallic Co/SiO2 catalyst produced in the same condition.
Since the nature of the support is known to influence the particle dispersion and size distribution while using classic impregnation techniques[5], we have synthesized the particles using a colloidal route to insure the homogeneity of cobalt size and dispersion between both catalysts. 10 ± 0.5nm cobalt nanoparticles were synthesized using a colloidal method reported elswhere.[6] Macroporous TiO2
[7] and mesoporous SiO2 (MCF-17)[8] were also prepared in-house and used as supports for the Co NPs.
We evaluated the catalytic activity and selectivity of Co/TiO2 and Co/SiO2 catalysts with metallic and oxidized Co components, as determined by the temperature of the reductive H2 pre-treatment. Two temperatures of hydrogen pre-treatment were selected: one below the bulk reduction temperature of Co oxides (250˚C) and another above it (450˚C) respectively referred to as ox and red, in order to evaluate the impact of cobalt oxidation state. Both reactions were evaluated in similar temperature and pressure conditions (250˚C and ~5 atm).
The Co/TiO2 catalyst performed approximately 5-fold better when Co was in an oxidized state. Furthermore, methane production was improved substantially for the oxidized Co. It was also found that the Co/SiO2 catalyst behaved opposite to the Co/TiO2 catalyst: peaks in activity and methane selectivity were obtained for the metallic Co. Overall, oxidized Co supported on TiO2 displayed a 2-fold enhancement in methane yield versus metallic Co supported on SiO2.
23
3.2 Experimental Synthesis of Macroporous TiO2
Macroporous TiO2 was prepared via a polymer templating strategy.[7] The polystyrene beads, utilized as the polymer template, were synthesized through an emulsifier-free emulsion polymerization technique.[9] Briefly, 14 g of styrene monomer and 0.7 g of divinylbenzene (a crosslinker) were washed 4 times with 0.1 M NaOH solution and with DI water to remove inhibitors. The mixture of styrene and divinylbenzene was then stirred in 140 mL of DI water at 70 oC, followed by purging under Ar flow for 1 h. Finally, potassium persulfate (0.03 g, 1.0M) was added as an initiator for the polymerization. After reacting at 70 oC for 12 h, the polystyrene beads with an average diameter of 500 nm were collected by centrifugation at 4300 rpm.
The next step was to add 20 mmol of titanium isopropoxide (Sigma-Aldrich, 97%) to P123 dissolved in ethanol and HCl. The combined solution was stirred for 5 h after which the dried polystyrene beads (4 g) was added. The solvent was evaporated at 60 °C for 48 h, and the resulting flakes were calcined at 700 °C in air for 6 h. After calcination, highly crystalline macroporous TiO2 with an average pore size of 300 nm was obtained. Synthesis of 10 nm Co Nanoparticles
10 nm cobalt nanoparticle synthesis was carried out using standard Schlenk techniques under an argon atmosphere as described in detail elsewhere.[6] Briefly, after evacuation of oleic acid (130 mg, 99% pure, Aldrich) in a 250 ml round bottom flask for 20 min, anhydrous o-dichlorobenzene (15 mL, 99%, DCB, Aldrich) was added under Ar. Once the temperature was stabilized at 163°C, Co2(CO)8 (stabilized with 1-5% hexane, Strem) in DCB (3 ml, 0.5 M) was injected quickly into the solution (25 ml SGE gas tight syringe equipped with a G13 needle [ID = 1.8 mm]) forming colloidal particles. This colloidal suspension was then aged for 20 min at constant temperature before cooling the flask. DCB (10 mL) and 2-proponal (ACS Grade, 20 mL) were added to this suspension, precipitating nanoparticles, which could then be extracted by centrifugation (4300 rpm). The solid was re-dispersed and stored in chloroform until further use. Fabrication of Co/TiO2 catalyst
For the preparation of a 10 weight % Co/TiO2 catalyst, as-synthesized Co nanoparticles dispersed in chloroform (~10 mg mL-1) were added to macroporous TiO2 and sonicated for 1 h at room temperature. The precipitate was separated by centrifugation and washed with acetone and ethanol seven times, then dried at 100 °C. Catalytic testing
CO2 hydrogenation was carried out in a U-shaped plug flow reactor bed, in which the temperature is monitored with a K-type thermocouple. A reactant gas feed consisting of CO2 and H2 balanced with He is fed to the catalyst. The pressure, continuously monitored by a capacitance gauge, was regulated via a needle valve to 5-6 bar. The gases at the outlet of the reactor were analyzed using a Hewlett Packard HP 5890 Series II chromatograph equipped with both FID and TCD detectors. Hayesep-D packed columns were employed for both the chromatographic separation of CO2, CO, and CH4 (TCD) and for detecting the presence of C1–C3 hydrocarbons (FID).
24
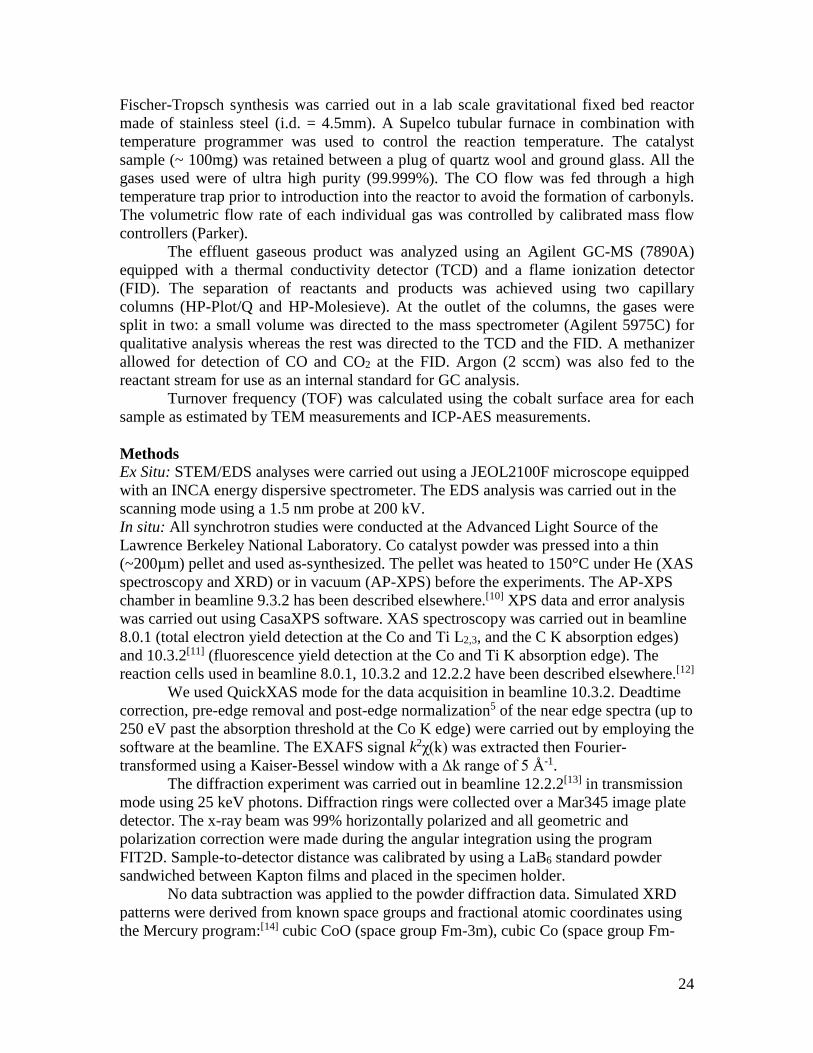
Fischer-Tropsch synthesis was carried out in a lab scale gravitational fixed bed reactor made of stainless steel (i.d. = 4.5mm). A Supelco tubular furnace in combination with temperature programmer was used to control the reaction temperature. The catalyst sample (~ 100mg) was retained between a plug of quartz wool and ground glass. All the gases used were of ultra high purity (99.999%). The CO flow was fed through a high temperature trap prior to introduction into the reactor to avoid the formation of carbonyls. The volumetric flow rate of each individual gas was controlled by calibrated mass flow controllers (Parker).
The effluent gaseous product was analyzed using an Agilent GC-MS (7890A) equipped with a thermal conductivity detector (TCD) and a flame ionization detector (FID). The separation of reactants and products was achieved using two capillary columns (HP-Plot/Q and HP-Molesieve). At the outlet of the columns, the gases were split in two: a small volume was directed to the mass spectrometer (Agilent 5975C) for qualitative analysis whereas the rest was directed to the TCD and the FID. A methanizer allowed for detection of CO and CO2 at the FID. Argon (2 sccm) was also fed to the reactant stream for use as an internal standard for GC analysis.
Turnover frequency (TOF) was calculated using the cobalt surface area for each sample as estimated by TEM measurements and ICP-AES measurements. Methods Ex Situ: STEM/EDS analyses were carried out using a JEOL2100F microscope equipped with an INCA energy dispersive spectrometer. The EDS analysis was carried out in the scanning mode using a 1.5 nm probe at 200 kV. In situ: All synchrotron studies were conducted at the Advanced Light Source of the Lawrence Berkeley National Laboratory. Co catalyst powder was pressed into a thin (~200µm) pellet and used as-synthesized. The pellet was heated to 150°C under He (XAS spectroscopy and XRD) or in vacuum (AP-XPS) before the experiments. The AP-XPS chamber in beamline 9.3.2 has been described elsewhere.[10] XPS data and error analysis was carried out using CasaXPS software. XAS spectroscopy was carried out in beamline 8.0.1 (total electron yield detection at the Co and Ti L2,3, and the C K absorption edges) and 10.3.2[11] (fluorescence yield detection at the Co and Ti K absorption edge). The reaction cells used in beamline 8.0.1, 10.3.2 and 12.2.2 have been described elsewhere.[12]
We used QuickXAS mode for the data acquisition in beamline 10.3.2. Deadtime correction, pre-edge removal and post-edge normalization5 of the near edge spectra (up to 250 eV past the absorption threshold at the Co K edge) were carried out by employing the software at the beamline. The EXAFS signal k2χ(k) was extracted then Fourier-transformed using a Kaiser-Bessel window with a Δk range of 5 Å-1.
The diffraction experiment was carried out in beamline 12.2.2[13] in transmission mode using 25 keV photons. Diffraction rings were collected over a Mar345 image plate detector. The x-ray beam was 99% horizontally polarized and all geometric and polarization correction were made during the angular integration using the program FIT2D. Sample-to-detector distance was calibrated by using a LaB6 standard powder sandwiched between Kapton films and placed in the specimen holder.
No data subtraction was applied to the powder diffraction data. Simulated XRD patterns were derived from known space groups and fractional atomic coordinates using the Mercury program:[14] cubic CoO (space group Fm-3m), cubic Co (space group Fm-
25
3m), spinel Co3O4 (space group Fd3m), rutile TiO2 (space group P42/mnm) and anatase TiO2 (space group I41/amd).
For a given pressure and temperature condition, X-ray spectra or diffraction patterns were measured, usually for an hour or more, until no further change in the spectra or diffraction pattern was observed. The acquisition time of each X-ray technique is however varied: 2 minutes for XRD (a bulk measurement); 20 min for NEXAFS TEY (a surface measurement); 160 min for EXAFS (another bulk measurement). Likewise, typical exposure times for the AP-XPS experiments were in the order of hours during which multiple measurements, at various core (Co and Ti 2p; C and O 1s) and valence levels using different photon energies (940 eV for Co, 630 eV for Ti, C and O), were made until no further change in the spectral features could be detected. Note, that all the techniques showed the evidence of reduction (or oxidation) of Co (and TiO2) for the Co/TiO2 catalyst, starting with the first measurement, and no significant change in the course of any experiment at any given condition. This suggests that the steady-state was reached rather quickly in the timescale of any X-ray technique used. 3.3 Results and Discussion
Figure 3–1 exhibits plots of turnover frequencies (3-1a) and selectivity towards methane (3-1b) for the CO2/H2 (ratio 1:3) reaction, displaying 4 cycles of catalytic runs.
Figure 3 - 1. Plots of TOF (1a) and selectivity towards methane (1b) for the CO2/H2 (ratio 1:3) reaction, displaying 4 cycles of catalytic runs.
26
Likewise, the CO/H2 (ratio 1:2) reaction yielded 2-fold enhancement in turnover rates over oxidized Co in the case of TiO2 support, whereas the Co/SiO2 catalyst is most active with metallic Co (Figure 3–2a). Product distribution is also influenced by the oxidation state of cobalt. In fact for both supports, the oxidized cobalt produces more unsaturated hydrocarbons as shown for C2 and C4 in the case of the Co/TiO2 catalyst (Figure 3–2b). Hence we can conclude that the hydrogenation activity of metallic cobalt is higher as we observe a diminishing of the olefin to paraffin ratio.
Figure 3 - 2. (a) TOFs for the Co/TiO2 (red) and Co/SiO2 (blue) catalysts as a function of alternating redox state of Co, red stands for the reduced Co and ox for the oxidized Co. (b) Bar graphs show the olefin to paraffin ratios for C2 and C4 molecules for Co/TiO2 catalyst. The reduced Co was obtained upon H2 treatment (10 vol. % in Ar for 1 hour) at 450°C, while the oxidized Co was obtained upon O2 treatment at 350°C and maintained in net reducing atmospheres at 250°C (see text). The reaction conditions were 5 atm of CO/H2 (1:2) at 250°C for 24 hours.
27
Figure 3 - 3. (a) TEM and (b) HR-TEM images of the Co/TiO2 catalyst, obtained after cycles of redox treatments and the CO2/H2 reaction. (c) STEM image and EDS elemental maps at (d) Ti K and (e) Co K lines of the same spent catalyst.
TEM, HR-TEM and STEM/EDS spectral maps at Co and Ti K lines of the
Co/TiOx spent catalyst cycled at elevated temperatures (up to 450°C) and reactive gas pressures (up to 5 bar) indicates no particle agglomeration (Figure 3–3). The Co particles are well dispersed on the TiO2 support.
Figure 3–4 shows AP-XPS spectra (a and b) taken at Co and Ti 2p core levels during reductive H2 (100 mTorr) treatments: at 250°C, Co was found oxidized and Ti was partially reduced on surfaces corresponding to probing depths of 6 Ȧ (kinetic energies of 180 eV),[15] whereas Co was partially reduced and Ti was fully reduced at 450°C. Under catalytically more relevant H2 partial pressures (150 Torr), (N)EXAFS indicated metallic Co at 450°C and oxidized Co at 250°C (Figure 3–3c). EXAFS oscillations revealed metallic Co-Co coordination or Co-O and oxidized Co-Co coordination, respectively (Figure 3–3d).
28
Figure 3 - 4. AP-XPS spectra of the Co/TiO2 catlyst at a) Co 2p and b) Ti 2p core levels obtained under given conditions. In situ c) NEXAFS spectrum and d) the corresponding EXAFS oscillations at Co K absorption edge under given conditions. In situ NEXAFS TEY spectra at e) Co L and f) C K edges dring reaction of CO2/H2 (1:3) at 1 atm and 250°C. Least-square fitting in e) was carried out using reference compounds.
Metallic Co is believed to be the active form of Co during hydrogenation of CO.[16,17] To this end, our findings over the Co/SiO2 catalyst are in accord with an active metallic Co phase. However, we found evidence for the existence of an oxidized form of Co supported on TiO2, surprisingly superior to the metallic state of Co for both the Fischer-Tropsch synthesis as well as for the hydrogenation of CO2. NEXAFS total electron yield (TEY) spectrum, a surface sensitive technique (probe depth ~ 2nm[18]), at the Co L edge revealed that near surface regions were, composed of Co2+ during CO2/H2 (1:3, ~1 atm) reaction at 250°C (Figure 3e). Furthermore, the C K edge TEY spectrum, obtained under the same reaction conditions, indicated the presence of CO and sp2- and sp3-like (i.e. C2H4 and CH4) hydrocarbons[19] (Figure 3–4f). NEXAFS fluorescence yield (FY) spectra, acquired at the Co K edge under 1 atm of CO2/H2 (1:3) at 250°C, demonstrate that the active cobalt oxide catalyst remained oxidized under these reaction conditions (Figure 3–5). Furthermore, in situ X-ray diffraction studies unequivocally showed that oxidized Co crystallized in the cubic CoO (Fm-3m) phase (Figure 3–6).
29
Figure 3 - 5. In situ NEXAFS FY spectra at Co K absorption edge, acquired under 1 atm of CO2/H2/Ar (1:3:0.5) at 250°C. Reduced and oxidized states of Co were obtained upon reductive H2 (20 vol. % in Ar) treatments at 450°C and 250°C, respectively, following O2 (20 vol. % in Ar) treatments at 350°C.
Figure 3 - 6. In situ XRD patterns, acquired under 20 vol. % O2 in Ar (blue) or 1 atm of CO2/H2/Ar (1:3:0.5) at 250°C (black and red), of the Co/TiO2 catalyst. The black XRD pattern belongs to the catalyst with reduced Co and the red XRD pattern belongs to that with oxidized Co. Simulated XRD patterns are shown on the x-axis: cubic CoO (space group Fm-3m, red), cubic Co (space group Fm-3m, black), spinel Co3O4 (space group Fd3m, blue), rutile TiO2 (space group P42/mnm, green) and anatase TiO2 (space group I41/amd, light green). Diamonds denote reflections of cubic Co, and spheres denote those of cubic CoO.
30
In view of the data gathered by XPS, we believe that metallic cobalt might be encapsulated by TiO2 decreasing the overall number of active sites and thus the activity of the metallic Co/TiO2. The wetting of small metallic particles by TiO2 is well known and was first reported by Tauster as a strong metal-support interaction (SMSI).[20–22] The reason for this encapsulation is not clear and might be related to the presence of specific adsorbates and/or thermally induced. No matter the reason, this Co/TiO2 nanocomposite material possesses a surface dynamism which allows it to adapt to its environment. Figure 3–7 shows % Co on the surface of the Co/TiO2 catalyst, as measured by AP-XPS under relevant conditions (100 mTorr O2 or H2) and lab XPS (Al K alpha) for the fresh and spent catalysts after cycles of redox treatment and CO2/H2 reaction. It was found that the % Co on the surface increased from 29 atom % in O2 at 350°C to 35 atom % in H2 at 250°C, suggestive of wetting of TiO2 by CoO. Lab XPS evidenced that both the fresh and spent catalysts had approximately 30 atom % Co in surface. At 450°C in H2, however, the % Co on the surface substantially dropped to 20 atom %. This is clearly reminiscent of reversible encapsulation of metallic Co[22,23], present under these conditions, by TiO2-x as a result of the lower surface free energy of the latter.[22] The possibility of CoTiO3 formation has been considered; nonetheless, our AP-XPS, NEXAFS, and XRD data rule out the existence of such compounds at the surface or in the bulk.
Figure 3 - 7. % Co on surface, defined as % Co /(Co+Ti) from XPS, as a function of condition. AP-XPS data were obtained using 940 eV and 630 eV photons at Co 2p and Ti 2p levels, respectively, under given conditions in 100 mTorr. Lab XPS (Al K Ephoton=1460 eV) data (red) were obtained in ~10-8 Torr bas pressure for the freshly prepared as well as spent catalysts.
3.4 Conclusion In view of our findings, we believe that CoO forms a catalytically active and
unique interface with TiO2, which enhanced the activity of CO or CO2 hydrogenation reactions with respect to metallic Co/TiO2. Moreover, for both reactions the metallic Co/SiO2 is less active than CoO/TiO2. Our catalytic data demonstrates that a certain tuning of the product distribution could be achieved using metal/metal oxide support interaction.
3.5 References [1] G. L. Bezemer, J. H. Bitter, H. P. C. E. Kuipers, H. Oosterbeek, J. E. Holewijn, X.
Xu, F. Kapteijn, A. J. Van Dillen, K. P. de Jong, J. Am. Chem. Soc. 2006, 128, 3956–3964.
[2] J. den Breejen, P. B. Radstake, G. L. Bezemer, J. H. Bitter, V. Frøseth, A. Holmen, K. P. de Jong, J. Am. Chem. Soc. 2009, 7197–7203.
[3] N. Fischer, E. van Steen, M. Claeys, J. Catal. 2013, 299, 67–80. [4] E. Van Steen, M. Claeys, M. E. Dry, J. Van De Loosdrecht, E. L. Viljoen, J. L.
Visagie, J. Phys. Chem. B 2005, 109, 3575–3577. [5] R. C. Reuel, C. H. Bartholomew, J. Catal. 1984, 85, 63–77. [6] V. Iablokov, S. K. Beaumont, S. Alayoglu, V. V Pushkarev, C. Specht, J. Guo, a P.
Alivisatos, N. H. Kruse, G. A. Somorjai, J. Gao, et al., Nano Lett. 2012, 12, 3091–3096.
[7] K. An, S. Alayoglu, N. Musselwhite, S. Plamthottam, G. Melaet, A. E. Lindeman, G. A. Somorjai, J. Am. Chem. Soc. 2013, 135, 16689–16696.
[8] P. Schmidt-Winkel, W. W. Lukens, D. Zhao, P. Yang, B. F. Chmelka, G. D. Stucky, J. Am. Chem. Soc. 1999, 121, 254–255.
[9] M. Park, K. Gandhi, L. Sun, R. Salovey, J. J. Aklonis, Polym. Eng. Sci. 1990, 30, 1158–1164.
[10] M. E. Grass, P. G. Karlsson, F. Aksoy, M. Lundqvist, B. Wannberg, B. S. Mun, Z. Hussain, Z. Liu, Rev. Sci. Instrum. 2010, 81, DOI 10.1063/1.3427218.
[11] M. A. Marcus, A. A. MacDowell, R. Celestre, A. Manceau, T. Miller, H. A. Padmore, R. E. Sublett, J. Synchrotron Radiat. 2004, 11, 239–247.
[12] S. Alayoglu, S. K. Beaumont, G. Melaet, A. E. Lindeman, N. Musselwhite, C. J. Brooks, M. A. Marcus, J. Guo, Z. Liu, N. Kruse, et al., J. Phys. Chem. C 2013, 117, 21803–21809.
[13] M. Kunz, A. A. MacDowell, W. A. Caldwell, D. Cambie, R. S. Celestre, E. E. Domning, R. M. Duarte, A. E. Gleason, J. M. Glossinger, N. Kelez, et al., J. Synchrotron Radiat. 2005, 12, 650–658.
[14] C. F. Macrae, I. J. Bruno, J. A. Chisholm, P. R. Edgington, P. McCabe, E. Pidcock, L. Rodriguez-Monge, R. Taylor, J. Van De Streek, P. A. Wood, J. Appl.
32
Crystallogr. 2008, 41, 466–470. [15] M. P. Seah, W. A. Dench, Surf. Interface Anal. 1979, 1, 46–55. [16] K. H. Cats, I. D. Gonzalez-Jimenez, Y. Liu, J. Nelson, D. van Campen, F. Meirer,
A. M. J. van der Eerden, F. M. F. de Groot, J. C. Andrews, B. M. Weckhuysen, Chem. Commun. (Camb). 2013, 49, 4622–4.
[17] N. E. Tsakoumis, R. Dehghan, R. E. Johnsen, A. Voronov, W. Van Beek, J. C. Walmsley, ??yvind Borg, E. Rytter, D. Chen, M. R??nning, et al., Catal. Today 2013, 205, 86–93.
[18] M. Abbate, J. B. Goedkoop, F. M. F. de Groot, M. Grioni, J. C. Fuggle, S. Hofmann, H. Petersen, M. Sacchi, Surf. Interface Anal. 1992, 18, 65–69.
[19] C. Laffon, J. Lasne, F. Bournel, K. Schulte, S. Lacombe, P. Parent, Phys. Chem. Chem. Phys. 2010, 12, 10865–70.
[20] S. J. Tauster, S. C. Fung, R. L. Garten, 1978, 170–175. [21] S. J. Tauster, S. C. Fung, R. T. Baker, J. A. Horsley, Science 1981, 211, 4487. [22] Q. Fu, T. Wagner, Surf. Sci. Rep. 2007, 62, 431–498. [23] V. a D. L. P. O’Shea, M. C. Á. Galván, A. E. P. Prats, J. M. Campos-Martin, J. L.
G. Fierro, Chem. Commun. 2011, 47, 7131–7133.
33
Chapter 4 – Time Resolved (2s) Study of the Initial Steps of the Catalytic Hydrogenation of CO: From Branched Isomers to Unsaturated Molecules Abstract The catalytic hydrogenation of carbon monoxide, known as the Fischer−Tropsch process, is a technologically important, complex multipath reaction which produces long-chain hydrocarbons. In order to access the initial kinetics and the mechanism, we developed a reactor that provides information under nonsteady state conditions. We tested a CoMgO catalyst and monitored the initial product formation within 2 s of exposure to CO as well as the time dependence of high molecular weight products (in a 60 s window) and found drastic changes in the product selectivity. The probability for forming branched isomer (C4 and C5) peaks in the first 25 s, and within that time frame no unsaturated products were detected. The subsequent decline (at ∼35 to 40 s) of branched isomers coincides with the detection of olefins (from C2 to C5), indicating a change in the reaction path.
*This chapter covers similar material as in Melaet, G., Ralston, WT., Liu, WC., Somorjai, GA. J. Phys. Chem. C. 2014, 118 (46), 26921-26925. – reproduced with permission, copyright 2014 American Chemical Society.
34
4.1 Introduction Fischer−Tropsch (FT) synthesis has been an industrially relevant process for decades
and is perhaps one of the most studied heterogeneous catalysis processes. The research is ongoing in order to elucidate the mechanism of this complex reaction. Many different models have been proposed; however, they are still debated, and a general consensus has not yet been reached.
Recently, we have shown that the oxidation state of cobalt at the onset of the reaction can influence the selectivity; i.e., starting with a metal leads to more saturated products.[1] We also have demonstrated the importance of average cobalt nanoparticle diameter on the turnover rate of the reaction under steady state conditions.[2] Despite their prevalence, steady state experiments are severely limited in that they provide only global kinetic parameters and little to no information on individual reaction steps. To understand the full extent of such a complex reaction, it is necessary to monitor the initial steps leading to the active surface and large product distribution. An understanding of how the fresh catalyst surface transforms to the steady state catalyst should help to control the selectivity of this complex reaction. Mechanistic elucidation of complex reactions, such as the FT process, requires a paradigm shift toward a focus on the catalyst in transient states. Initial rate studies, chemical transient kinetics,[3,4] steady state isotopic exchange,[5–7] and other similar experiments are our best opportunity to identify the initiator of the F−T synthesis and separate the primary from secondary products.
In the present paper, we are introducing a new reactor able to work under non-steady state conditions and compare it to those already recognized in the literature.[8] We also introduce new developments of the technique and original insights by the use of gas chromatography to obtain a sharper snapshot of the product distribution at early residence times. 4.2 Experimental
4.2.1 Experimental Setup For the purpose of these experiments, a new gas flow system was designed. It
combines two independent plug−flow circuits feeding a four-way valve which allows for selecting which circuit is directed through the reactor (see Figure 4–1 for the schematic). The gases at the outlet of the reactor are continuously analyzed by an online- quadrupole mass spectrometer (SRS RGA 200) via a well- calibrated flow-through capillary and a differentially pumped introduction valve (Pfeiffer GES 010 valve). The system allows for sampling at a maximum rate of 0.5 s while keeping the ionization chamber under molecular flow conditions (which allows for quantitative analysis). It must be pointed out that the online mass spectrometer (online QMS) is operated using a multiple ion detection mode for a series of 14 mass/charge ratios, giving an effective time resolution of 2.2 s. In practice, an abrupt change in the gaseous composition is obtained by switching from circuit 1 (H2:He = 3:1) to circuit 2 (H2:CO = 3:1) using the four-way valve. The presence of argon (∼10% in volume) in the reactive atmosphere serves as a reference gas to evaluate the response of the reactor to the switch. It also provides an estimate of the theoretical behavior of CO (referred to as CO reference) in the reactor if no
35
reaction/interaction with the catalyst was to occur. This type of experiment is defined as a chemical transient kinetics experiment.
Figure 4 - 1. Schematic of gas delivery system and analytical tools used to carry out chemical transient kinetic experiments. Insert on the bottom shows the switch principle from one circuit to the second circuit, allowing for fast and reproductive change of the gaseous composition.
Due to the complexity of the distribution of the FT synthesis, the use of a mass spectrometer alone does not provide a complete picture of the entire product distribution. Hence, given volumes of sample (∼1.3 mL) were collected at the outlet of the reactor and analyzed using an Agilent GC-MS (7890A) equipped with a thermal conductivity detector (TCD), a flame ionization detector (FID), and a quadrupole mass spectrometer. The separation of reactants and products was achieved using two capillary columns (HP-Plot/Q and HP- Molesieve). At the outlet of the columns, the gases were split in two: a small volume was directed to the mass spectrometer (Agilent 5975C) for qualitative analysis, whereas the rest was directed to the TCD and the FID. A methanizer allows for detection of CO and CO2 at the FID by fully reducing them to methane. The sampling volumes, corresponding to a time resolution of ∼2 s, were injected into vacuum-sealed flasks. The injections are synchronized with the change in the gas composition (timer is started when the switch is operated) and then correlated to the data obtained at the online-QMS using the argon present in the flow. This sampling volume is of the same order of magnitude in terms of time resolution with the data obtained at the online-QMS.
36
4.2.2 Reactor Verification The behavior of flow in the pipes from the delivery system to the reactor and from
the reactor to the analytical system was evaluated using the dimensionless Knudsen and Reynolds numbers. The former, calculated at room temperature for 1/8” stainless steel tubing, shows that our system is in a viscous flow (i.e. mean free path of molecules (λ) >>> than inner diameter of the pipe). The Reynolds number was evaluated for different flow rates as presented in Figure 4–2.
Figure 4 - 2. Evaluation of Reynolds number for the transient system; calculation was done using O2 at room temperature for a flow in the range of 1 to 150 mL/min.
From the calculated value, it can be seen that the Reynolds is well below the number for a cylindrical pipe (Re =~2000), which indicates that our flow is viscous laminar flow. The laminar sublayer thickness (∂s) was calculated for the range of flow rates. It was determined that for a flow between 20 and 100 sccm, ∂s is an order of magnitude smaller than the inner diameter of the pipe. This indicates that the flow behavior is close to a plug flow where the velocity of the fluid is assumed to be constant across any cross-section of the pipe perpendicular to the axis of the pipe.
Experimental verification for a well-mixed reactor was done by executing a switch between pure argon (in circuit 1) and pure oxygen (in circuit 2) while the reactor is opened. The mass/charge (m/z) ratio is monitored at the online-quadrupole mass spectrometer. The results of this experiment are presented in Figure 4–3.
37
Figure 4 - 3. Online-quadrupole mass spectrometer signal (left) and normalized signal (right) obtained during Ar → O2 → Ar switch at room temperature a total flow of 25 mL/min (sccm).
As is seen in Figure 4–3, the O2 and Ar inverted are perfectly overlapped showing that the residence time of the gases in the reactor are identical. Moreover, the mass spectrometer signals exhibit the characteristic exponential time dependence of a well-mixed reactor.
Finally, the different processes such as reactor filling, adsorption/desorption, variation of CO concentration (i.e. partial pressure in the reactor), etc. are deconvoluted from each other thanks to the use of different reference gases. We are co-feeding argon with CO (mixed 10% in vol. in the CO cylinder) which allows accounting for the behavior of CO if it was not reacting with the catalyst. The argon signal at the mass spectrometer is normalized and scaled up to produce the CO reference curves presented in subsequent figures. In addition, neon is added at the outlet of the reactor but before the online-QMS. Since the neon does not flow through the reactor, its behavior is independent from the phenomenon occurring in the reactor and allow for the evaluation of the total instantaneous volumetric flow rate.
4.2.3 Catalyst Preparation Cobalt magnesium oxide was prepared according to the literature using the
oxalate route.[8] Cobalt nitrate (Co(NO3)2) and magnesium nitrate (Mg(NO3)2) were stoichiometrically (10:1) mixed together in acetone; the mixed Co−Mg oxalate was obtained by addition of oxalic acid also dissolved in acetone. The resulting precipitate was centrifuged, washed several times, and dried overnight. The final catalyst was obtained by thermal decomposition of the oxalate in hydrogen (10% in argon) at 400 °C.
4.2.4 Catalyst Characterization Physical and metallic surface areas of the catalyst were measured using a
Micromeritics ASAP 2020. In both cases the oxalate was decomposed in situ with pure hydrogen at 3 °C/min up to 400 °C. Prior to the measurement, the CoMgO sample was evacuated at 150 °C for 2 h. The measurements were taken using nitrogen as the probe molecule at −196 °C, and the surface area was extrapolated using the BET expression. The metallic surface area was obtained using hydrogen as a probe molecule. The experiment was carried out at 35 °C, and the surface area was extrapolated from the isotherm.
38
4.3 Results Initially we needed to ensure that our system met all the requirements for a time-
resolved experiment. The whole system was determined to be a plug−flow system, and no gradient of concentration was observed along the tubing from the reactor to the analytical system (online-QMS). The reactor can be approximated to a well-mixed reactor. We compared the performance of a CoMgO catalyst to an identical catalyst utilized for this type of transient experiment[8] using the online-QMS only. CoMgO was produced according to the authors’ procedure; to ensure a valid comparison we have compared the morphological characteristics of both catalysts. The results are summarized in Table 1.
Table 4 - 1. Description of the catalysts: first column is from reference; the second is the one synthetized for this set of experiments
From this set of characterizations, it can be seen that both catalysts present identical morphological characteristics. The delay time, or time of apparition, of each product was obtained by analysis of the online-QMS data. To facilitate the comparison, our data and those obtained by Schweicher et al. are summarized in Table 2. As can be seen, both catalysts behave quite similarly: the steady state data are in good agreement (TOF 0.064 vs 0.066 s−1). As is apparent from Table 2, the transient period is also in good agreement with the data obtained by Schweicher as the time dependences (or delay time) of the products of our system are similar to those presented in the literature, confirming the practicality and validity our system.
Molecules / Time (s) Reference[8] CoMgO CO & CO2 18 21
CH4 8 9 C2s 12 12 C3s 15 14
Table 4 - 2. Time in second for the apparition of the different products/reactant from the moment of the switch is operated.
The sensitivity of an RGA quadrupole mass spectrometer is known to be somewhat less than that of a GC equipped with an FID/TCD; the trade off to the use of a GC is the loss of time resolution as the elution of all the products through the column is the limiting step (∼45 min). To overcome this drawback, a small volume of the effluent gas is injected into perfectly sealed and vacuum cleaned flasks, as described previously. Subsequently the samples were analyzed offline by GC-MS. By operating the
39
synchronized sampling system at different moments during the build-up phase of the reaction, we gain a temporal analysis of the product distribution. Figure 4–4 illustrates the principle of the experiment, showing the times at which the sampling of the exhaust gases is done (vertical dashed lines). As stated earlier, these samples were subsequently analyzed using our GC-MS which provide us with the total product distribution at each time (t).
Figure 4 - 4. Principle for the time-resolved experiment using the GC-MS analysis system. Shown is the transient and steady state periods obtained by the online-mass spectrometer. As a reference, we indicate with a dashed point vertical line the moment at which the GC-MS samples were collected. The transient period goes from 0 to ∼65 s after which the reaction reaches a steady state.
Using the data gathered by GC-MS, the selectivity was evaluated in terms of total amount of products obtained at time (t). As a result, we obtained the selectivity in time for the different products as displayed in Figure 4–5.
40
Figure 4 - 5. Selectivity as a function of time for different products obtained using CoMgO at atmospheric pressure and 230 °C for H2:CO = 3:1, obtained by GC-MS. The experimental data were fitted with a second-order polynomial fit. The inset provides a zoom to distinguish the different products obtained in time.
As indicated by the data obtained at the online-QMS, methane is the foremost product as well as the first to appear. The sequence in which the carbon chains appeared is directly related to the amount of carbon in the chain. In fact, the hydrocarbons appear (lower detection limit 0.5% selectivity) in the following order: C2−C3−C4−C5−C6. All these hydrocarbons appear within 40 s of the build-up.
This sequence could be expected if one agrees with the polymerization mechanism of the FT; i.e., the Anderson− Schulz−Flory distribution. Yet it demonstrates the superiority of the use of a GC in combination with the online-QMS versus the use of an online-QMS alone. Indeed, the online-QMS detection is limited to the amount of carbon produced. At atmospheric pressure, the catalyst only produces small quantities of C4+ which cannot be detected. On the other hand, our detection limit is lowered by the use of the GC, and our data indicate the presence of C5 and C6. Thus, the sensitivity of the gas chromatography allows for distinguishing small amounts of hydrocarbons, which would not be detected otherwise. Finally, it is worth noticing that the product distribution after 60 s is the same as that after 120 s, indicating we have reached a steady state. Furthermore, we have recorded over a period of a few hours and observed that the product distribution does not change.
The GC also allows for the differentiation of isomers and saturated/unsaturated molecules. According to our data, the branched and linear molecules are produced simultaneously, whereas it takes about 40 s to detect the first unsaturated product. We have evaluated the probability for the catalyst to produce a branched molecule versus its linear equivalent (see Figure 4–6a). It appears that the production of branched isomers peaks in the first 25 s during the buildup of the surface before decreasing and reaching a steady production rate around 50 s. It is interesting to notice that this decline in branched molecules corresponds to the onset of the unsaturated products (Figure 4–6b).
41
Figure 4 - 6. Changes in the selectivity of CoMgO during the buildup period highlighted by (a) the change in the probability to produce branched molecules and (b) the change in the olefin to paraffin ratio.
It is obvious from our set of data that the product distribution, i.e., the selectivity, drastically changes as the surface slowly evolves to the steady-state catalyst. We believe this change to be directly related with the changes in the surface coverage of the reactants (ΘC, ΘO, and ΘH, respectively).
Parameters influencing the selectivity of the FT process have been widely studied. The impact of the Co nanoparticle size and oxidation state is going to be our next focus as it was shown by others to be crucial.[9,10] Similarly, the addition of a second metal[5,11–
15] such as bimetallic nanoparticles of various compositions looks promising. Finally, we plan to investigate the addition of promoters[16–18] and the effect of the support[19–22] using transient experiments.
4.4 Conclusion We have developed and demonstrated the validity of our new system to study the
initial reaction rate of multipath reactions. Using a similar catalyst, we have compared our data to the literature and showed good agreement with previous findings. We provided additional data by using a GC-MS to analyze in detail the product distribution. This new operando system allowed highlighting the change in the product distribution, i.e., selectivity, for a CoMgO catalyst during the buildup of the reaction. We have showed that the longest carbon chains take more time to form, and we have evidenced that both linear and branched molecules are produced simultaneously. The appearance of unsaturated molecules seems to be linked to the decline in branching probability showing that as the build- up continues the catalyst evolves toward other preferential routes.
42
4.5 References [1] G. Melaet, W. T. Ralston, C.-S. Li, S. Alayoglu, K. An, N. Musselwhite, B. Kalkan, G. A. Somorjai, J. Am. Chem. Soc. 2014, 136, 2260–2263.
[2] G. Melaet, A. E. Lindeman, G. A. Somorjai, Top. Catal. 2013, 57, 500–507.
[3] A. Frennet, C. Hubert, J. Mol. Catal. A Chem. 2000, 163, 163–188.
[4] E. Vesselli, J. Schweicher, A. Bundhoo, A. Frennet, N. Kruse, J. Phys. Chem. C 2011, 115, 1255–1260.
[5] S. Vada, A. Hoff, E. ÅdnaneS, D. Schanke, A. Holmen, Top. Catal. 1995, 2, 155–162.
[6] V. Frøseth, S. Storsæter, Ø. Borg, E. A. Blekkan, M. Rønning, A. Holmen, Appl. Catal. A Gen. 2005, 289, 10–15.
[7] S. L. Shannon, J. G. Goodwin, Chem. Rev. 1995, 95, 677–695.
[8] J. Schweicher, A. Bundhoo, N. Kruse, J. Am. Chem. Soc. 2012, 134, 16135–16138.
[9] G. L. Bezemer, J. H. Bitter, H. P. C. E. Kuipers, H. Oosterbeek, J. E. Holewijn, X. Xu, F. Kapteijn, A. J. Van Dillen, K. P. de Jong, J. Am. Chem. Soc. 2006, 128, 3956–3964.
[10] J. den Breejen, P. B. Radstake, G. L. Bezemer, J. H. Bitter, V. Frøseth, A. Holmen, K. P. de Jong, J. Am. Chem. Soc. 2009, 7197–7203.
[11] C. Pirola, M. Scavini, F. Galli, S. Vitali, A. Comazzi, F. Manenti, P. Ghigna, Fuel 2014, 132, 62–70.
[12] G. Jacobs, J. A. Chaney, P. M. Patterson, T. K. Das, B. H. Davis, Appl. Catal. A Gen. 2004, 264, 203–212.
[13] G. Prieto, S. Beijer, M. L. Smith, M. He, Y. Au, Z. Wang, D. A. Bruce, K. P. de Jong, J. J. Spivey, P. E. de Jongh, Angew. Chemie 2014, 126, 6515–6519.
[14] D. Tristantini, S. Lögdberg, B. Gevert, Ø. Borg, A. Holmen, Fuel Process. Technol. 2007, 88, 643–649.
[15] E. Iglesia, S. L. Soled, R. A. Fiato, G. H. Via, J. Catal. 1993, 143, 345–368.
[16] M. E. Dry, G. J. Oosthuizen, J. Catal. 1968, 11, 18–24.
[17] W. Ngantsoue-Hoc, Y. Zhang, R. J. O'Brien, M. Luo, B. H. Davis, Appl. Catal. A Gen. 2002, 236, 77–89.
[18] C. M. Balonek, A. H. Lillebø, S. Rane, E. Rytter, L. D. Schmidt, A. Holmen, Catal. Letters 2010, 138, 8–13.
[19] E. Iglesia, S. L. Soled, R. A. Fiato, J. Catal. 1992, 137, 212–224.
[20] A. Y. Khodakov, A. Griboval-Constant, R. Bechara, V. L. Zholobenko, J. Catal. 2002, 206, 230–241.
[21] G. Jacobs, T. K. Das, Y. Zhang, J. Li, G. Racoillet, B. H. Davis, Appl. Catal. A Gen. 2002, 233, 263–281.
43
[22] Ø. Borg, P. D. C. Dietzel, A. I. Spjelkavik, E. Z. Tveten, J. C. Walmsley, S. Diplas, S. Eri, A. Holmen, E. Rytter, J. Catal. 2008, 259, 161–164.
44
Chapter 5 – Evidence of Structure Sensitivity in the Fischer-Tropsch Reaction on Model Cobalt Nanoparticles by Time-Resolved Chemical Transient Kinetics Abstract The Fischer-Tropsch process, or the catalytic hydrogenation of CO, produces long chain hydrocarbons and offers an alternative to the use of crude oil for chemical feedstocks. The observed size dependence of Co catalysts for the Fischer-Tropsch reaction was studied through the use of colloidally prepared Co nanoparticles and a chemical transient kinetics reactor capable of measurements under non-steady state conditions. Co nanoparticles of 4.3 nm and 9.5 nm were synthesized and tested under atmospheric pressure conditions and H2/CO = 2. Large differences in carbon coverage are observed for the two catalysts: the 4.3nm Co has ΘC < 1 while the 9.5nm Co supports a ΘC > 2. The monomer units present on the surface during reaction are identified as single carbon species for both sizes of cobalt nanoparticles, and the major CO dissociation site is identified as the B5-B geometry - fcc Co (221) step sites. The difference in activity of cobalt nanoparticles is shown to be due to the structure sensitivity caused by the loss of these specific types of sites at smaller nanoparticle sizes. *This chapter covers similar material as in Ralston, W.T., Melaet, G., Saephan, T., Somorjai, G.A. Angew Int. Ed. 2017 – reproduced with permissions, copyright 2017 Wiley-VCH.
45
5.1 Introduction The catalytic hydrogenation of carbon monoxide to longer chain hydrocarbons, or
Fischer-Tropsch (FT) reaction, is industrially and scientifically important. Common catalysts used for this surface catalyzed polymerization are cobalt and iron – catalysts based on cobalt are valued for their ability to produce a higher quantity of longer chains – however the mechanism of the FT process remains elusive.
A fundamental goal in the field of heterogeneous catalysis is to control the product selectivity, and to this end, an understanding of the FT mechanistic pathway is needed. In addition, work on cobalt catalysts for the FT reaction have shown the reaction to be structure-sensitive; below catalyst particle sizes of 8-10 nm, the activity decreases[1,2]. Several reasons for the activity loss of small particles have been proposed, such as easier re-oxidation of smaller particles[3,4], loss of necessary ensemble sites, and surface reconstructions.[5]
To understand the origin of the structure sensitivity, information is needed about individual or intermediate steps. Furthermore, an idea as to the true active site or active ensemble is necessary. Because the FT reaction has a complex reaction network, there most likely exists a variety of types of active sites – CO dissociation sites, H2 dissociation sites, monomer formation sites, and chain growth sites are all possibilities.
Through the use of transient reactor systems,[6][7] information such as intermediate residence times, surface coverages, and site reactivity distributions can be obtained. Various transient techniques have been developed, such as isotopic reactant exchange at steady state (SSITKA)[8,9][10], pulsed techniques (TAP)[11,12], and various step change experiments.[13,14] Previous transient experiments on cobalt catalysts have shown evidence for 2 distinct surface carbon precursors to methane[13], evidence for the CO insertion mechanism[15], steric hindrance on the surface[16], and irreversibly adsorbed CO on smaller Co particles[17]. This article presents our work using chemical transient kinetic experiments of CO/H2 gas over size controlled cobalt model catalysts. The chemical transient kinetic system observes the catalysts as it approaches a new steady state, a type of relaxation method where the effect of CO appearance or disappearance is studied. By synthesizing the Co nanoparticles using colloidal chemistry methods, we can ensure a proper size measurement[18] in order to correlate the structure of the Co nanoparticle catalysts with the observed catalytic trends. It was found that for smaller (4.3nm) particles, the Co surface could not support as much carbon as larger (9.5nm) particles by more than 1 carbon per Co surface atom. The monomer unit which gives rise to chain growth is found to be a single carbon species on both small and large Co particles. In addition, the CO dissociation site is identified as the B5-B site, and the observed activity difference of cobalt particles is attributed to structure sensitivity caused by a decrease in B5-B sites at smaller nanoparticle sizes.
46
5.2 Experimental 5.2.1 Catalyst Synthesis and Characterization Cobalt nanoparticles were prepared according to the literature[19]. Briefly, oleic
acid (Sigma-Aldrich, technical grade) was degassed at 80°C before the air-free addition of 12mL 1,2-dichlorobenzene (Sigma-Aldrich). The solution was heated to temperatures of 168-173°C depending on the desired nanoparticle size. To the hot solution, a 2M solution of Co2(CO)8 (Strem Chemicals, stabilized with 5% hexane) was injected and refluxed for 20 minutes. The resulting particles were precipitated and washed three times in a mixture of ethanol and acetone.
Mesoporous silica MCF-17[20] was prepared in-house and was used as a support for the Co nanoparticles. To support the nanoparticles in the mesoporous silica, the MCF-17 was mixed with a solution of dispersed nanoparticles in chloroform and sonicated for 1.5 hours. After sonication, the catalyst was centrifuged, washed 3 times with a mixture of ethanol and acetone, and dried at 100°C overnight. The dried catalyst particles were sieved to obtain particles with sizes between 150-250 micrometers; roughly 1g SiC (Sigma-Aldrich) was added as a diluent.
The resulting Co nanoparticles were characterized by transmission electron microscopy (Hitachi-7200, 120kV; JEOL JEM-2100, 200kV) to obtain size distributions of the synthesized nanoparticles as well as to investigate the fresh and spent catalysts.
Catalyst loadings were determined by ICP-AES (Perkin-Elmer ICP Optima 7000 DV) analysis of cobalt. Between 5-10mg of supported Co/MCF-17 catalyst was dissolved in 3mL aqua regia at 60°C before dilution with H2O. Nitrogen physisorption measurements were taken at 173 K using a Micromeretics ASAP 2020.
5.2.2 X-ray Characterization X-ray spectroscopies were carried out at the Advanced Light Source of Lawrence
Berkeley National Laboratory at beamlines 9.3.2[21], 10.3.2[22], and 11.0.1. Beamlines 9.3.2 and 11.0.1 were used for ambient pressure X-ray photoelectron spectroscopy (AP-XPS) and beamline 10.3.2 was used for Co K edge X-ray absorption spectroscopy (XAS).
AP-XPS samples were prepared by dropcasting a dilute solution of Co nanoparticles onto the native SiO2 termination of an n-doped Si wafer and oxidizing under flowing air at 350°C to remove the organic capping agent before installing inside the vacuum chamber of the XPS. After initial vacuum characterization of the sample, the catalyst was measured under 200mTorr O2 at 350°C; 200mTorr H2 at 450°C, and reaction conditions of 200mTorr CO + H2 (2:1) at 230°C. CasaXPS was used for data analysis.
XAS samples were prepared by lightly pressing the supported Co/MCF-17 catalyst into a pellet which was mounted into a home-built reactor cell.[23] Cobalt K edge data was collected in fluorescence mode at an angle of 45° to the beam. Dead time corrections and energy calibrations were performed using software at the beamline. A linear combination fitting of 4 standards (Co metal, CoO, CoOH, and Co3O4) was used to determine the oxidation state of the catalyst under the pretreatment and reaction conditions; the fitting range included an interval of ±25eV around the K edge energy (7708eV). Data processing utilized the Athena software package.
47
5.2.3 Chemical Transient Kinetics Reactor and Calculations A schematic of the CTK reactor is shown below in Figure 5–1. The chemical
transient reactor setup has been previously described in detail[24]. In short, a plug flow reactor is switched between two independent gas flow circuits while monitoring the transient species at the reactor outlet with an on-line mass spectrometer. In addition, a synchronized sampling system (VICI - ST12MWE) samples the reactor effluent at various points in time for off-line analysis by GC-MS (Agilent 7890A-5975C). Neon is introduced after the reactor outlet so that its behavior is independent of phenomena occurring inside the reactor; this allows us to calculate the instantaneous volumetric flow through the reactor at any point in time.
Before catalytic testing, samples were subjected to oxidation (O2) and reduction (H2) pretreatments. The oxidation pretreatment consisted of heating to 350°C in a flow of 10% O2 / Ar (30 sccm flow, 5°C/min ramp) and holding for 30 minutes. The reduction step consisted of heating to 450°C in a flow of 10% H2 / Ar (30 sccm total flow, 5°C/min ramp) and holding for 30 minutes; this step was carried out immediately prior to the catalytic testing.
Transient kinetic data was collected at atmospheric pressure, with a H2:CO ratio of 2:1 and a total flow rate of 40 sccm. The partial pressure of H2 was equivalent in each independent circuit, and the partial pressures of He and CO were set to be equal. The online mass spectrometer (online-MS) has a time resolution of ~2.5 sec, and the synchronized sampling system collects 2mL aliquots for offline analyses by GC-MS, corresponding to a time resolution of approximately 3 seconds. Due to the increased sensitivity of the GC-MS, the online-MS is used to follow total hydrocarbon production in time while the full product distribution is determined by offline GC-MS.
Figure 5 - 7. Schematic of the chemical transient kinetics reactor. The two independent circuits are shown on the left, and a four-way valve is operated to subject the catalyst to a step change in gaseous composition.
48
The carbon coverage of the cobalt surface is calculated using equation 1, given below:
Between the on-line mass spectrometer and the GC-MS data, the reactant and products can be followed in short timescales. The Co surface atoms is obtained by ICP-AES and TEM measurements.
The H2 surface flux (𝑆𝑆𝐻𝐻2 ) is the net molecular flux of hydrogen adsorbing or desorbing from the surface and is calculated according to equation 2 below:
𝑆𝑆𝐻𝐻2 = ∅𝐻𝐻2𝐵𝐵𝑘𝑘𝑑𝑑𝑜𝑜𝑑𝑑𝑝𝑝𝑜𝑜𝐵𝐵𝑜𝑜𝐵𝐵 − ∅𝐻𝐻2
𝑎𝑎𝐵𝐵𝑑𝑑𝑜𝑜𝑑𝑑𝑝𝑝𝑜𝑜𝐵𝐵𝑜𝑜𝐵𝐵 =𝑑𝑑𝑛𝑛𝐵𝐵
𝐵𝐵𝑎𝑎𝑑𝑑
𝑑𝑑𝑑𝑑− ∅𝐻𝐻2
𝐵𝐵𝐵𝐵𝑖𝑖𝑘𝑘𝑜𝑜 + ∅𝐻𝐻2𝑜𝑜𝑜𝑜𝑜𝑜𝑖𝑖𝑘𝑘𝑜𝑜 Eq. 2
Where ∅ =molecular flux in units of molecules / second and ∅𝐵𝐵𝐵𝐵𝑖𝑖𝑘𝑘𝑜𝑜 = reactor inlet molecular flow. 5.3 Results and Discussion
The cobalt nanoparticles were imaged by transmission electron spectroscopy after synthesis and prior to supporting in mesoporous silica (MCF-17). Over 1000 particles were counted to obtain the size distributions. The average particle size and standard deviation are reported in Table 5–1, along with other physical properties of the prepared catalysts. Figure 5–2 gives representative TEM images with the corresponding size distributions.
Nanoparticle Diameter[a]
Loading Co (wt%)[b]
BET Surface Area[c]
Metallic Co surface sites[d]
Catalyst A 4.3 nm Co
4.3 ± 0.8nm 8.4% 635 m2/g 1.88 x 10²⁰
Catalyst B 9.5 nm Co
9.5 ± 1.0nm 9.2% 632 m2/g 1.10 x 10²⁰
Table 5 - 3. Physical properties of the prepared Co nanoparticle MCF-17 catalysts. [a] From transmission electron microscopy. [b] As determined by ICP-AES. [c] Surface area of supported catalysts. [d] Calculated using values from TEM, ICP-AES, and 14.6 atoms Co/nm2.
Figure 5 - 8. Transmission electron micrographs of catalyst A (left), catalyst B (middle), and the corresponding size distributions (right) with a Gaussian fit (dotted lines).
Due to the colloidal method of preparing the Co nanoparticles, a layer of organic
capping agent (oleic acid) is present at the surface. The capping agent is removed under oxidative treatment, while a subsequent reduction step produces the Co metal. To follow these changes and to confirm removal of the capping agent, in situ x-ray spectroscopies are employed to characterize the catalyst surface under pretreatment and reaction conditions. Figure 5–3 shows the cobalt surface is carbon free after the oxidation and reduction treatments. The Co 2p signal is monitored in addition to the C 1s, and Figure 5–4 shows the changes of the Co surface at the different conditions.
Figure 5 - 9. C 1 s AP-XPS spectra taken at a photon energy of 490eV, showing the Co surface before and after exposure to CO gas.
50
Figure 5 - 10. Co 2p XPS spectra taken at 200mTorr O2 at 350°C; 200mTorr H2 at 450°C; and 100mTorr H2 + 50mTorr CO at 230°C. Co is reduced to Co0 under H2 and reaction conditions.
The chemical transient reactor allows for step changes in the gaseous composition,
and the experimental data is characterized by two distinct transient periods: the forward transient, in which a switch from He + H2 to CO + H2 turns the reaction “on”; and the backward transient, where a switch from CO + H2 to He + H2 turns the reaction “off”. The partial pressure of H2 is kept constant, while the partial pressure of He equals the partial pressure of CO.
After the forward transient switch, the online-MS signals typically stabilize after ~120 seconds on stream, marking the beginning of steady state FT operation. The steady state conversion and selectivity data for both catalyst A and B are similar to existing literature on size controlled Co catalysts for FT.[1,2] Table 2 gives the steady state data for both catalysts.
Table 5 - 4. Steady state reaction data at 230°C, H2/CO = 2. [a] Selectivity, carbon basis. [b] Olefin/Paraffin ratio.
51
Figure 5–5 gives an example of the forward transient response of catalyst A. The CO gas bottle contains 10% Ar as a tracer, which allows for the characterization of the gas-phase response of the reactor. The t = 0 time point in each of the figures in this chapter are referenced to the appearance (or disappearance in the back transient) of Ar in the outlet flow. Because Ar is inert it can be used to evaluate the theoretical response of CO in the case of no adsorption/reaction occurring – labelled ‘theoretical CO’ in Figure 5–5.
Figure 5 - 11. Forward transient switch to reaction conditions. Inset shows the first 15 seconds magnified.
Using the Ar reference, we can separate the filling of the reactor with adsorption
on the surface of the catalyst in the first seconds of the forward transient. The appearance of CO at the outlet is delayed in time from the theoretical response and exhibits a different slope – indicating the CO is undergoing adsorption and probably dissociation at the surface. The difference between the ‘theoretical CO’ and CO outlet flow values in Figure 5–5 represent the total number of CO molecules which have been adsorbed by the surface. Figure 5–6 shows the normalized outlet flow of CO during the forward transient for both catalysts. Comparing the outlet flow for catalysts’ A and B, it is obvious that the adsorption profiles are very different. Although catalyst A has more total metallic surface area than catalyst B, the surface adjusts to the new conditions much faster, as indicated by the steeper slope in the CO outlet flow and the faster time to reach steady state CO consumption. The 4.3 nm Co particles reach their steady state consumption of CO after about 20 s, whereas the 9.5 nm Co takes closer to 100 s. The faster equilibration implies that CO adsorption on smaller nanoparticles is either: faster, more energetically favourable; or limited by available sites for adsorption.
52
Figure 5 - 12. Normalized outlet flow of CO and theoretical CO for both catalysts.
Similar to previous results on a CoMgO catalyst[24], the hydrocarbons appear in order of increasing carbon number; Figure 5–7 shows the selectivity of the catalysts plotted in time. The hydrocarbons appearing sequentially confirms that a single carbon atom species is the monomer unit on both size Co catalysts. Our observations agree with theoretical models which predict the product distribution according to addition of a single carbon monomer – namely the Anderson Schulz Flory distribution.[25,26]
Figure 5 - 13. Carbon selectivity as a function of time for catalyst A (left) and B (right), showing the hydrocarbons appear in carbon number order.
Whether or not the actual monomer units are the same on both size nanoparticles, the product distributions are similar. Both catalysts produce a small amount of CO2, with CO2 appearing early after the forward switch but stabilizing very quickly to a steady state selectivity of about 1%. No alcohol formation was observed in this study. The major difference between catalyst A and B lies in the olefin production. The olefin to paraffin (O/P) ratio makes this clear; catalyst A has an O/P of 0.07, while catalyst B has an O/P ratio of 0.35, indicating the hydrogenation ability of the 4.3 nm Co is much higher than the 9.5 nm Co.[17]
53
Using data from both the online-MS and the offline GC-MS, the full carbon balance can be followed in time (Eq. 1). From the AP-XPS data, a clean, metallic cobalt surface is prepared before exposure to CO (see Figure 5–3 and 5–4). Figure 5–8 shows the carbon coverage (ΘC) versus time for both catalysts. The carbon coverage initially increases steadily for both catalysts, with the 9.5nm Co particles accumulating slightly more carbon than the smaller nanoparticles. Both size Co nanoparticles show a change in the ΘC profile around 15 seconds, with the small particles stabilizing around ΘC = 0.5 while the larger particles continue to accrue carbon with ΘC = 1.5 at 80 s. A ΘC value above 1 can be rationalized by considering that the growing chains will have multiple carbon atoms. We propose that a monomer pool is being formed in the initial seconds of the forward transient period and that the ΘC value of 0.5 is a critical value at which the surface concentration of C and H favor chain growth kinetics, producing larger hydrocarbons. Once this initial monomer pool is created, the reaction starts producing larger quantities of heavier hydrocarbons.
Figure 5 - 14. ΘC for both size Co catalysts, showing that larger Co nanoparticles can effectively “hold” more carbon per Co surface atom.
During the initial adsorption of CO, no products appear until 5 seconds after the switch to CO + H2. The first products to appear are CH4 and CO2; to understand what is occurring we consider the starting state of the catalyst. Under H2 + He, the cobalt nanoparticle surface should be covered in atomic hydrogen, as the cobalt surface is metallic and can easily dissociate H2. Upon the switch to H2 + CO, the hydrogen coverage ΘH should be much higher than typical FT conditions; thus we can expect a higher methanation rate at the initial onset of the reaction. Once a pool of carbon has built up on the surface, the values of ΘC and ΘH favor chain growth rather than methanation/termination. The smaller nanoparticles have a smaller carbon pool, and exhibit less activity whereas the larger nanoparticles have a larger amount of carbon on the surface and have higher activity (see Table 5–1). Even though catalyst A has a large metallic surface area, the number of sites for carbon seems to be limited; the 9.5 nm Co has a higher ΘC and is still more active. It appears that to promote chain propagation on cobalt, more carbon must be available on the surface. The idea of a carbon pool is not
54
new[7][8][9]; however, our results show that the carbon pool is not a by-product of the FT reaction but rather a necessary requirement for the reaction to occur.
Theoretical studies have shown agreement with the high ΘC values on fcc-Co under FT conditions[27],and that CO or deposited carbon can induce restructuring.[28,29] Recent work by van Helden et al demonstrated the variation of surface sites with fcc Co nanoparticle size;[30] interestingly, they showed that the site fractions of certain edge, step, and kink sites can actually increase with increasing nanoparticle size. Within the perspective of our present work, we propose that small variations in site fractions of B5-A, B5-B, and B6 sites of different size nanoparticles lead to large changes in the relative surface coverages of C and H atoms, as evidenced by the surface coverage of carbon. More specifically, these low coordination B5-A, B5-B, and B6 sites must correspond to either CO dissociation or chain growth sites.
In addition to monitoring the forward transient, the back transient also provides interesting information. An example of the back transient period is given in Figure 5–9; the zero time corresponds to the disappearance of Ar at the reactor outlet. Once the switch is operated and the CO inlet flow is stopped, the H2 consumption correspondingly decreases. Interestingly, both CH4 and H2 exhibit a peak during the back transient period. Figure 5–9 gives a representative example of the back transient period from catalyst A.
Figure 5 - 15. Back transient switch from CO + H2 to He + H2.
At the onset of the back transient period, the switch from CO + H2 to He + H2
creates a pseudo zero order hydrogen environment for the surface bound species. We assume here that any and all carbon species on the surface are hydrogenated during the back transient period – clean C 1 s spectra (see Figure 5–3) prove that the carbon removal from the surface is complete during the back transient. From Figure 5–9 it is
55
clear that methane increases substantially after CO is removed from the reactor, and this phenomena is observed for both catalysts. This is additional proof that the most abundant species on the surface during steady state FT operation appears to be a single carbon monomer.
Interestingly, the consumption of molecular hydrogen as a reactant shows a distinct peak after the back transient switch (Figure 5–9). The surface flux calculation (Eq. 2) uses a sign convention of negative for adsorption and positive for desorption. Overall, the catalysts are adsorbing hydrogen (negative value, right axis); however the upward facing peak can only be obtained by surface species desorbing. The slow increase of H2 over 80 s in Figure 5–9 corresponds to the emptying of the surface of remaining carbon monomer units – which is why the CH4 exhibits a similar time dependent tailing.
To understand why there is an observed peak in H2 desorption from the surface, we must assume there exists a supply of hydrogen similar to the carbon pool proposed earlier. Some of this surface hydrogen is used for chain propagation and growth, while some hydrogen is used for dissociation of CO.[31,32] When the back transient switch is operated, the CO flow stops, cutting off the carbon reactant supply to the surface. Once CO stops, the hydrogen pool which has been used to help dissociate CO is not needed and desorbs from the surface. By integrating the area of the hydrogen desorption peak, an estimate on the number of CO dissociation sites available on each catalyst is obtained.
Figure 5 - 16. Integrated H2 surface flow normalized by corresponding type of site for both catalysts.
To identify the specific CO dissociation site corresponding to the observed H2
desorption peak, normalizing the integrated H2 desorption peak by the number of dissociation sites for each size nanoparticle should give equal values. Figure 5–10 gives the ratio of desorbed hydrogen to the type of surface site (using estimates of surface site
56
fractions from van Helden et al). When normalizing the H2 peak by B5-B sites, both 4.3 nm and 9.5 nm Co give a similar value. Given that the reaction conditions are kept constant and assuming the absence of large energetic differences in reactant absorption, then the B5-B site should correspond to the major CO dissociation site on Co nanoparticles.
5.4 Conclusion
The loss of activity with smaller Co nanoparticles can now be explained by the structure sensitivity of the FT reaction to specific Co sites. Theoretical work has shown that B5-B sites continue to increase in concentration with increasing nanoparticle size[30] and this increase in CO dissociation sites leads to: higher ΘC values and thus higher activity. Our data confirms that it is a structural factor which influences the activity of the catalyst, with the presence of H2 assisted CO dissociation sites in larger quantities for larger particles.
5.5 References [1] G. L. Bezemer, J. H. Bitter, H. P. C. E. Kuipers, H. Oosterbeek, J. E. Holewijn, X. Xu, F. Kapteijn, A. J. Van Dillen, K. P. de Jong, J. Am. Chem. Soc. 2006, 128, 3956–3964.
[2] G. Melaet, A. E. Lindeman, G. a. Somorjai, Top. Catal. 2013, 57, 500–507.
[3] C. Lancelot, V. V. Ordomsky, O. Stéphan, M. Sadeqzadeh, H. Karaca, M. Lacroix, D. Curulla-Ferré, F. Luck, P. Fongarland, A. Griboval-Constant, et al., ACS Catal. 2014, 4, 4510–4515.
[4] E. Van Steen, M. Claeys, M. E. Dry, J. Van De Loosdrecht, E. L. Viljoen, J. L. Visagie, J. Phys. Chem. B 2005, 109, 3575–3577.
[5] J. Couble, D. Bianchi, J. Phys. Chem. C 2013, 117, 14544–14557.
[6] P. Biloen, J. Mol. Catal. 1993, 21, 17–24.
[7] S. L. Shannon, J. G. Goodwin, Chem. Rev. 1995, 95, 677–695.
[8] C. Ledesma, J. Yang, D. Chen, A. Holmen, ACS Catal. 2014, 4, 4527–4547.
[9] G. Jacobs, B. H. Davis, Catal. Sci. Technol. 2014, 4, 3927–3944.
[10] J. Yang, E. Z. Tveten, D. Chen, A. Holmen, 2010, 228, 16558–16567.
[11] J. T. Gleaves, G. S. Yablonskii, P. Phanawadee, Y. Schuurman, Appl. Catal. A Gen. 1997, 160, 55–88.
[12] J. T. Gleaves, G. Yablonsky, X. Zheng, R. Fushimi, P. L. Mills, J. Mol. Catal. A Chem. 2010, 315, 108–134.
57
[13] A. A. Khodadadi, R. R. Hudgins, P. L. Silveston, Can. J. Chem. Eng. 1998, 76, 239–247.
[14] R. J. Berger, F. Kapteijn, J. A. Moulijn, G. B. Marin, J. De Wilde, M. Olea, D. Chen, A. Holmen, L. Lietti, E. Tronconi, et al., Appl. Catal. A Gen. 2008, 342, 3–28.
[15] J. Schweicher, A. Bundhoo, N. Kruse, J. Am. Chem. Soc. 2012, 134, 16135–16138.
[16] G. Melaet, W. T. Ralston, W.-C. Liu, G. A. Somorjai, Catal. Today 2016, 272, 69–73.
[17] J. den Breejen, P. B. Radstake, G. L. Bezemer, J. H. Bitter, V. Frøseth, A. Holmen, K. P. de Jong, J. Am. Chem. Soc. 2009, 7197–7203.
[18] J. Yang, V. Frøseth, D. Chen, A. Holmen, Surf. Sci. 2016, 648, 67–73.
[19] V. Iablokov, S. K. Beaumont, S. Alayoglu, V. V Pushkarev, C. Specht, J. Guo, a P. Alivisatos, N. H. Kruse, G. A. Somorjai, J. Gao, et al., Nano Lett. 2012, 12, 3091–3096.
[20] P. Schmidt-Winkel, W. W. Lukens, D. Zhao, P. Yang, B. F. Chmelka, G. D. Stucky, J. Am. Chem. Soc. 1999, 121, 254–255.
[21] M. E. Grass, P. G. Karlsson, F. Aksoy, M. Lundqvist, B. Wannberg, B. S. Mun, Z. Hussain, Z. Liu, Rev. Sci. Instrum. 2010, 81, DOI 10.1063/1.3427218.
[22] M. A. Marcus, A. A. MacDowell, R. Celestre, A. Manceau, T. Miller, H. A. Padmore, R. E. Sublett, J. Synchrotron Radiat. 2004, 11, 239–247.
[23] S. Alayoglu, S. K. Beaumont, G. Melaet, A. E. Lindeman, N. Musselwhite, C. J. Brooks, M. A. Marcus, J. Guo, Z. Liu, N. Kruse, et al., J. Phys. Chem. C 2013, 117, 21803–21809.
[24] G. Melaet, W. T. Ralston, W. C. Liu, G. A. Somorjai, J. Phys. Chem. C 2014, 118, 26921–26925.
[25] G. Henrici-Olive, S. Olive, Angew. Chemie Int. Ed. English 1976, 15, 136–141.
[26] R. B. Anderson, J. Catal. 1978, 55, 114–115.
[27] M. C. Valero, P. Raybaud, J. Phys. Chem. C 2014, 118, 22479–22490.
[28] I. M. Ciobîcǎ, R. A. van Santen, P. J. van Berge, J. van de Loosdrecht, Surf. Sci. 2008, 602, 17–27.
[29] X. Zhang, R. A. Van Santen, E. J. M. Hensen, 2015, 596–601.
[30] P. van Helden, I. M. Ciobîcă, R. L. J. Coetzer, Catal. Today 2015, 261, 48–59.
[31] O. R. Inderwildi, S. J. Jenkins, D. A. King, 2008, 1305–1307.
58
[32] M. Ojeda, R. Nabar, A. U. Nilekar, A. Ishikawa, M. Mavrikakis, E. Iglesia, J. Catal. 2010, 272, 287–297.
59
Chapter 6 – High-Performance Hybrid Oxide Catalyst of Manganese and Cobalt for Low-Pressure Methanol Synthesis Abstract Carbon dioxide capture and use as a carbon feedstock presents both environmental and industrial benefits. Here we report the discovery of a hybrid oxide catalyst comprised of manganese oxide nanoparticles supported on mesoporous spinel cobalt oxide which catalyzes the conversion of carbon dioxide to methanol at high yields. In addition, carbon-carbon bond formation is observed through the production of ethylene. We document the existence of an active interface between cobalt oxide surface layers and manganese oxide nanoparticles by using X-ray absorption spectroscopy and electron energy loss spectroscopy in the scanning transmission electron microscopy mode. Through control experiments, we find that the catalyst’s chemical nature and architecture are the key factors in enabling the enhanced methanol synthesis and ethylene production. To demonstrate the industrial applicability, the catalyst was also run under high conversion regimes, showing its potential as a substitute for current methanol synthesis technologies. *This chapter covers similar material as in Li, CS., Melaet, G., Ralston, WT., An, K., Brooks, C., Ye, Y., Liu, Y., Zhu, J., Guo, J., Alayoglu, S., Somorjai, GA. Nat. Commun. 2015, 6:6538. – reproduced with permission, copyright 2015 Macmillan Publishers Limited.
60
6.1 Introduction Carbon dioxide is a harmful greenhouse gas produced in large quantities as a
byproduct in many industrial processes and in the generation of electricity.[1] In order to decrease emissions and prevent the increase of atmospheric carbon dioxide, carbon capture technologies have emerged to harvest, store, and transport the gas. The efficient utilization of these CO2 sources to produce fuel or higher value chemicals is the subject of much research interest, as CO2 makes an alternative, economical carbon feedstock.[2] An attractive possibility is methanol production:
CO2 + 3H2 CH3OH + H2O Eq. 1
It is an easily transportable fuel; fuel cell technology already exists (direct methanol fuel cells); and it can be used as a precursor for many valuable chemical intermediates.
A number of catalytic and electrocatalytic reaction schemes over various catalysts have been documented for the hydrogenation of CO2.[3–7] Electrocatalytic and photo-electrocatalytic routes show promise, but selective reduction of CO2 to methanol with a low overpotential is difficult.[8–10]
Homogeneous systems have been demonstrated, such as iridium catalysts for use in basic aqueous media at elevated pressure[11], or ruthenium based single site organometallic catalysts for hydrogenation of supercritical CO2 to make formic acid.[12,13] Even non-metal Lewis pairs have been successfully implemented as phase-transfer catalysts to solubilize and reduce CO2.[14,15]
Heterogeneously, Cu/ZnO supported in Al2O3 catalyzes methanol synthesis with selectivity (>50%) via hydrogenation of CO2 at high pressures (>20bar).[16] More recently, a Ni-Ga heterogeneous catalyst was reported as an alternative to traditional Cu/ZnO/Al2O3 methanol synthesis.[6] However, there is yet no chemically, catalytically, and economically viable substitute for Cu such as to hydrogenate CO2 to methanol in high yields.
In this paper we report a highly active and highly selective hybrid oxide catalyst composed of manganese oxide nanoparticles supported on a mesoporous cobalt oxide support for the production of methanol under mild pressure and temperature conditions. The nature of the interfacial domains of the catalyst is shown to be extremely important, as the activities of the individual catalyst components are lower and less selective to methanol, emphasizing the importance of the hybrid architecture. 6.2 Experimental Catalyst Preparation Nanoparticles (NPs) of 8.0 ±0.7 nm CoOx
[17] and 6.1 ±1.0 nm MnOx
[18] (Figure 6–1), and mesoporous supports[19,20] of Co3O4 and MnO2 (Figure 6–2) were synthesized according to the literature reports. Nanoparticle syntheses were carried out using standard Schlenk line techniques. Synthesis of 8 nm Co nanoparticles
150 μL oleic acid (Aldrich, 99%) was degassed and argon purged for three times in a 250 mL three-neck round bottom flask fitted with a condenser column. Then, 12 mL
61
dichlorobenzene (DCB, Aldrich, anhydrous 99%) was transferred into the flask airless, and temperature of the flask was raised to 169oC (about 5°C/min). Finally, 0.444g Co2(CO)8 (Strem Chemicals, stabilized with 1-5% hexanes) dissolved in 3 mL DCB was injected into the flask by using a 50 mL airtight syringe. The reaction was allowed to proceed for 20 minutes. After the heater was turned off, 13 mL DCB was poured into flask, and the colloidal suspension was allowed to cool down. The Co nanoparticles were collected by centrifugation and re-dispersed in 10 mL chloroform for further use.
Synthesis of 6 nm MnO nanoparticles
For the synthesis of Mn-oleate, 7.92 g MnCl2·4H2O (40 mmol, Aldrich 98%) and 24.36g sodium oleate (80 mmol, TCI, 95%) were injected into a mixture of 30 mL of ethanol, 40 mL of deionized H2O and 70 mL n-hexane at 70oC under magnetic stirring. The mixture was allowed to react for 4 hours. The solution of Mn-oleate (i.e. organic phase) was collected by using a separation funnel, and aqueous phase (i.e. NaCl solution) was discarded. The Mn-oleate salt was collected by using a rotating evaporator.
To synthesize 6 nm MnO nanoparticles, 1.24g Mn-oleate (about 2 mmol) was dissolved in 10 g of 1-octadecene (Aldrich, 98%) in a 50 mL round bottom flask. After degasing at 70oC for 1 hour, temperature of the flask was ramped to 310oC (1.9oC/min). The color of solution started to change from pink to transparent, then to pale green when temperature reached 310oC. The reaction was allowed to reflux for 10 minutes. The MnO nanoparticles were collected by centrifugation and re-dispersed in chloroform for further use.
Mesoporous Co3O4 and MnO2 For the typical synthesis of KIT-6, 27 g of P123 (Sigma-Aldrich, Mw = ∼5800) and 43.5 ml of concentrated HCl were dissolved in 980 ml of water. Then, 33.3 ml of n-butanol was added to the solution at 35 °C with vigorous stirring. After 1 h of stirring, 58 g of tetraethyl orthosilicate (Sigma-Aldrich, 99%) was added to the solution followed by stirring at 35 °C for 24 h. The mixture was reacted hydrothermally at 40 °C overnight. The filtered solid was dried and calcined at 550 °C for 6 h. To prepare mesoporous Co3O4 or MnO2, 4.7 g of cobalt (II) nitrate hexahydrate (Co(NO3)2·6H2O, Sigma-Aldrich, 98%) or 4.0 g of manganese (II) nitrate tetrahydrate (Mn(NO3)2·4H2O, Sigma-Aldrich, 97%) dissolved in 8 mL of water was mixed with 4 g of KIT-6 and 50 mL of toluene at 65 °C. After evaporating the toluene and water, the solid was collected and calcined at 300 °C for 6 h in air. Then, 2 M NaOH aqueous solution at 60 °C was added to the solid and the solution was shaken to dissolve the silica template. After centrifugation, the precipitate was washed with deionized water. The washing with the NaOH solution and deionized water was repeated three times to remove the silica template completely. Mesoporous Co3O4 or MnO2 replicas were obtained after three cycles of centrifugation and drying. MnOx/m-Co3O4 catalysts A hybrid oxide catalyst comprised of MnOx nanoparticles supported on mesoporous Co3O4 was prepared by the capillary inclusion method. Briefly, a desired amount of MnOx nanoparticle colloids dispersed in chloroform were diluted with 40 ml of n-hexane and mixed with mesoporous Co3O4. The mixture was sonicated for 3 h at
62
room temperature. The precipitate was collected by centrifugation, and washed with a 50:50 v/v mixture of acetone and ethanol five times. The precipitated solid was dried at 80 °C overnight.
Previously, we reported that 10 nm CoOx NPs gave rise to the highest CO2 hydrogenation activity measured over SiO2 and TiO2 supports.[17] Nonetheless, 8 nm CoOx NPs have been chosen for this study as a compromise between optimal activity and comparable particle sizes with MnOx NPs that could be synthetically produced. MnOx NPs were supported in mesoporous Co3O4 or mesoporous SiO2 (MCF-17) by sonicating a colloidal suspension of nanoparticles and mesoporous oxide followed by a series of centrifuging and washing cycles. The final supported catalysts, denoted as MnOx/m-Co3O4 and MnOx/m-SiO2, respectively, were dried overnight in an oven at 100°C before catalytic testing. Similarly, CoOx NPs were supported in mesoporous MnO2 or mesoporous SiO2 (MCF-17) and labeled as CoOx/m-MnO2 and CoOx/m-SiO2, respectively. Surface Area Measurements
BET measurements were performed using a Micromeritics ASAP 2020 porosity instrument. BET surface areas were evaluated for the reduced catalysts as well as the pristine catalysts (Table 1). The reductive treatment was carried out in 1 bar H2 for one hour and at three temperatures; 250°C, 350°C and 450°C, separately. Evaluation of Catalyst Loading
Zeiss Ultra55 analytical scanning electron microscopy (SEM) equipped with an EDAX energy dispersive spectrometer (EDS) was employed to determine the loadings of CoOx/m-MnO2 and MnOx/m-Co3O4 catalysts. An average of ten EDS spectra that were taken at both low magnification (300x) and high magnification (25,000x) were used to calculate the % wt. Co (CoOx/m-MnO2 and CoOx/m-SiO2) or Mn (MnOx/m-Co3O4 and MnOx/m-SiO2), shown in Table 1. Turnovers were calculated from BET surface areas and known surface packing densities of cubic (space group Fm-3m) CoO and MnO. STEM/EELS Studies and Analysis
JEOL 2100F transmission electron microscopy (TEM) was used in the scanning mode along with a GIF Tridiem Gatan electron energy loss spectrometer (EELS) and an Inca EDS. STEM/EELS studies were performed at an accelerating voltage of 120 kV. Convergence and collection semi-angles were 12 mrad. Full width half maximum (FWHM) of the zero loss peak was measured to be ~1 eV at a dispersion of 0.2 eV per channel (2048 channels). Elemental analysis was carried out by using the standard Gatan/EELS software assuming a power law for the pre-edge background and the hydrogenic model for quantification. The results of quantification are tabulated in Table 1. For the analysis of Mn and Co L edge spectra, a slightly modified procedure developed by Pennycook and co-workers was employed[21], as illustrated in Figure 6–5. Following the pre-edge removal, two step functions, one at each of the L3 and L2 edges and of the same amplitude as the edge jump were further subtracted from the data. Least-squares fittings of the L3 and L2 white line peaks were carried out by constraining amplitude, loss energy and FWHM. Refined amplitudes were used to calculate the L3/L2
63
ratios. STEM/EDS studies were carried out at an accelerating voltage of 200 kV with the holder tilted 15° to the EDS detector.
XAS Studies and Analysis
Synchrotron-based X-ray absorption spectroscopy (XAS) was performed on beamlines 6.3.1.2 (ISAAC) and 8.0.1 (wet-RIXS) at the Advanced Light Source at the Lawrence Berkeley National Laboratory. Co and Mn L XAS spectra were collected in the ~10-8 mbar base pressure in the total electron yield (TEY) mode by measuring the compensating electron flow from earth to sample. The X-ray absorption spectra were first normalized relative to X-ray flux. Next the pre-edge background was removed, and the reduced data was normalized relative to step edge. Linear combination fittings of the reference spectra to the sample were carried out to obtain relative atomic fractions. Catalytic Tests and Conditions
Catalytic testing was performed using a home-built plug-flow reactor operating in a temperature range of 200-450°C and a pressure range of 1-6 bar. The catalysts were conditioned at 350°C first in flowing 50 vol.% dry air in balance He followed by flowing 20 vol.% H2 in balance He for one hour each, separated by a 15 min He flush (50 sccm) between the two steps. Select catalysts were separately reduced at 250°C, 450°C as well as 350°C. The catalytic hydrogenation of CO2 was carried out at 6 bar of He:H2:CO2 (6.4:20.7:16.7) flowing at 42 sccm (delivered via carefully calibrated MKS mass flow controllers). The reactants and products, separated via SS columns packed with 5Ȧ molecular sieves, were monitored online using a HP 5890 II gas chromatograph equipped with a thermal conductivity detector and a flame ionization detector. Catalyst charges of 2-100 mg were used for catalyst testing. All catalysts were evaluated in the low conversion regime of 3-7%, and select catalysts were also run in the high conversion regime (i.e. limited by reverse water gas shift reaction) of 50-60% range. Space velocity was kept constant at about 150,000 h-1 by mixing catalysts with m-SiO2 (MCF-17) in the reactor bed. The catalytic reaction was carried out for more than 15 hours and the reported turnovers and yields were calculated after this stability run. Nanoparticles of CoOx and MnOx supported in m-SiO2 and pure mesoporous oxides were used as control catalysts. Chemical & morphological properties of the as-made catalysts
The as-synthesized catalysts were characterized by STEM and XAS. STEM/EDS phase spectra indicated Mn was well dispersed over a Co matrix, while STEM/EELS point spectra, taken at 11 edge positions on various oxide grains, showed average O/(Co+Mn) and Mn/(Co+Mn) ratios of 1.4 and 0.04, respectively (see Figure 6–6). Furthermore, XAS TEY revealed Mn (i.e. Mn L) with (II), (III), and (IV) redox centers and Co (i.e. Co L) in a pure spinel ordered Co3O4 phase for the MnOx/m-Co3O4 catalyst. The initial chemical composition of the MnOx NPs was determined as MnO:Mn3O4:MnO2 (0.3:0.5:0.2) with a very small concentration of Mn2O3 (about 0.01).
64
BET Surface Area (m2/g) Nanoparticle Atomic %
Pristine 250°Ca 350°Ca 450°Ca SEM/EDSb
STEM/EDSc
STEM/EELSd
MnOx / Co3O4 80.0 75.3 37.4 22.6 1.6 2.5 4.6
CoOx / MnO2 56.0 12.0 11.0 9.0 5.1 6.3 7.2
Table 6 - 1. Physical Properties of Co-Mn catalysts. [a] H2 reduction temperature. [b] Average of 10 EDS spectra obtained at 20kV and in the 300 – 2000x magnification range. [c] Average of more than 10 single particle (ie individual oxide/oxide grains) EDS map spectra. [d] Average of more than 10 EELS point spectra obtained at 100kV.
6.3 Results
The resulting nanoparticle size distributions of Co or Mn nanoparticles is given in Figure 6–1 along with representative TEM and HRTEM images. Both the Co nanoparticles in mesoporous MnO2 and Mn nanoparticles in mesoporous Co3O4 showed a homogeneous dispersion on the support, as shown by scanning transmission electron microscopy (STEM) mapping in Figure 6–2.
Figure 6 - 1. TEM characterization of the as-synthesized Mn and Co nanoparticles. Representative TEM (a and d); HRTEM (b and e); and the corresponding particle size distributions for MnOx (c) and CoOx (f) nanoparticles.
65
Figure 6 - 2. STEM/EDS characterization of hybrid oxide catalysts. Representative STEM images (a and d) and the EDS spectral maps at Co K (b and e) and Mn K (c and f) emission lines for the as-prepared MnOx/m-Co3O4 (a-c) and CoOx/m-MnO2 (d-f).
Control of activity and selectivity through the formation of specific interfacial
domains reveals to be highly efficient in the case of CO2 hydrogenation to methanol. We obtained 30% methanol selectivity and 0.18 s-1 yield for a hybrid catalyst consisting of MnOx NPs supported on mesoporous Co3O4 (m-Co3O4). The turnover frequency (TOF) of this catalyst compared with the support alone (m-Co3O4) or the MnOx NPs supported on mesoporous SiO2 (m-SiO2) is 3 and 25 times higher, respectively (see Figure 6–1). In terms of selectivity, the differences between our hybrid catalyst and its parent components are very pronounced as depicted by Figure 6–2. The cobalt support alone produces 35% of CO, 35% of CH4 and ~20% of methanol; the MnOx NPs produce primarily CO with a selectivity peaking at 85%. Another unique attribute of this catalyst is its ability for C–C bond formation. In addition to the high methanol yield, the catalyst produces ethylene (~10%).
66
Figure 6 - 3. Catalytic performance of the different catalysts. A) Activity expressed in terms of turnover frequency of the cobalt oxide support, the manganese nanoparticles supported on cobalt oxide and the manganese nanoparticles support on inert SiO2. B) Yield of these catalysts towards ethylene, methanol, and dimethyl ether.
Figure 6 - 4. Selectivity of various products during the hydrogenation of CO2 at 250°C for the catalysts listed in the legend.
67
The reason for its higher activity and better selectivity is linked to the structure of the catalyst that we identify as uniformly distributed grains of metallic cobalt cores with thin cobalt oxide shells in contact with the manganese oxide. This picture was derived from X-ray absorption spectroscopy (XAS) in the total electron yield (TEY) mode and electron energy-loss spectroscopy (EELS) in the scanning transmission electron microscopy (TEM) mode, and will be discussed below. The EELS technique, which gives bulk information, indicates the predominance of metallic cobalt. From a fresh to spent catalyst, the oxygen average for cobalt, plotted as a function of the cobalt L3 to L2 edge ratio, goes from 1.4 to 0.3 (see Figures 6 –5 and 6–6). The former value suggests the existence of a spinel cobalt oxide phase (that is, for m-Co3O4 the cobalt to oxygen theoretical ratio is 1.34), whereas the latter confirms a more metallic nature (~70%) of the grain. Manganese is only present in 1 wt. % and does not alter the conclusions arrived at above.
Figure 6 - 5. Representative STEM image (a) and the corresponding EELS point spectrum (b) showing O K and Mn, Co L edges for the MnOx/m-Co3O4 catalyst. Representative protocol (c) for the analysis of L3 and L2 loss spectra.
68
Figure 6 - 6. EELS characterization: representative STEM images of the pristine (a) and spent (b) MnOx/m-Co3O4 catalysts. The corresponding EELS point spectra (c) measure from the spots marked with the red dots in (a). Plots of O/(Co + Mn) vs L3/L2 ratios for the pristine (black diamonds) and spent (red circles) catalyst obtained from the EELS analysis. Stars in (d) show the values averaged over ten EELS spectra for each catalyst. Scale bars are 50 nm.
Contrastingly, the surface sensitive XAS in TEY measurement shows the following (Figure 6–7): the spinel Co3O4 phase of the support disappeared completely in favor of cobalt (II) oxide (from 0 to 80%; see Figures 6–8 and 6–9); the fraction of metallic cobalt increases as well in the spent catalyst (from 0 to 20%; Figure 6–9). The complimentary information gained from these techniques indicates that most of the grain is metallic, while the surface appears to be mainly a cobalt oxide, leading to the conclusion previously stated of the core/shell grain structure.
69
Meanwhile, the manganese oxide is also the subject of a reduction from Mn(IV) and Mn(III) to Mn (II). The result shows that the spent NPs are mainly made of MnO with a small amount of spinel oxide (Mn3O4).
Figure 6 - 7. X-ray absorption spectra (XAS) of (a) Mn L3 edge and (b) Co L3 edge comparing the fresh and spent MnOx/m-Co3O4 catalysts. The changes in the profile of these spectra evidence the change in the oxidation state for both the Co and Mn. Arrows indicate relative changes in oxidation states.
Figure 6 - 8. Co L edge XAS characterization of spent MnOx/m-Co3O4 catalyst conditioned in H2 at (a) 250°C, (b) 350°C and (c) 450°C. (d) Mn L edge XAS TEY spectra obtained for the spent MnOx/m-Co3O4 catalyst conditioned in H2 at 350°C.
70
Figure 6 - 9. Elemental fractions determined by XAS: metallic Co (blue), CoO in octahedral (dark green) and tetrahedral (light green) coordination, and spinel ordered Co3O4 (purple) for fresh and spent MnOx/m-Co3O4 catalysts: conditioned in H2 at 250°C (spent1), 350°C (spent2-[low conversion] and spent3-[high conversion]) and 450°C (spent4).
6.4 Discussion The active catalyst is produced by temperature reduction at 350˚C, and we have
investigated the effect of different hydrogen reduction temperatures on the activity of the catalyst. At higher reduction temperature, i.e. 450˚C, the catalytic TOF drops (Figure 6–10) which we cannot link to the change in overall surface area. Instead, we have correlated this drop to the increasing concentration of metallic cobalt at the surface as indicated by XAS in Figures 6–8 and 6–9. These results evidence the importance of the CoO phase in contact with the MnOx phase.
Figure 6 - 10. (a) TOF for various catalysts tested and (b) yields for ethylene, methanol, and dimethylether. The temperatures listed in (b) indicated the H2 reduction temperature used before running CO2 hydrogenation at 250°C.
71
We believe that the existence of a MnOx/CoO interface is paramount to the enhanced activity of the catalyst. A possible explanation is that the presence of manganese NPs helps reduce the CO2 to CO species, which can further react with surface layer CoO of the support, responsible for the formation of methanol and chain growth (ethylene). Our hypothesis is based on the fact that the selectivity of the nanoparticles towards CO is extremely high. One would expect the hybrid catalyst’s selectivity towards CO to be additive, whereas the hybrid is even lower than m-Co3O4 alone. To verify our hypothesis, we produced an inverted hybrid catalyst, i.e., CoOx NPs supported on mesoporous-MnO2 (m-MnO2). In this case, the activity of the inverted catalyst is dominated by the support, as its selectivity is similar to that of the m-MnO2 support (i.e. both primarily produce CO as indicated in Figure 6–4). These results prove that the architecture and chemical nature of the interface is vital to the activity of a catalyst.
Figure 6 - 11. Selectivity of CO, CH4, ethylene, and methanol at low (solid) and high (dashed) conversion regimes at 250°C for the MnOx/m-Co3O4 catalyst.
Finally, we investigated the industrial applicability of our hybrid catalyst as shown in Figure 6–11. We have compared the catalyst at different conversions under the same conditions (4 bar and 250˚C), demonstrating an even higher selectivity toward methanol than the one observed for low conversion (from 30 to 45%). Previous reports on Cu/ZnO methanol catalysts at high pressures (10 to 50 atm) show methanol yields on the order of 0.01 – 0.020 s-1 [16,22] with variations depending on preparation and pretreatment.[23] Our catalyst has a methanol yield of 0.18 s-1, approaching a ten-fold increase in activity. In addition, a recent paper by Studt et al.[6], provides a yield at comparable pressure conditions to our catalyst of 6*10-5 s-1. Thus not only is the
72
MnOx/m-Co3O4 catalyst more active, but compared to current Cu/ZnO methanol catalysts, our hybrid catalyst works under milder conditions, which make it an attractive alternative. The substantial savings in the cost and energy consumption make it an environmentally friendly catalyst in phase with the development of a more sustainable and greener industry.
6.5 Conclusion In this study, we reported the discovery of a highly active and selective methanol
synthesis catalyst comprised of MnOx nanoparticles supported in mesoporous cobalt oxide. In addition to methanol, ethylene was produced in modest quantities, indicating carbon-carbon bond formation pathways. Based on surface sensitive XAS and EELS in the scanning TEM mode, we determined the active phase of the catalyst as MnO nanoparticles dispersed over the grains of cobalt comprised of CoO surfaces with metallic Co cores. The existence of a MnO/CoO interface facilitated an activity enhancement towards methanol synthesis, compared to the separate nanoparticles and supports. The importance of the nature and architecture of the interfacial domains was highlighted by the use of an inverted catalyst. Catalytic runs under higher conversions demonstrated potential industrial applications, as methanol selectivity increases at expense of CO.
6.6 References [1] S. Solomon, G.-K. Plattner, R. Knutti, P. Friedlingstein, Proc. Natl. Acad. Sci. U. S.
A. 2009, 106, 1704–9. [2] H. V. M. Hamelers, O. Schaetzle, J. M. Paz-García, P. M. Biesheuvel, C. J. N.
Buisman, Environ. Sci. Technol. Lett. 2014, 1, 31–35. [3] J. Graciani, K. Mudiyanselage, F. Xu, A. E. Baber, J. Evans, S. D. Senanayake, D.
J. Stacchiola, P. Liu, J. Hrbek, J. F. Sanz, et al., Science (80-. ). 2014, 345, 546–550.
[4] J. F. Hull, Y. Himeda, W.-H. Wang, B. Hashiguchi, R. Periana, D. J. Szalda, J. T. Muckerman, E. Fujita, Nat. Chem. 2012, 4, 383–388.
[5] G. A. Olah, A. Goeppert, G. K. S. Prakash, J. Org. Chem. 2009, 74, 487–498. [6] F. Studt, I. Sharafutdinov, F. Abild-Pedersen, C. F. Elkjær, J. S. Hummelshøj, S.
Dahl, I. Chorkendorff, J. K. Nørskov, Nat. Chem. 2014, 6, 320–4. [7] D. Kim, J. Resasco, Y. Yu, A. M. Asiri, P. Yang, Nat. Commun. 2014, 5, 4948. [8] B. a Rosen, A. Salehi-khojin, M. R. Thorson, W. Zhu, D. T. Whipple, P. J. a Kenis,
R. I. Masel, Science (80-. ). 2011, 334, 643–645. [9] E. Barton Cole, P. S. Lakkaraju, D. M. Rampulla, A. J. Morris, E. Abelev, A. B.
Bocarsly, J. Am. Chem. Soc. 2010, 132, 11539–11551. [10] Y. Chen, C. W. Li, M. W. Kanan, J. Am. Chem. Soc. 2012, 134, 19969–19972.
73
[11] R. Tanaka, M. Yamashita, K. Nozaki, J. Am. Chem. Soc. 2009, 131, 14168–14169. [12] P. G. Jessop, T. Ikariya, R. Noyori, Nature 1994, 368, 231–233. [13] P. G. Jessop, Y. Hsiao, T. Ikariya, R. Noyori, J. Am. Chem. Soc. 1996, 118, 344–
355. [14] A. E. Ashley, A. L. Thompson, D. O’Hare, Angew. Chemie - Int. Ed. 2009, 48,
9839–9843. [15] G. Ménard, D. W. Stephan, J. Am. Chem. Soc. 2010, 132, 1796–1797. [16] K. C. Waugh, Catal. Today 1992, 15, 51–75. [17] G. Melaet, W. T. Ralston, C.-S. Li, S. Alayoglu, K. An, N. Musselwhite, B.
Kalkan, G. A. Somorjai, J. Am. Chem. Soc. 2014, 136, 2260–2263. [18] J. Park, K. An, Y. Hwang, J.-G. Park, H.-J. Noh, J.-Y. Kim, J.-H. Park, N.-M.
Hwang, T. Hyeon, Nat. Mater. 2004, 3, 891–895. [19] K. An, S. Alayoglu, N. Musselwhite, S. Plamthottam, G. Melaet, A. E. Lindeman,
G. A. Somorjai, J. Am. Chem. Soc. 2013, 135, 16689–16696. [20] S. Royer, D. Duprez, ChemCatChem 2011, 3, 24–65. [21] M. Varela, M. P. Oxley, W. Luo, J. Tao, M. Watanabe, a. R. Lupini, S. T.
Pantelides, S. J. Pennycook, Phys. Rev. B - Condens. Matter Mater. Phys. 2009, 79, 1–14.
[22] F. Arena, K. Barbera, G. Italiano, G. Bonura, L. Spadaro, F. Frusteri, J. Catal. 2007, 249, 185–194.
[23] C. Baltes, S. Vukojević, F. Schüth, J. Catal. 2008, 258, 334–344.
74
Chapter 7 – Soft X-ray Spectroscopy Studies of Adsorption and Reaction of CO in the Presence of H2 over 6nm MnO Nanoparticles Supported on Mesoporous Co3O4 Abstract MnO nanoparticles (6 nm) were supported on mesoporous spinel Co3O4 and studied using ambient pressure X-ray photoelectron spectroscopy (AP-XPS) and in situ X-ray absorption spectroscopy (XAS) during hydrogenation of CO. The nature and evolution of surface adsorbed species as well as the oxidation states of the metal oxide surfaces were evaluated under oxidizing, reducing, and H2+CO (2:1) reaction atmospheres. From APXPS, MnO nanoparticle surfaces were found to be progressively reduced in H2 atmospheres with increasing temperature. Surface adsorbed CO was found to be formed at the expense of lattice O under H2+CO reaction conditions. In situ XAS indicated the dominant oxide species were Co(OH)2, Co (II) oxides, MnO, Mn3O4 under reaction conditions. In situ XAS also indicated the formation of gas phase CO2, the disappearance of lattice O, and the further reduction of Mn3O4 to MnO upon prolonged reaction in H2+CO. Operando mass spectroscopy measurements showed the formation of CO2 and hydrocarbons. The spent catalyst was investigated using scanning transmission X-ray microscopy and (scanning) transmission electron microscopy; the catalyst grains were found to be homogeneous. *This chapter covers similar material as in Ralston, WT., Kennedy, G., Musselwhite, N., Horowitz, Y., Cordones-Hahn, A., Rude, B., Ahmed, M., Melaet, G., Alayoglu, S. Surface Sci. 2015, 648, 14-22.
75
7.1 Introduction Understanding and controlling a catalyst’s surface has long been the goal of
fundamental research in heterogeneous catalysis. However, understanding an industrial catalyst is complex; not only is the surface non-homogeneous, but they often contain multiple components. To overcome this complexity, yet retain the catalytic nature of the surface, model nanoparticle catalysts are used to bridge this so–called ‘materials gap’. A variety of strategies are employed to produce model nanoparticle catalysts, such as colloidal synthesis [1–4] and in situ deposition [5–8]. Many case examples of size- [9–19], shape- [20–26,2,3] and composition- [27–29,2] controlled nanoparticles, utilizing the colloidal synthesis approach, have been reported in the past decade.
In addition to model surfaces, in situ techniques are vital to probing surface properties as catalytic reactions take place. The study of these materials’ surfaces was made possible with the proliferation of high intensity X-ray sources (ref) and specialized instrumentation allowing for in situ spectroscopic characterization at pressures above high vacuum. Sum frequency generation vibrational spectroscopy (SFGVS) [30–33] and ambient pressure X-ray photoelectron spectroscopy (AP-XPS) [34–36,18,28] are among the surface techniques widely employed to investigate nanoparticle surfaces under relevant conditions. Structure-function correlations can be made using model nanoparticle surfaces and these in situ surface techniques.
The dynamic nature of surfaces has been well-documented [6,35], highlighting the importance of studying a model nanoparticle catalyst’s surface under reaction conditions. For example, under CO oxidation conditions, spinel Co3O4 was found to form an active interface with Pt NPs; in situ X-ray spectroscopy led to the conclusion that it was CoO present during the catalytic turnovers [37]. CoO supported on TiO2 was also found to be active under CO hydrogenation conditions; AP-XPS measurements showed increased CoO coverage compared to metallic Co on TiO2 [38].
Recently, 6nm MnOx nanoparticles supported on mesoporous Co3O4 was reported to produce high yields of methanol from a H2/CO2 (3:1) feed, where the enhanced catalytic activity towards methanol was attributed to the unique oxide-oxide interface [39]. Bimetallic Co-Mn nanoparticles supported on carbon nanofibers [40], titania [41], and silica [42] have been studied under CO hydrogenation conditions (Fischer-Tropsch synthesis), where the addition of Mn is reported to promote the formation of long chain hydrocarbons over methane. These studies over Co-Mn systems have captured unique catalytic behaviors and trends for well-defined, model hybrid systems; yet the molecular origins of the observed surface phenomena remain less understood, as the focus was on metal/oxide surfaces, rather than adsorbed species. Towards this end, adsorption and reaction of CO in the presence of H2 (Fischer-Tropsch synthesis) were studied to gain molecular insight into the oxide adsorbate interaction.
In this study, we investigated the surface chemical structure of 6nm MnO nanoparticles supported on a mesoporous Co3O4 co-catalyst under CO hydrogenation conditions using ambient pressure X-ray photoelectron spectroscopy (APXPS) and in situ X-ray absorption spectroscopy (XAS) in the total electron yield (TEY) mode. Measurements were made under oxidizing (O2), reducing (H2) and reactive (H2 + CO; 2:1) conditions. In addition, ex situ electron and X-ray spectro-microscopy techniques were employed to determine morphology, chemical compositions and elemental distributions for the pre- and post-reaction catalysts.
76
7.2 Experimental
7.2.1 Synthesis of MnO / Mesoporous Co3O4 catalyst The synthesis of 6 nm MnO NPs [43] and mesoporous Co3O4 support [44] has been
described in detail elsewhere. Briefly, MnO NPs were synthesized by refluxing 1.24 g manganese oleate (∼2 mmol) dissolved in 10 g of 1-octadecene for 10 min. MnO NPs were stored in 10 ml of hexane until further use.
Mesoporous Co3O4, (m-Co3O4) was prepared using a hard template. A mixture of cobalt (II) nitrate hexahydrate (4.7 g) in 8 ml of water and KIT-6 (4.0 g) dissolved in 50 ml of toluene were evaporated at 65 °C and the precipitated solid was subsequently calcined at 300 °C for 6 h in air. The KIT-6 template was dissolved using an aqueous solution of 2 M NaOH at 60 °C.
The MnO NPs/m-Co3O4 catalyst was prepared via the capillary inclusion method [45,46]. To produce a catalyst of nominally 10 weight % Mn, 2 mL of the colloidal MnOx NPs were diluted with 40 mL of n-hexane and mixed with 250 mg of m-Co3O4. The mixture was sonicated for 3 h at room temperature. The precipitate was collected by centrifugation and washed with a 50:50 v/v mixture of acetone and ethanol. The precipitated solid was dried at 80 °C overnight.
7.2.2 Soft X-ray Absorption Spectroscopy Soft X-ray absorption spectroscopy (XAS) studies were performed in beamline
6.0.2 of the Advanced Light Source (ALS). A purpose-built XAS end-station (detection of Electrons, Photons, and Ions for Chemistry and Catalysis: dEPIC2) was employed for the measurements. The end-station consists of three vacuum chambers: the beam entrance chamber, an ambient pressure (AP) cell, and a mass spectrometry chamber.
The entrance chamber consists of a variable aperture exit slit and an aluminum mesh for I0 correction. A base pressure of 10-8 Torr is maintained in the entrance chamber at any time. An exit slit of 50 μm diameter was used for the measurements reported in this paper. The entrance chamber is separated from the AP cell with a 100 nm thick Si3N4 window (1 mm by 0.5 mm, Silson Inc.).
The AP cell can be dosed using leak valves or a dedicated pre-mixing line with reactive/inert gases in the 0.01-1000 Torr range. Gas pressure in the AP cell and pre-mixing line were monitored via capacitance (Baratron, MKS) and cold cathode (Pfeifer and Granville-Phillips) gauges located at various points. To ensure a continuously well-mixed gas environment, a motorized fan is placed in close proximity to the sample holder.
Sample holder is installed on a 2.75” CF flange with four mini flange ports, and is mobilized on a top-mounted XYZΩ stage. Samples of nanoparticle films on 200 μm Si wafers or ~200 μm pelletized powders are secured between a 1/16” metal plate, which is used for total electron yield current measurements, and a 1/16” cylindrical ceramic spacer (Al2O3). A 1/32” metal foil with a central hole (Ø=1/4”) is attached to the front end of the ceramic spacer, and used to apply bias to sample. The metal current plate sits on a PID-controlled ceramic heater (Ø=1” and 10-16 ohm resistance, Momentive), which allows sample temperatures in the 25-550°C range. A photodiode (SXUV100, Opto Diode Corp.) is placed on a Z-manipulator and adjusted towards or away from sample for fluorescence measurements.
77
The mass spectrometer chamber is separated from the AP cell with a gate valve. On-line quadruple mass spectrometer (RGA, Stanford Research Systems) is used for continuous, operando detection. To achieve this, 1/8” stainless steel capillary tubing, heated to 100°C, is run between the sample front and the mass spectrometer ionizer. The distance between the capillary and the sample is manually adjusted to optimize detection sensitivity.
In a typical XAS experiment, Co L3, Mn L3, O K, and C K absorption edge spectra were monitored in a total electron yield (TEY) mode in oxidizing, reducing, or reaction conditions. The current to sample was measured using an amplifier with a bias potential of 250 V. Before measurements samples were treated for 0.5 hours in oxidizing or reducing conditions, or for 1 to 12 hours under reaction atmospheres. Acquisition times for TEY spectra were approximately 7 minutes, and spectra showed no significant changes from the beginning to the end of any measurement condition. All spectra were normalized for I0.
7.2.3 Ambient Pressure X-ray Photoelectron Spectroscopy The APXPS chamber in beamline 9.3.2 at the ALS has been described elsewhere
[47]. Various photon energies were used to probe the 2p and 3p levels of Co and Mn, in addition to the 1s levels of C and O.
The order of the APXPS experimental conditions was as follows: oxidation of the catalyst in 200 mTorr O2 at 350°C, reduction of the catalyst in 200 mTorr H2 at 250°C, reaction conditions of 300 mTorr H2+CO (2:1) at 225°C, followed by higher reduction temperatures of 350 and 480°C under 200 mTorr H2 each followed by reaction conditions at 225°C.
After the previous experimental conditions, the reversibility of the surface changes was studied whereby the catalyst was re-oxidized in O2 at 350°C, reduced in H2 at 250°C, and run under reaction conditions at 225°C. Energy calibrations were performed using valence level XPS spectra at each photon energy. XPS peaks for gas phase O2 and CO were also used for energy calibration. XPS data and error analysis was carried out using CasaXPS software.
Typical exposure times for any condition in the APXPS experiments were on the order of hours, during which multiple measurements at the aforementioned core and valence levels were taken. Each core or valence level was measured until no further changes in the spectral features could be observed. Similarly to XAS TEY measurements, APXPS spectra showed no significant changes from the first to the last measurement at any measurement condition. The steady-state was reached rather quickly in the timescale of both APXPS and XAS techniques.
7.2.4 Scanning Transmission X-ray Microscopy (STXM) STXM experiments were performed at the molecular environmental sciences
beamline (11.0.2) at the ALS [48]. Samples were dropcast from suspensions in methanol on to 100 nm thick Si3N4 windows, and air-dried before measurements. Multiple catalyst grains, each measuring approximately 500 nm, were measured at both Mn L and Co L absorption edges with spatial resolutions better than 40 nm. Image stacking, alignment, and spectral integrations were carried out using AXIS software.
78
7.2.5 Scanning Transmission Electron Microscopy (STEM) with Energy Dispersive Spectroscopy (EDS) and Electron Energy Loss Spectroscopy (EELS)
TEM and STEM measurements were performed at an accelerating voltage of 200 kV using a Jeol2100F transmission electron microscope equipped with an INCA energy dispersive spectrometer and a Gatan Tridiem electron energy loss spectrometer. TEM samples were prepared by dropcasting catalyst suspensions in methanol on to lacey carbon supported on Cu grids and vacuum-dried at 100°C for 2 days before measurements. EDS was carried out by monitoring Co and Mn K lines. EELS was carried out using convergence and collection semi-angles of 12 mrad with ~1 eV energy resolution at a dispersion of 0.2 eV per channel. Standard Gatan software was utilized for the analysis of EELS spectra; the pre-edge background was subtracted using a power-law fit while Hartree-Slater cross-sections were used to subtract step edges before quantification.
7.3 Results and Discussion 7.3.1 Characterization of the As-Prepared Catalyst The 6 nm MnO NPs/m-Co3O4 catalyst was characterized prior to in situ studies
using a combination of techniques. TEM and STEM images show ordered mesopores of about 10 nm in size (Figures 7–1). TEM and HRTEM images display nanocrystalline grains with sizes in the 5-10 nm range (Figures S1a and S1b). Individual MnO NPs could not be discerned from these TEM images. TEM image and a particle size histogram for MnO NPs is shown in Figure 7–2. Mesoporous particles were measured to be in the range of 0.2-2 μm, based on TEM images. STEM/EDS elemental maps indicated random and uniform distributions of Mn over the Co matrix (Figures 7–1). STEM/EDS maps and averages of multiple STEM/EELS point spectra show Mn:Co ratios of 1:10, which is consistent with the nominal mixing of MnO NPs and mesoporous Co3O4.
79
Figure 7 - 1. (a) TEM, (b) HRTEM, (c) STEM images of the pre-reaction MnO /m-Co3O4 catalyst. EDS elemental maps of the STEM image in (c) showing the (d) Co K and (e) Mn K lines. Scale bars are given in each image.
Figure 7 - 2. TEM image and particle size histogram of the as-synthesized MnO nanoparticles.
80
STXM images taken pre- and post- metal edges (Mn L and Co L) indicated random and uniform distribution of Co and Mn components across single particles, and thus was consistent with STEM/EDS maps. STXM also indicated particle cores and shells were chemically uniform; spinel Co3O4 and mixtures of Mn2+ and Mn3+ species, obtained from a qualitative inspection of STXM spectra (Figure 7–3).
Figure 7 - 3. STXM spectra at (a) Mn L and (b) Co L absorption edges for the pre-reaction catalyst. STXM spectra are color-coded as in the STXM images, and show integrated % absorption for the marked areas: particle cores (red) and particle shells (blue). STXM elemental maps are shown at L3 edge maxima; 640 and 780 eV for Mn and Co, respectively.
7.3.2 Ambient Pressure X-ray Photoelectron Spectroscopy Co and Mn Spectra
Figure 7–4 shows Mn and Co 3p core levels monitored using 630 eV photons, and demonstrates invariably larger fractions of MnOx (1<x<2) on the surface under all conditions studied. The strong peak around 48 eV was assigned to the Mn 3p transition, while the weaker peak around 60 eV was due to the Co 3p transition. The peaks in the 63-65 eV window were attributed to Mn satellites in agreement with Oku and Hirokawa [49].
Surface fractions of Co probed by AP-XPS progressively decreased with both increasing reduction temperature and H2 + CO reaction conditions. The 2p spectra of Co and Mn (shown in Figure 7–5b,c) were taken at photon energies of 900 and 760 eV, respectively, to give photoelectrons with kinetic energies of 120 eV. Co 2p core level spectra had very low and eventually no signal intensity after reduction in 200 mTorr H2 at 350°C, as shown in Figure 7–4b. The absence of Co 2p/3p signal is believed to be the result of a shadowing effect (loss of Co surface area and closer packed MnOx NPs) or by the formation of a continuous layer of MnOx NPs (wetting of CoOx) preventing the Co photoelectrons from reaching the analyzer. This can be argued considering the inelastic
81
mean free paths of the emitted photoelectron from Co through Mn oxides which are found to be 0.6 nm (KE: 120 eV) and ~1.7 nm (KE: ~800 eV) [50].
Mn 2p spectra indicated the progressive reduction of MnO1<x<2 (1<x<2) NPs. Figure 7–4c shows shifts to lower binding energies with increasing reduction temperature and subsequent reaction conditions. Figure 7–4c also includes the Mn 2p3/2 peak assignments according to Nesbitt et. al [51]. The dominant oxidation state on the surface was identified as Mn3+ in H2 atmospheres at 250°C and 350°C, and the following reactions at 225°C. In H2 atmospheres at 480°C and the reaction conditions run afterward, MnO is the dominant surface species.
It should also be noted that MnOx (1<x<2) NPs were reversibly oxidized in O2 atmospheres at 350°C. However, Co was not fully recovered from H2 treatment at 480ºC and the following H2 + CO reaction. This could be a result of dramatic morphology changes of the MnOx NPs from successive lattice expansions and contractions.
C and O 1s spectra
AP-XPS also indicated adsorption of CO on oxide surfaces. The C 1s and O 1s core levels were monitored using 630 eV photons; clean C 1s XPS spectra were obtained in H2 atmospheres following the oxidation in O2 at 350°C. Under reaction conditions, two C 1s peaks were observed (Figure 7–5b); a peak at 291 eV from gas phase CO and a broader peak at 289 eV, which was attributed to CO adsorbed on MnOx nanoparticles given their larger surface fractions. Furthermore, O 1s XPS spectra confirmed the above
Figure 7 - 4. Successive APXPS spectra showing (a) 3p core levels of Mn and Co, (b) 2p core levels of Co and (c) 2p core levels of Mn under various conditions. The spectra are stacked from bottom to top in the order of acquisition and color-coded as the key in the middle. Conditions are as described in the experimental section. In (a), Mn 3p and Co 3p levels are marked with dashed lines and Mn satellites with a dashed box. Dashed lines in (c) indicate the approximate peak positions for the respective oxidation states of Mn.
82
finding of: surface CO (component at 531.5 eV) and a decrease in lattice O (slight decrease of component at 530.5 eV) under reaction conditions (Figure 7–5a). Combined C and O 1s normalized peak areas, as shown in Figure 7–5c, are indicative of CO adsorption on MnOx (1<x<2) NPs, where a strong correlation exists for the increase of surface CO at the expense of lattice O.
Therefore, we believe that more CO is adsorbed for high manganese valences (i.e. after 250 and 350ºC reductions), while surface uptake of CO showed a minumum for MnO in Mn2+ state (after reduction at 480ºC). It should also be noted that CO uptake of the catalyst substantially increased after O2 recovery. This could be attributed to defect formation and lattice strain due to expansion/contraction of MnOx NPs, as suggested previously.
Figure 7 - 5. Successive AP-XPS spectra showing (a) C1s and (b) O1s core levels under various conditions. (c) Plots of normalized peak areas for lattice O and surface CO (from O1s [top] and C1s [bottom]). Spectra in (a) and (b) are stacked from bottom to top in the order of acquisition, and color-coded as in the middle key. Surface and gas phase CO are indicated in (a) and lattice O, surface CO, gas phase CO, and O2 are indicated in (b). Arrows in (c) indicate successive reaction conditions following H2 atmospheres at 250, 350 and 480°C from left to right.
83
7.3.3 In Situ Soft X-ray Absorption Spectroscopy Co and Mn L3 edge
In situ XAS, probing the near surface regions of the MnOx/Co3O4 catalyst, was used to quantitatively determine the oxidation states present on the surface through a linear combination fitting of reference compounds. Mn L3 absorption edge spectra and the linear combination fittings are shown in Figure 3. Samples were run at both 7.8 (Figure 7–6a and 7–6b) and 32 (Figure 7–6c and 7–6d) Torr total reaction pressure after different reduction pre-treatments. The reduction temperature appears to have no significant effect on the oxidation state of MnOx NPs during the CO hydrogenation reaction conditions, as shown in Figures 7–6a-c. The dominant oxidation states present measured after one hour under the reaction conditions are MnO and Mn3O4; however, prolonged reaction time in 32 Torr total reaction pressure produces MnO and MnO2 at the expense of Mn3O4.
Figure 7 - 6. (a-d) XAS TEY spectra at the Mn L3 absorption edge during H2 + CO (2:1) reaction conditions. Black connected diamonds are experimental spectra, red line is the fit, and the colored lines are the reference spectra. (e) Fractions of manganese species determined from the linear combination fittings in (a-d). XAS TEY spectrum in (a) was acquired following H2 reduction at 250°C. XAS TEY spectra in (b-d) were acquired following H2 reduction at 350°C. Spectra in (a-c) were acquired after the first hour under reaction conditions; (d) was acquired after 12 hours in the feed. The x-axis in (e) is numbered with the same codes as in the XAS TEY spectra; condition 2 is in H2 atmosphere (TEY spectrum not shown) and is indicated with an arrow in (e). Arrows in (d) indicate the spectral changes relative to the previous spectrum.
The Co mesoporous oxide support was also found to actively change during reduction and reaction. Figure 7–7 displays the Co L3 absorption edge and the resulting linear combination fits under various conditions. The dominant phase after reduction at 250°C and during reaction conditions of 7.8 Torr total pressure was spinel Co3O4 (Figure 4a). Following reduction at 350°C (Figure 7–7e, condition 2) Co3O4 was completely reduced to Co2+ species, namely CoO and Co(OH)2, as shown in Figure 7–7 b-d. Upon increasing the total reaction pressure from 7.8 to 32 Torr, the relative amounts of
84
Co(OH)2 and CoO change by approximately 10%. However, unlike the MnOx NPs, the Co does not undergo any further changes during prolonged reaction time (Figure 7–7d).
The XAS signal for Co was strong compared to the APXPS measurements mainly because of the deeper probing depth of the XAS TEY technique. However, it should be noted that Mn L edge TEY signal (10 nA) was about two orders of magnitude higher in intensity than Co L edge TEY signal (0.1 nA).
Figure 7 - 7. (a-d) XAS TEY spectra at the Co L3 absorption edge during H2 + CO(2:1) reaction conditions. Black connected diamonds are experimental spectra, red line is the fit, and the colored lines are the reference spectra. (e) Fractions of cobalt species determined from the linear combination fittings in (a-d). XAS TEY spectrum in (a) was acquired following H2 reduction at 250°C. XAS TEY spectra in (b-d) were acquired following H2 reduction at 350°C. Spectra in (a-c) were acquired after the first hour under reaction conditions; (d) was acquired after 12 hours in the feed. The x-axis in (e) is numbered with the same codes as in the XAS TEY spectra; condition 2 is in H2 atmosphere (TEY spectrum not shown) and is indicated with an arrow in (e). XAS contributions for Co2+ in (e) was decomposed into two components in (a-d): Co2+ in octahedral sites, indicated with dark green; and Co2+ in tetrahedral sites, indicated with light green. Arrows in (b) and (c) indicate the spectral changes relative to the previous spectrum.
C and O K edge
C and O K absorption edge spectra are shown for various conditions in Figure 7–8. Pure O2 spectra were taken while cooling from the oxidation treatment at 350°C, while pure CO and CO2 spectra were taken at catalyst temperatures of 200°C for reference. The C K edge spectrum under H2 shows the surface is free of residual carbon. Under 7.8 Torr reaction conditions, no apparent peak due to CO adsorption was observed; however, splitting and chemical shift of the gas phase CO peak (287.0 eV) were observed under 32 Torr reaction conditions, as shown in Figure 7–8a. In light of the AP-XPS findings, the splitting and shift of the gas phase CO peak could be due to adsorption of CO. Furthermore, gas phase CO2 (290.4 eV) appears during reaction conditions. The gas
85
phase CO2 peak becomes more pronounced upon prolonged reaction periods (batch reactor mode), suggesting adsorption and reaction of CO on the catalyst surface. The O K edge spectra support this view, with gas phase CO2 (534.2 eV) appearing at long reaction times. In addition, lattice O shows a substantial decrease at long reaction times, indicative of a qualitative agreement with the AP-XPS findings of a correlation between lattice O and surface CO.
Figure 7 - 8. XAS TEY spectra at the (a) C K and (b) O K absorption edges under various conditions. CO (gas phase and surface adsorbed) and gas phase CO2 are indicated in (a) and (b). Lattice O is also indicated in (b). The O2 spectrum was taken in vacuum after pumping out O2 while cooling from 350°C. The H2 spectra were taken in 2.7 Torr H2 while cooling from 350°C. CO and CO2 spectra were acquired in 2.7 Torr of the pure gases at 200°C. All H2+CO(2:1) spectra were collected at 225°C. The spectra are shown in the order of acquisition from bottom to top.
7.3.4 Residual Gas Analysis Using a multiple ion detection mode on the dEPIC2 (RGA quadruple mass
spectrometer), we monitored various m/z species during the reaction of 32 Torr H2+CO(2:1), after reduction at 350°C. Figure 7–9 shows the changes in the partial pressures of m/z 16 (CH4), 18 (H2O), 27 (hydrocarbon fragments), 28 (CO and hydrocarbon fragments) and 44 (CO2) from 5 min to 11 hours into the reaction. A decrease in the m/z 28 signal was indicative of consumption of CO, as a corresponding increase in the partial pressure of CO2 was observed. The observation of CO2 is consistent with detection of gas phase CO2 in the XAS TEY spectrum after 12 hours under reaction conditions. Interestingly, the formation of m/z 27 fragments and H2O could be the result of the catalytic hydrogenation of CO, as water and CO2 is a typical byproduct of the Fischer-Tropsch synthesis (C-C bond formation). However, the formation of H2O from a chemical reaction on the MnOx surface cannot be ruled out. Also of note is the lack of CH4 at the mass spectrometer; under low pressure CO
86
hydrogenation conditions, CH4 is often the most abundant product [40,42]. In agreement with the mass spectroscopy data, no CH4 is detected in the XAS TEY spectra.
Figure 7 - 9. Partial pressures of various species before, during, and after the reaction of 32 Torr H2+CO (2:1) at 225°C.
7.3.5 Ex Situ Spectroscopy The catalyst was studied pre- and post-reaction using TEM, STEM/EDS and
STXM. No changes to morphology in the post-reaction catalyst were detected by TEM or STEM. Elemental composition, measured by STEM/EDS, remained uniform as seen in Figure 7–10c-e. STEM/EELS spectra, acquired from single grains and multiple particles, indicated that the O/(Mn+Co) ratio dropped from 1.3 ± 0.1 for the fresh catalyst to 1.1 ± 0.2 for the spent catalyst, consistent with the reduction of catalyst. Representative energy loss spectra shown in Figure 7–11 clearly illustrate the loss of O content from the spent catalyst.
Figure 7 - 10. (a) TEM, (b) HRTEM and (c) STEM images of the post-reaction MnOx NPs/m-Co3O4 catalyst. EDS elemental maps of the STEM image in (c) showing (d) Co K and (e) Mn K lines. Scale bars are given for each image.
87
Figure 7 - 11. Representative STEM/EELS spectra, pre-O edge background removed, of the pre- and post-reaction (i.e. fresh vs. spent) catalysts. Difference spectrum is also given.
STXM was performed on the pre- and post-reaction catalyst. Figure 7–12 shows the XAS spectra obtained by integrating over different sections of the STXM image, namely the core of the particle and the outer shell. The corresponding STXM maps are superimposed over the STXM image at the given photon energies. Changes from the pre-reaction to post-reaction catalyst are consistent with the XAS TEY spectra and the STEM/EELS O loss spectra discussed above; namely the Co L absorption edge shows a qualitative reduction from spinel Co3O4 in the pre-reaction catalyst (Figure 7–3) to Co2+ species in the post-reaction catalyst (Figure 7–12b).
Figure 7 - 12. STXM spectra at (a) Mn L and (b) Co L absorption edges for the post-reaction catalyst. STXM spectra are color-coded as in the STXM images, and show integrated % absorption for the marked areas: particle cores (red) and particle shells (blue). STXM elemental maps are shown at given photon energies: 630 and 770 eV pre-
88
edge; 640 and 780 eV, L3 edge maxima; and 665 and 805 eV, post edge for Mn and Co, respectively.
A visual inspection of the Mn L absorption edge XAS spectra revealed a weaker peak at 639 eV (i.e. Mn2+) for the spent catalyst, which indicated a post-reaction oxidation of the MnO NPs (see Figure 7–12a and Figure 7–3a). This could be a result of exposure to air, as in situ XAS found Mn2+ (major) and Mn4+ (minor) species during reaction. This could also be a difference between the surface and bulk of the catalyst particles, because in situ XAS TEY measured the near surface regions as opposed to STXM monitoring the bulk using transmitted X-rays. STXM also indicated that chemical compositions were uniform across single particles and over the entire catalyst, as shown by identical XAS spectra integrated over the core and shell of individual particles. Multiple particles were imaged and show consistent results.
7.4 Conclusion In this paper, we studied the evolution of oxidation states and chemical
compositions of a hybrid oxide catalyst comprised of MnO NPs supported on mesoporous spinel Co3O4 under H2+CO atmospheres. Using tunable X-ray energies and reactive atmospheres of AP-XPS, we showed that MnO NPs covered cobalt oxide support. Surface adsorption of CO was correlated with high Mn valences and a decrease in lattice O. In situ XAS TEY measurements revealed chemical compositions of MnO NPs and the oxide support in the near surface regions and under H2 + CO reaction conditions: MnO and Mn3O4 were found dominant species for the nanoparticles, while Co(OH)2 and Co oxides bearing +2 charge were obtained for the cobalt oxide support. In situ XAS TEY measurements also revealed CO2 formation under 32 Torr H2 + CO (2:1) and at 225°C after 12 hours of reaction. Interestingly, the CO2 formed at long reaction times coincided with the disappearance of lattice O, as Mn3O4 mainly reduced to MnO. Combined APXPS, in situ XAS TEY and mass spectrocopy measurements indicated the adsorption and reaction of CO over oxides of manganese and cobalt in the presence of H2. Morphology and chemical composition of the catalyst were investigated using spectro-microscopy techniques, and found to be uniform across single particles and over particle ensembles.
7.5 References [1] A. P. Alivisatos, J. Phys. Chem. 1996, 100, 13226–13239.
[2] M. A. El-Sayed, Acc. Chem. Res. 2004, 37, 326–333.
[3] R. Narayanan, M. A. El-Sayed, J. Phys. Chem. B 2005, 109, 12663–12676.
[4] K. An, S. Alayoglu, T. Ewers, G. a Somorjai, J. Colloid Interface Sci. 2012, 373, 1–13.
89
[5] H.-J. Freund, J. Libuda, M. Bäumer, T. Risse, A. Carlsson, Chem. Rec. 2003, 3, 181–201.
[6] G. Rupprechter, H. J. Freund, Top. Catal. 2001, 14, 3–14.
[7] D. Goodman, Surf. Sci. 1994, 299, 837–848.
[8] D. W. Goodman, J. Catal. 2003, 216, 213–222.
[9] R. M. Rioux, B. B. Hsu, M. E. Grass, H. Song, G. A. Somorjai, Catal. Letters 2008, 126, 10–19.
[10] Y. Yao, Z. Yan, L. Chen, Z. Zhou, L. Liu, D. W. Goodman, Catal. Letters 2012, 142, 1437–1444.
[11] V. V. Pushkarev, K. An, S. Alayoglu, S. K. Beaumont, G. a. Somorjai, J. Catal. 2012, 292, 64–72.
[12] Y. H. Niu, L. K. Yeung, R. M. Crooks, J. Am. Chem. Soc. 2001, 123, 6840–6846.
[13] G. L. Bezemer, J. H. Bitter, H. P. C. E. Kuipers, H. Oosterbeek, J. E. Holewijn, X. Xu, F. Kapteijn, A. J. Van Dillen, K. P. de Jong, J. Am. Chem. Soc. 2006, 128, 3956–3964.
[14] T. Herranz, X. Deng, A. Cabot, J. Guo, M. Salmeron, J. Phys. Chem. B 2009, 113, 10721–10727.
[15] V. Iablokov, S. K. Beaumont, S. Alayoglu, V. V Pushkarev, C. Specht, J. Gao, A. P. Alivisatos, N. Kruse, G. A. Somorjai, Nano Lett. 2012, 12, 3091–3096.
[16] A. Tuxen, S. Carenco, M. Chintapalli, C. Chuang, C. Escudero, E. Pach, P. Jiang, F. Borondics, B. Beberwyck, A. P. Alivisatos, et al., 2013.
[17] S. Panigrahi, S. Basu, S. Praharaj, S. Pande, S. Jana, A. Pal, S. K. Ghosh, T. Pal, J. Phys. Chem. C 2007, 111, 4596–4605.
[18] M. E. Grass, Y. Zhang, D. R. Butcher, J. Y. Park, Y. Li, H. Bluhm, K. M. Bratlie, T. Zhang, G. A. Somorjai, Angew. Chemie-International Ed. 2008, 47, 8893–8896.
[19] M. Cargnello, V. V. T. Doan-Nguyen, T. R. Gordon, R. E. Diaz, E. A. Stach, R. J. Gorte, P. Fornasiero, C. B. Murray, Science (80-. ). 2013, 341, 771–773.
[20] G. A. Somorjai, S. Alayoglu, L. R. Baker, E. Gross, Abstr. Pap. Am. Chem. Soc. 2012, 244.
[21] K. M. Bratlie, H. Lee, K. Komvopoulos, P. Yang, G. A. Somorjai, Nano Lett. 2007, 7, 3097–3101.
[22] C.-K. Tsung, J. N. Kuhn, W. Huang, C. Aliaga, L.-I. Hung, G. A. Somorjai, P. Yang, J. Am. Chem. Soc. 2009, 131, 5816–5822.
90
[23] S. Alayoglu, C. Aliaga, C. Sprung, G. A. Somorjai, Catal. Letters 2011, 141, 914–924.
[24] V. V. Pushkarev, N. Musselwhite, K. An, S. Alayoglu, G. A. Somorjai, Nano Lett. 2012, 12, 5196–5201.
[25] P. Christopher, S. Linic, ChemCatChem 2010, 2, 78–83.
[26] M. Crespo-Quesada, A. Yarulin, M. Jin, Y. Xia, L. Kiwi-Minsker, J. Am. Chem. Soc. 2011, 133, 12787–12794.
[27] G. A. Somorjai, S. K. Beaumont, S. Alayoglu, Angew. Chemie-International Ed. 2011, 50, 10116–10129.
[28] S. Alayoglu, F. Tao, V. Altoe, C. Specht, Z. Zhu, F. Aksoy, D. R. Butcher, R. J. Renzas, Z. Liu, G. A. Somorjai, Catal. Letters 2011, 141, 633–640.
[29] J. R. Renzas, W. Huang, Y. Zhang, M. E. Grass, D. T. Hoang, S. Alayoglu, D. R. Butcher, F. Tao, Z. Liu, G. A. Somorjai, Phys. Chem. Chem. Phys. 2011, 13, 2556–2562.
[30] G. A. Somorjai, Appl. Surf. Sci. 1997, 121, 1–19.
[31] K. M. Bratlie, K. Komvopoulos, G. A. Somorjai, J. Phys. Chem. C 2008, 112, 11865–11868.
[32] C. J. Kliewer, C. Aliaga, M. Bieri, W. Huang, C.-K. Tsung, J. B. Wood, K. Komvopoulos, G. A. Somorjai, J. Am. Chem. Soc. 2010, 132, 13088–13095.
[33] C. Aliaga, C.-K. Tsung, S. Alayoglu, K. Komvopoulos, P. Yang, G. A. Somorjai, J. Phys. Chem. C 2011, 115, 8104–8109.
[34] D. F. Ogletree, H. Bluhm, G. Lebedev, C. S. Fadley, Z. Hussain, M. Salmeron, Rev. Sci. Instrum. 2002, 73, 3872–3877.
[35] F. Tao, M. E. Grass, Y. Zhang, D. R. Butcher, J. R. Renzas, Z. Liu, J. Y. Chung, B. S. Mun, M. Salmeron, G. A. Somorjai, Science (80-. ). 2008, 322, 932–934.
[36] F. Tao, M. E. Grass, Y. Zhang, D. R. Butcher, F. Aksoy, S. Aloni, V. Altoe, S. Alayoglu, J. R. Renzas, C.-K. Tsung, et al., J. Am. Chem. Soc. 2010, 132, 8697–8703.
[37] K. An, S. Alayoglu, N. Musselwhite, S. Plamthottam, G. Melaet, A. E. Lindeman, G. A. Somorjai, J. Am. Chem. Soc. 2013, 135, 16689–16696.
[38] G. Melaet, W. T. Ralston, C.-S. Li, S. Alayoglu, K. An, N. Musselwhite, B. Kalkan, G. A. Somorjai, J. Am. Chem. Soc. 2014, 136, 2260–2263.
[39] C.-S. Li, G. Melaet, W. T. Ralston, K. An, C. Brooks, Y. Ye, Y.-S. Liu, J. Zhu, J. Guo, S. Alayoglu, et al., Nat. Commun. 2015, 6, 6538.
[40] G. L. Bezemer, U. Falke, A. J. van Dillen, K. P. de Jong, Chem. Commun. 2005, 731–733.
91
[41] F. Morales, F. M. F. de Groot, P. Glatzel, E. Kleimenov, H. Bluhm, M. Hävecker, A. Knop-Gericke, B. M. Weckhuysen, J. Phys. Chem. B 2004, 108, 16201–16207.
[42] S. Werner, G. R. Johnson, A. T. Bell, ChemCatChem 2014, 6, 2881–2888.
[43] J. Park, K. An, Y. Hwang, J.-G. Park, H.-J. Noh, J.-Y. Kim, J.-H. Park, N.-M. Hwang, T. Hyeon, Nat. Mater. 2004, 3, 891–895.
[44] Y. Ren, Z. Ma, L. Qian, S. Dai, H. He, P. G. Bruce, Catal. Letters 2009, 131, 146–154.
[45] R. M. Rioux, H. Song, J. D. Hoefelmeyer, P. Yang, G. a Somorjai, J. Phys. Chem. B 2005, 109, 2192–202.
[46] H. Song, R. M. Rioux, J. D. Hoefelmeyer, R. Komor, K. Niesz, M. Grass, P. D. Yang, G. A. Somorjai, J. Am. Chem. Soc. 2006, 128, 3027–3037.
[47] M. E. Grass, P. G. Karlsson, F. Aksoy, M. Lundqvist, B. Wannberg, B. S. Mun, Z. Hussain, Z. Liu, Rev. Sci. Instrum. 2010, 81, DOI 10.1063/1.3427218.
[48] T. Warwick, H. Ade, D. Kilcoyne, M. Kritscher, T. Tylisczcak, S. Fakra, A. Hitchcock, P. Hitchcock, H. Padmore, J. Synchrotron Radiat. 2002, 9, 254–257.
[49] M. Oku, K. Hirokawa, S. Ikeda, J. Electron Spectros. Relat. Phenomena 1975, 7, 465–473.
[50] , S. Tanuma, C. J. Powell, D. R. Penn, Surf. Interface Anal. 2011, 43, 689–713.
[51] H. W. Nesbitt, D. Banerjee, Am. Mineral. 1998, 83, 305–315.