UNITED STATES SECURITIES AND EXCHANGE COMMISSION Washington, D.C. 20549 FORM 10-Q (Mark One) ☒ QUARTERLY REPORT PURSUANT TO SECTION 13 OR 15(d) OF THE SECURITIES EXCHANGE ACT OF 1934 For the quarterly period ended June 30, 2021 Or ☐ TRANSITION REPORT PURSUANT TO SECTION 13 OR 15(d) OF THE SECURITIES EXCHANGE ACT OF 1934 For the transition period from to Commission file number: 000-49799 OVERSTOCK.COM, INC. (Exact name of registrant as specified in its charter) Delaware 87-0634302 (State or other jurisdiction of incorporation or organization) (I.R.S. Employer Identification Number) 799 West Coliseum Way Midvale Utah 84047 (Address of principal executive offices) (Zip Code) (801) 947-3100 (Registrant's telephone number, including area code) Securities registered pursuant to Section 12(b) of the Act: Title of each class Trading Symbol(s) Name of each exchange on which registered Common Stock, $0.0001 par value OSTK NASDAQ Global Market Indicate by check mark whether the registrant (1) has filed all reports required to be filed by Section 13 or 15(d) of the Securities Exchange Act of 1934 during the preceding 12 months (or for such shorter period that the registrant was required to file such reports), and (2) has been subject to such filing requirements for the past 90 days. Yes ☒ No ☐ Indicate by check mark whether the registrant has submitted electronically every Interactive Data File required to be submitted pursuant to Rule 405 of Regulation S-T (§232.405 of this chapter) during the preceding 12 months (or for such shorter period that the registrant was required to submit such files). Yes ☒ No ☐ Indicate by check mark whether the registrant is a large accelerated filer, an accelerated filer, a non-accelerated filer, a smaller reporting company, or an emerging growth company. See the definitions of "large accelerated filer," "accelerated filer," "smaller reporting company," and "emerging growth company" in Rule 12b-2 of the Exchange Act. Large accelerated filer ☒ Accelerated filer ☐ Non-accelerated filer ☐ Smaller reporting company ☐ Emerging growth company ☐ If an emerging growth company, indicate by check mark if the registrant has elected not to use the extended transition period for complying with any new or revised financial accounting standards provided pursuant to Section 13(a) of the Exchange Act. ☐ Indicate by check mark whether the registrant is a shell company (as defined in Rule 12b-2 of the Exchange Act). Yes ☐ No ☒ 43,013,210 shares of the registrant's common stock, par value $0.0001, are outstanding on July 30, 2021.
Transcript
UNITED STATESSECURITIES AND EXCHANGE COMMISSION
Washington, D.C. 20549
FORM 10-Q(Mark One)
☒ QUARTERLY REPORT PURSUANT TO SECTION 13 OR 15(d) OF THE SECURITIES EXCHANGE ACTOF 1934
For the quarterly period ended June 30, 2021
Or
☐ TRANSITION REPORT PURSUANT TO SECTION 13 OR 15(d) OF THE SECURITIES EXCHANGE ACTOF 1934
For the transition period from to Commission file number: 000-49799
OVERSTOCK.COM, INC.(Exact name of registrant as specified in its charter)
Delaware 87-0634302(State or other jurisdiction of incorporation or organization) (I.R.S. Employer Identification Number)
799 West Coliseum WayMidvale
Utah 84047(Address of principal executive offices) (Zip Code)
(801) 947-3100
(Registrant's telephone number, including area code)
Securities registered pursuant to Section 12(b) of the Act:Title of each class Trading Symbol(s) Name of each exchange on which registered
Common Stock, $0.0001 par value OSTK NASDAQ Global Market
Indicate by check mark whether the registrant (1) has filed all reports required to be filed by Section 13 or 15(d) of the Securities Exchange Act of 1934 during thepreceding 12 months (or for such shorter period that the registrant was required to file such reports), and (2) has been subject to such filing requirements for the past 90 days.Yes ☒ No ☐
Indicate by check mark whether the registrant has submitted electronically every Interactive Data File required to be submitted pursuant to Rule 405 of Regulation S-T
(§232.405 of this chapter) during the preceding 12 months (or for such shorter period that the registrant was required to submit such files). Yes ☒ No ☐ Indicate by check mark whether the registrant is a large accelerated filer, an accelerated filer, a non-accelerated filer, a smaller reporting company, or an emerging growth
company. See the definitions of "large accelerated filer," "accelerated filer," "smaller reporting company," and "emerging growth company" in Rule 12b-2 of the ExchangeAct.
Large accelerated filer ☒ Accelerated filer ☐
Non-accelerated filer ☐ Smaller reporting company ☐
Emerging growth company ☐
If an emerging growth company, indicate by check mark if the registrant has elected not to use the extended transition period for complying with any new or revisedfinancial accounting standards provided pursuant to Section 13(a) of the Exchange Act. ☐
Indicate by check mark whether the registrant is a shell company (as defined in Rule 12b-2 of the Exchange Act). Yes ☐ No ☒
43,013,210 shares of the registrant's common stock, par value $0.0001, are outstanding on July 30, 2021.
Table of Contents
OVERSTOCK.COM, INC.TABLE OF CONTENTS TO QUARTERLY REPORT ON FORM 10-Q
For the Quarterly Period Ended June 30, 2021
PagePART I. FINANCIAL INFORMATION
Item 1. Financial Statements (Unaudited) 5
Consolidated Balance Sheets 5Consolidated Statements of Income 7Consolidated Statements of Comprehensive Income 8Consolidated Statements of Changes in Stockholders' Equity 9Consolidated Statements of Cash Flows 11Notes to Unaudited Consolidated Financial Statements 13
Item 2. Management's Discussion and Analysis of Financial Condition and Results of Operations 27
Item 3. Quantitative and Qualitative Disclosures About Market Risk 38
Item 4. Controls and Procedures 39
PART II. OTHER INFORMATION
Item 1. Legal Proceedings 40
Item 1A. Risk Factors 40
Item 2. Unregistered Sales of Equity Securities and Use of Proceeds 41
Item 3. Defaults Upon Senior Securities 41
Item 4. Mine Safety Disclosures 41
Item 5. Other Information 41
Item 6. Exhibits 42
Signature 43
2
Table of Contents
Special Cautionary Note Regarding Forward-Looking Statements
This Report on Form 10-Q and the documents incorporated herein by reference, as well as other public documents and statements our officers andrepresentatives may make from time to time, contain forward-looking statements within the meaning of the federal securities laws. These statements aretherefore entitled to the protection of the safe harbor provisions of these laws. You can find many of these statements by looking for words such as "may,""would," "could," "should," "will," "expect," "anticipate," "predict," "project," "potential," "continue," "contemplate," "seek," "assume," "believe,""intend," "plan," "forecast," "goal," "estimate," or other similar expressions which identify these forward-looking statements.
These forward-looking statements involve risks and uncertainties and relate to future events or our future financial or operating performance.These forward-looking statements are not historical facts, and are based on current expectations, estimates and projections about our industry andbusiness, and on management's beliefs and certain assumptions made by management, many of which, by their nature, are inherently uncertain and beyondour control. Accordingly, you are cautioned that any such forward-looking statements are not guarantees of future performance and are subject toassumptions, risks and uncertainties that are difficult to predict, and that actual results may be materially different from the results expressed or implied byany of our forward-looking statements.
Actual events or results may differ materially from those contemplated by our forward-looking statements for a variety of reasons, including amongothers:
• the impact that the COVID-19 pandemic, or other wide-spread disease or illness, may have on our business and the industries in which weoperate, including the impact that our business may experience at such time as the pandemic or other health risks subside;
• the impact that any litigation, claims, or regulatory matters could have on our business, financial condition, results of operations, and cashflows;
• any increases in the price of importing into the U.S. the types of merchandise we sell in our retail business or other supply chain challenges thatlimit our access to merchandise we sell in our retail business;
• any difficulties we may encounter as a result of our reliance on third-parties that we do not control for the performance of critical functionsmaterial to our business;
• any inability to convert new customers into repeat customers or maintain increased sales volumes, in particular at such time as the pandemicsubsides;
• any downturn in the U.S. housing industry or other changes in U.S. and global economic conditions or U.S. consumer spending;• any inability to generate and maintain unpaid natural traffic to our website;• any inability of Pelion to successfully manage the Medici Ventures Fund limited partnership or our direct minority interest in tZERO;• our exposure to cyber security risks, risks of data loss and other security breaches;• any strategic transactions, restructurings or other changes we may make to our business;• the risk that the amount of deferred tax assets we consider realizable could be reduced if estimates of future taxable income during the
carryforward period are reduced;• any challenges that result in the unavailability of our Website or reduced performance of our transaction systems;• the possibility that we are unable to protect our proprietary technology and to obtain trademark protection for our marks;• current and future claims of intellectual property infringement to which we are subject;• the commercial, competitive, technical, operational, financial, regulatory, legal, reputational, marketing and other obstacles Pelion faces in
trying to create economic success for the blockchain assets held within the Medici Ventures Fund it manages;• any losses or issues we may encounter as a consequence of accepting or holding bitcoin or other cryptocurrencies;• the adequacy of our liquidity and our ability to fund our capital requirements;• our inability to attract and retain key personnel;• the possibility that the cost of our current insurance policies may increase significantly or fail to adequately protect us as expected; and• the other risks described in this report or in our other public filings.
In evaluating all forward-looking statements, you should specifically consider the risks outlined above and in this Report, especially under theheadings "Special Cautionary Note Regarding Forward-Looking Statements," "Risk Factors,"
3
Table of Contents
"Legal Proceedings," and "Management's Discussion and Analysis of Financial Condition and Results of Operations." These factors may cause ouractual results to differ materially from those contemplated by any forward-looking statement. Although we believe that our expectations reflected in theforward-looking statements are reasonable, we cannot guarantee or offer any assurance of future results, levels of activity, performance or achievementsor other future events. Our forward-looking statements contained in this report speak only as of the date of this report and, except as required by law, weundertake no obligation to update forward-looking statements to reflect events or circumstances occurring after the date of this report or any changes inour expectations or any change in any events, conditions or circumstances on which any of our forward-looking statements are based.
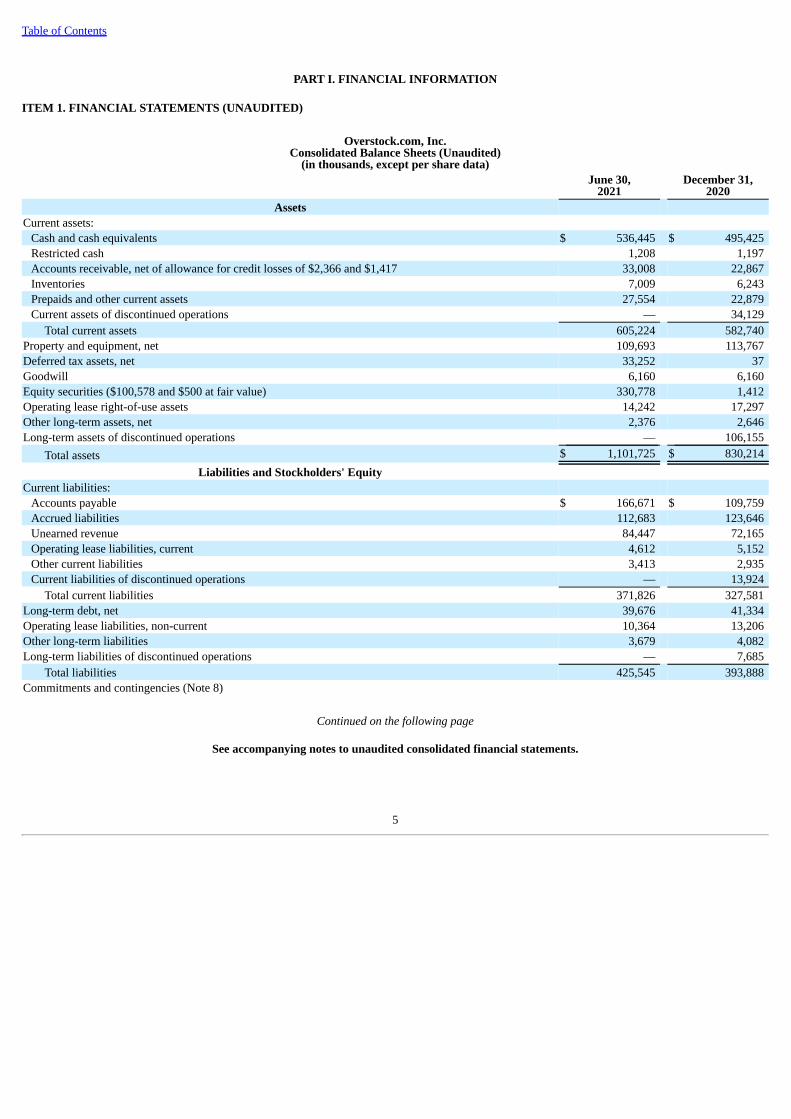
Current assets: Cash and cash equivalents $ 536,445 $ 495,425 Restricted cash 1,208 1,197 Accounts receivable, net of allowance for credit losses of $2,366 and $1,417 33,008 22,867 Inventories 7,009 6,243 Prepaids and other current assets 27,554 22,879 Current assets of discontinued operations — 34,129
Total current assets 605,224 582,740 Property and equipment, net 109,693 113,767 Deferred tax assets, net 33,252 37 Goodwill 6,160 6,160 Equity securities ($100,578 and $500 at fair value) 330,778 1,412 Operating lease right-of-use assets 14,242 17,297 Other long-term assets, net 2,376 2,646 Long-term assets of discontinued operations — 106,155
Total assets $ 1,101,725 $ 830,214 Liabilities and Stockholders' Equity
Current liabilities: Accounts payable $ 166,671 $ 109,759 Accrued liabilities 112,683 123,646 Unearned revenue 84,447 72,165 Operating lease liabilities, current 4,612 5,152 Other current liabilities 3,413 2,935 Current liabilities of discontinued operations — 13,924
Total current liabilities 371,826 327,581 Long-term debt, net 39,676 41,334 Operating lease liabilities, non-current 10,364 13,206 Other long-term liabilities 3,679 4,082 Long-term liabilities of discontinued operations — 7,685
Total liabilities 425,545 393,888 Commitments and contingencies (Note 8)
Continued on the following page
See accompanying notes to unaudited consolidated financial statements.
Preferred stock, $0.0001 par value, authorized shares - 5,000 Series A-1, issued and outstanding - 4,204 and 4,204 — — Series B, issued and outstanding - 357 and 357 — —
Common stock, $0.0001 par value, authorized shares - 100,000 Issued shares - 46,607 and 46,331 Outstanding shares - 43,012 and 42,768 4 4
Additional paid-in capital 954,518 970,873 Accumulated deficit (199,229) (525,233)Accumulated other comprehensive loss (545) (553)
Treasury stock at cost - 3,595 and 3,563 (78,568) (71,399)Equity attributable to stockholders of Overstock.com, Inc. 676,180 373,692
Equity attributable to noncontrolling interests — 62,634 Total stockholders' equity 676,180 436,326
Total liabilities and stockholders' equity $ 1,101,725 $ 830,214
See accompanying notes to unaudited consolidated financial statements.
6
Table of Contents
Overstock.com, Inc.Consolidated Statements of Income (Unaudited)
(in thousands, except per share data)
Three months ended
June 30,Six months ended
June 30, 2021 2020 2021 2020Net revenue $ 794,536 $ 766,956 $ 1,454,397 $ 1,106,554 Cost of goods sold 619,710 589,044 1,126,047 854,436
Sales and marketing 85,272 79,215 158,810 115,560 Technology 30,383 29,063 60,906 56,344 General and administrative 22,660 20,837 45,531 44,722
Total operating expenses 138,315 129,115 265,247 216,626 Operating income 36,511 48,797 63,103 35,492 Interest expense, net (130) (364) (285) (375)Other income (expense), net 298 246 72 (41)Income from continuing operations before income taxes 36,679 48,679 62,890 35,076 Provision (benefit) for income taxes (45,726) 840 (45,533) 1,003
Income from continuing operations 82,405 47,839 108,423 34,073 Income (loss) from discontinued operations, net of income taxes 227,372 (13,458) 217,246 (19,257)Consolidated net income $ 309,777 $ 34,381 $ 325,669 $ 14,816
Less: Net loss attributable to noncontrolling interests—discontinuedoperations (134) (1,975) (335) (5,207)
Net income attributable to stockholders of Overstock.com, Inc. $ 309,911 $ 36,356 $ 326,004 $ 20,023 Net income per share of common stock:
Net income (loss) attributable to common shares—basicContinuing operations $ 1.73 $ 1.12 $ 2.27 $ 0.82 Discontinued operations 4.78 (0.27) 4.58 (0.34)
Total $ 6.51 $ 0.85 $ 6.85 $ 0.48 Net income (loss) attributable to common shares—diluted
See accompanying notes to unaudited consolidated financial statements.
7
Table of Contents
Overstock.com, Inc.Consolidated Statements of Comprehensive Income (Unaudited)
(in thousands)
Three months ended
June 30,Six months ended
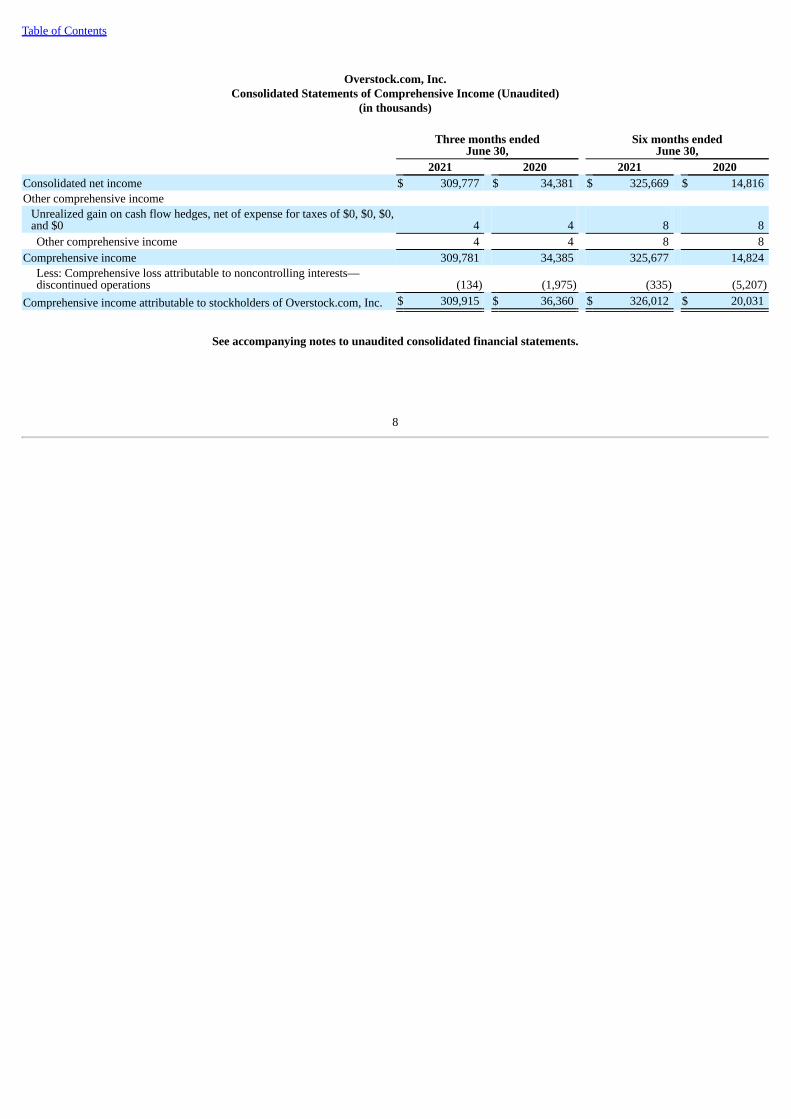
June 30, 2021 2020 2021 2020Consolidated net income $ 309,777 $ 34,381 $ 325,669 $ 14,816 Other comprehensive income
Unrealized gain on cash flow hedges, net of expense for taxes of $0, $0, $0,and $0 4 4 8 8 Other comprehensive income 4 4 8 8
Comprehensive income 309,781 34,385 325,677 14,824 Less: Comprehensive loss attributable to noncontrolling interests—discontinued operations (134) (1,975) (335) (5,207)
Comprehensive income attributable to stockholders of Overstock.com, Inc. $ 309,915 $ 36,360 $ 326,012 $ 20,031
See accompanying notes to unaudited consolidated financial statements.
8
Table of Contents
Overstock.com, Inc.Consolidated Statements of Changes in Stockholders' Equity (Unaudited)
(in thousands)
Three months ended
June 30,Six months ended
June 30,2021 2020 2021 2020
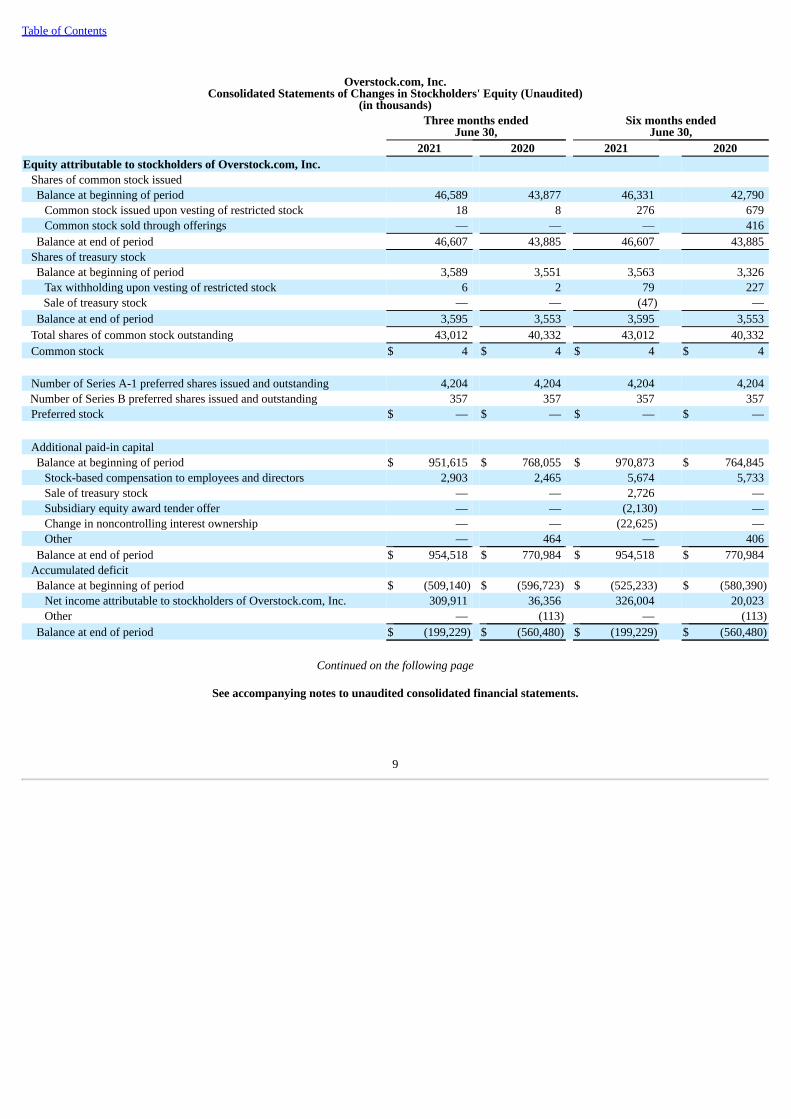
Equity attributable to stockholders of Overstock.com, Inc. Shares of common stock issuedBalance at beginning of period 46,589 43,877 46,331 42,790
Common stock issued upon vesting of restricted stock 18 8 276 679 Common stock sold through offerings — — — 416
Balance at end of period 46,607 43,885 46,607 43,885 Shares of treasury stockBalance at beginning of period 3,589 3,551 3,563 3,326
Tax withholding upon vesting of restricted stock 6 2 79 227 Sale of treasury stock — — (47) —
Balance at end of period 3,595 3,553 3,595 3,553 Total shares of common stock outstanding 43,012 40,332 43,012 40,332 Common stock $ 4 $ 4 $ 4 $ 4
Number of Series A-1 preferred shares issued and outstanding 4,204 4,204 4,204 4,204 Number of Series B preferred shares issued and outstanding 357 357 357 357 Preferred stock $ — $ — $ — $ —
Additional paid-in capitalBalance at beginning of period $ 951,615 $ 768,055 $ 970,873 $ 764,845
Stock-based compensation to employees and directors 2,903 2,465 5,674 5,733 Sale of treasury stock — — 2,726 — Subsidiary equity award tender offer — — (2,130) — Change in noncontrolling interest ownership — — (22,625) — Other — 464 — 406
Balance at end of period $ 954,518 $ 770,984 $ 954,518 $ 770,984 Accumulated deficitBalance at beginning of period $ (509,140) $ (596,723) $ (525,233) $ (580,390)
Net income attributable to stockholders of Overstock.com, Inc. 309,911 36,356 326,004 20,023 Other — (113) — (113)
Balance at end of period $ (199,229) $ (560,480) $ (199,229) $ (560,480)
Continued on the following page
See accompanying notes to unaudited consolidated financial statements.
9
Table of Contents
Overstock.com, Inc.Consolidated Statements of Changes in Stockholders' Equity (Unaudited)
(in thousands)Three months ended
June 30,Six months ended
June 30,2021 2020 2021 2020
Accumulated other comprehensive lossBalance at beginning of period $ (549) $ (564) $ (553) $ (568)
Net other comprehensive income 4 4 8 8 Balance at end of period $ (545) $ (560) $ (545) $ (560)
Treasury stockBalance at beginning of period $ (78,048) $ (70,493) $ (71,399) $ (68,807)
Tax withholding upon vesting of restricted stock (520) (44) (7,812) (1,730)Sale of treasury stock — — 643 —
Balance at end of period (78,568) (70,537) (78,568) (70,537)Total equity attributable to stockholders of Overstock.com, Inc. $ 676,180 $ 139,411 $ 676,180 $ 139,411
Equity attributable to noncontrolling interestsBalance at beginning of period $ 85,058 $ 61,376 $ 62,634 $ 62,771 Paid in capital for noncontrolling interest — 5,000 — 5,000 Net loss attributable to noncontrolling interests (134) (1,975) (335) (5,207)Change in noncontrolling interest ownership — — 22,625 — Deconsolidation of subsidiaries (84,924) — (84,924) 1,837 Other — (464) — (464)
Total equity attributable to noncontrolling interests $ — $ 63,937 $ — $ 63,937
See accompanying notes to unaudited consolidated financial statements.
10
Table of Contents
Overstock.com, Inc.Consolidated Statements of Cash Flows (Unaudited)
(in thousands)Six months ended
June 30, 2021 2020Cash flows from operating activities:
Consolidated net income $ 325,669 $ 14,816 (Income) loss from discontinued operations, net of income taxes (217,246) 19,257 Adjustments to reconcile consolidated net income to net cash provided by operating activities:
Depreciation and amortization 9,949 10,978 Non-cash operating lease cost 2,528 2,632 Stock-based compensation to employees and directors 5,107 4,633 Increase in deferred income taxes, net (47,046) 20 Other non-cash adjustments 721 173 Changes in operating assets and liabilities:
Accounts receivable, net (10,141) (19,787)Inventories (766) (500)Prepaids and other current assets (3,452) (3,302)Other long-term assets, net (368) 8 Accounts payable 56,543 54,434 Accrued liabilities (10,651) 57,679 Unearned revenue 12,282 48,470 Operating lease liabilities (2,812) (3,363)Other long-term liabilities (270) 1,217
Net cash provided by continuing operating activities 120,047 187,365 Net cash used in discontinued operating activities (17,128) (16,922)
Net cash provided by operating activities 102,919 170,443 Cash flows from investing activities:
Contributions for capital calls (41,122) — Expenditures for property and equipment (5,620) (7,388)Other investing activities, net (908) (159)
Net cash used in continuing investing activities (47,650) (7,547)Net cash used in discontinued investing activities (29,703) (431)
Net cash used in investing activities (77,353) (7,978)
Continued on the following page
See accompanying notes to unaudited consolidated financial statements.
11
Table of Contents
Overstock.com, Inc.Consolidated Statements of Cash Flows (Unaudited)
(in thousands)Six months ended
June 30,2021 2020
Cash flows from financing activities: Payments on long-term debt (1,366) (779)Proceeds from long-term debt — 47,500 Proceeds from sale of common stock, net of offering costs — 2,848 Payments of taxes withheld upon vesting of restricted stock (7,812) (1,730)Other financing activities, net (1) (3,992)
Net cash provided by (used in) continuing financing activities (9,179) 43,847 Net cash provided by discontinued financing activities 2,085 —
Net cash provided by (used in) financing activities (7,094) 43,847 Net increase in cash, cash equivalents, and restricted cash 18,472 206,312 Cash, cash equivalents, and restricted cash, beginning of period, inclusive of cash balances of discontinuedoperations 519,181 114,898 Cash, cash equivalents, and restricted cash, end of period, inclusive of cash balances of discontinued operations 537,653 321,210
Less: Cash, cash equivalents, and restricted cash of discontinued operations — 19,082 Cash, cash equivalents, and restricted cash, end of period $ 537,653 $ 302,128
See accompanying notes to unaudited consolidated financial statements.
12
Table of Contents
Overstock.com, Inc.Notes to Unaudited Consolidated Financial Statements
1. DESCRIPTION OF BUSINESS
Overstock.com, Inc. is an online retailer and technology company. It is a leading e-commerce retailer offering customers a wide selection ofquality brands for the home at low prices, including furniture, décor, area rugs, bedding and bath, home improvement, outdoor, and kitchen and diningitems, among others. The online shopping site, which receives tens of millions of visits per month, provides customers access to millions of products fromthird-party partners. As used herein, "Overstock," "the Company," "we," "our" and similar terms include Overstock.com, Inc. and its wholly-ownedsubsidiaries, unless the context indicates otherwise. As used herein, the term "Website" refers to the Company's internet websites located atwww.overstock.com, www.o.co, www.overstock.ca, and www.overstockgovernment.com.
2. SUMMARY OF SIGNIFICANT ACCOUNTING POLICIES Basis of Presentation
We have prepared the accompanying unaudited consolidated financial statements pursuant to the rules and regulations of the Securities andExchange Commission ("SEC") regarding interim financial reporting. Accordingly, certain information and footnote disclosures normally included infinancial statements prepared in accordance with accounting principles generally accepted in the United States ("GAAP") have been omitted in accordancewith the rules and regulations of the SEC. These financial statements should be read in conjunction with our audited annual consolidated financialstatements and related notes included in our Annual Report on Form 10-K for the year ended December 31, 2020. There have been no significant changesto our significant accounting policies disclosed in Note 2—Accounting Policies, included in Part II, Item 8, Financial Statements and SupplementaryData, of our Annual Report on Form 10-K for the year ended December 31, 2020, except as disclosed below.
The accompanying unaudited consolidated financial statements reflect all adjustments, consisting only of normal recurring adjustments, which are,in our opinion, necessary for a fair presentation of results for the interim periods presented. The results of operations for the three and six months endedJune 30, 2021 are not necessarily indicative of the results to be expected for any future period or the full fiscal year, due to seasonality and other factors.
On April 23, 2021, we entered into a Limited Partnership Agreement (the "Limited Partnership Agreement") with Pelion MV GP, L.L.C.("Pelion"), in connection with the closing (the "Medici Closing") of the Transaction Agreement dated January 25, 2021 between the Company, MediciVentures, Inc. ("Medici Ventures"), Pelion, and Pelion, Inc. (the "Transaction Agreement"). In connection with the execution of the Limited PartnershipAgreement, Pelion acquired control over Medici Ventures and its blockchain assets. As a result of this transaction, we performed an assessment of controlunder the variable interest entity ("VIE") model and determined that effective as of the Medici Closing, we held a variable interest in both Medici Venturesand tZERO Group, Inc. ("tZERO") (collectively, the "Disposal Group"), both of which meet the definition of variable interest entities; however, we are notthe primary beneficiary of either entity for purposes of consolidation. Accordingly, we deconsolidated the Disposal Group's consolidated net assets andnoncontrolling interest from our consolidated financial statements and results beginning on April 23, 2021, the date that control ceased. The DisposalGroup met the criteria to be reported as held for sale and discontinued operations as of March 31, 2021. As a result of closing the transaction during thesecond quarter of 2021, the Disposal Group's operating results for the periods prior to deconsolidation have been reflected in our consolidated statements ofincome as discontinued operations for all periods presented. Additionally, the related assets and liabilities of the Disposal Group associated with the priorperiods are classified as discontinued operations in our consolidated balance sheets. The majority of the Disposal Group was previously included in theMedici Ventures and tZERO reportable segments, and the remainder was included in Other. Effective as of the first quarter of fiscal year 2021, theCompany has one reportable segment: Retail. See Note 14—Business Segments for additional segment information.
Unless otherwise specified, disclosures in these consolidated financial statements reflect continuing operations only. Certain prior period data,primarily related to discontinued operations, have been reclassified in the consolidated financial statements and accompanying notes to conform to thecurrent period presentation. See Note 3—Discontinued Operations for further information.
13
Table of Contents
Principles of consolidation
The accompanying consolidated financial statements include our accounts and the accounts of our wholly-owned subsidiaries. All intercompanyaccount balances and transactions have been eliminated in consolidation. Use of estimates
The preparation of financial statements in conformity with GAAP requires estimates and assumptions that affect the reported amounts of assetsand liabilities, revenues and expenses, and related disclosures of contingent liabilities in our consolidated financial statements and accompanying notes.Estimates are used for, but not limited to, receivables valuation, revenue recognition, Club O and gift card breakage, sales returns, vendor incentivediscount offers, inventory valuation, depreciable lives and valuation of property and equipment, and internally-developed software, goodwill valuation,intangible asset valuation, equity securities valuation, income taxes, stock-based compensation, performance-based compensation, self-funded healthinsurance liabilities, and contingencies.
Our estimates involving, among other items, forecasted revenues, sales volume, pricing, cost and availability of inventory, consumer demand andspending habits, the continued operations of our supply chain and logistics network, and the overall impact of social distancing on our workforce are evenmore difficult to estimate as a result of uncertainties associated with the scope and duration of the global novel coronavirus ("COVID-19") pandemic andvarious actions taken by governmental authorities, private business and other third parties in response to the pandemic, the ongoing economic effect of thepandemic and the post-pandemic economic recovery. Although these estimates are based on our best knowledge of current events and actions that we mayundertake in the future, the variability of these factors depends on a number of conditions, including uncertainty associated with the COVID-19 pandemicand the post-pandemic economic recovery, how long these conditions will persist, ongoing developments related to the production, approval anddistribution of vaccines, the emergence and spread of new variants of the virus (including variants that may be more contagious and/or impact theeffectiveness of existing vaccines), and additional measures that may be introduced or reintroduced by governments or private parties or the effect any suchadditional measures may have on our business and thus our accounting estimates may change from period to period. To the extent there are differencesbetween these estimates and actual results, our consolidated financial statements may be materially affected.
Initial valuation of retained noncontrolling interest in former subsidiaries
We measure our retained noncontrolling interest in former subsidiaries at fair value at the date of deconsolidation. In the absence of quoted marketprices (e.g., a privately held entity), the fair value is determined in good faith under our valuation policy and process using generally accepted valuationapproaches. We utilize an independent third party valuation firm to assist us in determining the fair values of our retained noncontrolling interest in formersubsidiaries using a combination of a market approach and income approach. The market approach relies upon a comparison with guideline publiccompanies or guideline transactions and entails selecting relevant financial information of the subject company, and capitalizing those amounts usingvaluation multiples that are based on empirical market observations. The income approach relies upon an analysis of its projected economic earningsdiscounted to present value (discounted cash flows). The fair value determination of our retained noncontrolling interest required the use of significantunobservable inputs (Level 3 inputs) as shown in the table within Note 3—Discontinued Operations. Due to the inherent uncertainty of determining the fairvalue of Level 3 securities that do not have a readily available market value, the determination of fair value requires significant judgment or estimation andchanges in the estimates and assumptions used in the valuation models could materially affect the determination of fair value for these assets. See Note 3—Discontinued Operations for further information.
Income taxes
We recognize deferred tax assets to the extent that we believe these assets are more likely than not to be realized. In evaluating our ability torecover our deferred tax assets within the jurisdiction from which they arise, we consider all available positive and negative evidence, including results ofrecent operations, projected future taxable income, scheduled reversals of our deferred tax liabilities, and tax planning strategies.
We record uncertain tax positions in accordance with ASC 740 on the basis of a two-step process whereby (1) we determine whether it is morelikely than not that the tax positions will be sustained on the basis of the technical merits of the position and (2) for those tax positions that meet the more-likely-than-not recognition threshold, we recognize the largest amount of tax benefit that is more than 50 percent likely to be realized upon ultimatesettlement with the related tax authority.
14
Table of Contents
We recognize interest and penalties related to unrecognized tax benefits within the income tax expense line in the accompanying consolidated incomestatements. Accrued interest and penalties are included within the related tax liability line in our consolidated balance sheets.
Recently adopted accounting standards
In December 2019, the FASB issued ASU 2019-12, Income Taxes ("Topic 740")—Simplifying the Accounting for Income Taxes, which removescertain exceptions to the general principles in Topic 740 and amends existing guidance to improve consistent application. We adopted the changes under thenew standard on January 1, 2021. The implementation of ASU 2019-12 did not have a material impact on our consolidated financial statements anddisclosures.
In January 2020, the FASB issued ASU 2020-01, Investments—Equity Securities (Topic 321), Investments—Equity Method and Joint Ventures(Topic 323), and Derivatives and Hedging (Topic 815): Clarifying the Interactions between Topic 321, Topic 323, and Topic 815, which clarifies theinteraction of the accounting for equity securities under Topic 321, the accounting for equity method investments in Topic 323, and the accounting forcertain forward contracts and purchased options in Topic 815. We adopted the changes under the new standard on January 1, 2021. The implementation ofASU 2020-01 did not have a material impact on our consolidated financial statements and disclosures.
In October 2020, the FASB issued ASU 2020-10, Codification Improvements, which amends and provides Codification improvements in order toeither clarify the Codification or correct unintended application of guidance that are not expected to have a significant effect on current accounting practiceor create a significant administrative cost to most entities. We adopted the changes under the new standard on January 1, 2021. The implementation of ASU2020-10 did not have a material impact on our consolidated financial statements and disclosures.
3. DISCONTINUED OPERATIONS
On January 25, 2021, we entered into the Transaction Agreement with Medici Ventures, Pelion, and Pelion, Inc., pursuant to which the partiesagreed, among other things, that: (i) Medici Ventures would convert to a Delaware limited partnership (the "Partnership"), (ii) pursuant to the terms andsubject to the conditions of a Limited Partnership Agreement which was entered into on the date of the Medici Closing, Pelion would become the solegeneral partner of the Partnership, and we (along with any other stockholders of Medici Ventures at the time of the Medici Closing), would become thelimited partners of the Partnership, (iii) prior to the Medici Closing, Overstock would convert the outstanding intercompany debt owed to us by MediciVentures into shares of common stock in Medici Ventures; and (iv) prior to the Medici Closing, Overstock would convert the outstanding intercompanydebt owed to us by tZERO into shares of common stock in tZERO, in each case, on the terms and subject to the conditions set forth in the TransactionAgreement and the relevant definitive agreements to be entered into in connection therewith. Pursuant to the terms of the Limited Partnership Agreement,we and any other partners subsequently admitted to the Partnership agreed to make a capital commitment of $45 million to the Partnership in proportion toour equity interest in the Partnership in order to fund the Partnership's capital needs. The capital commitments may be called in one or more cashinstallments as specified by the general partner upon ten business days' prior written notice. The term of the Partnership is eight years. The debt conversionoutlined in (iii) and (iv) above was completed during the quarter ended March 31, 2021, following which Medici Ventures and Overstock heldapproximately 42% and 41%, respectively, of tZERO's outstanding common stock.
The Transaction Agreement represents a strategic shift for Overstock and a substantive change in the purpose and design of Medici Ventures andits interplay with Overstock’s overall business objectives. The Overstock board of directors has determined that it is in the best interest of Overstock and itsshareholders to have the Overstock management team focus on Overstock’s core e-commerce home furnishings business and strategies. Accordingly, aftersix years of committed effort to advance blockchain technology, Overstock has determined that the Medici Ventures businesses will be better served underthe management of Pelion, a professional asset manager with technology expertise in early-stage companies. From and after the Medici Closing, Pelion hassole authority and responsibility regarding investing decisions, appointing board members of the portfolio companies, and exercising all shareholder rightsfor assets held by the Partnership, with the intent of generating capital appreciation for the held entities and investment income for the partners.
On April 23, 2021, we entered into the Limited Partnership Agreement with Pelion, as part of the Medici Closing, pursuant to which Pelionbecame the sole general partner, holding a 1% equity interest in the Partnership, and Overstock became a limited partner, holding a 99% equity interest inthe Partnership. The Partnership meets the definition of an investment company under ASC Subtopic 946 - Financial Services - Investment Companies. Asa result of this transaction, we
15
Table of Contents
performed an assessment of control under the VIE model and determined that upon closing of the transaction, we held a variable interest in both MediciVentures and tZERO which meet the definition of variable interest entities; however, we are not the primary beneficiary of either entity for purposes ofconsolidation as we do not have the power (either explicit or implicit), through voting rights or similar rights, to direct the activities of the Partnership ortZERO that most significantly impact its economic performance. Pelion was not a related party at the time of the transaction and apart from their capacityas the general partner of the Partnership, we have no other relationship with them. We may not voluntarily withdraw from the Partnership without theconsent of the general partner or upon certain limited events as outlined in the Limited Partnership Agreement. Any proceeds from the sales of assets by thePartnership will be allocated on an asset-by-asset basis to the partners of the Partnership in accordance with the Limited Partnership Agreement followingsuch events.
At the transaction date, our retained equity interest in the Partnership and our direct minority interest in tZERO had a fair value of $288.8 million,inclusive of $3.4 million of capital calls funded at the transaction date. The fair value of these equity securities at the transaction date was estimated bytaking the mid-point from a valuation range using a weighting of multiple valuation techniques on the underlying components of the equity securities tocalculate a fair value for the whole, including discounted cash flow models and market transactional data, both of which incorporate significantunobservable inputs (Level 3). Approximately $149.9 million of the total $288.8 million Level 3 equity securities have been valued using unadjusted inputsthat have not been internally developed by management, including third-party transactions and quotations. The significant unobservable inputs used in the$288.8 million fair value measurement of these Level 3 equity securities at the transaction date are summarized as follows:
Valuation technique Unobservable inputs Range (1)Weighted average
(2)Market approach Enterprise value to revenue multiple 0.88x 0.88x
Discounted cash flows - exitmultiple
Discount rate 9.0% - 35.0% 32.4%Enterprise value to revenue multiple 0.75x - 5.00x 4.40x
(1) — The range for the Annual revenue growth rate and Annual EBITDA % of revenues are based on the weighted average metrics for theannual periods of the separate cash flow models for the respective component.
(2) — Unobservable inputs were weighted by the relative fair value based on the fair value of the underlying components subjected to theidentified valuation technique. For projected terminal year, the amount represents the median of the inputs and is not a weighted average.
We recognized a $243.5 million gain upon deconsolidation of these entities which primarily relates to the remeasurement of our retained equitymethod interest in the Partnership and our direct minority interest in tZERO at fair value, which was included in our consolidated statements of income aspart of Income (loss) from discontinued operations, net of income taxes. During the quarter ended June 30, 2021, we completed the entire funding of our$44.6 million capital commitment consistent with our proportional ownership interest
Our retained equity interest in these entities are classified as equity method securities as we can exercise significant influence, but not control, overthese entities through holding more than a 20% interest in the entity. We will record our proportionate share of the Partnership's reported net income or loss,which reflects the fair value changes of the underlying investments of the Partnership, in Other income (expense), net in our consolidated statements ofincome with corresponding adjustments to the carrying value of the asset. There is no difference between the carrying amount of our investment in thePartnership and the amount of underlying equity we have in the Partnership's net assets. We have elected to apply the fair value option for valuing ourretained direct minority interest in tZERO in future reporting periods as we determined that accounting for our direct equity interest in tZERO under thefair value option would approximate the same valuation approach used by the
16
Table of Contents
Partnership for valuing our indirect interest in tZERO through the Partnership and would be the most meaningful and transparent option for evaluating ourcontinued exposure to the economics of tZERO.
As of June 30, 2021, our 99% equity interest in the Partnership and the 40% direct minority interest in tZERO had a carrying value of $329.9million which is included in Equity securities on our consolidated balance sheets, of which, $99.7 million is valued under the fair value option. Thisamount also constitutes our maximum exposure to loss as a result of our involvement in these entities as we have no additional financing obligations tothese entities. There were no changes in the valuation of our equity interest in tZERO between the recognition date of April 23, 2021 and the period endedJune 30, 2021. The operations of the Partnership post transaction date are not significant through the period ended June 30, 2021 and there were no equitymethod gains or losses associated with our equity interest in the Partnership through the period ended June 30, 2021.
Results of discontinued operations through the transaction date were as follows (in thousands):Three months ended
June 30,Six months ended
June 30,2021 2020 2021 2020
Revenue, net $ 1,802 $ 15,588 $ 17,394 $ 27,563 Cost of goods sold 1,325 13,618 13,716 23,959
Technology 577 4,615 7,133 10,130 Selling, general, and administrative 2,084 7,109 13,509 16,067
Total operating expenses 2,661 11,724 20,642 26,197 Operating loss from discontinued operations (2,184) (9,754) (16,964) (22,593)Interest income, net 5 390 192 473 Other income (loss), net (398) (4,417) 4,081 2,553 Gain on deconsolidation 243,541 — 243,541 —
Income (loss) from discontinued operations before income taxes 240,964 (13,781) 230,850 (19,567)Provision (benefit) for income taxes 13,592 (323) 13,604 (310)Net income (loss) from discontinued operations $ 227,372 $ (13,458) $ 217,246 $ (19,257)
Less: Net loss attributable to noncontrolling interests from discontinuedoperations (134) (1,975) (335) (5,207)
Net income (loss) from discontinued operations attributable to stockholdersof Overstock.com, Inc. $ 227,506 $ (11,483) $ 217,581 $ (14,050)
17
Table of Contents
Assets and liabilities of discontinued operations were as follows (in thousands):June 30,
2021December 31,
2020Cash and cash equivalents $ — $ 21,075 Other current assets — 13,054
Total current assets of discontinued operations $ — $ 34,129 Property and equipment, net $ — $ 8,783 Intangible assets, net — 13,852 Goodwill — 28,790 Equity securities — 45,878 Operating lease right-of-use assets — 7,226 Other long-term assets, net — 1,626
Total long-term assets of discontinued operations $ — $ 106,155 Accounts payable and accrued liabilities $ — $ 11,939 Other current liabilities — 1,985
Total current liabilities of discontinued operations $ — $ 13,924 Operating lease liabilities, non-current — 7,099 Other long-term liabilities — 586
Total long-term liabilities of discontinued operations $ — $ 7,685
4. FAIR VALUE MEASUREMENT
The following tables summarize our assets and liabilities measured at fair value on a recurring basis using the following levels of inputs (inthousands): Fair Value Measurements at June 30, 2021 Total Level 1 Level 2 Level 3Assets:
Equity securities, at fair value $ 100,578 $ 855 $ — $ 99,723 Trading securities held in a "rabbi trust" (1) 163 163 — —
(1) — Trading securities held in a rabbi trust are included in Prepaids and other current assets and Other long-term assets, net in the consolidatedbalance sheets.
(2) — Non-qualified deferred compensation in a rabbi trust is included in Accrued liabilities and Other long-term liabilities in the consolidatedbalance sheets.
18
Table of Contents
5. PROPERTY AND EQUIPMENT, NET
Property and equipment, net consist of the following (in thousands):
June 30,
2021 December 31, 2020Computer hardware and software, including internal-use software and website development $ 217,553 $ 213,124 Building 69,245 69,245 Furniture and equipment 11,906 12,165 Land 12,781 12,781 Leasehold improvements 2,717 3,049 Building machinery and equipment 9,805 9,793 Land improvements 7,010 7,010
331,017 327,167 Less: accumulated depreciation (221,324) (213,400)Total property and equipment, net $ 109,693 $ 113,767
Capitalized costs associated with internal-use software and website development, both developed internally and acquired externally, anddepreciation of costs for the same periods associated with internal-use software and website development consist of the following (in thousands):
Three months endedJune 30,
Six months endedJune 30,
2021 2020 2021 2020Capitalized internal-use software and website development $ 1,758 $ 3,648 $ 3,462 $ 5,586 Depreciation of internal-use software and website development 1,774 2,470 3,582 4,856
Depreciation expense is classified within the corresponding operating expense categories on our consolidated statements of income as follows (inthousands):
Three months endedJune 30,
Six months endedJune 30,
2021 2020 2021 2020Cost of goods sold $ 147 $ 177 $ 301 $ 367 Technology 3,594 3,596 7,469 7,337 General and administrative 1,040 1,607 2,134 3,211
Total depreciation $ 4,781 $ 5,380 $ 9,904 $ 10,915
6. BORROWINGS
2020 loan agreements
In March 2020, we entered into two loan agreements. The loan agreements provide a $34.5 million Senior Note, carrying interest at an annual rateof 4.242%, and a $13.0 million Mezzanine Note, carrying interest at an annual rate of 5.002%. The loans carry a blended annual interest rate of 4.45%. TheSenior Note is for a 10-year term (stated maturity date is March 6, 2030) and requires interest only payments, with the principal amount and any thenunpaid interest due and payable at the end of the 10-year term. The Mezzanine Note has a stated 10-year term, though the agreement requires principal andinterest payments monthly over approximately a 46-month payment period. Our debt issuance costs and debt discount are amortized using the straight-linebasis which approximates the effective interest method.
19
Table of Contents
As of June 30, 2021, the total outstanding debt on these loans was $42.9 million, net of $551,000 in capitalized debt issuance costs, and the totalamount of the current portion of these loans included in Other current liabilities on our consolidated balance sheets was $3.3 million.
Further, Overstock serves as a guarantor under the Senior Note (the "Senior Note Guaranty") and the Mezzanine Note (the "Mezzanine NoteGuaranty"). Both loans include certain financial and non-financial covenants and are secured by our corporate headquarters and the related land and ranksenior to stockholders. Overstock has agreed under the Senior Note Guaranty to, among other things, maintain, until all of the obligations guaranteed byOverstock under the Senior Note Guaranty have been paid in full, (i) a net worth in excess of $30 million and minimum liquid assets of $3 million for solong as the Mezzanine Note is outstanding, and (ii) a net worth in excess of $15 million and minimum liquid assets of $1 million from and after the date theMezzanine Note has been paid in full. Overstock has also agreed under the Mezzanine Note Guaranty to, among other things, maintain a net worth inexcess of $30 million and minimum liquid assets of $3 million until all obligations guaranteed by Overstock under the Mezzanine Note Guaranty have beenpaid in full.
We are in compliance with our debt covenants and continue to monitor our ongoing compliance with our debt covenants.
7. LEASES
We have operating leases for warehouses, office space, and data centers. Our leases have remaining lease terms of one year to six years, some ofwhich may include options to extend the leases perpetually, and some of which may include options to terminate the leases within one year.
The components of lease expenses were as follows (in thousands):
The following table provides a summary of other information related to leases (in thousands):
Six months endedJune 30,
2021 2020Cash payments included in operating cash flows from lease arrangements $ 3,760 $ 4,050Right-of-use assets obtained in exchange for new operating lease liabilities — 1,726Derecognition of right-of-use assets due to reassessment of lease term 527 666
The following table provides supplemental balance sheet information related to leases:
Maturity of lease liabilities under our non-cancellable operating leases as of June 30, 2021, are as follows (in thousands):
Payments due by period Amount2021 (Remainder) $ 2,686 2022 5,678 2023 4,644 2024 2,779 2025 671 Thereafter 340
Total lease payments 16,798 Less interest 1,822
Present value of lease liabilities $ 14,976
8. COMMITMENTS AND CONTINGENCIES Legal proceedings and contingencies
From time to time, we are involved in litigation concerning consumer protection, employment, intellectual property, claims under the securitieslaws, and other commercial matters related to the conduct and operation of our business and the sale of products on our Website. In connection with suchlitigation, we have been in the past and we may be in the future subject to significant damages. In some instances, other parties may have contractualindemnification obligations to us. However, such contractual obligations may prove unenforceable or non-collectible, and if we cannot enforce or collect onindemnification obligations, we may bear the full responsibility for damages, fees, and costs resulting from such litigation. We may also be subject topenalties and equitable remedies that could force us to alter important business practices. Such litigation could be costly and time consuming and coulddivert or distract our management and key personnel from our business operations. Due to the uncertainty of litigation and depending on the amount andthe timing, an unfavorable resolution of some or all of such matters could materially affect our business, results of operations, financial position, or cashflows. The nature of the loss contingencies relating to claims that have been asserted against us are described below.
In September 2009, SpeedTrack, Inc. sued us along with 27 other defendants in the United States District Court in the Northern District ofCalifornia, alleging that we infringed a patent covering search and categorization software. We believe that certain third-party vendors of products andservices sold to us are contractually obligated to indemnify us, and we have tendered defense of the case to an indemnitor who accepted the defense. InApril 2016, the court entered an order partially dismissing the claims against us. In May 2016, the plaintiff filed an amended complaint and we filed ananswer. In March 2020, the court entered a judgment of non-infringement in our favor and against the plaintiff. In June 2020, the plaintiff filed an appeal tothe United States District Court of Appeals for the Federal Circuit. In June 2021, the United States District Court of Appeals for the Federal Circuitaffirmed the lower court's judgment of non-infringement and issued a ruling in our favor and against the plaintiff.
As previously disclosed, in February 2018, the Division of Enforcement of the SEC informed tZERO and subsequently informed us that it isconducting an investigation and requested that we and tZERO voluntarily provide certain information and documents related to tZERO and the tZEROsecurity token offering in connection with its investigation. In December 2018, we received a follow-up request from the SEC relating to its investigationrelating to GSR Capital Ltd., a Cayman Islands exempted company ("GSR"). On October 7, 2019, we received a subpoena from the SEC requestingdocuments and other information related to the Series A-1 preferred stock dividend to stockholders we announced in June 2019 (the "Dividend") (discussedbelow in Note 10—Stockholders' Equity) and requesting Rule 10b5-1 plans entered into by certain officers and directors that were in effect during theperiod of January 1, 2018 through October 7, 2019. In December 2019, we received a subpoena from the SEC requesting documents related to the GSRtransaction and the alternative trading system run by tZERO ATS, LLC. We received another subpoena from the SEC in December 2019 requesting ourinsider trading policies as well as certain employment and consulting agreements. We have also previously received requests from the SEC regarding GSRand our communications with our former Chief Executive Officer and Director Patrick Byrne, and the matters referenced in the December 2019 subpoenas.In May 2020, we received a subpoena from the SEC requesting additional information related to the ATS. In January 2021, we received a subpoena fromthe SEC requesting information regarding our Retail guidance in 2019 and
21
Table of Contents
certain communications with current and former executives, board members, and investors. We are cooperating with the SEC's investigations, haveprovided all documents requested in the voluntary requests and the 2019 and 2020 subpoenas, and continue to provide documents requested in the 2021subpoena.
On September 27, 2019, a purported securities class action lawsuit was filed against us and our former chief executive officer and former chieffinancial officer in the United States District Court of Utah, alleging violations under Section 10(b), Rule 10b-5, Section 20(a), Section 20(A) of theSecurities Exchange Act of 1934, as amended (the "Exchange Act"). On October 8, 2019, October 17, 2019, October 31, 2019, and November 20, 2019,four similar lawsuits were filed in the same court also naming the Company and the above referenced former executives as defendants, bringing similarclaims under the Exchange Act, and seeking similar relief. These cases were consolidated into a single lawsuit in December 2019. The Court appointed TheMangrove Partners Master Fund Ltd. as lead plaintiff in January 2020. In March 2020, an amended consolidated complaint was filed against us, ourPresident, our former Chief Executive Officer, and our former Chief Financial Officer. We filed a motion to dismiss and on September 28, 2020, the courtgranted our motion and entered judgment in our favor. The plaintiffs filed a motion to amend their complaint on October 23, 2020 and filed a notice ofappeal on October 26, 2020. The United States District Court of Utah granted the plaintiffs' motion to amend their complaint on January 6, 2021 and theTenth Circuit Court dismissed the plaintiffs' appeal on January 8, 2021. We filed a motion to dismiss plaintiffs' amended complaint on February 25, 2021.The court heard oral argument on our motion on June 18, 2021, but has not yet issued a ruling. No estimates of the possible losses or range of losses can bemade at this time. We intend to vigorously defend this consolidated action.
On November 22, 2019, a shareholder derivative suit was filed against us and certain past and present directors and officers of the Company in theUnited States District Court for the District of Delaware, with allegations that include: (i) breach of fiduciary duties, (ii) unjust enrichment, (iii) insiderselling and misappropriation of the Company's information, and (iv) contribution under Sections 10(b) and 21D of the Exchange Act. On December 17,2019, a similar lawsuit was filed in the same court, naming the same defendants, bringing similar claims, and seeking similar relief. These cases wereconsolidated into a single lawsuit in January 2020. In March 2020, the court entered a stay on litigation, pending the outcome of the securities class actionmotion to dismiss. No estimates of the possible losses or range of losses can be made at this time. We intend to vigorously defend these actions.
On April 23, 2020, a putative class action lawsuit was filed against us in the Circuit Court of the County of St. Louis, State of Missouri, allegingthat we over-collected taxes on products sold into the state of Missouri. We removed the case to United States District Court, Eastern District of Missourion May 22, 2020, and on February 9, 2021, the case against us was dismissed. On March 1, 2021, a putative class action lawsuit was filed against us in theCircuit Court of the County of St. Louis, State of Missouri, alleging similar allegations to the April 23, 2020 putative class action lawsuit that wasdismissed, that we over-collected taxes on products sold into the state of Missouri. We filed a motion to compel arbitration on April 15, 2021 which has notyet been decided. No estimates of the possible losses or range of losses can be made at this time. We intend to vigorously defend this action.
We establish liabilities when a particular contingency is probable and estimable. At June 30, 2021 and December 31, 2020, we have accrued $1.1million and $1.8 million, respectively, which are included in Accrued liabilities in our consolidated balance sheets. It is reasonably possible that the actuallosses may exceed our accrued liabilities.
9. INDEMNIFICATIONS AND GUARANTEES
During our normal course of business, we have made certain indemnities, commitments, and guarantees under which we may be required to makepayments in relation to certain transactions. These indemnities include, but are not limited to, indemnities we entered into in favor of Loan Core CapitalFunding Corporation LLC under our building loan agreements, various lessors in connection with facility leases for certain claims arising from suchfacility or lease, the environmental indemnity we entered into in favor of the lenders under our prior loan agreements, customary indemnificationarrangements in underwriting agreements and similar agreements, and indemnities to our directors and officers to the maximum extent permitted under thelaws of the State of Delaware. The duration of these indemnities, commitments, and guarantees varies, and in certain cases, is indefinite. In addition, themajority of these indemnities, commitments, and guarantees do not provide for any limitation of the maximum potential future payments we could beobligated to make. As such, we are unable to estimate with any reasonableness our potential exposure under these items. We have not recorded any liabilityfor these indemnities, commitments, and guarantees in the accompanying consolidated balance sheets. We do, however, accrue for losses for any knowncontingent liability, including those that may arise from indemnification provisions, when future payment is both probable and reasonably estimable.
22
Table of Contents
10. STOCKHOLDERS' EQUITY
Common stock
Each share of common stock has the right to one vote. The holders of common stock are also entitled to receive dividends declared by the Boardof Directors out of funds legally available, subject to prior rights of holders of all classes of stock outstanding having priority rights as to dividends.
On May 19, 2020, we completed the distribution of our announced digital dividend (the "Dividend") payable in shares of our Series A-1 preferredstock. The Dividend was paid out at a ratio of 1:10, so that one share of Series A-1 preferred stock was issued for every ten shares of OSTK common stock,for every ten shares of Series A-1 preferred stock, and for every ten shares of Series B preferred stock held by all holders of such shares as of April 27,2020, the record date for the Dividend. The number of shares of Series A-1 preferred stock declared as a stock dividend was 4,085,445 as of March 31,2020 and the number of shares distributed was 4,079,030 on May 19, 2020.
Preferred stock
Each share of our Series A-1 preferred stock and our Series B preferred stock (collectively, the "preferred shares"), except as required by law, areintended to have voting and dividend rights similar to those of one share of common stock. Preferred shares rank senior to common stock with respect todividends. Holders of the preferred shares are entitled to an annual cash dividend of $0.16 per share, in preference to any dividend payment to the holdersof the common stock, out of funds of the Company legally available for payment of dividends and subject to declaration by our Board of Directors. Holdersof the preferred shares are also entitled to participate in any cash dividends we pay to the holders of the common stock and are also entitled to participate innon-cash dividends we pay to holders of the common stock, subject to potentially different treatment if we effect a stock dividend, stock split, orcombination of the common stock. There are no arrearages in cumulative preferred dividends. We declared or accumulated a cash dividend of $0.16 pershare to the holders of our preferred stock during 2020 and 2021.
Neither the Series A-1 preferred stock nor Series B preferred stock is required to be converted into or exchanged for shares of our common stockor any other entity; however, at our sole discretion, we have the right to convert the Series A-1 preferred stock into Series B preferred stock at any time on aone-to-one basis. In the event of any liquidation, any amount available for distribution to stockholders after payment of all liabilities will be distributedproportionately, with each share of Series A-1 preferred stock and each share of Series B preferred stock being treated as though it were a share of ourcommon stock. If we are party to any merger or consolidation in which our common stock is changed into or exchanged for stock or other securities of anyother person (or the Company) or cash or any other property (or a right to receive the foregoing), we will use all commercially reasonable efforts to causeeach outstanding share of the preferred stock to be treated as if such share were an additional outstanding share of common stock in connection with anysuch transaction. Neither the Series A-1 preferred stock nor the Series B preferred stock is registered under the Exchange Act.
JonesTrading Sales Agreement
We entered into an Amended and Restated Capital on Demand Sales Agreement (the "Sales Agreement"), dated June 26, 2020 withJonesTrading Institutional Services LLC ("JonesTrading") and D.A. Davidson & Co. ("D.A. Davidson"), under which we may conduct "at the market"sales of our common stock. Under the Sales Agreement, JonesTrading and D.A. Davidson, acting as our agents, may offer our common stock in the marketon a daily basis or otherwise as we request from time to time. We have no obligation to sell additional shares under the Sales Agreement, but we may do sofrom time to time. For the six months ended June 30, 2021, we did not sell any shares of our common stock pursuant to the Sales Agreement. For the sixmonths ended June 30, 2020, we received $2.8 million of proceeds that was included in Accounts receivable, net on our consolidated balance sheet atDecember 31, 2019 for the sale of an aggregate of 415,904 shares of our common stock under the prior iteration of the agreement that were executed in lateDecember 2019. As of June 30, 2021, we had $150.0 million available under our "at the market" sales program.
TM
23
Table of Contents
11. STOCK-BASED AWARDS
We have equity incentive plans that provide for the grant to employees and board members of stock-based awards, including restricted stock.Employee accounting applies to awards granted by the Company to its own employees. Stock-based compensation expense is classified within thecorresponding operating expense categories on our consolidated statements of income as follows (in thousands):
Three months endedJune 30,
Six months endedJune 30,
2021 2020 2021 2020Cost of goods sold $ 20 $ 49 $ 31 $ 103 Sales and marketing 338 309 595 697 Technology 866 283 1,523 1,041 General and administrative 1,578 1,311 2,958 2,792
When an award is forfeited prior to the vesting date, we recognize an adjustment for the previously recognized expense in the period of theforfeiture.
Overstock restricted stock awards
The Overstock.com, Inc. Amended and Restated 2005 Equity Incentive Plan (the "Plan") provides for the grant of incentive stock options toemployees and directors of the Company, as well as restricted stock units and other types of equity awards of the Company. These restricted stock awardsgenerally vest over three years at 33.3% at the end of the first year, 33.3% at the end of the second year and 33.4% at the end of the third year, subject to therecipient's continuing service to us.
The cost of restricted stock units is determined using the fair value of our common stock on the date of the grant and compensation expense iseither recognized on a straight-line basis over the vesting schedule or on an accelerated schedule when vesting of restricted stock awards exceeds a straight-line basis. The cumulative amount of compensation expense recognized at any point in time is at least equal to the portion of the grant date fair value of theaward that is vested at that date.
The following table summarizes restricted stock award activity during the six months ended June 30, 2021 (in thousands, except per share data):
Six months ended
June 30, 2021
Units
WeightedAverage
Grant DateFair Value
Outstanding—beginning of year 639 $ 17.98 Granted at fair value 297 87.92 Vested (276) 24.48 Forfeited (25) 34.41
Outstanding—end of period 635 $ 47.26
24
Table of Contents
12. REVENUE AND CONTRACT LIABILITY
Unearned Revenue
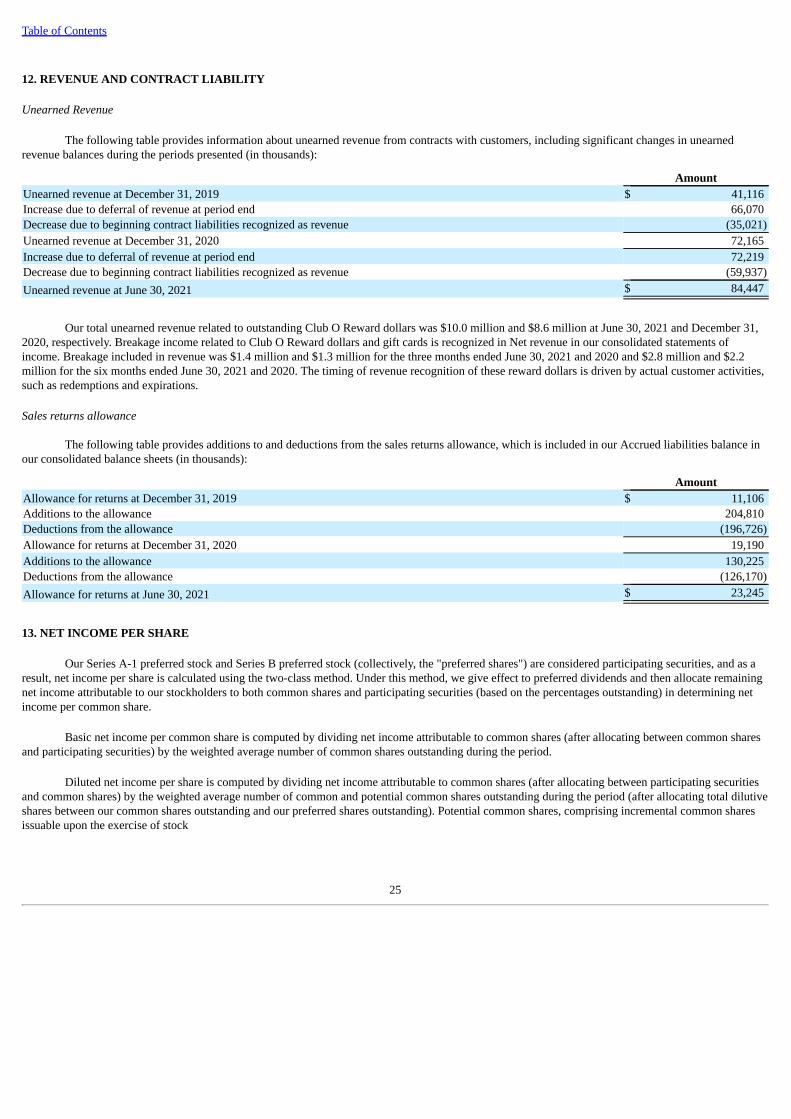
The following table provides information about unearned revenue from contracts with customers, including significant changes in unearnedrevenue balances during the periods presented (in thousands):
AmountUnearned revenue at December 31, 2019 $ 41,116 Increase due to deferral of revenue at period end 66,070 Decrease due to beginning contract liabilities recognized as revenue (35,021)Unearned revenue at December 31, 2020 72,165 Increase due to deferral of revenue at period end 72,219 Decrease due to beginning contract liabilities recognized as revenue (59,937)Unearned revenue at June 30, 2021 $ 84,447
Our total unearned revenue related to outstanding Club O Reward dollars was $10.0 million and $8.6 million at June 30, 2021 and December 31,2020, respectively. Breakage income related to Club O Reward dollars and gift cards is recognized in Net revenue in our consolidated statements ofincome. Breakage included in revenue was $1.4 million and $1.3 million for the three months ended June 30, 2021 and 2020 and $2.8 million and $2.2million for the six months ended June 30, 2021 and 2020. The timing of revenue recognition of these reward dollars is driven by actual customer activities,such as redemptions and expirations.
Sales returns allowance
The following table provides additions to and deductions from the sales returns allowance, which is included in our Accrued liabilities balance inour consolidated balance sheets (in thousands):
AmountAllowance for returns at December 31, 2019 $ 11,106 Additions to the allowance 204,810 Deductions from the allowance (196,726)Allowance for returns at December 31, 2020 19,190 Additions to the allowance 130,225 Deductions from the allowance (126,170)Allowance for returns at June 30, 2021 $ 23,245
13. NET INCOME PER SHARE
Our Series A-1 preferred stock and Series B preferred stock (collectively, the "preferred shares") are considered participating securities, and as aresult, net income per share is calculated using the two-class method. Under this method, we give effect to preferred dividends and then allocate remainingnet income attributable to our stockholders to both common shares and participating securities (based on the percentages outstanding) in determining netincome per common share.
Basic net income per common share is computed by dividing net income attributable to common shares (after allocating between common sharesand participating securities) by the weighted average number of common shares outstanding during the period.
Diluted net income per share is computed by dividing net income attributable to common shares (after allocating between participating securitiesand common shares) by the weighted average number of common and potential common shares outstanding during the period (after allocating total dilutiveshares between our common shares outstanding and our preferred shares outstanding). Potential common shares, comprising incremental common sharesissuable upon the exercise of stock
25
Table of Contents
options, warrants, and restricted stock awards are included in the calculation of diluted net income per common share to the extent such shares are dilutive.
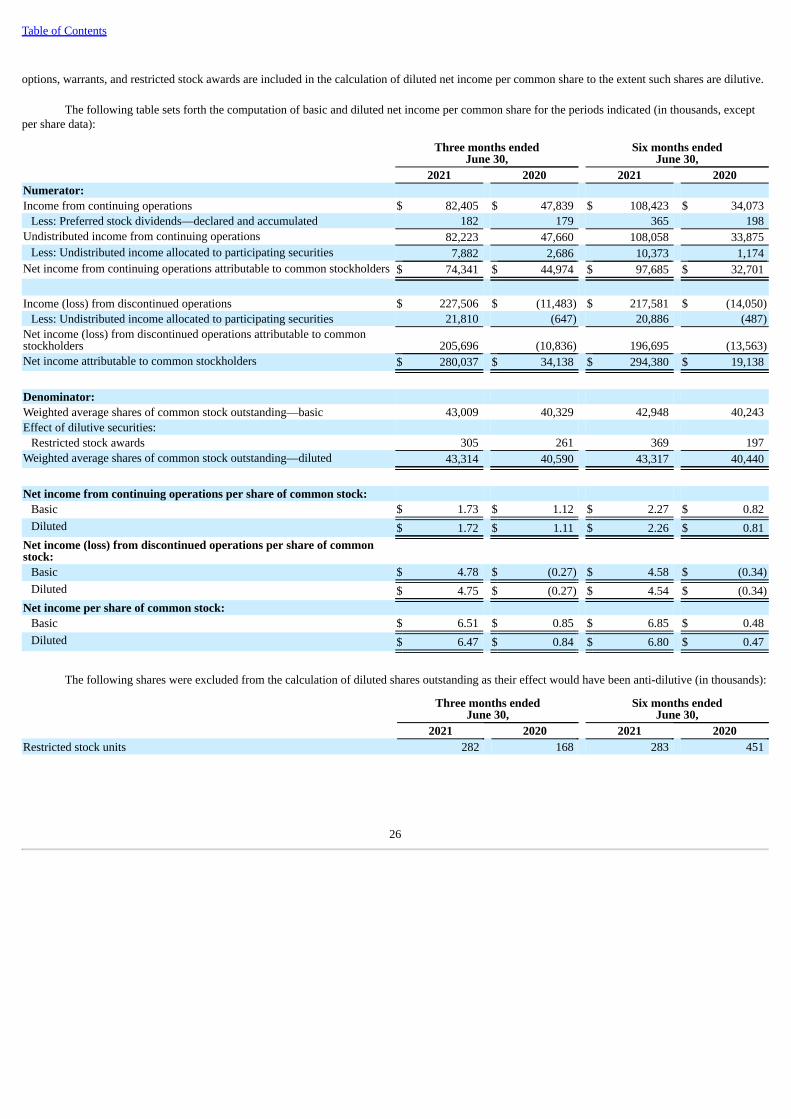
The following table sets forth the computation of basic and diluted net income per common share for the periods indicated (in thousands, exceptper share data):
Three months ended
June 30,Six months ended
June 30, 2021 2020 2021 2020Numerator:Income from continuing operations $ 82,405 $ 47,839 $ 108,423 $ 34,073
Less: Preferred stock dividends—declared and accumulated 182 179 365 198 Undistributed income from continuing operations 82,223 47,660 108,058 33,875
Less: Undistributed income allocated to participating securities 7,882 2,686 10,373 1,174 Net income from continuing operations attributable to common stockholders $ 74,341 $ 44,974 $ 97,685 $ 32,701
Income (loss) from discontinued operations $ 227,506 $ (11,483) $ 217,581 $ (14,050)
Less: Undistributed income allocated to participating securities 21,810 (647) 20,886 (487)Net income (loss) from discontinued operations attributable to commonstockholders 205,696 (10,836) 196,695 (13,563)Net income attributable to common stockholders $ 280,037 $ 34,138 $ 294,380 $ 19,138
Denominator:Weighted average shares of common stock outstanding—basic 43,009 40,329 42,948 40,243 Effect of dilutive securities:
Restricted stock awards 305 261 369 197 Weighted average shares of common stock outstanding—diluted 43,314 40,590 43,317 40,440
Net income from continuing operations per share of common stock:Basic $ 1.73 $ 1.12 $ 2.27 $ 0.82 Diluted $ 1.72 $ 1.11 $ 2.26 $ 0.81
Net income (loss) from discontinued operations per share of commonstock:
Net income per share of common stock:Basic $ 6.51 $ 0.85 $ 6.85 $ 0.48 Diluted $ 6.47 $ 0.84 $ 6.80 $ 0.47
The following shares were excluded from the calculation of diluted shares outstanding as their effect would have been anti-dilutive (in thousands):
Three months ended
June 30,Six months ended
June 30, 2021 2020 2021 2020Restricted stock units 282 168 283 451
26
Table of Contents
14. BUSINESS SEGMENTS
We evaluated our reportable segments in accordance with ASC Topic 280 Segment Reporting based on how we manage our business. At theconclusion of this evaluation, we concluded that we have one reportable segment, Retail, which primarily consists of amounts earned through e-commerceproduct sales through our Website. All corporate support costs (administrative functions such as finance, human resources, and legal) are allocated to oursingle reportable segment. The results of that segment are shown on our consolidated statements of income as continuing operations. As a result of thetransactions discussed in Note 3—Discontinued Operations, our tZERO and Medici Ventures reportable segments became a part of the Disposal Group anddiscontinued operations.
For the three and six months ended June 30, 2021 and 2020, substantially all of our revenues were attributable to customers in the United States.At June 30, 2021 and December 31, 2020, substantially all our property and equipment were located in the United States.
ITEM 2. MANAGEMENT'S DISCUSSION AND ANALYSIS OF FINANCIAL CONDITION AND RESULTS OF OPERATIONS
The following discussion provides information that we believe to be relevant to an understanding of our consolidated financial condition andresults of operations. The statements in this section regarding industry outlook, our expectations regarding the performance of our business and any othernon-historical statements are forward-looking statements. Our actual results may differ materially from those contained in or implied by any forward-looking statements contained herein. These forward-looking statements are subject to numerous risks and uncertainties, including, but not limited to, therisks and uncertainties described in "Special Cautionary Note Regarding Forward Looking Statements" and in Part II, Item 1A, "Risk Factors" included inthis Quarterly Report on Form 10-Q. You should read the following discussion together with our consolidated financial statements and related notesincluded in this Quarterly Report on Form 10-Q and with the sections entitled "Special Cautionary Note Regarding Forward-Looking Statements," Part I,Item 1A, "Risk Factors," and our consolidated financial statements and related notes included in our Annual Report on Form 10-K for the year endedDecember 31, 2020.
We are an online retailer and technology company. As used herein, "Overstock," "the Company," "we," "our" and similar terms includeOverstock.com, Inc. and our majority-owned subsidiaries, unless the context indicates otherwise.
Overview
Overstock seeks to provide goods to furnish and accessorize "Dream Homes for All," particularly for our target customers—consumers who seeksmart value on quality, stylish merchandise at competitive prices, and who want an easy shopping experience. We believe that the furniture and homefurnishings market, which is highly fragmented and has traditionally been served by brick and mortar stores, will continue transitioning to online sales,particularly as millennials and younger generations start families and move into new homes. As a result of the COVID-19 pandemic, the marketexperienced an acceleration of online sales adoption as consumers migrated to online shopping. We regularly update our product assortment to meet theevolving preferences of our customers and current trends. Our products include furniture, décor, area rugs, bedding and bath, home improvement, outdoor,and kitchen and dining items, among others. We sell our products and services primarily through our internet websites located at www.overstock.com,www.o.co, www.overstock.ca, and www.overstockgovernment.com (referred to collectively as the "Website"). Nearly all our retail sales through ourWebsite were from transactions in which we fulfilled orders through our network of manufacturers, distributors and other suppliers ("partners") selling onour Website. Our use of the term "partner" does not mean that we have formed any legal partnerships with any of our retail partners. We provide ourpartners with access to a large customer base and a proprietary technology platform and services for order fulfillment, customer service, returns handling,and other services. Our supply chain allows us to ship directly to our customers from our suppliers or from our warehouses.
27
Table of Contents
Strategies for our Business
Our business initiatives enable our long-term focus on our three brand pillars, "Product Findability," "Smart Value," and "Easy Delivery andSupport." Current initiatives for the business include:
• Improve Product Findability – Directly supporting our "Product Findability" pillar by improving customer search and navigation throughrefinement of our taxonomy and attribute infrastructure with the goal of enhanced search relevancy and recommendations.
• Grow Canada Market Share – Expanding geographical engagement to grow our Canadian customer base by providing a wholesale change in ourCanadian "Smart Value" and "Easy Delivery and Support" customer shopping experience.
• Grow Government Market Share – Improving our Government website with more competitive market features and products that offer an intuitiveprocurement experience, and provide the flexibility to expand the platform to additional government customers.
• Improve Enterprise Platform – Improving our data strategy to connect high-quality, intuitive data with our business users to enable faster insights.Additionally, embracing the public cloud in order to promote greater resilience for the business in the event of unforeseen circumstances.
Financial Reporting Presentation Relating to the Pelion Transaction
Unless otherwise specified, disclosures throughout Management's Discussion and Analysis of Financial Conditions, Results of Operations, andLiquidity and Capital Resources, reflect continuing operations only. See Note 3—Discontinued Operations in the Notes to Unaudited ConsolidatedFinancial Statements included in Item 1, Part I, Financial Statements (Unaudited) of this Quarterly Report on Form 10-Q for further information.
Executive Commentary This executive commentary is intended to provide investors with a view of our business through the eyes of our management. As an executive
commentary, it necessarily focuses on selected aspects of our business. This executive commentary is intended as a supplement to, but not a substitute for,the more detailed discussion of our business included elsewhere herein. Investors are cautioned to read our entire "Management's Discussion and Analysisof Financial Condition and Results of Operations," as well as our interim and audited financial statements, and the discussion of our business and riskfactors and other information included elsewhere or incorporated in this report. This executive commentary includes forward-looking statements, andinvestors are cautioned to read "Special Cautionary Note Regarding Forward-Looking Statements."
Revenue increased 3.6% for the three months ended June 30, 2021, compared to the same period in 2020. This increase was primarily due to a33% increase in average order size driven by a continued and seasonal product mix shift into core home furnishings categories, partially offset by a 22%decrease in the number of customer orders. This decreased order activity was largely driven by tapering of the accelerated customer growth we experiencedat the peak of the COVID-19 pandemic related to stay at home mandates in the second quarter of 2020. While we observed acceleration of new customeracquisition and demand for our products and resulting sales during the peak of the pandemic, we cannot estimate the impact that the ongoing COVID-19pandemic, the intensity of additional waves of the pandemic or the subsiding of the pandemic and return to prior patterns of economic activity will have onour business in the future due to the unpredictable nature of the ultimate development and duration of the COVID-19 pandemic.
Gross profit decreased 1.7% for the three months ended June 30, 2021, compared to the same period in 2020, primarily due to a decrease in grossmargin. Gross margin decreased to 22.0% for the three months ended June 30, 2021, compared to 23.2% for the same period in 2020, primarily due to theone-time benefits realized in 2020 such as lower promotional discounting environment, fees charged to partners due to unmet contractual service levels,and lower customer service costs due to slower growth in our staffing relative to the increase in sales.
Sales and marketing expenses as a percentage of revenue increased from 10.3% for the three months ended June 30, 2020 to 10.7% for the threemonths ended June 30, 2021, primarily due to increased spending on paid listing advertisements and keywords to support our customer acquisition strategy,partially offset by less broadcast media spend and gained leverage in staff-related expenses.
28
Table of Contents
Technology expenses totaled $30.4 million for the three months ended June 30, 2021, a $1.3 million increase compared to the three months endedJune 30, 2020, primarily due to staff-related costs to support strategic initiatives and increased cloud adoption.
General and administrative expenses increased $1.8 million for the three months ended June 30, 2021 compared to the three months endedJune 30, 2020, primarily driven by an $8.6 million reversal of a legal settlement accrual in 2020, partially offset by a reduction in staff-related expenses.
Our consolidated cash and cash equivalents balance increased from $495.4 million as of December 31, 2020, to $536.4 million as of June 30,2021.
Additional commentary related to COVID-19
Overstock has continued to respond to the challenges and opportunities created by the COVID-19 pandemic. In fiscal year 2020, we saw asubstantial year-over-year increase in our Website traffic, number of new customers, and customer demand, particularly in our key home furnishingscategories. While many of our key metrics remain positive some have receded slightly from the elevated 2020 levels during Q2 2021. Our online-onlyplatform and partner network with thousands of fulfillment centers have enabled us to meet the increase in demand. Our three warehouses have remainedoperational based on our sustained implementation of sound safety measures, including staggered shifts and social distancing. These measures are updatedbased on CDC guidelines. We hired in key areas throughout the Company to support our current and expected growth. There remain continued challengescreated by the increased volume throughout the supply chain in factory production capacity, inbound freight delays, as well as carrier delivery constraintsand fulfillment performance from some suppliers. We have evaluated and implemented a phased re-entry plan for our offices; most of our corporateemployees continue to work from home without incident throughout the re-entry period. We cannot predict how the COVID-19 pandemic, including thespread of variants thereof, or the vaccination rate will unfold in the coming months, regionally, nationally and internationally. Nevertheless, the challengesarising from the pandemic have not adversely affected our liquidity, revenues, or capacity to service our debt, nor have these conditions required us toreduce our capital expenditures.
29
Table of Contents
Results of Operations
Comparisons of Three Months Ended June 30, 2021 to Three Months Ended June 30, 2020, and Six Months Ended June 30, 2021 to Six MonthsEnded June 30, 2020.
Net revenue, cost of goods sold, gross profit and gross margin
The following table reflects our net revenue, cost of goods sold, and gross profit for the three and six months ended June 30, 2021 and 2020 (inthousands):
Three months ended
June 30,Six months ended
June 30,2021 2020 2021 2020
Net revenue $ 794,536 $ 766,956 $ 1,454,397 $ 1,106,554 Cost of goods sold
Product costs and other cost of goods sold 591,280 562,165 1,070,462 811,770 Fulfillment and related costs 28,430 26,879 55,585 42,666
Total cost of goods sold 619,710 589,044 1,126,047 854,436 Gross profit $ 174,826 $ 177,912 $ 328,350 $ 252,118
Product costs and other cost of goods sold 74.4 % 73.3 % 73.6 % 73.4 %Fulfillment and related costs 3.6 % 3.5 % 3.8 % 3.9 %
Total cost of goods sold 78.0 % 76.8 % 77.4 % 77.2 %Gross margin 22.0 % 23.2 % 22.6 % 22.8 %
The 3.6% increase in net revenue for the three months ended June 30, 2021, as compared to the same period in 2020, was primarily due to a 33%increase in average order value driven by a continued and seasonal product mix shift into core home furnishings categories, partially offset by a 22%decrease in the number of customer orders. This decreased order activity was largely driven by tapering of the accelerated customer growth we experiencedat the peak of the COVID-19 pandemic related to stay at home mandates in the second quarter of 2020.
The 31.4% increase in net revenue for the six months ended June 30, 2021, as compared to the same period in 2020, was primarily due toincreased retail product sales resulting from a 25% increase in average order value driven by a continued product mix shift into core home furnishingscategories and a 5% increase in customer orders.
For both the three and six months ended June 30, 2021, while we observed acceleration of new customer acquisition and demand for our productsand resulting sales during the peak of the pandemic, we cannot estimate the impact that the ongoing COVID-19 pandemic, the intensity of additional wavesof the pandemic or the subsiding of the pandemic and return to prior patterns of economic activity will have on our business in the future due to theunpredictable nature of the ultimate development and duration of the COVID-19 pandemic.
International net revenues were less than 1% of total net revenues for each of the three and six months ended June 30, 2021 and 2020.
30
Table of Contents
Change in estimate of average transit times (days)
Our revenue related to merchandise sales is recognized upon delivery to our customers. As we ship high volumes of packages through multiplecarriers, it is not practical for us to track the actual delivery date of each shipment. Therefore, we use estimates to determine which shipments are deliveredand, therefore, recognized as revenue at the end of the period. Our delivery date estimates are based on average shipping transit times. We review andupdate our estimates on a quarterly basis based on our actual transit time experience. However, actual shipping times may differ from our estimates, whichcan be further impacted by uncertainty, volatility, and any disruption to our carriers caused by the COVID-19 pandemic.
The following table shows the effect that hypothetical changes in the estimate of average shipping transit times would have had on the reported
amount of revenue and income before income taxes for the three months ended June 30, 2021 (in thousands):
Three months ended
June 30, 2021
Change in the Estimate of Average Transit Times (Days)Increase (Decrease)
RevenueIncrease (Decrease)
Income Before Income Taxes2 $ (16,547) $ (3,106)1 $ (7,776) $ (1,453)As reported As reported As reported-1 $ 16,877 $ 3,216 -2 $ 27,308 $ 5,192
Our overall gross margins fluctuate based on changes in supplier cost and/or sales price, including competitive pricing; inventory management
decisions; sales coupons and promotions; product mix of sales; and operational and fulfillment costs. Fulfillment costs include all warehousing costs,including fixed overhead and variable handling costs (excluding packaging costs), as well as merchant processing fees associated with customer paymentsmade by credit cards and other payment methods and other variable fees, and customer service costs, all of which we include as costs in calculating grossmargin. We believe that some companies in our industry, including some of our competitors, account for fulfillment costs within operating expenses, andtherefore exclude fulfillment costs from gross margin. As a result, our gross margin may not be directly comparable to others in our industry.
Fulfillment costs as a percentage of sales may vary due to several factors, such as our ability to manage costs at our warehouses, significantchanges in the number of units received and fulfilled, the extent to which we use third-party fulfillment services and warehouses, and our ability toeffectively manage customer service costs and merchant fees. Fulfillment and related costs remained relatively consistent as a percentage of revenue duringthe three and six months ended June 30, 2021 as compared to the same period in 2020.
Gross margins for the past six quarterly periods and fiscal year ending 2020 were:
Gross profit for the three months ended June 30, 2021 decreased 1.7% compared to the same period in 2020, primarily due to a decrease in grossmargin. Gross margin decreased to 22.0% for the three months ended June 30, 2021, compared to 23.2% for the same period in 2020, primarily due to theone-time benefits realized in 2020 such as lower promotional discounting environment, fees charged to partners due to unmet contractual service levels,and lower customer service costs due to slower growth in our staffing relative to the increase in sales.
Gross profit for the six months ended June 30, 2021 increased 30.2% compared to the same period in 2020, primarily due to sales volume. Grossmargin decreased to 22.6% for the six months ended June 30, 2021, compared to 22.8% for the same period in 2020, primarily due to one-time benefitsrealized in 2020 such as lower promotional discounting environment and fees charged to partners due to unmet contractual service levels.
31
Table of Contents
Operating expenses Sales and marketing expenses
We use a variety of methods to target our consumer audience, including online campaigns, such as advertising through text ads, product listingads, display ads, native ads, affiliate marketing programs, e-mail, direct mail, video ads, and social media campaigns. We also do brand advertising throughlinear and streaming television.
Costs associated with our discounted shipping and other promotions, such as coupons, are not included in sales and marketing expense. Rather,they are accounted for as a reduction in revenue as they reduce the amount of consideration we expect to receive in exchange for goods or services andtherefore affect net revenues and gross margin. We consider discounted shipping and other promotions, such as our policy for free shipping on orders, as aneffective marketing tool.
The following table reflects our sales and marketing expenses for the three and six months ended June 30, 2021 and 2020 (in thousands):
Three months ended
June 30,Six months ended
June 30, 2021 2020 2021 2020Sales and marketing expenses $ 85,272 $ 79,215 $ 158,810 $ 115,560
Advertising expense included in sales and marketing expenses $ 81,855 $ 75,051 $ 151,868 $ 107,587 Year-over-year percentage growth
Sales and marketing expenses 7.6 % 37.4 %Advertising expense included in sales and marketing expenses 9.1 % 41.2 %
Percentage of net revenuesSales and marketing expenses 10.7 % 10.3 % 10.9 % 10.4 %Advertising expense included in sales and marketing expenses 10.3 % 9.8 % 10.4 % 9.7 %
The 40 basis point increase in sales and marketing expenses as a percent of net revenues for the three months ended June 30, 2021, as compared to
the same period in 2020, was primarily due to increased spending on paid listing advertisements and keywords to support our customer acquisition strategy,partially offset by less broadcast media spend and gained leverage in staff-related expenses.
The 50 basis point increase in sales and marketing expenses as a percent of net revenues for the six months ended June 30, 2021, as compared tothe same period in 2020, was primarily due to increased spending on paid listing advertisements and keywords to support our customer acquisition strategy,partially offset by less broadcast media spend and gained leverage in staff-related expenses.
Technology expenses
We seek to deploy our capital resources efficiently in technology, including web services, customer support solutions, website search, expansion ofnew and existing product categories, and in technology to enhance the customer experience, including using machine learning, improve our processefficiency, modernize and expand our systems, and support and expand our logistics infrastructure. We expect to continue to incur technology expenses tosupport these initiatives and these expenditures may continue to be material.
The frequency and variety of cyberattacks on our Website, our corporate systems, and on third parties we use to support our technology continuesto increase. The impact of such attacks, their costs, and the costs we incur to protect ourselves against future attacks have not been material to date.However, we consider the risk introduced by cyberattacks to be serious and will continue to incur costs related to efforts to protect ourselves against them.
32
Table of Contents
The following table reflects our technology expenses for the three and six months ended June 30, 2021 and 2020 (in thousands):
Technology expenses 4.5 % 8.1 %Technology expenses as a percent of net revenues 3.8 % 3.8 % 4.2 % 5.1 %
The $1.3 million increase in technology expenses for the three months ended June 30, 2021, as compared to the same period in 2020, wasprimarily due to staff-related costs to support strategic initiatives and increased cloud adoption.
The $4.6 million increase in technology expenses for the six months ended June 30, 2021, as compared to the same period in 2020, was primarilydue to staff-related costs to support strategic initiatives and increased cloud adoption.
General and administrative expenses
The following table reflects our general and administrative expenses for the three and six months ended June 30, 2021 and 2020 (in thousands):
Three months ended
June 30,Six months ended
June 30, 2021 2020 2021 2020General and administrative expenses $ 22,660 $ 20,837 $ 45,531 $ 44,722 Year-over-year percentage growth
General and administrative expenses 8.7 % 1.8 %General and administrative expenses as a percent of net revenues 2.9 % 2.7 % 3.1 % 4.0 %
The $1.8 million increase in general and administrative expenses for the three months ended June 30, 2021, as compared to the same period in2020, was primarily driven by an $8.6 million reversal of a legal settlement accrual in 2020, partially offset by a reduction in staff-related expenses.
The $809,000 increase in general and administrative expenses for the six months ended June 30, 2021, as compared to the same period in 2020,was primarily driven by an $8.6 million reversal of a legal settlement accrual in 2020, a $2.5 million legal settlement realized in 2020, partially offset by areduction in staff-related expenses and reduced discretionary consulting spend.
Income taxes
Our income tax provision for interim periods is determined using an estimate of our annual effective tax rate adjusted for discrete items, if any, forrelevant interim periods. We update our estimate of the annual effective tax rate each quarter and make cumulative adjustments if our estimated annualeffective tax rate changes.
Our quarterly tax provision and our quarterly estimate of our annual effective tax rate are subject to significant variations due to several factorsincluding: variability in predicting our pre-tax and taxable income as well as the mix of jurisdictions to which those items relate, relative changes inexpenses or losses for which tax benefits are limited or not recognized, how we do business, fluctuations in our stock price, economic outlook, politicalclimate, and other conditions such as the COVID-19 pandemic. In addition, changes in laws, regulations, and administrative practices will impact our rate.Our effective tax rate can be volatile based on the amount of pre-tax income. For example, the impact of discrete items on our effective tax rate is greaterwhen pre-tax income is lower.
33
Table of Contents
Our provision (benefit) for income tax for the three months ended June 30, 2021 and 2020 was $(45.7) million and $840,000, respectively. Ourprovision (benefit) for income tax for the six months ended June 30, 2021 was $(45.5) million and $1.0 million, respectively. The tax benefit increasedduring the three and six months ended June 30, 2021 primarily due to the valuation allowance release for certain federal and state deferred tax assets. Theeffective tax rate for the six months ended June 30, 2021 and 2020 was (72.4)% and 2.9%, respectively. Our high effective tax rate for the six months endedJune 30, 2021 is primarily attributable to the valuation allowance release for certain federal and state deferred tax assets in the current period.
Each quarter we assess the recoverability of our deferred tax assets under ASC Topic 740. We assess available positive and negative evidence toestimate whether we will generate sufficient future taxable income to use our existing deferred tax assets. We have no carryback ability, and therefore wemust rely on future taxable income, including tax planning strategies and future reversals of taxable temporary differences, to support their realizability. Inour assessment for the period ended June 30, 2021, we concluded it is more likely than not that our deferred tax assets related to United States federalincome and all states with the exception of Utah will be realizable, therefore, we released approximately $47.0 million of our valuation allowance. When achange in valuation allowance is recognized during an interim period, a portion of the valuation allowance to be reversed must be allocated to theremaining interim periods. We still maintain a valuation allowance against our deferred tax assets for capital losses and the state of Utah where notsupported by future reversals of taxable temporary differences, because of the uncertainty regarding the realizability of these deferred tax assets. We willcontinue to monitor the need for a valuation allowance against our remaining deferred tax assets on a quarterly basis.
In reaching the conclusion that deferred tax assets related to United States federal income and all states, except for Utah, will be realizable, weconsidered, among other things, three significant pieces of positive evidence that occurred during the quarter ended June 30, 2021: 1) achieving three-yearcumulative earnings, 2) recent use of deferred tax assets, and 3) changes in our tax filing groups in conjunction with the Pelion Transaction.
First, a significant piece of objective positive evidence we evaluated was the cumulative earnings generated over the three-year period ended June30, 2021, by our federal tax-filing group that includes our Retail segment. Because we no longer have objective negative evidence in the form ofcumulative losses, additional weight may be given to our more recent operating results and more subjective evidence such as forecasts of future taxableincome. As a result of the COVID-19 pandemic, the market experienced an acceleration of online sales adoption as consumers migrated to online shopping.We saw our retail product sales accelerate beginning in the second half of March 2020 and continuing through June 2021. The effects of the ongoingCOVID-19 pandemic on our business make estimates of future income more challenging due to the unpredictable nature of the ultimate development andduration of the pandemic. Therefore, we performed a sensitivity analysis based on historical actuals as well as management’s forecasts to address howpotential changes in assumptions could impact our ability to generate the minimum amount of taxable income required to utilize our deferred tax assetsprior to expiration. The minimum amount of annual income we need to earn to utilize the remaining federal and non-Utah state deferred tax assets prior toexpiration is significantly lower than our recent operating results and future projections, mitigating risk around the unpredictable nature of the developmentand duration of the COVID-19 pandemic.
Second, we have utilized significant deferred tax assets in the form of federal net operating losses over the last five quarters, resulting in an overallreduction in the amount of valuation allowance recorded against our net deferred tax assets. Based on our earnings through June 30, 2021, we now haveutilized substantially all federal net operating losses that expire.
Third, due to the strategic shift for Overstock and the substantive change in the purpose and design of Medici Ventures resulting in the closure ofthe Pelion Transaction during the quarter, we have deconsolidated certain business lines that historically contributed operating losses to our tax filings.These losses will not recur in our future federal and state tax filings. Additionally, in conjunction with the Pelion Transaction, the gain on deconsolidationrecognized in our financial statements generated a new taxable temporary difference, the reversal of which further supports the realizability of certainfederal and state deferred tax assets.
We are subject to taxation in the United States and multiple state and foreign jurisdictions. Tax years beginning in 2016 are subject to examinationby taxing authorities, although net operating loss and credit carryforwards from all years are subject to examinations and adjustments for at least three yearsfollowing the year in which the attributes are used.
34
Table of Contents
Liquidity and Capital Resources
Overview
We believe that our cash and cash equivalents currently on hand and expected cash flows from future operations will be sufficient to continueoperations for at least the next twelve months. We continue to monitor, evaluate, and manage our operating plans, forecasts, and liquidity in light of themost recent developments driven by the COVID-19 pandemic. We proactively seek opportunities to improve the efficiency of our operations and have inthe past and may in the future take steps to realize internal cost savings, including aligning our staffing needs based on our current and expected futurelevels of operations and process streamlining.
Current sources of liquidity
Our principal sources of liquidity are existing cash and cash equivalents and accounts receivables, net. At June 30, 2021, we had cash and cashequivalents of $536.4 million and accounts receivables, net of $33.0 million.
At June 30, 2021, we had $150.0 million available under our "at the market" sales program which permits us to conduct "at the market" sales ofour common stock under the Sales Agreement.
Cash flow information is as follows (in thousands):
Cash received from customers generally corresponds to our net revenues as our customers primarily use credit cards to buy from us, causing ourreceivables from these sales transactions to settle quickly. We have payment terms with our partners that generally extend beyond the amount of timenecessary to collect proceeds from our customers. As a result of increased online shopping migration from the COVID-19 pandemic, we saw our retailrevenue accelerate beginning in the second half of March 2020 and continuing through June 2021, as customers turned to online shopping, which causedour cash, cash equivalents and accounts receivable balances to increase compared to prior quarter-end and also resulted in an increase in our accountspayable and unearned revenue balance as of June 30, 2021. Due to uncertainty surrounding the COVID-19 pandemic, we are unable to predict the durationsuch favorable conditions and its sustained impact on cash flows. We continue to monitor, evaluate, and manage our operating plans, forecasts, andliquidity in light of the most recent developments driven by the COVID-19 pandemic.
The $120.0 million of net cash provided by continuing operating activities during the six months ended June 30, 2021 was primarily due toincome from continuing operations adjusted for non-cash items of $79.7 million and cash provided by changes in operating assets and liabilities of $40.4million.
The $187.4 million of net cash provided by continuing operating activities during the six months ended June 30, 2020 was primarily due toincome from continuing operations adjusted for non-cash items of $52.5 million and cash provided by changes in operating assets and liabilities of $134.9million.
Investing activities
For the six months ended June 30, 2021, investing activities resulted in a net cash outflow of $47.7 million, primarily due to $41.1 million ofcontributions for capital calls and $5.6 million of expenditures for property and equipment.
35
Table of Contents
For the six months ended June 30, 2020, investing activities resulted in a net cash outflow of $7.5 million, primarily due to $7.4 million ofexpenditures for property and equipment.
Financing activities
For the six months ended June 30, 2021, financing activities resulted in a net cash outflow of $9.2 million primarily due to $7.8 million forpayment of taxes withheld upon vesting of restricted stock.
For the six months ended June 30, 2020, financing activities resulted in a net cash inflow of $43.8 million primarily due to $47.5 million inproceeds from long-term debt and $2.8 million of net proceeds from the sale of common stock under our at the market offering for sales of common stockexecuted in late December 2019, partially offset by $1.7 million for payment of taxes withheld upon vesting of restricted stock.
Contractual Obligations and Commitments
The following table summarizes our contractual obligations as of June 30, 2021 and the effect such obligations and commitments are expected tohave on our liquidity and cash flow in future periods (in thousands):
(1) — Represents the future minimum lease payments under non-cancellable operating leases. For information regarding our operating leaseobligations, see Note 7—Leases, in the Notes to Unaudited Consolidated Financial Statements included in Item 1, Part I, Financial Statements(Unaudited) of this Quarterly Report on Form 10-Q.
(2) — Represents future interest and principal payments on the financing agreements with Loan Core Capital Funding Corporation LLC. Forinformation regarding our financing agreements, see Note 6—Borrowings, in the Notes to Unaudited Consolidated FinancialStatements included in Item 1, Part I, Financial Statements (Unaudited) of this Quarterly Report on Form 10-Q.
Tax contingencies
We are involved in various tax matters, the outcomes of which are uncertain. As of June 30, 2021, accrued tax contingencies were $917,000.Changes in state, federal, and foreign tax laws may increase our tax contingencies. The timing of the resolution of income tax contingencies is highlyuncertain, and the amounts ultimately paid, if any, upon resolution of issues raised by the taxing authorities may differ from the amounts accrued. It isreasonably possible that within the next 12 months we will receive additional assessments by various tax authorities. These assessments may or may notresult in changes to our contingencies related to positions on prior years' tax filings.
Off-Balance Sheet Arrangements
We do not have any off-balance sheet arrangements that have or are reasonably likely to have a current or future effect on our financial condition,changes in financial condition, revenues or expenses, results of operations, liquidity, capital expenditures, or capital resources that would be material toinvestors.
Critical Accounting Policies and Estimates
The preparation of our financial statements requires that we make estimates and judgments. We base these on historical experience and on otherassumptions that we believe to be reasonable. There have been no material changes to our critical accounting policies and estimates as compared to thecritical accounting policies and estimates described in Note 2—Accounting Policies, included in Part II, Item 8, Financial Statements and SupplementaryData, of our Annual Report on Form 10-K for the year ended December 31, 2020, except for the additions of our critical accounting policy regarding ourassessment of control under the VIE model for the retained noncontrolling interests resulting from the deconsolidation of our Medici subsidiaries, which isdiscussed in Note 2—Summary of Significant Accounting Policies, Basis of Presentation, and our
36
Table of Contents
critical accounting policy and estimates for the initial valuation of our retained noncontrolling interests in deconsolidated former subsidiaries, which isdiscussed in Note 2—Summary of Significant Accounting Policies, Initial valuation of retained noncontrolling interest in former subsidiaries.
Government Regulation
We are subject to a wide variety of laws, rules and regulations, some of which apply or may apply to us as a result of our retail business, andothers of which apply to us for other reasons, such as our status as a publicly held company or the places in which we sell certain types or amounts ofproducts. Our retail business is subject to general business regulations and laws, as well as regulations and laws specifically governing the Internet, e-commerce, and other services we offer. Existing and future laws and regulations may result in increasing expense and may impede our growth. Applicableand potentially applicable regulations and laws include regulations and laws regarding taxation, privacy, data protection, pricing, content, copyrights,distribution, mobile communications, electronic device certification, electronic waste, energy consumption, environmental regulation, electronic contractsand other communications, competition, consumer protection, employment, import and export matters, information reporting requirements, access to ourservices and facilities, the design and operation of websites, health and sanitation standards, the characteristics and quality of products and services, productlabeling and unfair and deceptive trade practices.
Our efforts to expand our retail business outside of the U.S. expose us to foreign and additional U.S. laws and regulations, including but notlimited to, laws and regulations relating to taxation, business licensing or certification requirements, advertising practices, online services, the use ofcryptocurrency, the importation of specified or proscribed items, importation quotas, consumer protection, intellectual property rights, consumer and dataprotection, privacy, encryption, restrictions on pricing or discounts, and the U.S. Foreign Corrupt Practices Act and other applicable U.S. and foreign lawsprohibiting corrupt payments to government officials and other third parties.
37
Table of Contents
ITEM 3. QUANTITATIVE AND QUALITATIVE DISCLOSURES ABOUT MARKET RISK
We are exposed to market risk for the effect of interest rate changes, foreign currency fluctuations, and changes in the market values of oursecurities. Information relating to quantitative and qualitative disclosures about these market risks is set forth below.
Interest Rate Sensitivity
The fair value of our cash and cash equivalents (highly-liquid instruments with a remaining maturity of 90 days or less at the date of purchase)would not be significantly affected by either an increase or decrease in interest rates due mainly to the short-term nature of these instruments.
Our loan agreements carry a fixed blended annual interest rate of 4.45%. Since the Notes bear interest at a fixed rate, we have no direct financialstatement risk associated with changes in interest rates.
Foreign Currency Risk
Most of our sales and operating expenses are denominated in U.S. dollars, and therefore, our total revenue and operating expenses are notcurrently subject to significant foreign currency risk.
Investment Risk
The fair values of our equity securities may be subject to fluctuations due to volatility of the stock market in general, investment-specificcircumstances, and changes in general economic conditions. Volatile market conditions arising from the COVID-19 pandemic may result in significantchanges in the value of our equity securities. At June 30, 2021, our recorded value in equity securities in public and private companies was $330.8 million,of which $855,000 relates to publicly traded companies, recorded at fair value, which are subject to market price volatility. We have elected to account forcertain of our equity method securities using the fair value option. Our assessment includes a review of recent operating results and trends, recentsales/acquisitions of the equity securities, and other publicly available data. Valuations of private companies are inherently more complex due to the lack ofreadily available market data. As such, we believe that market sensitivities are not practicable.
38
Table of Contents
ITEM 4. CONTROLS AND PROCEDURES Disclosure Controls and Procedures
We maintain disclosure controls and procedures, as such term is defined in Rule 13a-15(e) and 15d-15(e) of the Exchange Act. Theterm disclosure controls and procedures means controls and other procedures of an issuer that are designed to ensure that information required to bedisclosed by the issuer in the reports that it files or submits under the Exchange Act is recorded, processed, summarized and reported, within the timeperiods specified in the Commission's rules and forms.
Disclosure controls and procedures include, without limitation, controls and procedures designed to ensure that information required to bedisclosed by an issuer in the reports that it files or submits under the Exchange Act is accumulated and communicated to the issuer's management,including its principal executive and principal financial officers, or persons performing similar functions, as appropriate to allow timely decisions regardingrequired disclosure.
Evaluation of Disclosure Controls and Procedures
We carried out an evaluation required by the Exchange Act, under the supervision and with the participation of our principal executive officer andprincipal financial officer, of the effectiveness of the design and operation of our disclosure controls and procedures, as defined in Rule 13a-15(e) of theExchange Act, as of the end of the period covered by this report. Based on this evaluation, our principal executive officer and principal financial officerconcluded that our disclosure controls and procedures were effective to provide reasonable assurance that information required to be disclosed by us in thereports that we file or submit under the Exchange Act is recorded, processed, summarized and reported within the time periods specified in the SEC'srules and forms and to provide reasonable assurance that such information is accumulated and communicated to our management, including our principalexecutive officer and principal financial officer, as appropriate to allow timely decisions regarding required disclosure.
Limitations on Disclosure Controls and Procedures
Our disclosure controls and procedures are designed to provide reasonable assurance of achieving their objectives as specified above.Management does not expect, however, that our disclosure controls and procedures will prevent or detect all error and fraud. Any control system, no matterhow well designed and operated, is based upon certain assumptions and can provide only reasonable, not absolute, assurance that its objectives will be met.Further, no evaluation of controls can provide absolute assurance that misstatements due to error or fraud will not occur or that all control issues andinstances of fraud, if any, within the Company have been detected.
Changes in Disclosure Controls and Procedures and Internal Control Over Financial Reporting
During the quarter ended June 30, 2021, we evaluated, and in certain cases enhanced, the design of existing internal controls supporting both therelease of our tax valuation allowance and the initial valuation of our retained noncontrolling interests in deconsolidated former subsidiaries. Except forthese enhancements, there were no other changes in either our disclosure controls and procedures or our internal control over financial reporting thatoccurred during the quarter ended June 30, 2021, that have materially affected, or are reasonably likely to materially affect, our disclosure controls andprocedures or our internal control over financial reporting. We have not experienced any material impact to our disclosure controls and procedures or ourinternal controls over financial reporting despite the fact that most of our corporate employees are working remotely due to the COVID-19 pandemic. Weare continually monitoring and assessing the COVID-19 situation on our internal controls to minimize the impact on their design and operatingeffectiveness.
39
Table of Contents
PART II. OTHER INFORMATION
ITEM 1. LEGAL PROCEEDINGS
From time to time, we are involved in, or become subject to litigation or other legal proceedings concerning consumer protection, employment,intellectual property, claims under the securities laws, and other commercial matters related to the conduct and operation of our business and the sale ofproducts on our Website. We also prosecute lawsuits to enforce our legal rights. In connection with such litigation or other legal proceedings, we have beenin the past and we may be in the future subject to significant damages, associated costs, or equitable remedies relating to the operation of our business.Such litigation could be costly and time consuming and could divert or distract our management and key personnel from our business operations. Due tothe uncertainty of litigation and depending on the amount and the timing, an unfavorable resolution of some or all of such matters could materially affectour business, results of operations, financial position, or cash flows. For additional details, see the information set forth under Item 1 of Part I, FinancialStatements—Note 8—Commitments and Contingencies, subheading Legal Proceedings and Contingencies, contained in the Notes to UnauditedConsolidated Financial Statements of this Quarterly Report on Form 10-Q is incorporated by reference in answer to this Item.
ITEM 1A. RISK FACTORS
Any investment in our securities involves a high degree of risk. Please consider the following risk factors carefully. If any one or more of the following riskswere to occur, it could have a material adverse effect on our business, prospects, financial condition and results of operations, and the market price of oursecurities could decrease significantly. Statements below to the effect that an event could or would harm our business (or have an adverse effect on ourbusiness or similar statements) mean that the event could or would have a material adverse effect on our business, prospects, financial condition andresults of operations, which in turn could or would have a material adverse effect on the market price of our securities. Many of the risks we face involvemore than one type of risk. Consequently, you should read all of the risk factors below carefully, as well as the risk factors described in our Form 10-K forthe year ended December 31, 2020, and in any reports we file with the SEC after we file this Form 10-Q, before deciding whether to purchase or hold oursecurities. We have not repeated risk factors contained in our Form 10-K for the year ended December 31, 2020, which are incorporated herein byreference. The occurrence of any of these risks could harm our business, the trading price of our securities could decline, and investors could lose part orall of their investment.
Other than the risk factors set forth below, there are no material changes from the risk factors previously disclosed in Part I - Item 1A - "RiskFactors," of our Annual Report on Form 10-K for the year ended December 31, 2020.
We may be required to recognize losses relating to our direct and indirect equity interests in startup businesses.
We hold direct and indirect noncontrolling interests in several companies that are in the startup or development stages. Noncontrolling interests areinherently risky because we may not have the ability to influence business decisions. Further, these interests are inherently risky because the markets for thetechnologies or products these companies are developing are typically in the early stages, unproven, and may never materialize. These companies mayabandon, modify, or alter their product and service mix and overall strategy whether due to COVID-19 or otherwise. Additionally, since these interests arein companies that are in the early startup or development stages, even if their technology or products are viable, they may not be able to obtain the capitalor resources necessary to successfully bring their technology or products to market. Furthermore, the economic impact of the COVID-19 pandemic maylimit the ability for these entities to raise capital in the future. Furthermore, we have no assurance that the technology or products of companies we havefunded would be successful, even if they were brought to market. We may in the future recognize losses related to these interests. Any such losses could bematerial and could have a material adverse effect on our financial results and business.
We recently reversed the valuation allowance for a significant portion of our deferred tax assets, and we may not be able to realize these assets in thefuture. Our deferred tax assets may also be subject to additional valuation allowances, which could adversely affect our operating results.
Determining whether a valuation allowance for deferred tax assets is appropriate requires judgment and an evaluation of all positive and negativeevidence. At each reporting period, we assess the need for, or the sufficiency of, a valuation allowance against deferred tax assets. At June 30, 2021, basedon the weight of all the positive and negative evidence, we concluded that it was more likely than not that we will realize certain federal and state netdeferred tax assets based on future taxable income. Therefore, we reversed the valuation allowance on those deferred tax assets at June 30, 2021.
40
Table of Contents
Our conclusion at June 30, 2021 that it is more likely than not that we will realize certain federal and state net deferred tax assets is primarilybased on our estimate of future taxable income. Our estimate of future taxable income is based on internal projections which primarily consider historicalperformance, but also include various internal estimates and assumptions as well as certain external data. We believe all of these inputs to be reasonable,although inherently subject to judgment. If actual results differ significantly from these estimates of future taxable income, we may need to reestablish avaluation allowance for some or all of our deferred tax assets. Establishing an allowance on our net deferred tax assets could have a material adverse effecton our financial condition and operating results.
ITEM 2. UNREGISTERED SALES OF EQUITY SECURITIES AND USE OF PROCEEDS Unregistered issuance of equity securities
None.
Issuer purchases of equity securities
None. Limitations upon the payment of dividends
None.
ITEM 3. DEFAULTS UPON SENIOR SECURITIES
None. ITEM 4. MINE SAFETY DISCLOSURES
Not applicable.
ITEM 5. OTHER INFORMATION
None.
41
Table of Contents
ITEM 6. EXHIBITS
(a) Exhibit Number Exhibit Description
10.1 Medici Ventures, L.P. Limited Partnership Agreement, dated as of April 23, 2021, between Overstock.com, Inc., andPelion MV GP, L.L.C., incorporated by reference to Exhibit 10.1 to the Company’s Current Report on Form 8-K filedon April 26, 2021.
10.2 Overstock.com, Inc. 2021 Employee Stock Purchase Plan (incorporated by reference to Annex A to the Registrant'sForm DEF 14A (File No. 000-49799) filed on March 25, 2021).
31.1* Exhibit 31.1 Certification of Chief Executive Officer31.2* Exhibit 31.2 Certification of Chief Financial Officer32.1** Exhibit 32.1 Section 1350 Certification of Chief Executive Officer32.2** Exhibit 32.2 Section 1350 Certification of Chief Financial Officer
101 The following financial statements from the Company's Quarterly Report on Form 10-Q for the quarter ended June 30,2021 formatted in Inline XBRL: (i) Consolidated Balance Sheets, (ii) Consolidated Statements of Income, (iii)Consolidated Statements of Comprehensive Income, (iv) Consolidated Statements of Cash Flows, (v) ConsolidatedStatements of Stockholders' Equity, and (vi) Notes to Consolidated Financial Statements tagged as blocks of text andincluding detailed tags
104 The cover page from the Company's Quarterly Report on Form 10-Q for the quarter ended June 30, 2021, formatted inInline XBRL (included as Exhibit 101)
Pursuant to the requirements of the Securities Exchange Act of 1934, the registrant has duly caused this report to be signed on its behalf by theundersigned thereunto duly authorized.
Date: August 5, 2021 OVERSTOCK.COM, INC.
/s/ ADRIANNE B. LEE
Adrianne B. Lee
Chief Financial Officer(Principal Financial Officer and Principal Accounting Officer)
43
Exhibit 31.1
CERTIFICATION OF CHIEF EXECUTIVE OFFICER
I, Jonathan E. Johnson III, certify that:
1. I have reviewed this Quarterly Report on Form 10-Q of Overstock.com, Inc.; 2. Based on my knowledge, this report does not contain any untrue statement of a material fact or omit to state a material fact necessary to
make the statements made, in light of the circumstances under which such statements were made, not misleading with respect to the periodcovered by this report;
3. Based on my knowledge, the financial statements, and other financial information included in this report, fairly present in all material
respects the financial condition, results of operations and cash flows of the registrant as of, and for, the periods presented in this report; 4. The registrant’s other certifying officer(s) and I are responsible for establishing and maintaining disclosure controls and procedures (as
defined in Exchange Act Rules 13a-15(e) and 15d-15(e)) and internal control over financial reporting (as defined in Exchange Act Rules 13a-15(f) and 15d-15(f)) for the registrant and have: a. designed such disclosure controls and procedures, or caused such disclosure controls and procedures to be designed under our
supervision, to ensure that material information relating to the registrant, including its consolidated subsidiaries, is made known to us byothers within those entities, particularly during the period in which this report is being prepared;
b. designed such internal control over financial reporting, or caused such internal control over financial reporting to be designed under our
supervision, to provide reasonable assurance regarding the reliability of financial reporting and the preparation of financial statements forexternal purposes in accordance with generally accepted accounting principles;
c. evaluated the effectiveness of the registrant’s disclosure controls and procedures and presented in this report our conclusions about the
effectiveness of the disclosure controls and procedures, as of the end of the period covered by this report based on such evaluation; and d. disclosed in this report any change in the registrant’s internal control over financial reporting that occurred during the registrant’s most
recent fiscal quarter (the registrant’s fourth fiscal quarter in the case of an annual report) that has materially affected, or is reasonably likely tomaterially affect, the registrant’s internal control over financial reporting; and
5. The registrant’s other certifying officer(s) and I have disclosed, based on our most recent evaluation of internal control over financial
reporting, to the registrant’s auditors and the audit committee of the registrant’s board of directors (or persons performing the equivalentfunctions):
a. all significant deficiencies and material weaknesses in the design or operation of internal control over financial reporting which are
reasonably likely to adversely affect the registrant’s ability to record, process, summarize and report financial information; and b. any fraud, whether or not material, that involves management or other employees who have a significant role in the registrant’s internal
control over financial reporting.
Date: August 5, 2021 /s/ JONATHAN E. JOHNSON III Jonathan E. Johnson III Chief Executive Officer (Principal Executive Officer)
Exhibit 31.2
CERTIFICATION OF CHIEF FINANCIAL OFFICER
I, Adrianne B. Lee, certify that:
1. I have reviewed this Quarterly Report on Form 10-Q of Overstock.com, Inc.; 2. Based on my knowledge, this report does not contain any untrue statement of a material fact or omit to state a material fact necessary to
make the statements made, in light of the circumstances under which such statements were made, not misleading with respect to the periodcovered by this report;
3. Based on my knowledge, the financial statements, and other financial information included in this report, fairly present in all material
respects the financial condition, results of operations and cash flows of the registrant as of, and for, the periods presented in this report; 4. The registrant’s other certifying officer(s) and I are responsible for establishing and maintaining disclosure controls and procedures (as
defined in Exchange Act Rules 13a-15(e) and 15d-15(e)) and internal control over financial reporting (as defined in Exchange Act Rules 13a-15(f) and 15d-15(f)) for the registrant and have: a. designed such disclosure controls and procedures, or caused such disclosure controls and procedures to be designed under our
supervision, to ensure that material information relating to the registrant, including its consolidated subsidiaries, is made known to us byothers within those entities, particularly during the period in which this report is being prepared;
b. designed such internal control over financial reporting, or caused such internal control over financial reporting to be designed under our
supervision, to provide reasonable assurance regarding the reliability of financial reporting and the preparation of financial statements forexternal purposes in accordance with generally accepted accounting principles;
c. evaluated the effectiveness of the registrant’s disclosure controls and procedures and presented in this report our conclusions about the
effectiveness of the disclosure controls and procedures, as of the end of the period covered by this report based on such evaluation; and d. disclosed in this report any change in the registrant’s internal control over financial reporting that occurred during the registrant’s most
recent fiscal quarter (the registrant’s fourth fiscal quarter in the case of an annual report) that has materially affected, or is reasonably likely tomaterially affect, the registrant’s internal control over financial reporting; and
5. The registrant’s other certifying officer(s) and I have disclosed, based on our most recent evaluation of internal control over financial
reporting, to the registrant’s auditors and the audit committee of the registrant’s board of directors (or persons performing the equivalentfunctions):
a. all significant deficiencies and material weaknesses in the design or operation of internal control over financial reporting which are
reasonably likely to adversely affect the registrant’s ability to record, process, summarize and report financial information; and b. any fraud, whether or not material, that involves management or other employees who have a significant role in the registrant’s internal
control over financial reporting.
Date: August 5, 2021 /s/ ADRIANNE B. LEE Adrianne B. Lee Chief Financial Officer (Principal Financial Officer and Principal Accounting Officer)
Exhibit 32.1
CERTIFICATION OF PRINCIPAL EXECUTIVE OFFICER
PURSUANT TO
18 U.S.C. SECTION 1350,
AS ADOPTED PURSUANT TO
SECTION 906 OF THE SARBANES-OXLEY ACT OF 2002
I, Jonathan E. Johnson III, certify, pursuant to 18 U.S.C. Section 1350, as adopted pursuant to Section 906 of the Sarbanes-Oxley Act of 2002, that theQuarterly Report of Overstock.com, Inc. on Form 10-Q for the quarter ended June 30, 2021 fully complies with the requirements of Section 13(a) or15(d) of the Securities Exchange Act of 1934, as applicable, and that information contained in such Report fairly presents in all material respects thefinancial condition and results of operations of Overstock.com, Inc.
Date: August 5, 2021 /s/ JONATHAN E. JOHNSON III
Jonathan E. Johnson III
Chief Executive Officer
(Principal Executive Officer)
Exhibit 32.2
CERTIFICATION OF PRINCIPAL FINANCIAL OFFICER
PURSUANT TO
18 U.S.C. SECTION 1350,
AS ADOPTED PURSUANT TO
SECTION 906 OF THE SARBANES-OXLEY ACT OF 2002
I, Adrianne B. Lee, certify, pursuant to 18 U.S.C. Section 1350, as adopted pursuant to Section 906 of the Sarbanes-Oxley Act of 2002, that the QuarterlyReport of Overstock.com, Inc. on Form 10-Q for the quarter ended June 30, 2021 fully complies with the requirements of Section 13(a) or 15(d) of theSecurities Exchange Act of 1934, as applicable, and that information contained in such Report fairly presents in all material respects the financial conditionand results of operations of Overstock.com, Inc.
Date: August 5, 2021 /s/ ADRIANNE B. LEE
Adrianne B. Lee
Chief Financial Officer
(Principal Financial Officer and Principal Accounting Officer)