36
Alexandria, 18th of March 2019 Alessandro Panaro Head of Maritime Dept. SRM Intesa Sanpaolo Banking Group The new maritime phenomena
Alexandria, 18th of March 2019
Alessandro Panaro Head of Maritime Dept. SRM
Intesa Sanpaolo Banking Group
The new maritime phenomena

www.srm-maritimeconomy.com

The main phenomena that will shape the future of the maritime sector
The Mediterranean Economic Scenario and competitiveness indicators
The growing role of Mediterranean

The most important data on the shipping sector in the Med
Source: SRM on Eurostat, Suez Canal Authority, ISTAT, Port Authorities
25% WORLD’S
CONTAINER LINER SERVICES
20% GLOBAL SHIPPING TRAFFIC
19 PORTS THROUGHPUT >1 MLN TEUs
83% SHARE OF SEA TRADE ITALY-MED
+500% OF CONTAINER
TRAFFIC SINCE 1995
611 mln tonnes SHORT SEA SHIPPING
983 mln tonnes SUEZ CARGO
TRAFFIC

4% annual growth 10,7 bn tons Global volumes gathered momentum
and reached Fastest growth in five years
Containerized trade accounted for
17.1% of total seaborne trade
+6.4%
Major dry bulk commodities accounted for
29.9% of total seaborne trade
+5.1%
Crude oil shipments rose by
2.4% down from
4% in 2016
Combined volumes of refined petroleum products and gas went up by
3.9%
World Seaborne Trade in 2017
Source: SRM on UNCTAD, 2018
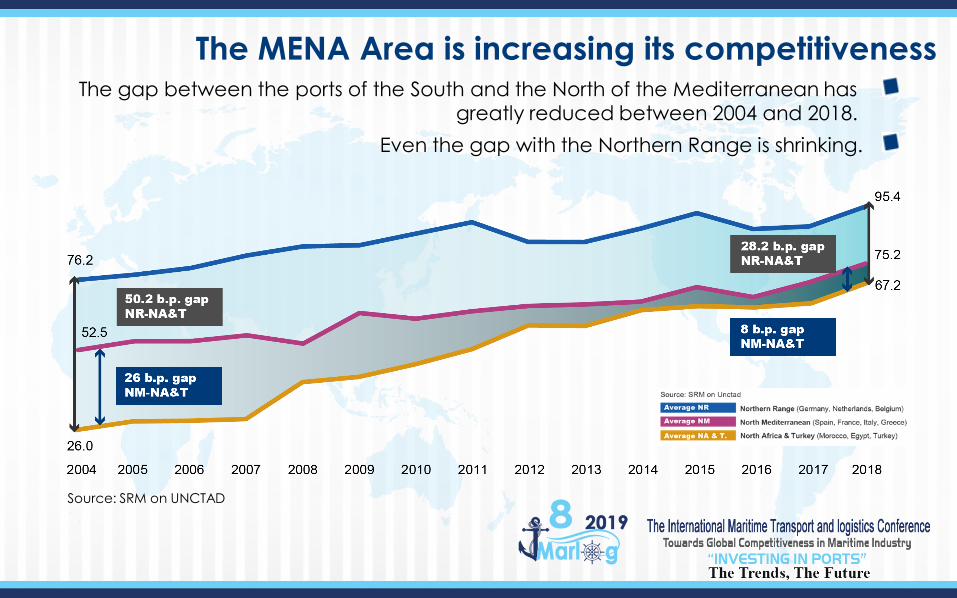
The MENA Area is increasing its competitiveness The gap between the ports of the South and the North of the Mediterranean has
greatly reduced between 2004 and 2018. Even the gap with the Northern Range is shrinking.
Source: SRM on UNCTAD

Liner Shipping Connectivity Index (LSCI): analysis of the MENA Area
Source: SRM on UNCTAD
Egypt gained 30 b.p. in the span analysed (2004-2018)
2004 2010 2015 2018
1° Egypt 42.9 UAE 63.4 UAE 70.4 UAE 83.91 2° UAE 38.1 Saudi Arabia 50.4 Morocco 68.3 Morocco 71.5
3° Saudi Arabia 35.8 Morocco 49.4 Saudi
Arabia 64.8 Egypt 70.28
4° Turkey 25.6 Oman 48.5 Egypt 61.5 Saudi Arabia 66.62
5° Oman 23.3 Egypt 47.6 Turkey 52 Oman 62.97

Logistic Performance Index
4,2 4,05 4,04 4,03 4,03 4,02 4,00 3,99 3,99 3,97
3,74
2016 2018
26th 19th
Italy Ranks 19th
China hold the 26th place in the world
Source: SRM on World Bank
3,61

In this scenario logistic efficiency and connectivity are the new challenges in international maritime competitiveness
The top 5 countries of the world in terms of
shipping competitiveness are in ASIA
Source: SRM on Unctad and World Bank

The top 4 countries of the world in terms of Logistic connectivity
are in EUROPE
Source: SRM on Unctad and World Bank
In this scenario logistic efficiency and connectivity are the new challenges in international maritime competitiveness
The top 5 countries of the world in terms of
shipping competitiveness are in ASIA

46%
8% 12%
8%
8%
6% 7%
2% 3% Northern Range
40%
South Med 9%
West Med 13%
Italy 6%
East Med 13%
Black Sea 6%
UK 7%
Atlantic 3%
Baltic Sea 3%
2008
2017
The analysis of container ports by geographic area: the new role of Med
Northern Range market share (40%) is decreased between 2008 and 2017.
The MED Area can be a great opportunity; between 2008 and 2017 the ports of MED Area increased their market share from 36% to 41%.
Market Share - TEU
MED AREA IS
GROWING
NORTHERN RANGE IS
SLOWING DOWN
Source: SRM on Port Authorities

Suez Canal: the new records
container ships 4,724
oil tankers
+2.5%
+4.1% 18,174 Ships
983,4 million tonnes of goods
+3.6%
+8.2%
+4.2%
491 mln tonn 235.5
mln tonn
+7%
5,706
Source: SRM on Suez Canal Authority, 2019
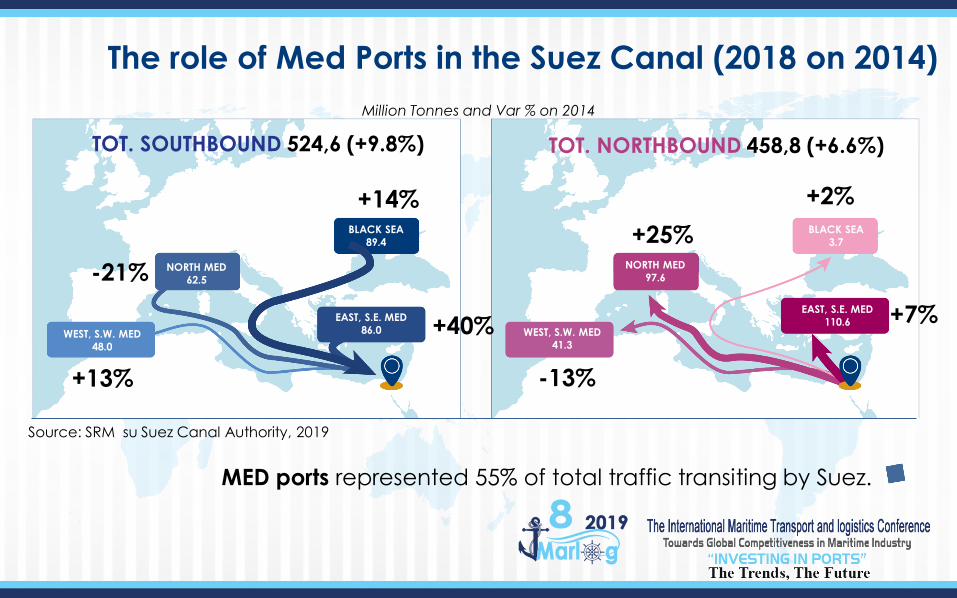
WEST, S.W. MED 48.0
EAST, S.E. MED 86.0
NORTH MED 62.5
BLACK SEA 89.4
WEST, S.W. MED 41.3
EAST, S.E. MED 110.6
BLACK SEA 3.7
NORTH MED 97.6
TOT. SOUTHBOUND 524,6 (+9.8%) TOT. NORTHBOUND 458,8 (+6.6%)
The role of Med Ports in the Suez Canal (2018 on 2014)
MED ports represented 55% of total traffic transiting by Suez.
Source: SRM su Suez Canal Authority, 2019
+40%
-21%
+14%
+13%
+7%
+25%
-13%
+2%
Million Tonnes and Var % on 2014

Suez (and the Sumed pipeline) is the 3rd busiest transit chokepoint in the world with a total oil flow (crude oil and refined products) of 5.5 million b/d transited in both
directions
It holds 9% of global seaborne oil trade and
9% of LNG
Mains oil global chokepoints
Source: SRM on U.S. Energy Information Administration (EIA)
Petroleum transit volumes through select maritime routes|2016 - Million barrels per day

…the naval gigantism…
Source: ITF (2015)
The ship size increased 7 times in a period of 40 years
133 new ships of the 10-23,000 TEUS category will be launched by 2022
(45 of which in the 18-23,000 TEUS)
Growth of Containership size, period 1970-2017
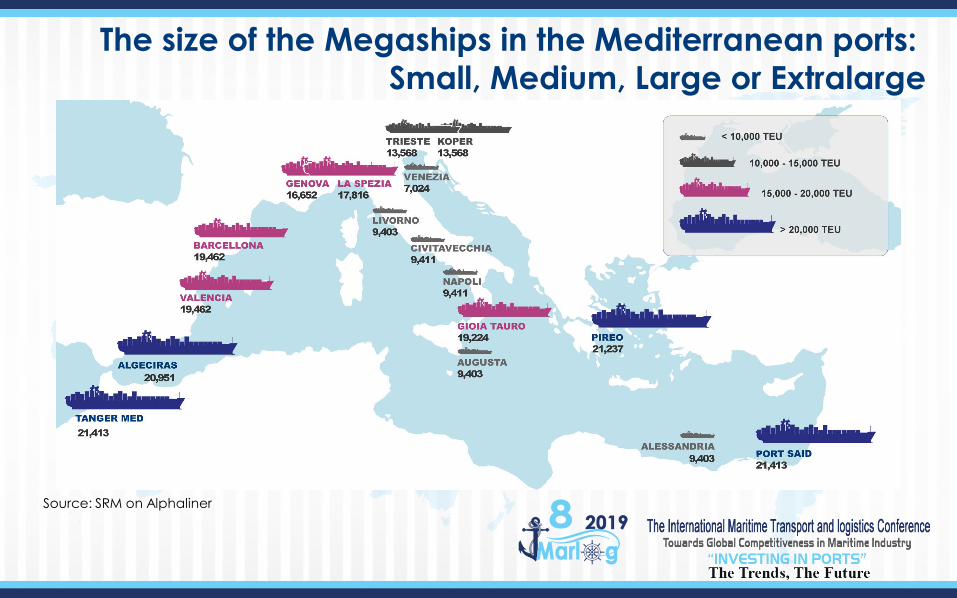
The size of the Megaships in the Mediterranean ports: Small, Medium, Large or Extralarge
Source: SRM on Alphaliner

MSC 30%
MAERSK 16% CMA CGM
11%
COSCO 7% EVERGREEN
1%
YM 2%
NYC 2%
AL 2%
ZIM 1%
MOL 1%
OTHERS 27%
Carriers' fleet market share in the Med Ports Total TEUs - 2018
In 2018, the market share of the container fleet
managed by 2M was 46%. The market share held by
Ocean Alliance was almost 20%
Source: SRM on Alphaliner

2012 2017
2017 2012
The Mediterranean routes of the Ocean Alliance

2012 2017
2017 2012
+27 OCEAN
ALLIANCE Traffic
+10 COSCO
Presence
2017
The Mediterranean routes of the Ocean Alliance

The Short Sea Shipping map
42
72
74 60 123
84
60 50 56
51
46
41 52
43
Source: SRM on Eurostat
542 46
70 450
261
611
131
From - To Cargo Transited (Million tons)
Main Short Sea Shipping
Corridor
Cargo Carried (Million tons)

* CEU (car equivalent unit) * Source: SRM on WWL, BRS Group, ANFIA, Fearnleys
The connection between the growth of Ro-Ro and the increase of the automotive

Ro-Ro traffic in the Mediterranean Sea-density map
2012-2017 comparison
Source: SRM

Arab Middle East and
North Africa 6%
East Asia 51%
Europe 10%
North America
1%
Sub-Saharan Africa
3%
West Asia 29%
$146 bn
INVESTMENT VALUE BY GEOGRAPHIC AREA
The role of BRI in the Mediterranean
Source: SRM on China Global Investment Tracker database Investment until June 2018
No financial investment

40.6
87.2 99.6
19.1
269.4
319.0
71.4
167.8 185.8
36.2
103.1 108.8
0
50
100
150
200
250
300
350
2001
2002
2003
2004
2005
2006
2007
2008
2009
2010
2011
2012
2013
2014
2015
2016
2017
2018
*
2019
*
2020
*
Italy China USA Germany
$ bn
Italy
Germany USA
China
A steady increase in trade relation towards the MENA area China is the largest partner
Source: SRM on UNCTAD
Italy’s trade with MENA Area: $87 bn (+70.4% on 2001). According to SRM forecast, this
trade will reach
$99.6 bn in 2020
China is the largest trade partner of MENA countries
$269.4 bn import-export

VALENCIA PIRAEUS
Source: SRM
The Chinese chessboard

VALENCIA PIRAEUS
ROTTERDAM
ABU DHABI
AMBARLI
SUEZ CANAL ASHDOD
HAIFA
MARSEILLE
MALTA
ANTWERP
ZEEBRUGGE
HAMBURG
BILBAO
Source: SRM
The Chinese chessboard

Total traffic of Cosco Container terminal is increasing in the Med
Source: SRM on COSCO
In 2018 total traffic of Cosco container terminal in the Med ports was almost 12 million TEUs.
Chinese terminals dominate 22% of the traffic in the Med ports.
Cosco Cargo in Med terminal 2018
Terminal Throughput (TEU ‘000)
Piraeus 4,409.2
Noatum 3,622.2
Suez Canal 1,258.3
Kumport 1,258.3
Vado Reefer 66.6
22% of Med ports
Total throughput Med Ports 11,966,100

The growth of the free zones in the world
1975 1986 1997 2002 2006 2014
79 176
845
3,000 3,500 4,500
N F
ree
Zone
s In
n. C
ount
ries
in 25 in 47
in 93
in 116 in 130
in 135
There are about 4,500 Free zones all over the world. These zones have created 68 million direct jobs and over $ 500 billion of direct
trade-related value added.
Source: SRM on Trade Performance Of Free Trade Zones, 2014 and others
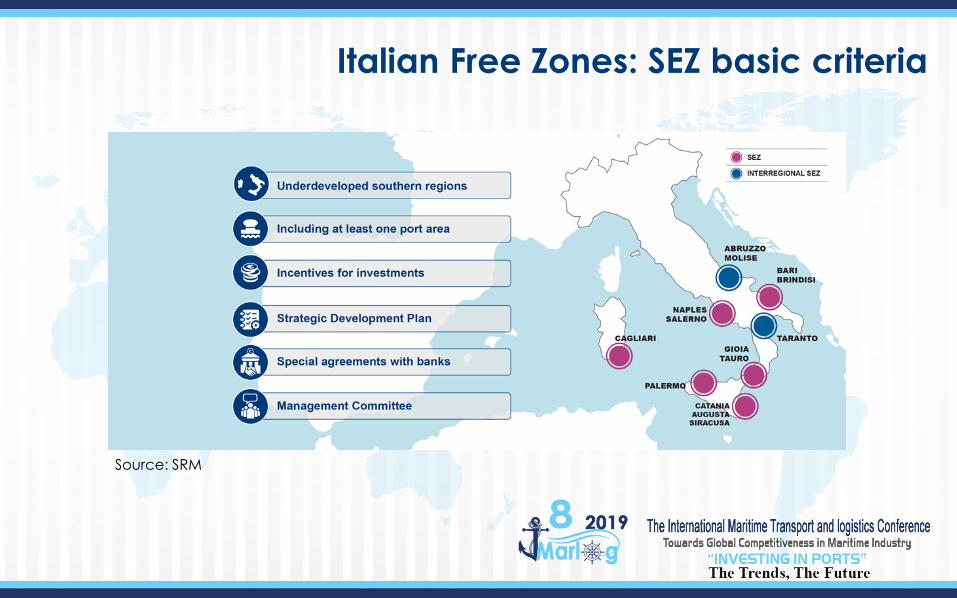
Italian Free Zones: SEZ basic criteria
Source: SRM

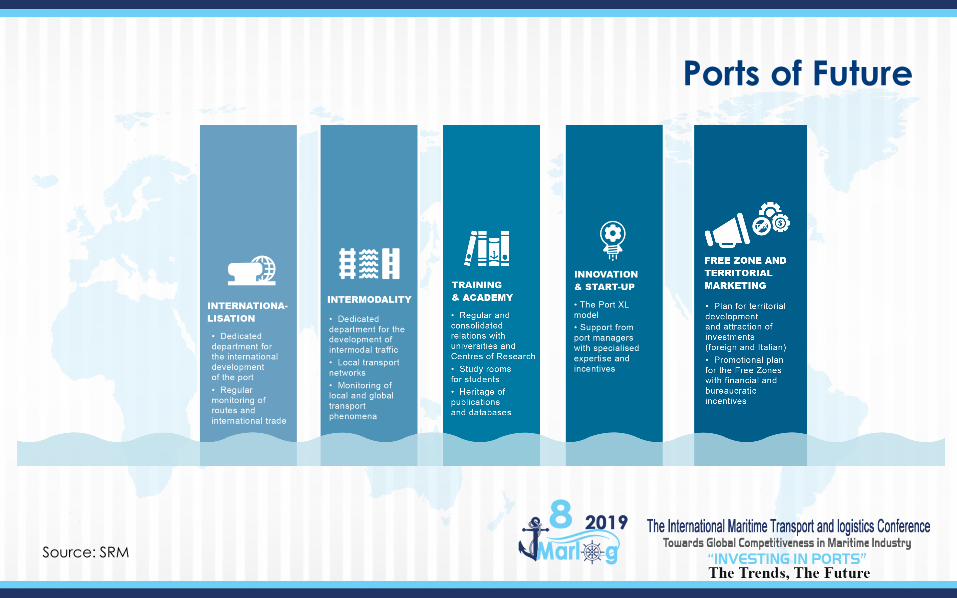
Ports of Future
Source: SRM

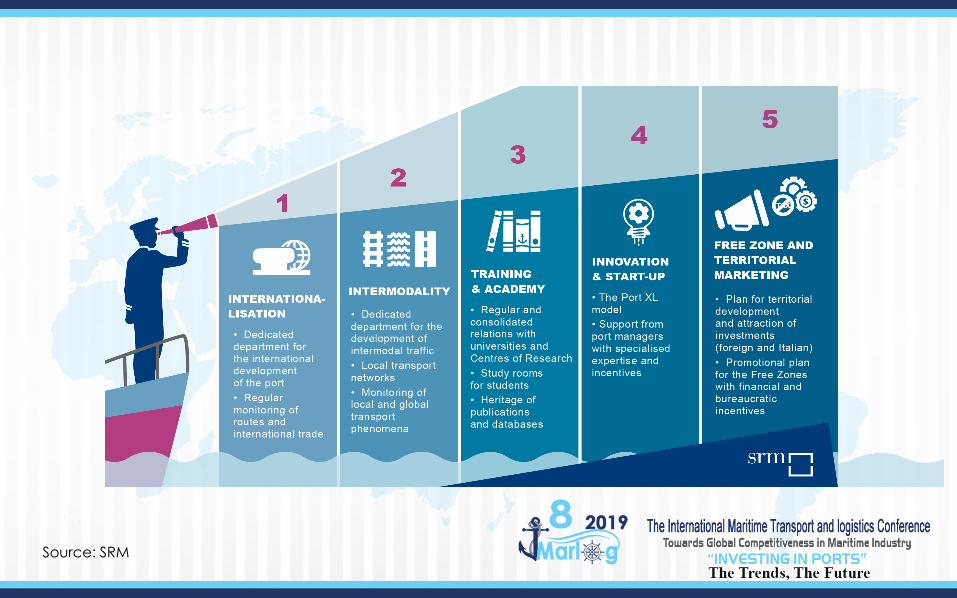
Ports of Future
Source: SRM

Ports of Future
Source: SRM

Ports of Future
Source: SRM
Ports of Future
Source: SRM
Source: SRM

Alessandro Panaro Head of Maritime & Energy Dept. SRM
www.srm-maritimeconomy.com
srmezzogiorno
SRM
SRM Studi Ricerche Mezzogiorno
Thank you for your attention SRM


