UNITED STATES SECURITIES AND EXCHANGE COMMISSION Washington, D.C. 20549 FORM 10-Q (Mark One) ☒ QUARTERLY REPORT PURSUANT TO SECTION 13 OR 15(d) OF THE SECURITIES EXCHANGE ACT OF 1934 For the quarterly period ended June 30, 2020 ☐ TRANSITION REPORT PURSUANT TO SECTION 13 OR 15(d) OF THE SECURITIES EXCHANGE ACT OF 1934 For the transition period from to Commission File Number 001-33378 DISCOVER FINANCIAL SERVICES (Exact name of registrant as specified in its charter) Delaware (State or other jurisdiction of incorporation or organization) 36-2517428 (I.R.S. Employer Identification No.) 2500 Lake Cook Road, Riverwoods, Illinois 60015 (Address of principal executive offices, including zip code) (224) 405-0900 (Registrant's telephone number, including area code) Securities registered pursuant to Section 12(b) of the Act Title of each class Trading symbol(s) Name of each exchange on which registered Common Stock, par value $0.01 per share DFS New York Stock Exchange Indicate by check mark whether the registrant (1) has filed all reports required to be filed by Section 13 or 15(d) of the Securities Exchange Act of 1934 during the preceding 12 months (or for such shorter period that the registrant was required to file such reports), and (2) has been subject to such filing requirements for the past 90 days. Yes ☒ No ☐ Indicate by check mark whether the registrant has submitted electronically every Interactive Data File required to be submitted pursuant to Rule 405 of Regulation S-T (§232.405 of this chapter) during the preceding 12 months (or for such shorter period that the registrant was required to submit such files). Yes ☒ No ☐ Indicate by check mark whether the registrant is a large accelerated filer, an accelerated filer, a non-accelerated filer, a smaller reporting company, or an emerging growth company. See the definitions of "large accelerated filer," "accelerated filer," "smaller reporting company," and "emerging growth company" in Rule 12b-2 of the Exchange Act. Large Accelerated Filer ☒ Accelerated Filer ☐ Non-accelerated Filer ☐ Smaller Reporting Company ☐ Emerging Growth Company ☐ If an emerging growth company, indicate by check mark if the registrant has elected not to use the extended transition period for complying with any new or revised financial accounting standards provided pursuant to Section 13(a) of the Exchange Act. ☐ Indicate by check mark whether the registrant is a shell company (as defined in Rule 12b-2 of the Exchange Act). Yes ☐ No ☒ As of July 22, 2020, there were 306,421,150 shares of the registrant's Common Stock, par value $0.01 per share, outstanding.
Transcript
UNITED STATES
SECURITIES AND EXCHANGE COMMISSIONWashington, D.C. 20549
FORM 10-Q(Mark One)☒ QUARTERLY REPORT PURSUANT TO SECTION 13 OR 15(d) OF THE SECURITIES EXCHANGE ACT OF 1934
For the quarterly period ended June 30, 2020
☐ TRANSITION REPORT PURSUANT TO SECTION 13 OR 15(d) OF THE SECURITIES EXCHANGE ACT OF 1934For the transition period from to
Commission File Number 001-33378
DISCOVER FINANCIAL SERVICES(Exact name of registrant as specified in its charter)
Delaware(State or other jurisdiction of incorporation or organization)
36-2517428(I.R.S. Employer Identification No.)
2500 Lake Cook Road, Riverwoods, Illinois 60015(Address of principal executive offices, including zip code)
(224) 405-0900(Registrant's telephone number, including area code)
Securities registered pursuant to Section 12(b) of the ActTitle of each class Trading symbol(s) Name of each exchange on which registered
Common Stock, par value $0.01 per share DFS New York Stock Exchange
Indicate by check mark whether the registrant (1) has filed all reports required to be filed by Section 13 or 15(d) of the Securities Exchange Act of 1934during the preceding 12 months (or for such shorter period that the registrant was required to file such reports), and (2) has been subject to such filing requirementsfor the past 90 days. Yes ☒ No ☐
Indicate by check mark whether the registrant has submitted electronically every Interactive Data File required to be submitted pursuant to Rule 405 ofRegulation S-T (§232.405 of this chapter) during the preceding 12 months (or for such shorter period that the registrant was required to submit suchfiles). Yes ☒ No ☐
Indicate by check mark whether the registrant is a large accelerated filer, an accelerated filer, a non-accelerated filer, a smaller reporting company, or anemerging growth company. See the definitions of "large accelerated filer," "accelerated filer," "smaller reporting company," and "emerging growth company" inRule 12b-2 of the Exchange Act.
Large Accelerated Filer ☒ Accelerated Filer ☐
Non-accelerated Filer ☐ Smaller Reporting Company ☐
Emerging Growth Company ☐
If an emerging growth company, indicate by check mark if the registrant has elected not to use the extended transition period for complying with any new orrevised financial accounting standards provided pursuant to Section 13(a) of the Exchange Act. ☐
Indicate by check mark whether the registrant is a shell company (as defined in Rule 12b-2 of the Exchange Act). Yes ☐ No ☒As of July 22, 2020, there were 306,421,150 shares of the registrant's Common Stock, par value $0.01 per share, outstanding.
DISCOVER FINANCIAL SERVICESQuarterly Report on Form 10-Q for the quarterly period ended June 30, 2020
TABLE OF CONTENTS
Part I FINANCIAL INFORMATION Item 1. Financial Statements 1Item 2. Management's Discussion and Analysis of Financial Condition and Results of Operations 47Item 3. Quantitative and Qualitative Disclosures about Market Risk 75Item 4. Controls and Procedures 76
Part II OTHER INFORMATION Item 1. Legal Proceedings 78Item 1A. Risk Factors 78Item 2. Unregistered Sales of Equity Securities and Use of Proceeds 79Item 3. Defaults Upon Senior Securities 79Item 4. Mine Safety Disclosures 79Item 5. Other Information 80Item 6. Exhibits 80
Except as otherwise indicated or unless the context otherwise requires, "Discover Financial Services," "Discover," "DFS," "we," "us," "our," and "theCompany" refer to Discover Financial Services and its subsidiaries. See Glossary of Acronyms, located after Part I — Item 4, for terms and abbreviations usedthroughout the quarterly report.
We own or have rights to use the trademarks, trade names and service marks that we use in conjunction with the operation of our business, including, but notlimited to: Discover®, PULSE®, Cashback Bonus®, Discover Cashback Checking®, Discover it®, Freeze it®, College Covered®, and Diners Club International®.All other trademarks, trade names and service marks included in this quarterly report on Form 10-Q are the property of their respective owners.
Table of Contents
Part I. FINANCIAL INFORMATIONItem 1. Financial Statements
DISCOVER FINANCIAL SERVICESCondensed Consolidated Statements of Financial Condition
June 30,
2020 December 31,
2019
(unaudited) (dollars in millions,
except share amounts)Assets Cash and cash equivalents $ 15,138 $ 6,924Restricted cash 29 40Other short-term investments 2,549 —Investment securities (includes available-for-sale securities of $10,201 and $10,323 reported at fair value with associated amortized cost of $9,734and $10,173 at June 30, 2020 and December 31, 2019, respectively) 10,485 10,595Loan receivables Loan receivables 88,927 95,894Allowance for credit losses(1) (8,184) (3,383)
Net loan receivables 80,743 92,511Premises and equipment, net 1,115 1,057Goodwill 255 255Intangible assets, net 96 155Other assets 3,382 2,459Total assets $ 113,792 $ 113,996Liabilities and Stockholders' Equity Liabilities Deposits Interest-bearing deposit accounts $ 76,365 $ 71,955Non-interest bearing deposit accounts 999 791
Total deposits 77,364 72,746Long-term borrowings 23,194 25,701Accrued expenses and other liabilities 3,591 3,690Total liabilities 104,149 102,137Commitments, contingencies and guarantees (Notes 10, 13 and 14) Stockholders' Equity Common stock, par value $0.01 per share; 2,000,000,000 shares authorized; 567,653,357 and 566,653,650 shares issued at June 30, 2020 andDecember 31, 2019, respectively 6 6Preferred stock, par value $0.01 per share; 200,000,000 shares authorized; 10,700 and 5,700 shares issued and outstanding at June 30, 2020 andDecember 31, 2019, respectively 1,056 563Additional paid-in capital 4,216 4,206Retained earnings 18,673 21,290Accumulated other comprehensive income (loss) 122 (119)Treasury stock, at cost; 261,233,267 and 256,496,492 shares at June 30, 2020 and December 31, 2019, respectively (14,430) (14,087)Total stockholders' equity 9,643 11,859Total liabilities and stockholders' equity $ 113,792 $ 113,996
(1) Prior to adoption of Accounting Standards Update ("ASU") No. 2016-13 on January 1, 2020, credit losses were estimated using the incurred loss approach.
The table below presents the carrying amounts of certain assets and liabilities of Discover Financial Services' consolidated variable interest entities ("VIEs"), which are included in the condensed consolidated statements of financialcondition above. The assets in the table below include those assets that can only be used to settle obligations of the consolidated VIEs. The liabilities in the table below include third-party liabilities of consolidated VIEs only and excludeintercompany balances that eliminate in consolidation. The liabilities also exclude amounts for which creditors have recourse to the general credit of Discover Financial Services.
Liabilities Long-term borrowings $ 12,766 $ 14,284Accrued expenses and other liabilities $ 10 $ 15 (1) Prior to adoption of ASU No. 2016-13 on January 1, 2020, credit losses were estimated using the incurred loss approach.
See Notes to the Condensed Consolidated Financial Statements.1
Table of Contents
DISCOVER FINANCIAL SERVICESCondensed Consolidated Statements of Income
For the Three Months Ended June 30, For the Six Months Ended June 30,
2020 2019 2020 2019
(unaudited)
(dollars in millions, except per share amounts)Interest income Credit card loans $ 2,173 $ 2,396 $ 4,589 $ 4,758Other loans 439 460 923 917Investment securities 55 39 113 67Other interest income 5 82 29 172Total interest income 2,672 2,977 5,654 5,914Interest expense Deposits 340 401 713 787Long-term borrowings 142 244 353 490Total interest expense 482 645 1,066 1,277Net interest income 2,190 2,332 4,588 4,637Provision for credit losses(1) 2,046 787 3,853 1,596Net interest income after provision for credit losses 144 1,545 735 3,041Other income Discount and interchange revenue, net 237 299 453 530Protection products revenue 44 49 91 98Loan fee income 85 102 204 206Transaction processing revenue 49 48 93 94Gains on equity investments 43 — 79 —Other income 14 22 42 50Total other income 472 520 962 978Other expense Employee compensation and benefits 452 427 919 852Marketing and business development 129 224 360 419Information processing and communications 117 101 231 200Professional fees 181 183 374 350Premises and equipment 27 26 57 54Other expense 171 117 295 227Total other expense 1,077 1,078 2,236 2,102(Loss) income before income taxes (461) 987 (539) 1,917Income tax (benefit) expense (93) 234 (110) 438Net (loss) income $ (368) $ 753 $ (429) $ 1,479Net (loss) income allocated to common stockholders $ (369) $ 747 $ (446) $ 1,452Basic (loss) earnings per common share $ (1.20) $ 2.32 $ (1.45) $ 4.46Diluted (loss) earnings per common share $ (1.20) $ 2.32 $ (1.45) $ 4.46 (1) Prior to adoption of ASU No. 2016-13 on January 1, 2020, credit losses were estimated using the incurred loss approach.
See Notes to the Condensed Consolidated Financial Statements.2
Table of Contents
DISCOVER FINANCIAL SERVICESCondensed Consolidated Statements of Comprehensive Income
For the Three Months Ended June 30, For the Six Months Ended June 30,
2020 2019 2020 2019
(unaudited)
(dollars in millions)
Net (loss) income $ (368) $ 753 $ (429) $ 1,479
Other comprehensive (loss) income, net of tax
Unrealized (losses) gains on available-for-sale investment securities, net of tax (16) 71 240 102
Unrealized gains (losses) on cash flow hedges, net of tax 4 (18) 1 (30)
Unrealized pension and post-retirement plan gains, net of tax — — — 1
See Notes to the Condensed Consolidated Financial Statements.4
Table of Contents
DISCOVER FINANCIAL SERVICESCondensed Consolidated Statements of Cash Flows
For the Six Months Ended June 30,
2020 2019
(unaudited)
(dollars in millions)Cash flows from operating activities Net (loss) income $ (429) $ 1,479Adjustments to reconcile net income to net cash provided by operating activities Provision for credit losses(1) 3,853 1,596Deferred income taxes (531) (50)Depreciation and amortization 246 202Amortization of deferred revenues and accretion of accretable yield on acquired loans (165) (201)Net (gain) loss on investments and other assets (51) 21Other, net 68 39Changes in assets and liabilities Decrease (increase) in other assets 388 (23)(Decrease) increase in accrued expenses and other liabilities (112) 850
Net cash provided by operating activities 3,267 3,913 Cash flows from investing activities Purchases of other short-term investments (2,548) (1,000)Maturities of available-for-sale investment securities 438 70Purchases of available-for-sale investment securities — (4,115)Maturities of held-to-maturity investment securities 18 12Purchases of held-to-maturity investment securities (30) (34)Net principal repaid (disbursed) on loans originated for investment 5,614 (950)Proceeds from sale of other investments 94 —Purchases of other investments (40) (21)Purchases of premises and equipment (153) (151)Net cash provided by (used for) investing activities 3,393 (6,189) Cash flows from financing activities Proceeds from issuance of securitized debt — 1,234Maturities and repayment of securitized debt (1,666) (4,070)Proceeds from issuance of other long-term borrowings 495 595Maturities and repayment of other long-term borrowings (1,753) (7)Proceeds from issuance of common stock 5 4Purchases of treasury stock (343) (948)Net increase in deposits 4,601 1,955Proceeds from issuance of preferred stock 493 —Dividends paid on common and preferred stock (289) (279)Net cash provided by (used for) financing activities 1,543 (1,516)Net increase (decrease) in cash, cash equivalents and restricted cash 8,203 (3,792)Cash, cash equivalents and restricted cash, at beginning of period 6,964 15,145Cash, cash equivalents and restricted cash, at end of period $ 15,167 $ 11,353
Reconciliation of cash, cash equivalents and restricted cash Cash and cash equivalents $ 15,138 $ 10,313Restricted cash 29 1,040Cash, cash equivalents and restricted cash, at end of period $ 15,167 $ 11,353
(1) Prior to adoption of ASU No. 2016-13 on January 1, 2020, credit losses were estimated using the incurred loss approach.
See Notes to the Condensed Consolidated Financial Statements.
5
Table of Contents
Notes to the Condensed Consolidated Financial Statements(unaudited)
1. Background and Basis of Presentation
Description of BusinessDiscover Financial Services ("DFS" or the "Company") is a direct banking and payment services company. The Company is a bank holding company under
the Bank Holding Company Act of 1956 as well as a financial holding company under the Gramm-Leach-Bliley Act and therefore is subject to oversight,regulation and examination by the Board of Governors of the Federal Reserve System (the "Federal Reserve"). The Company provides direct banking products andservices and payment services through its subsidiaries. The Company offers its customers credit card loans, private student loans, personal loans, home equityloans and deposit products. The Company also operates the Discover Network, the PULSE network ("PULSE") and Diners Club International ("Diners Club"). TheDiscover Network processes transactions for Discover-branded credit and debit cards and provides payment transaction processing and settlement services. PULSEoperates an electronic funds transfer network, providing financial institutions issuing debit cards on the PULSE network with access to ATMs domestically andinternationally, as well as merchant acceptance throughout the U.S. for debit card transactions. Diners Club is a global payments network of licensees, which aregenerally financial institutions, that issue Diners Club branded charge cards and/or provide card acceptance services.
The Company's business activities are managed in two segments, Direct Banking and Payment Services, based on the products and services provided. For adetailed description of the operations of each segment, as well as the allocation conventions used in business segment reporting, see Note 17: Segment Disclosures.
Basis of PresentationThe accompanying condensed consolidated financial statements have been prepared in accordance with accounting principles generally accepted in the
United States ("GAAP") for interim financial information and with the instructions to Form 10-Q and Article 10 of Regulation S-X. Accordingly, they do notinclude all of the information and footnotes required by GAAP for complete consolidated financial statements. In the opinion of management, the financialstatements reflect all adjustments necessary for fair presentation of results for the interim period. All such adjustments are of a normal, recurring nature. Thepreparation of financial statements in conformity with GAAP requires the Company to make estimates and assumptions that affect the amounts reported in thecondensed consolidated financial statements and related disclosures. These estimates are based on information available as of the date of the condensedconsolidated financial statements. The Company believes that the estimates used in the preparation of the condensed consolidated financial statements arereasonable. Actual results could differ from these estimates. These interim condensed consolidated financial statements should be read in conjunction with theCompany's 2019 audited consolidated financial statements filed with the Company's annual report on Form 10-K for the year ended December 31, 2019.
Recently Issued Accounting Pronouncements (Not Yet Adopted)In March 2020, the Financial Accounting Standards Board ("FASB") issued ASU No. 2020-04, Reference Rate Reform (Topic 848): Facilitation of the
Effects of Reference Rate Reform on Financial Reporting. The ASU addresses operational challenges resulting from the discontinuation of the London InterbankOffered Rate (“LIBOR”) and other reference rates at the end of 2021. By providing optional practical expedients and exceptions to applying certain GAAPrequirements, ASU No. 2020-04 provides temporary relief designed to ease the operational cost and burden of accounting for contract modifications, hedgingrelationships and other transactions that reference LIBOR or another reference rate expected to be discontinued as a result of reference rate reform. In general, theoptional expedients and exceptions allow eligible contracts that are modified due to reference rate reform to be accounted for prospectively as a continuation ofthose contracts, permit companies to preserve hedge accounting for hedging relationships affected by reference rate reform and enable companies to make a one-time election to transfer or sell certain held-to-maturity debt securities indexed to LIBOR or another reference rate that is expected to be discontinued. Thetemporary expedients and exceptions are elective and do not apply to contract modifications made and hedging relationships entered into or evaluated afterDecember 31, 2022, with the exception of hedging relationships existing as of that date for which certain optional expedients have been elected and are expected tobe retained through the end of the hedging relationships. The ASU is effective upon issuance and management is evaluating the impact the ASU will have on theCompany’s financial statements as part of its overall evaluation of reference rate reform.
6
Table of Contents
Recently Adopted Accounting PronouncementsIn June 2016, the FASB issued ASU No. 2016-13, Financial Instruments—Credit Losses (Topic 326): Measurement of Credit Losses on Financial
Instruments. The FASB subsequently issued several additional ASUs that clarify the scope and application of the new credit loss guidance. Topic 326 replaced theincurred loss model with the current expected credit loss ("CECL") approach. For loans carried at amortized cost, the allowance for credit losses is now based onmanagement's current estimate of all anticipated credit losses over the remaining expected life of the loans. Upon the origination of a loan, the Company records itsestimate of all expected credit losses on that loan through an immediate charge to earnings. Updates to that estimate each period are recorded through provisionexpense. The CECL estimate is based on historical experience, current conditions and reasonable and supportable forecasts.
As compared to prior GAAP, the CECL approach increases the Company's allowance for credit losses on loan receivables as a result of: (1) recordingreserves for expected losses, not simply those deemed to be already incurred, (2) extending the loss estimate period over the entire life of the loan and (3)presenting the credit loss component of the purchased credit-impaired ("PCI") loan portfolio in the allowance for credit losses rather than embedding it within theloan carrying value. The allowance for credit losses on all loans carried at amortized cost, including loans previously referred to as PCI loans and loans modified ina troubled debt restructuring ("TDR") are measured under the CECL approach. Previous specialized measurement guidance for PCI loans, which are now referredto as purchased credit-deteriorated ("PCD"), and TDRs was eliminated, although certain separate disclosure guidance was retained.
Measurement of credit impairment of available-for-sale debt securities generally remains unchanged under the new rules, but any credit impairment isrecorded through an allowance, rather than a direct write-down of the security. The Company invests in U.S. Treasury and residential mortgage-backed securitiesissued by government agencies, which have long histories with no credit losses and are explicitly or implicitly guaranteed by the U.S. government. Therefore,management has concluded that there is no expectation of non-payment on its investment securities and does not record an allowance for credit losses on theseinvestments.
The ASU became effective for the Company on January 1, 2020 and required modified-retrospective application, meaning a cumulative-effect adjustmentwas recorded as of the effective date without adjusting comparative prior periods. This cumulative-effect adjustment did not reflect the economic disruptionresulting from the coronavirus disease 2019 ("COVID-19") since the global disruption occurred subsequent to January 1, 2020. As a result of adoption, theCompany recorded:
• A $2.5 billion increase to the allowance for credit losses on loan receivables primarily representing the adjustment for recording reserves for expectedlosses, not simply those deemed to be already incurred, and extending the loss estimate period over the entire life of the loan;
• A $0.6 billion increase to other assets related to deferred tax assets on the larger allowance for credit losses;
• An offsetting $1.9 billion decrease, net of tax, to the opening balance of retained earnings; and
• Immaterial adjustments to the following:
◦ The carrying value of PCD loans and related accrued interest reflected in other assets; and
◦ Accrued expenses and other liabilities to record reserves for unfunded commitments.
As required by the ASU, financial statement results and balances prior to January 1, 2020 have not been retrospectively adjusted to reflect the amendmentsin ASU No. 2016-13. Therefore, current period results and balances are not comparable to prior period amounts, particularly with regard to the provision andallowance for credit losses (and their related subtotals).
7
Table of Contents
2. Investments
The Company's other short-term investments and investment securities consist of the following (dollars in millions):
(1) Includes U.S. Treasury bills with maturity dates greater than 90 days but less than one year at the time of acquisition.(2) Includes $159 million and $121 million of U.S. Treasury securities pledged as swap collateral as of June 30, 2020 and December 31, 2019, respectively.(3) Consists of residential mortgage-backed securities issued by Fannie Mae, Freddie Mac and Ginnie Mae.
The amortized cost, gross unrealized gains and losses, and fair value of available-for-sale and held-to-maturity investment securities are as follows (dollarsin millions):
(1) Available-for-sale investment securities are reported at fair value.(2) Held-to-maturity investment securities are reported at amortized cost.(3) Amounts represent residential mortgage-backed securities that were classified as held-to-maturity as they were entered into as a part of the Company's community reinvestment initiatives.
The Company invests in U.S. Treasury and residential mortgage-backed securities issued by government agencies, which have long histories with no creditlosses and are explicitly or implicitly guaranteed by the U.S. government. Therefore, management has concluded that there is no expectation of non-payment on itsinvestment securities and does not record an allowance for credit losses on these investments.
8
Table of Contents
The following table provides information about available-for-sale investment securities with aggregate gross unrealized losses and the length of time thatindividual investment securities have been in a continuous unrealized loss position (dollars in millions):
Number ofSecurities in aLoss Position
Less than 12 months More than 12 months
Fair
Value Unrealized
Losses Fair
Value Unrealized
LossesAt December 31, 2019
Available-for-Sale Investment Securities
U.S. Treasury securities 11
$ 1,402
$ (8)
$ —
$ —
There were no proceeds from sales or recognized gains and losses on available-for-sale securities during the three or six months ended June 30, 2020 and2019. See Note 9: Accumulated Other Comprehensive Income for unrealized gains and losses on available-for-sale securities during the three and six monthsended June 30, 2020 and 2019.
Maturities of available-for-sale debt securities and held-to-maturity debt securities are provided in the following table (dollars in millions):
(1) Maturities of residential mortgage-backed securities are reflective of the contractual maturities of the investment.
Other InvestmentsAs a part of the Company's community reinvestment initiatives, the Company has made equity investments in certain limited partnerships and limited
liability companies that finance the construction and rehabilitation of affordable rental housing, as well as stimulate economic development in low to moderateincome communities. These investments are accounted for using the equity method of accounting and are recorded within other assets. The related commitment forfuture investments is recorded in accrued expenses and other liabilities within the condensed consolidated statements of financial condition. The portion of eachinvestment's operating results allocable to the Company reduces the carrying value of the investments and is recorded in other expense within the condensedconsolidated statements of income. The Company further reduces the carrying value of the investments by recognizing any amounts that are in excess of future nettax benefits in other expense. The Company earns a return primarily through the receipt of tax credits allocated to the affordable housing projects and the
community revitalization projects. These investments are not consolidated as the Company does not have a controlling financial interest in the entities. As ofJune 30, 2020 and December 31, 2019, the Company had outstanding investments in these entities of $335 million and $336 million, respectively, and relatedcontingent liabilities of $63 million and $74 million, respectively. Of the above outstanding equity investments, the Company had $301 million and $298 million ofinvestments related to affordable housing projects as of June 30, 2020 and December 31, 2019, respectively, which had $47 million and $59 million relatedcontingent liabilities, respectively.
9
Table of Contents
The Company holds non-controlling equity positions in several payment services entities. Most of these investments are not subject to equity methodaccounting because the Company does not have significant influence over the investee. The common or preferred equity securities that the Company holdstypically do not have readily determinable fair values. As a result, the majority of these investments are carried at cost minus impairment, if any. As of June 30,2020 and December 31, 2019, the carrying value of these investments, which is recorded within other assets, was $25 million and $42 million, respectively.
3. Loan ReceivablesThe Company has two loan portfolio segments: credit card loans and other loans.
The Company's classes of receivables within the two portfolio segments are depicted in the following table (dollars in millions):
Total loan receivables 88,927 95,894Allowance for credit losses(5) (8,184) (3,383)
Net loan receivables $ 80,743 $ 92,511
(1) Amounts include carrying values of $16.6 billion and $18.9 billion underlying investors' interest in trust debt at June 30, 2020 and December 31, 2019, respectively, and $11.0 billion and $12.7 billion in seller's interest at June 30,
2020 and December 31, 2019, respectively. See Note 4: Credit Card and Student Loan Securitization Activities for additional information.(2) Unbilled accrued interest receivable on credit card loans, which is presented as part of other assets in the Company's condensed consolidated statements of financial condition, was $379 million and $471 million at June 30, 2020
and December 31, 2019, respectively.(3) Accrued interest receivable on private student, personal and other loans, which is presented as part of other assets in the Company's condensed consolidated statements of financial condition, was $494 million, $48 million and $6
million, respectively, at June 30, 2020 and $461 million, $53 million and $4 million, respectively, at December 31, 2019.(4) Amounts include carrying values of $274 million and $292 million in loans pledged as collateral against the note issued from a student loan securitization trust at June 30, 2020 and December 31, 2019, respectively. See Note 4:
Credit Card and Student Loan Securitization Activities for additional information.(5) Prior to adoption of ASU No. 2016-13 on January 1, 2020, credit losses were estimated using the incurred loss approach.
10
Table of Contents
Credit Quality IndicatorsAs part of credit risk management activities, on an ongoing basis, the Company reviews information related to the performance of a customer's account with
the Company as well as information from credit bureaus, such as FICO or other credit scores, relating to the customer's broader credit performance. Key creditquality indicators that are actively monitored for credit card, private student and personal loans include FICO scores and delinquency status. These indicators areimportant to understand the overall credit performance of the Company's customers and their ability to repay.
FICO scores are generally obtained at origination of the account and are refreshed monthly or quarterly thereafter to assist in predicting customerbehavior. Historically, the Company has noted that accounts with FICO scores below 660 have larger delinquencies and credit losses than those with higher creditscores.
The following table provides the distribution of the most recent FICO scores available for the Company's customers by the amortized cost basis (excludingaccrued interest receivable presented in other assets) for credit card, private student and personal loan receivables (dollars in millions): Credit Risk Profile by FICO Score
Total personal loans$ 6,939 95% $ 377 5% $ 7,257 94% $ 430 6%
(1) Amounts include $1.0 billion and $956 million of revolving line-of-credit arrangements that were converted to term loans as a result of a TDR program as of June 30, 2020 and December 31, 2019, respectively.(2) A majority of student loans originations occur in the third quarter and disbursements can span across multiple calendar years.(3) FICO score represents the higher credit score of the cosigner or borrower.
11
Table of Contents
Delinquencies are an indicator of credit quality at a point in time. A loan balance is considered delinquent when contractual payments on the loan become30 days past due.
The amortized cost basis (excluding accrued interest receivable presented in other assets) of delinquent loans in the Company's loan portfolio is shownbelow for credit card, private student and personal loan receivables (dollars in millions): June 30, 2020 December 31, 2019
Total personal loans$ 52 $ 27 $ 79 $ 74 $ 31 $ 105
(1) Student loans may include a deferment period, during which customers are not required to make payments while enrolled in school at least half time as determined by the school. During a deferment period, these loans do not
advance into delinquency.(2) Includes PCD loans for all periods presented.
In response to the economic impact of COVID-19, the Company employed skip-a-pay programs as short-term offerings, which allow customers on amonthly or other periodic basis to request approval to skip their payment(s) for that month or period. Current accounts enrolled in these programs do not advanceto delinquency, and delinquent accounts enrolled in these programs do not advance to the next delinquency cycle, or to charge-off.
In addition to the skip-a-pay programs, the Company has other modification programs that customers have utilized during the period. Due to provisions inthe CARES Act or interagency guidance, some accounts in these programs do not constitute TDRs.
12
Table of Contents
Allowance for Credit LossesA detailed description of the Company's allowance for credit losses policy can be found under the sub-heading "— Significant Loan Receivables
Accounting Policies — Allowance for Credit Losses" below.
The following tables provide changes in the Company's allowance for credit losses (dollars in millions): For the Three Months Ended June 30, 2020
Credit Card Student Loans Personal Loans Other Total
Balance at March 31, 2020 $ 5,306 $ 765 $ 807 $ 35 $ 6,913
Additions
Provision for credit losses(1) 1,873 49 114 2 2,038
Deductions
Charge-offs (852) (20) (78) — (950)
Recoveries 164 5 14 — 183
Net charge-offs (688) (15) (64) — (767)
Balance at June 30, 2020 $ 6,491 $ 799 $ 857 $ 37 $ 8,184
For the Three Months Ended June 30, 2019
Credit Card Student Loans Personal Loans Other Total
Balance at March 31, 2019(2) $ 2,622 $ 168 $ 338 $ 6 $ 3,134
Additions
Provision for credit losses(2) 692 15 80 — 787
Deductions
Charge-offs (789) (18) (91) — (898)
Recoveries 166 3 11 — 180
Net charge-offs(3) (623) (15) (80) — (718)
Other(4) — (1) — — (1)
Balance at June 30, 2019(2) $ 2,691 $ 167 $ 338 $ 6 $ 3,202
13
Table of Contents
The following tables provide changes in the Company's allowance for credit losses (dollars in millions): For the Six Months Ended June 30, 2020
Credit Card Student Loans Personal Loans Other Total
Balance at December 31, 2019(2) $ 2,883 $ 148 $ 348 $ 4 $ 3,383
Provision for credit losses(1) 3,312 178 377 9 3,876
Deductions
Charge-offs (1,721) (42) (162) — (1,925)
Recoveries 350 10 29 — 389
Net charge-offs (1,371) (32) (133) — (1,536)
Balance at June 30, 2020 $ 6,491 $ 799 $ 857 $ 37 $ 8,184
For the Six Months Ended June 30, 2019
Credit Card Student Loans Personal Loans Other Total
Balance at December 31, 2018(2) $ 2,528 $ 169 $ 338 $ 6 $ 3,041
Additions
Provision for credit losses(2) 1,402 30 164 — 1,596
Deductions
Charge-offs (1,563) (37) (185) — (1,785)
Recoveries 324 7 21 — 352
Net charge-offs(3) (1,239) (30) (164) — (1,433)
Other(4) — (2) — — (2)
Balance at June 30, 2019(2) $ 2,691 $ 167 $ 338 $ 6 $ 3,202
(1) Excludes an $8 million build and $23 million release of the liability for expected credit losses on unfunded commitments for the three months and six months ended June 30, 2020, respectively, as the liability is recorded in accruedexpenses and other liabilities in the Company's condensed consolidated statements of financial condition.
(2) Prior to adoption of ASU No. 2016-13 on January 1, 2020, credit losses were estimated using the incurred loss approach.(3) Prior to adoption of ASU No. 2016-13 on January 1, 2020, net charge-offs on PCD loans generally did not result in a charge to earnings.(4) Net change in reserves on PCD pools having no remaining non-accretable difference (prior to adoption of ASU No. 2016-13 on January 1, 2020).(5) Represents the adjustment to allowance for credit losses as a result of adoption of ASU No. 2016-13 on January 1, 2020.
The allowance for credit losses was $8.2 billion at June 30, 2020, which reflects a $1.3 billion build over the amount of the allowance for credit losses atMarch 31, 2020. The allowance build across all loan products primarily reflects an economic outlook with updated assumptions about the impact of the COVID-19pandemic. In estimating the allowance at June 30, 2020, the Company used a macroeconomic forecast that assumes a peak unemployment rate of 16%, recoveringto just under 11% at the end of 2020 with slow recovery over the next few years, and an annualized real Gross Domestic Product decline of approximately 30%quarter-over-quarter or down approximately 10% on a year-over-year basis. The estimate also contemplated the impact of government stimulus programs andcompany-initiated loan modification programs on borrower payment behavior. The impact of COVID-19 on the economy has led to uncertainty in assumptionssurrounding factors such as the length and depth of economic stresses and borrower behavior, which required significant management judgment in estimating theallowance for credit losses.
Company-initiated loan modification programs include those offered specifically in response to COVID-19 as well as existing programs offered tocustomers experiencing difficulty making their payments. In addition to skip-a-pay programs, the Company has other modification programs that customers haveutilized during the period related to the pandemic. The accounts using these modifications are generally excluded from TDR status either because the concessionsare insignificant or they qualify for exemption pursuant to the CARES Act or interagency guidance. All modifications are considered as part of the process fordetermining the allowance for credit losses.
The allowance for credit losses was $8.2 billion at June 30, 2020, which reflects a $4.8 billion build over the amount of the allowance for credit losses atDecember 31, 2019. The allowance build across all loan products was due to (I) a
14
Table of Contents
$2.5 billion cumulative-effect adjustment for the adoption of CECL on January 1, 2020, and (II) a $2.3 billion build that primarily reflects an economic outlookthat included the COVID-19 pandemic and resulting economic stress.
At adoption of CECL and at June 30, 2020, the forecast period management deemed to be reasonable and supportable was 18 months. This period decreasedto 12 months at March 31, 2020 due to the uncertainty caused by the rapidly changing economic environment due to the COVID-19 pandemic. In the secondquarter, the reasonable and supportable period was 18 months based on the view that the present macroeconomic conditions will last for a longer period thanpreviously expected. For both quarters, the reversion period was 12 months. Since adoption of CECL, a straight-line method was used to revert to appropriatehistorical information. During the quarter ended June 30, 2020, the high degree of economic stress led the Company to apply a weighted reversion method forcredit card loans that puts more emphasis on the loss forecast model rather than lower historical losses. At June 30, 2020, the reversion method remained straight-line for all other products.
The increase in net charge-offs on credit card loans for the three and six months ended June 30, 2020 when compared to the same periods in 2019 was dueto seasoning of recent years' loan growth.
Net charge-offs of principal are recorded against the allowance for credit losses, as shown in the preceding table. Information regarding net charge-offs ofinterest and fee revenues on credit card and other loans is as follows (dollars in millions):
For the Three Months Ended June 30, For the Six Months Ended June 30,
2020 2019 2020 2019
Interest and fees accrued subsequently charged off, net of recoveries (recorded as a reduction ofinterest income)
$ 136 $ 128 $ 279 $ 255
Fees accrued subsequently charged off, net of recoveries (recorded as a reduction to other income)$ 33 $ 30 $ 68 $ 61
Delinquent and Non-Accruing Loans
The amortized cost basis (excluding accrued interest receivable presented in other assets) of delinquent and non-accruing loans in the Company's loanportfolio is shown below by each class of loan receivables (dollars in millions):
(1) The Company estimates that the gross interest income that would have been recorded in accordance with the original terms of non-accruing credit card loans was $8 million and $11 million for the three months ended June 30,
2020 and 2019, respectively, and $18 million and $23 million for the six months ended June 30, 2020 and 2019, respectively. The Company does not separately track the amount of gross interest income that would have beenrecorded in accordance with the original terms of loans. This amount was estimated based on customers' current balances and most recent interest rates.
(2) Includes PCD loans for all periods presented.
15
Table of Contents
Troubled Debt RestructuringsThe Company has internal loan modification programs that provide relief to credit card, student and personal loan borrowers who may be experiencing
financial hardship. The Company considers a modified loan in which a concession has been granted to the borrower to be a TDR based on the cumulative length ofthe concession period and credit quality of the borrower. New programs are continually evaluated to determine which of them meet the definition of a TDR,including programs provided to customers for temporary relief due to the economic impacts of the COVID-19 outbreak that may be subject to regulatory exclusionfrom TDR status. The internal loan modification programs include both temporary and permanent programs, which vary by product. External loan modificationprograms are also available for credit card and personal loans. For all temporary modification programs, including those created specifically in response toCOVID-19, the accounts are reviewed for exclusion from being reported as a TDR in accordance with the CARES Act or interagency guidance. To the extent theaccounts do not meet the requirements for exclusion, temporary and permanent modifications on credit card and personal loans, as well as temporary modificationson student loans and certain grants of student loan forbearance, result in the loans being classified as TDRs. In addition, loans that defaulted (see table on loans thatdefaulted from a TDR program that follows) or graduated from modification programs or forbearance continue to be classified as TDRs, except as noted below.
For credit card customers, the Company offers both temporary and permanent hardship programs. The temporary hardship programs consist of an interestrate reduction and in some cases a reduced minimum payment, both lasting for a period no longer than 12 months. Charging privileges on these loans are generallysuspended while in the program and if certain criteria are met, may be reinstated following completion of the program. Beginning in 2020, credit card accounts ofborrowers that have previously participated in a temporary interest rate reduction program and that have both demonstrated financial stability and had theircharging privileges reinstated at a market-based interest rate, are excluded from the balance of TDRs.
The permanent modification program involves closing the account, changing the structure of the loan to a fixed payment loan with a maturity no longer than60 months and reducing the interest rate on the loan. The permanent modification program does not normally provide for the forgiveness of unpaid principal, butmay allow for the reversal of certain unpaid interest or fee assessments. The Company also makes permanent loan modifications for customers who requestfinancial assistance through external sources, such as a consumer credit counseling agency program. These loans typically receive a reduced interest rate butcontinue to be subject to the original minimum payment terms and do not normally include waiver of unpaid principal, interest or fees. These loans remain in thepopulation of TDRs until they are paid off or charged off.
At June 30, 2020 and December 31, 2019, there were $5.6 billion of private student loans in repayment and $21 million and $46 million, respectively, inforbearance. To assist student loan borrowers who are experiencing temporary financial difficulties but are willing to resume making payments, the Company mayoffer hardship forbearance or programs that include payment deferral, temporary payment reduction, temporary interest rate reduction or extended terms. Amodified loan typically meets the definition of a TDR based on the cumulative length of the concession period and a determination of financial distress based on anevaluation of the credit quality of the borrower using FICO scores.
For personal loan customers, in certain situations the Company offers various payment programs, including temporary and permanent programs. Thetemporary programs normally consist of a reduction of the minimum payment for a period of no longer than 12 months with the option of a final balloon paymentrequired at the end of the loan term or an extension of the maturity date with the total term not exceeding nine years. Further, in certain circumstances the interestrate on the loan is reduced. The permanent programs involve changing the terms of the loan in order to pay off the outstanding balance over a longer term and incertain circumstances reducing the interest rate on the loan. Similar to the temporary programs, the total term may not exceed nine years. The Company also allowspermanent loan modifications for customers who request financial assistance through external sources, similar to the credit card customers discussed above.Payments are modified based on the new terms agreed upon with the credit counseling agency. Personal loans included in temporary and permanent programs areclassified as TDRs.
Borrower performance after using payment programs or forbearance is monitored and the Company believes the programs are useful in assisting customersexperiencing financial difficulties and allowing them to make timely payments. In addition to helping customers with their credit needs, these programs aredesigned to maximize collections and ultimately the Company’s profitability. The Company plans to continue to use payment programs and forbearance as ameans to provide relief to customers experiencing temporary financial difficulties and, as a result, expects to have additional loans classified as TDRs in the future.
16
Table of Contents
In order to evaluate the primary financial effects that resulted from credit card loans entering into a TDR program during the three and six months endedJune 30, 2020 and 2019, the Company quantified the amount by which interest and fees were reduced during the periods. During the three months ended June 30,2020 and 2019, the Company forgave approximately $18 million and $17 million, respectively, of interest and fees as a result of accounts entering into a creditcard loan TDR program. During the six months ended June 30, 2020 and 2019, the Company forgave approximately $39 million and $34 million, respectively, ofinterest and fees as a result of accounts entering into a credit card loan TDR program. For all loan products, interest income on modified loans is recognized basedon the modified contractual terms.
TDR program balances and number of accounts have been favorably impacted by customer usage of modifications that were subject to TDR exclusion inaccordance with the CARES Act or interagency guidance and are lower than comparative periods as a result.
The following table provides information on loans that entered a TDR program during the period (dollars in millions): For the Three Months Ended June 30,
2020 2019
Number ofAccounts Balances
Number ofAccounts Balances
Accounts that entered a TDR program during the period
Credit card loans(1)27,966 $ 191 84,568 $ 551
Private student loans62 $ 1 1,710 $ 30
Personal loans1,332 $ 17 2,670 $ 36
For the Six Months Ended June 30,
2020 2019
Number ofAccounts Balances
Number ofAccounts Balances
Accounts that entered a TDR program during the period
Credit card loans(1)120,702 $ 800 176,924 $ 1,143
Private student loans1,780 $ 33 3,286 $ 61
Personal loans3,880 $ 51 5,270 $ 71
(1) Accounts that entered a credit card TDR program include $176 million and $173 million that were converted from revolving line-of-credit arrangements to term loans during the three months ended June 30, 2020 and 2019,respectively, and $386 million and $336 million for the six months ended June 30, 2020 and 2019, respectively.
17
Table of Contents
The following table presents the carrying value of loans that experienced a payment default during the period that had been modified in a TDR during the15 months preceding the end of each period (dollars in millions): For the Three Months Ended June 30,
2020 2019
Number ofAccounts
AggregatedOutstanding
Balances UponDefault
Number ofAccounts
AggregatedOutstanding
Balances UponDefault
TDRs that subsequently defaulted
Credit card loans(1)(2) 11,841 $ 66 16,220 $ 95
Private student loans(3) 246 $ 5 290 $ 6
Personal loans(2) 622 $ 9 946 $ 14 For the Six Months Ended June 30,
2020 2019
Number ofAccounts
AggregatedOutstanding
Balances UponDefault
Number ofAccounts
AggregatedOutstanding
Balances UponDefault
TDRs that subsequently defaulted
Credit card loans(1)(2) 32,326 $ 183 31,872 $ 185
Private student loans(3) 604 $ 12 570 $ 11
Personal loans(2) 1,822 $ 27 1,794 $ 27
(1) Terms revert back to the pre-modification terms for customers who default from a temporary program and charging privileges remain suspended in most cases.(2) For credit card loans and personal loans, a customer defaults from a TDR program after two consecutive missed payments. The outstanding balance upon default is generally the loan balance at the end of the month prior to default.(3) For student loans, defaults have been defined as loans that are 60 or more days delinquent. The outstanding balance upon default is generally the loan balance at the end of the month prior to default.
Of the account balances that defaulted as shown above for the three months ended June 30, 2020 and 2019, approximately 61% and 39%, respectively, andfor the six months ended June 30, 2020 and 2019, approximately 48% and 39%, respectively, of the total balances were charged off at the end of the month inwhich they defaulted from a TDR program.
Significant Loan Receivables Accounting PoliciesWith the adoption of ASU No. 2016-13 on January 1, 2020, certain significant accounting policies have changed since disclosed in Note 2: Summary of
Significant Accounting Policies to the consolidated financial statements of the Company's annual report on Form 10-K for the year ended December 31, 2019.Refer to Note 1: Background and Basis of Presentation for details on adoption of the standard. Impacts on all significant loan receivables accounting policies aresummarized as follows:
• The loan receivables policy was updated to reflect the removal of PCI loans as a separate loan portfolio segment.
• The relevance of the PCI loan policy was eliminated by CECL and therefore it was removed as a significant accounting policy.
• The delinquent loans and charge-offs policy did not change.
• The allowance for credit losses policy was updated to reflect the CECL approach for estimating credit losses.
• The loan interest and fee income policy, which includes certain accounting policy elections related to accrued interest, did not materially change.
18
Table of Contents
The policies below represent those with significant updates resulting from adoption of ASU 2016-13 and are reflective of those updates. Policies that did notmaterially change can be found at Note 2: Summary of Significant Accounting Policies to the consolidated financial statements of the Company's annual report onForm 10-K for the year ended December 31, 2019.
Loan ReceivablesLoan receivables consist of credit card receivables and other loans. Loan receivables also include unamortized net deferred loan origination fees and costs.
Credit card loan receivables are reported at their principal amounts outstanding and include uncollected billed interest and fees and are reduced for unearnedrevenue related to balance transfer fees. Other loans consist of student loans, personal loans and other loans and are reported at their principal amounts outstanding.For student loans, principal amounts outstanding also include accrued interest that has been capitalized. The Company's loan receivables are deemed to be held forinvestment at origination or acquisition because management has the intent and ability to hold them for the foreseeable future. Cash flows associated with loansoriginated or acquired for investment are classified as cash flows from investing activities, regardless of a subsequent change in intent.
Allowance for Credit LossesThe Company maintains an allowance for credit losses at a level that is appropriate to absorb credit losses anticipated over the remaining expected life of
loan receivables as of the balance sheet date. The estimate of expected credit losses considers uncollectible principal, interest and fees associated with theCompany's loan receivables existing as of the balance sheet date. Additionally, the estimate includes expected recoveries of amounts that were either previouslycharged off or are expected to be charged off. The allowance is evaluated quarterly for appropriateness and is maintained through an adjustment to the provisionfor credit losses. Charge-offs of principal amounts of loans outstanding are deducted from the allowance and subsequent recoveries of such amounts increase theallowance. Charge-offs of loan balances representing unpaid interest and fees result in a reversal of interest and fee income, respectively, which is effectively areclassification of the provision for credit losses.
The Company calculates its allowance for credit losses by estimating expected credit losses separately for classes of the loan portfolio with similar riskcharacteristics, which results in segmenting the portfolio by loan product type. The allowance for credit losses for each loan product type is based on: 1) areasonable and supportable forecast period, 2) a reversion period and 3) a post-reversion period based on historical information covering the remaining life of theloan, all of which is netted with expected recoveries. The lengths of the reasonable and supportable forecast and reversion periods can vary and are subject to aquarterly assessment that considers the economic outlook and level of variability among macroeconomic forecasts. Generally, a straight-line method is used torevert from the reasonable and supportable forecast period to the post-reversion period, but in certain stressed scenarios, a weighted approach may be deemed moreappropriate.
Several analyses are used to help estimate credit losses anticipated over the remaining expected life of loan receivables as of the balance sheet date. TheCompany's estimation process includes models that predict customer losses based on risk characteristics and portfolio attributes, macroeconomic variables, andhistorical data and analysis. There is a significant amount of judgment applied in selecting inputs and analyzing the results produced by the models to determine theallowance.
For credit card loans, the Company uses a modeling framework that includes the following components for estimating expected credit losses:
• Probability of default: this model estimates the probability of charge-off at different points in time over the life of each loan.
• Exposure at default: this model estimates the portion of the balance sheet date balance remaining at any given time of charge-off for each loan. Giventhat there is no stated life of a receivable balance on a revolving credit card account, the Company applies a percentage of expected payments toestimate the portion of the balance that would remain at the time of charge-off.
• Loss given default: this model estimates the percentage of exposure (i.e. net loss) at time of charge-off that cannot be recovered, with the offsettingforecast recoveries being the driver of this estimate.
• Recoveries from previously charged-off accounts are estimated separately and are netted as part of the aggregation of all of the components of the cardloss modeling framework.
19
Table of Contents
For student loans and personal loans, the Company uses vintage-based models that estimate expected credit losses over the life of the loan, net of recoveryestimates, impacted mainly by time elapsed since origination, credit quality of origination vintages and macroeconomic forecasts.
The models described above for credit card, student and personal loans are developed utilizing historical data and applicable macroeconomic variable inputsbased on statistical analysis and behavioral relationships with credit performance. Expected recoveries from loans charged off as of the balance sheet date aremodeled separately and included in the allowance estimate. The Company leverages these models and recent macroeconomic forecasts for the portion of theestimate associated with the reasonable and supportable forecast period. To estimate expected credit losses for the remainder of the life of the credit card loans, theCompany reverts to historical experience of credit card loans with characteristics similar to those as of the balance sheet date and observed over various phases of acredit cycle. To estimate expected credit losses for the remainder of the life of student and personal loans, the Company reverts to use of average macroeconomicvariables over an appropriate historical period.
The considerations in these models include past and current loan performance, loan growth and seasoning, risk management practices, account collectionstrategies, economic conditions, bankruptcy filings, policy changes and forecasting uncertainties. Consideration of past and current loan performance includes thepost-modification performance of loans modified in a TDR. For the credit card loan portfolio, the Company estimates its credit losses on a loan-level basis, whichincludes loans that are delinquent and/or no longer accruing interest and/or loans that have been modified under a TDR. For the remainder of its portfolio,including student, personal and other loans, the Company estimates its credit losses on a pooled basis. For all loan types, recoveries are estimated at a pooled levelbased on estimates of future cash flows derived using historical experience.
Interest on credit card loans is included in the estimate of expected credit losses once billed to the customer (i.e., once the interest becomes part of the loanbalance). An allowance for credit losses is measured for accrued interest on all other loans and is presented as part of allowance for credit losses in the consolidatedstatements of financial condition.
The Company records a liability for expected credit losses for unfunded commitments on all other loans, which is presented as part of accrued expenses andother liabilities in the consolidated statements of financial condition. This liability is evaluated quarterly for appropriateness and is maintained through anadjustment to the provision for credit losses. No liability for expected credit losses is required for unused lines of credit on the Company’s credit card loansbecause they are unconditionally cancellable.
4. Credit Card and Student Loan Securitization ActivitiesThe Company's securitizations are accounted for as secured borrowings and the related trusts are treated as consolidated subsidiaries of the Company. For a
description of the Company's principles of consolidation with respect to VIEs, see Note 1: Background and Basis of Presentation to the consolidated financialstatements of the Company's annual report on Form 10-K for the year ended December 31, 2019.
Credit Card Securitization ActivitiesThe Company accesses the term asset securitization market through the Discover Card Master Trust I ("DCMT") and the Discover Card Execution Note
Trust ("DCENT"). Credit card loan receivables are transferred into DCMT and beneficial interests in DCMT are transferred into DCENT. DCENT issues debtsecurities to investors that are reported in long-term borrowings.
The DCENT debt structure consists of four classes of securities (DiscoverSeries Class A, B, C and D notes), with the most senior class generally receiving atriple-A rating. In order to issue senior, higher rated classes of notes, it is necessary to obtain the appropriate amount of credit enhancement, generally through theissuance of junior, lower rated or more highly subordinated classes of notes. The subordinated classes are held by wholly-owned subsidiaries of Discover Bank.The Company is exposed to credit-related risk of loss associated with trust assets as of the balance sheet date through the retention of these subordinated interests.The estimated loss is included in the allowance for credit losses estimate.
The Company's retained interests in the assets of the trusts, consisting of investments in DCENT notes held by subsidiaries of Discover Bank, constituteintercompany positions, which are eliminated in the preparation of the Company's condensed consolidated statements of financial condition.
20
Table of Contents
Upon transfer of credit card loan receivables to the trust, the receivables and certain cash flows derived from them become restricted for use in meetingobligations to the trusts' creditors. Further, the transferred credit card loan receivables are owned by the trust and are not available to third-party creditors of theCompany. The trusts have ownership of cash balances, the amounts of which are reported in restricted cash. With the exception of the seller's interest in trustreceivables, the Company's interests in trust assets are generally subordinate to the interests of third-party investors and, as such, may not be realized by theCompany if needed to absorb deficiencies in cash flows that are allocated to the investors in the trusts' debt. Apart from the restricted assets related to securitizationactivities, the investors and the securitization trusts have no recourse to the Company's other assets or the Company's general credit for a shortage in cash flows.
The carrying values of these restricted assets, which are presented on the Company's condensed consolidated statements of financial condition as relating tosecuritization activities, are shown in the following table (dollars in millions):
June 30,
2020 December 31,
2019Restricted cash $ 19 $ 28 Investors' interests held by third-party investors 12,450 14,100Investors' interests held by wholly-owned subsidiaries of Discover Bank 4,184 4,796Seller's interest 11,018 12,652Loan receivables(1) 27,652 31,548
Allowance for credit losses allocated to securitized loan receivables(1)(2)(1,972) (1,179)
Net loan receivables 25,680 30,369Other 5 5Carrying value of assets of consolidated variable interest entities $ 25,704 $ 30,402
(1) The Company maintains its allowance for credit losses at an amount sufficient to absorb expected losses inherent in all loan receivables, which includes all loan receivables in the trusts. Therefore, credit risk associated with thetransferred receivables is fully reflected on the Company's balance sheet in accordance with GAAP.
(2) Prior to adoption of ASU No. 2016-13 on January 1, 2020, credit losses were estimated using the incurred loss approach.
The debt securities issued by the consolidated trusts are subject to credit, payment and interest rate risks on the transferred credit card loan receivables. Toprotect investors in the securities, there are certain features or triggering events that could cause an early amortization of the debt securities, including triggersrelated to the impact of the performance of the trust receivables on the availability and adequacy of cash flows to meet contractual requirements. As of June 30,2020, no economic or other early amortization events have occurred.
The Company continues to own and service the accounts that generate the loan receivables held by the trusts. Discover Bank receives servicing fees fromthe trusts based on a percentage of the monthly investor principal balance outstanding. Although the fee income to Discover Bank offsets the fee expense to thetrusts and thus is eliminated in consolidation, failure to service the transferred loan receivables in accordance with contractual requirements could lead to atermination of the servicing rights and the loss of future servicing income, net of related expenses.
Student Loan Securitization ActivitiesStudent loan trust receivables are recorded in private student loans and the related debt issued by the trusts is reported in long-term borrowings. The assets
of the trusts are restricted from being sold or pledged as collateral for other borrowings and the cash flows from these restricted assets may be used only to payobligations of the trusts. With the exception of the trusts' restricted assets, the trusts and investors have no recourse to the Company's other assets or the Company'sgeneral credit for a shortage in cash flows.
Securities issued to investors are outstanding from only one of the two remaining student loan securitization trusts. Principal payments on the long-termsecured borrowings are made as cash is collected on the underlying loans that are used as collateral on the secured borrowings. The Company does not have accessto cash collected by the securitization trust until cash is released in accordance with the trust indenture agreement. Similar to the credit card securitizations, theCompany continues to own and service the accounts that generate the student loan receivables held by the trust and receives servicing fees from the trust based ona percentage of the principal balance outstanding. Although the servicing fee income offsets the fee expense related to the trust and thus is eliminated inconsolidation, failure to service the transferred loan receivables in accordance with contractual requirements could lead to a termination of the servicing rights andthe loss of future servicing income, net of related expenses.
21
Table of Contents
Under terms of the trust arrangement, the Company has the option, but not the obligation, to provide financial support to the trust, but has never providedsuch support. A substantial portion of the credit risk associated with the securitized loans has been transferred to a third party under an indemnificationarrangement.
The carrying values of these restricted assets, which are presented on the Company's condensed consolidated statements of financial condition as relating tosecuritization activities, are shown in the following table (dollars in millions):
June 30,
2020 December 31,
2019Restricted cash $ 10 $ 12Student loan receivables 274 292Carrying value of assets of consolidated variable interest entities $ 284 $ 304
5. Intangible AssetsIn connection with the preparation of the financial statements for this quarterly report on Form 10-Q, the Company identified a triggering event due to
changes in the international travel and entertainment businesses that continue to persist and a declining revenue outlook for the foreseeable future resulting fromCOVID-19. As a result, the Company conducted an interim impairment test on its Diners Club trade names and international transaction processing rights non-amortizable intangible assets.
The valuation methodology used to value the trade names and international transaction processing rights was based on a discounted cash flow method,consistent with the methodology used for annual impairment testing. As a result of this analysis, the Company made the determination that the trade names andinternational transaction processing rights were impaired and recognized a charge in its Payment Services segment of $36 million and $23 million, respectively.The impairment was recorded in other expense.
The trade names have a remaining net book value of $92 million and the international transaction processing rights have no remaining net book value.
22
Table of Contents
6. DepositsThe Company offers its deposit products to customers through two channels: (i) through direct marketing, internet origination and affinity relationships
("direct-to-consumer deposits"); and (ii) indirectly through contractual arrangements with securities brokerage firms ("brokered deposits"). Direct-to-consumerdeposits include online savings accounts, certificates of deposit, money market accounts, IRA certificates of deposit and checking accounts, while brokereddeposits include certificates of deposit and sweep accounts.
The following table provides a summary of interest-bearing deposit accounts (dollars in millions):
June 30,
2020 December 31,
2019
Certificates of deposit in amounts less than $100,000$ 22,974 $ 25,113
Certificates of deposit in amounts $100,000 or greater(1)10,392 9,268
(1) Includes $3.0 billion and $2.6 billion in certificates of deposit equal to or greater than $250,000, the Federal Deposit Insurance Corporation ("FDIC") insurance limit, as of June 30, 2020 and December 31, 2019, respectively.
The following table summarizes certificates of deposit in amounts of $100,000 or greater by contractual maturity (dollars in millions):
June 30,
2020Three months or less $ 1,954Over three months through six months 1,639Over six months through twelve months 3,941Over twelve months 2,858Total $ 10,392
The following table summarizes certificates of deposit maturing over the remainder of this year, over each of the next four years, and thereafter (dollars inmillions):
Long-term borrowings consist of borrowings having original maturities of one year or more. The following table provides a summary of the Company'slong-term borrowings and weighted-average interest rates on outstanding balances (dollars in millions):
Fixed-rate senior bank notes(1) 2021-2030 2.45%-4.65% 3.89% 6,255 6,785
Fixed-rate subordinated bank notes 2028-2028 4.68%-4.68% 4.68% 520 996
Total long-term borrowings $ 23,194 $ 25,701
(1) The Company uses interest rate swaps to hedge portions of these long-term borrowings against changes in fair value attributable to changes in LIBOR or Overnight Index Swap ("OIS") Rate. Use of these interest rate swapsimpacts carrying value of the debt. See Note 16: Derivatives and Hedging Activities.
(2) Discover Card Execution Note Trust floating-rate asset-backed securities include issuances with the following interest rate terms: 1-month LIBOR + 23 to 60 basis points as of June 30, 2020.(3) The student loan securitization trust floating-rate asset-backed security includes an issuance with the following interest rate term: Prime rate + 100 basis points as of June 30, 2020.(4) Repayment of this debt is dependent upon the timing of principal and interest payments on the underlying student loans. The date shown represents final maturity date.
The following table summarizes long-term borrowings maturing over the remainder of this year, over each of the next four years, and thereafter (dollars inmillions): June 30, 20202020 $ 1,8542021 4,2462022 5,2082023 3,4212024 2,635Thereafter 5,830Total $ 23,194
The Company has access to committed borrowing capacity through private securitizations to support the funding of its credit card loan receivables. As ofJune 30, 2020, the total commitment of secured credit facilities through private providers was $6.0 billion, none of which was drawn as of June 30, 2020. Access tothe unused portions of the secured credit facilities is subject to the terms of the agreements with each of the providers, which have various expirations in calendaryears 2021 through 2022. Borrowings outstanding under each facility bear interest at a margin above LIBOR or the asset-backed commercial paper costs of eachindividual conduit provider. The terms of each agreement provide for a commitment fee to be paid on the unused capacity and include various affirmative andnegative covenants, including performance metrics and legal requirements similar to those required to issue any term securitization transaction.
24
Table of Contents
8. Preferred StockOn June 22, 2020, the Company issued and sold 5,000 shares of 6.125% Fixed-Rate Reset Non-Cumulative Perpetual Preferred Stock, Series D (the
“preferred stock”), with a par value of $0.01 per share. Each share of preferred stock has a liquidation preference of $1,000 and is represented by 100 depositaryshares. Proceeds, net of underwriting discount and estimated expenses, received from the preferred stock issuance totaled approximately $493 million. Thepreferred stock is redeemable at the Company’s option, subject to regulatory approval, either (1) in whole or in part during the three-month period prior to, andincluding, each reset date (as defined in the certificate of designations for the preferred stock) or (2) in whole but not in part, at any time within 90 days following aregulatory capital event (as defined in the certificate of designations for the preferred stock), in each case at a redemption price equal to $1,000 per share ofpreferred stock plus declared and unpaid dividends. Any dividends declared on the preferred stock will be payable semi-annually in arrears at a rate of 6.125% perannum until September 23, 2025, after which the dividend rate will reset every five years to a fixed annual rate equal to the 5-year Treasury rate plus 5.783%. Formore information on the Company's preferred stock, see Note 12: Common and Preferred Stock to the consolidated financial statements of the Company's annualreport on Form 10-K for the year ended December 31, 2019.
9. Accumulated Other Comprehensive Income
Changes in each component of accumulated other comprehensive income (loss) ("AOCI") were as follows (dollars in millions):
Unrealized Gains onAvailable-for-Sale
InvestmentSecurities, Net of
Tax
(Losses) Gains onCash Flow Hedges,
Net of Tax Losses on PensionPlan, Net of Tax AOCI
For the Three Months Ended June 30, 2020
Balance at March 31, 2020 $ 368 $ (20) $ (214) $ 134
Net change (16) 4 — (12)Balance at June 30, 2020 $ 352 $ (16) $ (214) $ 122
For the Three Months Ended June 30, 2019
Balance at March 31, 2019 $ 41 $ 10 $ (187) $ (136)
Net change 71 (18) — 53
Balance at June 30, 2019 $ 112 $ (8) $ (187) $ (83)
For the Six Months Ended June 30, 2020
Balance at December 31, 2019 $ 112 $ (17) $ (214) $ (119)
Net change 240 1 — 241
Balance at June 30, 2020 $ 352 $ (16) $ (214) $ 122
For the Six Months Ended June 30, 2019
Balance at December 31, 2018 $ 10 $ 22 $ (188) $ (156)
Net change 102 (30) 1 73
Balance at June 30, 2019 $ 112 $ (8) $ (187) $ (83)
25
Table of Contents
The following table presents each component of other comprehensive income (loss) ("OCI") before reclassifications and amounts reclassified from AOCIfor each component of OCI before- and after-tax (dollars in millions):
Before Tax Tax Benefit(Expense) Net of Tax
For the Three Months Ended June 30, 2020
Available-for-Sale Investment Securities
Net unrealized holding losses arising during the period $ (20) $ 4 $ (16)
Net change $ (20) $ 4 $ (16)
Cash Flow Hedges
Net unrealized gains arising during the period $ — $ 1 $ 1
Amounts reclassified from AOCI 5 (2) 3
Net change $ 5 $ (1) $ 4
Pension Plan For the Three Months Ended June 30, 2019
Available-for-Sale Investment Securities
Net unrealized holding gains arising during the period $ 94 $ (23) $ 71
Net change $ 94 $ (23) $ 71
Cash Flow Hedges
Net unrealized losses arising during the period $ (22) $ 6 $ (16)
Amounts reclassified from AOCI (2) — (2)
Net change $ (24) $ 6 $ (18)
For the Six Months Ended June 30, 2020
Available-for-Sale Investment Securities
Net unrealized holding gains arising during the period $ 317 $ (77) $ 240
Net change $ 317 $ (77) $ 240
Cash Flow Hedges
Net unrealized losses arising during the period $ (7) $ 3 $ (4)
Amounts reclassified from AOCI 7 (2) 5
Net change $ — $ 1 $ 1
For the Six Months Ended June 30, 2019
Available-for-Sale Investment Securities
Net unrealized holding gains arising during the period $ 134 $ (32) $ 102
Net change $ 134 $ (32) $ 102
Cash Flow Hedges
Net unrealized losses arising during the period $ (35) $ 9 $ (26)
Amounts reclassified from AOCI (5) 1 (4)
Net change $ (40) $ 10 $ (30)
Pension Plan
Unrealized gains arising during the period $ 1 $ — $ 1
Net change $ 1 $ — $ 1
26
Table of Contents
10. Income Taxes
The following table presents the calculation of the Company's effective income tax rate (dollars in millions, except effective income tax rate):
For the Three Months Ended June
30, For the Six Months Ended June
30,
2020 2019 2020 2019(Loss) income before income taxes $ (461) $ 987 $ (539) $ 1,917Income tax (benefit) expense $ (93) $ 234 $ (110) $ 438Effective income tax rate 20.2% 23.8% 20.4% 22.9%
The income tax expense decreased $327 million and $548 million for the three and six months ended June 30, 2020, respectively, as compared to the sameperiods in 2019 due to pretax losses for the current periods. The effective tax rate for the three and six months ended June 30, 2020 is lower due to a lowerprojected pretax income for the full year. The Company calculates its provision for income taxes during interim reporting periods by applying an estimate of theannual effective tax rate for the full year to pretax income or loss excluding unusual or infrequent occurring discrete items. The Company is projecting a lowerpretax income for the full year, therefore the effective tax rate for the full year is lower from the historical annual effective tax rate.
The Company is subject to examination by the Internal Revenue Service ("IRS") and tax authorities in various state, local and foreign tax jurisdictions. TheCompany regularly assesses the likelihood of additional assessments or settlements in each of the taxing jurisdictions resulting from these and subsequent years'examinations. The years 2011-2015 are currently under review by the IRS Office of Appeals. At this time, the potential change in unrecognized tax benefits is notexpected to be significant over the next 12 months. The Company believes that its reserves are sufficient to cover any tax, penalties and interest that would resultfrom such examinations.
11. Earnings Per Share
The following table presents the calculation of basic and diluted earnings per share ("EPS") (in millions, except per share amounts):
For the Three Months Ended June 30, For the Six Months Ended June 30,
2020 2019 2020 2019Numerator Net (loss) income $ (368) $ 753 $ (429) $ 1,479Preferred stock dividends — — (16) (16)Net (loss) income available to common stockholders (368) 753 (445) 1,463Income allocated to participating securities (1) (6) (1) (11)Net (loss) income allocated to common stockholders $ (369) $ 747 $ (446) $ 1,452Denominator Weighted-average shares of common stock outstanding 306 322 307 325Effect of dilutive common stock equivalents — 1 — 1Weighted-average shares of common stock outstanding and common stock equivalents 306 323 307 326
Basic (loss) earnings per common share $ (1.20) $ 2.32 $ (1.45) $ 4.46Diluted (loss) earnings per common share $ (1.20) $ 2.32 $ (1.45) $ 4.46
Anti-dilutive securities were not material and had no impact on the computation of diluted EPS for the three or six months ended June 30, 2020 and 2019.
27
Table of Contents
12. Capital AdequacyThe Company is subject to the capital adequacy guidelines of the Federal Reserve, and Discover Bank, the Company's main banking subsidiary, is subject to
various regulatory capital requirements as administered by the FDIC. Failure to meet minimum capital requirements can result in the initiation of certainmandatory and possibly additional discretionary actions by regulators that, if undertaken, could have a direct material effect on the financial position and results ofthe Company and Discover Bank. Under capital adequacy guidelines and the regulatory framework for prompt corrective action, the Company and Discover Bankmust meet specific capital guidelines that involve quantitative measures of assets, liabilities and certain off-balance sheet items, as calculated under regulatoryguidelines. Capital amounts and classification are also subject to qualitative judgments by the regulators about components, risk weightings and other factors.
The Company and Discover Bank are subject to regulatory and capital rules issued by the Federal Reserve and FDIC, respectively, under the BaselCommittee's December 2010 framework ("Basel III rules"). The Basel III rules, which became effective for the Company January 2015, were subject to phase-inperiods through the end of 2018, based on the Company being classified as a "Standardized Approach" entity. As of January 1, 2019, the Basel III rules subject totransition have all been fully phased in with the exception of certain transition provisions that were frozen pursuant to regulation issued in November 2017.Pursuant to a final rule issued in July 2019, the transition provisions that were previously frozen have been replaced with new permanent rules effective in April2020. Additionally, on March 27, 2020, federal bank regulatory agencies announced an interim final rule that allows banks that have implemented CECL theoption to delay for two years the estimated impact of CECL on regulatory capital, followed by a three-year transition period. For purposes of calculating regulatorycapital, the Company has elected to defer recognition of the estimated impact of CECL on regulatory capital for two years in accordance with the interim final ruleadopted by federal bank regulatory agencies on March 27, 2020. Pursuant to the interim final rule, the estimated impact of CECL on regulatory capital will bephased in over a three-year period beginning in 2022.
As of June 30, 2020, the Company and Discover Bank met all Basel III minimum capital ratio requirements to which they were subject. The Company andDiscover Bank also met the requirements to be considered "well-capitalized" under Regulation Y and prompt corrective action regulations, respectively, and therehave been no conditions or events that management believes have changed the Company's or Discover Bank's category. To be categorized as "well-capitalized,"the Company and Discover Bank must maintain minimum capital ratios as set forth in the table below.
28
Table of Contents
The following table shows the actual capital amounts and ratios of the Company and Discover Bank and comparisons of each to the regulatory minimumand "well-capitalized" requirements (dollars in millions):
Actual Minimum Capital
Requirements
Capital RequirementsTo Be Classified asWell-Capitalized
Amount Ratio(1) Amount Ratio Amount(2) Ratio(2)
June 30, 2020 Total capital (to risk-weighted assets) Discover Financial Services $ 13,367 14.7% $ 7,252 ≥8.0% $ 9,065 ≥10.0%Discover Bank $ 13,029 14.5% $ 7,167 ≥8.0% $ 8,958 ≥10.0%Tier 1 capital (to risk-weighted assets) Discover Financial Services $ 11,665 12.9% $ 5,439 ≥6.0% $ 5,439 ≥6.0%Discover Bank $ 10,941 12.2% $ 5,375 ≥6.0% $ 7,167 ≥8.0%Tier 1 capital (to average assets) Discover Financial Services $ 11,665 10.0% $ 4,645 ≥4.0% N/A N/ADiscover Bank $ 10,941 9.5% $ 4,597 ≥4.0% $ 5,746 ≥5.0%Common Equity Tier 1 (to risk-weighted assets) Discover Financial Services $ 10,609 11.7% $ 4,079 ≥4.5% N/A N/ADiscover Bank $ 10,941 12.2% $ 4,031 ≥4.5% $ 5,823 ≥6.5% December 31, 2019 Total capital (to risk-weighted assets) Discover Financial Services $ 13,250 13.5% $ 7,860 ≥8.0% $ 9,825 ≥10.0%Discover Bank $ 13,441 13.8% $ 7,776 ≥8.0% $ 9,720 ≥10.0%Tier 1 capital (to risk-weighted assets) Discover Financial Services $ 11,595 11.8% $ 5,895 ≥6.0% $ 5,895 ≥6.0%Discover Bank $ 11,203 11.5% $ 5,832 ≥6.0% $ 7,776 ≥8.0%Tier 1 capital (to average assets) Discover Financial Services $ 11,595 10.3% $ 4,482 ≥4.0% N/A N/ADiscover Bank $ 11,203 10.1% $ 4,435 ≥4.0% $ 5,544 ≥5.0%Common Equity Tier 1 (to risk-weighted assets) Discover Financial Services $ 11,032 11.2% $ 4,421 ≥4.5% N/A N/ADiscover Bank $ 11,203 11.5% $ 4,374 ≥4.5% $ 6,318 ≥6.5% (1) Capital ratios are calculated based on the Basel III Standardized Approach rules, subject to applicable transition provisions, including CECL transition provisions.(2) The Basel III rules do not establish well-capitalized thresholds for these measures for bank holding companies. Existing well-capitalized thresholds established in the Federal Reserve's Regulation Y have been included where
available.
13. Commitments, Contingencies and GuaranteesIn the normal course of business, the Company enters into a number of off-balance sheet commitments, transactions and obligations under guarantee
arrangements that expose the Company to varying degrees of risk. The Company's commitments, contingencies and guarantee relationships are described below.
Commitments
Unused Credit ArrangementsAt June 30, 2020, the Company had unused credit arrangements for loans of approximately $214.0 billion. Such arrangements arise primarily from
agreements with customers for unused lines of credit on certain credit cards and certain other loan products, provided there is no violation of conditions in therelated agreements. These arrangements, substantially all of which the Company can terminate at any time and which do not necessarily represent future cashrequirements, are periodically reviewed based on account usage, customer creditworthiness and loan qualification.
29
Table of Contents
ContingenciesSee Note 14: Litigation and Regulatory Matters for a description of potential liability arising from pending litigation or regulatory proceedings involving the
Company.
GuaranteesThe Company has obligations under certain guarantee arrangements, including contracts, indemnification agreements, and representations and warranties,
which contingently require the Company to make payments to the guaranteed party based on changes in an underlying asset, liability or equity security of aguaranteed party, rate or index. Also included as guarantees are contracts that contingently require the Company to make payments to a guaranteed party based onanother entity's failure to perform under an agreement. The Company's use of guarantees is disclosed below by type of guarantee.
Securitizations Representations and WarrantiesAs part of the Company's financing activities, the Company provides representations and warranties that certain assets pledged as collateral in secured
borrowing arrangements conform to specified guidelines. Due diligence is performed by the Company, which is intended to ensure that asset guidelinequalifications are met. If the assets pledged as collateral do not meet certain conforming guidelines, the Company may be required to replace, repurchase or sellsuch assets. In its credit card securitization activities, the Company would replace nonconforming receivables through the allocation of excess seller's interest orfrom additional transfers from the unrestricted pool of receivables. If the Company could not add enough receivables to satisfy the requirement, an earlyamortization (or repayment) of investors' interests would be triggered. In its student loan securitizations, the Company would generally repurchase the loans fromthe trust at the outstanding principal amount plus interest.
The maximum potential amount of future payments the Company could be required to make would be equal to the current outstanding balances of third-party investor interests in credit card asset-backed securities, and the principal amount of any student loan secured borrowings, plus any unpaid interest for thecorresponding secured borrowings. The Company has recorded substantially all of the maximum potential amount of future payments in long-term borrowings onthe Company's condensed consolidated statements of financial condition. The Company has not recorded any incremental contingent liability associated with itssecured borrowing representations and warranties. Management believes that the probability of having to replace, repurchase or sell assets pledged as collateralunder secured borrowing arrangements, including an early amortization event, is low.
Counterparty Settlement GuaranteesDiners Club and DFS Services LLC (on behalf of PULSE) have various counterparty exposures, which are listed below.
• Merchant Guarantee. Diners Club has entered into contractual relationships with certain international merchants, which generally include travel-relatedbusinesses, for the benefit of all Diners Club licensees. The licensees hold the primary liability to settle the transactions of their customers with thesemerchants. However, Diners Club retains a counterparty exposure if a licensee fails to meet its financial payment obligation to one of these merchants.
• ATM Guarantee. PULSE entered into contractual relationships with certain international ATM acquirers in which DFS Services LLC retainscounterparty exposure if an issuer fails to fulfill its settlement obligation.
• Network Alliance Guarantee. Discover Network, Diners Club and PULSE have entered into contractual relationships with certain international paymentnetworks in which DFS Services LLC retains the counterparty exposure if a network fails to fulfill its settlement obligation.
The maximum potential amount of future payments related to such contingent obligations is dependent upon the transaction volume processed between thetime a potential counterparty defaults on its settlement and the time at which the Company disables the settlement of any further transactions for the defaultingparty. The Company has some contractual remedies to offset these counterparty settlement exposures (such as letters of credit or pledged deposits), however, thereis no limitation on the maximum amount the Company may be liable to pay.
The actual amount of the potential exposure cannot be quantified as the Company cannot determine whether particular counterparties will fail to meet theirsettlement obligations. In the event that all licensees and/or issuers were to become
30
Table of Contents
unable to settle their transactions, the Company estimates its maximum potential counterparty exposures to these settlement guarantees would be approximately$50 million as of June 30, 2020.
The Company believes that the estimated amounts of maximum potential future payments are not representative of the Company's actual potential lossexposure given Diners Club's and PULSE's insignificant historical losses from these counterparty exposures. As of June 30, 2020, the Company had not recordedany material contingent liability in the condensed consolidated financial statements for these counterparty exposures and management believes that the probabilityof any payments under these arrangements is low.
Discover Network Merchant Chargeback GuaranteesThe Company operates the Discover Network, issues payment cards and permits third parties to issue payment cards. The Company is contingently liable
for certain transactions processed on the Discover Network in the event of a dispute between the payment card customer and a merchant. The contingent liabilityarises if the disputed transaction involves a merchant or merchant acquirer with whom the Discover Network has a direct relationship. If a dispute is resolved in thecustomer's favor, the Discover Network will credit or refund the disputed amount to the Discover Network card issuer, who in turn credits its customer's account.The Discover Network will then charge back the disputed amount of the payment card transaction to the merchant or merchant acquirer, where permitted by theapplicable agreement, to seek recovery of amounts already paid to the merchant for payment card transactions. If the Discover Network is unable to collect theamount subject to dispute from the merchant or merchant acquirer (e.g., in the event of merchant default or dissolution or after expiration of the time period forchargebacks in the applicable agreement), the Discover Network will bear the loss for the amount credited or refunded to the customer. In most instances, a loss bythe Discover Network is unlikely to arise in connection with payments on card transactions because most products or services are delivered when purchased andcredits are issued by merchants on returned items in a timely fashion, thus minimizing the likelihood of cardholder disputes with respect to amounts paid by theDiscover Network. However, where the product or service is not scheduled to be provided to the customer until a later date following the purchase, the likelihoodof a contingent payment obligation by the Discover Network increases. Losses related to merchant chargebacks were not material for the three and six monthsended June 30, 2020 and 2019.
The maximum potential amount of obligations of the Discover Network arising as a result of such contingent obligations is estimated to be the portion of thetotal Discover Network transaction volume processed to date for which timely and valid disputes may be raised under applicable law and relevant issuer andcustomer agreements. There is no limitation on the maximum amount the Company may be liable to pay to issuers. However, the Company believes that suchamount is not representative of the Company's actual potential loss exposure based on the Company's historical experience. The actual amount of the potentialexposure cannot be quantified as the Company cannot determine whether the current or cumulative transaction volumes may include or result in disputedtransactions.
The following table summarizes certain information regarding merchant chargeback guarantees (in millions):
For the Three Months Ended June 30, For the Six Months Ended June 30,
(1) Represents transactions processed on the Discover Network for which a potential liability exists that, in aggregate, can differ from credit card sales volume.
The Company did not record any material contingent liability in the condensed consolidated financial statements for merchant chargeback guarantees as ofJune 30, 2020 or December 31, 2019. The Company mitigates the risk of potential loss exposure by withholding settlement from merchants, obtaining third-partyguarantees, or obtaining escrow deposits or letters of credit from certain merchant acquirers or merchants that are considered higher risk due to various factors suchas time delays in the delivery of products or services. As of June 30, 2020 and December 31, 2019, the Company had escrow deposits and settlement withholdingsof $34 million and $8 million, respectively, which are recorded in interest-bearing deposit accounts and accrued expenses and other liabilities on the Company'scondensed consolidated statements of financial condition.
14. Litigation and Regulatory MattersIn the normal course of business, from time to time, the Company has been named as a defendant in various legal actions, including arbitrations, class
actions and other litigation, arising in connection with its activities. Certain of the actual or threatened legal actions include claims for substantial compensatoryand/or punitive damages or claims for indeterminate
31
Table of Contents
amounts of damages. The litigation process is not predictable and can lead to unexpected results. The Company contests liability and/or the amount of damages asappropriate in each pending matter.
The Company has historically offered its customers an arbitration clause in its customer agreements. The arbitration clause allows the Company and itscustomers to quickly and economically resolve disputes. Additionally, the arbitration clause has in some instances limited the costs of, and the Company's exposureto, litigation. Future legal and regulatory challenges and prohibitions may cause the Company to discontinue its offering and use of such clauses. From time totime, the Company is involved in legal actions challenging its arbitration clause. Bills may be periodically introduced in Congress to directly or indirectly prohibitthe use of pre-dispute arbitration clauses.
The Company is also involved, from time to time, in other reviews, investigations and proceedings (both formal and informal) by governmental agenciesregarding the Company's business including, among other matters, consumer regulatory, accounting, tax and other operational matters, some of which may resultin significant adverse judgments, settlements, fines, penalties, injunctions, decreases in regulatory ratings, customer restitution or other relief, which couldmaterially impact the Company's condensed consolidated financial statements, increase its cost of operations, or limit its ability to execute its business strategiesand engage in certain business activities. Certain subsidiaries of the Company are subject to a consent order with the Consumer Financial Protection Bureau("CFPB") regarding certain student loan servicing practices, as described below. Pursuant to powers granted under federal banking laws, regulatory agencies havebroad and sweeping discretion, and may assess civil money penalties, require changes to certain business practices or require customer restitution at any time.
In accordance with applicable accounting guidance, the Company establishes an accrued liability for legal and regulatory matters when those matterspresent loss contingencies that are both probable and estimable. Litigation and regulatory settlement related expense was not material for the three and six monthsended June 30, 2020 and 2019.
There may be an exposure to loss in excess of any amounts accrued. The Company believes the estimate of the aggregate range of reasonably possiblelosses (meaning those losses the likelihood of which is more than remote but less than likely) in excess of the amounts that the Company has accrued for legal andregulatory proceedings is up to $165 million. This estimated range of reasonably possible losses is based upon currently available information for thoseproceedings in which the Company is involved, takes into account the Company's best estimate of such losses for those matters for which an estimate can be made,and does not represent the Company's maximum potential loss exposure. Various aspects of the legal proceedings underlying the estimated range will change fromtime to time and actual results may vary significantly from the estimate.
The Company's estimated range above involves significant judgment, given the varying stages of the proceedings, the existence of numerous yet to beresolved issues, the breadth of the claims (often spanning multiple years and, in some cases, a wide range of business activities), unspecified damages and/or thenovelty of the legal issues presented. The outcome of pending matters could be material to the Company's condensed consolidated financial condition, operatingresults and cash flows for a particular future period, depending on, among other things, the level of the Company's income for such period, and could adverselyaffect the Company's reputation.
On July 22, 2015, the Company announced that its subsidiaries, Discover Bank, The Student Loan Corporation and Discover Products Inc. (the "DiscoverSubsidiaries"), agreed to a consent order with the CFPB resolving the agency's investigation with respect to certain student loan servicing practices. The orderrequired the Discover Subsidiaries to provide redress of approximately $16 million to consumers who may have been affected by the activities described in theorder related to certain collection calls, overstatements of minimum payment due amounts in billing statements and provision of interest paid information toconsumers, and provide regulatory disclosures with respect to loans acquired in default. In addition, the Discover Subsidiaries were required to pay a $2.5 millioncivil money penalty to the CFPB. As required by the consent order, on October 19, 2015, the Discover Subsidiaries submitted to the CFPB a redress plan and acompliance plan designed to ensure that the Discover Subsidiaries provide redress and otherwise comply with the terms of the order. The CFPB is currentlyinvestigating Discover Bank's compliance with the order and certain student loan servicing practices. Discover Bank is cooperating with the CFPB in connectionwith the investigation. Discover Bank is enhancing the compliance plan submitted to the CFPB in 2015. The investigation could lead to a supervisory action, whichmay result in legal fees, penalties, fines and remediation expenses, and could require Discover Bank to change certain business practices.
On March 8, 2016, a class action lawsuit was filed against the Company, other credit card networks, other issuing banks, and EMVCo in the U.S. DistrictCourt for the Northern District of California (B&R Supermarket, Inc., d/b/a Milam's Market, et al. v. Visa, Inc. et al.) alleging a conspiracy by defendants to shiftfraud liability to merchants with the migration to
32
Table of Contents
the EMV security standard and chip technology. Plaintiffs assert joint and several liability among the defendants and seek unspecified damages, including trebledamages, attorneys' fees, costs and injunctive relief. In May 2017, the Court entered an order transferring the entire action to a federal court in New York that ispresiding over certain related claims that are pending in the actions consolidated as MDL 1720. On March 11, 2018, the Court entered an order denying theplaintiffs' motion for class certification without prejudice to filing a renewed motion. Plaintiffs filed a renewed motion for class certification on July 16, 2018.Defendants filed their Opposition to Class Certification on March 15, 2019; a hearing date is yet to be scheduled. The Company is not in a position at this time toassess the likely outcome or its exposure, if any, with respect to this matter, but will seek to vigorously defend against all claims asserted by the plaintiffs.
15. Fair Value MeasurementsFair value is defined as the price that would be received to sell an asset or paid to transfer a liability in an orderly transaction between market participants at
the measurement date. Accounting Standards Codification ("ASC") Topic 820, Fair Value Measurement, provides a three-level hierarchy for classifying financialinstruments, which is based on whether the inputs to the valuation techniques used to measure the fair value of each financial instrument are observable orunobservable. It also requires certain disclosures about those measurements. The three-level valuation hierarchy is as follows:
• Level 1: Fair values determined by Level 1 inputs are defined as those that utilize quoted prices (unadjusted) in active markets for identical assets orliabilities that the Company has the ability to access.
• Level 2: Fair values determined by Level 2 inputs are those that utilize inputs other than quoted prices included in Level 1 that are observable for the assetor liability, either directly or indirectly. Level 2 inputs include quoted prices for similar assets and liabilities in active or inactive markets, quoted pricesfor the identical assets in an inactive market, and inputs other than quoted prices that are observable for the asset or liability, such as interest rates andyield curves that are observable at commonly quoted intervals. The Company evaluates factors such as the frequency of transactions, the size of the bid-ask spread and the significance of adjustments made when considering transactions involving similar assets or liabilities to assess the relevance of thoseobserved prices. If relevant and observable prices are available, the fair values of the related assets or liabilities would be classified as Level 2.
• Level 3: Fair values determined by Level 3 inputs are those based on unobservable inputs and include situations where there is little, if any, marketactivity for the asset or liability being valued. In instances in which the inputs used to measure fair value may fall into different levels of the fair valuehierarchy, the level in the fair value hierarchy within which the fair value measurement in its entirety is classified is based on the lowest level input that issignificant to the fair value measurement in its entirety. The Company may utilize both observable and unobservable inputs in determining the fair valuesof financial instruments classified within the Level 3 category.
The determination of classification of its financial instruments within the fair value hierarchy is performed at least quarterly by the Company. For transfersin and out of the levels of the fair value hierarchy, the Company discloses the fair value measurement based on the value immediately preceding the transfer.
The Company's assessment of the significance of a particular input to the fair value measurement in its entirety requires judgment and involvesconsideration of factors specific to the asset or liability. Furthermore, certain techniques used to measure fair value involve some degree of judgment and, as aresult, are not necessarily indicative of the amounts the Company would realize in a current market exchange.
33
Table of Contents
Assets and Liabilities Measured at Fair Value on a Recurring Basis
Assets and liabilities measured at fair value on a recurring basis are as follows (dollars in millions):
Quoted Price inActive Markets
for IdenticalAssets
(Level 1)
SignificantOther
ObservableInputs
(Level 2)
SignificantUnobservable
Inputs (Level 3) Total
Balance at June 30, 2020 Assets Fair value - OCI U.S. Treasury securities $ 9,838 $ — $ — $ 9,838Residential mortgage-backed securities - Agency — 363 — 363Available-for-sale investment securities $ 9,838 $ 363 $ — $ 10,201 Liabilities Fair value - OCI Derivative financial instruments - cash flow hedges(1) $ — $ 5 $ — $ 5 Fair value - Net income Derivative financial instruments - fair value hedges(1) $ — $ 2 $ — $ 2 Balance at December 31, 2019 Assets Fair value - OCI U.S. Treasury securities $ 9,906 $ — $ — $ 9,906Residential mortgage-backed securities - Agency — 417 — 417Available-for-sale investment securities $ 9,906 $ 417 $ — $ 10,323 Liabilities Fair value - OCI Derivative financial instruments - cash flow hedges(1) $ — $ 2 $ — $ 2 Fair value - Net income Derivative financial instruments - fair value hedges(1) $ — $ 4 $ — $ 4Derivative financial instruments - foreign exchange forward contracts(1) $ — $ 1 $ — $ 1
(1) Derivative instrument carrying values in an asset or liability position are presented as part of other assets or accrued expenses and other liabilities, respectively, in the Company's condensed consolidated statements of financialcondition.
Available-for-Sale Investment SecuritiesInvestment securities classified as available-for-sale consist of U.S. Treasury securities and residential mortgage-backed securities. The fair value estimates
of investment securities classified as Level 1, consisting of U.S. Treasury securities, are determined based on quoted market prices for the same securities. TheCompany classifies residential mortgage-backed securities as Level 2, the fair value estimates of which are based on the best information available. This data mayconsist of observed market prices, broker quotes or discounted cash flow models that incorporate assumptions such as benchmark yields, issuer spreads,prepayment speeds, credit ratings and losses, the priority of which may vary based on availability of information.
The Company validates the fair value estimates provided by pricing services primarily by comparison to valuations obtained through other pricing sources.The Company evaluates pricing variances amongst different pricing sources to ensure that the valuations utilized are reasonable. The Company also corroboratesthe reasonableness of the fair value estimates with analysis of trends of significant inputs, such as market interest rate curves. The Company further performs duediligence in understanding the procedures and techniques performed by the pricing services to derive fair value estimates.
34
Table of Contents
At June 30, 2020, amounts reported in residential mortgage-backed securities reflect government-rated obligations issued by Fannie Mae, Freddie Mac andGinnie Mae with a par value of $345 million, a weighted-average coupon of 2.81% and a weighted-average remaining maturity of three years.
Derivative Financial InstrumentsThe Company's derivative financial instruments consist of interest rate swaps and foreign exchange forward contracts. These instruments are classified as
Level 2 as their fair values are estimated using proprietary pricing models, containing certain assumptions based on readily observable market-based inputs,including interest rate curves, option volatility and foreign currency forward and spot rates. In determining fair values, the pricing models use widely acceptedvaluation techniques including discounted cash flow analysis on the expected cash flows of each derivative. This analysis reflects the contractual terms of thederivatives, including the period to maturity and the observable market-based inputs. The fair values of the interest rate swaps are determined using the marketstandard methodology of netting the discounted future fixed cash receipts (or payments) and the discounted expected variable cash payments (or receipts). Thevariable cash payments are based on an expectation of future interest rates derived from the observable market interest rate curves. The Company considerscollateral and master netting agreements that mitigate credit exposure to counterparties in determining the counterparty credit risk valuation adjustment. The fairvalues of the currency instruments are valued comparing the contracted forward exchange rate pertaining to the specific contract maturities to the current marketexchange rate.
The Company validates the fair value estimates of interest rate swaps primarily through comparison to the fair value estimates computed by thecounterparties to each of the derivative transactions. The Company evaluates pricing variances amongst different pricing sources to ensure that the valuationsutilized are reasonable. The Company also corroborates the reasonableness of the fair value estimates with analysis of trends of significant inputs, such as marketinterest rate curves. The Company performs due diligence in understanding the impact to any changes to the valuation techniques performed by proprietary pricingmodels prior to implementation, working closely with the third-party valuation service and reviews the control objectives of the service at least annually. TheCompany corroborates the fair value of foreign exchange forward contracts through independent calculation of the fair value estimates.
Assets and Liabilities Measured at Fair Value on a Non-Recurring BasisThe Company also has assets that under certain conditions are subject to measurement at fair value on a non-recurring basis. These assets include those
associated with acquired businesses, including goodwill and other intangible assets. For these assets, measurement at fair value in periods subsequent to the initialrecognition of the assets is applicable if one or more of the assets is determined to be impaired. The Company had $59 million of impairments related to theseassets during the three months ended June 30, 2020. See Note 5: Intangible Assets for more information on the impact of COVID-19 on intangible assets.
35
Table of Contents
Financial Instruments Measured at Other Than Fair Value
The following tables disclose the estimated fair value of the Company's financial assets and financial liabilities that are not required to be carried at fairvalue (dollars in millions):
Net loan receivables $ — $ — $ 88,833 $ 88,833 $ 80,743 Carrying value approximates fair value(1) Cash and cash equivalents $ 15,138 $ — $ — $ 15,138 $ 15,138Restricted cash $ 29 $ — $ — $ 29 $ 29Other short-term investments $ 2,549 $ — $ — $ 2,549 $ 2,549Accrued interest receivables(2) $ — $ 977 $ — $ 977 $ 977 Liabilities Amortized cost Time deposits(3) $ — $ 34,303 $ — $ 34,303 $ 33,366Short-term borrowings $ — $ — $ — $ — $ — Long-term borrowings - owed to securitization investors $ — $ 12,701 $ 144 $ 12,845 $ 12,766Other long-term borrowings — 11,157 — 11,157 10,428Long-term borrowings $ — $ 23,858 $ 144 $ 24,002 $ 23,194 Carrying value approximates fair value(1) Accrued interest payables(2) $ — $ 255 $ — $ 255 $ 255 (1) The carrying values of these assets and liabilities approximate fair value due to the nature of their liquidity (i.e., due or payable in less than one year).(2) Accrued interest receivable and payable carrying values are presented as part of other assets or accrued expenses and other liabilities, respectively, in the Company's condensed consolidated statements of financial condition.(3) Excludes deposits without contractually defined maturities for all periods presented.
36
Table of Contents
The following tables disclose the estimated fair value of the Company's financial assets and financial liabilities that are not required to be carried at fairvalue (dollars in millions):
(1) The carrying values of these assets and liabilities approximate fair value due to the nature of their liquidity (i.e., due or payable in less than one year).(2) Accrued interest receivable and payable carrying values are presented as part of other assets or accrued expenses and other liabilities, respectively, in the Company's condensed consolidated statements of financial condition.(3) Excludes deposits without contractually defined maturities for all periods presented.
16. Derivatives and Hedging ActivitiesThe Company uses derivatives to manage its exposure to various financial risks. The Company does not enter into derivatives for trading or speculative
purposes. Certain derivatives used to manage the Company's exposure to foreign currency are not designated as hedges and do not qualify for hedge accounting.
Derivatives may give rise to counterparty credit risk, which generally is addressed through collateral arrangements as described under the sub-heading "—Collateral Requirements and Credit-Risk Related Contingency Features." The Company enters into derivative transactions with established dealers that meetminimum credit criteria established by the Company. All counterparties must be pre-approved prior to engaging in any transaction with the Company.Counterparties are monitored on a regular basis by the Company to ensure compliance with the Company's risk policies and limits. In determining the counterpartycredit risk valuation adjustment for the fair values of derivatives, the Company considers collateral and legally enforceable master netting agreements that mitigatecredit exposure to related counterparties.
All derivatives are recorded in other assets at their gross positive fair values and in accrued expenses and other liabilities at their gross negative fair values.See Note 15: Fair Value Measurements for a description of the valuation methodologies of derivatives. Cash collateral amounts associated with derivative positionsthat are cleared through an exchange are legally characterized as settlement of the derivative positions. Such collateral amounts are reflected as offsets to theassociated derivatives balances recorded in other assets or in accrued expenses and other liabilities. Other cash collateral posted and held balances are recorded inother assets and deposits, respectively, in the condensed consolidated statements of
37
Table of Contents
financial condition. Collateral amounts recorded in the condensed consolidated statements of financial condition are based on the net collateral posted or heldposition for each applicable legal entity's master netting arrangement with each counterparty.
Derivatives Designated as HedgesDerivatives designated and qualifying as a hedge of the exposure to variability in expected future cash flows arising from changes in interest rates, or other
types of forecasted transactions, are considered cash flow hedges. Derivatives designated and qualifying as a hedge of the exposure to changes in the fair value ofan asset, liability, or firm commitment attributable to a particular risk, such as interest rate risk, are considered fair value hedges.
Cash Flow HedgesThe Company uses interest rate swaps to manage its exposure to changes in interest rates related to future cash flows resulting from interest payments on
credit card securitized debt and deposits. The Company's outstanding cash flow hedges are for an initial maximum period of seven years for deposits. Thederivatives are designated as hedges of the risk of changes in cash flows on the Company's Federal Funds rate-based interest payments, and qualify for hedgeaccounting in accordance with ASC Topic 815, Derivatives and Hedging ("ASC 815").
The change in the fair value of derivatives designated as cash flow hedges is recorded in OCI and is subsequently reclassified into earnings in the period thatthe hedged forecasted cash flows affect earnings. Amounts reported in AOCI related to derivatives at June 30, 2020 will be reclassified to interest expense asinterest payments are accrued on certain of the Company's floating-rate securitized debt and deposits. During the next 12 months, the Company estimates it willreclassify $7 million of pretax expense to interest expense related to its derivatives designated as cash flow hedges.
Fair Value HedgesThe Company is exposed to changes in fair value of its fixed-rate debt obligations due to changes in interest rates. The Company uses interest rate swaps to
manage its exposure to changes in fair value of certain fixed-rate long-term borrowings, including securitized debt and bank notes, attributable to changes inLIBOR or OIS rate, benchmark interest rates as defined by ASC 815. These interest rate swaps qualify as fair value hedges in accordance with ASC 815. Changesin both (i) the fair values of the derivatives and (ii) the hedged long-term borrowings and deposits relating to the risk being hedged are recorded in interest expense.The changes generally provide substantial offset to one another, with any difference in interest expense.
Derivatives Not Designated as Hedges
Foreign Exchange Forward ContractsThe Company has foreign exchange forward contracts that are economic hedges and are not designated as accounting hedges. The Company enters into
foreign exchange forward contracts to manage foreign currency risk. Changes in the fair value of these contracts are recorded in other income.
Derivatives Cleared Through an ExchangeThe legal characterization of cash variation margin payments on derivatives cleared through an exchange are legally considered settlement payments and are
accounted for with corresponding derivative positions as one unit of account and not separately as collateral. With settlement payments on derivative positionscleared through this exchange reflected as offsets to the associated derivative asset and liability balances, the fair values of derivative instruments and collateralbalances shown are generally reduced.
38
Table of Contents
Derivatives Activity
The following table summarizes the fair value (including accrued interest) and outstanding notional amounts of derivative instruments and related collateralbalances (dollars in millions):
June 30, 2020 December 31, 2019
NotionalAmount
Number ofOutstandingDerivativeContracts Derivative Assets
Total gross derivative assets/liabilities(2) — 7 — 7
Less: collateral held/posted(3) — (7) — (7)
Total net derivative assets/liabilities $ — $ — $ — $ —
(1) The foreign exchange forward contracts have notional amounts of EUR 6 million, GBP 6 million, SGD 1 million and INR 596 million as of June 30, 2020 and notional amounts of EUR 9 million, GBP 14 million, SGD 1 millionand INR 596 million as of December 31, 2019.
(2) In addition to the derivatives disclosed in the table, the Company enters into forward contracts to purchase when-issued mortgage-backed securities as part of its community reinvestment initiatives. At June 30, 2020, the Companyhad one outstanding contracts with a total notional amount of $13 million and immaterial fair value. At December 31, 2019, the Company had two outstanding contracts with a total notional amount of $42 million and immaterialfair value.
(3) Collateral amounts, which consist of both cash and investment securities, are limited to the related derivative asset/liability balance and do not include excess collateral received/pledged.
The following amounts were recorded on the statements of financial condition related to cumulative basis adjustment for fair value hedges (dollars inmillions): June 30, 2020 December 31, 2019
Carrying Amount of
Hedged Assets/Liabilities
Cumulative Amount of FairValue Hedging AdjustmentIncreasing (Decreasing) the
Carrying Amount ofHedged Assets/Liabilities
Carrying Amount ofHedged Assets/Liabilities
Cumulative Amount of FairValue Hedging AdjustmentIncreasing (Decreasing) the
Carrying Amount of HedgedAssets/Liabilities
Long-term borrowings $ 13,836 $ 398 $ 14,244 $ 13
39
Table of Contents
The following table summarizes the impact of the derivative instruments on income and indicates where within the condensed consolidated financialstatements such impact is reported (dollars in millions):
Location and Amount of (Losses) Gains Recognized in Income
Interest Expense
Deposits
Long-TermBorrowings
Other Income
For the Three Months Ended June 30, 2020
Total amounts of income and expense line items presented in the statements of income in which the effects of fair value orcash flow hedges are recorded $ (340)
$ (142)
$ 14
The effects of cash flow and fair value hedging
Losses on cash flow hedging relationship
Amounts reclassified from OCI into earnings $ (4)
$ (1)
$ —
Gains on fair value hedging relationship
Gains on hedged items $ —
$ 11
$ —
Gains on interest rate swaps —
38
—
Total gains on fair value hedges $ — $ 49
$ —
For the Three Months Ended June 30, 2019
Total amounts of income and expense line items presented in the statements of income in which the effects of fair value orcash flow hedges are recorded $ (401)
$ (244)
$ 22
The effects of cash flow and fair value hedging
Gains on cash flow hedging relationship
Amounts reclassified from OCI into earnings $ 1
$ 1
$ —
(Losses) gains on fair value hedging relationship
Losses on hedged items $ —
$ (85)
$ —
Gains on interest rate swaps —
74
—
Total losses on fair value hedges $ — $ (11)
$ —
40
Table of Contents
The following table summarizes the impact of the derivative instruments on income and indicates where within the condensed consolidated financialstatements such impact is reported (dollars in millions):
Location and Amount of (Losses) Gains Recognized in Income
Interest Expense
Deposits
Long-TermBorrowings
Other Income
For the Six Months Ended June 30, 2020
Total amounts of income and expense line items presented in the statements of income in which the effects of fair value orcash flow hedges are recorded $ (713)
$ (353)
$ 42
The effects of cash flow and fair value hedging
Losses on cash flow hedging relationship
Amounts reclassified from OCI into earnings $ (5)
$ (2)
$ —
(Losses) gains on fair value hedging relationship
Losses on hedged items $ —
$ (385)
$ —
Gains on interest rate swaps —
443
—
Total gains on fair value hedges $ — $ 58
$ —
The effects of derivatives not designated in hedging relationships
Gains on derivatives not designated as hedges $ —
$ —
$ 1
For the Six Months Ended June 30, 2019
Total amounts of income and expense line items presented in the statements of income in which the effects of fair value orcash flow hedges are recorded $ (787)
$ (490)
$ 50
The effects of cash flow and fair value hedging
Gains on cash flow hedging relationship
Amounts reclassified from OCI into earnings $ 2
$ 3
$ —
(Losses) gains on fair value hedging relationship
Losses on hedged items $ —
$ (140)
$ —
Gains on interest rate swaps —
116
—
Total losses on fair value hedges $ — $ (24)
$ —
For the impact of the derivative instruments on OCI, see Note 9: Accumulated Other Comprehensive Income.
Collateral Requirements and Credit-Risk Related Contingency FeaturesThe Company has master netting arrangements and minimum collateral posting thresholds with its counterparties for its fair value and cash flow hedge
interest rate swaps and foreign exchange forward contracts. The Company has not sought a legal opinion in relation to the enforceability of its master nettingarrangements and, as such, does not report any of these positions on a net basis. Collateral is required by either the Company or its subsidiaries or the counterpartydepending on the net fair value position of these derivatives held with that counterparty. The Company may also be required to post collateral with a counterpartyfor its fair value and cash flow hedge interest rate swaps depending on the credit rating it or Discover Bank receives from specified major credit rating agencies.These collateral receivable or payable amounts are generally not offset against the fair value of these derivatives, but are recorded separately in other assets or
deposits. Most of the Company's cash collateral amounts relate to positions cleared through an exchange and are reflected as offsets to the associated derivativesbalances recorded in other assets and accrued expenses and other liabilities.
At June 30, 2020, Discover Bank's credit rating met specified thresholds set by its counterparties. However, if its credit rating is reduced below investmentgrade, Discover Bank would be required to post additional collateral. The amount of
41
Table of Contents
additional collateral as of June 30, 2020 would have been $20 million. DFS (Parent Company) had no outstanding derivatives as of June 30, 2020, and therefore,no collateral was required.
The Company also has agreements with certain of its derivative counterparties that contain a provision where if the Company defaults on any of itsindebtedness, including default where repayment of the indebtedness has not been accelerated by the lender, then the Company could also be declared in default onits derivative obligations.
17. Segment DisclosuresThe Company's business activities are managed in two segments: Direct Banking and Payment Services.
• Direct Banking: The Direct Banking segment includes Discover-branded credit cards issued to individuals on the Discover Network and otherconsumer products and services, including private student loans, personal loans, home equity loans, and other consumer lending and deposit products.The majority of Direct Banking revenues relate to interest income earned on the segment's loan products. Additionally, the Company's credit cardproducts generate substantially all revenues related to discount and interchange, protection products and loan fee income.
• Payment Services: The Payment Services segment includes PULSE, an automated teller machine, debit and electronic funds transfer network; DinersClub, a global payments network; and the Company's Network Partners business, which provides payment transaction processing and settlementservices on the Discover Network. The majority of Payment Services revenues relate to transaction processing revenue from PULSE and royalty andlicensee revenue from Diners Club.
The business segment reporting provided to and used by the Company's chief operating decision maker is prepared using the following principles andallocation conventions:
• The Company aggregates operating segments when determining reportable segments.
• Corporate overhead is not allocated between segments; all corporate overhead is included in the Direct Banking segment.
• Through its operation of the Discover Network, the Direct Banking segment incurs fixed marketing, servicing and infrastructure costs that are notspecifically allocated among the segments, with the exception of an allocation of direct and incremental costs driven by the Company's PaymentServices segment.
• The assets of the Company are not allocated among the operating segments in the information reviewed by the Company's chief operating decisionmaker.
• The revenues of each segment are derived from external sources. The segments do not earn revenue from intercompany sources.
• Income taxes are not specifically allocated between the operating segments in the information reviewed by the Company's chief operating decisionmaker.
42
Table of Contents
The following table presents segment data (dollars in millions):
Direct
Banking PaymentServices Total
For the Three Months Ended June 30, 2020
Interest income
Credit card loans $ 2,173 $ — $ 2,173
Private student loans 182 — 182
Personal loans 231 — 231
Other 86 — 86
Total interest income 2,672 — 2,672
Interest expense 482 — 482
Net interest income 2,190 — 2,190
Provision for credit losses 2,046 — 2,046
Other income 354 118 472
Other expense 982 95 1,077
(Loss) income before income taxes $ (484) $ 23 $ (461)
For the Three Months Ended June 30, 2019
Interest income
Credit card loans $ 2,396 $ — $ 2,396
Private student loans 203 — 203
Personal loans 241 — 241
Other 136 1 137
Total interest income 2,976 1 2,977
Interest expense 645 — 645
Net interest income 2,331 1 2,332
Provision for credit losses(1) 787 — 787
Other income 436 84 520
Other expense 1,039 39 1,078
Income before income taxes $ 941 $ 46 $ 987
(1) Prior to adoption of ASU No. 2016-13 on January 1, 2020, credit losses were estimated using the incurred loss approach.
43
Table of Contents
The following table presents segment data (dollars in millions):
Direct
Banking PaymentServices Total
For the Six Months Ended June 30, 2020
Interest income
Credit card loans $ 4,589 $ — $ 4,589
Private student loans 387 — 387
Personal loans 485 — 485
Other 193 — 193
Total interest income 5,654 — 5,654
Interest expense 1,066 — 1,066
Net interest income 4,588 — 4,588
Provision for credit losses 3,853 — 3,853
Other income 720 242 962
Other expense 2,100 136 2,236
(Loss) income before income tax expense $ (645) $ 106 $ (539)
For the Six Months Ended June 30, 2019
Interest income
Credit card loans $ 4,758 $ — $ 4,758
Private student loans 408 — 408
Personal loans 478 — 478
Other 269 1 270
Total interest income 5,913 1 5,914
Interest expense 1,277 — 1,277
Net interest income 4,636 1 4,637
Provision for credit losses(1) 1,596 — 1,596
Other income 808 170 978
Other expense 2,028 74 2,102
Income before income tax expense $ 1,820 $ 97 $ 1,917
(1) Prior to adoption of ASU No. 2016-13 on January 1, 2020, credit losses were estimated using the incurred loss approach.
44
Table of Contents
18. Revenue from Contracts with CustomersASC Topic 606, Revenue from Contracts with Customers ("ASC 606"), generally applies to the sales of any good or service for which no other specific
accounting guidance is provided. ASC 606 defines a principles-based model under which revenue from a contract is allocated to the distinct performanceobligations within the contract and recognized in income as each performance obligation is satisfied. The Company's revenue that is subject to this model includesdiscount and interchange, protection products fees, transaction processing revenue and amounts classified as other income.
The following table presents revenue from contracts with customers disaggregated by business segment and reconciles revenue from contracts withcustomers to total other income (dollars in millions):
Total other income subject to ASC 606(2) 334 84 418
Other income not subject to ASC 606
Loan fee income 102 — 102
Gains on equity investments — — —
Total other income not subject to ASC 606 102 — 102
Total other income by operating segment $ 436 $ 84 $ 520
(1) Net of rewards, including Cashback Bonus rewards, of $385 million and $460 million for the three months ended June 30, 2020 and 2019, respectively.(2) Excludes $1 million and $1 million of deposit product fees that are reported within net interest income for the three months ended June 30, 2020 and 2019, respectively.
45
Table of Contents
The following table presents revenue from contracts with customers disaggregated by business segment and reconciles revenue from contracts withcustomers to total other income (dollars in millions):
Total other income subject to ASC 606(2) 602 170 772
Other income not subject to ASC 606
Loan fee income 206 — 206
Gains on equity investments — — —
Total other income not subject to ASC 606 206 — 206
Total other income by operating segment $ 808 $ 170 $ 978
(1) Net of rewards, including Cashback Bonus rewards, of $863 million and $906 million for the six months ended June 30, 2020 and 2019, respectively.(2) Excludes $1 million and $2 million of deposit product fees that are reported within net interest income for the six months ended June 30, 2020 and 2019, respectively.
For a detailed description of the Company's significant revenue recognition accounting policies, see Note 2: Summary of Significant Accounting Policies tothe consolidated financial statements of the Company's annual report on Form 10-K for the year ended December 31, 2019.
19. Subsequent EventsThe Company has evaluated events and transactions that have occurred subsequent to June 30, 2020 and determined that there were no subsequent events
that would require recognition or disclosure in the condensed consolidated financial statements.
46
Table of Contents
Item 2. Management's Discussion and Analysis of Financial Condition and Results of OperationsThe following discussion and analysis of our financial condition and results of operations should be read in conjunction with our condensed consolidated
financial statements and related notes included elsewhere in this quarterly report. This quarterly report contains forward-looking statements within the meaning ofthe Private Securities Litigation Reform Act of 1995. Such statements, which speak to our expected business and financial performance, among other matters,contain words such as "believe," "expect," "anticipate," "intend," "plan," "aim," "will," "may," "should," "could," "would," "likely," and similar expressions. Suchstatements are based upon the current beliefs and expectations of our management and are subject to significant risks and uncertainties. Actual results may differmaterially from those set forth in the forward-looking statements. These forward-looking statements speak only as of the date of this quarterly report, and there isno undertaking to update or revise them as more information becomes available.
The following factors, among others, could cause actual results to differ materially from those set forth in the forward-looking statements: the effect of thecoronavirus disease 2019 ("COVID-19") pandemic and measures taken to mitigate the pandemic, including their impact on our credit quality and businessoperations as well as their impact on general economic and financial markets, changes in economic variables, such as the availability of consumer credit, thehousing market, energy costs, the number and size of personal bankruptcy filings, the rate of unemployment, the levels of consumer confidence and consumer debtand investor sentiment; the impact of current, pending and future legislation, regulation, supervisory guidance and regulatory and legal actions, including, but notlimited to, those related to financial regulatory reform, consumer financial services practices, anti-corruption and funding, capital and liquidity; the actions andinitiatives of current and potential competitors; our ability to manage our expenses; our ability to successfully achieve card acceptance across our networks andmaintain relationships with network participants; our ability to sustain and grow our private student loan, personal loan and home equity loan products; difficultyobtaining regulatory approval for, financing, transitioning, integrating or managing the expenses of acquisitions of or investments in new businesses, products ortechnologies; our ability to manage our credit risk, market risk, liquidity risk, operational risk, legal and compliance risk and strategic risk; the availability andcost of funding and capital; access to deposit, securitization, equity, debt and credit markets; the impact of rating agency actions; the level and volatility of equityprices, commodity prices and interest rates, currency values, investments, other market fluctuations and other market indices; losses in our investment portfolio;limits on our ability to pay dividends and repurchase our common stock; limits on our ability to receive payments from our subsidiaries; fraudulent activities ormaterial security breaches of key systems; our ability to remain organizationally effective; our ability to increase or sustain Discover card usage or attract newcustomers; our ability to maintain relationships with merchants; the effect of political, economic and market conditions, geopolitical events and unforeseen orcatastrophic events; our ability to introduce new products and services; our ability to manage our relationships with third-party vendors; our ability to maintaincurrent technology and integrate new and acquired systems; our ability to collect amounts for disputed transactions from merchants and merchant acquirers; ourability to attract and retain employees; our ability to protect our reputation and our intellectual property; and new lawsuits, investigations or similar matters orunanticipated developments related to current matters. We routinely evaluate and may pursue acquisitions of or investments in businesses, products, technologies,loan portfolios or deposits, which may involve payment in cash or our debt or equity securities.
Additional factors that could cause our results to differ materially from those described below can be found in this section and in "Item 1A. Risk Factors" inPart II of this quarterly report and in "Risk Factors," "Business — Competition," "Business — Supervision and Regulation" and "Management's Discussion andAnalysis of Financial Condition and Results of Operations" in our annual report on Form 10-K for the year ended December 31, 2019, which is filed with the SECand available at the SEC's internet site (https://www.sec.gov).
Introduction and OverviewDiscover Financial Services ("DFS") is a direct banking and payment services company. We provide direct banking products and services and payment
services through our subsidiaries. We offer our customers credit card loans, private student loans, personal loans, home equity loans and deposit products. We alsooperate the Discover Network, the PULSE network ("PULSE") and Diners Club International ("Diners Club"). The Discover Network processes transactions forDiscover-branded credit and debit cards and provides payment transaction processing and settlement services. PULSE operates an electronic funds transfernetwork, providing financial institutions issuing debit cards on the PULSE network with access to ATMs domestically and internationally, as well as merchantacceptance throughout the U.S. for debit card transactions. Diners Club is a global payments network of licensees, which are generally financial institutions, thatissue Diners Club branded charge cards and/or provide card acceptance services.
47
Table of Contents
Our primary revenues consist of interest income earned on loan receivables and fees earned from customers, financial institutions, merchants and issuers.The primary expenses required to operate our business include funding costs (interest expense), credit loss provisions, customer rewards and expenses incurred togrow, manage and service our loan receivables and networks. Our business activities are funded primarily through consumer deposits, securitization of loanreceivables and the issuance of unsecured debt.
Measurement of Credit Losses on Financial Instruments became effective for us on January 1, 2020. The standard significantly amended accounting principlesgenerally accepted in the United States by replacing the incurred loss model with the current expected credit loss ("CECL") approach. The CECL approachrequires our allowance for credit losses to be based on an estimate of all anticipated credit losses over the remaining expected life of all of the loans, as opposed toan estimate of incurred losses as of the balance sheet date. For additional information on CECL, see Note 1: Background and Basis of Presentation to ourcondensed consolidated financial statements.
The ASU required modified-retrospective application, meaning a cumulative-effect adjustment was recorded on January 1, 2020 without adjustingcomparative prior periods. This cumulative-effect adjustment did not reflect the economic disruption resulting from COVID-19 since the global disruptionoccurred subsequent to January 1, 2020. As a result of adoption, we recorded:
• A $2.5 billion increase to the allowance for credit losses on loan receivables primarily representing the adjustment for recording reserves for expectedlosses, not simply those deemed to be already incurred, and extending the loss estimate period over the entire life of the loan;
• A $0.6 billion increase to other assets related to deferred tax assets on the larger allowance for credit losses;
• An offsetting $1.9 billion decrease, net of tax, to the opening balance of retained earnings; and
• Immaterial adjustments to the following:
◦ The carrying value of PCD loans and related accrued interest reflected in other assets; and
◦ Accrued expenses and other liabilities to record reserves for unfunded commitments.
As required by the ASU, financial statement results and balances prior to January 1, 2020 have not been retrospectively adjusted to reflect the amendmentsin ASU No. 2016-13. Therefore, current period results and balances are not comparable to prior period amounts, particularly with regard to the provision andallowance for credit losses (and their related subtotals).
Additional Information for ComparabilityIn order to help investors understand our year-over-year performance, we are providing adjusted prior year allowance for credit losses and related allowance
build figures using the CECL approach for comparative purposes. These adjusted prior year figures are non-GAAP financial measures and should be viewed inaddition to, not as a substitute for, our reported results. We believe that these adjusted figures are useful to investors since credit losses were estimated using theincurred loss approach prior to adoption of ASU No. 2016-13 on January 1, 2020. The adjusted allowance and related build figures provide investors withcomparable amounts to understand our results.
48
Table of Contents
The following table provides a reconciliation of prior year allowance for credit losses figures as reported (using the incurred loss approach) to adjustedallowance for credit losses using the CECL approach, as well as related allowance build figures (dollars in millions):
Allowance build - as reported (incurred)(2) $ 84 $ 97 $ 68 $ 93 Allowance build - as adjusted (CECL)(3) $ 105 $ 137 $ 60 $ 125 (1) Represents adjustment for recording reserves for expected losses, not simply those deemed to be already incurred, and extending the loss estimate period over the entire life of the loan.(2) Calculated as the change in the allowance for credit losses as reported using the incurred loss approach.(3) Calculated as the change in the allowance for credit losses as adjusted using the CECL approach.
Refer to "— Critical Accounting Estimates — Allowance for Credit Losses on Loan Receivables" for more details on our estimation process and keyassumptions requiring significant judgment and to "— Loan Quality — Provision and Allowance for Credit Losses" for discussion of drivers of current periodchanges in the allowance for credit losses.
COVID-19 Pandemic Response and ImpactThe COVID-19 pandemic has continued to have a widespread and unprecedented impact on a global scale. The health crisis continues to have a severe
effect on the economy. The impact of COVID-19 continues to evolve rapidly, its future effects are uncertain, and it may be difficult to assess or predict the extentof the impacts of the pandemic on us as many factors are beyond our control and knowledge. For a discussion of the risks we face with respect to the COVID-19pandemic, the associated economic uncertainty, the steps taken to mitigate the pandemic and the resulting economic contraction, see "Item 1A — Risk Factors" inPart II of this quarterly report on Form 10-Q, which should be read in conjunction with the risk factors disclosed in our annual report on Form 10-K for the yearended December 31, 2019. This section includes a discussion of significant areas of potential impact on us of the COVID-19 pandemic and certain actions we aretaking or expect to take in this time of uncertainty caused by the COVID-19 pandemic.
Outlook and Financial ResultsDuring the first half of the year, the pandemic has adversely impacted our financial results, specifically in the decrease in sales volume and credit card loan
growth as well as the increase in our estimate of life of loan expected credit losses. As previously disclosed in the first quarter Form 10-Q, we continue to executeon our strategy to implement approximately $400 million of cost reductions off of previously provided guidance from the fourth quarter 2019 earnings release,targeting areas such as account acquisition costs and marketing expenses, due to the economic environment and the resulting pressure on earnings for theremainder of the year. Outbreaks of COVID-19 have resulted in state and local governments implementing, and in some cases re-implementing, measures to try tocontain the virus such as travel bans and restrictions, shutdowns and quarantines. We anticipate these measures as well as the related economic uncertainty willcontinue to negatively impact consumer and business spending habits and the consumer credit environment, including the ability of consumers to repay their loans.While certain parts of the U.S. have begun to lift these measures, the re-emergence of COVID-19 has and may continue to result in governments re-imposingrestrictions that may remain in place for a significant period of time. The economic uncertainty associated with COVID-19 and the measures taken to limit itsspread have and will likely continue to adversely affect our business, results of operations and financial condition.
Regulatory and LegislativeFederal, state and local governments, including the U.S. Congress, the Executive Branch, and banking agencies have taken extraordinary measures to
support the U.S. economy and mitigate the effects of the COVID-19 pandemic and the impact of measures taken to slow its spread. These policies have includedefforts to provide regulatory relief and flexibility to financial institutions, liquidity to capital markets and mandates to support businesses and consumers, includingstimulus checks, payment forbearance, and other forms of assistance. Lawmakers will likely continue to offer additional proposals as the situation evolves in anattempt to mitigate harm to the economy and consumers. It is too early to determine the overall
49
Table of Contents
effectiveness of actions that have been taken and their ultimate impact on our business, results of operations and financial condition. For more information, see “—Regulatory Environment and Developments” below.
Loan ReceivablesIn our loan portfolio, we continue to lend to customers, but have tightened standards for new accounts and for growing existing accounts. Currently, we are
providing support to our customers impacted by COVID-19 across all of our loan products, expanding payment plans notably through skip-a-pay programs, to helpour customers during this period of economic difficulty. Skip-a-pay programs were intended to be a short-term option and we plan to end program enrollments inthe near future. After that, we will continue to offer assistance to those who qualify on a customer-by-customer basis. We have materially increased our allowancefor credit losses in anticipation of higher credit losses caused by further deterioration in the macroeconomic outlook. The reserve build for the quarter ended June30, 2020 took into account our best estimate for the impact of programs put in place by federal and state governments and agencies to mitigate the economicimpact of the pandemic. It is unclear whether the measures employed to date are complete or whether federal and state governments and agencies may takeadditional action that could impact our business. Refer to "— Loan Quality — Impact of COVID-19 on Loan Quality" for more details on the current periodallowance for credit losses.
Capital and LiquidityWe entered the COVID-19 pandemic with strong capital and liquidity positions, which we believe allows us to maintain normal operations during periods of
financial market stress and disruptions to wholesale and retail funding sources. We believe we have a sufficient reserve of high-quality liquid assets and have beenable to maintain access to diverse funding channels. We continued to see strong demand for our direct-to-consumer and sweep deposit balances as consumerssavings rates have increased and investors sought safer assets. We remain well-capitalized with capital ratios in excess of regulatory minimums and have takenactions to preserve capital such as suspending our share repurchase program. For purposes of calculating regulatory capital, we have elected to defer recognition ofthe estimated impact of CECL on regulatory capital for two years in accordance with the interim final rule announced by Federal banking regulators on March 27,2020. Pursuant to the interim final rule, the estimated impact of CECL on regulatory capital will be phased in over a three-year period beginning in 2022.
For more information on the impact of COVID-19 on liquidity and capital, see "— Liquidity and Capital Resources — Impact of COVID-19 on Liquidityand Capital."
Payment ServicesAs governments across the U.S. and the world have taken steps to minimize the transmission of COVID-19, the number of transactions processed on the
Discover Global Network has declined overall despite increases in certain categories. Certain negatively impacted categories such as travel make up a smallportion of the transactions processed but may have an outsized impact on some of our Diners Club franchisees. The current crisis may result in lasting changes inconsumer payment behaviors, such as a shift from credit to debit, a decline in the use of cash, increasing online sales and rapid adoption of contactless payment.These shifts may result in changes to the Payment Services segment’s results of operations.
Fair Value and ImpairmentsWith the uncertain nature of the pandemic's overall impact to the economy, we continue to assess the impact of COVID-19 with respect to our goodwill and
intangible assets, investment securities and other long-term assets. During the second quarter of 2020, we identified a triggering event due to changes in theinternational travel and entertainment businesses that continue to persist and a declining revenue outlook for the foreseeable future resulting from COVID-19. As aresult, we conducted interim impairment testing of our non-amortizable intangible assets in the Payment Services segment and recognized impairment chargestotaling $59 million. For more information on the impact of COVID-19 on intangible assets, see Note 5: Intangible Assets to our condensed consolidated financialstatements.
Business Continuity and OperationsWe have informed employees that they may continue to work from home and will not be required to return to our physical locations until January 1, 2021,
at the earliest. Notwithstanding the shift to work-from-home, our operations continue largely unaffected due to the successful implementation of certain of ourbusiness continuity plans. Operational changes necessitated by the rapid shift in employee location have not thus far had a material adverse effect on us or our
50
Table of Contents
financial condition; however, the shift has caused us to grow increasingly dependent on third-party service providers, including those with which we have norelationship such as our employees’ internet service providers. For more information on the risks associated with reliance on third-party service providers and theshift to work from home, see our risk factors disclosed in our annual report on Form 10-K for the year ended December 31, 2019 as well as "Item 1A — RiskFactors" in Part II of this quarterly report on Form 10-Q.
Regulatory Environment and DevelopmentsThe COVID-19 pandemic has dramatically impacted the U.S. and global economies. We are working with our customers to address their unique financial
situations, while balancing safety and soundness requirements. We are in contact with our regulators, who have proactively encouraged banks to work withborrowers during this time of stress. Among other things, the federal banking agencies have taken the following actions to proactively address the economicdisruptions caused by the COVID-19 outbreak and provide flexibility for banking organizations to work with impacted businesses and consumers:
• Market Stabilization: The Federal Reserve reduced short-term interest rates to near zero and launched numerous programs and facilities, including theTerm Asset-Backed Securities Loan Facility, to increase market liquidity and promote stability;
• Capital & Liquidity Flexibility: Regulatory agencies issued statements urging banks to use their capital and liquidity buffers to continue lending duringthe crisis;
• CECL: A joint agency interim final rule provided banks, such as Discover, with the option to delay CECL's impact on regulatory capital for two years,followed by three year phase-in of those impacts;
• Flexibility to Work with Consumers: Joint agency guidance encouraged banks to work with borrowers and provided guidelines for prudent reliefprograms, and agencies worked with FASB to provide accounting-classification flexibility for certain short-term loan modifications;
• Pandemic Planning: The Federal Financial Institutions Examination Council released updated guidance to remind banks of actions they should betaking to minimize potential adverse effects of a pandemic on business continuity; and
• Supervisory Flexibility: Regulatory agencies have indicated willingness to work with institutions to provide flexibility and minimize burdens ofsupervisory activities, including extending deadlines for data collections.
In addition to the above regulatory actions, the Coronavirus Aid, Relief, and Economic Security Act ("CARES Act") was signed into law on March 27, 2020to provide relief to U.S. businesses and consumers impacted by the COVID-19 crisis. The CARES Act includes approximately $2 trillion of financial assistance,principally through federal loan programs intended to provide relief to consumers who have suffered job losses and aid businesses that have experienced disruptionas a result of the pandemic. Additionally, the CARES Act provided expanded unemployment benefits and direct payments to impacted consumers and offeredrelief for consumers through changes to credit reporting requirements and mandated forbearance on certain federally backed mortgages and student loans. Specificto financial institutions, the CARES Act provided the option for financial institutions, including Discover, to temporarily suspend certain accounting requirementsrelated to troubled debt restructurings ("TDRs") and delay the effective date of CECL for the duration of the national emergency. See "— Banking — CapitalStandards and Stress Testing" below for more information. It also authorized the Federal Deposit Insurance Corporation ("FDIC") to establish an emergencyguarantee program, which could be used to temporarily increase deposit insurance limits. Additional legislative and regulatory action may be proposed and couldinclude requirements that could significantly impact our business practices. The impact of these legislative and regulatory initiatives on us, the economy and theU.S. consumer will depend upon a wide variety of factors some of which are yet to be identified.
Banking
Capital Standards and Stress TestingDiscover is subject to supervisory stress tests every other year rather than annually and is required to submit annual capital plans to the Federal Reserve and
subject to other core components of the enhanced prudential standards rules, such as risk management and risk committee requirements and liquidity riskmanagement regulations. However, Discover is not required to submit company-run capital stress tests and is no longer subject to the liquidity coverage ratio.
51
Table of Contents
On June 25, 2020, we received results of the Federal Reserve’s supervisory stress tests and preliminary Stress Capital Buffer ("SCB") requirement. Thenotice indicated that Discover’s capital ratios remain above all required minimums under each of the supervisory scenarios and our preliminary SCB requirementwas set at 3.5%, which is expected to be finalized in August and effective beginning October 1, 2020. In addition to the stress test and SCB results, the FederalReserve also notified Discover that it and all other firms that participated in the 2020 Comprehensive Capital Analysis and Review exercise would be required tosubmit a revised capital plan that will be assessed by the Federal Reserve later this year under newly developed scenarios incorporating economic stressesreflecting the ongoing COVID-19 pandemic. In the interim, the Federal Reserve has capped covered firms’ capital distributions based on a formula that restrictsmost share repurchases and limits dividends based on average net income during the past four quarters. Consistent with regulatory expectations, our managementalso continues to conduct forward-looking sensitivity analysis and stress tests to assess the potential impact of economic changes resulting from the COVID-19pandemic on capital planning and provides this information to our Board of Directors as well as our regulators.
LIBOROn July 27, 2017, the UK Financial Conduct Authority announced that it would no longer encourage or compel banks to continue to contribute quotes and
maintain the London Interbank Offered Rate ("LIBOR") after 2021. LIBOR is commonly used as a benchmark to determine interest rates for financial instruments,such as floating-rate asset-backed securities issued by Discover Card Execution Note Trust, and certain financial products, including some of our floating-ratestudent loans. A cross-functional team is overseeing and managing our transition away from the use of LIBOR. This team monitors developments associated withLIBOR alternatives, assesses evolving industry and marketplace norms and conventions for LIBOR indexed instruments, evaluates the impact that the inability todetermine LIBOR after 2021 will have on us, and facilitates the operational changes associated with the use of alternative benchmark rates. On June 4, 2020, theConsumer Financial Protection Bureau (“CFPB”) issued a Notice of Proposed Rulemaking (“NPR”) concerning the anticipated discontinuation of LIBOR. ThisNPR sets forth amendments to Regulation Z, the implementing regulation for the Truth in Lending Act, and includes proposed examples of replacement indices forLIBOR that meet Regulation Z standards for open- and closed-end products. Discover is monitoring the evolution of this NPR and will take into account theprovisions of any related Final Rule in our efforts to transition away from the use of LIBOR.
Consumer Financial ServicesThe CFPB regulates consumer financial products and services, and examines certain providers of consumer financial products and services, including
Discover. The CFPB's authority includes preventing "unfair, deceptive or abusive acts or practices" and ensuring that consumers have access to fair, transparentand competitive financial products and services. The CFPB has rulemaking, supervision and enforcement powers with respect to federal consumer protection laws.Historically, the CFPB's policy priorities focused on several financial products of the type we offer (e.g. credit cards and other consumer lending products). Inaddition, the CFPB is required by statute to undertake certain actions including its bi-annual review of the consumer credit card market. In response to the COVID-19 pandemic, federal banking regulators as well as the CFPB have encouraged banks to work with their borrowers and provided regulatory flexibility, given examflexibility, delayed the Home Mortgage Disclosure Act and other data collections, and promoted other areas for relief. Similar to the banking regulators, wecontinue to be in regular contact with the CFPB as the COVID-19 pandemic evolves. Similarly, we are monitoring the activity in the states and are in contact withstate officials, as necessary, to ensure we are aware of and in compliance with state requirements responding to COVID-19.
Data Security and PrivacyPolicymakers at the federal and state levels remain focused on measures to enhance data security and data breach incident response requirements.
Furthermore, regulations and legislation at various levels of government have been proposed and enacted to augment data privacy standards. For example, theCalifornia Consumer Privacy Act ("CCPA") creates a broad set of privacy rights and remedies modeled in part on the European Union's General Data ProtectionRegulation. The CCPA went into effect on January 1, 2020, and proposed regulations have yet to be finalized. California Attorney General Enforcement for CCPAbegan on July 1, 2020. The original proponent of the CCPA has launched a 2020 California ballot initiative with the goal of expanding the rights and remediescreated by the CCPA, while protecting the new law from future legislative amendments. This initiative will appear on the November 2020 ballot. While it is tooearly to determine the full impact of these developments, they may result in the imposition of requirements on Discover and other providers of consumer financialservices or networks that could adversely affect our businesses.
52
Table of Contents
Payment NetworksThe Dodd-Frank Act contains several provisions impacting the debit card market, including network participation requirements and interchange fee
limitations. The changing debit card environment, including competitor actions related to merchant and acquirer pricing and transaction routing strategies, hasadversely affected, and is expected to continue to adversely affect, our PULSE network's business practices, network transaction volume, revenue and prospects forfuture growth. We continue to closely monitor competitor pricing and technology development strategies in order to assess their impact on our business and oncompetition in the marketplace. Following an inquiry by the U.S. Department of Justice into some of these competitor pricing strategies, PULSE filed a lawsuitagainst Visa in late 2014 with respect to these competitive concerns. The Court granted summary judgment in favor of Visa in August 2018. PULSE filed anappeal on January 17, 2019 and Visa filed their response to the appeal on April 5, 2019. The Fifth Circuit Court of Appeals held a hearing on the appeal on October9, 2019 and will hold an additional hearing on the appeal in the coming months. Visa also faces ongoing merchant litigation as it relates to the underlyinganticompetitive behavior that is the subject of PULSE's case against Visa. In addition, the Dodd-Frank Act's network participation requirements impact PULSE'sability to enter into exclusivity arrangements, which affects PULSE's current business practices and may materially adversely affect its network transaction volumeand revenue.
For more information on how the regulatory and supervisory environment, ongoing enforcement actions and findings, and changes to laws and regulationscould impact our strategies, the value of our assets, or otherwise adversely affect our business see "Risk Factors — Current Economic and RegulatoryEnvironment" in our annual report on Form 10-K year ended December 31, 2019. For more information on recent matters affecting us, see Note 14: Litigation andRegulatory Matters to our condensed consolidated financial statements.
SegmentsWe manage our business activities in two segments, Direct Banking and Payment Services, based on the products and services provided. For a detailed
description of the operations of each segment, as well as the allocation conventions used in our business segment reporting, see Note 17: Segment Disclosures toour condensed consolidated financial statements.
The following table presents segment data (dollars in millions):
For the Three Months Ended June 30, For the Six Months Ended June 30, 2020 2019 2020 2019
Direct Banking
Interest income
Credit card $ 2,173 $ 2,396 $ 4,589 $ 4,758
Private student loans 182 203 387 408
Personal loans 231 241 485 478
Other 86 136 193 269
Total interest income 2,672 2,976 5,654 5,913
Interest expense 482 645 1,066 1,277
Net interest income 2,190 2,331 4,588 4,636
Provision for credit losses(1) 2,046 787 3,853 1,596
Other income 354 436 720 808
Other expense 982 1,039 2,100 2,028
(Loss) income before income taxes (484) 941 (645) 1,820
Payment Services
Net interest income — 1 — 1
Provision for credit losses(1) — — — —
Other income 118 84 242 170
Other expense 95 39 136 74
Income before income taxes 23 46 106 97
Total (loss) income before income taxes $ (461) $ 987 $ (539) $ 1,917
(1) Prior to adoption of ASU No. 2016-13 on January 1, 2020, credit losses were estimated using the incurred loss approach.
53
Table of Contents
The following table presents information on transaction volume (in millions):
For the Three Months Ended June 30, For the Six Months Ended June 30,
(1) Diners Club volume is derived from data provided by licensees for Diners Club branded cards issued outside North America and is subject to subsequent revision or amendment.(2) Represents gross Discover card sales volume on the Discover Network.(3) Represents Discover card activity related to sales net of returns, balance transfers, cash advances and other activity.(4) Represents Discover card activity related to sales net of returns.
Direct BankingOur Direct Banking segment reported pretax losses of $484 million and $645 million, respectively, for the three and six months ended June 30, 2020 as
compared to pretax income of $941 million and $1.8 billion, respectively, for the three and six months ended June 30, 2019.
Net interest income decreased for the three and six months ended June 30, 2020 as compared to the same periods in 2019 primarily driven by lower yieldson credit card loans partially offset by lower funding costs. Interest income decreased during the three and six months ended June 30, 2020 as compared to thesame periods in 2019 as a result of lower yields on credit card loans, which was the result of lower market rates. Interest expense decreased during the three and sixmonths ended June 30, 2020 as compared to the same periods in 2019 due to lower funding costs and lower average market rates.
For the three and six months ended June 30, 2020, the provision for credit losses increased as compared to the same periods in 2019, which, in addition tothe impact of life of loan reserving under CECL, primarily reflects a significant change in economic outlook due to the COVID-19 pandemic. For a detaileddiscussion on provision for credit losses, see "— Loan Quality — Provision and Allowance for Credit Losses."
Total other income decreased for the three and six months ended June 30, 2020 as compared to the same periods in 2019, which was primarily due to adecrease in net discount and interchange revenue and loan fee income. The decrease in discount and interchange revenue was partially offset by a decrease inrewards costs, both of which were the result of lower sales volume due to the impacts of the COVID-19 pandemic. Loan fee income decreased due to lower salesvolume and late fees. Sales volume was lower driven by the COVID-19 impacts. Late fees decreased as a result of lower delinquencies as we continue to workwith our customers through the economic stresses from COVID-19.
Total other expense decreased for the three months ended June 30, 2020 as compared to the same period in 2019, which was primarily due to marketing andbusiness development driven by COVID-19 related expense reductions in brand advertising for card. Total other expense increased for the six months ended June30, 2020 as compared to the same period in 2019, which was primarily due to higher employee compensation and benefits driven by a larger headcount base andhigher average salaries.
54
Table of Contents
Discover card sales volume was $30.7 billion and $64.7 billion, respectively, for the three and six months ended June 30, 2020, which was a decrease of16.2% and 7.0%, respectively, as compared to the same periods in 2019. This volume decline was primarily driven by lower consumer spending as a result ofCOVID-19.
Payment ServicesOur Payment Services segment reported pretax income of $23 million and $106 million, respectively, for the three and six months ended June 30, 2020 as
compared to pretax income of $46 million and $97 million, respectively, for the same periods in 2019. The increase in segment pretax income was primarily due togains on equity investment sales during each quarter. Other expense increased primarily due to a non-cash impairment charge on the Diners Club business of $59million driven by changes in the international travel and entertainment businesses that continue to persist and a declining revenue outlook for the foreseeable futureresulting from COVID-19.
Critical Accounting EstimatesIn preparing our condensed consolidated financial statements in conformity with accounting principles generally accepted in the United States ("GAAP"),
management must make judgments and use estimates and assumptions about the effects of matters that are uncertain. For estimates that involve a high degree ofjudgment and subjectivity, it is possible that different estimates could reasonably be derived for the same period. For estimates that are particularly sensitive tochanges in economic or market conditions, significant changes to the estimated amount from period to period are also possible. Management believes the currentassumptions and other considerations used to estimate amounts reflected in our condensed consolidated financial statements are appropriate. However, if actualexperience differs from the assumptions and other considerations used in estimating amounts in our condensed consolidated financial statements, the resultingchanges could have a material effect on our consolidated results of operations and, in certain cases, could have a material effect on our consolidated financialcondition. Management has identified the estimates related to our allowance for credit losses on loan receivables, the evaluation of goodwill for potentialimpairment and the accrual of income taxes as critical accounting estimates. Discussion of critical accounting estimates related to the evaluation of goodwill forpotential impairment and the accrual of income taxes are discussed in greater detail in our annual report on Form 10-K for the year ended December 31, 2019. Thatdiscussion can be found within "Management's Discussion and Analysis of Financial Condition and Results of Operations — Critical Accounting Estimates."There have not been any material changes in the methods used to formulate these critical accounting estimates related to the evaluation of goodwill for potentialimpairment and the accrual of income taxes from those discussed in our annual report on Form 10-K for the year ended December 31, 2019. Discussion of ourcritical accounting estimate related to our allowance for credit losses on loan receivables, which has been updated for adoption of the CECL approach forestimating losses on January 1, 2020, is discussed below. For more information on CECL adoption, see Note 1: Background and Basis of Presentation to ourcondensed consolidated financial statements.
Allowance for Credit Losses on Loan ReceivablesWe base our allowance for credit losses on several analyses that help us estimate credit losses anticipated over the remaining expected life of loan
receivables as of the balance sheet date. In deriving this estimate, we consider the collectibility of principal, interest and fees associated with our loan receivables.We also consider expected recoveries of amounts that were either previously charged off or are expected to be charged off. Our estimation process includes modelsthat predict customer losses based on risk characteristics and portfolio attributes, macroeconomic variables, and historical data and analysis. There is a significantamount of judgment applied in selecting inputs and analyzing the results produced to determine the allowance. The allowance for credit losses for each loanproduct type is based on: 1) a reasonable and supportable forecast period, 2) a reversion period and 3) a post-reversion period based on historical informationcovering the remaining life of the loan. For credit card loans, we use a modeling framework that includes the following components: 1) probability of default, 2)exposure at default and 3) loss given default, as well as estimated recoveries for estimating expected credit losses. For student loans and personal loans, we usevintage-based models that estimate expected credit losses net of recoveries over the life of the loans. The considerations in these models include past and currentloan performance, loan growth and seasoning, risk management practices, account collection strategies, economic conditions, bankruptcy filings, policy changesand forecasting uncertainties. Given the same information, others may reach different reasonable estimates.
The key assumptions requiring significant judgment in the allowance for credit losses estimate on a quarterly basis include determination of the lengths ofthe reasonable and supportable forecast and reversion periods, as well as the macroeconomic variables selected for use in loss forecast models. The lengths of thereasonable and supportable forecast and reversion periods can vary and are subject to a quarterly assessment that considers the economic outlook and level ofvariability among macroeconomic forecasts. Generally, a straight-line method is used to revert from the reasonable and
55
Table of Contents
supportable forecast period to the post-reversion period, but in certain stressed scenarios, a weighted approach may be deemed more appropriate. The specificmacroeconomic variables most significant to the loss forecast models may change over time, but generally include measures of consumer indebtedness,unemployment, personal income and housing-related metrics.
The overall economic environment directly impacts both the reasonable and supportable forecast and reversion periods, as well as the macroeconomicvariables that are used in the loss forecast models. If management used different assumptions about the economic environment in estimating expected credit losses,the impact to the allowance for credit losses could have a material effect on our consolidated financial condition and results of operations. In addition, if weexperience a rapidly changing economic environment, as experienced recently under the COVID-19 pandemic, the uncertainty around the credit loss forecasts mayincrease, both due to the uncertainty of the economic forecasts and the challenges our models may have in incorporating them. Although the estimation process isbroader than any single macroeconomic variable, some variables have a more significant impact on the allowance for credit losses estimate. One example is amacroeconomic forecast reflecting a 25 basis point change in the Unemployment Rate variable, which could move the card allowance for credit losses estimate byapproximately $190 million. See "— Loan Quality" and Note 3: Loan Receivables to our condensed consolidated financial statements for further details about ourallowance for credit losses.
Earnings Summary
The following table outlines changes in our condensed consolidated statements of income (dollars in millions):
(1) Prior to adoption of ASU No. 2016-13 on January 1, 2020, credit losses were estimated using the incurred loss approach.
56
Table of Contents
Net Interest IncomeThe table that follows this section has been provided to supplement the discussion below and provide further analysis of net interest income and net interest
margin. Net interest income represents the difference between interest income earned on our interest-earning assets and the interest expense incurred to financethose assets. We analyze net interest income in total by calculating net interest margin (net interest income as a percentage of average total loan receivables) andnet yield on interest-earning assets (net interest income as a percentage of average total interest-earning assets). We also separately consider the impact of the levelof loan receivables and the related interest yield and the impact of the cost of funds related to each of our funding sources, along with the income generated by ourliquidity portfolio, on net interest income.
Our interest-earning assets consist of: (i) cash and cash equivalents primarily related to amounts on deposit with the Federal Reserve Bank of Philadelphia,(ii) restricted cash, (iii) other short-term investments, (iv) investment securities and (v) loan receivables. Our interest-bearing liabilities consist primarily ofdeposits, both direct-to-consumer and brokered, and long-term borrowings, including amounts owed to securitization investors. Net interest income is influencedby the following:
• The level and composition of loan receivables, including the proportion of credit card loans to other loans, as well as the proportion of loan receivablesbearing interest at promotional rates as compared to standard rates;
• The credit performance of our loans, particularly with regard to charge-offs of finance charges, which reduce interest income;
• The terms of long-term borrowings and certificates of deposit upon initial offering, including maturity and interest rate;
• The interest rates necessary to attract and maintain direct-to-consumer deposits;
• The level and composition of other interest-earning assets, including our liquidity portfolio and interest-bearing liabilities;
• Changes in the interest rate environment, including the levels of interest rates and the relationships among interest rate indices, such as the prime rate,the Federal Funds rate, interest rate on excess reserves and LIBOR; and
• The effectiveness of interest rate swaps in our interest rate risk management program.
Net interest income decreased for the three and six months ended June 30, 2020 as compared to the same periods in 2019 primarily driven by lower yieldson credit card loans partially offset by lower funding costs. Interest income decreased during the three and six months ended June 30, 2020 as compared to thesame periods in 2019 as a result of lower yields on credit card loans, which was the result of lower market rates. Interest expense decreased during the three and sixmonths ended June 30, 2020 as compared to the same periods in 2019 due to lower funding costs and lower average market rates.
57
Table of Contents
Average Balance Sheet Analysis(dollars in millions) For the Three Months Ended June 30,
2020 2019
Average Balance Yield/Rate Interest Average Balance Yield/Rate Interest
Other long-term borrowings(4) 11,582 4.05% 233 10,822 4.78% 257
Total borrowings 25,106 2.83% 353 26,343 3.75% 490
Total interest-bearing liabilities 98,716 2.17% 1,066 94,377 2.73% 1,277
Other liabilities and stockholders’ equity 14,975 15,898
Total liabilities and stockholders’ equity $ 113,691 $ 110,275
Net interest income $ 4,588 $ 4,637
Net interest margin(6) 10.01% 10.47%
Net yield on interest-earning assets(7) 8.07% 8.59%
Interest rate spread(8) 7.77% 8.23% (1) Average balances of loan receivables include non-accruing loans, which are included in the yield calculations. If the non-accruing loan balances were excluded, there would not be a material impact on the amounts reported above.(2) Interest income on credit card loans includes $76 million and $65 million of amortization of balance transfer fees for the three months ended June 30, 2020 and 2019, respectively, and $158 million and $130 million for the six
months ended June 30, 2020 and 2019, respectively.(3) Prior to adoption of ASU No. 2016-13 on January 1, 2020, credit losses were estimated using the incurred loss approach.(4) Includes the impact of interest rate swap agreements used to change a portion of fixed-rate funding to floating-rate funding.(5) Includes the impact of interest rate swap agreements used to change a portion of floating-rate funding to fixed-rate funding.(6) Net interest margin represents net interest income as a percentage of average total loan receivables.(7) Net yield on interest-earning assets represents net interest income as a percentage of average total interest-earning assets.(8) Interest rate spread represents the difference between the rate on total interest-earning assets and the rate on total interest-bearing liabilities.
59
Table of Contents
Loan QualityImpact of COVID-19 on Loan Quality
COVID-19 and its impact to the economy has had a significant effect on our sales volume and loan growth during the first half of 2020. Also, while wecontinue to lend to customers, we have tightened standards for new accounts and for growing existing accounts.
We continue to provide support to our customers impacted by COVID-19. In response to the pandemic, to complement the assistance already availablethrough our existing programs, we expanded borrower relief offerings to also include skip-a-pay programs and other loan modifications. The accounts using thesemodifications are generally excluded from TDR status either because the concessions are insignificant or they qualify for exemption pursuant to the CARES Act orinteragency guidance.
As of June 30, 2020, we have enrolled approximately 650 thousand customers and $5.2 billion in receivables in skip-a-pay programs in total. Of thosecustomers and receivables, 88 thousand and $1.0 billion, respectively, were still enrolled at quarter-end. We have seen skip-a-pay enrollments in our card portfoliosteadily decrease after peak enrollment during the first week of April. The utilization of skip-a-pay programs has had a favorable impact on reported creditperformance because, pursuant to regulatory guidelines, accounts enrolled in the programs do not advance through delinquency cycles in the same time frame aswould have occurred without the programs. Specifically, current accounts enrolled in the programs do not advance to delinquency, and delinquent accountsenrolled in the programs do not advance to the next delinquency cycle, or to charge-off. At June 30, 2020, our delinquency ratios have been favorably impacted bycustomer usage of the skip-a-pay programs and are lower than comparative periods as a result.
Additionally, due to relief provided by the CARES Act or interagency guidance, certain customer accounts entering loan modification programs during thepandemic were excluded from being reported as TDRs. As a result, fewer modifications were reported as TDRs at June 30, 2020 than otherwise would have been.The table below reflects both the new modifications reported as TDRs and the amount of new modifications excluded from TDR classification as a result ofregulatory relief (dollars in millions):
For the Six Months Ended June 30, 2020
Accounts that entered a program and
were classified as TDRs during the period Accounts excluded from the TDR
designation due to regulatory exemptions
Number ofAccounts Balances
Number ofAccounts Balances
Credit card loans120,702 $ 800 64,408 $ 502
Private student loans1,780 $ 33 1,363 $ 25
Personal loans3,880 $ 51 168 $ 3
Despite the lower delinquency and TDR trends resulting from the relief we are providing to our customers, we believe we have appropriately reflected therisk presented by the accounts using these programs as well as the worsening economic impact of the pandemic on our customers in the allowance for credit losses.The increases in the allowance for credit losses during the first half of 2020 are indicative of the deterioration in consumer credit we expect related to thepandemic. The year-to-date build in the allowance of $4.8 billion is largely comprised of card loans but includes increases across all loan products. Labor markets,historically indicative of trends in credit losses, have been significantly stressed by the pandemic with unemployment reaching unprecedented levels. The higherallowance for credit losses reflects our view of this economic impact on our customers. Refer to Note 3: Loan Receivables to our condensed consolidated financialstatements for more details on modification programs, troubled debt restructurings, and the allowance for credit losses.
60
Table of Contents
Loan receivables consist of the following (dollars in millions):
June 30,
2020 December 31, 2019
Credit card loans $ 70,201 $ 77,181Other loans
Private student loans 9,730 9,653
Personal loans 7,316 7,687
Other 1,680 1,373
Total other loans 18,726 18,713
Total loan receivables 88,927 95,894Allowance for credit losses(1) (8,184) (3,383)
Net loan receivables $ 80,743 $ 92,511
(1) Prior to adoption of ASU No. 2016-13 on January 1, 2020, credit losses were estimated using the incurred loss approach.
Provision and Allowance for Credit LossesProvision for credit losses is the expense related to maintaining the allowance for credit losses at an appropriate level to absorb the estimate of credit losses
anticipated over the remaining expected life of loan receivables at each period end date. In deriving the estimate of expected credit losses, we consider thecollectibility of principal, interest and fees associated with our loan receivables. We also consider expected recoveries of amounts that were either previouslycharged off or are expected to be charged off. Establishing the estimate for expected losses requires significant management judgment. The factors that influencethe provision for credit losses include:
• Increases or decreases in outstanding loan balances, including:
◦ Changes in consumer spending, payment and credit utilization behaviors;
◦ The level of originations and maturities; and
◦ Changes in the overall mix of accounts and products within the portfolio;
• The credit quality of the loan portfolio, which reflects, among other factors, our credit granting practices and the effectiveness of collection efforts;
• The impact of general economic conditions on the consumer, including national and regional conditions, unemployment levels, bankruptcy trends andinterest rate movements;
• The level and direction of historical losses; and
• Regulatory changes or new regulatory guidance.
For more details on how we estimate the allowance for credit losses, refer to "— Critical Accounting Estimates — Allowance for Credit Losses on LoanReceivables" and Note 3: Loan Receivables to our condensed consolidated financial statements.
61
Table of Contents
The following tables provide changes in our allowance for credit losses (dollars in millions): For the Three Months Ended June 30, 2020
Credit Card Student Loans Personal Loans Other Total
Balance at March 31, 2020 $ 5,306 $ 765 $ 807 $ 35 $ 6,913
Additions
Provision for credit losses(1) 1,873 49 114 2 2,038
Deductions
Charge-offs (852) (20) (78) — (950)
Recoveries 164 5 14 — 183
Net charge-offs (688) (15) (64) — (767)
Balance at June 30, 2020 $ 6,491 $ 799 $ 857 $ 37 $ 8,184
For the Three Months Ended June 30, 2019
Credit Card Student Loans Personal Loans Other Total
Balance at March 31, 2019(2) $ 2,622 $ 168 $ 338 $ 6 $ 3,134
Additions
Provision for credit losses(2) 692 15 80 — 787
Deductions
Charge-offs (789) (18) (91) — (898)
Recoveries 166 3 11 — 180
Net charge-offs(3) (623) (15) (80) — (718)
Other(4) — (1) — — (1)
Balance at June 30, 2019(2) $ 2,691 $ 167 $ 338 $ 6 $ 3,202
62
Table of Contents
The following tables provide changes in our allowance for credit losses (dollars in millions): For the Six Months Ended June 30, 2020
Credit Card Student Loans Personal Loans Other Total
Balance at December 31, 2019(2) $ 2,883 $ 148 $ 348 $ 4 $ 3,383
Provision for credit losses(1) 3,312 178 377 9 3,876
Deductions
Charge-offs (1,721) (42) (162) — (1,925)
Recoveries 350 10 29 — 389
Net charge-offs (1,371) (32) (133) — (1,536)
Balance at June 30, 2020 $ 6,491 $ 799 $ 857 $ 37 $ 8,184
For the Six Months Ended June 30, 2019
Credit Card Student Loans Personal Loans Other Total
Balance at December 31, 2018(2) $ 2,528 $ 169 $ 338 $ 6 $ 3,041
Additions
Provision for credit losses(2) 1,402 30 164 — 1,596
Deductions
Charge-offs (1,563) (37) (185) — (1,785)
Recoveries 324 7 21 — 352
Net charge-offs(3) (1,239) (30) (164) — (1,433)
Other(4) — (2) — — (2)
Balance at June 30, 2019(2) $ 2,691 $ 167 $ 338 $ 6 $ 3,202
(1) Excludes an $8 million build and $23 million release of the liability for expected credit losses on unfunded commitments for the three months and six months ended June 30, 2020, respectively, as the liability is recorded in accrued
expenses and other liabilities in our condensed consolidated statements of financial condition.(2) Prior to adoption of ASU No. 2016-13 on January 1, 2020, credit losses were estimated using the incurred loss approach.(3) Prior to adoption of ASU No. 2016-13 on January 1, 2020, net charge-offs on PCD loans generally did not result in a charge to earnings.(4) Net change in reserves on PCD pools having no remaining non-accretable difference (prior to adoption of ASU No. 2016-13 on January 1, 2020).(5) Represents the adjustment to allowance for credit losses as a result of adoption of ASU No. 2016-13 on January 1, 2020.
The allowance for credit losses was $8.2 billion at June 30, 2020, which reflects a $4.8 billion build over the amount of the allowance for credit losses atDecember 31, 2019. The allowance build across all loan products was due to (I) a $2.5 billion cumulative-effect adjustment for the adoption of CECL on January1, 2020 and (II) a $2.3 billion build during the period that primarily reflects an economic outlook with updated assumptions about the impact of the COVID -19pandemic. In estimating the allowance at June 30, 2020, we used a macroeconomic forecast that assumes a peak unemployment rate of 16%, recovering to justunder 11% at the end of 2020 with slow recovery over the next few years, and an annualized real Gross Domestic Product decline of approximately 30% quarter-over-quarter or down approximately 10% on a year-over-year basis. The estimate also contemplated the impact of government stimulus programs and company-initiated loan modification programs on borrower payment behavior. The impact of COVID-19 on the economy has led to uncertainty in assumptions surroundingfactors such as the length and depth of economic stresses and borrower behavior, which required significant management judgment in estimating the allowance forcredit losses.
Company-initiated loan modification programs include those offered specifically in response to COVID-19 as well as existing programs offered tocustomers experiencing difficulty making their payments. In addition to skip-a-pay programs, we have other modification programs that customers have utilizedduring the period related to the pandemic. The accounts using these modifications are generally excluded from TDR status either because the concessions areinsignificant or they qualify for exemption pursuant to the CARES Act or interagency guidance. All modifications are considered as part of the process fordetermining the allowance for credit losses.
At adoption of CECL and at June 30, 2020, the forecast period management deemed to be reasonable and supportable was 18 months. This period decreasedto 12 months at March 31, 2020 due to the uncertainty caused by the rapidly changing
63
Table of Contents
economic environment due to the COVID-19 pandemic. In the second quarter, the reasonable and supportable period was 18 months based on the view that thepresent macroeconomic conditions will last for a longer period than previously expected. For both quarters, the reversion period was 12 months. Since adoption ofCECL, a straight-line method was used to revert to appropriate historical information. During the quarter ended June 30, 2020, the high degree of economic stressled us to apply a weighted reversion method for credit card loans that puts more emphasis on the loss forecast model rather than lower historical losses. At June 30,2020, the reversion method remained straight-line for all other products.
The provision for credit losses is the amount of expense realized after considering the level of net charge-offs in the period and the required amount ofallowance for credit losses at the balance sheet date. For the three and six months ended June 30, 2020, the provision for credit losses increased by $1.3 billion or159%, and $2.3 billion or 143%, respectively, as compared to the same periods in 2019. The allowance build was determined under separate methodologies foreach period, based on the timing of the adoption of ASU No. 2016-13 on January 1, 2020; however, the largest driver of the increase in provision between the twoperiods was the significant change in economic outlook due to the COVID-19 pandemic.
Net Charge-offsOur net charge-offs include the principal amount of losses charged off less principal recoveries and exclude charged-off and recovered interest and fees and
fraud losses. Charged-off and recovered interest and fees are recorded in interest income and loan fee income, respectively, which is effectively a reclassification ofthe provision for credit losses, while fraud losses are recorded in other expense.
The following table presents amounts and rates of net charge-offs of key loan products (dollars in millions):
For the Three Months Ended June 30, For the Six Months Ended June 30,
2020 2019 2020 2019
$ % $ % $ % $ %Credit card loans $ 688 3.90% $ 623 3.49% $ 1,371 3.77% $ 1,239 3.50%Private student loans(1) $ 15 0.62% $ 15 0.61% $ 32 0.65% $ 30 0.64%Personal loans $ 64 3.43% $ 80 4.33% $ 133 3.51% $ 164 4.43% (1) Prior to adoption of ASU No. 2016-13 on January 1, 2020, net charge-offs on PCD loans generally did not result in a charge to earnings.
The net charge-off rate on our credit card loans increased for the three and six months ended June 30, 2020 when compared to the same periods in 2019 dueto seasoning of recent years' loan growth. The net charge-off rate on our private student loans remained relatively flat for the three and six months ended June 30,2020 when compared to the same periods in 2019. The net charge-off rate on our personal loans decreased for the three and six months ended June 30, 2020 whencompared to the same periods in 2019 due to improved underwriting.
64
Table of Contents
DelinquenciesDelinquencies are an indicator of credit quality at a point in time. A loan balance is considered delinquent when contractual payments on the loan become
30 days past due.
The following table presents the amounts and delinquency rates of key loan products that are 30 and 90 days or more delinquent, loans that are not accruinginterest regardless of delinquency, and loans restructured in TDR programs (dollars in millions):
June 30, 2020 December 31, 2019
$ % $ %Loans 30 or more days delinquent
Credit card loans $ 1,523 2.17% $ 2,019 2.62%
Private student loans(1) $ 153 1.57% $ 181 1.88%
Personal loans $ 79 1.07% $ 105 1.37% Loans 90 or more days delinquent
Credit card loans $ 846 1.21% $ 1,020 1.32%
Private student loans(1) $ 40 0.41% $ 45 0.47%
Personal loans $ 27 0.36% $ 31 0.40%
Loans not accruing interest $ 253 0.26% $ 266 0.28%
Loans restructured in TDR programs
Credit card loans(2)(3)(4)
Currently enrolled $ 1,787 2.55% $ 2,108 2.73%
No longer enrolled(5) $ 478 0.68% $ 1,254 1.62%
Total credit card loans $ 2,265 3.23% $ 3,362 4.35%
Private student loans(6) $ 296 3.04% $ 269 2.79%
Personal loans(7) $ 206 2.82% $ 208 2.71% (1) Includes PCD loans for all periods presented.(2) We estimate that interest income recognized on credit card loans restructured in TDR programs was $60 million and $82 million for the three months ended June 30, 2020 and 2019, respectively, and $131 million and $152 million
for the six months ended June 30, 2020 and 2019, respectively. We do not separately track interest income on loans in TDR programs. This amount was estimated by applying an average interest rate to the average loans in thevarious TDR programs.
(3) We estimate that the gross interest income that would have been recorded in accordance with the original terms of credit card loans restructured in TDR programs was $47 million and $50 million for the three months ended June30, 2020 and 2019, respectively, and $101 million and $95 million for the six months ended June 30, 2020 and 2019, respectively. We do not separately track the amount of additional gross interest income that would have beenrecorded if the loans in TDR programs had not been restructured and interest had instead been recorded in accordance with the original terms. This amount was estimated by applying the difference between the average interest rateearned on non-modified loans and the average interest rate earned on loans in the TDR programs to the average loans in the TDR programs.
(4) Credit card loans restructured in TDR programs include $131 million and $184 million at June 30, 2020 and December 31, 2019, respectively, which are also included in loans 90 or more days delinquent.(5) Beginning in 2020, credit card accounts of borrowers that have previously participated in a temporary interest rate reduction program and that have both demonstrated financial stability and had their charging privileges reinstated
at a market-based interest rate, are no longer included in the balance of TDRs.(6) Private student loans restructured in TDR programs include $8 million and $10 million at June 30, 2020 and December 31, 2019, respectively, which are also included in loans 90 or more days delinquent.(7) Personal loans restructured in TDR programs include $7 million at both June 30, 2020 and December 31, 2019, which are also included in loans 90 or more days delinquent.
The 30-day as well as 90-day delinquency rates for credit card loans at June 30, 2020 decreased compared to December 31, 2019 primarily due to the impactof skip-a-pay relief programs. The 30-day and 90-day delinquency rates for private student loans at June 30, 2020 decreased compared to December 31, 2019primarily due to seasonality of the loan portfolio. The 30-day and 90-day delinquency rates for personal loans at June 30, 2020 decreased compared toDecember 31, 2019 as a result of improved underwriting.
The balance of credit card loans reported as TDRs decreased at June 30, 2020 as compared to December 31, 2019 primarily due to customer usage inprograms subject to TDR exclusion in accordance with the CARES Act or interagency guidance. The balance of personal loans reported as TDRs was relativelyflat at June 30, 2020 as compared to December 31, 2019. The balance of private student reported as TDRs increased at June 30, 2020 as compared to December 31,2019 due to continued loan growth and improved awareness of programs available to assist borrowers having difficulties making payment obligations. We plan tocontinue to use TDR programs as we believe they are useful in assisting customers experiencing financial difficulties and allowing them to make timely payments.See Note 3: Loan Receivables to our condensed
65
Table of Contents
consolidated financial statements for further description of our use of TDR programs to provide relief to customers experiencing financial hardship.
Modified and Restructured LoansFor information regarding modified and restructured loans, see "— Delinquencies", "— Impact of COVID-19 on Loan Quality", "— COVID-19 Pandemic
Response and Impact — Loan Receivables" and Note 3: Loan Receivables to our condensed consolidated financial statements.
Other Income
The following table presents the components of other income (dollars in millions):
(1) Net of rewards, including Cashback Bonus rewards, of $385 million and $460 million for the three months ended June 30, 2020 and 2019, respectively, and $863 million and $906 million for the six months ended June 30, 2020
and 2019, respectively.
Total other income decreased for the three and six months ended June 30, 2020 as compared to the same periods in 2019, primarily due to a decrease in netdiscount and interchange revenue and loan fee income, which were partially offset by an increase in gain on equity investments. The decrease in discount andinterchange revenue was partially offset by a decrease in rewards costs, both of which were the result of lower sales volume due to the impacts of the COVID-19pandemic. Loan fee income decreased due to lower sales volume and late fees. Sales volume was lower driven by the COVID-19 impacts. Late fees decreased as aresult of lower delinquencies as we continue to work with our customers through the economic stresses from COVID-19. Gain on equity investments increasedprimarily from a sale during each quarter.
Other Expense
The following table represents the components of other expense (dollars in millions):
Total other expense was relatively flat for the three months ended June 30, 2020 as compared to the same period in 2019. Marketing costs decreasedprimarily driven by COVID-19 related expense reductions in brand advertising for card. This was offset by a non-cash impairment charge (included in Otherexpense), on the Diners Club business within the Payment Services segment, driven by changes in the international travel and entertainment businesses thatcontinue to persist and a declining revenue outlook for the foreseeable future resulting from COVID-19, and higher employee compensation and benefits driven bya larger headcount base and higher average salaries.
66
Table of Contents
Total other expense increased for the six months ended June 30, 2020 as compared to the same period in 2019. The increase was primarily driven by theCOVID-19 related non-cash impairment charge on the Diners Club business discussed above, employee compensation and benefits, and information processingand communications. Employee compensation and benefits increased as a result of a larger headcount base and higher average salaries. The increase in informationprocessing and communications was due to investments in infrastructure. This was offset by a decrease in marketing costs due to COVID-19 related expensereductions in brand advertising for card.
Income Tax Expense
The following table presents the calculation of the effective income tax rate (dollars in millions, except effective income tax rate):
For the Three Months Ended June 30, For the Six Months Ended June 30,
2020 2019 2020 2019(Loss) income before income taxes $ (461) $ 987 $ (539) $ 1,917Income tax (benefit) expense $ (93) $ 234 $ (110) $ 438Effective income tax rate 20.2% 23.8% 20.4% 22.9%
Income tax expense decreased $327 million and $548 million for the three and six months ended June 30, 2020, respectively, as compared to the sameperiods in 2019 due to pretax losses for the current periods. The effective tax rate for the three and six months ended June 30, 2020 is lower due to a lowerprojected pretax income for the full year. We calculate our provision for income taxes during interim reporting periods by applying an estimate of the annualeffective tax rate for the full year to pretax income or loss excluding unusual or infrequent occurring discrete items. We are projecting a lower pretax income forthe full year, therefore the effective tax rate for the full year is lower from the historical annual effective tax rate.
Liquidity and Capital ResourcesImpact of COVID-19 on Liquidity and Capital
We entered the COVID-19 pandemic with strong capital and liquidity positions sized to allow us to maintain normal operations during extended periods offinancial market stress and disruptions to wholesale and retail funding sources. Our reserves of high-quality liquid assets and access to diverse funding channelsallowed us to refrain from issuing debt in disrupted wholesale funding markets and avoid higher funding costs. As market conditions improved, we fortified ourcapital position in June by raising $500 million of Tier 1 capital in the form of perpetual preferred stock. Moreover, our direct-to-consumer and sweep depositbalances increased substantially during the second quarter as investors sought safe haven assets. Consequently, our store of liquid assets increased as the quarterprogressed. We plan to maintain a prudent liquid asset buffer, particularly so long as heightened uncertainty around the macroeconomic and financial operatingenvironment persists.
We remain well-capitalized with capital ratios in excess of regulatory minimums and took prudent actions to preserve capital when the macroeconomic andoperating environment turned uncertain. Of note, we suspended our plans to purchase shares of our common stock and took actions to reduce our exposures tohigher-risk segments of our credit portfolio. We have completed numerous stress tests to assess the impact of a severe economic downturn on our capital andliquidity and maintain ample amounts of both to ensure we remain well-capitalized and funded while continuing to serve our customers and extend specialaccommodations to those who need it.
Funding and LiquidityWe seek to maintain stable, diversified and cost-effective funding sources and a strong liquidity profile in order to fund our business and repay or refinance
our maturing obligations under both normal operating conditions and periods of economic or financial stress. In managing our liquidity risk, we seek to maintain aprudent liability maturity profile and ready access to an ample store of primary and contingent liquidity sources. Our primary funding sources include direct-to-consumer and brokered deposits, public term asset-backed securitizations and other short-term and long-term borrowings. Our primary liquidity sources include aliquidity portfolio comprised of highly liquid, unencumbered assets, including cash and cash equivalents, short term investments and investment securities, andborrowing capacity through private term asset-backed securitizations. In addition, we have unused borrowing capacity with the Federal Reserve discount window,which provides another source of contingent liquidity.
67
Table of Contents
Funding Sources
DepositsWe offer deposit products to customers through two channels: (i) through direct marketing, internet origination and affinity relationships ("direct-to-
consumer deposits"); and (ii) indirectly through contractual arrangements with securities brokerage firms ("brokered deposits"). Direct-to-consumer depositsinclude online savings accounts, certificates of deposit, money market accounts, IRA certificates of deposit and checking accounts, while brokered deposits includecertificates of deposit and sweep accounts. At June 30, 2020, we had $61.1 billion of direct-to-consumer deposits and $16.3 billion of brokered and other deposits.
Credit Card Securitization FinancingWe securitize credit card receivables as a source of funding. We access the asset-backed securitization market using the Discover Card Master Trust I
("DCMT") and the Discover Card Execution Note Trust ("DCENT"), through which we issue DCENT DiscoverSeries notes in both public and private transactions.From time to time, we may add credit card receivables to these trusts to create sufficient funding capacity for future securitizations while managing seller's interest.We retain significant exposure to the performance of trust assets through holdings of the seller's interest and subordinated security classes of DCENT. At June 30,2020, we had $12.5 billion of outstanding public asset-backed securities and $4.2 billion of outstanding subordinated asset-backed securities that had been issuedto our wholly-owned subsidiaries.
The securitization structures include certain features designed to protect investors. The primary feature relates to the availability and adequacy of cash flowsin the securitized pool of receivables to meet contractual requirements, the insufficiency of which triggers early repayment of the securities. We refer to this as"economic early amortization", which is based on excess spread levels. Excess spread is the amount by which income received by a trust during a collection period,including interest collections, fees and interchange, exceeds the fees and expenses of the trust during such collection period, including interest expense, servicingfees and charged-off receivables. In the event of an economic early amortization, which would occur if the excess spread fell below 0% on a three-month rollingaverage basis, we would be required to repay the affected outstanding securitized borrowings using available collections received by the trust. For the three monthsended June 30, 2020, the DiscoverSeries three-month rolling average excess spread was 12.27%. The period of ultimate repayment would be determined by theamount and timing of collections received.
Through our wholly-owned indirect subsidiary, Discover Funding LLC, we are required to maintain a contractual minimum level of receivables in the trustin excess of the face value of outstanding investors' interests. This excess is referred to as the minimum seller's interest. The required minimum seller's interest inthe pool of trust receivables, which is included in credit card loan receivables restricted for securitization investors, is set at approximately 7% in excess of the totalinvestors' interests (which includes interests held by third parties as well as those interests held by us). If the level of receivables in the trust were to fall below therequired minimum, we would be required to add receivables from the unrestricted pool of receivables, which would increase the amount of credit card loanreceivables restricted for securitization investors. A decline in the amount of the excess seller's interest could occur if balance repayments and charge-offs exceedednew lending on the securitized accounts or as a result of changes in total outstanding investors' interests. Seller's interest is impacted by seasonality as higherbalance repayments tend to occur in the first calendar year quarter. If we could not add enough receivables to satisfy the minimum seller's interest requirement, anearly amortization (or repayment) of investors' interests would be triggered.
An early amortization event would impair our liquidity, and may require us to utilize our available non-securitization related contingent liquidity or rely onalternative funding sources, which may or may not be available at the time. We have several strategies we can deploy to prevent an early amortization event. Forinstance, we could add additional receivables to the trust, which would reduce our available borrowing capacity at the Federal Reserve discount window. As ofJune 30, 2020, there were $27.7 billion of credit card receivables in the trust and no accounts were added to those restricted for securitization investors for the threeand six months ended June 30, 2020. Alternatively, we could employ structured discounting, which was used effectively in 2009 to bolster excess spread andmitigate early amortization risk.
68
Table of Contents
The following table summarizes expected contractual maturities of the investors' interests in credit card securitizations, excluding those that have beenissued to our wholly-owned subsidiaries (dollars in millions):
The triple-A rating of DCENT Class A Notes issued to date has been based, in part, on an FDIC rule, which created a safe harbor that provides that theFDIC, as conservator or receiver, will not, using its power to disaffirm or repudiate contracts, seek to reclaim or recover assets transferred in connection with asecuritization, or recharacterize them as assets of the insured depository institution, provided such transfer satisfies the conditions for sale accounting treatmentunder previous GAAP. Although the implementation of the Financial Accounting Standards Board Accounting Standards Codification Topic 860, Transfers andServicing, no longer qualified certain transfers of assets for sale accounting treatment, the FDIC approved a final rule that preserved the safe-harbor treatmentapplicable to revolving trusts and master trusts, including DCMT, so long as those trusts would have satisfied the original FDIC safe harbor if evaluated underGAAP pertaining to transfers of financial assets in effect prior to December 2009. Other legislative and regulatory developments may, however, impact our abilityand/or desire to issue asset-backed securities in the future.
Other Long-Term Borrowings—Student LoansAt June 30, 2020, $144 million of remaining principal balance was outstanding on securitized debt assumed as part of our acquisition of The Student Loan
Corporation. Principal and interest payments on the underlying student loans will reduce the balance of these secured borrowings over time.
Other Long-Term Borrowings—Corporate and Bank Debt
The following table provides a summary of Discover Financial Services (Parent Company) and Discover Bank outstanding fixed-rate debt (dollars inmillions):
Certain Discover Financial Services senior notes require us to offer to repurchase the notes at a price equal to 101% of their aggregate principal amount plusaccrued and unpaid interest in the event of a change of control involving us and a corresponding ratings downgrade to below investment grade.
Short-Term BorrowingsAs part of our regular funding strategy, we may from time to time borrow short-term funds in the federal funds market or the repurchase ("repo") market
through repurchase agreements. Federal funds are short-term, unsecured loans between banks or other financial entities with a Federal Reserve account. Fundsborrowed in the repo market are short-term, collateralized loans, usually secured with highly-rated investment securities such as U.S. Treasury bills or notes, orfederal agency mortgage bonds or debentures. At June 30, 2020, there were no outstanding balances in the federal funds market or repurchase agreements.
Additional Funding Sources
Private Asset-Backed SecuritizationsWe have access to committed borrowing capacity through privately placed asset-backed securitizations. At June 30, 2020, we had total committed capacity
of $6.0 billion, none of which was drawn. While we may utilize funding from these
69
Table of Contents
private securitizations from time to time for normal business operations, their committed nature also makes them a reliable contingency funding source. Therefore,we reserve some undrawn capacity, informed by our liquidity stress test results, for potential contingency funding needs. We also seek to ensure the stability andreliability of these securitizations by staggering their maturity dates, renewing them approximately one year prior to their scheduled maturity dates and periodicallydrawing them for operational testing purposes and seasonal funding needs.
Federal ReserveDiscover Bank has access to the Federal Reserve Bank of Philadelphia's discount window. As of June 30, 2020, Discover Bank had $32.8 billion of
available borrowing capacity through the discount window based on the amount and type of assets pledged, primarily consumer loans. We have no borrowingsoutstanding under the discount window and reserve this capacity as a source of contingent liquidity.
Funding UsesOur primary uses of funds include the extensions of loans and credit, primarily through Discover Bank; the purchase of investments for our liquidity
portfolio; working capital; and debt and capital service. We assess funding uses and liquidity needs under stressed and normal operating conditions, consideringprimary uses of funding, such as on-balance sheet loans, and contingent uses of funding, such as the need to post additional collateral for derivatives positions. Inorder to anticipate funding needs under stress, we conduct liquidity stress tests to assess the impact of idiosyncratic, systemic and hybrid (idiosyncratic andsystemic) scenarios with varying levels of liquidity risk reflecting a range of stress severity.
Credit RatingsOur borrowing costs and capacity in certain funding markets, including those for securitizations and unsecured senior and subordinated debt, may be
affected by the credit ratings of DFS, Discover Bank and the securitization trusts. Downgrades in these credit ratings could result in higher interest expense on ourunsecured debt and asset securitizations, as well as higher collateral enhancement requirements for both our public and private asset securitizations. In addition toincreased funding costs, deterioration in credit ratings could reduce our borrowing capacity in the unsecured debt and asset securitization capital markets.
In light of the COVID-19 pandemic, rating agencies have cited their expectation that the banking industry will experience heightened loan delinquenciesand charge-offs as the labor market weakens. During the second quarter, Moody’s, Standard and Poor’s, and Fitch Ratings affirmed our credit ratings; Standardand Poor’s and Fitch changed the outlook on our senior unsecured credit ratings from “stable” to “negative”, however, while Moody’s retains a “stable” outlook onour ratings. A rating outlook reflects an agency's opinion regarding the likely rating direction over the medium term—often a period of about a year—but alsoindicates the agency's belief that the issuer's credit profile is consistent with its current rating level at that point in time.
We also maintain agreements with certain of our derivative counterparties that contain provisions that require DFS and Discover Bank to maintain aninvestment grade credit rating from specified major credit rating agencies. At June 30, 2020, Discover Bank's credit rating met specified thresholds set by itscounterparties. However, if its credit rating was to fall below investment grade, Discover Bank would be required to post additional collateral, which, as ofJune 30, 2020, would have been $20 million. DFS (Parent Company) had no outstanding derivatives as of June 30, 2020, and therefore, no collateral was required.
70
Table of Contents
The table below reflects our current credit ratings and outlooks:
Moody's Investors
Service Standard & Poor's Fitch
Ratings
Discover Financial Services
Senior unsecured debt Baa3 BBB- BBB+
Outlook for Discover Financial Services senior unsecured debt Stable Negative Negative
Discover Bank
Senior unsecured debt Baa2 BBB BBB+
Outlook for Discover Bank senior unsecured debt Stable Negative Negative
Subordinated debt Baa3 BBB- BBB
Discover Card Execution Note Trust
Class A(1) Aaa(sf) AAA(sf) AAA(sf) (1) An "sf" in the rating denotes rating agency identification for structured finance product ratings.
A credit rating is not a recommendation to buy, sell or hold securities, may be subject to revision or withdrawal at any time by the assigning ratingorganization, and each rating should be evaluated independently of any other rating.
LiquidityWe seek to ensure that we have adequate liquidity to sustain business operations, fund asset growth and satisfy debt obligations under stressed and normal
operating conditions. In addition to the funding sources discussed in the previous section, we also maintain highly liquid, unencumbered assets in our liquidityportfolio that we expect to be able to convert to cash quickly and with little loss of value using either the repo market or outright sales.
We maintain a liquidity risk and funding management policy, which outlines the overall framework and general principles we follow in managing liquidityrisk across our business. The policy is approved by the Board of Directors with implementation responsibilities delegated to the Asset and Liability ManagementCommittee (the "ALCO"). Additionally, we maintain a liquidity management framework document, which outlines the general strategies, objectives and principleswe utilize to manage our liquidity position and the various liquidity risks inherent in our business model. We seek to balance the trade-offs between maintainingtoo much liquidity, which may be costly, with having too little liquidity, which could cause financial distress. Liquidity risk is centrally managed by the ALCO,which is chaired by our Treasurer and has cross-functional membership. The ALCO monitors the liquidity risk profiles of DFS and Discover Bank and overseesany actions Corporate Treasury may take to ensure that we maintain ready access to our funding sources and sufficient liquidity to meet current and projectedneeds. In addition, the ALCO and our Board of Directors regularly review our compliance with our liquidity limits at DFS and Discover Bank, which areestablished in accordance with the liquidity risk appetite set by our Board of Directors.
We employ a variety of metrics to monitor and manage liquidity. We utilize early warning indicators ("EWIs") to detect emerging liquidity stress events anda reporting and escalation process that is designed to be consistent with regulatory guidance. The EWIs include both idiosyncratic and systemic measures, and aremonitored on a daily basis and reported to the ALCO regularly. A warning from one or more of these indicators triggers prompt review and decision-making byour senior management team, and in certain instances may lead to the convening of a senior-level response team and activation of our contingency funding plan.
In addition, we conduct liquidity stress tests regularly and ensure contingency funding is in place to address potential liquidity shortfalls. We evaluate arange of stress scenarios that are designed in accordance with regulatory requirements, including idiosyncratic, systemic and a combination of such events thatcould impact funding sources and our ability to meet liquidity needs. These scenarios measure the projected liquidity position at DFS and Discover Bank across arange of time horizons by comparing estimated contingency funding needs to available contingent liquidity.
Our primary contingent liquidity sources include our liquidity portfolio and private securitizations with unused borrowing capacity. In addition, we haveunused borrowing capacity with the Federal Reserve discount window, which provides an additional source of contingent liquidity. We seek to maintain sufficientliquidity to be able to satisfy all maturing obligations and fund business operations for at least 12 months in a severe stress environment. In such an environment,we may also take actions to curtail the size of our balance sheet, which would reduce the need for funding and liquidity.
71
Table of Contents
At June 30, 2020, our liquidity portfolio is comprised of highly liquid, unencumbered assets, including cash and cash equivalents, short term investmentsand investment securities. Cash and cash equivalents were primarily in the form of deposits with the Federal Reserve, Treasury bills, and government moneymarket funds. Short term investments primarily included Treasury bills with contractual maturities greater than 90 days but less than one year at the time ofacquisition. Investment securities primarily included debt obligations of the U.S. Treasury and residential mortgage-backed securities issued by U.S. governmenthousing agencies or government-sponsored enterprises. These investments are considered highly liquid, and we expect to have the ability to raise cash by sellingthem, utilizing repurchase agreements or pledging certain of these investments to access secured funding. The size and composition of our liquidity portfolio mayfluctuate based upon the size of our balance sheet as well as operational requirements, market conditions and interest rate risk management strategies. For instance,our liquidity portfolio grew materially during the second quarter as customer deposits increased and loan balances declined, reflecting consumers’ response to theCOVID-19 pandemic.
At June 30, 2020, our liquidity portfolio and undrawn credit facilities were $65.7 billion, which was $9.4 billion higher than the balance at December 31,2019. During the three and six months ended June 30, 2020, the average balance of our liquidity portfolio was $25.9 billion and $22.1 billion, respectively.
Total liquidity portfolio and undrawn credit facilities$ 65,683 $ 56,328
(1) Cash in the process of settlement and restricted cash are excluded from cash and cash equivalents for liquidity purposes.(2) Excludes $159 million and $121 million of U.S. Treasury securities that have been pledged as swap collateral in lieu of cash as of June 30, 2020 and December 31, 2019, respectively.(3) See "— Additional Funding Sources" for additional information.
CapitalOur primary sources of capital are the earnings generated by our businesses and the proceeds from issuances of capital securities. We seek to manage capital
to a level and composition sufficient to support the growth and risks of our businesses and to meet regulatory requirements, rating agency targets and debt investorexpectations. Within these constraints, we are focused on deploying capital in a manner that provides attractive returns to our stockholders. The level, compositionand utilization of capital are influenced by changes in the economic environment, strategic initiatives, and legislative and regulatory developments.
Under regulatory capital requirements adopted by the Federal Reserve and the FDIC, DFS, along with Discover Bank, must maintain minimum levels ofcapital. Failure to meet minimum capital requirements can result in the initiation of certain mandatory and possibly additional discretionary actions by regulatorsthat, if undertaken, could limit our business activities and have a direct material effect on our financial position and results. We must meet specific capitalrequirements that involve quantitative measures of assets, liabilities and certain off-balance sheet items, as calculated under regulatory guidance and regulations.Current or future legislative or regulatory reforms, such as the implementation of CECL, may require us to hold more capital or adversely impact our capital level.We consider the potential impacts of these reforms in managing our capital position.
DFS and Discover Bank are subject to regulatory capital requirements that became effective January 2015 under final rules issued by the Federal Reserveand the FDIC to implement the provisions under the Basel Committee's December 2010 framework ("Basel III rules"). The Basel III rules require DFS andDiscover Bank to maintain minimum risk-based capital and leverage ratios and define what constitutes capital for purposes of calculating those ratios. Under BaselIII rules for regulatory capital, DFS and Discover Bank are classified as "Standardized Approach" entities, defined as U.S. banking
72
Table of Contents
organizations with consolidated total assets over $50 billion but not exceeding $250 billion and consolidated total on-balance sheet foreign exposures less than $10billion.
As of January 1, 2019, thresholds within the Basel III rules were fully phased in with the exception of certain transition provisions that were frozen pursuantto regulation issued in November 2017. Pursuant to a final rule issued in July 2019, the transition provisions that were previously frozen have been replaced withnew permanent thresholds as discussed below. Additionally, on March 27, 2020, federal bank regulatory agencies announced an interim final rule that allows banksthat have implemented CECL the option to delay for two years the estimated impact of CECL on regulatory capital, followed by a three-year transition period. Forpurposes of calculating regulatory capital, we have elected to defer recognition of the estimated impact of CECL on regulatory capital for two years in accordancewith the interim final rule; after that period of deferral, the estimated impact of CECL on regulatory capital will be phased in over a three-year period beginning in2022. We estimate that electing this option raises our Common Equity Tier 1 ("CET1") capital ratios in 2020. For additional information regarding the risk-basedcapital and leverage ratios, see Note 12: Capital Adequacy to our condensed consolidated financial statements.
On March 4, 2020, the Federal Reserve announced the SCB final rule, which would impose limitations on our capital distributions if we do not maintain ourcapital ratios above stated regulatory minimum ratios based on the results of supervisory stress tests. We participated in the CCAR supervisory stress test this yearand received our preliminary SCB of 3.5%, which primarily reflects the difference between our actual CET1 ratio as of the fourth quarter of 2019 and our projectedminimum CET1 ratio based on the Federal Reserve’s models in its nine-quarter Severely Adverse stress scenario. The SCB is expected to become effectiveOctober 1, 2020 and we will receive a final SCB by August 31, 2020. Under this rule, we will be required to assess if our planned capital actions are consistentwith the effective capital distributions limitations that will apply on a pro-forma basis throughout the planning horizon. See "— Regulatory Environment andDevelopments — Banking — Capital Standards and Stress Testing" for additional information.
The Basel III rules provide for certain threshold-based deductions from and adjustments to CET1 to the extent that any one such category or all suchcategories in the aggregate exceed certain percentages of CET1. In July 2019, federal banking regulators issued a final rule that, among other things, revised certaincapital requirements for Standardized Approach banks by raising the 10% of CET1 deduction threshold for certain items to 25% and eliminating the 15%combined deduction threshold applying to these items. These changes became effective for all Standardized Approach banking institutions in April 2020.
Basel III rules also require disclosures relating to market discipline. This series of disclosures is commonly referred to as "Pillar 3." The objective is toincrease transparency of capital requirements for banking organizations. We are required to make prescribed regulatory disclosures on a quarterly basis regardingour capital structure, capital adequacy, risk exposures and risk-weighted assets. The Pillar 3 disclosures are made publicly available on our website in a reportcalled "Basel III Regulatory Capital Disclosures."
At June 30, 2020, DFS and Discover Bank met the requirements for "well-capitalized" status under Regulation Y and the prompt corrective action rules,respectively, exceeding the regulatory minimums to which they were subject under the applicable rules. Additionally, we are subject to regulatory requirementsimposed by the Federal Reserve as part of its stress testing framework and CCAR program. Refer to "- Regulatory Environment and Developments" for moreinformation.
We disclose tangible common equity, which represents common equity less goodwill and intangibles. Management believes that common stockholders'equity excluding goodwill and intangibles is a meaningful measure to investors of our true net asset value. As of June 30, 2020, tangible common equity is notformally defined by U.S. GAAP or codified in the federal banking regulations and, as such, is considered to be a non-GAAP financial measure. Other financialservices companies may also disclose this measure and definitions may vary, so we advise users of this information to exercise caution in comparing this measurefor different companies.
73
Table of Contents
The following table provides a reconciliation of total common stockholders' equity (a U.S. GAAP financial measure) to tangible common equity (dollars inmillions):
June 30,
2020 December 31,
2019
Total common stockholders' equity(1) $ 8,587 $ 11,296
Less: goodwill (255) (255)
Less: intangible assets, net (96) (155)
Tangible common equity $ 8,236 $ 10,886
(1) Total common stockholders' equity is calculated as total stockholders' equity less preferred stock.
For the period between July 1, 2019 and June 30, 2020, the Federal Reserve pre-approved capital distributions up to a maximum amount for each CategoryIV bank, including Discover. The Federal Reserve based these capital distribution limits on results from the 2018 supervisory stress test. Notwithstanding the pre-approval, we were still required to prepare in 2019 a capital plan to be approved by our Board of Directors and on April 6, 2020, we submitted to the FederalReserve a new capital plan for the period July 1, 2020 to June 30, 2021, pursuant to the CCAR supervisory stress test. On June 25, 2020, we received the stress testresults, which are discussed herein.
We recently declared a quarterly cash dividend on our common stock of $0.44 per share, payable on September 3, 2020 to holders of record on August 20,2020, which is consistent with last quarter. In light of the current economic downturn, the Federal Reserve required all large banks participating in the CCARsupervisory stress test to cap common stock dividends at the average of a firm’s net income over the preceding four quarters. We also recently declared a semi-annual cash dividend on our preferred stock (Series C) of $2,750 per share, equal to $27.50 per depositary share, payable on October 30, 2020 to holders of recordon October 15, 2020, which is consistent with the amount paid in the second quarter of 2020. On June 22, 2020, we opportunistically issued new perpetualpreferred shares (Series D) with a liquidation amount of $500 million; these shares provide Tier 1 capital and we used the proceeds for general corporate purposes.The Series D preferred stock pays semi-annual dividends at a fixed annual rate of 6.125% until September 23, 2025, after which its dividend rate will reset everyfive years to a fixed annual rate equal to the 5-year Treasury rate plus 5.783%.
Our existing share repurchase program, which had $1.2 billion of remaining authorization expires on September 30, 2020. Having suspended sharerepurchases earlier this year in recognition of the pandemic-induced economic downturn, we repurchased no common stock during the three months ended June 30,2020. We may reinstate our share repurchase program in the future, but the Federal Reserve has required all large banks participating in the CCAR supervisorystress test to suspend share repurchases for at least the third quarter. Thereafter, our decision to repurchase additional shares of common stock will depend on ourfinancial results, prevailing and expected economic conditions, potential regulatory limitations, and other considerations. Share repurchases under the program maybe made through a variety of methods, including open market purchases, privately negotiated transactions or other purchases, including block trades, acceleratedshare repurchase transactions, or any combination of such methods.
The amount and size of any future dividends and share repurchases will depend upon our results of operations, financial condition, capital levels, cashrequirements, future prospects and other factors, such as the implementation of CECL. The declaration and payment of future dividends, as well as the amountthereof, are subject to the discretion of our Board of Directors. Holders of our shares of common stock are subject to the prior dividend rights of holders of ourpreferred stock or the depositary shares representing such preferred stock outstanding, and if full dividends have not been declared and paid on all outstandingshares of preferred stock in any dividend period, no dividend may be declared or paid or set aside for payment on our common stock. In addition, as noted above,banking laws and regulations and our banking regulators may limit our ability to pay dividends and make share repurchases, including limitations on the extent towhich our banking subsidiaries can provide funds to us through dividends, loans or otherwise. Further, current or future regulatory reforms may require us to holdmore capital or adversely impact our capital level. There can be no assurance that we will declare and pay any dividends or repurchase any shares of our commonstock in the future.
Certain Off-Balance Sheet Arrangements
GuaranteesGuarantees are contracts or indemnification agreements that contingently require us to make payments to a guaranteed party based on changes in an
underlying asset, liability, or equity security of a guaranteed party, rate or index. Also included in guarantees are contracts that contingently require the guarantor tomake payments to a guaranteed party based on another
74
Table of Contents
entity's failure to perform under an agreement. Our guarantees relate to transactions processed on the Discover Network and certain transactions processed byPULSE and Diners Club. See Note 13: Commitments, Contingencies and Guarantees to our condensed consolidated financial statements for further discussionregarding our guarantees.
Contractual Obligations and Contingent Liabilities and CommitmentsIn the normal course of business, we enter into various contractual obligations that may require future cash payments. Contractual obligations at June 30,
2020, which include deposits, long-term borrowings, operating lease obligations, interest payments on fixed-rate debt, purchase obligations and other liabilitieswere $104.7 billion. For a description of our contractual obligations, see our annual report on Form 10-K for the year ended December 31, 2019 under"Management's Discussion and Analysis of Financial Condition and Results of Operations — Contractual Obligations and Contingent Liabilities andCommitments."
We extend credit for consumer loans, primarily arising from agreements with customers for unused lines of credit on certain credit cards and certain otherloan products, provided there is no violation of conditions established in the related agreement. At June 30, 2020, our unused credit arrangements wereapproximately $214.0 billion. These arrangements, substantially all of which we can terminate at any time and which do not necessarily represent future cashrequirements, are periodically reviewed based on account usage, customer creditworthiness and loan qualification. In addition, in the ordinary course of business,we guarantee payment on behalf of subsidiaries relating to contractual obligations with external parties. The activities of the subsidiaries covered by any suchguarantees are included in our condensed consolidated financial statements.
Item 3. Quantitative and Qualitative Disclosures About Market RiskMarket risk refers to the risk that a change in the level of one or more market prices, rates, indices, correlations or other market factors will result in losses
for an investment position or portfolio. We are exposed to market risk primarily from changes in interest rates.
Interest Rate RiskWe borrow money from a variety of depositors and institutions in order to provide loans to our customers, as well as invest in other assets and our business.
These loans and other assets earn interest, which we use to pay interest on the money borrowed. Our net interest income and, therefore, earnings, will be reduced ifthe interest rate earned on assets increases at a slower pace than the interest rate paid on our borrowings. Changes in interest rates and our competitors' responses tothose changes may influence customer payment rates, loan balances or deposit account activity. As a result, we may incur higher funding costs, which maydecrease earnings.
Our interest rate risk management policies are designed to measure and manage the potential volatility of earnings that may arise from changes in interestrates by having a portfolio that reflects our mix of variable- and fixed-rate assets and liabilities. To the extent that the repricing characteristics of the assets andliabilities in a particular portfolio are not sufficiently matched, we may utilize interest rate derivative contracts, such as swap agreements, to achieve our objectives.Interest rate swap agreements effectively convert the underlying asset or liability from fixed- to floating-rate or from floating- to fixed-rate. See Note 16:Derivatives and Hedging Activities to our condensed consolidated financial statements for information on our derivatives activity.
We use an interest rate sensitivity simulation to assess our interest rate risk exposure. For purposes of presenting the possible earnings effect of ahypothetical, adverse change in interest rates over the 12-month period from our reporting date, we assume that all interest rate sensitive assets and liabilities willbe impacted by a hypothetical, immediate 100 basis point change in interest rates relative to market consensus expectations as of the beginning of the period. Thesensitivity is based upon the hypothetical assumption that all relevant types of interest rates would change instantaneously, simultaneously and to the same degree.
Our interest rate sensitive assets include our variable-rate loan receivables and the assets that make up our liquidity portfolio. We have limitations on ourability to mitigate interest rate risk by adjusting rates on existing balances and competitive actions may limit our ability to increase the rates that we charge tocustomers for new loans. At June 30, 2020, the majority of our credit card and student loans charge variable rates. Assets with rates that are fixed at period end butwhich will mature, or otherwise contractually reset to a market-based indexed rate or other fixed rate prior to the end of the 12-month period, are considered to berate sensitive. The latter category includes certain revolving credit card loans that may be
75
Table of Contents
offered at below-market rates for an introductory period, such as balance transfers and special promotional programs, after which the loans will contractuallyreprice in accordance with our normal market-based pricing structure. For assets that have a fixed interest rate but contractually will, or are assumed to, reset to amarket-based indexed rate or other fixed rate during the next 12 months, earnings sensitivity is measured from the expected repricing date. In addition, for allinterest rate sensitive assets, earnings sensitivity is calculated net of expected credit losses, which for purposes of this analysis, are assumed to remain unchangedrelative to our baseline expectations over the analysis horizon.
Interest rate sensitive liabilities are assumed to be those for which the stated interest rate is not contractually fixed for the next 12-month period. Thus,liabilities that vary with changes in a market-based index, such as the federal funds rate or London Interbank Offered Rate ("LIBOR"), which will reset before theend of the 12-month period, or liabilities whose rates are fixed at the fiscal period end but will mature and are assumed to be replaced with a market-based indexedrate prior to the end of the 12-month period, are also considered to be rate sensitive. For these fixed-rate liabilities, earnings sensitivity is measured from theexpected maturity date.
Net interest income sensitivity requires assumptions to be made regarding market conditions, consumer behavior, and overall growth and composition of thebalance sheet. The degree to which our deposit rates change when benchmark interest rates change—our deposit “beta”—is one of the more significant of theseassumptions. Our ALCO members review this assumption periodically and, in light of additional historical evidence, recently adopted a lower assumed depositbeta. All else equal, a lower deposit beta increases our modeled NII sensitivity to an interest rate shock, such that we would describe our current short-term interestrate risk position as being modestly asset sensitive. We believe this position is prudent given that benchmark interest rates are currently very near zero.Assumptions about deposit beta and other matters are inherently uncertain and, as a result, actual earnings may differ from the simulated earnings presented below.Our actual earnings depend on multiple factors including, but not limited to, the direction and timing of changes in interest rates, the movement of short-termversus long-term rates, balance sheet composition, competitor actions affecting pricing decisions in our loans and deposits, and strategic actions undertaken bymanagement.
The following table shows the impacts to net interest income over the following 12-month period that we estimate would result from an immediate andparallel change in interest rates affecting all interest rate sensitive assets and liabilities (dollars in millions): At June 30, 2020 At December 31, 2019
Basis point change $ % $ %
+100 $ 142 1.42 % $ 12 0.12 %
-100 $ (3) (0.03)% $ (13) (0.13)%
Item 4. Controls and Procedures
Evaluation of Disclosure Controls and ProceduresUnder the supervision and with the participation of our management, including our Chief Executive Officer and Chief Financial Officer, we conducted an
evaluation of the effectiveness of our disclosure controls and procedures (as defined in Rule 13a-15(e) and 15d-15(e) of the Securities Exchange Act of 1934, asamended (the "Exchange Act")), which are designed to ensure that information required to be disclosed by us in the reports that we file or submit under theExchange Act is recorded, processed, summarized and reported within the time periods specified by the SEC's rules and forms. Disclosure controls and proceduresinclude, without limitation, controls and procedures designed to ensure that information required to be disclosed by us in the reports that we file or submit underthe Exchange Act is accumulated and communicated to our management, including our Chief Executive Officer and Chief Financial Officer, as appropriate toallow timely decisions regarding required disclosure. Based on this evaluation, our Chief Executive Officer and Chief Financial Officer concluded that ourdisclosure controls and procedures were effective as of the end of the period covered by this report.
Changes in Internal Control over Financial ReportingThere have been no changes in our internal control over financial reporting (as such term is defined in Exchange Act Rule 13a-15(f) and 15d-15(f)) that
occurred during the period covered by this report that have materially affected, or are reasonably likely to materially affect, our internal control over financialreporting.
76
Table of Contents
Glossary of Acronyms
• ALCO: Asset and Liability Management Committee
• AOCI: Accumulated Other Comprehensive Income
• ASC: Accounting Standards Codification
• ASU: Accounting Standards Update
• CARES Act: Coronavirus Aid, Relief, and Economic Security Act
• CCAR: Comprehensive Capital Analysis and Review
• CCPA: California Consumer Privacy Act
• CECL: Current Expected Credit Loss
• CET1: Common Equity Tier 1
• CFPB: Consumer Financial Protection Bureau
• COVID-19: Coronavirus Disease 2019
• DCENT: Discover Card Execution Note Trust
• DCMT: Discover Card Master Trust
• DFS: Discover Financial Services
• EPS: Earnings Per Share
• EWI: Early Warning Indicator
• FASB: Financial Accounting Standards Board
• FDIC: Federal Deposit Insurance Corporation
• GAAP: Generally Accepted Accounting Principles
• IRS: Internal Revenue Service
• LIBOR: London Interbank Offered Rate
• NPR: Notice of Proposed Rulemaking
• OCI: Other Comprehensive Income
• OIS: Overnight Index Swap
• PCD: Purchased Credit-Deteriorated
• PCI: Purchased Credit-Impaired
• SCB: Stress Capital Buffer
• TDR: Troubled Debt Restructuring
• VIE: Variable Interest Entity
77
Table of Contents
Part II. OTHER INFORMATION
Item 1. Legal ProceedingsFor a description of legal proceedings, see Note 14: Litigation and Regulatory Matters to our condensed consolidated financial statements.
Item 1A. Risk FactorsIn light of recent developments relating to the coronavirus disease 2019 ("COVID-19") pandemic, we are supplementing our risk factors disclosed in our
annual report on Form 10-K for the year ended December 31, 2019. The following risk factor should be read in conjunction with the risk factors described in ourannual report on Form 10-K.
The COVID-19 pandemic has and is expected to continue to have a material adverse effect on our business, results of operations and financial condition.The COVID-19 pandemic has had an unprecedented impact on a global scale. As a result of the COVID-19 pandemic and the measures implemented to
contain the pandemic, economic activity has declined both on a national and global level and unemployment has risen at a record pace. The depth and duration ofthis economic contraction is unknown and currently unpredictable. Federal and state governments and agencies have put in place programs to mitigate and respondto the impact of the pandemic. These programs are in their early stages and it is too early to tell how successful these measures will be. It is also unclear whetherthe measures employed to date are exhaustive, or whether federal and state governments and agencies may take additional action that could impact our business.
The impact of the COVID-19 pandemic and the resulting economic contraction has impacted and is expected to continue to adversely impact our financialresults. As consumers grow increasingly uncertain about the economy, lose their jobs or are unable to find work due to the COVID-19 pandemic and theimplementation of measures implemented to slow the spread of COVID-19, they may become increasingly unable or unwilling to repay their loans on time. Theduration of the pandemic and the measures to contain it and the long-term negative economic impact in relation to increased unemployment could lead to increasedcustomer delinquencies and charge-offs, which would cause an increase to our allowance for credit losses, which would adversely affect our profitability. We haveput various programs in place to assist affected borrowers during the pandemic. The programs generally provide borrowers with flexibility to make monthlypayments, including allowing customers to skip payments without penalty, or in certain cases, accrual of interest. The terms and conditions of the programs aresubject to change and enrollment levels may fluctuate based on those changes as well as the depth and duration of the economic contraction. Our regulators areincreasingly focused on how these programs are being implemented. If we are unable to effectively implement these programs, we could be subject to regulatorycriticism and reputational harm. As the number of loans enrolled in these programs increases, our financial results will be adversely impacted in the short term dueto forgone interest. The impact on the U.S. economy and the consumer credit environment may continue after the COVID-19 pandemic has subsided; the pace ofrecovery is uncertain and unpredictable. The resurgence of COVID-19 in areas where the pandemic previously appeared to have subsided or been contained onlyadds to the uncertainty and unpredictability of the pace of recovery. Additionally, in connection with the economic contraction due to COVID-19, we havedecreased our marketing activities, which may adversely impact our ability to attract new customers and grow market share.
Given the nature of the crisis, our financial and economic models may be unable to accurately predict and respond to the impact of the economic contractionor lasting changes to consumer behaviors, which in turn may limit our ability to manage credit risk and avoid higher charge-off rates. Additionally, due to thenature and novelty of the crisis, our credit and economic models may not be able to adequately predict or forecast credit losses, sales, receivables or other financialmetrics during and after the crisis, which could result in our reserves being too large or insufficient. For more information see the risk factor entitled "Our riskmanagement framework and models for managing risks may not be effective in mitigating our risk of loss" in our annual report on Form 10-K year endedDecember 31, 2019.
As governments have put measures in place to contain the pandemic by requiring all non-essential businesses to close and/or their employees work fromhome and discouraging or prohibiting people generally from leaving their homes, our sales volume, credit card loan growth, interchange revenue and net-to-netvolume have declined and may continue to do so. The economic contraction and associated slowdown in travel and transaction volume may have a materialadverse impact on the financial condition of some of our Diners Club International ("Diners Club") franchises. In the past, we have extended financial support tofranchises experiencing financial stress.
78
Table of Contents
Beginning March 13, 2020, we have transitioned nearly all of our employees and non-employee contractors to working from home. Previously, only a smallportion of employees worked primarily from a location other than one of our offices. As we adapt to this new way of working, it may become less effective and asa result our ability to design and implement new products, services or features may be adversely impacted. Additionally, in the event that a meaningful portion ofour call center agents become ill due to COVID-19 or otherwise are unable to work effectively, our ability to meet our internal measures for customer service maybe adversely effected. The pandemic has required us and our third-party vendors to activate certain business continuity programs and make ongoing adjustments tooperations. To the extent that these plans and back-up servicing and other strategies and adjustments are either not available, insufficient or cannot be implementedin whole or in part, we may be exposed to legal, regulatory, reputational, operational, information security or financial risk. For example, if we are unable to sendour customers certain required statements or disclosures due to disruptions in staffing and personnel or our back-up servicing plans, we may be exposed to legaland regulatory scrutiny. Finally, as nearly all of our employees are working from home, we are increasingly reliant on a handful of vendors, including those wehave no direct relationship with such as our employees' internet service providers, to maintain reliable high speed access to our internal network. Failure by suchthird-party providers would impact our operations. Efforts by us, our vendors and their vendors to continue to adapt operations to this new environment mayintroduce additional vulnerabilities to our operations and information security programs and systems in ways we have not previously contemplated or otherwiseprepared for.
There are no comparable recent events that provide guidance as to the effect the spread of COVID-19 as a global pandemic may have, and, as a result, theultimate impact of the outbreak and the economic recovery following the containment of the outbreak is highly uncertain and subject to change. We do not yetknow the full extent of the impacts on our business, our operations or the global economy as a whole. However, the effects have had and are expected to continueto have a material impact on our results of operations and heighten many of our known risks described in the risk factors disclosed in our annual report on Form10-K for the year ended December 31, 2019.
Item 2. Unregistered Sales of Equity Securities and Use of Proceeds
Issuer Purchases of Equity Securities
The following table sets forth information regarding employee transactions that were made by us or on our behalf during the most recent quarter.
Employee transactions(1) 5,432 $ 42.60 (1) Reflects shares withheld (under the terms of grants under employee stock compensation plans) to offset tax withholding obligations that occur upon the delivery of outstanding shares underlying restricted stock units or upon the
exercise of stock options.
Item 3. Defaults Upon Senior SecuritiesNone.
Item 4. Mine Safety DisclosuresNone.
79
Table of Contents
Item 5. Other InformationNone.
Item 6. ExhibitsSee "Exhibit Index" for documents filed herewith and incorporated herein by reference.
Exhibit Index
ExhibitNumber Description
3.1
Restated Certificate of Incorporation of Discover Financial Services (filed as Exhibit 3.2 to Discover Financial Services’ Current Report onForm 8-K filed on May 21, 2019 and incorporated herein by reference thereto).
3.2
Certificate of Elimination of the Fixed Rate Cumulative Perpetual Preferred Stock, Series A, of Discover Financial Services (filed as Exhibit 3.2to Discover Financial Services’ Quarterly Report on Form 10-Q filed on June 26, 2012 and incorporated herein by reference thereto).
3.3
Certificate of Designations of Fixed Rate Non-Cumulative Perpetual Preferred Stock, Series B (filed as Exhibit 3.1 to Discover FinancialServices’ Current Report on Form 8-K filed on October 16, 2012 and incorporated herein by reference thereto).
3.4
Certificate of Designations of Fixed-to-Floating Rate Non-Cumulative Perpetual Preferred Stock, Series C (filed as Exhibit 3.1 to DiscoverFinancial Services’ Current Report on Form 8-K filed on October 31, 2017 and incorporated herein by reference thereto).
3.5
Certificate of Elimination of Fixed Rate Non-Cumulative Perpetual Preferred Stock, Series B (filed as Exhibit 3.1 to Discover FinancialServices’ Current Report on Form 8-K filed on December 4, 2017 and incorporated herein by reference thereto).
3.6
Certificate of Designations of Fixed-Rate Reset Non-Cumulative Perpetual Preferred Stock Series D (filed as Exhibit 3.1 to Discover FinancialServices’ Current Report on Form 8-K filed on June 22, 2020 and incorporated herein by reference thereto).
4.1
Deposit Agreement, dated June 22, 2020 (filed as Exhibit 4.1 to Discover Financial Services’ Current Report on Form 8-K filed on June 22,2020 and incorporated herein by reference thereto).
4.2
Form of certificate representing the Fixed Rate Reset Non-Cumulative Perpetual Preferred Stock, Series D (filed as Exhibit 4.2 to DiscoverFinancial Services’ Current Report on Form 8-K filed on June 22, 2020 and incorporated herein by reference thereto).
31.1 Certification of Chief Executive Officer pursuant to Rule 13a-14(a) under the Securities Exchange Act of 1934.
31.2 Certification of Chief Financial Officer pursuant to Rule 13a-14(a) under the Securities Exchange Act of 1934.
32.1
Certification of Chief Executive Officer and Chief Financial Officer pursuant to Section 1350 of Chapter 63 of Title 18 of the United StatesCode.
101
Interactive Data File — the following financial statements from Discover Financial Services Quarterly Report on Form 10-Q formatted in inlineXBRL: (1) Condensed Consolidated Statements of Financial Condition, (2) Condensed Consolidated Statements of Income, (3) CondensedConsolidated Statements of Comprehensive Income, (4) Condensed Consolidated Statements of Changes in Stockholders' Equity, (5) CondensedConsolidated Statements of Cash Flows and (6) Notes to the Condensed Consolidated Financial Statements.
104
Cover Page Interactive Data File — the cover page from Discover Financial Services Quarterly Report on Form 10-Q formatted in inline XBRLand contained in Exhibit 101.
Pursuant to the requirements of Section 13 or 15(d) of the Securities Exchange Act of 1934, the Registrant has duly caused this report to be signed on itsbehalf by the undersigned thereunto duly authorized.
Discover Financial Services(Registrant)
By: /s/ JOHN T. GREENE
John T. Greene
Executive Vice President, Chief Financial Officer
Date: July 27, 2020
81
Exhibit 31.1
CERTIFICATIONI, Roger C. Hochschild, certify that:
1. I have reviewed this Quarterly Report on Form 10-Q of Discover Financial Services (the "registrant");
2. Based on my knowledge, this report does not contain any untrue statement of a material fact or omit to state a material fact necessary to make thestatements made, in light of the circumstances under which such statements were made, not misleading with respect to the period covered by this report;
3. Based on my knowledge, the financial statements, and other financial information included in this report, fairly present in all material respects thefinancial condition, results of operations and cash flows of the registrant as of, and for, the periods presented in this report;
4. The registrant's other certifying officer and I are responsible for establishing and maintaining disclosure controls and procedures (as defined in ExchangeAct Rules 13a-15(e) and 15d-15(e)) and internal control over financial reporting (as defined in Exchange Act Rules 13a-15(f) and 15d-15(f)) for theregistrant and have:
a) Designed such disclosure controls and procedures, or caused such disclosure controls and procedures to be designed under our supervision, toensure that material information relating to the registrant, including its consolidated subsidiaries, is made known to us by others within thoseentities, particularly during the period in which this report is being prepared;
b) Designed such internal control over financial reporting, or caused such internal control over financial reporting to be designed under oursupervision, to provide reasonable assurance regarding the reliability of financial reporting and the preparation of financial statements forexternal purposes in accordance with generally accepted accounting principles;
c) Evaluated the effectiveness of the registrant's disclosure controls and procedures and presented in this report our conclusions about theeffectiveness of the disclosure controls and procedures, as of the end of the period covered by this report based on such evaluation; and
d) Disclosed in this report any change in the registrant's internal control over financial reporting that occurred during the registrant's most recentfiscal quarter (the registrant's fourth fiscal quarter in the case of an annual report) that has materially affected, or is reasonably likely tomaterially affect, the registrant's internal control over financial reporting; and
5. The registrant's other certifying officer and I have disclosed, based on our most recent evaluation of internal control over financial reporting, to theregistrant's auditors and the audit committee of the registrant's board of directors (or persons performing the equivalent functions):
a) All significant deficiencies and material weaknesses in the design or operation of internal control over financial reporting which are reasonablylikely to adversely affect the registrant's ability to record, process, summarize and report financial information; and
b) Any fraud, whether or not material, that involves management or other employees who have a significant role in the registrant's internal controlover financial reporting.
Date: July 27, 2020
/s/ ROGER C. HOCHSCHILD Roger C. Hochschild Chief Executive Officer and President
Exhibit 31.2
CERTIFICATIONI, John T. Greene, certify that:
1. I have reviewed this Quarterly Report on Form 10-Q of Discover Financial Services (the "registrant");
2. Based on my knowledge, this report does not contain any untrue statement of a material fact or omit to state a material fact necessary to make thestatements made, in light of the circumstances under which such statements were made, not misleading with respect to the period covered by this report;
3. Based on my knowledge, the financial statements, and other financial information included in this report, fairly present in all material respects thefinancial condition, results of operations and cash flows of the registrant as of, and for, the periods presented in this report;
4. The registrant's other certifying officer and I are responsible for establishing and maintaining disclosure controls and procedures (as defined in ExchangeAct Rules 13a-15(e) and 15d-15(e)) and internal control over financial reporting (as defined in Exchange Act Rules 13a-15(f) and 15d-15(f)) for theregistrant and have:
a) Designed such disclosure controls and procedures, or caused such disclosure controls and procedures to be designed under our supervision, toensure that material information relating to the registrant, including its consolidated subsidiaries, is made known to us by others within thoseentities, particularly during the period in which this report is being prepared;
b) Designed such internal control over financial reporting, or caused such internal control over financial reporting to be designed under oursupervision, to provide reasonable assurance regarding the reliability of financial reporting and the preparation of financial statements forexternal purposes in accordance with generally accepted accounting principles;
c) Evaluated the effectiveness of the registrant's disclosure controls and procedures and presented in this report our conclusions about theeffectiveness of the disclosure controls and procedures, as of the end of the period covered by this report based on such evaluation; and
d) Disclosed in this report any change in the registrant's internal control over financial reporting that occurred during the registrant's most recentfiscal quarter (the registrant's fourth fiscal quarter in the case of an annual report) that has materially affected, or is reasonably likely tomaterially affect, the registrant's internal control over financial reporting; and
5. The registrant's other certifying officer and I have disclosed, based on our most recent evaluation of internal control over financial reporting, to theregistrant's auditors and the audit committee of the registrant's board of directors (or persons performing the equivalent functions):
a) All significant deficiencies and material weaknesses in the design or operation of internal control over financial reporting which are reasonablylikely to adversely affect the registrant's ability to record, process, summarize and report financial information; and
b) Any fraud, whether or not material, that involves management or other employees who have a significant role in the registrant's internal controlover financial reporting.
Date: July 27, 2020
/s/ JOHN T. GREENE John T. Greene Executive Vice President, Chief Financial Officer
Exhibit 32.1
CERTIFICATION PURSUANT TO18 U.S.C. SECTION 1350,
AS ADOPTED PURSUANT TOSECTION 906 OF THE SARBANES-OXLEY ACT OF 2002
In connection with the Quarterly Report of Discover Financial Services (the "Company") on Form 10-Q for the period ended June 30, 2020, as filed with theSecurities and Exchange Commission (the "Report"), each of Roger C. Hochschild, Chief Executive Officer and President of the Company, and John T. Greene,Executive Vice President and Chief Financial Officer of the Company, certifies, pursuant to 18 U.S.C. Section 1350, as adopted pursuant to Section 906 of theSarbanes-Oxley Act of 2002, that:
1. The Report fully complies with the requirements of Section 13(a) or 15(d) of the Securities Exchange Act of 1934; and
2. The information contained in the Report fairly presents, in all material respects, the financial condition and results of operations of the Company.
Date: July 27, 2020
/s/ ROGER C. HOCHSCHILD Roger C. Hochschild Chief Executive Officer and President
Date: July 27, 2020
/s/ JOHN T. GREENE John T. Greene Executive Vice President, Chief Financial Officer


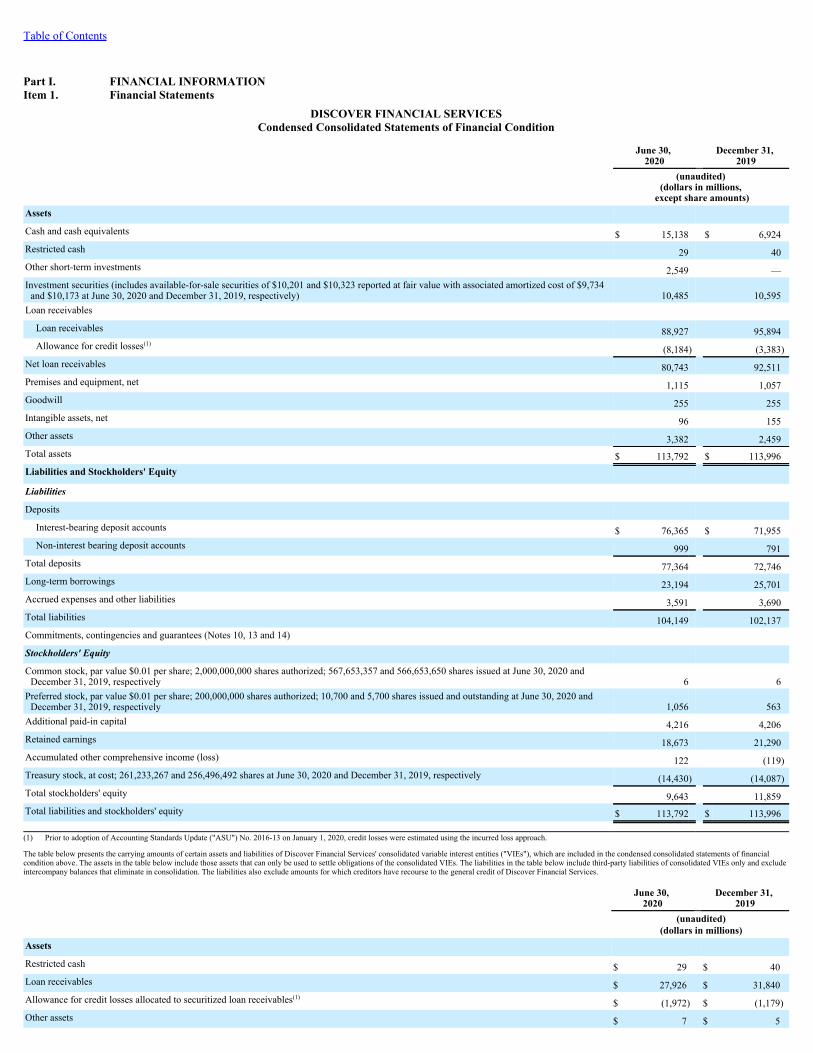


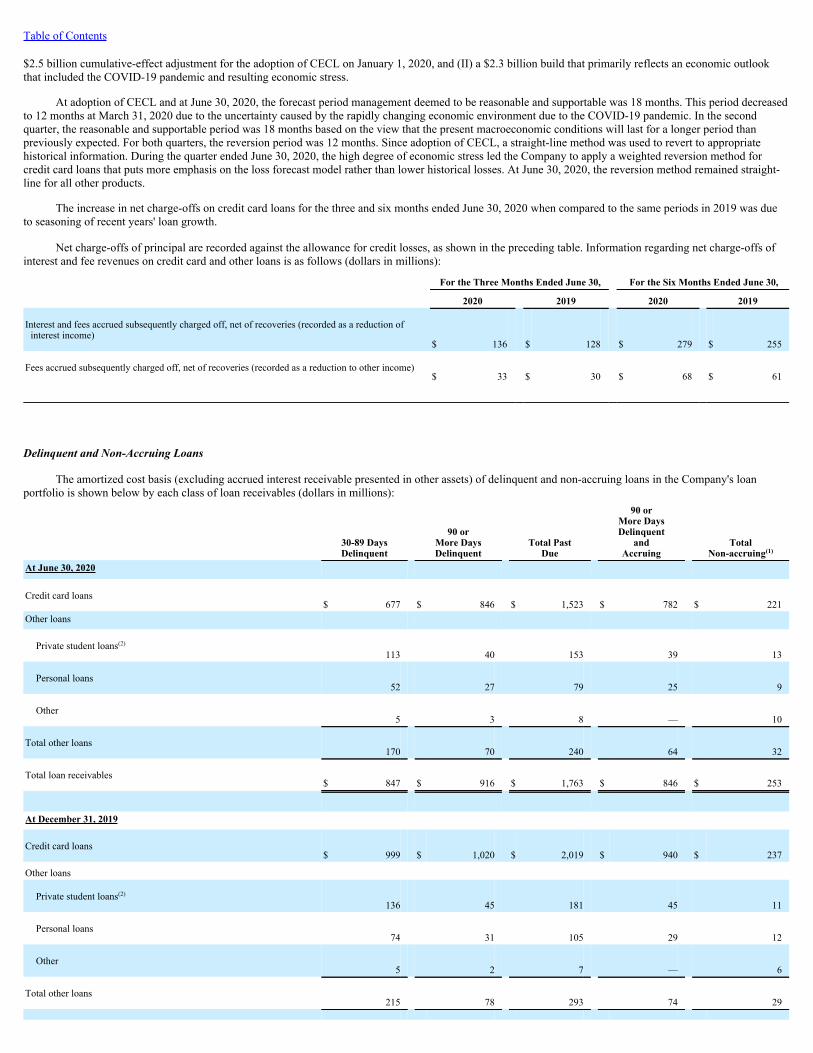


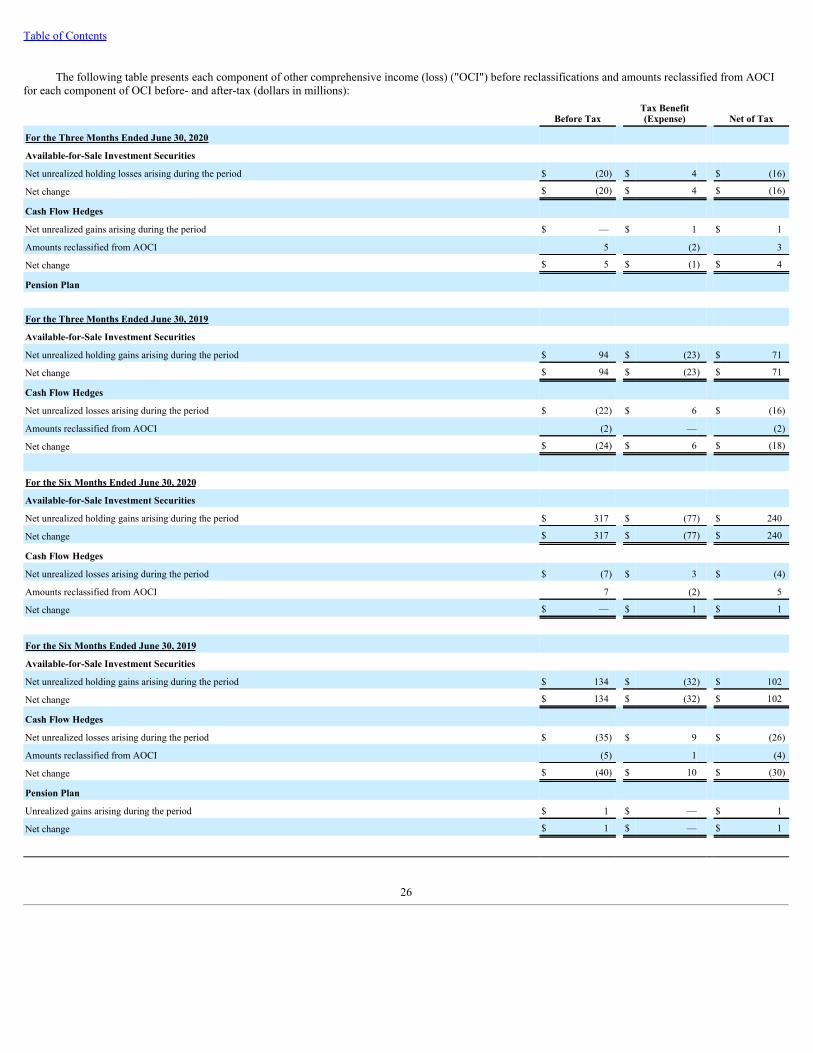


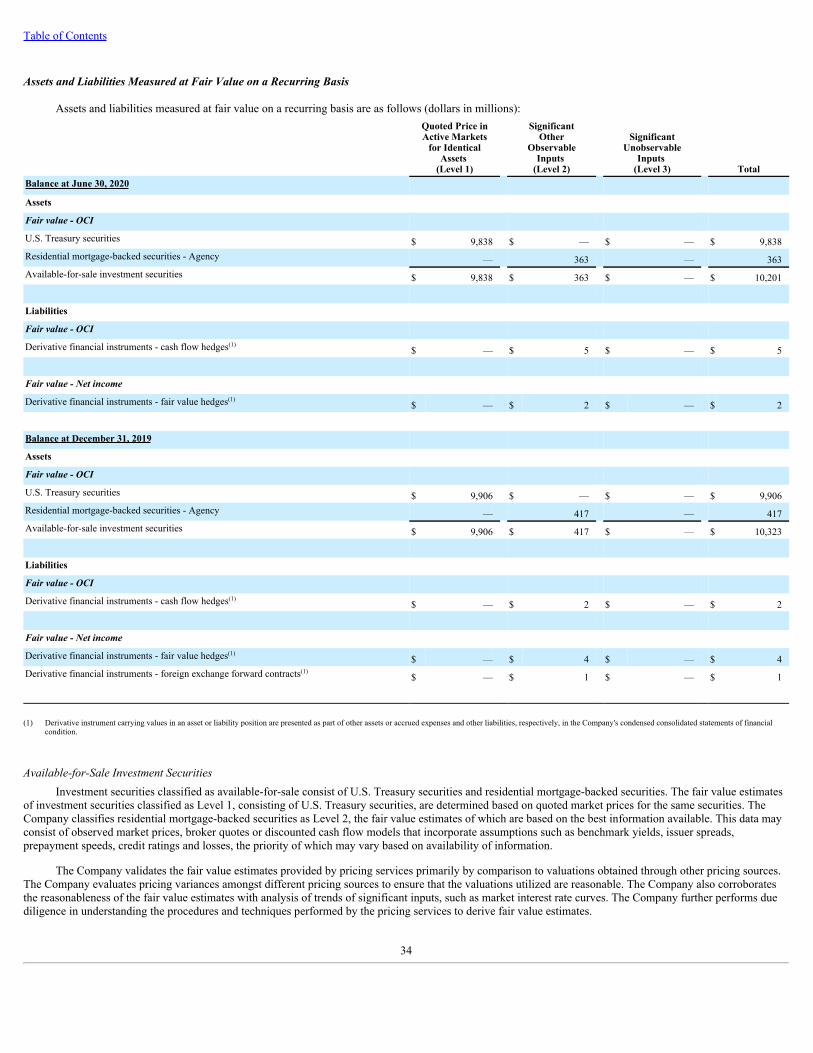


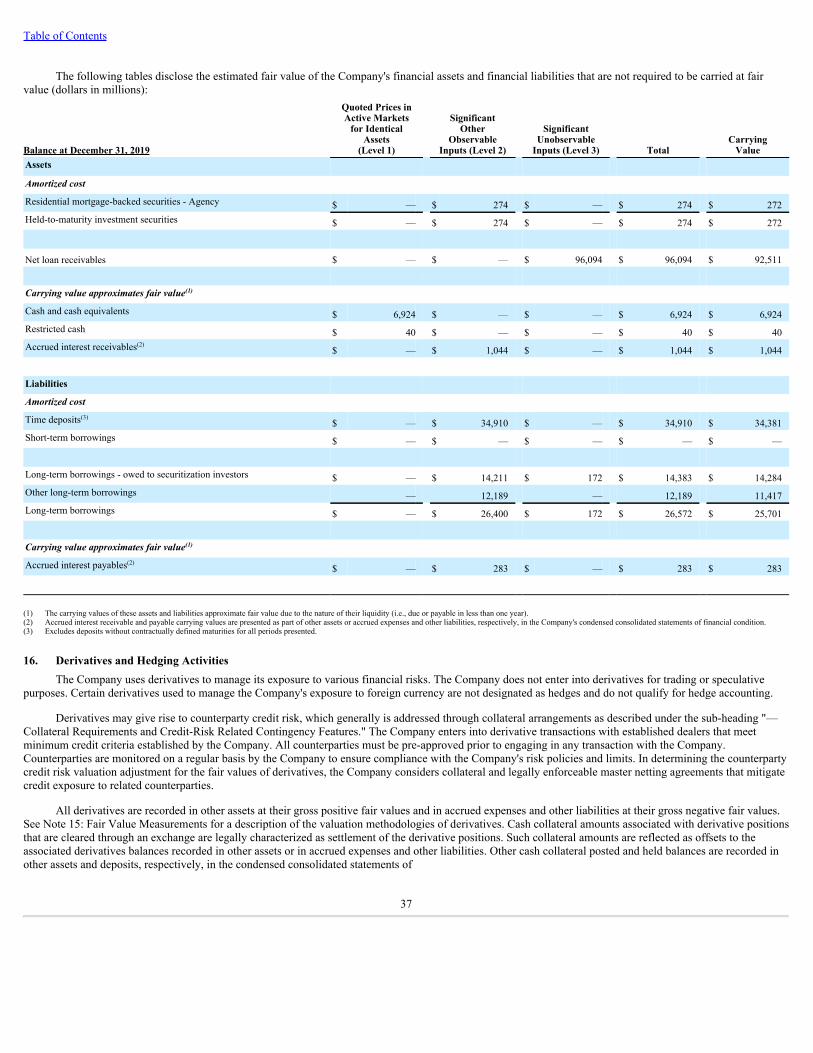


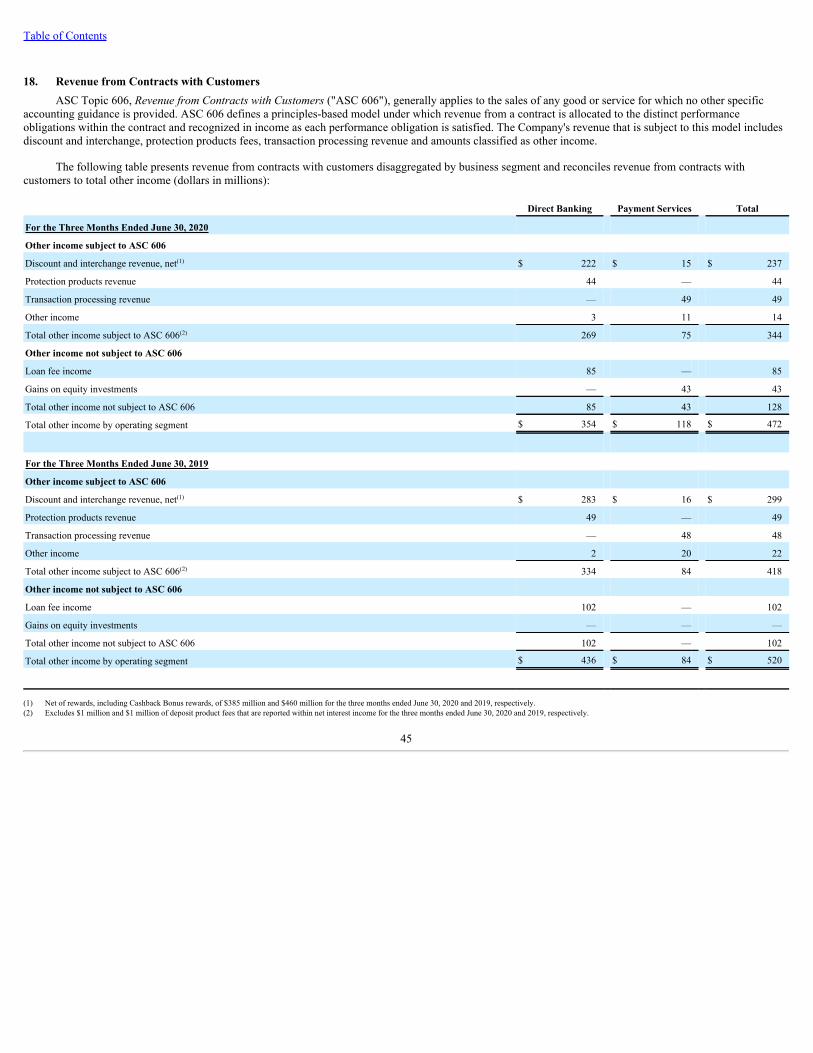


![ÀÊ¼Ó Ó¯¼À Ó ¯£ ª| À ÙÊp£ ÀÆp£ ª j?ZL L& $UP Ud?L0€¦ · j?ZL L& $UP U d?L0;;; ¯¼;ÀÊ¼Ó Ó¯¼À;¯ ; ¯© ÀÆ |;Ó ¯£ ª| ;À ÙÊp£;pÀÀp森 ;];ÀÆp£](https://static.documents.pub/doc/80x56/5f54773748da2f2365375bdb/-p-p-jzl-l-up-udl0-jzl-l.jpg)


![RFM Scoping Policy Brief - partner-religion-development.org · G¼¯À £ÚÆ ß ª ;];Gp¼Æ p£ ÆÚ ;S ¼ ; À;pª; ʪ ¼£Ú ª ;Æ ªÀ ¯ª;Ô Æ ;1 À; ª;£¯|p£ ßpÆ](https://static.documents.pub/doc/80x56/5c06a08009d3f25f308c47c6/rfm-scoping-policy-brief-partner-religion-ga-ua-ss-a-gpa.jpg)
![Lunch & Learn - iowapeersupporttraining.org · S ;1Ê ª | ;] ;1 p¼ª ;À ¼ À;¹ ¼¯ Ó À;pª ;¯ ¹ ¹ ¯ ¼ÆÊ ª ÆÚ;Ư ; ª p ;Ô Æ ;¯ Æ ¼ ÀÊ ¹ ¼Ó À¯ ¼À](https://static.documents.pub/doc/80x56/5bc63f4b09d3f201518be0dc/lunch-learn-io-s-1e-a-1-pa-a-a-o-apa-.jpg)

