37
+ Julian A. Reed, Ed.D., MPH Evaluating Policy and Environmental Change Interventions Michigan Department of Community Health: Building Healthy Communities
| Date post: | 03-Jan-2016 |
| Category: |
Documents |
| Upload: | mitchell-barton |
| View: | 216 times |
| Download: | 1 times |

+
Julian A. Reed, Ed.D., MPH
Evaluating Policy and Environmental Change Interventions
Michigan Department of Community Health:
Building Healthy Communities

+ACKNOWLEDGMENTS
Lisa Grost, MHSA, PAPHSMichigan Department of Community
HealthBHC and Physical ActivityPublic Health Consultant
Karah Mantinan, MPH, RDProject ManagerChildhood Obesity Prevention Mission
ProjectAltarum Institute
2
MDCH Building Healthy Communities 2010
MDCH Building Healthy Communities 2008
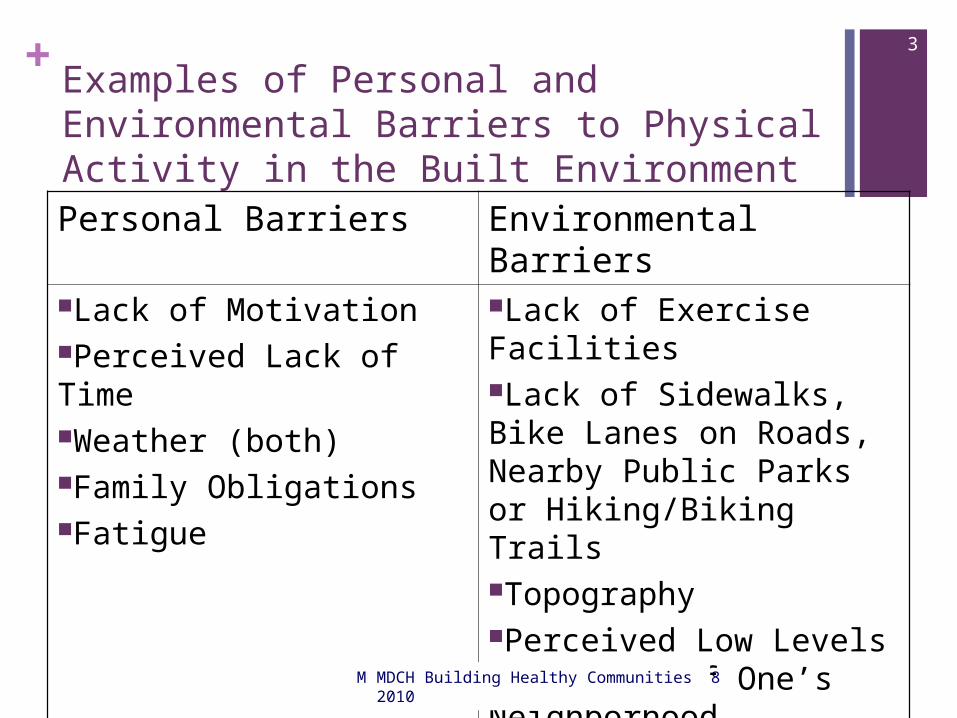
+Examples of Personal and Environmental Barriers to Physical Activity in the Built EnvironmentPersonal Barriers Environmental Barriers
Lack of MotivationPerceived Lack of TimeWeather (both)Family ObligationsFatigue
Lack of Exercise FacilitiesLack of Sidewalks, Bike Lanes on Roads, Nearby Public Parks or Hiking/Biking TrailsTopographyPerceived Low Levels of Safety of One’s Neighborhood
3
MDCH Building Healthy Communities 2010
MDCH Building Healthy Communities 2008
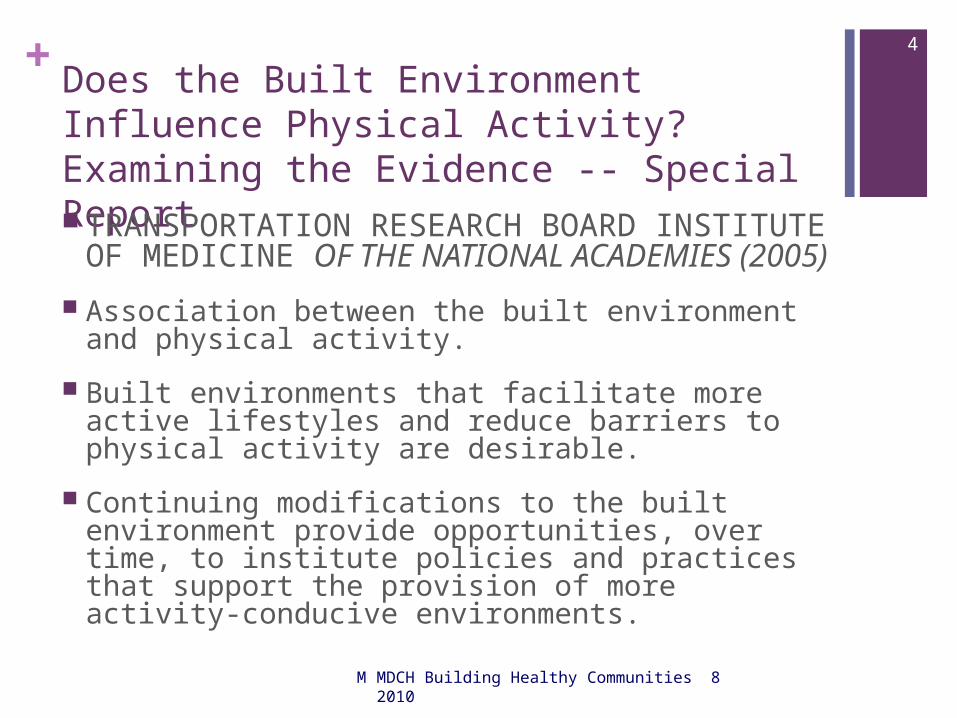
+Does the Built Environment Influence Physical Activity? Examining the Evidence -- Special Report TRANSPORTATION RESEARCH BOARD
INSTITUTE OF MEDICINE OF THE NATIONAL ACADEMIES (2005)
Association between the built environment and physical activity.
Built environments that facilitate more active lifestyles and reduce barriers to physical activity are desirable.
Continuing modifications to the built environment provide opportunities, over time, to institute policies and practices that support the provision of more activity-conducive environments.
4
MDCH Building Healthy Communities 2010

MDCH Building Healthy Communities 2008
+Why Trails?
Accessibility to no-cost recreational facilities like trails have been identified as elements related to physical activity promotion.
Recreational trails have also been identified as an environmental support for activity.
The Center for Disease Control and Prevention’s Task Force on Community Preventive Services recommends environmental interventions that include access to trails to promote physical activity.
5
MDCH Building Healthy Communities 2010

MDCH Building Healthy Communities 2008
+Why Parks?
Parks have a variety of activity settings (e.g., tennis courts, trails, playgrounds, playing fields, etc.) yet we know little about specific features related to quantify activity in parks.
National Recreation and Park Association entitled: Step Up to Health-it Starts in the Parks.
The Trust for Public Land also recently disseminated a report entitled: The Health Benefits of Parks to illustrate the roles parks have in promoting regular activity.
6
MDCH Building Healthy Communities 2010

MDCH Building Healthy Communities 2008
+More on Parks and Trails
Self-report most widely used.
The vast majority of trail and park-user data collected has focused on characteristics describing little information about the activity patterns of adults who use community trails and parks.
7
MDCH Building Healthy Communities 2010

MDCH Building Healthy Communities 2008
+Background on Building Healthy Communities (BHC) Michigan is currently ranked 13th worst in the nation in
mortality from cardiovascular disease and has the 9th highest rate of obesity in the US.
Three risk factors are estimated to play a role in nearly 70% of all chronic diseases: poor nutrition, inadequate physical activity, and tobacco use.
The BHC initiative addresses these three risk factors in Michigan using a population-based approach grounded in the theoretical framework of the Social Ecological Model to prevent chronic disease and improve the health of residents.
8
MDCH Building Healthy Communities 2010

MDCH Building Healthy Communities 2008
+BHC: The Role of Local Health Departments
Local health departments are funded to plan, implement, and evaluate evidence-based interventions with a coalition of local partners that focus on changing the policies and environments in their communities.
9
MDCH Building Healthy Communities 2010
MDCH Building Healthy Communities 2008
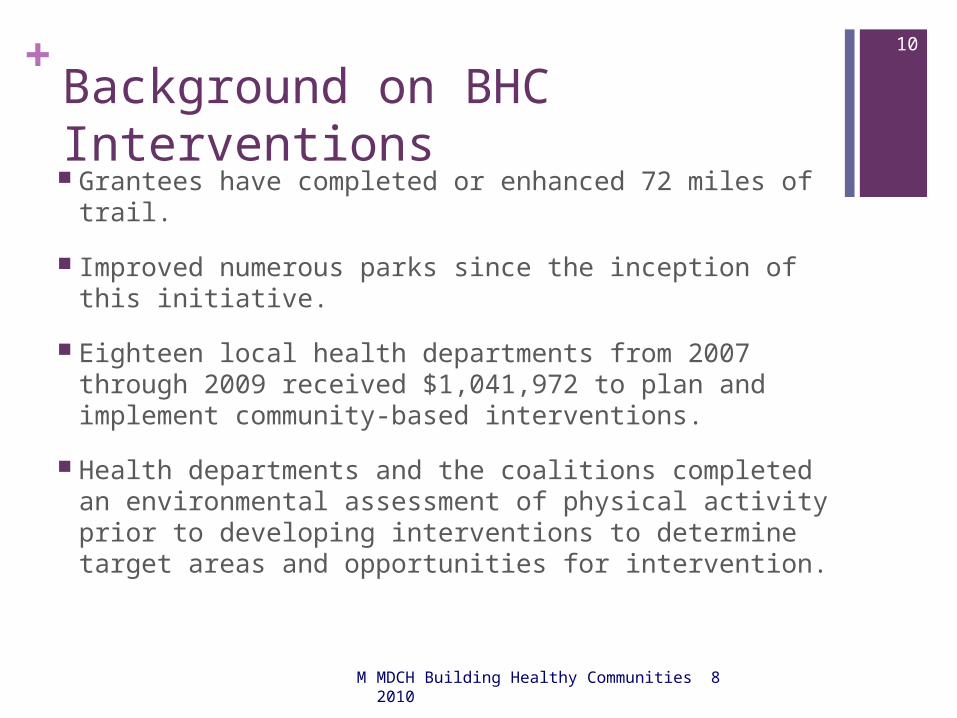
+Background on BHC Interventions Grantees have completed or enhanced 72 miles of
trail.
Improved numerous parks since the inception of this initiative.
Eighteen local health departments from 2007 through 2009 received $1,041,972 to plan and implement community-based interventions.
Health departments and the coalitions completed an environmental assessment of physical activity prior to developing interventions to determine target areas and opportunities for intervention.
10
MDCH Building Healthy Communities 2010

MDCH Building Healthy Communities 2008
+Trail and Park Interventions
Eleven health departments during two funding cycles for 2007/2008 and 2008/2009 chose to develop or enhance trails in their respective communities to promote physical activity.
BHC interventions to promote trail use ranged from: 1. building new trails
2. extending the distance of current trails
3. enhancements with trailheads, benches and lighting
4. trail promotion with signage and building connecting trails between cities
Seven health departments enhanced existing community parks by establishing walking trails within parks or installing new equipment such as playgrounds.
11
MDCH Building Healthy Communities 2010

MDCH Building Healthy Communities 2008
+Why Evaluate Parks and Trails?
Mostly Free and Egalitarian
Distribute Resources Equitably
Who, When, Where
Contextual Elements Impacting Use
Open Environment
Was the Intervention Effective?
NEED OBJECTIVE DATA TO SUGGEST CHANGES
12
MDCH Building Healthy Communities 2010

MDCH Building Healthy Communities 2008
+What is Direct Observation? Direct observation is a methodology to
classify free living behaviors into distinct categories in order to be analyzed.
Direct observation of human behavior in both natural and built environments has been used as an objective methodology to study human behavior for over a century.
It is has been frequently overlooked by physical activity researchers and practitioners.
13
MDCH Building Healthy Communities 2010

MDCH Building Healthy Communities 2008
+Direct Observation and Intercept Surveys
Objective methodologies in concert with survey methods should be utilized.
Surveys are limited to respondents’ perceptions and do not provide contextual information (e.g., trail terrain, air temperature, time of day of trail use, etc.) that could be related to activity behavior.
14
MDCH Building Healthy Communities 2010

MDCH Building Healthy Communities 2008
+The System for Observing Play and Recreation in Communities (SOPARC)a
Based on momentary time-sampling. Separate scans are made for females and males, and for
estimating the age and ethnic groupings of participants. Summary counts describe the number of participants by
gender, activity modes and levels, and estimated age and gender groupings.
Proven valid and reliable for gathering data on: user demographics (e.g., age, sex, race) environmental features (e.g., temperature, weather, equipment) user features (e.g., type of activity) physical activity level (e.g., sedentary, walking, very active)
aMcKenzie et al. System for observing play and recreation in communities (SOPARC): reliability and feasibility measures. Journal of Physical Activity and Health. 2006;3:S208-S222.
15
MDCH Building Healthy Communities 2010
MDCH Building Healthy Communities 2008
+Rationale for SOPARC
Activity and recreation are positively associated with good health.
Investigations of activity participants in “open” environments have been hampered by the lack of an objective tool.
16
MDCH Building Healthy Communities 2010

MDCH Building Healthy Communities 2008
+ 17
MDCH Building Healthy Communities 2010

MDCH Building Healthy Communities 2008
+ 18
MDCH Building Healthy Communities 2010

MDCH Building Healthy Communities 2008
+BHC Overall Trail-Use
To date, (N=7,125) trail users were observed on 17 of Michigan’s trails between 2007 and 2009.
19
MDCH Building Healthy Communities 2010
Frequency Percent
Gender MaleFemale
36383487
51%49%
Age ChildTeenAdultSenior
89610894192 950
13%15%59%13%
Ethnicity WhiteOther
6826 238
97% 3%

MDCH Building Healthy Communities 2008
+ 20
MDCH Building Healthy Communities 2010

MDCH Building Healthy Communities 2008
+Trail-Use by Gender
Fifty-one percent (N=3638) of Michigan trail users were male and 49% (N=3487) were female.
These findings were consistent with current census estimates for Michigan.
21
MDCH Building Healthy Communities 2010
Female Male
Age ChildTeenAdultSenior
392(5.5%) 434(6.1%)2201(31%) 448(6.3%)
497(7%) 655(9.2%)1971(27.8%) 502(7.1%)
MDCH Building Healthy Communities 2008
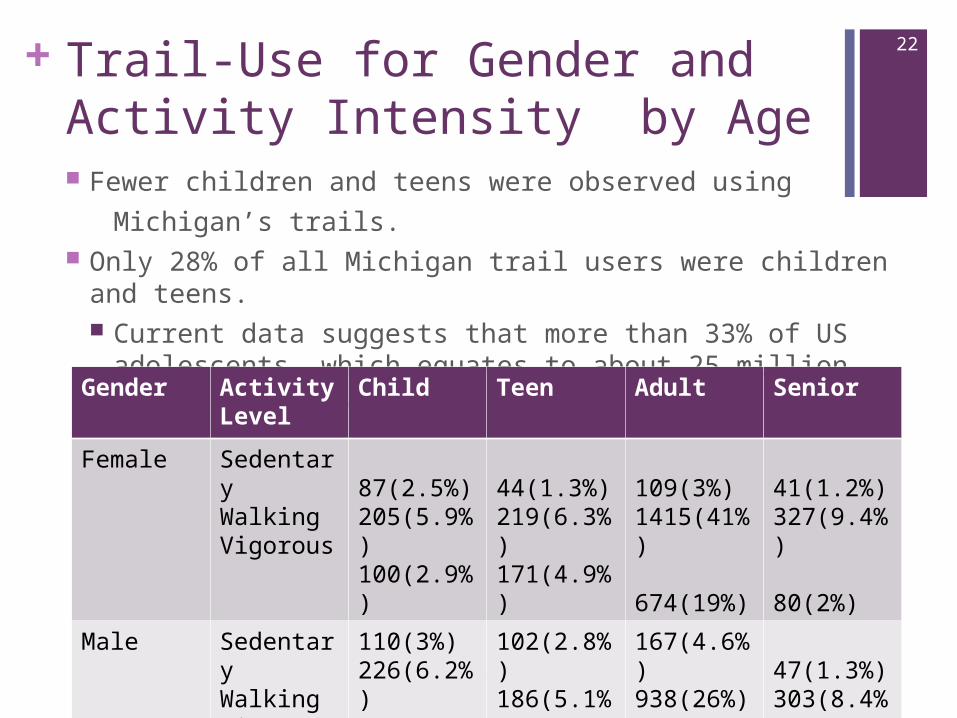
+Trail-Use for Gender and Activity Intensity by Age Fewer children and teens were observed using
Michigan’s trails. Only 28% of all Michigan trail users were children and teens.
Current data suggests that more than 33% of US adolescents, which equates to about 25 million youth are overweight or obese.
22
MDCH Building Healthy Communities 2010
Gender Activity Level
Child Teen Adult Senior
Female SedentaryWalkingVigorous
87(2.5%)205(5.9%)100(2.9%)
44(1.3%)219(6.3%)171(4.9%)
109(3%)1415(41%) 674(19%)
41(1.2%)327(9.4%) 80(2%)
Male SedentaryWalking Vigorous
110(3%)226(6.2%)161(4.5%)
102(2.8%)186(5.1%)367(10%)
167(4.6%)938(26%)859(24%)
47(1.3%)303(8.4%)151(4.2%)

MDCH Building Healthy Communities 2008
+BHC Interventions to Promote Trail-Use: Awareness & Promotion
23
MDCH Building Healthy Communities 2010
Trail Pre (trail users)
Type of Intervention Post (trail users)
Number 1 N = 206 Extend length of trail; Placement of benches and signage on trail.
N =477
Number 2 N =193 Enhanced two routes of the trail by adding signage.
N = 373
Number 3 N = 214 Extend trail an additional five miles to connect two cities and enhance trail with signage.
N = 381
Number 4 N =168 Connect two cities and enhance trail with signage.
N = 328
Number 5 N =164 Enhance trail by adding signage N = 323

MDCH Building Healthy Communities 2008
+Air Temperature Related to
Number of Trail Users
The majority of male and female trail users were observed using the trails when the temperatures were above 60 degrees, Fahrenheit.
Approximately, 80% of users (N=5336) were observed when the ambient temperature was between 61 and 90 degrees.
24
MDCH Building Healthy Communities 2010
MDCH Building Healthy Communities 2008
+Intercept Survey Results (Trail)
Eight-hundred and seventy six (N=876) respondents completed the survey during evaluation periods from 2007-2009.
Many of the intercept survey results were consistent with direct observation findings*.
Approximately 63% of survey respondents between 2007 and 2009 were ‘walking’ when asked to complete the survey.
The majority of respondents were visiting the trail ‘with others’ (57%; N=493).
Trail users reported spending ‘between 1 and 2 hours’ on the trail per visit. In addition, 74% (N=639) of all respondents believed the maintenance of the trails was ‘excellent’.
25
MDCH Building Healthy Communities 2010

MDCH Building Healthy Communities 2008
+Intercept Survey Results (Trail)
Approximately 56% of all respondents reported that the safety and security along the trails was ‘excellent’.
Survey respondents tended to be female which is consistent with previous research examining the demographics of trail users.
However, this finding was not consistent with the direct observation data.
Respondents used the trail primarily for exercise or recreation (89%; N=762); while few respondents used Michigan’s trails for transportation purposes.
Approximately 75% of Michigan survey respondents were 35 years of age or older.
Furthermore, 93% of respondents were white, consistent with Michigan’s trail direct observation findings*.
26
MDCH Building Healthy Communities 2010

MDCH Building Healthy Communities 2008
+BHC Overall Park-Use To date, (N=4137) users were observed in 14 of Michigan’s parks. More males were observed in the parks (N=2369; 55%) than
females. The largest number of park users were children (N=1937; 45%),
followed by adults and teens.
27
MDCH Building Healthy Communities 2010
Frequency Percent
Gender MaleFemale
23691944
55%45%
Age ChildTeenAdultSenior
193710821216 71
45%25%28% 2%
Ethnicity WhiteOther
23331816
56%44%

MDCH Building Healthy Communities 2008
+ 28
MDCH Building Healthy Communities 2010

MDCH Building Healthy Communities 2008
+Park-Use by Gender Fifty-five percent (N=2369) of Michigan park users
were male and 45% (N=1944) were female. These findings are not consistent with current census
estimates for Michigan. Census estimates reveal that approximately 51% of Michigan residents are male and 49% are female.
29
MDCH Building Healthy Communities 2010
Female Male
Age ChildTeenAdultSenior
898(20%)338(8%)679(16%) 29(1%)
1036(24%) 749(17%) 542(13%) 42(1%)

MDCH Building Healthy Communities 2008
+Park-Use for Ethnicity and Activity Intensity by Age Approximately 44% of Michigan park users were minorities.
This finding was significantly different than Michigan’s trail user profile
and was not consistent with current census estimates for Michigan. Current census estimates reveal that only 19% of Michigan residents are
minorities.
30
MDCH Building Healthy Communities 2010
Age Activity Level White (%) Other (%)
Child SedentaryWalkingVigorous
102(5.6%)228(12.6%)661(36.5%)
119(6.6%)422(23.3%)276(15.3%)
Teen SedentaryWalking Vigorous
58(5.7%) 91(8.9%)306(30%)
120(11.8%)241(23.6%)204(20%)
Adult SedentaryWalkingVigorous
307(27%)281(24.7%)149(13.1%)
144(12.7%)211(18.5%) 46(4%)
Senior SedentaryWalking Vigorous
14(9.7%) 32(45.1%) 5(7.0%)
11(15.5%) 9(12.7%) 0(0%)

+Target Areas in Parks
The most frequently used target areas within Michigan’s parks were trails and playgrounds.
Approximately 41% (N=1529) of all park users were observed using these two targets.
The overwhelming majority of users of playgrounds were children and teens.
31
MDCH Building Healthy Communities 2010

MDCH Building Healthy Communities 2008
+Interventions to Promote Park-Use
BHC funded interventions to promote increases in park use were identified following five interventions.
32
MDCH Building Healthy Communities 2010
Park Pre (park users)
Type of Intervention Post (park users)
Number 1 158 Extend length of trail in the park; Placement of benches and signage on trail in the park. 371
Number 2 152 Improve and enhance park by replacing 7 pieces of playground equipment, installing 3 bike racks, putting down wood chips, paving a .25 mile walking path and adding signage to the path.
558
Number 3 22 Implement neighborhood specific non-motorized transportation plans and safety improvement plans.
85
Number 4 79 Improve safety and increase usability of park through installation of benches along a half mile walking path, removal of brush and installation of lighting.
108
Number 5 122 Installed walking path around perimeter of the park. 147
MDCH Building Healthy Communities 2008
+Air Temperature Related to
Number of Park Users Similar to Michigan’s trail findings, approximately
83% of male and female park users were observed between 61 and 90 degrees Fahrenheit (N=2936).
Contextual elements like weather and temperature have been found to impact physical activity.
The limited studies available suggest physical activity levels do vary with seasonality and the impact of poor and extreme weather has been identified as a barrier to activity among various populations.
33
MDCH Building Healthy Communities 2010

MDCH Building Healthy Communities 2008
+Intercept Survey Results (Park)
One-hundred and eighty-seven (N=187) park respondents were surveyed.
Michigan survey respondents tended to be female This finding was not consistent with the direct observation findings.
Similar to the survey findings for trail users, walkers were surveyed most.
In addition, 60% (N=110) of park users visited the park ‘with others’. This finding was consistent with trail users surveyed.
Similar to the target area findings using direct observation, the most common activity among park visitors was trail use.
34
MDCH Building Healthy Communities 2010
MDCH Building Healthy Communities 2008
+Intercept Survey Results (Park)
The majority of park users (26%) visited their respective park 4 or more times per week.
Initially, the majority of survey respondents (36%) reported that the ‘safety and security’ in their park was ‘excellent’. This perception changed during subsequent evaluations among
users as respondents reported the ‘safety and security’ of their park to be ‘good’ (27%) instead of ‘excellent’.
Approximately, 21% of park users surveyed in 2007/2008 transported themselves to their respective park by ‘motorized vehicle’; yet by 2008/2009 the most frequently cites response was ‘walking’ (36%).
35
MDCH Building Healthy Communities 2010
MDCH Building Healthy Communities 2008
+Conclusions and Implications for Increasing Trail Use among Michigan Residents
More males use Michigan’s trails for physical activity White, adults were the primary users of trails Fewer children, teens and seniors use Michigan’s trails Walking was the most common behavior observed on the trail Interventions including signage/prom. had significant increases in trail use Males used trails for walking and vigorous activity Michigan’s trails were perceived to be well maintained and relatively safe Users tended to visit the trail with someone and spend 1 to 2 hours on the trail each
visit
Based on the summary of findings presented above, additional strategies to promote trail use among children, teens and seniors need to be examined.
Greater efforts to promote trail use among underserved populations such as minorities should be considered. This is an extremely important element, since the majority of trail users surveyed were white, college graduates.
36
MDCH Building Healthy Communities 2010

MDCH Building Healthy Communities 2008
+Conclusions and Implications for Increasing Park Use among Michigan Residents
Children and teens were the primary users of Michigan’s parks Few seniors used parks for physical activity in Michigan Playgrounds were a popular target area for child and teen physical activity Adults primarily engaged in walking behavior in Michigan’s parks Interventions: the enhancement of trails within a park led to increases in park
use Michigan’s parks are used by both white and minorities for physical activity Park users spend between 1 to 2 hours per visit in Michigan’s parks Michigan’s park users visit their respective park 4 or more times per week Michigan’s parks are perceived to be well maintained and safe and secure
Considering that minorities are less active than white youth and adults-enhancing parks should be considered an appropriate intervention approach among Michigan residents.
37
MDCH Building Healthy Communities 2010


