37


02
01
Business Philosophy
Members of Top Management
Letter to Shareholders
Launch Customer Centric Growth Strategy
Lite-On Value
LOHAS Lite-On
1.0 Corporate Overview
1.1 Company Profile
1.2 Organization Chart
1.3 Board Members and Supervisors
1.4 Major Shareholders
1.5 Issuance of Corporate Bonds
1.6 Issuance of Global Depositary Receipts
1.7 Introduction of Lite-On Awards
1.8 Introduction of Lite-On Cultural Foundation
2.0 Operational Highlights
2.1 Business Overview
2.2 Market and Sales Overview
3.0 Financial Information
3.1 Financial Historical Summary
3.2 Supervisor's Report
3.3 Standalone Financial Statements of 2006
3.4 Consolidated Financial Statements of 2006
03
05
07
11
13
21
23
23
24
25
25
26
28
29
29
31
33
34
39
41
45
46
54
Table of Contents
04
03
Vision To become a company of World Class Excellence
Business Scale : US$8 billion
Leadership : worldwide absolute No. 1
Profitability : top in the industry
Corporate governance : transparent, independent and unbiased
Corporate citizenship : globalization, environmental friendliness, social responsibility
Mission Short-term : major player in opto-electronic components
Long-term : global leader in digital converged devices
Strategy Profitable Growth
Customer Value Creation
Cash Flow Maximization
Lite-On Values Customer Satisfaction
Excellence in Execution
Innovation
Integrity
Business Philosopy
Vision
Mission
Strategy
Lite-On Values

06
05
Chairman Raymond Soong
Lite-On Group CEO David Lin (Lite-On Tech. Vice Chairman)
Lite-On Group DCEO Warren Chen (Lite-On Core-Investment CEO)
Lite-On Tech CEO KC Terng
CTO Paul Lo ( Lite-On Automotive Int'l CEO )
CSO Danny Liao ( Lite-On IT CEO)
CFO Andrew Lin
CMO Cherng Chao
Mem
bers of TopM
anagement


12
11
By trimming low-margin businesses and focused on profitable businesses, Lite-On proudly witnessed success from “Profitable Growth”
strategy in the past two years.
Starting a new growth cycle, Lite-On continues to move on with the “Customer Centric Growth” strategy for incoming two years, aiming at
boosting both profits and revenues. By adding new customers and providing “cluster” services, contribution from high-margin products is
expected to expand.
Lite-On depicts its business scope blueprint into three stages. Short term, Lite-On aims to add new customers in high-margin products,
including LED, power supply and casing. In the mid-term, “cluster” business model within handset, game console, notebook, printer and
LCD TV will be the growth engines. In the long-term, Lite-On will steer into car components.
Launch Customer CentricGrowth Strategy
14
13
Customers are the ones who sign our paychecks.
Identi fying their needs and understanding their markets wi l l
help maximize value creation for our customers.
CUSTOMER SATISFACTION

16
15
First movers in the market always capture the future trends, formulate
strategies accordingly and perform execution effect ively in advance to the competi tors.
EXCELLENCE IN EXECUTION

18
17
Innovation often ends in complacency and is always fueled by dai ly renovations.
INNOVATION

20
19
Trust from shareholders, customers, employees and suppl iers is earned by strong commitment to integri ty.
And that trust is the fountainhead for companies that are bui l t to last.
INTEGRITY

22
21
"LOHAS", a new life style originated from the western society, occurs to underline the same living attitude as Lite-On's corporate culture -
"Joy, Growth, Health, and Balance", both are to encourage people to live a "Life Style of Health and Sustainability".
"LOHAS LITE-ON", a brand new corporate image esteemed by the public ever since.
Employees are the major assets of Lite-On. With the belief that employees could only ignite their professions by living a physically and
mentally balanced life, Lite-On provides the most encouraging and healthy environment. By every employee's dedication, Lite-On will
continue to develop at a fast pace, and create a bright future.
"LOHAS LITE-ON" for Bright Future

26
25
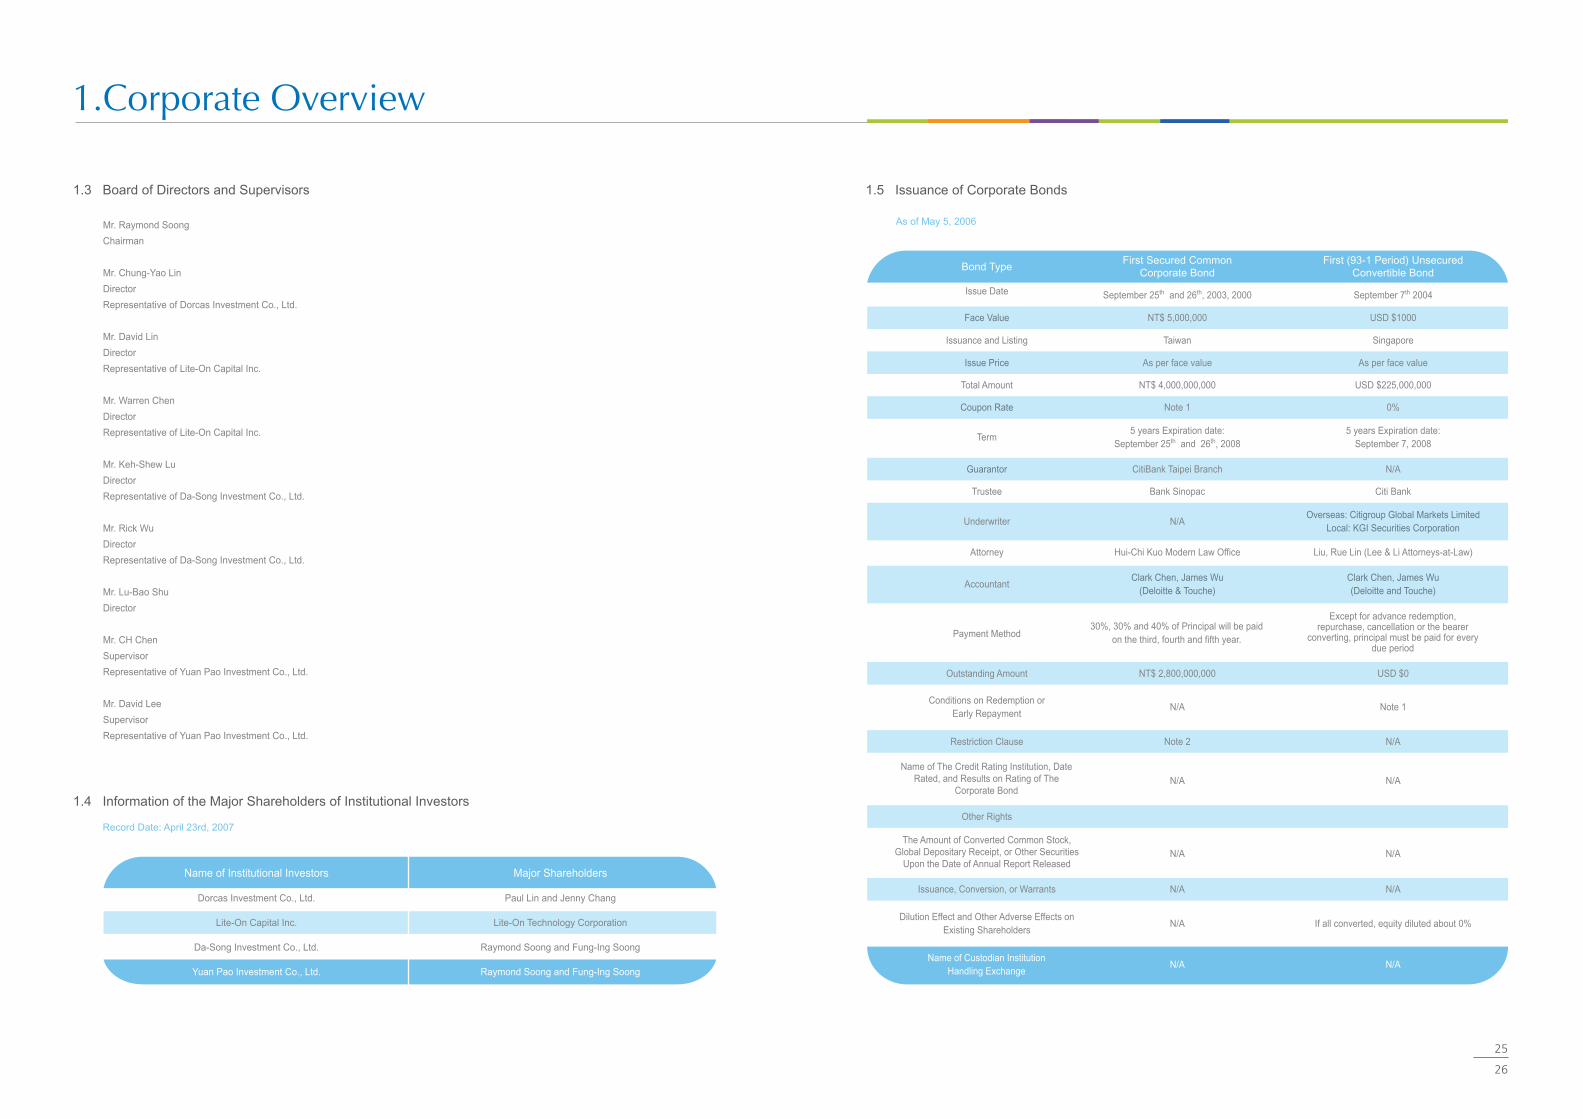
1.3 Board of Directors and Supervisors
1.4 Information of the Major Shareholders of Institutional Investors
Record Date: April 23rd, 2007
Mr. Raymond Soong
Chairman
Mr. Chung-Yao Lin
Director
Representative of Dorcas Investment Co., Ltd.
Mr. David Lin
Director
Representative of Lite-On Capital Inc.
Mr. Warren Chen
Director
Representative of Lite-On Capital Inc.
Mr. Keh-Shew Lu
Director
Representative of Da-Song Investment Co., Ltd.
Mr. Rick Wu
Director
Representative of Da-Song Investment Co., Ltd.
Mr. Lu-Bao Shu
Director
Mr. CH Chen
Supervisor
Representative of Yuan Pao Investment Co., Ltd.
Mr. David Lee
Supervisor
Representative of Yuan Pao Investment Co., Ltd.
Name of Institutional Investors
Dorcas Investment Co., Ltd.
Lite-On Capital Inc.
Da-Song Investment Co., Ltd.
Yuan Pao Investment Co., Ltd.
Major Shareholders
Paul Lin and Jenny Chang
Lite-On Technology Corporation
Raymond Soong and Fung-Ing Soong
Raymond Soong and Fung-Ing Soong
1.5 Issuance of Corporate Bonds
As of May 5, 2006
Bond TypeFirst Secured Common
Corporate BondFirst (93-1 Period) Unsecured
Convertible Bond
5 years Expiration date:September 25th and 26th, 2008
Overseas: Citigroup Global Markets LimitedLocal: KGI Securities Corporation
5 years Expiration date:September 7, 2008
Term
Guarantor
Trustee
Coupon Rate
Total Amount
Issue Price
Issuance and Listing
Face Value
Issue Date
Clark Chen, James Wu(Deloitte & Touche)
Hui-Chi Kuo Modern Law Office
Clark Chen, James Wu(Deloitte and Touche)
Except for advance redemption, repurchase, cancellation or the bearer
converting, principal must be paid for every due period
The Amount of Converted Common Stock, Global Depositary Receipt, or Other Securities
Upon the Date of Annual Report Released
30%, 30% and 40% of Principal will be paid on the third, fourth and fifth year.
Dilution Effect and Other Adverse Effects onExisting Shareholders
Name of The Credit Rating Institution, Date Rated, and Results on Rating of The
Corporate Bond
Liu, Rue Lin (Lee & Li Attorneys-at-Law)
Citi Bank
N/A
0%
USD $225,000,000
As per face value
Singapore
USD $1000
September 7th 2004
N/A
Bank Sinopac
CitiBank Taipei Branch
Note 1
NT$ 4,000,000,000
As per face value
Taiwan
NT$ 5,000,000
September 25th and 26th, 2003, 2000
Underwriter
Attorney
Accountant
Payment Method
Other Rights
N/A N/A
N/A N/A
N/A N/A
N/A N/A
N/A If all converted, equity diluted about 0%
Issuance, Conversion, or Warrants
Restriction Clause Note 2 N/A
Conditions on Redemption orEarly Repayment
N/A Note 1
USD $0NT$ 2,800,000,000Outstanding Amount
Name of Custodian InstitutionHandling Exchange
1.Corporate Overview

28
27
Note 1
Security A NT$400,000.000:If 6M LIBOR<0.90%, coupon rate is 6M LIBOR If 0.90%≦6M LIBOR≦2.00%, coupon rate is 3.05%; If 6M LIBOR (2.00%, coupon rate is (4.0001%-6M LIBOR) MIN0.
Security B NT$400,000.000:If 6M LIBOR<0.90%, coupon rate is 6M LIBOR If 0.90%≦6M LIBOR≦2.00%, coupon rate is 3.05%; If 6M LIBOR (2.00%, coupon rate is (4.0001%-6M LIBOR) MIN0.
Security C NT$200,000.000:If 6M LIBOR<0.90%, coupon rate is 6M LIBOR If 0.90%≦6M LIBOR≦2.00%, coupon rate is 3.05%; If 6M LIBOR (2.00%, coupon rate is (4.0001%-6M LIBOR) MIN0.
Security D NT$400,000.000:If 6M LIBOR<0.90%, coupon rate is 6M LIBOR If 0.90%≦6M LIBOR≦2.00%, coupon rate is 3.05%; If 6M LIBOR (2.00%, coupon rate is (4.0001%-6M LIBOR) MIN0.
Security E NT$300,000.000:If 6M LIBOR<0.90%, coupon rate is 6M LIBOR If 0.90%≦6M LIBOR≦2.00%, coupon rate is 3.05%; If 6M LIBOR (2.00%, coupon rate is (4.0001%-6M LIBOR) MIN0.
Security F NT$300,000.000:If 6M LIBOR<0.90%, coupon rate is 6M LIBOR If 0.90%≦6M LIBOR≦2.00%, coupon rate is 3.05%; If 6M LIBOR (2.00%, coupon rate is (4.0001%-6M LIBOR) MIN0.
Security G NT$200,000.000:If 6M LIBOR<0.90%, coupon rate is 6M LIBOR If 0.90%≦6M LIBOR≦2.00%, coupon rate is 3.05%; If 6M LIBOR (2.00%, coupon rate is (4.0001%-6M LIBOR) MIN0.
Security H NT$300,000.000:If 6M LIBOR<0.90%, coupon rate is 6M LIBOR If 0.90%≦6M LIBOR≦2.00%, coupon rate is 3.05%; If 6M LIBOR (2.00%, coupon rate is (4.0001%-6M LIBOR) MIN0.
Security I NT$300,000.000:If 6M LIBOR<0.90%, coupon rate is 6M LIBOR If 0.90%≦6M LIBOR≦2.00%, coupon rate is 3.05%; If 6M LIBOR (2.00%, coupon rate is (4.0001%-6M LIBOR) MIN0.Security J NT$200,000.000:If 6M LIBOR<0.90%, coupon rate is 6M LIBOR If 0.90%≦6M LIBOR≦2.00%, coupon rate is 3.05%; If 6M LIBOR (2.00%, coupon rate is (4.0001%-6M LIBOR) MIN0.
Security K NT$300,000.000:If 6M LIBOR<0.90%, coupon rate is 6M LIBOR If 0.90%≦6M LIBOR≦2.00%, coupon rate is 3.05%; If 6M LIBOR (2.00%, coupon rate is (4.0001%-6M LIBOR) MIN0.
Security L NT$200,000.000:If 6M LIBOR<0.90%, coupon rate is 6M LIBOR If 0.90%≦6M LIBOR≦2.00%, coupon rate is 3.05%; If 6M LIBOR (2.00%, coupon rate is (4.0001%-6M LIBOR) MIN0.
Security M NT$300,000.000:If 6M LIBOR<0.90%, coupon rate is 6M LIBOR If 0.90%≦6M LIBOR≦2.00%, coupon rate is 3.05%; If 6M LIBOR (2.00%, coupon rate is (4.0001%-6M LIBOR) MIN0.
Security N NT$200,000.000:If 6M LIBOR<0.90%, coupon rate is 6M LIBOR If 0.90%≦6M LIBOR≦2.00%, coupon rate is 3.05%; If 6M LIBOR (2.00%, coupon rate is (4.0001%-6M LIBOR) MIN0.
The first coupon date is two business days before the issuing date for each Security. The coupon rate is adjusted by 6M LIBOR on the following coupon dates that are two business days before the basic coupon date of every 6 months starting from the issuing date and is calculated by simple rate on the basic coupon date . The face rate shall not be lower than %. (the business day here means the business days of banks in London. In case of holidays, one business before the basic coupon date is recognized.)
6M LIBOR: 6 month LIBOR means the Fixing Rates of USD 6-Month LIBOR listed on Page 3750 of Money line Telerate at 11 o'clock on the coupon date (London time).
Note2
Based upon the original restriction on the consolidated report (annual certification), the cap of leverage ratio is 125%, the bottom line of current ratio is 100%, the bottom line of TIE ratio is 300%, tangible net worth should be at least NT$35,000,000,000.
1.6 Issuance of Global Depositary Receipts
Items Issue Date September 25, 1996
Important Terms and Conditions in The Deposit Agreement
and The Custody Agreement
Closing Price per GDR
As of March 31, 2007
High
Low
Average
USD$ 17.84
USD$ 11.46
USD$ 13.76
High
Low
Average
USD$ 13
USD$ 12.69
USD$ 12.86
2006
Issuance & Listing
Total Amount
Offering Price per GDR
Units Issued
Underlying Securities
Common Shares Represented
Rights and Obligations of GDR Holders
Trustee
Depositary Bank
Custodian Bank
GDRs Outstanding
Apportionment of The Expenses For The Issuance and The Maintenance
London Stock Exchange
USD$ 71,295,000
USD$14.55
4,900,000 Units
Common Shares from Cash Injection
49,000,000 Shares
Same as Those of Common Share Holders
Citibank,
Citibank,
Citibank,
6,375,978 Units
Borne by the Company
--
1.Corporate Overview

30
29
September 25, 1996
As a corporate citizen, Lite-On Technology Corporation has initiated numerous projects to make contributions back to the society and
help grow its economy, one of them being Lite-On Awards. The annually held competition not only encourages talents of industrial design
to advance their creativity and innovation, it also promotes communication and idea exchange amongst them. Lite-On Awards since its
inception has broadened its scope from a competition within Taiwan to one with participants from all over the world. Taiwan has since
received much attention from industrial design professionals worldwide; in addition, it has also helped the country grow a pool of talents
in the profession of industrial design.
Since 2001, Lite-On Awards has inspired many Taiwanese and overseas Chinese industrial design talents to present their cutting-edge
ideas and inventions. Lite-On Awards has extraordinarily increased exposure throughout the years and received positive recognition from
world's most renowned industrial design professionals. Some Lite-On Awards competition winners have further been awarded by the top
3 global awards, iF Awards, Red Dot Awards, and IDEA Awards.
In April 2007, Lite-On Awards launched its seventh annual competition with the theme of "Foreseeing the Future", and has received
1,700 entries. The theme is to promote creative ideas in 4C (Computer, Communication, Consumer, and Car). Participants have
emerged from 23 countries including Taiwan, China, Hong Kong, Singapore, Korea, Japan, Thailand, India, United States, England,
Ireland, France, Norway, Austria, Italy, Spain, Turkey, Rumania, Arab, Russia, Chile, and Peru. Since its inception, there has been over 7,300
participants, Lite-On Awards has successfully transformed into an industrial design competition of the largest scale within Greater China.
Going forward, Lite-On Awards will continue broadening its horizon to reach more talents and encourage more ideas. Just as iF Awards
is frequently considered the Oscar in industrial design, Lite-On Awards aspires to become the iF Awards for the Chinese descents
around the world.
Founders
The Lite-On Cultural Foundation was established in 1993 with initial funds donated by the three founders of Lite-On Group: Mr. Raymond
Soong, Mr. Paul Lin and Mr. Simon Wu. The Lite-On Group continues to allocate NT$10 million annually to support the Foundation's
initiatives and plans.
Primary Areas of Focus
i.Management of the Taipei Shin-Yi Community College
The purpose of Taipei Shin-Yi Community College offers lifelong learning opportunities to the community. The Foundation was
honorably selected to manage the Taipei Shin-Yi Community College in 2001, offering 110 courses to approximately 3,000 students
during each semester.
ii. Promotion of Counseling Services to Children
Children's counseling group recruits volunteering student parents and trains them before they are assigned to student counseling
offices. The first “Children Counseling Group” was set up in Min- Zu Elementary School of Taipei City in March 1998. There are more
than 40 groups of 20 to 30 volunteers serving at elementary schools, and more than 1,000 volunteers are available to provide children
counseling services. More than 100,000 volunteers have been trained since inception.
1.8 Introduction of Lite-On Cultural Foundation
I
II
iii.Broadcast Educational Programs on Radio
The Foundation started a radio program, “Love in Your Community”, with Good News Broadcasting Station since July, 1997. This
program was renamed twice to “Build a New Home” on January 1st 2001 and then “Community College EASY GO” on August 1st
2003. The radio program discusses various topics such as life-time learning, environment protection, art and life, health, community
counseling services, local literatures and history, community services, volunteering services, teenage issues, senior welfare,
government policy and oversea community introduction.
iv.Sponsor Community Publications
The Foundation has published 17 titles of ”Community Development” series so far with the sponsorship of Bureau of Interior, R.O.C.
Awards and Achievement
i.The Lite-On Children Counseling Group
The Foundation received the Group and Personal Award for Youth Volunteer Service from National Youth Commission in 2001.
Junior High School, Lee Shan Elementary School and Da Hu Elementary School received the Group and Personal Golden
Diamond Awards from the Government of Taipei City.
Children Counseling Groups at Min-Zu Elementary School received the Group Golden Diamond Award from the Government of
Taipei City.
Children Counseling Groups at Min-Zu Elementary School, Jian Kang Elementary School and Fu Lin Elementary School received
the Personal Golden Diamond Award from the Government of Taipei City.
The quarterly magazine “Gen Shin Garden”, published by the Lite-On Children Counseling Group, won the “2002 Education
Publication Excellence Award” from the Executive Yuan of the Taiwan government.
The Lite-On Cultural Foundation was selected to manage the “National Children Counseling Seminar” from 2001 to 2002 by
Children's Bureau of Interior R.O.C.
Children Counseling Groups at Xi Song Elementary School received the Group and Personal Golden Diamond Awards from the
Government of Taipei City in 2005.
ii. Broadcasting Programs
The program, “Love in your community”, received the Golden Bell Award (Society Development Award) from the Government
Information Office of Executive Yuan in 1997 and received the Broadcast Culture Award (Special Cultural Report Award) from the
Council for Cultural Affairs of Executive Yuan in 1998.
”Searching for the Root”, a unit of “Build a New Home”, was recognized as Excellent Culture Program by the Council for Cultural
Affairs of Executive Yuan in 2001 and 2002.
“Build a New Home,” a radio program broadcasted by the Lite-On Cultural Foundation, won the National Golden Voice Award for the
Best Talk Program” in 2002.
iii. Others
Taipei Shin-Yi Community College, managed by the Lite-On Cultural Foundation, won “Excellence Award for Management and
Development” from the Bureau of Education Administration of Government of Taipei City for the second consecutive year.
The Foundation received “The Group Service Award of Social Education” from the Ministry of Education in 1998.
The Foundation received the “Golden Wen-Xin Award” in 1998 and “Wen-Xin Award” in 2001 from the Council for Cultural Affairs
(CCA) of Executive Yuan.
The Foundation was selected to manage an inspection tour for post-earthquake reconstruction in Kobe, Japan.
III
1.7 Introduction of Lite-On Awards
■
■
■
■
■
■
■
■
■
■
■
■
■
■
1.Corporate Overview

34
33
Business Function% of Sales
in 2006Major Business
GroupsMajor Products
2.1 Business Overview
I Business Scope
2.2 Market and Sales Overview
I Market Analysis
CRT color displays.
LED color displays.
Scanning modules.
MFPs.
Phone camera modules.
GPS PDAs.
Power supplies for desktop and notebook PCs.
Power supplies for fax machines, printers,
and scanners.
Power supplies for servers and workstations.
SMD LED, LED indicators, and LED displays.
Infrared products.
Photocouplers.
Desktop computer full systems.
Desktop computer barebone systems.
Network interface cards, switches, and routers.
Modems.
Design, develop, manufacture, and
sales in digital display products.
Design, develop, manufacture, and
sales in imaging-related, portable
image devices, and PDA products.
Design, develop, manufacture, and
sales in power supply products.
Design, develop, manufacture, and
sales in opto-electronics products.
Design, develop, manufacture, and
sales in computer products, network
products, and other PC-related
components.
45%
14%
16%
6%
19%
Digital Display
Imaging
Power Supply
Optoelectronics
Others
■
■
■
■
■
■
■
■
■
■
■
■
■
■
■
■
To strengthen R&D for software and System On Chip: In the future, 4C products will become “lighter, thinner, shorter, smaller,
cheaper, and more efficient”, and should be “ready to use, handy, and easy to use”. Lite-On Technology will focus on developing the
technology of software and System On Chip, as well as the R&D capacity thereof.
To enhance intellectual property: Encouraging innovation, controlling patents, creating advantage in unfair competition, and avoiding
repeated R&D time and expenses by professional IP management, as well as reducing R&D costs.
To establish Lite-On Technology R&D Center: Integrating current R&D technology platforms and promoting e-design in order to increase
the efficiency of R&D and shorten the R&D time; participating more in large scale projects in the production or governmental fields, in
order to upgrade technology level; and recruiting outstanding talent from National Defense and cooperating with colleges to establish
Incubator Centers, in order to contribute to the development of professional talent and further develop R&D potential for the Company.
Electronic circuit design, system integration design and testing, and software development and integration
Large-size, wide-format, high-performance LCD monitors
High-brightness and high-power LED technologies and applications
High-performance color laser multifunctional printer
Digital LCD TV used power supply products
Wireless networking and communication modules
1. Major Products of the Company:
Lite-On Technology stands in the leading position in optoelectronics components areas. The Company's major products, including
Digital Display, Imaging, Power Supply, and Optoelectronics, accounted for over 80% of the 2006 worldwide consolidated revenue.
The Company either sustained or strengthened its competitive position in these segments during 2006 and looks to further solidify or
gain market share. Hereunder is the market analysis of the four major products:
(1) Digital Display
Based on the latest IDC report, in 2007 there will be about 160 million units of desktop LCD monitors of demand in the market, a
growth of 30% from 2006. This growth rate is to accelerate from less than 10% in 2006, the reason being the rollout of the new
Vista platform plus replacement demand. Prices of panels, which make over 90% of the bill of materials for LCD monitors, saw
more drops in 2006 that LCD monitors have become even more affordable than two years ago. This may create a demand to
upgrade from 17" to 19" or demand for replacement. Moreover, IDC also estimates that by 2009, the entire LCD monitor market
will expand to over 200 million units. Therefore, the Company is expecting the strength in the growth for LCD monitors to continue
for incoming years.
(2) Imaging
Growth in the printer market has been accelerating for the past few years since the photo printer and multiple function peripheral
(MFP) were introduced to the market. Lite-On Technology foresees that both color inkjet and color laser MFP's will create the
need for customers to replace their existing printers, which becomes the major growth driver for the Imaging business. MFP
generally combines the features of copying, printing, and scanning together. When the fax function is added to the system, it is
called a 4-in-1 MFP. In 2004, the Company successfully developed the 8-in-1 MFP, in 2005, the Company successfully launched
photo printers and photo MPF's. In 2006, the Company saw significant growth in demand for laser technologies and starting from
2007, the Company will have the complete product portfolio from inkjet printers to color laser MFP's to offer to its customers.
(3) Power Supply
The Switching Power Supply (SPS) market has been growing steadily, where it is most commonly applied in the IT-related
products. Statistics from Micro Tech Consultant indicates that the global market value of SPS was about US$ 18.1 Billion with an
annual growth rate of 4%. It is estimated that the market value will grow another 4% reaching over US$ 20 Billion by 2009.
Because of wide variety in applications, SPS only has limited impact from the short-term downturn of the IT industry, and has
been able to maintain steady growth. SPS products can be categorized into two different types - AC/DC and DC/DC, where
AC/DC converters currently owns about 80% of the total market share. Currently, SPS for IT products is the primary application
with about 43% of market share, followed by communication and industrial equipments, at about 20% and 16%, respectively.
II
■
■
■
■
■
■
■
■
III
Major Future R&D Directions
Major R&D Focus in 2007
2.Operational Highlights
Unit: Thousand of NT dollars
IV Research and Development
2002
818,646
1.68%
Item / Year
R&D Expenses
Expense amount as a % of net sales
2003
1,873,467
1.88%
2004
2,031,020
1.30%
2005
2,171,642
1.33%
2006
1,974,739
1.38%
36
35
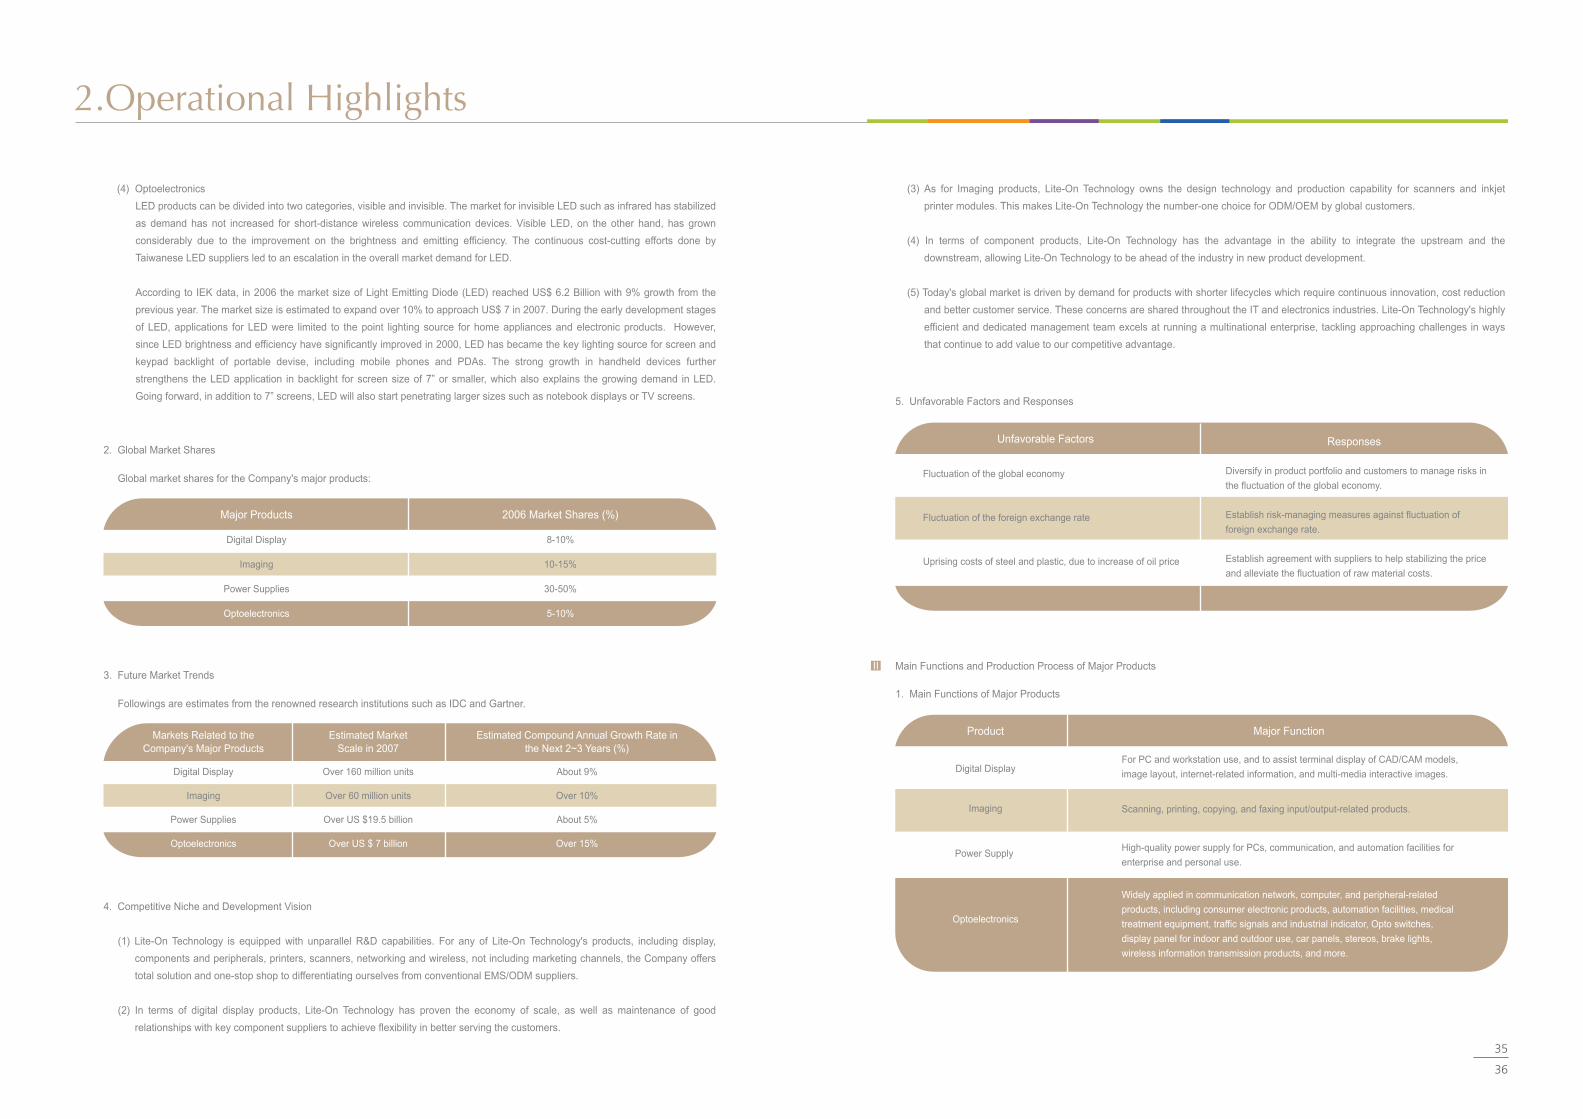
(4) Optoelectronics
LED products can be divided into two categories, visible and invisible. The market for invisible LED such as infrared has stabilized
as demand has not increased for short-distance wireless communication devices. Visible LED, on the other hand, has grown
considerably due to the improvement on the brightness and emitting efficiency. The continuous cost-cutting efforts done by
Taiwanese LED suppliers led to an escalation in the overall market demand for LED.
According to IEK data, in 2006 the market size of Light Emitting Diode (LED) reached US$ 6.2 Billion with 9% growth from the
previous year. The market size is estimated to expand over 10% to approach US$ 7 in 2007. During the early development stages
of LED, applications for LED were limited to the point lighting source for home appliances and electronic products. However,
since LED brightness and efficiency have significantly improved in 2000, LED has became the key lighting source for screen and
keypad backlight of portable devise, including mobile phones and PDAs. The strong growth in handheld devices further
strengthens the LED application in backlight for screen size of 7” or smaller, which also explains the growing demand in LED.
Going forward, in addition to 7” screens, LED will also start penetrating larger sizes such as notebook displays or TV screens.
2.Operational Highlights
Global market shares for the Company's major products:
2. Global Market Shares
Global market shares for the Company's major products:
Major Products
Digital Display
Imaging
Power Supplies
Optoelectronics
2006 Market Shares (%)
8-10%
10-15%
30-50%
5-10%
Global market shares for the Company's major products:
3. Future Market Trends
Followings are estimates from the renowned research institutions such as IDC and Gartner.
Digital Display
Imaging
Power Supplies
Optoelectronics
Markets Related to theCompany's Major Products
Over 160 million units
Over 60 million units
Over US $19.5 billion
Over US $ 7 billion
Estimated MarketScale in 2007
Estimated Compound Annual Growth Rate in the Next 2~3 Years (%)
About 9%
Over 10%
About 5%
Over 15%
4. Competitive Niche and Development Vision
(1) Lite-On Technology is equipped with unparallel R&D capabilities. For any of Lite-On Technology's products, including display,
components and peripherals, printers, scanners, networking and wireless, not including marketing channels, the Company offers
total solution and one-stop shop to differentiating ourselves from conventional EMS/ODM suppliers.
(2) In terms of digital display products, Lite-On Technology has proven the economy of scale, as well as maintenance of good
relationships with key component suppliers to achieve flexibility in better serving the customers.
(3)As for Imaging products, Lite-On Technology owns the design technology and production capability for scanners and inkjet
printer modules. This makes Lite-On Technology the number-one choice for ODM/OEM by global customers.
(4)In terms of component products, Lite-On Technology has the advantage in the ability to integrate the upstream and the
downstream, allowing Lite-On Technology to be ahead of the industry in new product development.
(5) Today's global market is driven by demand for products with shorter lifecycles which require continuous innovation, cost reduction
and better customer service. These concerns are shared throughout the IT and electronics industries. Lite-On Technology's highly
efficient and dedicated management team excels at running a multinational enterprise, tackling approaching challenges in ways
that continue to add value to our competitive advantage.
Unfavorable Factors Responses
Diversify in product portfolio and customers to manage risks in
the fluctuation of the global economy.
Establish risk-managing measures against fluctuation of
foreign exchange rate.
Establish agreement with suppliers to help stabilizing the price
and alleviate the fluctuation of raw material costs.
Fluctuation of the global economy
Fluctuation of the foreign exchange rate
Uprising costs of steel and plastic, due to increase of oil price
5. Unfavorable Factors and Responses
1. Main Functions of Major Products
II Main Functions and Production Process of Major Products
Product Major Function
For PC and workstation use, and to assist terminal display of CAD/CAM models,
image layout, internet-related information, and multi-media interactive images.
High-quality power supply for PCs, communication, and automation facilities for
enterprise and personal use.
Widely applied in communication network, computer, and peripheral-related
products, including consumer electronic products, automation facilities, medical
treatment equipment, traffic signals and industrial indicator, Opto switches,
display panel for indoor and outdoor use, car panels, stereos, brake lights,
wireless information transmission products, and more.
Scanning, printing, copying, and faxing input/output-related products.
Digital Display
Imaging
Power Supply
Optoelectronics

38
37
2.Operational Highlights
Global market shares for the Company's major products:
2. Production Process of Major Products
4. List of Major Customers and Suppliers in the Past Two Years
3. Status of Material Supply
All domestic and foreign Lite-On Technology factories retain a cooperative, long-term relationship with material suppliers. Suppliers
are able to provide components on-time and help Lite-On Technology achieve competitive production costs through reasonable
pricing. This process leads to smoother, more cost-effective production and enables Lite-On Technology to provide customers with
the highest quality of goods and best service.
Unit: Thousand of NT dollars
(1). List of Major Customers
Customer's Name
Lite-On Trading USA, Inc
HPQ
Others
Amount
48,533,369
17,162,506
97,097,351
% of Cost of Goods Sold
30%
11%
59%
2005
Amount
42,350,860
20,806,572
80,238,810
% of Cost of Goods Sold
30%
15%
55%
2006
Unit: Thousand NT dollars
Unit: Thousand of Units, Sets, or NT dollars
(2). List of Major Suppliers
Supplier's Name
Titanic Capital Service
Others
Amount
71,056,771
74,239,390
% of Annual Sales
49%
51%
2005
Amount
66,126,018
63,676,538
% of Annual Sales
51%
49%
2006
5. Production Capacity/Volume/Value Table in the Past Two Years
Unit: Thousand of Units, Sets, or NT dollars
6. Sales Volume/Value Table in the Past Two Years
2005
10,579
20,894
65,861
5,061,419
76,497
5,235,250
10,946
15,930
65,861
5,061,419
45,508
5,199,664
72,849,248
12,990,053
19,381,847
7,944,879
34,699,850
147,865,877
Capacity Volume Value
2006
Capacity Volume Value
13,626
14,594
71,159
6,458,890
113,349
6,671,618
11,188
14,594
71,159
6,458,890
64,924
6,620,755
65,392,196
15,671,329
23,309,428
8,866,019
30,706,003
143,944,975
Digital Display
Imaging
Power Supply
Optoelectronics
Others
Total
Note: Figures above are based worldwide consolidated numbers.
Major Product
Production Year
2005
Domestic Sales
18
3,589
16,080
387,465
7,293
414,445
14,733
4,417,842
7,623,237
509,425
3,413,787
15,979,024
Volume Value
11,018
11,642
46,697
4,081,088
43,760
4,194,205
76,345,603
12,362,839
13,164,142
7,219,961
37,721,657
146,814,202
Volume Value
Digital Display
Imaging
Power Supply
Optoelectronics
Others
Total
Major Product
SalesYear
Export
2006
Domestic Sales
0
59
3,058
1,042,387
328
1,045,832
71
95,135
838,724
1,112,738
40,545
2,087,213
Volume Value
11,880
8,869
65,124
4,785,169
48,815
4,919,857
70,229,103
5,218,192
24,224,080
7,534,517
34,103,137
141,309,029
Volume Value
Export
Materials
Incoming
SMT/
Parts Assembly
Quality Control
Inspection
Quality Control
Inspection
Electrical Test/
Appearance Inspection/
Packaging1. Digital Display
2. Imaging
3. Power Supply
4. Optoelectronics
Storage of Finished
Products in Warehouse
Shipping
Pass
Pass
No
No
Major Products


42
41
3.1 Financial Historical Summary
I Brief Balance Sheet and Income Statement for the Last 5 Years
i.Balance Sheet
Unit: Thousand of NT dollars
Financial Data for the Last 5 Years (Note 1)Year
Items 2002 2003 2004 2005 2006
Fiscal YearUntil
3/31/2007
34,501,324
25,239,734
7,387,659
100,751
1,189,078
68,418,546
25,926,702
28,886,409
1,436,994
185,327
27,549,023
30,508,730
19,094,383
17,794,499
5,988,417
1,537,730
(515,073)
518,362
-
40,869,523
37,909,816
Current Assets
Long-Term Investment
Fixed Assets
Intangible Assets
Other Assets
Total Liabilities
Before Distribution
After Distribution
Before Distribution
After Distribution
Before Distribution
After Distribution
Before Distribution
After Distribution
Long-Term Liabilities
Other Liabilities
Capital Stock
Capital Surplus
45,884,378
30,223,137
4,022,951
-
664,251
80,794,717
31,469,410
34,805,523
4,393,002
460,404
36,322,816
39,658,929
22,476,906
15,929,977
8,598,465
2,546,559
(411,775)
(110,607)
-
44,471,901
41,135,788
55,045,878
30,850,722
3,349,498
177,120
1,023,985
90,447,203
32,153,335
37,390,014
10,115,578
439,443
42,708,356
47,945,035
25,121,449
15,819,375
10,093,729
3,871,036
(543,575)
(1,040,623)
(4,585)
47,738,847
42,502,168
63,366,832
33,055,070
2,820,418
132,986
716,225
100,091,531
43,143,634
50,128,809
2,923,851
1,173,660
47,241,145
54,226,320
26,225,639
16,138,820
12,505,237
4,862,016
(399,345)
(399,692)
(493)
52,850,386
45,865,211
60,356,002
41,355,790
3,257,387
132,986
605,805
105,707,970
39,708,265
(Note2)
1,846,573
1,202,176
42,757,014
(Note2)
29,081,192
21,555,808
13,150,059
(Note2)
376,247
67,679
(493)
62,950,956
(Note2)
55,548,893
47,813,020
2,860,548
132,986
555,636
106,911,083
38,778,908
(Note2)
1,781,636
1,291,731
41,852,275
(Note2)
29,101,694
21,603,358
14,886,746
(Note2)
617,930
129,364
(493)
65,058,808
(Note2)
Current Liabilities
Total Liabilities
Retained Earnings
Total StockholdersEquity
Note 1: The balance sheet has been audited and verified by CPA of DELOITTE & TOUCHE.
Note 2: Distribution will be confirmed after being resolved in the 2007 shareholders meeting.
Unrealized Gain or Loss on Financial Asset
Cumulative Translation Adjustment
Net Loss of Unrecognized Pension Costs
ii.Income Statement
iii.CPA's Opinions for the Last 5 Years.
Unit: Thousand of NT dollars
Financial Data for the Last 5 Years (Note 1)Year
Items 2002 2003 2004 2005 2006
Fiscal YearUntil
3/31/2007
99,667,848
9,518,028
2,201,082
6,879,374
732,593
8,347,863
7,280,863
-
-
-
7,280,863
2.89
155,813,787
12,414,306
4,563,900
5,612,358
2,071,448
8,104,810
7,557,177
-
-
-
7,557,177
2.88
162,793,226
12,728,137
4,041,797
6,779,823
1,194,180
9,627,440
8,732,358
-
-
-
8,732,358
3.33
143,396,242
11,364,543
3,500,454
6,971,796
1,284,033
9,188,217
8,401,959
-
-
-
8,401,959
3.04
35,034,837
2,607,506
657,210
1,562,290
227,930
1,991,570
1,736,687
-
-
-
1,736,687
0.6
Note 1: The income statement has been audited and verified by CPA of DELOITTE & TOUCHE.
Note 2: Calculated according to total shares after the increase of capital reserve fund and surplus adjustments.
Income (Loss) before Tax for Active Operating Departments
Operating Income(Loss)
Non-Operating Income(Loss)
Non-Operating Expenses
Gross Profit
Net Sales
Income (Loss) after Tax for Active Operating Departments
Income (Loss) for Inactive Operating Departments
Cumulative Effects of Changes in Accounting Principles
Extraordinary Gains (Losses)
Net Income (Loss)
Earnings (Losses) Per Share (Note 2)
2002
2003
2004
2005
2006
Wu Chin Shun, Wu Chin Shun
Chen Chiung Hsiang, Wu Chin Shun
Chen Chiung Hsiang, Wei Yung Tu
Chen Chiung Hsiang, Wei Yung Tu
Wei Yung Tu, Ryh Yan Chang
Modified Unqualified Opinion
Modified Unqualified Opinion
Modified Unqualified Opinion
Modified Unqualified Opinion
Modified Unqualified Opinion
Names of CPAYear Audit Opinions
48,710,703
4,149,125
692,546
4,371,994
467,790
4,596,750
5,126,750
-
-
-
5,126,750
3.62
3.Financial Information

44
43
II Financial Consolidated Data Analysis for the Last Five Years
Unit: Thousand of NT dollars
Financial Data for the Last 5 Years (Note1)YearAnalyzedItems 2002 2003 2004 2005 2006
Fiscal YearUntil
3/31/2007
Note 1: The financial analysis has been audited and verified by CPA of DELOITTE & TOUCHE.
Note 2: Calculated according to total shares after the increase of capital reserve fund and surplus adjustments.
Note 3: The Profit & Loss is only for one quarter, therefore it's not included in the financial analysis.
40.27
572.66
133.07
109.97
18.14
5.13
71.00
9.64
3.29
38.00
6.59
0.71
10.69
18.67
3.63
24.07
10.52
3.62
0.21
142.00
(2.02)
5.95
1.63
Debt Ratio
Long-Term Funds to Fixed Assets
Current Ratio(%)
Quick Ratio (%)
Number of Times of Interst Assurance(%)
Turnover Rate of Receivables (Times)
Turnover Rate of Inventory (Times)
Turnover Rate of Payable (Times)
Number of Average Sales Days
Turnover Rate of Fixed Assets (Times)
Turnover Rate of Total Assets (Times)
Asset Return Ratio (%)
Return Rate of Shareholders' Equity (%)
Operation Profits Ratio (%)
Profits Before Tax Ratio (%)
Net Profit Ratio (%)
Earning (Loss) Per Share (NTD) (Note2)
Cash Flow Ratio(%)
Appropriateness of Cash Flow(%)
Ratio of Cash Reinvestment(%)
Operation Leverage
Financial Leverage
44.96
1,214.65
145.81
113.38
55.14
5.52
66.00
11.63
4.96
31.00
24.77
1.23
9.91
17.06
9.79
37.14
7.31
2.89
10.30
79.00
1.13
1.53
1.08
47.22
1,727.26
171.20
151.12
32.48
6.81
54.00
18.38
5.89
20.00
46.52
1.72
9.05
16.39
18.17
32.26
4.85
2.88
19.10
107.00
4.88
1.28
1.06
47.20
1,978.05
146.87
136.60
54.08
5.58
65.00
30.54
6.58
12.00
57.72
1.63
9.31
17.36
15.41
36.71
5.36
3.33
0.60
66.00
(7.86)
1.41
1.05
40.45
1,989.25
152.00
140.17
17.79
4.52
81.00
31.84
7.56
11.00
44.02
1.36
8.56
14.51
12.04
31.60
5.86
3.04
29.97
79.00
7.59
1.29
1.19
39.15
2,336.63
143.25
129.44
16.03
- (Note 3)
- (Note 3)
- (Note 3)
- (Note 3)
- (Note 3)
- (Note 3)
- (Note 3)
- (Note 3)
- (Note 3)
- (Note 3)
- (Note 3)
4.96
0.60
3.38
87.00
1.84
1.34
1.25
Number of Cashing Days of Receivables on Average
Leverage Degree
Cash Flow (%)
Profitability
Solvency
Operation
Ability
Financial Structure (%)
Calculation Methods for Analyzed Items are as below:
i. Financial Structure:
(A) Debt Ratio = Total Liabilities / Total Assets.
(B) Long-Term Funds to Fixed Assets = (Net Shareholders' Equity + Long-Term Liabilities) / Net Fixed Assets.
ii. Solvency:
(A) Current Ratio (%) = Current Assets / Current Liabilities
(B) Quick Ratio (%) = (Current Assets - Inventory - Prepaid Expenses) / Current Liabilities.
(C) Number of Times of Interest Assurance (Times) = Net Profit before Income Tax and Interest Expenses / Interest Expenditures this Term
iii. Operation Ability :
(A) Turnover Rate of Receivable (Times) (Including Accounts Receivable and Notes Receivable Incurred By Business) Turnover Rate = Net
Sales / Receivables Averaged in Various Terms (Including Accounts Receivable and Notes Receivable Incurred by Business) Balance.
(B) Number of Cashing Days of Receivables on Average = 365 / Turnover Rate of Receivables.
(C) Turnover Rate of Inventory (Times) = Costs Of Goods Sold / Average Inventory Value.
(D) Turnover Rate Of Payables (Times)(Including Accounts Payable And Notes Payable Incurred By Business) Turnover Rate = Costs
of Goods Sold / Payables Averaged In Various Terms (Including Accounts Payable and Notes Payable Incurred by Business) Balance.
(E) Number of Days In Average Sales = 365 / Turnover Rate Inventory.
(F) Turnover Rate of Fixed Assets (Times) = Net Sales / Net Fixed Assets.
(G) Turnover Rate of Overall Assets (Times) = Net Sales / Total Fixed Assets.
iv. Profitability:
(A) Asset Return Ratio (%)= [ Net Income (Loss) Net Income + Interest Expense (1 - Tax Rate)] / Average Total Assets.
(B) Return Rate Of Shareholders' Equity = Profit (Loss) After Tax / Average Shareholders' Equity, Net
(C) Net Profit Ratio (%) = Income(Loss) / Net Sales
(D) Earning (Loss) per Share = [Net Income (Loss) Dividend of Preferred Shares] / Weighted Average of Outstanding Shares.
v. Cash Flow:
(A)Cash Flow Ratio = Net Cash Flow of Operating Activities / Current Liabilities.
(B)Appropriateness of Cash Flow = Net Cash Flow of Operating Activities in the Past Five Years / (Capital Expenditures + Increased
Inventory + Cash Dividend) of The Past Five Years.
(C) Ratio of Cash Reinvestment : (Net Cash Flow of Operating Activities - Cash Dividend) / (Gross Fixed Assets + Long-Term Investment
+ Other Assets + Operating Funds).
vi. Leverage Degree:
(A) Operating Leverage = (Net Operating Revenues - Variable Operating Costs and Expenses) / Operating Profits.
(B) Financial Leverage = Operating Profit / (Operating Income Interest Expense)
3.Financial Information

46
45
INDEPENDENT AUDITORS' REPORT
The Board of Directors and Shareholders Lite-On Technology Corporation
We have audited the accompanying balance sheets of Lite-On Technology Corporation as of December 31, 2006 and 2005, and
the related statements of income, changes in shareholders' equity and cash flows for the years then ended. These financial
statements are the responsibility of the Corporation's management. Our responsibility is to express an opinion on these financial
statements based on our audits. As disclosed in Note 7, we did not audit the financial statements of equity-method investees as
of and for the years ended December 31, 2006 and 2005. The carrying values of these investments included in the accompanying
balance sheets were 5.08% (NT$5,369,174 thousand) and 7.12% (NT$7,129,279 thousand) of the Corporation's total assets as of
December 31, 2006 and 2005, respectively. Also, the equity in the net earnings of these investees were 10.31% (NT$947,757
thousand) and 10.08% (NT$970,471 thousand) of the Corporation's income before income tax in 2006 and 2005, respectively.
The financial statements of the foregoing investees were audited by other auditors, whose reports have been furnished to us, and our
opinion, insofar as it relates to the amounts pertaining to the above investments, is based solely on the reports of the other auditors.
We conducted our audits in accordance with the Rules Governing the Audit of Financial Statements by Certified Public
Accountants and auditing standards generally accepted in the Republic of China. Those rules and standards require that we plan
and perform the audit to obtain reasonable assurance about whether the financial statements are free of material misstatement.
An audit includes examining, on a test basis, evidence supporting the amounts and disclosures in the financial statements. An
audit also includes assessing the accounting principles used and significant estimates made by management, as well as
evaluating the overall financial statement presentation. We believe that our audits and the reports of the other auditors provide a
reasonable basis for our opinion.
In our opinion, based on our audits and the reports of the other auditors, the financial statements referred to above present fairly,
in all material respects, the financial position of Lite-On Technology Corporation as of December 31, 2006 and 2005, and the
results of its operations and its cash flows for the years then ended in conformity with Guidelines Governing the Preparation of
Financial Reports by Securities Issuers, requirements of the Business Accounting Law and Guidelines Governing Business
Accounting relevant to financial accounting standards, and accounting principles generally accepted in the Republic of China.
We have also audited the consolidated financial statements of Lite-On Technology Corporation and subsidiaries for the years
ended December 31, 2006 and 2005 (not presented herein) and have issued a modified unqualified opinion thereon in our report
dated March 2, 2007.
Lite-On Technology Corporation
Supervisor: Yuan Pao Investment Co., Ltd
Representative: CH Chen
Supervisor: Yuan Pao Investment Co., Ltd
Representative: David Lee
April 25th, 2007
The Board of Directors have prepared and submitted to us the Company's 2006 Business Report, Financial Statements, and
proposal for earnings distribution. The CPAs of DELOITTE & TOUCHE were retained to audit the Financial Statements and have
submitted a report relating thereto. The above Business Report, Financial Statements and proposal for earnings distribution have
been further examined as being correct and accurate by the undersigned, the ombudsmen of Lite-On Technology Corporation.
According to Article 219 of the Company Law, we hereby submit this report.
3.2 Supervisor's Report 3.3 Standalone Financial Statement of 2006
March 2, 2007
3.Financial Information

48
47
The accompanying financial statements are intended only to present the financial position, results of operations and cash flows in
accordance with accounting principles and practices generally accepted in the Republic of China and not those of any other
jurisdictions. The standards, procedures and practices to audit such financial statements are those generally accepted and
applied in the Republic of China.
For the convenience of readers, the auditors' report and the accompanying financial statements have been translated into English
from the original Chinese version prepared and used in the Republic of China. If there is any conflict between the English version
and the original Chinese version or any difference in the interpretation of the two versions, the Chinese-language auditors' report
and financial statements shall prevail. Also, as stated in Note 2 to the financial statements, the additional footnote disclosures that
are not required under generally accepted accounting principles were not translated into English.
LIT
E-O
N T
EC
HN
OLO
GY
CO
RP
OR
AT
ION
BA
LAN
CE
SH
EE
TS
DE
CE
MB
ER
31,
200
6 A
ND
200
5 (I
n T
hous
ands
of
New
Tai
wan
Dol
lars
, E
xcep
t P
ar V
alue
)
Notice to Readers
2006
20
05
2006
20
05
AS
SE
TS
A
mo
un
t %
A
mo
un
t %
L
IAB
ILIT
IES
AN
D S
HA
RE
HO
LD
ER
S'
EQ
UIT
Y
Am
ou
nt
%
Am
ou
nt
%
CU
RR
EN
T A
SS
ET
S
CU
RR
EN
T L
IAB
ILIT
IES
C
ash
(Not
e 4)
$
21,
103,
215
20
$ 2
0,91
8,42
6 21
S
hort
-ter
m b
ank
loan
s (N
ote
12)
$
9,6
15,8
20
9 $
7,0
62,7
507
Not
es r
ece
ivab
le (
Not
e 2)
10
,29
8 -
8,3
34
- N
otes
pay
able
9,
411
-
39,4
41
- A
ccou
nts
rece
ivab
le, n
et (
Not
es 2
and
5)
17,5
23,
213
17
17,4
16,
363
17
Acc
ount
s pa
yab
le
11,0
26,
883
10
12,1
60,
574
12
Rec
eiva
ble
fro
m r
elat
ed
part
ies
(No
tes
2 a
nd 2
0)
16,1
75,
290
15
19,7
38,
850
20
Pay
abl
e t
o re
late
d p
artie
s (N
ote
20)
12,6
43,
277
12
10,4
03,
938
10
Oth
er fi
nanc
ial a
sset
s -
curr
ent
19
4,9
57
- 36
9,1
07
- In
com
e ta
x pa
yab
le (
Not
es 2
and
17
) 82
2,2
46
1
604,
759
1 In
vent
orie
s, n
et (
Not
es 2
an
d 6)
4,
294
,875
4
4,0
04,3
72
4 A
ccru
ed e
xpen
ses
1,8
07,4
64
2 2,
179
,100
2
Pre
pay
men
ts
588,
976
1
458,
520
1
Adv
anc
e fr
om
cus
tom
ers
700,
957
1
1,0
15,4
23
1 D
efer
red
inco
me
tax
asse
ts -
cur
rent
(N
otes
2 a
nd 1
7)
46
5,1
78-
45
2,8
60
-C
urre
nt p
ort
ion
of
lon
g-te
rm d
ebts
(N
otes
2 a
nd 1
3)
1,2
00,0
00
1 7,
872
,196
8
Pro
duc
t war
rant
y re
serv
e (
No
te 2
) 37
7,6
92
- 47
2,7
63
1 T
otal
cur
rent
ass
ets
60
,35
6,00
257
63
,36
6,83
2
63
Oth
er c
urre
nt li
abili
ties
1,5
04,5
151
1,
332
,690
1
LON
G-T
ER
M I
NV
ES
TM
EN
TS
(N
ote
s 2,
3,
7, 8
an
d 9)
T
otal
cur
rent
liab
ilitie
s 39
,70
8,26
5
3743
,14
3,63
443
A
vaila
ble
-for
-sal
e fi
nanc
ial a
sset
s -
nonc
urre
nt
904,
011
1
928,
490
1
Fin
anci
al a
sset
s m
easu
red
at
hol
ding
cos
t 16
9,0
99
- 1,
419
,725
1
LON
G-T
ER
M L
IAB
ILIT
IES
Lo
ng-t
erm
inve
stm
ent
und
er e
qui
ty m
eth
od
40,2
82,
680
38
30,7
06,
855
31
D
eriv
ativ
e fin
anc
ial l
iabi
lity
for
hed
ging
- n
oncu
rre
nt (
Not
es 2
, 3
and
24)
59
,75
6 -
- -
Long
-ter
m d
ebt
s, n
et o
f cur
ren
t por
tion
(Not
ds 2
an
d 13
) 1,
665
,192
22,
800
,000
3 T
otal
long
-ter
m in
vest
men
ts
41,3
55,
790
39
33,0
55,
070
33
Tot
al lo
ng-t
erm
liab
ilitie
s 1,
724
,948
2
2,8
00,0
00
3 P
RO
PE
RT
IES
(N
otes
2,
10
and
22)
C
ost
RE
SE
RV
E F
OR
LA
ND
VA
LUE
INC
RE
ME
NT
TA
X (
Not
e 2)
121,
625
-
123,
851
-
Land
82
5,7
30
1 93
4,3
75
1
Bui
ldin
gs
1,0
61,7
54
1 1,
327
,721
1
OT
HE
R L
IAB
ILIT
IES
M
achi
ner
y an
d e
qui
pm
ent
2,8
93,1
88
3 2,
066
,700
2
Acc
rued
pen
sion
cos
ts (
No
tes
2 a
nd 1
4)
74,7
65
- 90
,97
5-
Mo
ldin
g eq
uipm
ent
716,
940
1
596,
327
1
Def
erre
d in
com
e ta
x lia
bili
ties
- n
onc
urre
nt (
No
tes
2 a
nd 1
7)
698,
359
1
386,
904
-
Tra
nspo
rtat
ion
equi
pme
nt
17,6
83
- 29
,56
9 -
Def
erre
d in
com
e (
No
te 2
) 42
8,8
34
- 54
4,0
65
1 O
ffice
eq
uip
me
nt
583,
799
-
670,
130
1
Mis
cella
neo
us (
Not
es 2
and
7)
218
-
15
1,7
16
- M
isce
llane
ous
equ
ipm
ent
574,
411
-
58
1,8
55-
Tot
al c
ost
6,6
73,5
05
6 6,
206
,677
6
Tot
al o
ther
liab
ilitie
s 1,
202
,176
1
1,
173
,660
1
Less
: A
ccu
mu
late
d d
epr
ecia
tion
3,5
46,8
15
3 3,
491
,831
3
Acc
um
ula
ted
impa
irme
nt
65
,08
0-
68,8
78
- T
ota
l lia
bilit
ies
42
,75
7,01
4
40
47,2
41,
145
47
3,
061
,610
3
2,6
45,9
68
3 A
dd:
Adv
ance
pay
men
ts
19
5,7
77-
17
4,4
50
- S
HA
RE
HO
LDE
RS
' EQ
UIT
Y
Cap
ital s
tock
- $
10
par
valu
e N
et p
rope
rtie
s
3,2
57,3
873
2,8
20,4
183
Aut
hori
zed
- 3
,500
,000
th
ousa
nd
shar
es
Issu
ed -
2,8
73,4
81 t
hou
sand
sha
res
in 2
006
and
2,6
01,
821
tho
usa
nd
shar
es
GO
OD
WIL
L, N
ET
(N
ote
2)
132,
986
-
132,
986
-
in
20
05
28,7
34,
812
27
26,0
18,
213
26
A
dva
nce
rece
ipts
for
co
mm
on
stoc
k 34
6,3
80
1
207,
426
-
OT
HE
R A
SS
ET
S
Tot
al c
apita
l sto
ck
29
,08
1,19
2
28
26,2
25,
639
26
Idle
ass
ets,
net
(N
otes
2 a
nd 1
1)
42,1
41
- 27
,97
8 -
Cap
ital s
urpl
us
Ref
und
abl
e d
epos
its
72,4
55
- 58
,39
6 -
Pai
d-in
ca
pita
l in
exce
ss o
f par
val
ue
3,6
17,1
47
3 2,
723
,855
3
Def
erre
d ch
arg
es,
net
(No
tes
2 a
nd 2
2)
491,
209
1
629,
851
1
Bon
d co
nver
sion
7,
596
,809
7
3,0
06,6
06
3 T
reas
ury
stoc
k tr
ansa
ctio
ns
85,9
31
- -
-
Tot
al o
ther
ass
ets
605,
805
1
716,
225
1
Long
-ter
m s
tock
inve
stm
ents
un
der
the
equi
ty m
etho
d -
- 15
2,4
38
- M
erge
r10
,25
5,92
110
10
,25
5,92
110
T
otal
cap
ital s
urpl
us
21
,55
5,80
820
16
,13
8,82
016
R
eta
ined
ear
nin
gs
Lega
l res
erve
3,
417
,409
3
2,5
44,1
73
3 S
peci
al r
ese
rve
399,
837
1
818,
507
1
Una
ppro
pria
ted
earn
ings
9,
332
,813
9
9,1
42,5
579
Tot
al r
etai
ned
earn
ings
13,1
50,
059
13
12
,50
5,23
713
O
ther
ite
ms
of s
hare
hol
ders
' eq
uity
U
nre
aliz
ed lo
ss o
n ca
sh f
low
hed
ging
(5
9,7
56 )
- -
- U
nre
aliz
ed g
ain
(los
s) o
n fin
anci
al in
stru
me
ns
376,
247
-
(39
9,34
5 )
- C
umul
ativ
e tr
ansl
atio
n ad
just
me
nts
67,6
79
- (3
99,
692
) (1
) M
isce
llane
ous
(4
93
)
-
(49
3 )
- T
otal
oth
er it
em
s of
sha
reh
olde
rs' e
quity
383,
677
-
(7
99,
530
) (1
) T
reas
ury
stoc
k -
38,7
20 t
hou
san
d sh
are
s in
20
06 a
nd 3
8,5
31 t
hous
and
shar
esin
20
05
(1
,21
9,7
80 )
(1
)
(1,2
19,
780
)
(1 )
Tot
al s
hare
hol
ders
' equ
ity
62,9
50,
956
60
52,8
50,
386
53
TO
TA
L$
105,
707
,970
100
$10
0,0
91,5
3110
0T
OT
AL
$10
5,7
07,9
70 1
00
$10
0,0
91,5
31 1
00
The
acc
ompa
nyin
g no
tes
are
an in
tegr
al p
art
of t
he f
inan
cial
sta
tem
ents
. (W
ith D
eloi
tte
& T
ouch
e au
dit
repo
rt d
ated
Mar
ch 2
, 20
07)
3.Financial Information

50
49
LITE-ON TECHNOLOGY CORPORATION
STATEMENTS OF INCOME
YEARS ENDED DECEMBER 31, 2006 AND 2005
(In Thousands of New Taiwan Dollars, Except Par Value)
LITE-ON TECHNOLOGY CORPORATION
STATEMENTS OF INCOME
YEARS ENDED DECEMBER 31, 2006 AND 2005
(In Thousands of New Taiwan Dollars, Except Earnings Per Share)
(Continued)
2006 2005
Amount % Amount %
SALES (Notes 2 and 20) $144,421,053 101 $163,717,316 100
LESS: SALES RETURNS 801,761 1 650,745 -
SALES ALLOWANCES 223,050 - 273,345 -
NET SALES 143,396,242 100 162,793,226 100
COST OF SALES (Notes 18 and 20) 132,142,915 92 149,623,026 92
GROSS PROFIT 11,253,327 8 13,170,200 8
REALIZED (UNREALIZED) PROFITS ONINTERCOMPANY SALES (Note 2) 111,216 - (442,063 ) -
ADJUSTED GROSS PROFIT 11,364,543 8 12,728,137 8
OPERATING EXPENSES (Notes 18, 20 and 22)
Marketing 3,737,257 3 4,326,190 3
General and administrative 2,152,093 2 2,188,508 1
Research and development 1,974,739 1 2,171,642 1
Total operating expenses 7,864,089 6 8,686,340 5
OPERATING INCOME 3,500,454 2 4,041,797 3
NONOPERATING INCOME AND GAINS
Interest income 434,779 1 231,809 -
Investment income recognized under the equity
method, net (Notes 2 and 7) 4,358,534 3 4,038,253 2
Dividend income 29,918 - 32,562 -
Gain on disposal of properties and idle assets 31,342 - 47,281 -
Gain on disposal of investments 245,037 - 1,471,906 1
Foreign exchange gain, net (Note 2) 167,483 - 2,488 -
Other income 1,704,703 1 1,002,805 1
Total nonoperating income and gains 6,971,796 5 6,827,104 4
NONOPERATING EXPENSES AND LOSSES
Interest expense (Notes 2 and 24) 547,325 1 120,281 -
Decline in carrying value of financial assets
measured at holding cost 168,895 - 298,549 -
Loss on disposal of properties and idle assets 39,829 - 81,678 -
(Concluded)
Total nonoperating expenses and losses
INCOME BEFORE INCOME TAX
INCOME TAX EXPENSE (Notes 2 and 17)
NET INCOME
EARNINGS PER SHARE (Note 19)
Basic
Diluted
2006
Amount %
137,814 -
98,100 -
- -
292,070 -
1,284,033 1
9,188,217 6
786,258 -
$ 8,401,959 6
2006
Pre-tax After-tax
$ 3.32 $ 3.04
$ 3.20 $ 2.92
2005
Amount %
39,062 -
179,675 -
81,534 -
440,682 1
1,241,461 1
9,627,440 6
895,082 1
$ 8,732,358 5
2005
Pre-tax After-tax
$ 3.67 $ 3.33
$ 3.48 $ 3.16
NET INCOME
EARNINGS PER SHARE
Basic
Diluted
The accompanying notes are an integral part of the financial statements.
(With Deloitte & Touche audit report dated March 2, 2007)
Pro forma information on the assumption that shares of Lite-On Technology Corp. held by its direct and indirect subsidiaries were not
treated as treasury stock.
Loss on disposal of inventories
Loss on decline in inventory value (Notes 2 and 22)
Asset impairment loss (Notes 2, 10, 11 and 22)
Other expenses (Note 18)
2005
Pre-tax x After-ta
$ 8,804,477$ 9,699,559
$ 3.30$ 3.64
$ 3.15$ 3.46
2006
Pre-tax After-tax
$ 8,486,390$ 9,272,648
$ 3.02$ 3.30
$ 2.91$ 3.18
3.Financial Information

LITE-ON TECHNOLOGY CORPORATION
STATEMENTS OF CASH FLOWS
YEARS ENDED DECEMBER 31, 2006 AND 2005
(In Thousands of New Taiwan Dollars)
LIT
E-O
N T
EC
HN
OLO
GY
CO
RP
OR
AT
ION
STA
TE
ME
NT
S O
F C
HA
NG
ES
IN
SH
AR
EH
OLD
ER
S' E
QU
ITY
YE
AR
S E
ND
ED
DE
CE
MB
ER
31,
200
6 A
ND
200
5 (I
n T
hous
ands
of
New
Tai
wan
Dol
lars
; E
xcep
t C
ash
Div
iden
ds P
er S
hare
)
The
acc
ompa
nyin
g no
tes
are
an in
tegr
al p
art
of t
he f
inan
cial
sta
tem
ents
. (W
ith D
eloi
tte
& T
ouch
e au
dit
repo
rt d
ated
Mar
ch 2
, 20
07)
Cap
ital S
urpl
us (N
otes
2 a
nd 1
5)
Issu
ed C
apita
l Sto
ck (N
ote
15)
Adv
ance
P
aid-
in C
apita
lLo
ng-t
erm
S
tock
In
vest
men
ts
Ret
aine
d E
arni
ngs
(Not
es 2
and
15)
U
nrea
lized
Loss
on
Cas
hFl
ows
Unr
ealiz
edG
ain
(Los
s) o
n Fi
nanc
ial
Cum
ulat
ive
Tran
slat
ion
Tota
l
Sha
res
(Tho
usan
ds)
Am
ount
Rec
eipt
s fo
r C
omm
on
Sto
ck
in E
xces
s of
P
ar V
alue
B
ond
Con
vers
ion
Trea
sury
S
tock
Tr
ansa
ctio
ns
Und
er th
e E
quity
Met
hod
Mer
ger
Tota
l Le
gal R
eser
ve
Spe
cial
R
eser
ve
Una
ppro
pria
ted
Ear
ning
s To
tal
Hed
ging
(N
ote
3)
Inst
rum
ent
(Not
es 2
and
3)
Adj
ustm
ents
(N
ote
2)
Mis
cella
neou
s
Trea
sury
S
tock
(Not
es 2
an
d 16
) S
hare
hold
erE
quity
BA
LAN
CE
, JA
NU
AR
Y 1
, 200
5
2,
512,
145
$25,
121,
449
$ -
$ 2,
733,
555
$ 2,
481,
006
$ 18
3,67
7 $
128,
693
$10,
292,
444
$15,
819,
375
$ 1,
789,
456
$ 52
2,38
2 $
7,78
1,89
1 $1
0,09
3,72
9 $
- $
(543
,575
)
$(1,
040,
623
) $
(4,5
85 )
$(
1,70
6,92
3 )
$47,
738,
847
App
ropr
iatio
n of
prio
r yea
r's e
arni
ngs
Lega
l res
erve
-
- -
- -
- -
- -
754,
717
- (7
54,7
17 )
-
- -
- -
- -
Spe
cial
rese
rve
- -
- -
- -
- -
- -
296,
125
(296
,125
)
- -
- -
- -
-C
ash
divi
dend
s - 2
0%
- -
- -
- -
- -
- -
- (5
,006
,440
)(5
,006
,440
)
- -
- -
- (5
,006
,440
)S
tock
div
iden
ds -
2%
50,0
64
500,
644
- -
- -
- -
- -
- (5
00,6
44 )
(5
00,6
44 )
-
- -
- -
-B
onus
to e
mpl
oyee
s - c
ash
- -
- -
- -
- -
- -
- (1
36,8
99 )
(1
36,8
99 )
-
- -
- -
(136
,899
)B
onus
to e
mpl
oyee
s - s
tock
48
,537
48
5,37
0 -
- -
- -
- -
- -
(485
,370
)
(485
,370
)
- -
- -
- -
Rem
uner
atio
n to
dire
ctor
s an
d su
perv
isor
s -
- -
- -
- -
- -
- -
(93,
340
) (9
3,34
0 )
- -
- -
- (9
3,34
0)
Adj
ustm
ent a
risin
g fro
m c
hang
es in
equ
ity in
in
vest
men
ts d
ue to
sub
sidi
arie
s' d
istri
butio
n of
bon
us
to e
mpl
oyee
s -
- -
- -
- (8
5,28
6 )
- (8
5,28
6 )
- -
- -
- -
- -
- (8
5,28
6)
Cas
h di
vide
nds
rece
ived
by
subs
idia
ries
- -
- -
- 61
,032
-
- 61
,032
-
- -
- -
- -
- -
61,0
32 R
ever
sal o
f adj
ustm
ent a
risin
g fro
m c
hang
es in
net
loss
of
unr
ecog
nize
d pe
nsio
n co
sts
in s
ubsi
diar
ies
-
- -
- -
- -
- -
- -
- -
- -
- 4,
092
- 4,
092
A
djus
tmen
t aris
ing
from
cha
nges
in e
quity
in in
vest
ees
- -
- -
- -
58,5
35
- 58
,535
-
- -
- -
- -
- -
58,5
35
Adj
ustm
ent a
risin
g fro
m c
hang
es in
sub
sidi
arie
s' c
apita
l su
rplu
s -
- -
- -
- 50
,496
-
50,4
96
- -
- -
- -
- -
- 50
,496
R
etire
men
t of t
reas
ury
stoc
k - 8
,925
thou
sand
sha
res
(8,9
25 )
(8
9,25
0 )
- (9
,700
)
(8,8
04 )
(2
44,7
09 )
-
(36,
523
) (2
99,7
36 )
-
- (9
8,15
7 )
(98,
157
) -
- -
- 48
7,14
3 -
N
et in
com
e in
200
5 -
- -
- -
- -
- -
- -
8,73
2,35
8 8,
732,
358
- -
- -
- 8,
732,
358
C
onve
rsio
n of
ove
rsea
s co
nver
tible
bon
ds in
to c
omm
onst
ock
-
- 20
7,42
6 -
534,
404
- -
- 53
4,40
4 -
- -
- -
- -
- -
741,
830
Rev
ersa
l of u
nrea
lized
loss
on
long
-term
sto
ck
inve
stm
ents
-
- -
- -
- -
- -
- -
- -
- 14
4,23
0 -
- -
144,
230
Tran
slat
ion
adju
stm
ents
on
long
-term
sto
ck
inve
stm
ents
-
-
-
-
-
-
- -
-
-
-
-
-
-
-
64
0,93
1
-
-
640,
931
BA
LAN
CE
, DE
CE
MBE
R 3
1, 2
005
2,60
1,82
1 2
6,01
8,21
3 20
7,42
6
2,
723,
855
3,00
6,60
6 -
152,
438
10,2
55,9
21
16,
138,
820
2,54
4,17
3 81
8,50
7
9,
142,
557
12,5
05,2
37
-
(399
,345
)
(3
99,6
92 )
(493
)
(1,
219,
780
) 5
2,85
0,38
6
Effe
cts
of a
ccou
ting
chan
ges
sinc
e ad
opte
d S
FAS
No.
34
- -
- -
- -
- -
- -
- -
- (1
10,2
20 )
24
2,90
6 -
- -
132,
686
App
ropr
iatio
n of
prio
r yea
r's e
arni
ngs
Lega
l res
erve
-
- -
- -
- -
- -
873,
236
- (8
73,2
36 )
-
- -
- -
- -
Rev
ersa
l of s
peci
al re
serv
e -
- -
- -
- -
- -
- (4
18,6
70 )
41
8,67
0 -
- -
- -
- -
Cas
h di
vide
nds
- $24
%
- -
- -
- -
- -
- -
- (6
,626
,205
)
(6,6
26,2
05 )
-
- -
- -
(6,6
26,2
05)
Sto
ck d
ivid
ends
- 0.
5%
13,8
05
138,
046
- -
- -
- -
- -
- (1
38,0
46 )
(1
38,0
46 )
-
- -
- -
-B
onus
to e
mpl
oyee
s - c
ash
- -
- -
- -
- -
- -
- (2
44,3
22 )
(2
44,3
22 )
-
- -
- -
(244
,322
)B
onus
to e
mpl
oyee
s - s
tock
52
,000
52
0,00
0 -
- -
- -
- -
- -
(520
,000
)
(520
,000
)
- -
- -
- -
Rem
uner
atio
n to
dire
ctor
s an
d su
perv
isor
s -
- -
- -
- -
- -
- -
(114
,648
)
(114
,648
)
- -
- -
- (1
14,6
48)
C
onve
rsio
n of
ove
rsea
s co
nver
tible
bon
ds in
to c
omm
on
stoc
k 17
9,30
1
1,
793,
008
138,
954
-
4,
590,
203
- -
-
4,
590,
203
- -
- -
- -
- -
- 6,
522,
165
C
ash
divi
dend
s re
ceiv
ed b
y su
bsid
iarie
s -
- -
- -
84,4
31
- -
84,4
31
- -
- -
- -
- -
- 84
,431
Adj
ustm
ent a
risin
g fro
m c
hang
es in
equ
ity in
in
vest
men
ts d
ue to
sub
sidi
arie
s' d
istri
butio
n of
bon
us
to e
mpl
oyee
s -
- -
- -
- (1
60,1
91 )
-
(160
,191
)
- -
(113
,916
)
(113
,916
)
- -
- -
- (2
74,1
07)
Adj
ustm
ent a
risin
g fro
m c
hang
es in
cap
ital s
urpl
us in
su
bsid
iarie
s -
- -
- -
1,50
0 7,
753
- 9,
253
- -
- -
- -
- -
- 9,
253
Unr
ealiz
ed g
ain
or lo
ss o
n ca
sh fl
ows
hedg
ing
- -
- -
- -
- -
- -
- -
- 50
,464
-
- -
- 50
,464
Net
inco
me
in 2
006
- -
- -
- -
- -
- -
-
8,
401,
959
8,40
1,95
9 -
- -
- -
8,40
1,95
9
Unr
ealiz
ed g
ain
or lo
ss o
n av
aila
ble-
for s
ale
finan
cial
as
sets
-
- -
- -
- -
- -
- -
- -
- 53
2,68
6 -
- -
532,
686
Tran
slat
ion
adju
stm
ents
on
long
-term
sto
ck
inve
stm
ents
-
- -
- -
- -
- -
- -
- -
- -
467,
371
- -
467,
371
Issu
ance
of n
ew s
hare
s du
e to
sha
re e
xcha
nge
26,5
54
26
5,54
5 -
89
3,29
2
- -
- -
89
3,29
2 -
-
-
- -
--
--
1,15
8,83
7
BA
LAN
CE
, DE
CE
MBE
R 3
1, 2
006
2,87
3,48
1 $2
8,73
4,81
2 $
346,
380
$ 3,
617,
147
$ 7,
596,
809
$ 85
,931
$
- $1
0,25
5,92
1 $2
1,55
5,80
8 $
3,41
7,40
9 $
399,
837
$ 9,
332,
813
$13,
150,
059
$ (5
9,75
6 )
$ 37
6,24
7 $
67,6
79
$ (4
93 )
$(
1,21
9,78
0 )
$62,
950,
956
2006 2005
CASH FLOWS FROM OPERATING ACTIVITIES
Net income $ 8,401,959 $ 8,732,358
Adjustments to reconcile net income to net cash provided by operating activities:
Depreciation 654,883 618,023
Amortization 316,264 436,311
Reversal of allowance for bad debts (8,598 ) (40,102 )
Loss on decline in inventory value 98,100 179,675
Loss on disposal of inventories 137,814 39,062
Gain on disposal of investments (245,037 ) (1,471,906 )
Decline in carrying value of financial assets measured at holding cost 168,895 298,549
Loss on disposal of properties and idle assets,net 8,487 34,397
Impairment loss on assets - 81,534
Investment income recognized under the equity method,net (4,358,534 ) (4,038,253 )
Cash dividends from equity-method investees 2,815,985 1,933,757
Product warranty reserve (95,071 ) 126,138
Accrued pension costs (16,210 ) 7,881
Deferred income taxes 299,137 385,040
Deferred income (115,231 ) 447,722
Net changes in operating assets and liabilities
Notes receivable (1,964 ) 17,450
Accounts receivable (98,252 ) (3,171,979 )
Receivable from related parties 3,774,473 (6,748,902 )
Inventories (526,417 ) 1,570,982
Other financial assets - current 174,150 392,373
Prepayments (130,456 ) 316,994
Notes payable (30,030 ) (80,135 )
Accounts payable (1,133,691 ) 2,371,804
Payable to related parties 2,239,339 (2,534,528 )
Income tax payable 217,487 38,597
Accrued expenses (371,636 ) 124,881
Advances from customers (314,466 ) 83,229
Other current liabilities 39,684 109,607
Net cash provided by operating activities 11,901,064 260,559
CASH FLOWS FROM INVESTING ACTIVITIES
Proceeds from sale of available-for-sale assets 782,738 218,094
Proceeds from sale of financial asset measured at holding cost 268,520 51,345
Acquisition of long-term investments under the equity method (10,707,359 ) (2,724,459 )
Acquisition in financial assets measured at holding cost (29,738 ) (19,009 )
Proceeds from sale of long-term investments under the equity method 4,863,276 4,314,322
Acquisition of properties (1,492,143 ) (672,558 )
Proceeds from disposal of properties and idle assets 364,556 509,638
(Continued)
52
51
3.Financial Information

54
53
INDEPENDENT AUDITORS' REPORT
The Board of Directors and Shareholders Lite-On Technology Corporation
We have audited the accompanying balance sheets of Lite-On Technology Corporation (“Parent Company”) and subsidiaries as of
December 31, 2006 and 2005, and the related consolidated statements of income, changes in shareholders' equity and cash flows
for the years then ended. These financial statements are the responsibility of the Parent Company's management. Our
responsibility is to express an opinion on these financial statements based on our audits. However, as stated in Note 2, we did not
audit the financial statements as of and for the years ended December 31, 2006 and 2005 of consolidated subsidiaries. The
assets of these subsidiaries were 4.30% (NT$7,130,662 thousand) and 12.56% (NT$19,252,022 thousand) of the consolidated
total assets as of December 31, 2006 and 2005, respectively. The sales of these subsidiaries were 2.91% (NT$6,459,472
thousand) and 27.00% (NT$61,432,318 thousand) of the consolidated total sales in 2006 and 2005, respectively. As stated in
Note 9, we did not audit the financial statements as of and for the years ended December 31, 2006 and 2005 of equity-method
investees. The carrying values of the related equity-method investments included in the accompanying balance sheets were
0.81% (NT$1,345,000 thousand) and 0.17% (NT$266,322 thousand) of the consolidated total assets as of December 31, 2006
and 2005, respectively. Also, the equity in the net earnings of these investees were 0.36% (NT$38,289 thousand) and 0.32%
(NT$40,052 thousand) of the consolidated income before income tax in 2006 and 2005, respectively. The financial statements of
the foregoing consolidated subsidiaries and equity-method investees were audited by other auditors, whose reports have been
furnished to us, and our opinion, insofar as it relates to the amounts pertaining to the above investments, is based solely on the
reports of the other auditors.
We conducted our audits in accordance with the Rules Governing the Audit of Financial Statements by Certified Public
Accountants and auditing standards generally accepted in the Republic of China. Those rules and standards require that we plan
and perform the audit to obtain reasonable assurance about whether the financial statements are free of material misstatement.
An audit includes examining, on a test basis, evidence supporting the amounts and disclosures in the financial statements. An
audit also includes assessing the accounting principles used and significant estimates made by management, as well as
evaluating the overall financial statement presentation. We believe that our audits and the reports of the other auditors provide a
reasonable basis for our opinion.
In our opinion, based on our audits and the reports of the other auditors, the financial statements referred to above present fairly,
in all material respects, the financial position of Lite-On Technology Corporation and subsidiaries as of December 31, 2006 and
2005, and the results of their operations and their cash flows for the years then ended in conformity with Guidelines Governing the
Preparation of Financial Reports by Securities Issuers, requirements of the Business Accounting Law and Guidelines Governing
Business Accounting relevant to financial accounting standards, and accounting principles generally accepted in the Republic of China.
As disclosed in Note 2 to the financial statements, Lite-On Technology Corporation and subsidiaries adopted revised SFAS No. 7
"Consolidated Financial Statements", to prepare the consolidated financial statements. Since 2005, the consolidated entities
include the accounts of all investors in which Lite-On Technology Corporation has a controlling interest.
3.4 Consolidated Financial Statements of 2006LITE-ON TECHNOLOGY CORPORATION
STATEMENTS OF CASH FLOWS
YEARS ENDED DECEMBER 31, 2006 AND 2005
(In Thousands of New Taiwan Dollars)
March 2, 2007
The accompanying notes are an integral part of the financial statements.
(With Deloitte & Touche audit report dated March 2, 2007)
(Concluded)
2006 2005
Increase in refundable deposits (14,059 ) (19,972 )
Increase in deferred charges (166,763 ) (129,915 )
Net cash provided by (used in) investing activities (6,130,972 ) 1,527,486
CASH FLOWS FROM FINANCING ACTIVITIES
Increase in short-term bank loans 2,553,070 4,078,510
Increase (Decrease) in long-term debts (1,284,839 ) 232,701
Decrease in guarantee deposits (500 ) (1,048 )
Cash dividends paid (6,626,205 ) (5,006,440 )
Remuneration to directors and supervisors and bonuses to employees (226,829 ) (230,239 )
Net cash used in financing activities (5,585,303 ) (926,516 )
NET INCREASE IN CASH 184,789 861,529
CASH, BEGINNING OF YEAR 20,918,426 20,056,897
CASH, END OF YEAR $ 21,103,215 $ 20,918,426
SUPPLEMENTARY DISCLOSURE OF CASH FLOW INFORMATION
Interest paid (excluding capitalized interests) $ 540,299 $ 89,502
Income tax paid $ 211,512 $ 475,180
NONCASH INVESTING AND FINANCING ACTIVITIES
Current portion of long-term debts $ 1,200,000 $ 7,872,196
Payable to cash dividends,remuneration of directors and
supervisors and employees cash bonuses $ 132,141 $ -
Conversion of overseas convertible bonds into common stock
and capital surplus $ 6,522,615 $ 741,830
CASH PAID FOR ACQUISITION OF PROPERTIES
Increase in properties $ 1,488,757 $ 751,998
Decrease (increase) in payable for properties 3,386 (79,440 )
$ 1,492,143 $ 672,558
3.Financial Information

The accompanying consolidated financial statements are intended only to present the financial position, results of operations and
cash flows in accordance with accounting principles and practices generally accepted in the Republic of China and not those of
any other jurisdictions. The standards, procedures and practices to audit such financial statements are those generally accepted
and applied in the Republic of China.
For the convenience of readers, the auditors' report and the accompanying financial statements have been translated into English
from the original Chinese version prepared and used in the Republic of China. If there is any conflict between the English version
and the original Chinese version or any difference in the interpretation of the two versions, the Chinese-language auditors' report
and financial statements shall prevail. Also, as stated in Note 2 to the financial statements, the additional footnote disclosures that
are not required under generally accepted accounting principles were not translated into English.
Notice to Readers
LIT
E-O
N T
EC
HN
OLO
GY
CO
RP
OR
AT
ION
AN
D S
UB
SID
IAR
IES
CO
NS
OLI
DA
TE
D B
ALA
NC
E S
HE
ET
S
DE
CE
MB
ER
31,
200
6 A
ND
200
5 (I
n T
hous
ands
of
New
Tai
wan
Dol
lars
, E
xcep
t P
ar V
alue
)
The
acc
ompa
nyin
g no
tes
are
an in
tegr
al p
art
of t
he c
onso
lidat
ed f
inan
cial
sta
tem
ents
.
(With
Del
oitt
e &
Tou
che
audi
t re
port
dat
ed M
arch
2,
2007
)
2006
2005
2006
2005
AS
SE
TS
A
mo
un
t %
A
mo
un
t %
L
IAB
ILIT
IES
AN
D S
HA
RE
HO
LD
ER
S'
EQ
UIT
YA
mo
un
t %
Am
ou
nt
%
CU
RR
EN
T A
SS
ET
S
CU
RR
EN
T L
IAB
ILIT
IES
Cas
h (N
ote
4)
$
48,7
56,2
54
29
$
42,3
11,1
46
27
Sho
rt-t
erm
ba
nk lo
ans
(Not
e 14
)
$ 10
,410
,488
6
$ 7,
674,
096
5
Fin
anci
al a
sset
s at
fair
valu
e th
roug
h pr
ofit
or lo
ss -
cur
rent
(N
otes
2, 3
, 7 a
nd 2
6)4,
312
- 10
5,74
2 -
Fin
anci
al l
iab
ilitie
s at
fair
valu
e th
rou
gh p
rofit
or
loss
-cu
rren
t (N
otes
2, 3
and
26)
13,9
62
- -
- A
vaila
ble-
for-
sale
fin
anc
ial a
sset
s -
curr
ent (
Not
es 2
, 3 a
nd 8
)28
0,86
3 -
82,8
12
- N
otes
pay
able
714,
606
1 67
,254
-
Not
es r
ecei
vabl
e (N
ote
2)10
9,44
8 -
24,2
40
- A
ccou
nts
paya
ble
53,4
58,4
07
32
57,8
19,4
82
38
Acc
ount
s re
ceiv
able
, net
(N
otes
2 a
nd 5
)45
,434
,913
27
48
,843
,311
32
P
ayab
le to
rel
ated
par
ties
(Not
e 2
2)85
2,43
4 1
1,01
5,1
63
1 R
ecei
vabl
es fr
om r
ela
ted
part
ies
(Not
es 2
and
22)
1,15
1,0
79
1 1,
521,
623
1
Inco
me
tax
paya
ble
(N
otes
2 a
nd 1
9)2,
381,
335
2
1,90
1,1
34
1 O
ther
fina
ncia
l ass
ets
- cu
rren
t 2,
138,
636
1
1,29
4,6
46
1 A
ccru
ed e
xpen
ses
5,66
0,7
39
3 5,
108,
861
3
Inve
ntor
ies,
net
(N
otes
2 a
nd 6
)25
,576
,626
16
28
,521
,927
19
O
ther
acc
ount
s pa
yabl
e3,
935,
383
2
2,81
5,0
18
2 P
repa
ymen
ts1,
501,
281
1
1,14
1,4
59
1 A
dvan
ce fr
om c
usto
mer
s1,
437,
431
1
1,23
4,5
25
1 D
efer
red
inco
me
tax
asse
ts -
cur
rent
(N
otes
2 a
nd 1
9)78
5,09
4 1
793,
367
- C
urre
nt p
ortio
n of
long
-ter
m d
ebts
(N
otes
2 a
nd 1
5)1,
518,
323
1
7,90
9,8
73
5 P
rodu
ct w
arra
nty
rese
rve
(Not
e 2)
666,
651
- 79
8,44
9 -
Tot
al c
urre
nt a
sset
s
12
5,73
8,5
06
76
12
4,64
0,2
73
81
O
ther
cur
rent
liab
ilitie
s48
1,51
4 -
959,
656
1
LON
G-T
ER
M IN
VE
ST
ME
NT
S (
Not
es 2
, 3,
9, 1
0
and
11)
Tot
al c
urre
nt li
abili
ties
81
,531
,273
49
87
,303
,511
57
Ava
ilabl
e-fo
r-sa
le f
ina
ncia
l ass
ets
- no
ncur
rent
2,52
7,0
39
1 2,
233,
033
1
Fin
anci
al a
sset
s m
easu
red
at h
oldi
ng c
ost
895,
340
1 2,
280,
233
2
LON
G-T
ER
M L
IAB
ILIT
IES
Long
-ter
m in
vest
men
t und
er e
qui
ty m
etho
d3,
156,
133
2
1,72
7,4
21
1 D
eriv
ativ
e fin
anci
al l
iab
ility
for
hed
ging
- n
oncr
uuen
t (N
otes
2, 3
and
26)
59,7
56
- -
- Lo
ng-t
erm
de
bts,
net
of c
urre
nt p
ortio
n (N
otes
2 a
nd 1
5)2,
367,
306
2
2,94
2,8
89
2 T
otal
long
-ter
m in
vest
men
ts6,
578,
512
4
6,24
0,6
87
4
Tot
al lo
ng-t
erm
lia
bilit
ies
2,42
7,0
62
2 2,
942,
889
2
PR
OP
ER
TIE
S (
Not
es 2
,12
an
d 24
)C
ost
RE
SE
RV
E F
OR
LA
ND
VA
LUE
INC
RE
ME
NT
TA
X (
Not
e 2)
157,
558
- 15
9,78
4 -
Land
2,66
0,2
01
2 2,
580,
492
2
Bui
ldin
gs12
,053
,482
7
11,3
38,2
14
7 O
TH
ER
LIA
BIL
ITIE
SM
achi
nery
and
equ
ipm
ent
17,1
95,6
79
10
12,1
98,2
25
8 A
ccru
ed p
ensi
on c
osts
(N
otes
2 a
nd 1
6)23
7,18
7 -
177,
863
- M
old
ing
equ
ipm
ent
926,
571
1 1,
519,
395
1
Gua
rant
ee d
epo
sits
8,13
3 -
32,4
95
- T
rans
port
atio
n e
quip
men
t16
8,15
0 -
129,
119
- D
efer
red
inco
me
tax
liab
ilitie
s -
nonc
urre
nt (
Not
es 2
and
19)
1,27
2,3
80
1 90
0,85
5 1
Offi
ce e
quip
men
t 2,
171,
900
1
1,78
8,0
92
1 D
efer
red
inco
me
(Not
e 2)
2,33
6 -
18,8
93
- M
isce
llane
ous
equi
pm
ent
1,29
7,3
87
1 1,
613,
820
1
Mis
cella
neou
s4,
653
- 43
,817
-
Tot
al c
ost
36,4
73,3
70
22
31,1
67,3
57
20
Less
: A
ccum
ula
ted
dep
reci
atio
n14
,213
,286
9
11,8
83,8
04
8 T
otal
oth
er li
abili
ties
1,52
4,6
89
1 1,
173,
923
1
Acc
umul
ated
impa
irmen
t75
,576
-
152,
329
- 22
,184
,508
13
19
,131
,224
12
Tot
al li
abi
litie
s85
,640
,582
52
91
,580
,107
60
A
dd:
Co
nstr
uctio
n in
pro
gres
s an
d a
dvan
ce p
aym
ents
2,77
4,3
90
2 83
4,57
1 1
SH
AR
EH
OLD
ER
S'E
QU
ITY
OF
PA
RE
NT
CO
MP
AN
YN
et p
rope
rtie
s24
,958
,898
15
19
,965
,795
13
Cap
ital s
tock
- $
10 p
ar v
alu
eA
utho
rized
- 3
,500
,000
thou
sand
sha
res
INT
AN
GIB
LE A
SS
ET
SIs
sued
- 2
,873
,48
1 th
ousa
nd
shar
es in
200
6 a
nd 2
,601
,82
1 th
ous
and
shar
es in
2005
28
,734
,812
1826
,018
,213
17P
aten
t us
e rig
hts
(Not
es 2
and
13)
2,58
3,5
50
2 3,
675
- A
dvan
ce r
ecei
pts
for
com
mon
sto
ck34
6,38
0-
20
7,42
6-
Goo
dwill
, ne
t (N
ote
2 an
d 1
3)3,
663,
192
2
258,
450
- 29
,081
,192
18
26
,225
,639
17La
nd u
se r
ight
s (N
ote
2)28
1,23
9 -
305,
350
1 C
apita
l sur
plus
P
aid-
in c
apita
l in
exce
ss o
f par
val
ue3,
617,
147
22,
723,
855
2T
otal
inta
ngib
le a
sset
s
6,52
7,9
81
4
56
7,47
5
1 B
ond
conv
ersi
on7,
596,
809
53,
006,
606
2T
reas
ury
stoc
k tr
ansa
ctio
ns
85,9
31-
--
OT
HE
R A
SS
ET
SLo
ng-t
erm
sto
ck in
vest
men
ts u
nde
r th
e e
quity
met
hod
--
152,
438
-Le
ased
ass
ets,
net
(N
ote
2)-
- 98
,551
-
Mer
ger
10,2
55,9
216
10,2
55,9
217
Idle
ass
ets,
net
(N
ote
2)46
,107
-
87,8
52
- T
otal
cap
ital s
urp
lus
21,5
55,8
0813
16,1
38,8
2011
Ref
unda
ble
dep
osits
186,
234
- 11
8,67
0 -
Ret
ain
ed e
arn
ings
Def
erre
d ch
arge
s, n
et (
Not
e 2
)1,
323,
174
1
1,44
4,1
52
1 Le
gal r
eser
ve3,
417,
409
22,
544,
173
2M
isce
llane
ous
293,
911
- 97
,698
-
Spe
cia
l res
erve
399,
837
-81
8,50
7-
Una
ppro
pria
ted
ear
ning
s9,
332,
813
69,
142,
557
6T
otal
oth
er a
sset
s1,
849,
426
1
1,84
6,9
23
1 T
otal
ret
ain
ed e
arni
ngs
13
,150
,059
812
,505
,237
8O
ther
item
s of
sha
reh
old
ers'
equ
ityU
nrea
lized
loss
on
cash
flow
hed
ging
(59,
756
)-
--
Unr
ealiz
ed g
ain
or lo
ss o
n fin
anc
ial i
nstr
umen
t37
6,24
7-
(399
,345
)-
Cum
ulat
ive
tran
slat
ion
adju
stm
ents
67,6
79-
(399
,692
)(1
)M
isce
llane
ous
(493
)-
(493
)-
Tot
al o
ther
ite
ms
of s
hare
hold
ers'
eq
uity
383,
677
-(7
99,5
30 )
(1 )
Tre
asur
y st
ock
- 38
,720
thou
sand
sha
res
in 2
006
an
d 38
,531
thou
sand
sha
res
in20
05
(1,2
19,7
80(1
)(1
,219
,780
)(1
)
Tot
al s
hare
hold
er's
equ
ity o
f pa
rent
com
pany
62,9
50,9
5638
52,8
50,3
8634
MIN
OR
ITY
INT
ER
ES
T17
,061
,785
108,
830,
660
6
T
otal
sha
reh
old
ers'
equ
ity80
,012
,741
4861
,681
,046
40
TO
TA
L$
165,
653
,323
10
0$
153,
261
,153
10
0T
OT
AL
$ 16
5,65
3,3
23
100
$ 15
3,26
1,1
53
100
56
55
3.Financial Information

58
57
LITE-ON TECHNOLOGY CORPORATION AND SUBSIDIARIES
CONSOLIDATED STATEMENTS OF INCOME
YEARS ENDED DECEMBER 31, 2006 AND 2005
(In Thousands of New Taiwan Dollars, Except Earnings Per Share)
LITE-ON TECHNOLOGY CORPORATION AND SUBSIDIARIES
CONSOLIDATED STATEMENTS OF INCOME
YEARS ENDED DECEMBER 31, 2006 AND 2005
(In Thousands of New Taiwan Dollars, Except Earnings Per Share)
2006 2005
Amount % Amount %
2006 2005
Amount % Amount %
(Continued)
(Concluded)The accompanying notes are an integral part of the consolidated financial statements.
(With Deloitte & Touche audit report dated March 2, 2007)
Pro forma information on the assumption that shares of Lite-On Technology Corp. held by its direct and indirect subsidiaries were not treated as treasury stock.
SALES (Notes 2 and 22) $226,277,001 102 $231,548,253 102
LESS: SALES RETURNS 2,996,857 1 2,009,176 1
SALES ALLOWANCES 1,241,499 1 2,197,696 1
NET SALES 222,038,645 100 227,341,381 100
OTHER OPERATING REVENUE 160,952 - 164,232 -
Total operating revenue 222,199,597 100 227,505,613 100
OPERATING COST
Cost of sales (Notes 20 and 22) 193,812,881 87 199,599,981 88
Other operating cost 29,761 - 79,969 -
Total operating cost 193,842,642 87 199,679,950 88
GROSS PROFIT 28,356,955 13 27,825,663 12
REALIZED PROFITS ON INTERCOMPANY
SALES (Note 2) 2,394 - 3,199 -
ADJUSTED GROSS PROFIT 28,359,349 13 27,828,862 12
OPERATING EXPENSES (Notes 20, 22 and 24)
Marketing 9,806,782 4 8,964,804 4
General and administrative 4,650,957 2 4,715,769 2
Research and development 3,758,087 2 3,683,398 1
Total operating expenses 18,215,826 8 17,363,971 7
OPERATING INCOME 10,143,523 5 10,464,891 5
NONOPERATING INCOME AND GAINS
Interest income 1,026,463 1 582,986 -
Investment income recognized under the equity
method, net (Notes 2 and 9) 242,510 - 181,835 -
Dividend income 32,331 - 57,952 -
Gain on disposal of properties and idle assets 59,644 - 203,914 -
Gain on disposal of investments 149,714 - 1,508,256 1
Foreign exchange gain, net (Note 2) 508,663 - 195,490 -
Other income (Notes 2, 3 and 7) 1,757,802 1 1,702,459 1
Total nonoperating income and gains 3,777,127 2 4,432,892 2
NONOPERATING EXPENSES AND LOSSES
Interest expense (Note 2) 654,183 - 202,626 -
Decline in carrying value of financial assets
measured at holding cost 336,491 - 308,558 -
Loss on disposal of properties and id le assets 87,887 - 188,508 -
Loss on disposal of inventories 429,868 - 39,638 -
Loss on dec line in inventory value (Notes 2 and 24) 849,339 1 348,567 -
Asset impairment loss (Notes 2, 12 and 24) 105,638 - 191,134 -
Other expenses (Notes 2, 3, 7 and 20) 784,224 1 1,107,893 1
Total nonoperating ex penses and losses 3,247,630 2 2,386,924 1
INCO ME BEFORE INCO ME TAX ANDCUMUL ATIVE EFFECTS RESULTING FROMCHANGES IN ACCO UNTING PRINCIPLES 10,673,020 5 12,510,859 6
INCOME TAX EX PENSE (Notes 2 and 19) 1,511,531 1 1,936,740 1
CONSOLIDATED NET INCOME BEFORECUMUL ATIVE EFFECTS RESULTING FROMCHANGES IN ACCO UNTING PRINCIPLES 9,161,489 4 10,574,119 5
CUMUL ATIVE EFFECTS OF CHANGES INACCOUNTING PRINCIPLES (Note 3)(DEDUCT INCOME TAX 289 THOUSAND DOLLARS) 711 - - -
CONSOLIDATED NET INCOME $ 9,162,200 4 $ 10,574,119 5
ATTRIBUTED TO:Controlling Interest $ 8,401,959 4 $ 8,732,358 4
Minority Interest 760,241 - 1,841,761 1
$ 9,162,200 4 $ 10,574,119 5
2006 2005Pretax After-tax Pretax After-tax
2006 2005Pretax After-tax Pretax After-tax
EARNINGS PE R SHARE (Note 21)
Basic $ 3.32 $ 3.04 $ 3.67 $ 3.33
Diluted $ 3.20 $ 2.92 $ 3.48 $ 3.16
CONSOLIDATED NET INCOME $ 9,272,648 $ 8,486,390 $ 9,699,559 $ 8,804,477
EARNINGS PER SHARE
Basic $ 3.30 $ 3.02 $ 3.64 $ 3.30
Diluted $ 3.18 $ 2.91 $ 3.46 $ 3.15
3.Financial Information

60
59
LIT
E-O
N T
EC
HN
OLO
GY
CO
RP
OR
AT
ION
AN
D S
UB
SID
IAR
IES
CO
NS
OLI
DA
TE
D S
TAT
EM
EN
TS
OF
CH
AN
GE
S I
N S
HA
RE
HO
LDE
R'S
EQ
UIT
Y
YE
AR
S E
ND
ED
DE
CE
MB
ER
31,
200
6 A
ND
200
5
(In
Tho
usan
ds o
f N
ew T
aiw
an D
olla
rs,
Exc
ept
Cas
h D
ivid
ends
Per
Sha
re)
(Con
clud
ed)
Cap
ital S
urpl
us (N
otes
2 a
nd 1
7)
Unr
ealiz
edU
nrea
lized
Pai
d-in
Lo
ss o
nG
ain
(Los
s)on
C
umul
ativ
e Is
sued
Cap
ital S
tock
(Not
e 17
)
Adv
ance
C
apita
lC
ash
Flow
Fina
ncia
lTr
ansl
atio
n
Trea
sury
Sto
ckM
inor
ityTo
tal
Sha
res
R
ecei
pts
for
in E
xces
s o
fB
ond
Trea
sury
Sto
ck
Long
-ter
mS
tock
Inve
stm
ents
Und
er th
eS
peci
alU
napp
ropr
iate
d
Hed
ging
Inst
rum
ent
Adj
ustm
ents
(N
otes
2E
quity
S
hare
hold
ers'
Ret
aine
d E
arni
ngs
(Not
es 2
and
17)
(Tho
usan
ds)
Am
ount
C
omm
on
Sto
ck
Par
Val
ueC
onve
rsio
nTr
ansa
ctio
nsE
quity
Met
hod
Mer
ger
Tota
lLe
gal
Res
erve
Res
erve
Ear
ning
sTo
tal
(Not
e 3)
(Not
es 2
and
3)
(Not
e 2)
Mis
cella
neou
san
d 18
)(N
ote2
)E
quity
BA
LAN
CE
, JA
NU
AR
Y 1
, 200
5 2
,512
,145
$25,
121,
449
$ -
$2,7
33,5
55$2
,481
,006
$1
83,6
77
$128
,693
$1
0,29
2,44
4
$15,
819,
375
$1,7
89,4
56$5
22,3
82$7
,781
,891
$1
0,09
3,72
9$
-$(
543,
575
)
$(1,
040,
623)
$(4,
585 )
$(
1,70
6,92
3)
$ 6,3
43,8
93
$54,
082,
740
Effe
ct o
f cha
nge
in c
onso
lidat
ed e
ntiti
es
sinc
e 20
05
--
--
--
--
--
--
--
- -
--
1,17
3,68
71,
173,
687
App
ropr
iatio
n of
prio
r yea
r's e
arni
ngs
Lega
l res
erve
-
--
--
--
--
754,
717
-
(754
,717
)-
- -
- -
--
-
Spe
cial
rese
rve
- -
--
--
- -
--
296,
125
(2
96,1
25 )
--
- -
--
--
Cas
h di
vide
nds
- 20%
-
- -
- -
- -
- -
--
(5,0
06,4
40)
(5,0
06,4
40 )
- -
- -
--
(5,0
06,4
40 )
Sto
ck d
ivid
ends
- 2%
50
,064
50
0,64
4 -
- -
- -
- -
- -
(5
00,6
44 )
(500
,644
) -
- -
--
--
Bon
us to
em
ploy
ees
- cas
h -
- -
- -
- -
- -
- -
(1
36,8
99 )
(136
,899
) -
- -
--
-(1
36,8
99 )
Bon
us to
em
ploy
ees
- sto
ck
48,5
37
485,
370
- -
- -
- -
- -
-
(485
,370
) (4
85,3
70 )
- -
--
--
-
Rem
uner
atio
n to
dire
ctor
s an
d su
perv
isor
s -
- -
- -
- -
- -
- -
(93,
340
) (9
3,34
0 )
- -
--
--
(93,
340
)
Cas
h di
vide
nds
rece
ived
by
subs
idia
ries
- -
- -
- 61
,032
-
- 61
,032
-
- -
- -
- -
--
-61
,032
Adj
ustm
ent a
risin
g fro
m c
hang
es in
equ
ity
in i
nves
tees
-
- -
- -
- 58
,535
-
58,5
35
- -
- -
- -
--
--
58,5
35
Adj
ustm
ent a
risin
g fro
m c
hang
es in
equ
ity in
in
vest
men
ts d
ue to
sub
sidi
arie
s' d
istri
butio
n of
bon
us to
em
ploy
ees
- -
- -
- -
(85,
286
) -
(85,
286
) -
- -
- -
- -
--
-(8
5,28
6 )
Adj
ustm
ent a
risin
g fro
m c
hang
es in
subs
idia
ries'
cap
ital s
urpl
us
- -
- -
- -
50,4
96
- 50
,496
-
- -
- -
- -
--
-50
,496
Rev
ersa
l aris
ing
from
cha
nges
in s
ubsi
diar
ies'
net l
osse
s no
t rec
ogni
zed
as p
ensi
on c
osts
-
- -
- -
- -
- -
- -
- -
- -
- 4,
092
- -
4,09
2
Ret
irem
ent o
f tre
asur
y st
ock
- 8,
925
thou
sand
sha
res
(8,9
25 )
(89,
250
) -
(9,7
00 )
(8,8
04 )
(24
4,70
9)
- (3
6,52
3 )
(299
,736
) -
-
(98,
157
) (9
8,15
7 )
- -
- -
487,
143
- -
Con
vers
ion
of o
vers
eas
conv
ertib
le b
onds
into
com
mon
sto
ck
- -
207
,426
-
53
4,40
4 -
- -
534,
404
- -
-
- -
- -
- -
- 74
1,83
0
Tran
slat
ion
adju
stm
ent o
n lo
ng-te
rm s
tock
inve
stm
ents
-
- -
- -
- -
- -
- -
-
- -
- 64
0,93
1 -
- -
640,
931
Con
solid
ated
net
inco
me
in 2
005
- -
- -
- -
- -
- -
- 8
,732
,358
8,
732,
358
- -
- -
- 1,
841,
761
10,5
74,1
19
Rev
ersa
l of u
nrea
lized
loss
on
long
-term
sto
ck
inve
stm
ents
-
- -
- -
- -
- -
- -
-
- -
144,
230
- -
- -
144,
230
Effe
ct o
n ch
ange
of s
hare
hold
ers'
equ
ity o
f
subs
idia
ries
-
-
-
-
-
-
- -
-
-
-
- -
-
-
-
- -
(528
,681
) (5
28,6
81 )
BA
LAN
CE
, DE
CE
MB
ER
31,
200
5 2
,601
,821
26
,018
,213
2
07,4
26
2,7
23,8
55
3,0
06,6
06
- 1
52,4
38
10,2
55,9
21
16,1
38,8
20
2,5
44,1
73
818
,507
9
,142
,557
12
,505
,237
- (
399,
345
)(3
99,6
92 )
(493
)(1
,219
,780
) 8,
830,
660
61,6
81,0
46
Effe
ct o
f cha
nge
in c
onso
lidat
ed e
ntiti
es
sinc
e 20
06
- -
- -
- -
- -
--
--
--
--
--
3,89
7,79
4 3,
897,
794
Effe
cts
of a
ccou
ntin
g ch
ange
s si
nce
adop
ted
SFA
S N
O.3
4 -
- -
- -
- -
- -
-
-
- -
(11
0,22
0 )
24
2,90
6 -
- -
- 13
2,68
6
App
ropr
iatio
n of
prio
r yea
r's e
arni
ngs
Lega
l res
erve
-
- -
- -
- -
- -
873,
236
-
(8
73,2
36 )
- -
- -
- -
- -
Rev
ersa
l of s
peci
al re
serv
e -
- -
- -
- -
- -
- (4
18,6
70)
41
8,67
0 -
- -
- -
- -
-
Cas
h di
vide
nds
- 24%
-
- -
- -
- -
- -
- -
(6,6
26,2
05)
(6,6
26,2
05 )
- -
- -
- -
(6,6
26,2
05 )
Sto
ck d
ivid
ends
- 0.
5%
13,8
05
138,
046
- -
- -
- -
- -
-
(138
,046
) (1
38,0
46 )
- -
- -
- -
-
Bon
us to
em
ploy
ees
- cas
h -
- -
- -
- -
- -
- -
(2
44,3
22 )
(244
,322
) -
- -
- -
- (2
44,3
22 )
Bon
us to
em
ploy
ees
- sto
ck
52,0
00
520,
000
- -
- -
- -
- -
-
(520
,000
) (5
20,0
00 )
- -
- -
- -
-
Rem
uner
atio
n to
dire
ctor
s an
d su
perv
isor
s -
- -
- -
- -
- -
- -
(1
14,6
48 )
(114
,648
) -
- -
- -
- (1
14,6
48 )
Con
vers
ion
of o
vers
eas
conv
ertib
le b
onds
into
co
mm
on s
tock
17
9,30
1 1,
793,
008
138
,954
-
4,5
90,2
03
- -
- 4,
590,
203
- -
- -
- -
- -
- -
6,52
2,16
5
Cas
h di
vide
nds
rece
ived
by
subs
idia
ries
- -
- -
-
84,4
31
- -
84,4
31
- -
- -
- -
- -
- -
84,4
31
Adj
ustm
ent a
risin
g fro
m c
hang
es in
equ
ity in
inve
stm
ents
due
to s
ubsi
diar
ies'
dis
tribu
tion
of b
onus
to e
mpl
oyee
s -
- -
- -
- (1
60,1
91)
- (1
60,1
91 )
- -
(1
13,9
16 )
(113
,916
) -
- -
- -
- (2
74,1
07 )
Adj
ustm
ent a
risin
g fro
m c
hang
es in
cap
ital
surp
lus
in s
ubsi
diar
ies
- -
- -
- 1,
500
7,75
3 -
9,25
3 -
- -
- -
- -
- -
- 9,
253
Unr
ealiz
ed g
ain
or lo
ss o
n ca
sh f
low
s he
dgin
g -
- -
- -
- -
- -
- -
- -
50,4
64
- -
- -
- 50
,464
Con
solid
ated
net
inco
me
in 2
006
- -
- -
- -
- -
- -
- 8
,401
,959
8,
401,
959
- -
- -
- 76
0,24
1 9,
162,
200
Unr
ealiz
ed g
ain
or lo
ss o
n av
aila
ble-
for-
sale
finan
cial
ass
ets
- -
- -
- -
- -
- -
- -
- -
53
2,68
6 -
--
- 53
2,68
6
Tran
slat
ion
adju
stm
ents
on
long
-term
sto
ck
inve
stm
ents
-
- -
- -
- -
- -
- -
- -
- -
467,
371
--
- 46
7,37
1
Issu
ance
of n
ew s
hare
s du
e to
sha
re e
xcha
nge
26,5
5426
5,54
5-
893,
292
- -
- -
893,
292
- -
- -
- -
--
- -
1,15
8,83
7
Effe
ct o
f cha
nge
in s
hare
hold
ers'
equ
ity o
f
subs
idia
ries
--
- -
--
--
- -
- -
- -
- -
--
3,5
73,0
903,
573,
090
BA
LAN
CE
, DE
CE
MB
ER
31,
200
6 2
,873
,481
$28,
734,
812
$34
6,38
0$3
,617
,147
$7,
596,
809
$ 8
5,93
1 $
-
$2
1,55
5,80
8
$10,
255,
921
$
3,41
7,40
9
$
399,
837
$9,
332,
813
$13,
150,
059
$ (5
9,75
6 )
$
376,
247
$
67,6
79 $
(4
93 )
$(
1,21
9,78
0)
$17,
061,
785
$80,
012,
741
The
acc
ompa
nyin
g no
tes
are
an in
tegr
al p
art o
f the
con
solid
ated
fina
ncia
l sta
tem
ents
.
(With
Del
oitte
& T
ouch
e au
dit r
epor
t dat
ed M
arch
2, 2
007)
3.Financial Information
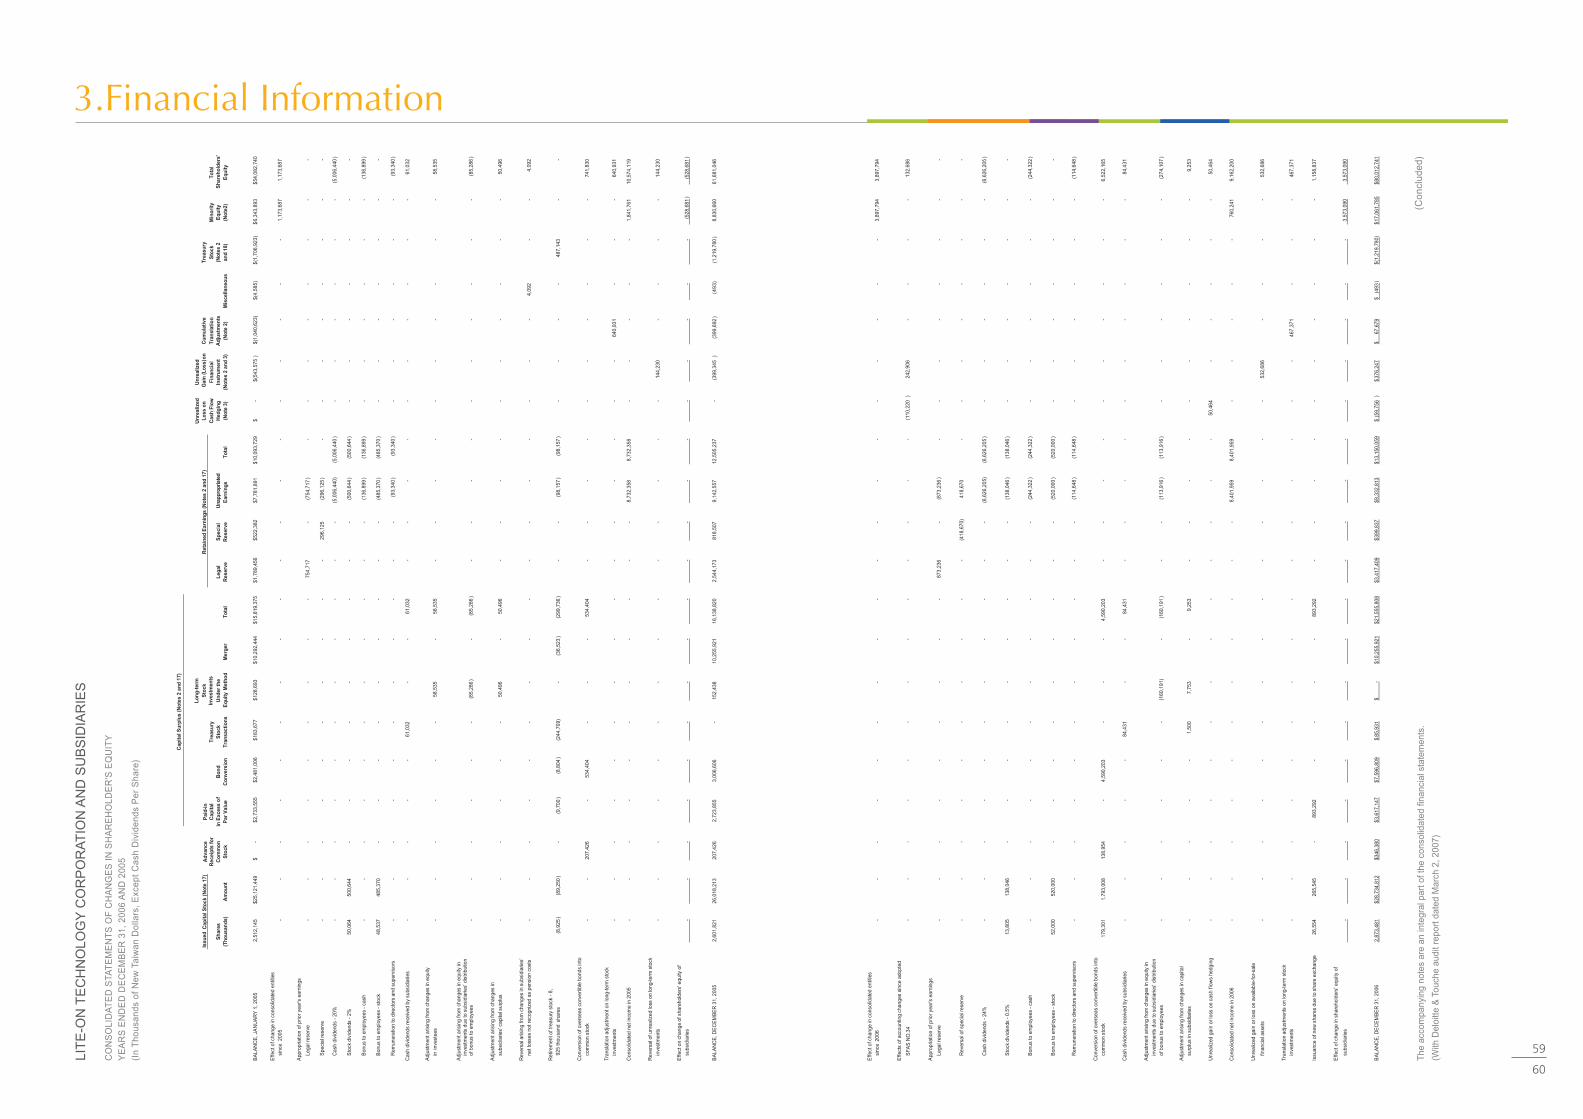
60
59
LIT
E-O
N T
EC
HN
OLO
GY
CO
RP
OR
AT
ION
AN
D S
UB
SID
IAR
IES
CO
NS
OLI
DA
TE
D S
TAT
EM
EN
TS
OF
CH
AN
GE
S I
N S
HA
RE
HO
LDE
R'S
EQ
UIT
Y
YE
AR
S E
ND
ED
DE
CE
MB
ER
31,
200
6 A
ND
200
5
(In
Tho
usan
ds o
f N
ew T
aiw
an D
olla
rs,
Exc
ept
Cas
h D
ivid
ends
Per
Sha
re)
(Con
clud
ed)
Cap
ital S
urpl
us (N
otes
2 a
nd 1
7)
Unr
ealiz
edU
nrea
lized
Pai
d-in
Lo
ss o
nG
ain
(Los
s)on
C
umul
ativ
e Is
sued
Cap
ital S
tock
(Not
e 17
)
Adv
ance
C
apita
lC
ash
Flow
Fina
ncia
lTr
ansl
atio
n
Trea
sury
Sto
ckM
inor
ityTo
tal
Sha
res
R
ecei
pts
for
in E
xces
s o
fB
ond
Trea
sury
Sto
ck
Long
-ter
mS
tock
Inve
stm
ents
Und
er th
eS
peci
alU
napp
ropr
iate
d
Hed
ging
Inst
rum
ent
Adj
ustm
ents
(N
otes
2E
quity
S
hare
hold
ers'
Ret
aine
d E
arni
ngs
(Not
es 2
and
17)
(Tho
usan
ds)
Am
ount
C
omm
on
Sto
ck
Par
Val
ueC
onve
rsio
nTr
ansa
ctio
nsE
quity
Met
hod
Mer
ger
Tota
lLe
gal
Res
erve
Res
erve
Ear
ning
sTo
tal
(Not
e 3)
(Not
es 2
and
3)
(Not
e 2)
Mis
cella
neou
san
d 18
)(N
ote2
)E
quity
BA
LAN
CE
, JA
NU
AR
Y 1
, 200
5 2
,512
,145
$25,
121,
449
$ -
$2,7
33,5
55$2
,481
,006
$1
83,6
77
$128
,693
$1
0,29
2,44
4
$15,
819,
375
$1,7
89,4
56$5
22,3
82$7
,781
,891
$1
0,09
3,72
9$
-$(
543,
575
)
$(1,
040,
623)
$(4,
585 )
$(
1,70
6,92
3)
$ 6,3
43,8
93
$54,
082,
740
Effe
ct o
f cha
nge
in c
onso
lidat
ed e
ntiti
es
sinc
e 20
05
--
--
--
--
--
--
--
- -
--
1,17
3,68
71,
173,
687
App
ropr
iatio
n of
prio
r yea
r's e
arni
ngs
Lega
l res
erve
-
--
--
--
--
754,
717
-
(754
,717
)-
- -
- -
--
-
Spe
cial
rese
rve
- -
--
--
- -
--
296,
125
(2
96,1
25 )
--
- -
--
--
Cas
h di
vide
nds
- 20%
-
- -
- -
- -
- -
--
(5,0
06,4
40)
(5,0
06,4
40 )
- -
- -
--
(5,0
06,4
40 )
Sto
ck d
ivid
ends
- 2%
50
,064
50
0,64
4 -
- -
- -
- -
- -
(5
00,6
44 )
(500
,644
) -
- -
--
--
Bon
us to
em
ploy
ees
- cas
h -
- -
- -
- -
- -
- -
(1
36,8
99 )
(136
,899
) -
- -
--
-(1
36,8
99 )
Bon
us to
em
ploy
ees
- sto
ck
48,5
37
485,
370
- -
- -
- -
- -
-
(485
,370
) (4
85,3
70 )
- -
--
--
-
Rem
uner
atio
n to
dire
ctor
s an
d su
perv
isor
s -
- -
- -
- -
- -
- -
(93,
340
) (9
3,34
0 )
- -
--
--
(93,
340
)
Cas
h di
vide
nds
rece
ived
by
subs
idia
ries
- -
- -
- 61
,032
-
- 61
,032
-
- -
- -
- -
--
-61
,032
Adj
ustm
ent a
risin
g fro
m c
hang
es in
equ
ity
in i
nves
tees
-
- -
- -
- 58
,535
-
58,5
35
- -
- -
- -
--
--
58,5
35
Adj
ustm
ent a
risin
g fro
m c
hang
es in
equ
ity in
in
vest
men
ts d
ue to
sub
sidi
arie
s' d
istri
butio
n of
bon
us to
em
ploy
ees
- -
- -
- -
(85,
286
) -
(85,
286
) -
- -
- -
- -
--
-(8
5,28
6 )
Adj
ustm
ent a
risin
g fro
m c
hang
es in
subs
idia
ries'
cap
ital s
urpl
us
- -
- -
- -
50,4
96
- 50
,496
-
- -
- -
- -
--
-50
,496
Rev
ersa
l aris
ing
from
cha
nges
in s
ubsi
diar
ies'
net l
osse
s no
t rec
ogni
zed
as p
ensi
on c
osts
-
- -
- -
- -
- -
- -
- -
- -
- 4,
092
- -
4,09
2
Ret
irem
ent o
f tre
asur
y st
ock
- 8,
925
thou
sand
sha
res
(8,9
25 )
(89,
250
) -
(9,7
00 )
(8,8
04 )
(24
4,70
9)
- (3
6,52
3 )
(299
,736
) -
-
(98,
157
) (9
8,15
7 )
- -
- -
487,
143
- -
Con
vers
ion
of o
vers
eas
conv
ertib
le b
onds
into
com
mon
sto
ck
- -
207
,426
-
53
4,40
4 -
- -
534,
404
- -
-
- -
- -
- -
- 74
1,83
0
Tran
slat
ion
adju
stm
ent o
n lo
ng-te
rm s
tock
inve
stm
ents
-
- -
- -
- -
- -
- -
-
- -
- 64
0,93
1 -
- -
640,
931
Con
solid
ated
net
inco
me
in 2
005
- -
- -
- -
- -
- -
- 8
,732
,358
8,
732,
358
- -
- -
- 1,
841,
761
10,5
74,1
19
Rev
ersa
l of u
nrea
lized
loss
on
long
-term
sto
ck
inve
stm
ents
-
- -
- -
- -
- -
- -
-
- -
144,
230
- -
- -
144,
230
Effe
ct o
n ch
ange
of s
hare
hold
ers'
equ
ity o
f
subs
idia
ries
-
-
-
-
-
-
- -
-
-
-
- -
-
-
-
- -
(528
,681
) (5
28,6
81 )
BA
LAN
CE
, DE
CE
MB
ER
31,
200
5 2
,601
,821
26
,018
,213
2
07,4
26
2,7
23,8
55
3,0
06,6
06
- 1
52,4
38
10,2
55,9
21
16,1
38,8
20
2,5
44,1
73
818
,507
9
,142
,557
12
,505
,237
- (
399,
345
)(3
99,6
92 )
(493
)(1
,219
,780
) 8,
830,
660
61,6
81,0
46
Effe
ct o
f cha
nge
in c
onso
lidat
ed e
ntiti
es
sinc
e 20
06
- -
- -
- -
- -
--
--
--
--
--
3,89
7,79
4 3,
897,
794
Effe
cts
of a
ccou
ntin
g ch
ange
s si
nce
adop
ted
SFA
S N
O.3
4 -
- -
- -
- -
- -
-
-
- -
(11
0,22
0 )
24
2,90
6 -
- -
- 13
2,68
6
App
ropr
iatio
n of
prio
r yea
r's e
arni
ngs
Lega
l res
erve
-
- -
- -
- -
- -
873,
236
-
(8
73,2
36 )
- -
- -
- -
- -
Rev
ersa
l of s
peci
al re
serv
e -
- -
- -
- -
- -
- (4
18,6
70)
41
8,67
0 -
- -
- -
- -
-
Cas
h di
vide
nds
- 24%
-
- -
- -
- -
- -
- -
(6,6
26,2
05)
(6,6
26,2
05 )
- -
- -
- -
(6,6
26,2
05 )
Sto
ck d
ivid
ends
- 0.
5%
13,8
05
138,
046
- -
- -
- -
- -
-
(138
,046
) (1
38,0
46 )
- -
- -
- -
-
Bon
us to
em
ploy
ees
- cas
h -
- -
- -
- -
- -
- -
(2
44,3
22 )
(244
,322
) -
- -
- -
- (2
44,3
22 )
Bon
us to
em
ploy
ees
- sto
ck
52,0
00
520,
000
- -
- -
- -
- -
-
(520
,000
) (5
20,0
00 )
- -
- -
- -
-
Rem
uner
atio
n to
dire
ctor
s an
d su
perv
isor
s -
- -
- -
- -
- -
- -
(1
14,6
48 )
(114
,648
) -
- -
- -
- (1
14,6
48 )
Con
vers
ion
of o
vers
eas
conv
ertib
le b
onds
into
co
mm
on s
tock
17
9,30
1 1,
793,
008
138
,954
-
4,5
90,2
03
- -
- 4,
590,
203
- -
- -
- -
- -
- -
6,52
2,16
5
Cas
h di
vide
nds
rece
ived
by
subs
idia
ries
- -
- -
-
84,4
31
- -
84,4
31
- -
- -
- -
- -
- -
84,4
31
Adj
ustm
ent a
risin
g fro
m c
hang
es in
equ
ity in
inve
stm
ents
due
to s
ubsi
diar
ies'
dis
tribu
tion
of b
onus
to e
mpl
oyee
s -
- -
- -
- (1
60,1
91)
- (1
60,1
91 )
- -
(1
13,9
16 )
(113
,916
) -
- -
- -
- (2
74,1
07 )
Adj
ustm
ent a
risin
g fro
m c
hang
es in
cap
ital
surp
lus
in s
ubsi
diar
ies
- -
- -
- 1,
500
7,75
3 -
9,25
3 -
- -
- -
- -
- -
- 9,
253
Unr
ealiz
ed g
ain
or lo
ss o
n ca
sh f
low
s he
dgin
g -
- -
- -
- -
- -
- -
- -
50,4
64
- -
- -
- 50
,464
Con
solid
ated
net
inco
me
in 2
006
- -
- -
- -
- -
- -
- 8
,401
,959
8,
401,
959
- -
- -
- 76
0,24
1 9,
162,
200
Unr
ealiz
ed g
ain
or lo
ss o
n av
aila
ble-
for-
sale
finan
cial
ass
ets
- -
- -
- -
- -
- -
- -
- -
53
2,68
6 -
--
- 53
2,68
6
Tran
slat
ion
adju
stm
ents
on
long
-term
sto
ck
inve
stm
ents
-
- -
- -
- -
- -
- -
- -
- -
467,
371
--
- 46
7,37
1
Issu
ance
of n
ew s
hare
s du
e to
sha
re e
xcha
nge
26,5
5426
5,54
5-
893,
292
- -
- -
893,
292
- -
- -
- -
--
- -
1,15
8,83
7
Effe
ct o
f cha
nge
in s
hare
hold
ers'
equ
ity o
f
subs
idia
ries
--
- -
--
--
- -
- -
- -
- -
--
3,5
73,0
903,
573,
090
BA
LAN
CE
, DE
CE
MB
ER
31,
200
6 2
,873
,481
$28,
734,
812
$34
6,38
0$3
,617
,147
$7,
596,
809
$ 8
5,93
1 $
-
$2
1,55
5,80
8
$10,
255,
921
$
3,41
7,40
9
$
399,
837
$9,
332,
813
$13,
150,
059
$ (5
9,75
6 )
$
376,
247
$
67,6
79 $
(4
93 )
$(
1,21
9,78
0)
$17,
061,
785
$80,
012,
741
The
acc
ompa
nyin
g no
tes
are
an in
tegr
al p
art o
f the
con
solid
ated
fina
ncia
l sta
tem
ents
.
(With
Del
oitte
& T
ouch
e au
dit r
epor
t dat
ed M
arch
2, 2
007)
3.Financial Information

62
61
LITE-ON TECHNOLOGY CORPORATION AND SUBSIDIARIES
CONSOLIDATED STATEMENTS OF CASH FLOWS
YEARS ENDED DECEMBER 31, 2006 AND 2005
(In Thousands of New Taiwan Dollars)
LITE-ON TECHNOLOGY CORPORATION AND SUBSIDIARIES
CONSOLIDATED STATEMENTS OF CASH FLOWS
YEARS ENDED DECEMBER 31, 2006 AND 2005
(In Thousands of New Taiwan Dollars)
(Concluded)
The accompanying notes are an integral part of the consolidated financial statements.
(With Deloitte & Touche audit report dated March 2, 2007)
(Continued)
2006 2005 2006 2005
2006 2005
Proceeds from financial assets measured at holding cost 278,747 33,591Acquisition of financial assets measured at holding cost (118,688 ) (532,821 )Acquisition of long-term investments under the equity method (452,000 ) (3,129,770 )Proceeds from sale of long-term investments under the equity method 82,886 4,332,083Acquisition of properties (5,880,468 ) (2,231,921 )Proceeds from property disposal 775,036 1,324,054Decrease (increase) in refundable deposits (67,564 ) 30,100Increase in deferred charges (567,729 ) (979,330 )Acquisition of intangible assets (1,226,855 ) (3,675 )Increase in land use rights - (191,731 )The difference between the cost of acquisiting subsidiary and its shareholders' equity (430,283 ) -Increase in other assets (231,227 ) (89,342 )
Net cash used in investing activities (6,796,629 ) (1,634,240 )
CASH FLOWS FROM FINANCING ACTIVITIESIncrease in short-term bank loans 2,736,392 4,689,856Increase in financial liabilities at fair value through profit of loss 13,962 -Increase (decrease) in long-term debts (444,968 ) 413,267Increase (decrease) in guarantee deposits (24,362 ) 24,721Cash dividends paid (7,863,327 ) (6,530,181 )Remuneration to directors and supervisors and bonuses to employees (226,829 ) (498,577 )
Net cash used in financing activities (5,809,132 ) (1,900,914 )
EFFECTS OF EXCHANGE RATE CHANGES 467,371 69,473
CASH INCREASE DUE TO CHANGES IN CONSOLIDATED ENTITIES 2,052,343 3,032,020
NET INCREASE IN CASH 6,445,108 7,174,682
CASH, BEGINNING OF YEAR 42,311,146 35,136,464
CASH, END OF YEAR $ 48,756,254 $ 42,311,146
SUPPLEMENTARY DISCLOSURE OF CASH FLOWINFORMATIONInterest paid (excluding capitalized interests) $ 641,579 $ 165,103Income tax paid $ 780,042 $ 996,427
NONCASH INVESTING AND FINANCING ACTIVITIESCurrent portion of long-term debts $ 1,518,323 $ 7,909,873
Payable to cash dividends,remuneration of directors and supervisiors and employees cash bonuses $ 136,284 $ -
Conversion of overseas convertible bonds into common stock $ 6,522,165 $ 741,830The subsidiary issued stock to acquire intangible assets $ 4,275,331 $ -
CASH PAID FOR ACQUISITION OF PROPERTIESIncrease in properties $ 6,191,428 $ 2,035,739Decrease (increase) in payable for properties (310,960 ) 196,182
$ 5,880,468 $ 2,231,921
CASH FLOWS FROM OPERATING ACTIVITIES
Consolidated net income $ 9,162,200 $ 10,574,119
Cumulative effects of changes in accounting principles (711 ) -
Adjustments to reconcile net income to net cash provided by operating activities:
Depreciation 2,719,837 2,341,551
Amortization 828,718 867,431
Reversal of allowance for bad debts (24,282 ) (26,512 )
Financial asset and liability revaluation loss (gain) 10,060 (13,736 )
Loss on decline in inventory value 849,339 348,567
Loss on disposal of inventories 429,868 39,638
Gain on disposal of investments (149,714 ) (1,508,256 )
Loss (gain) on disposal of properties and idle assets,net 28,243 (15,406 )
Asset impairment loss 105,638 191,134
Decline in carrying value of financial assets measured at holding cost 336,491 308,558
Investment income recognized under the equity method,net (242,510 ) (181,835 )
Cash dividends from equity-method investees 138,298 276,055
Product warranty reserve (131,798 ) 46,453
Accrued pension costs 59,324 38,177
Deferred income taxes 379,798 375,596
Deferred income (16,557 ) (49,586 )
Net changes in operating assets and liabilities
Notes receivable (85,208 ) 1,544
Accounts receivable 3,432,680 (15,780,734 )
Receivable from related parties 370,544 4,220,876
Inventories 1,666,094 (3,973,944 )
Prepayments (359,822 ) (36,246 )
Other financial assets - current (843,990 ) (74,341 )
Notes payable 647,352 (53,303 )
Accounts payable (4,361,075 ) 11,516,727
Payables to related parties (162,729 ) (4,020,732 )
Income taxes payable 480,201 523,998
Accrued expenses 551,878 172,348
Other accounts payable 988,224 1,013,872
Advances from customers 202,906 91,223
Other current liabilities (478,142 ) 395,107
Net cash provided by operating activities 16,531,155 7,608,343
CASH FLOWS FROM INVESTING ACTIVITIES
Decrease (increase) in financial assets at fair value through profit or loss 92,081 (413,571 )
Proceeds from sale of available-for sale financial assets 7,721,454 218,093
Acquisition of available-for-sale financial assets (6,772,019 ) -
3.Financial Information

This annual report contains excerpts from the Chinese version of Lite-On Technology Corporation's 2006
annual report, which was printed on May 5th, 2007 and published in accordance with “the Regulation of
the Criteria Governing Information to be published in Annual Company Reports in the Republic of China.”
For more information, please refer to the Chinese version of the Company's annual report.
Lite-On Technology Corporation
Raymond Soong, Chairman


