Middle East Journal of Age and Ageing 2008; Volume 5, Issue 2 Models and Systems of Elderly Care Quality of life in elderly people in Kashan, Iran --------------------------------------------------- Author Vahid NejatP; Peymaneh Shirinbayan2; Ahmadali Akbari Kamrani, MD3; Mahshid Foroughan, MD4; Parisa Taheri, MD5; Mehrdad Sheikhvatan, MD6 1) Neuroscientist, Rehabilitation and well-being college, Tehran, Iran 2YMaster of Psychometry, Rehabilitation and well-being college, Tehran, Iran 3) Assistant Professor of internal medicine, Rehabilitation and well-being college, Tehran, Iran 4) Psychologist, Rehabilitation and well-being college, Tehran, Iran 5) Specialist of Geriatric Medicine, Rehabilitation and well-being college, Tehran, Iran 6) Researcher, Medical Sciences/ University of Tehran, Tehran, Iran. Correspondence: Vahid Nejati P.O.Box: 13185-1678, Tehran, Iran Tel: +9821 66439463 Fax: +98 021 66919206 Email: [email protected]ABSTRACT The objective of this article was to identify determinants of quality of life and investigate their association with physical and social functions, physical and emotional roles, and physical and mental health among older people in Kashan, Iran. In a cross-sectional study 389 elderly persons (aged 2:60 years) was selected ran- domly from 120 zones ofKashan. The structured interview consisted of36 questions including sub-ques- tions related to different aspects of life by using on SF-36 health survey. The mean age of participants was 69.8::1::7.74 years. Illiteracy rate in men and women were 31.2% and 8.5% (P<O.OOOI), whereas marriage rates were 87.6% and 87.1%(P=125), respectively. The mean score of aspects of physical function (P<O.OOOI), general health perception (P<O.OOOI), physical role (P<O.OOOI), vitality (P=0.0007), mental health (P=0.003), and bodily pain (P<O.OOOI) in men was higher than in females, whereas social function (P=0.844) and emotional role (P=0.397) were similar between the two genders. Illiteracy is common in elderly people, and quality of life in men was higher than women in all aspects. Keywords: Quality oflife, Old age, SF-36 health survey Introduction Social scientists started to use it in the 1970s and since then there has been a growing interest in quality oflife issues in medicine, nursing and other health care areas. There are vari- ous explanations for this growing interest. One has to do with the growing number of elderly people in society. Higher age often brings about health problems and a decrease in func- tional capacity. This means that we have a growing number of people living with chronic diseases, health problems and decreasing capacity. For these patients the goal of health care cannot be freedom from disease. What we can do is to help the patients to live as good a life as possible despite their illnesses and decreasing capacitiesJ:3J. Quality of life is a universally desired patient outcome that is essential to human health[IJ.Quality oflife is a subjective and multidimensional concept that is increasingly being recog- nized as a useful outcome in health and social care research. The World Health Organization Quality of Life group defined quality oflife as "an individual's perception oftheirRosition in life in the context of the culture and value systems in which they live and in relation to their goals, expectations, standards and concerns. The subjective nature of quality oflife purports that it can be conceptualized differently by different groups of people. Age, gender, health status, and cultural factors are some of the important factors that influence their conceptu- alization[2J.The term quality of life is of a more recent origin. There are several previous studies about quality of life in elderly people in different societies. However, a few studies http://www.me-jaa.com 21
Transcript
Middle East Journal of Age and Ageing 2008; Volume 5, Issue 2
1) Neuroscientist, Rehabilitation and well-being college, Tehran, Iran2YMaster of Psychometry, Rehabilitation and well-being college, Tehran, Iran3) Assistant Professor of internal medicine, Rehabilitation and well-being college, Tehran, Iran4) Psychologist, Rehabilitation and well-being college, Tehran, Iran5) Specialist of Geriatric Medicine, Rehabilitation and well-being college, Tehran, Iran6) Researcher, Medical Sciences/ University of Tehran, Tehran, Iran.
The objective of this article was to identify determinants of quality of life and investigate their associationwith physical and social functions, physical and emotional roles, and physical and mental health among olderpeople in Kashan, Iran. In a cross-sectional study 389 elderly persons (aged 2:60 years) was selected ran-domly from 120 zones ofKashan. The structured interview consisted of36 questions including sub-ques-tions related to different aspects of life by using on SF-36health survey. The mean age of participants was69.8::1::7.74years. Illiteracy rate in men and women were 31.2% and 8.5% (P<O.OOOI),whereas marriage rateswere 87.6%and 87.1%(P=125), respectively. The mean score of aspects of physical function (P<O.OOOI),general health perception (P<O.OOOI),physical role (P<O.OOOI),vitality (P=0.0007), mental health (P=0.003),and bodily pain (P<O.OOOI)in men was higher than in females, whereas social function (P=0.844) andemotional role (P=0.397) were similar between the two genders. Illiteracy is common in elderly people, andquality of life in men was higher than women in all aspects.
Keywords: Quality oflife, Old age, SF-36 health survey
Introduction Social scientists started to use it in the 1970s and since thenthere has been a growing interest in quality oflife issues inmedicine, nursing and other health care areas. There are vari-ous explanations for this growing interest. One has to do withthe growing number of elderly people in society. Higher ageoften brings about health problems and a decrease in func-tional capacity. This means that we have a growing numberof people living with chronic diseases, health problems anddecreasing capacity. For these patients the goal of health carecannot be freedom from disease. What we can do is to help thepatients to live as good a life as possible despite their illnessesand decreasing capacitiesJ:3J.
Quality of life is a universally desired patient outcome that isessential to human health[IJ.Quality oflife is a subjective andmultidimensional concept that is increasingly being recog-nized as a useful outcome in health and social care research.The World Health Organization Quality of Life group definedquality oflife as "an individual's perception oftheirRositionin life in the context of the culture and value systems in whichthey live and in relation to their goals, expectations, standardsand concerns. The subjective nature of quality oflife purportsthat it can be conceptualized differently by different groupsof people. Age, gender, health status, and cultural factors aresome of the important factors that influence their conceptu-alization[2J.The term quality of life is of a more recent origin.
There are several previous studies about quality of life inelderly people in different societies. However, a few studies
http://www.me-jaa.com 21
Middle East Journal of Age and Ageing 2008; Volume 5, Issue 2
about quality oflife in this group in Iran were done. In order toobtain a detailed and organized program like other countriesin the world and many of the East-Mediterranean countries(EMRO) have proposed their seniors' health national program.It was necessary for Iran to perform an epidemiological surveyto determine seniors' social and physical health, setting priori-ties for social and physical health needs, assess the amountof services needed for them and to adopt national policies oncaring for this age group.
The objective of this article was to identify determinants ofquality of life and investigate their association with physicaland social functions, physical and emotional roles, and Physi-cal and Mental health among older people in Kashan, a city inIran located in the center of this country. The estimated 2006
_population of Kashan City is 301864 and of that 51.2% of thepopulation is male.
Materials and Methods
Study population:A cross-sectional study of389 elderly persons (aged 2:60,years) was selected randomly from 120 zones of Kashan city.Data for this study were collected between April 2005 andApril 2006. The sample was restricted to people living innon-institutional settings (e.g. their own homes or houses forelderly people). The study site has been described as a typicalIranian agricultural community and as being similar to most ofrural Iran in terms of ethnicity, culture, and language. Indi-viduals who agreed to participate met with the researcher orresearch assistant who explained the purpose of the study andobtained informed consent.
Data collection:
Because elderly people in institutions usually have more healthproblems and lower functional capacity than elderly peopleliving in their own homes, they might have difficulties incompleting a long interview. The researchers sent a letter tothe informants, describing the purpose of the study, and thencontacted them by telephone to set a date for the interview.Ethical committees in Kashan University of medical scienceshave approved this study. The structured interview consistedof 36 questions including sub-questions related to differentaspects of life: age, sex, marital status, literacy (ability to readand write), physical function, knowledge of general health per-ceptions, physical role, social function, emotional role, vitality,mental health, and bodily pain. Questions were based on SF-36health survey. SF-36 is a generic questionnaire for the meas-urement of quality of life, and covers 8 dimensions of healthstatus and 2 summary areas, one physical and one mental[4].The scores are in the range of 0 to 100 (a higher score indicat-ing a better health status). The questionnaire has been trans-
Table1. Demographic characteristics of elderly population
lated and validated in an Iranian population[5]. The reason forchoosing previously tested instruments was to guarantee initialvalidity and reliability.
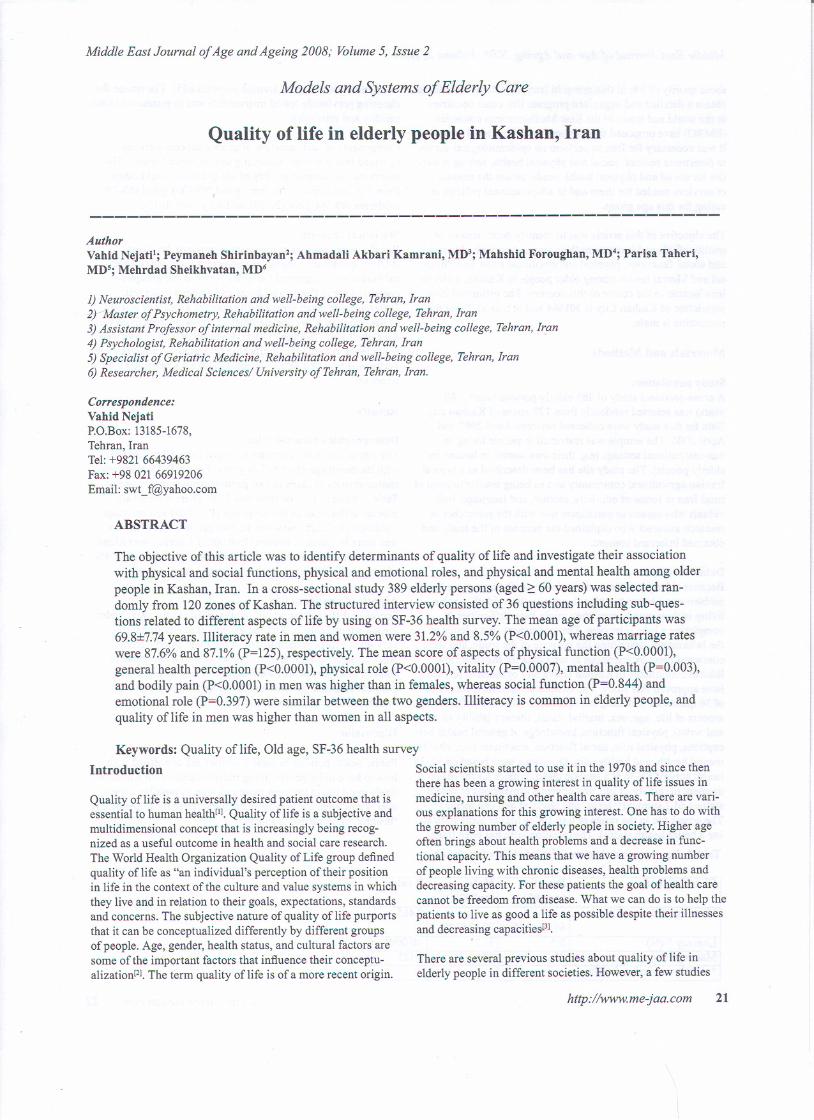
Components of each question of quality aspects were cat-egorized into five steps according to categorized scales: Thescores on the summed quality oflife questions could rangefrom 0 to 100 (mean = 50): very good (80-100), good (60-79),moderate (40-59),poor (20-39), and very poor (0-19).
Statistical analysis:Results were reported as the mean :f:standard deviation(SD) for quantitative variables and percentages for categori-cal variables. Categorical variables between the groups werecompared using Pearson's x2-test and Fisher's exact test.Differences in mean scores with regard to aspects of qualityoflife were tested by non-parametric one-way analysis ofvari-ance, the Mann-Whitney U-test. P values of 0.05 or less wereconsidered statistically significant. All statistical analyses wereperformed by using SPSS version 13and SAS version 9.1 forwindows.
Results
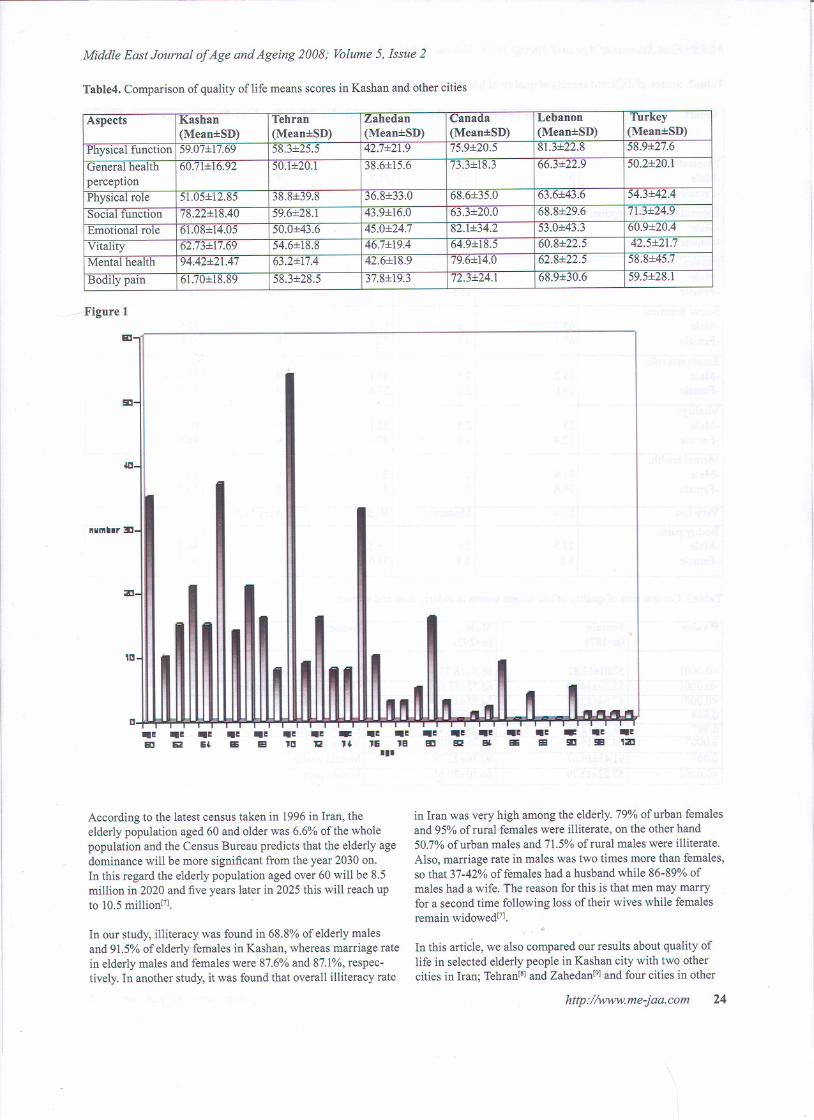
Demographic characteristics:The age of our study population ranged from 60 to 120yearswith the mean age of 69.8:f:7.74years (Figure 1).Demographiccharacteristics of cases in two genders were summarized inTable 1.Male to Female ratio was 1.08.There were no sig-nificant differences in the mean age (P=0.465) and marriagecondition (P=0.125) between the two genders, but illiteracywas more frequent in women (P<O.OOO1).Literacy was foundin 31.2% of men and only 8.5% of women, whereas only 1.4%of men and 0.5% of women had a postgraduate degree.
Aspects of quality of life:Scores of different aspects of quality of life in the two gendersare shown in Table 2. With the exception of emotional role,very goodscorespredominatedin themaleelderlygroup.Also, comparison of mean scores between the two gendersshowed that these scores were higher in men in aspects ofphysical function, general health perception, physical role,vitality, mental health, and bodily pain (Table 3).
Discussion
Public health policies in most countries are concerned withhow to keep older people living independently with a qualita-tively good life in the community as long as possible. How-ever, knowledge about what may characterize those seemingly'healthy' older people is sparse(6].
..
http://www.me-jaa.com 22
Characteristics Female Male P value
(n= 187) (n=202)Mean age (Mean:f:SD) 0.465
68.49:!:7.19 70.12:!:7.22
Literacy * (%) 8.5 31.2 <0.0001
Marriage (%) 87.1 87.6 0.125
* Ability to read and write
Middle East Journal of Age and Ageing 2008; Volume 5, Issue 2
Table2. Scores of different aspects of quality of life in two genders
Table3. Comparison of quality of life means scores in elderly men and women
http://www.me-jaa.com 23
Aspect Very poor (0-19) Poor (20-39) Moderate (40-59) Good (60-79) Very good (80-100)
<0.0001 57.01:i:l3.82 66.6:f:18.35 Physical function<0.0001 55.59:f:14.89 65.72:f:17.3l General health perception<0.0001 47.54:f:12.07 54.56:f:12.68 Physical role0.844 78.03:f:17.50 78.40:f:19.30 Social function0.397 61.2l:f:12.68 62.38:f:14.4l Emotional role0.0007 59.70:f:15.72 65.76:f:19.02 Vitality0.003 91.43:f:16.67 97.36:f:22.78 Mental health
<0.0001 57.22:f:15.79 66.10:f:20.6l Bodily pain
Middle East Journal of Age and Ageing 2008; Volume 5, Issue 2
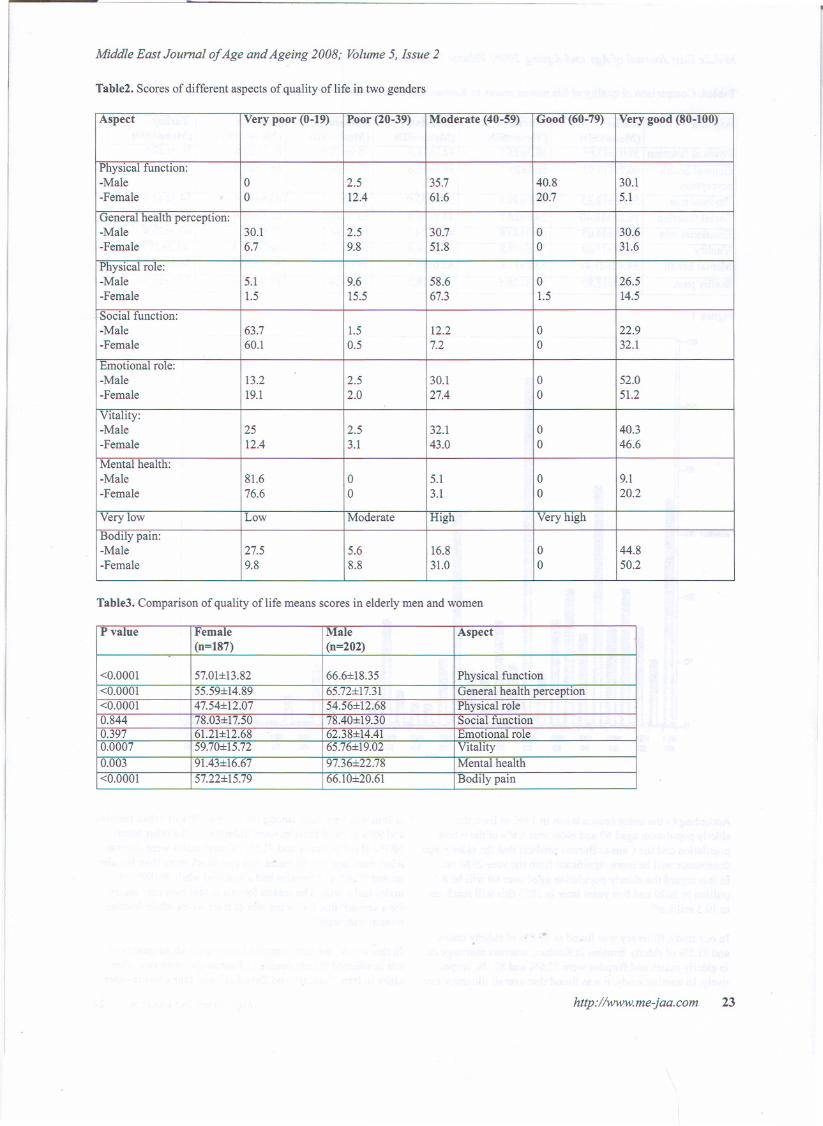
Table4. Comparison of quality of life means scores in Kashan and other cities
Figure 1
&:I
!5D
olD
ftlll1llllr ::!II
ZI
U~
a..~&:I
..~IIW
..~IB
~~12
~~ ..~"E ..8
.....~E"
~~iii
~~..a
-u
According to the latest census taken in 1996 in Iran, theelderly population aged 60 and older was 6.6% ofthe wholepopulation and the Census Bureau predicts that the elderly agedominance will be more significant from the year 2030 on.In this regard the elderly population aged over 60 will be 8.5million in 2020 and five years later in 2025 this will reach upto 10.5million[7]. >
In our study, illiteracy was found in 68.8% of elderly malesand 91.5% of elderly females in Kashan, whereas marriage ratein elderly males and females were 87.6% and 87.1%,respec-tively. In another study, it was found that overall illiteracy rate
..~sa
..~EM
..~BE
-!ill
..~'ZI
~~EB
~~!iEI
..~B2
in Iran was very high among the elderly. 79% of urban femalesand 95% of rural females were illiterate, on the other hand50.7% of urban males and 71.5% of rural males were illiterate.
Also, marriage rate in males was two times more than females,so that 37-42% offemales had a husband while 86-89% ofmales had a wife. The reason for this is that men may marryfor a second time following loss of their wives while femalesremain widowed[7].
..
In this article, we also compared our results about quality oflife in selected elderly people in Kashan city with two othercities in Iran; Tehran[S]and Zahedan[9]and four cities in other
http://www.me-jaa.com 24
Aspects Kashan Tehran Zahedan Canada Lebanon Turkey
Middle East Journal of Age and Ageing 2008; Volume 5, Issue 2
countries; Toronto in Canada[IO], south cities in Lebanon[II], and
Samsun in Turkeyl12].
Results ofthis comparison are summarized in Table 4. Wefound that the mean scores of quality of life in all aspects inKashan were higher than the capital ofIran (Tehran). Physi-cal role score in this city was more than the other two citiesin Iran, Also, physical role score was less and social functionand mental health was more than other countries. These resultsshowed that several factors can influence the quality of life inelderly populations in different societies. Functional capacity,perceived health, good housing conditions, an active life style,and good social relationships were some of the factors thatexplained life satisfaction and subjective quality oflife[13oI6].Low economic status is another determinant affecting quality
yf life. Social capital was discussed as an important aspect ofsuccessful aging[17J.
In summary, although extremely wealthy in terms of tourismpotentials, the city remains largely undeveloped. Illiteracy iscommon in the elderly population, and quality of life in menwas higher than women in all aspects.
AcknowledgementThis research project has been supported by Kashan Univer-sity of Medical Sciences and Health Services. We are indebtedto Farzan Institute for Research, Science and Technology fortechnical assistance and statistical analysis. The authors wouldlike to thank the interviewers who collected the information,the general practitioners who volunteered their practices forthe study, and the participants who gave up their time for thestudy.
References
1. Emery MP, Perrier LL, Acquadro C. Patient-Reported Outcomeand Quality of Life Instruments Database (PROQOLID):frequently aske4 questions. Health Qual Life Outcomes 2005;3:12.
2. Nilsson J, Masudrana AM. Naharkabir Z. Social Capital andQuality of Life in Old Age Results From a Cross-Sectional Studyin Rural Bangladesh. J Age Health 2006; 18 (3): 419-34.
3. Lawton M. A multidimensional view of quality of life in frailelders. In: The Concept and Measurement of Quality of Life inthe Frail Elderly. Birren J, Lubben J, Rowe J, Detchman D, eds).San Diego: Academic Press, 1991:3-27.
4. Ware IE Sherbourne CD. The MOS 36-Item short form health
survey (SF-36). Med Care 1992; 30 (6): 473-83.
5. Alonso J, Prieto L, Ant6 JM. The Spanish version of the SF-36
Health Survey (the SF-36 health questionnaire): an instrument formeasuring clinical results. Med Clin (Barc) 1995; 104 (20): 771-6.
6. Borglin G, Jakobsson U, Edberg AK, Hallberg IR. Older peoplein Sweden with various degrees of present quality of life: their
health, social support, everyday activities and sense of coherence.Health Soc Care Community 2006; 14 (2): 136-46.
7. Teymoori F et al. Social Welfare and Health (Mental, Social,Physical) Status of Aged People in Iran. Middle East J Age Aging2006; 3(1): 1-8
8. Vahdaninia MS, Gashtasbi A, Motazeri A, Maftoun F. Quality oflife related to health in elderly. Payesh 2005; 4: 113-20.
9. Ahmadi F, Salar A, Faghihzadeh S. The study of quality of care
in Zahedan elderly population. Hayat 2003; 10: 61-7.
10. Hopman WM Towheed T, Anastassiades T, Tenenhouse A,Poliquin S, Berger C, Joseph L, Brown JP, Murray TM, Adachi
JD, Hanley DA. Canadian normative data for the SF-36 healthsurvey. Canadian Multicentre Osteoporosis Study Research
Group. CMAJ 2000;163 (3): 265-71.
II. Sabbah I, Drouby N, Sabbah S, Retel-Rude N, Mercier M.
Quality oflife in rural populations in Lebanon using SF-36Health survey. Health Qual Life Outcomes 2003; 1(1): 30
12. Canbaz S, Sunter AT, Dabak S, Peksen Y. The prevalence of
chronic diseases and quality of life in elderly people in Samsun.Turk J Med Sci 2003; 33 (5): 335-40.
13. Karjalainen P. Vanhusten tyyty vaEisyydestaE ja senmittaamisesta. Sosiaalisia Erikoistutkimuksia XXXII: 99.
Sosiaali- ja terveysministerioE, Helsinki 1984
14. Ojala T. Livskvalitet i aE Iderdomen Folkpensionsanstaltens
Publikationer, ML: 92. Folkpensionsanstalten, A E bo; 1989.
15. Beijar C, Christiansson T. KaEllor tilllivskvalitet i hoEgfaElder.
Gerontologia 1995; 9: 273-82.
16. -Nilsson M, Ekman SL, SarvimaEki 1. Ageing with joy or
resigning to old age. Health Care Later Life 1998; 3 (2): 94 -110.
17. Cannuscio C, Block J, Kawachi I. Social capital and successful
aging: The role of senior housing. Ann Int Med 2003;139 (5 pt 2):395-9.