Calcium Deposits in the Crayfish, Cheraxquadricarinatus: Microstructure Versus ElementalDistributionGilles Luquet,1,* Yannicke Dauphin,2 Aline Percot,3 Murielle Salomé,4 Andreas Ziegler,5
Maria S. Fernández,6 and José L. Arias6
1Sorbonne Universités, Biologie des Organismes et des Ecosystèmes Aquatiques (BOREA), UMR MNHN/CNRS-7208/UPMC/UCN/UA/IRD-207, Muséum National d’Histoire Naturelle, 75005 Paris, France2Sorbonne Universités, Département Systèmatique et Evolution, Mammifères et Oiseaux, Muséum National d’HistoireNaturelle, 75005 Paris, France3Sorbonne Universités, MONARIS, UMR 8233 CNRS/UPMC, Université Paris 06, 75005 Paris, France4ID21, European Synchrotron Radiation Facility, 38000 Grenoble, France5Central Facility for Electron Microscopy, University of Ulm, 89069 Ulm, Germany6Faculty of Veterinary and Animal Sciences, University of Chile, Santiago de Chile, Chile
Abstract: The crayfish Cherax quadricarinatus stores calcium ions, easily mobilizable after molting, forcalcifying parts of the new exoskeleton. They are chiefly stored as amorphous calcium carbonate (ACC) duringeach premolt in a pair of gastroliths synthesized in the stomach wall. How calcium carbonate is stabilized in theamorphous state in such a biocomposite remains speculative. The knowledge of the microstructure at thenanometer level obtained by field emission scanning electron microscopy and atomic force microscopycombined with scanning electron microscopy energy-dispersive X-ray spectroscopy, micro-Raman and X-rayabsorption near edge structure spectroscopy gave relevant information on the elaboration of such anACC-stabilized biomineral. We observed nanogranules distributed along chitin-protein fibers and theaggregation of granules in thin layers. AFM confirmed the nanolevel structure, showing granules probablysurrounded by an organic layer and also revealing a second level of aggregation as described for other crystallinebiominerals. Raman analyses showed the presence of ACC, amorphous calcium phosphate, and calcite. Elementalanalyses confirmed the presence of elements like Fe, Na, Mg, P, and S. P and S are heterogeneously distributed.P is present in both the mineral and organic phases of gastroliths. S seems present as sulfate (probably as sulfatedsugars), sulfonate, sulfite, and sulfoxide groups and, in a lesser extent, as sulfur-containing amino acids.
Crustaceans are able to synthesize and resorb calcifiedbiominerals during molting cycles (Greenaway, 1985;Lowenstam & Weiner, 1989; Luquet & Marin, 2004; Luquet,2012). Due to the presence of a hard and inelastic exoskele-ton, they have to molt in order to grow. Among thearthropods, most crustaceans have the ability to harden theirexoskeleton by sclerotization and calcification. This lastprocess occurs by precipitation of calcium carbonate and,to a lesser extent, calcium phosphate as amorphouscalcium phosphate (ACP) or carbonate apatite in a three-dimensional network of organic matter synthesized byhypodermal cells. This has been mainly studied in decapods(Soejoko & Tjia, 2003; Dillaman et al., 2005; Romano et al.,2007; Kunkel & Jercinovic, 2013; Grunenfelder et al., 2014)and isopods (Becker et al., 2005; Neues et al., 2007).
Calcium ions are more or less available in the aquaticbiotopes and branchial calcium uptake constitutes the majorcuticular contribution of calcium ions for aquatic species inpostmolt. Nevertheless, for terrestrial and semiterrestrial spe-cies, premolt periods are devoted, among other processes, tothe storage of calcium ions. Such a storage process wasdescribed in isopods, amphipods, and decapods (Graf, 1978;Greenaway, 1985; Luquet, 2012). In this last group, land crabs(Numanoi, 1939; Bliss, 1953) and aquatic decapods such aslobsters (Herrick, 1911), Norway lobsters (Farmer, 1973;Sarda, 1991), and crayfish (Kugler & Birkner, 1948; Travis,1960, 1963; Chantran, 1874; Huxley, 1879) develop gastrolithsin their cardiac stomach wall as reservoirs of mineral ions.
Gastroliths are structurally “rounded, disc-shaped”(Travis, 1960, 1963) and often semispherical (Fig. 1). Theyare synthesized in two specialized discoidal areas by epithe-lial cells between the stomach epithelium and a noncalcifiedcuticle underlying this epithelium (Travis, 1963; Shechteret al., 2008a; Glazer & Sagi, 2012). The mineral phase,which originates from decalcification of the old carapace, is*Corresponding author. [email protected]
Received July 23, 2015; accepted December 11, 2015
precipitated within an organic template of chitin-proteinfibers tightly linked by protein bridges (Thormann et al.,2012; Luquet et al., 2013; see also Fig. 1). Different categoriesof molecules have been identified as organic components:proteins with putative posttranslational modifications (Ishiiet al., 1996; Tsutsui et al., 1999; Shechter et al., 2008a, 2008b;Luquet et al., 2009; Bentov et al., 2010; Glazer et al., 2010,2013; Glazer & Sagi, 2012), proteoglycans and carbohydrates(Fernandez et al., 2012; Luquet et al., 2013), and phos-phorylated low-molecular weight metabolites (Bentov et al.,2010; Akiva-Tal et al., 2011; Sato et al., 2011).
These deposits are mainly composed of amorphouscalcium carbonate, or ACC, the most metastable of the cal-cium carbonate polymorphs (Hikida et al., 2003; Shechteret al., 2008a; Luquet, 2012; Luquet et al., 2013). The presenceof stable ACC in biocomposites has already been described,especially in crustaceans (Addadi et al., 2003; Luquet, 2012).Recently, another amorphous mineral, ACP, was suggestedto also be present in gastroliths (Luquet et al., 2013; Reederet al., 2013; Habraken et al., 2015).
Numerous hypotheses have been forwarded to explainbiogenic ACC stabilization over time (Aizenberg et al.,2001). Mineral ions such as Mg2+ are suspected of playingsuch a role (Loste et al., 2003; Raz et al., 2003; Han &Aizenberg, 2008; Politi et al., 2008). Anion groups (carboxyl,sulfate, phosphate) from components of organic matrices(proteins without or with posttranslational modifications,carbohydrates, proteoglycans putatively sulfated) are knownto chelate calcium ions and are considered to play a role inACC formation/stabilization.
In gastroliths, compounds suspected of playing such arole are proteins with putative posttranslational modifica-tions such as phosphorylations (Shechter et al., 2008b;Bentov et al., 2010; Glazer et al., 2010). On the other hand,small phosphorylated metabolites have also been detected bynuclear magnetic resonance (NMR) and are thought to playan interacting role between chitin-binding proteins orprotein-binding proteins and calcium ions preventing acrystallization process (Akiva-Tal et al., 2011; Sato et al.,2011).
One strategy to find an answer is to explore therelationship occurring between the morphology/structureof the gastrolith, the mineral, the elemental and molecularcomposition, and the spatial distribution of all thesecomponents. Analyses previously undertaken were rarelyperformed in situ and most of the results were obtainedfrom bulk extracts. Here we analyzed the structure ofCherax quadricarinatus gastroliths from the microscale tothe nanometer level by using high-performance microscopytechniques such as field emission scanning electron micro-scopy (FESEM) and atomic force microscopy (AFM).In parallel, we investigated the presence and distribution ofelements (P, S, Mg, Sr, Fe,…) on gastrolith cross-sections byscanning electron microscopy energy-dispersive X-rayspectroscopy (SEM-EDS) and Raman spectroscopy. Thisanalysis reveals a particular spatial-temporal distribution ofsome elements (S and P more particularly). Finally, weinvestigated in more depth the presence and distribution of Sby X-ray absorption near edge structure spectroscopy(XANES).
Figure 1. a: Pair of hemispherical gastroliths from the freshwater crayfish, Cherax quadricarinatus. At left: roundedside in contact with the stomach epithelium. At right: flat face on the cuticle side. The dashed line indicates wherecross-sections were performed perpendicular to the surface. b: Natural fracture of a gastrolith showing the densemineralized inner structure. c: Cross-section of a gastrolith showing the layered structure (a–c: light microscopy).d: Gastrolith disc section (modified from Travis, 1963). e: Gastrolith organic matrix composed of parallel and trans-verse chitin-protein fibers (after slight decalcification by acetic acid; SEM picture). SL = stomach lumen; C = cuticlecomprised of epicuticle, exocuticule, and endocuticle, from top to bottom; G = gastrolith; E = stomach epithelium;Ct = connective tissue; SEM = scanning electron microscopy.
Calcium Storage in Crayfish 23
MATERIALS AND METHODS
Gastrolith Sample PreparationAustralian red claw crayfish, C. quadricarinatus, were bredin a farm located on the campus of the University of Chile,Santiago de Chile. Gastroliths were extracted from animals atecdysis, the period of the molting cycle where gastroliths areat their maximum size. They were immersed in 10% (v/v)NaOCl for a few hours to remove superficial organic con-taminants and then rinsed with distilled water and kept atroom temperature and dry air until used.
Sections were obtained by cutting gastroliths with anelectric microsaw. Sections were cut perpendicular to thesurface (dashed line, Fig. 1a) symmetrically through the centerof the flat circular basis of the semispherical gastrolith. Twotypes of sectioning were performed: cross-sections afterembedding the gastroliths in araldite for obtaining slicesof 50-μm thickness and sections of whole gastroliths in twohalves without any previous treatment. In the latter case, somesections were polished as described for the differenttechniques.
For observing in situ the organic matrix network, freshlybroken gastroliths were incubated in acetic acid 5% (30 s) toslightly decalcify the surface. Then, they were carefully rinsedwith methanol and air-dried before observation.
The soluble organic matrix (SOM) was obtained aftergrinding gastroliths to a powder. This powder was decalcifiedfor 24 h in cold acetic acid (10% v/v) at 4°C. The solution wasthen centrifuged 30min at 4,000 g at 4°C. The supernatantcontaining the acetic acid-SOM was filtered and concentratedwith an Amicon ultrafiltration system (Millipore SAS,Molsheim, France) on an Ultracel-PL membrane (5-kDa cut-off; Millipore SAS, Molsheim, France). The SOM solution,devoid of acetic acid, was lyophilized and kept at 4°C until used.
Light and FESEM ObservationsFor light microscopy observations, gastroliths were usedafter extraction and washing. The two types of transversesections obtained as described above were observed using aNikon Eclipse E200 microscope or a Nikon SMZ800 bino-cular stereomicroscope (Nikon France SAS, Champigny surMarne, France).
For FESEM observations, gastroliths were cleaved in twohalves and mounted on aluminum holders using self-adhesivecarbon pads and conductive glue without any polishing.Samples were then rotary shadowed with 3.5–4nm platinumat an angle of 45° using a BAF 300 (BAL-TEC, Balzers,Liechtenstein). FESEM (Hitachi S-5,200; Hitachi High-TechScience Corporation, Tokyo, Japan) was performed at anacceleration voltage of 4 kV and an emission current of 10μA.
AFMSamples were also studied using a Nanoscope IIIa Dimen-sion 3100 scanning probe microscope (Digital Instruments-Veeco, Santa Barbara, CA, USA) operated in tapping modein air. The AFM tapping mode uses an oscillating tip at an
amplitude of approximately several tens of nanometers whenthe tip is not in contact with the surface. Since the tip is nolonger in permanent contact with the sample surface duringthe scanning motion, unwanted alterations can be avoided toa large extent. The resolution of tapping mode AFM is on theorder of a few nanometers. Measurements with an AFM aremade in three dimensions, the horizontal X-Y plane and thevertical Z dimension. Tip-sample force interactions causechanges in amplitude, phase, and the resonance frequency ofthe oscillating cantilever. The spatial variation of the changecan be presented in height (topography) or interaction(amplitude or phase) images that can be collected simulta-neously. Phase imaging is a powerful extension that providesnanometer-scale information about surface structure: itmonitors the phase lag between the signal that drives thecantilever to oscillate and the cantilever oscillation outputsignal. Thus, contrast in phase images is due to differences inmaterial properties. The phase lag is monitored while thetopographic image is being taken so that images oftopography and material properties are collected simulta-neously. The amplitude AFM signal is related to the gradientof the topography as the tip scans over the sample surface.Fine morphological features are easily observed in amplitudeand phase images.
Compared with SEM, AFM provides topographic directheight measurements and views of surface features since nocoating is necessary. Compared with TEM, three-dimensionalAFM images are obtained without difficult sample preparationand with a similar resolution.
Sample sections were polished using P1,200, P2,500, andP4,000 HERMES water grinding papers (Buehler, Dardilly,France), 3 and 1 μm diamond polycrystalline suspensions(Buehler, Dardilly, France). To avoid analytical artifacts, noaluminum oxide suspension was used because previousanalyses on mollusk shells and coral skeletons have shownthat, despite repeated ultrasonic cleanings, alumina is notremoved from the surface. To remove contamination due tothe polishing step, sections were then etched with 10%formic acid for 5 s, or with 2% acetic acid for 5 s. Previousexperiments have shown that etching does not createartifacts (Dauphin & Dufour, 2008).
Micro-Raman Spectroscopy AnalysesRaman spectra were recorded using a Horiba Jobin YvonLabRam HR 800 spectrometer (Horiba Jobin Yvon SAS,Villeneuve d’Ascq, France) equipped with edge filters, 600lines/mm grating, an Olympus microscope (OlympusFrance, Montlhéry, France) equipped with an objective witha magnification factor of 50× , and a Peltier cooled CCDdetector. The excitation wavelength was the 458 nm line ofan Ar+ laser (Innova 90C, Coherent Inc., Santa Clara, CA,USA). The laser power at the sample was between 2 and3mW. The analyzed diameter with the optical set-up usedfor data collection was about 3 μm.
This configuration led to a spectral resolution of about2 cm−1, and calibration was checked with respect to the
24 Gilles Luquet et al.
520.7 cm−1 band of silicon. Typical recording times consistedof five accumulations of 3 s.
For mapping, spectra were recorded between 60 and1,750 cm−1. The acquisition of each spectrum requiredaround 15 s. To investigate spatial distribution of theminerals, the sample was moved by a computer-controlledstage. Each surface was scanned by moving the sample by5 μm steps. Maps were performed on a 90 × 500 μm surfacefor map area 1 (10 × 5 μm resolution), and 60 × 500 μm sur-face for map areas 2 and 3 (5 × 5 μm resolution). Maps weregenerated by integrating the area of the band at 277 cm−1
(between 236 and 310 cm−1). Spectral acquisitions, baselinesubtractions, and map generation were managed by theLabSpec software (Horiba Jobin Yvon SAS, Longjumeau,France) (Horiba Jobin Yvon).
Electron Microprobe Analyses (EDS)A Zeiss DSM 962 SEM (Carl Zeiss Microscopy Gmbh,Oberkochen, Germany) equipped with an EDAX FalconX-ray detector system (EDAX Business Unit, AMETEKGmbH, Wiesbaden, Germany) with a 10mm2 SUTWwindow was used for EDS.
The samples (half gastroliths) were mounted on a45mm-diameter custom made device and polished to amirror finish using a series of silicon carbide papers (StruersGmbh, Willich, Germany) and 100% methanol instead ofwater to prevent dissolution of amorphous mineral phases.
Spectral maps were recorded from polished air-driedsamples coated with a 10 nm-thick layer of carbon at anacceleration voltage of 20 kV and count rates between 1,000and 2,000 s−1. They were built from these maps employingGenesis software (EDAX).
Because of the water content of the gastroliths, dryinginevitably leads to formation of cracks within the polishedsurface. In principle, these may affect the molar ratioscalculated from the spectra. However, since no large signaloriginates from these cracks in both high and low energy EDXmaps, the effect is limited to the edges of the cracks only. Givena number of about ten cracks per millimeter and an excitationdepth of only a few micrometer, the effect of the cracks on thecalculation of molar ratios is of minor significance.
Micro-XANES Spectroscopy AnalysesThis work was carried out at the ID21 beamline of the Eur-opean Synchrotron Radiation Facility (Grenoble, France). Inthe ID21 scanning X-ray microscope, a Fresnel zone plate wasused as focusing optics to generate a submicron X-ray probe.An energy-dispersive high-purity Ge detector (PrincetonGamma-Tech Instruments, Princeton, NJ, USA) mounted inthe horizontal plane perpendicular to the beam collected thefluorescence emission photons. This geometry minimizes thecontribution of elastic scattering. An energy range between 2and 7keV is available, which gives access to the K-edge of sulfurat 2,472 eV. The XANES energy scan around the sulfur K-edgewas achieved using a fixed-exit double-crystal Si(111) mono-chromator located upstream from the microscope, which offers
the necessary energy resolution. This experiment required theX-raymicroscope to be operated under vacuum to avoid strongabsorption of the sulfur emission lines by air.
Although the primary beam energy was set around thatof the S K-edge energy region, elements with absorptionedges at lower energies were also subject to excitation andemission of fluorescence photons, and could therefore bedetermined. Thus, micro-fluorescence element maps of Mgand P were obtained simultaneously with the S maps.
Samples were embedded in resin, and polished usingvarious grades of diamond paste. The oil residue from thediamond paste was removed with a detergent diluted in hotwater for 1min, then rinsed with tap water. Then sampleswere etched with 1% v/v acetic acid for 5 s, then rinsed withwith ultra-pure Milli-Q water (Merck Millipore, MerckKGaA, Darmstadt, Germany) to remove the remainingcontaminants. The light etching creates a slightly roughsurface, but the height range between hollows and peaks islower than 5 µm so that the surface is “flat” for non-quantitative analyses. Because fluorescence emission wasused as a contrast mechanism, a flat surface of the sample isnecessary to avoid signal fluctuations that could have beenproduced by sample topography. In addition, etching of thesample after polishing helped to eliminate potential surfacecontamination and remains of the diamond pastes and oil.
Data were normalized and analyzed with the ATHENAprogram of the IFFEFIT package (Ravel & Newville, 2005).
RESULTSLight Microscopy and FESEM ObservationsThe paired gastroliths extracted from a specimen (Fig. 1a)show a hemispherical structure: the flat side corresponds to thebeginning of the storage process occurring in between thestomach epithelium and a nonmineralized cuticle underlyingthis epithelium (Fig. 1d; modified from Travis, 1963). Theconvex side is the growing side in close contact with epithelialcells. The inner view of a gastrolith, on a fracture as well as on across-section, shows a layering structure at different scales(Figs. 1b, 1c). After a slight decalcification treatment on thesurface of a gastrolith, the three-dimensional network ofchitin-protein fibers is visible (Fig. 1e; Luquet et al., 2013).
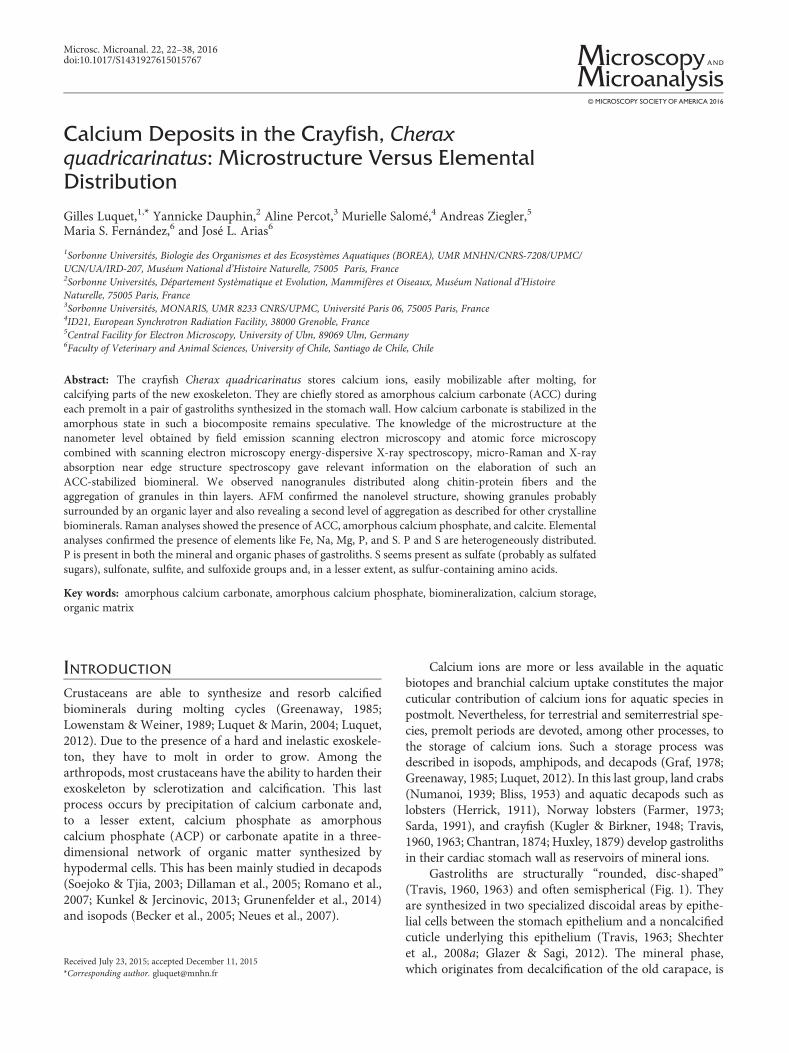
FESEM observations confirm the concentric layeredpattern, as previously described for different species (Travis,1960, 1963; Luquet et al., 2013; Habraken et al., 2015). Theyclearly show rounded structures of around 100-nm diameter,aligned along fibers (Figs. 2a.1, 2a.2). The morphology andsize of these spherules (Figs. 2b, 2c) are in accordancewith mineralized structures typical of the ACC polymorph(Bentov et al., 2010; Luquet et al., 2013).
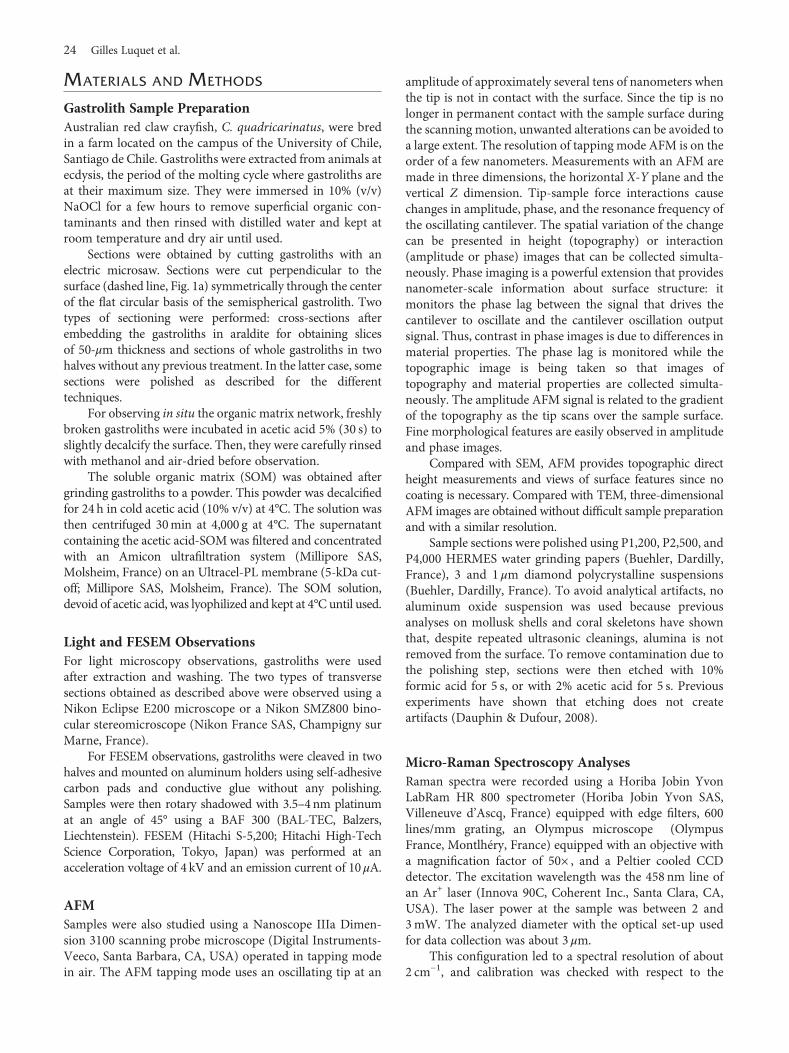
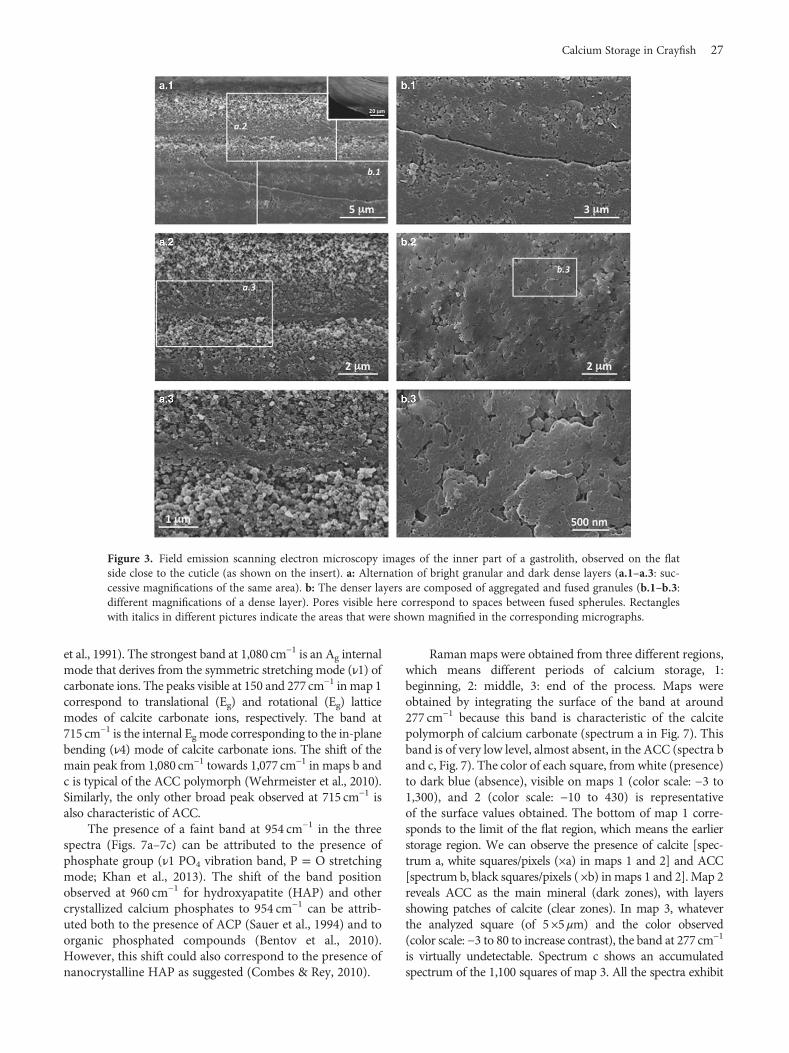
Light and SEM microscopy images had previouslyshown an alternation of layers of different thickness anddifferent levels of brightness (Luquet et al., 2013; see alsoFig. 4b). These differences are explained by observations atdifferent magnifications of granular and dense layers(Figs. 3a.1–3a.3). These dense layers, more abundant on the
Calcium Storage in Crayfish 25
flat side, seem to correspond to a more or less degree ofaggregation of the spherulitic structures (which appearflattened after polishing; Figs. 3b.1–3b.3) observed in theso-called granular layers. Pores are visible in Figure 3b.3probably corresponding to spaces between fused spherules.
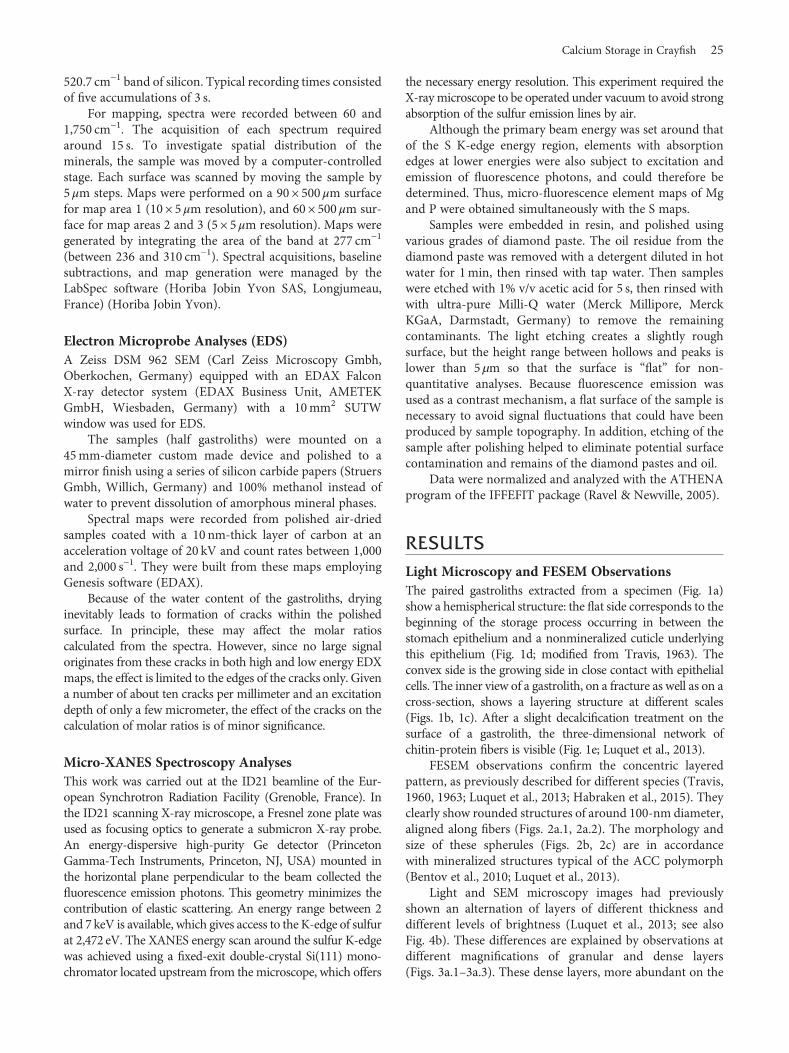
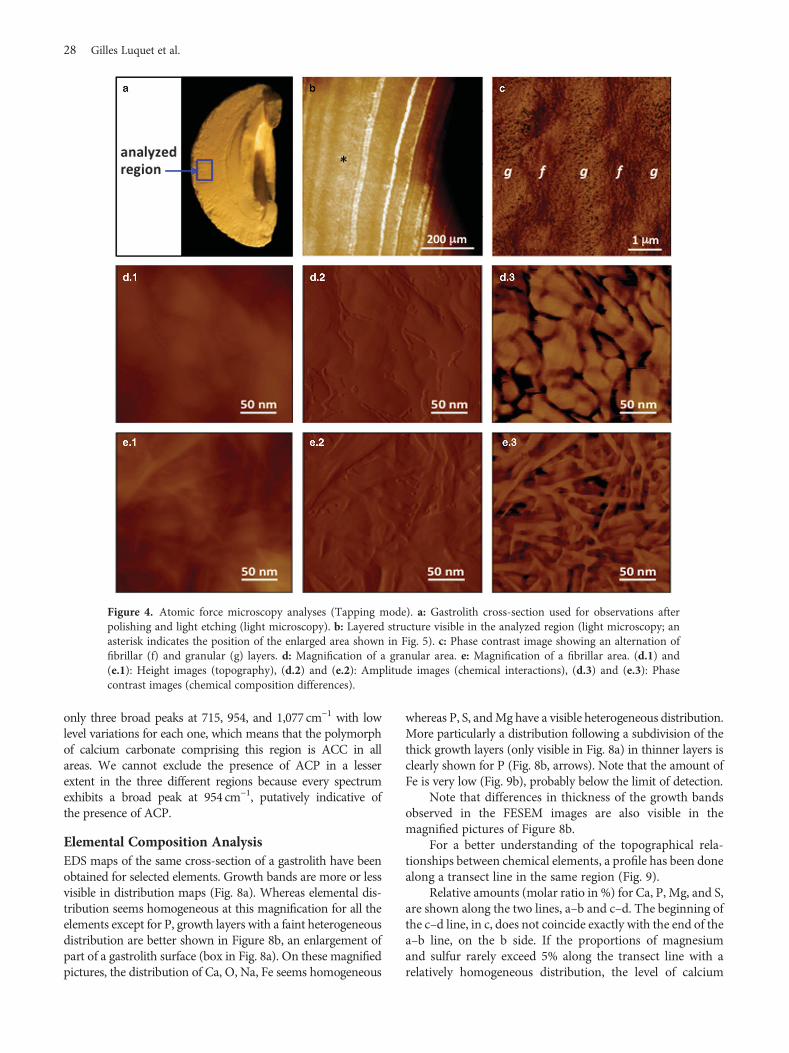
AFM ObservationsFigure 4 clearly shows that the layered structure visible at amacroscopic level is also present at a microscopic level(Fig. 4b). The phase contrast image Figure 4c exhibits analternation of granular (g) and fibrillar (f) layers of around1 μm thickness. These differences observed after etching maybe the result of a difference of richness in organic versusmineral matter of each layer as previously observed aftercomplete decalcification and described in Luquet et al.(2013). Figure 4d is a magnification of a granular areashowing irregular aggregated more or less spherical struc-tures (Figs. 4d.1, 4d.2: topographic view, Fig. 4d.3: phasecontrast). Figure 4e is a magnification of a zone inside afibrillar layer. All the phase contrast pictures exhibit clearmaterial, which corresponds to mineralized structureswhereas dark regions can be interpreted as organic material.
Fibers of around 5-nm diameter are visible. The originalspatial arrangement (alignment of spherules along parallelfibers) seems disrupted following the etching treatmentperformed before observation.
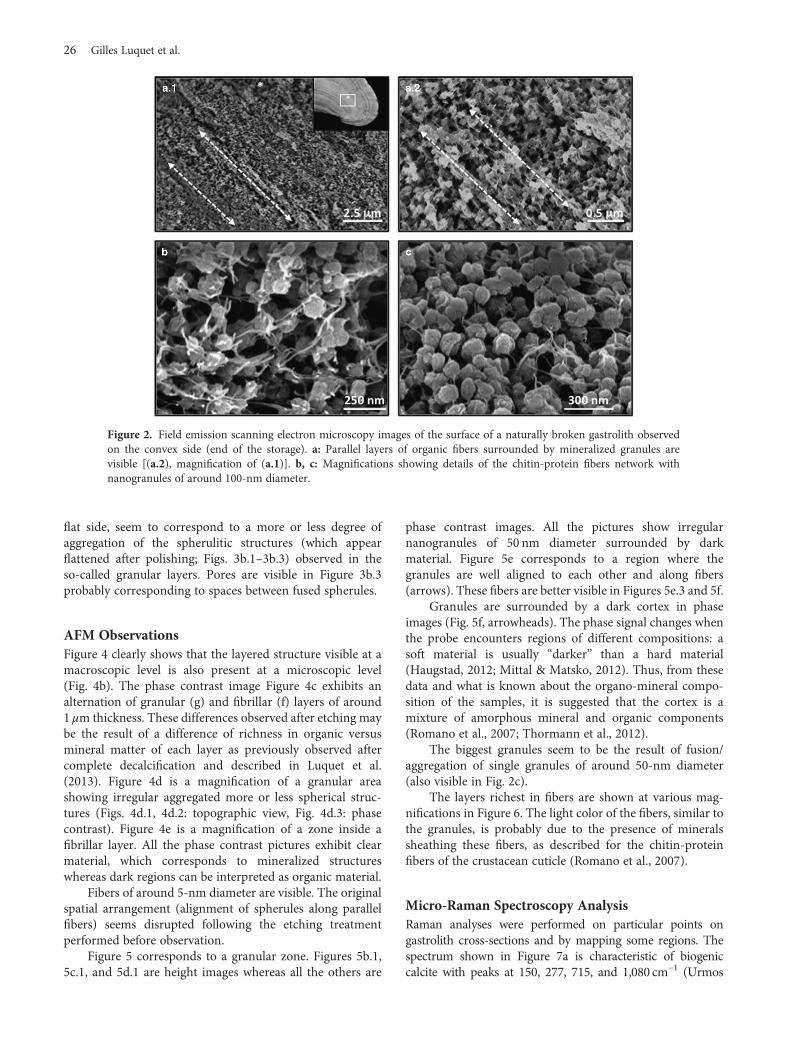
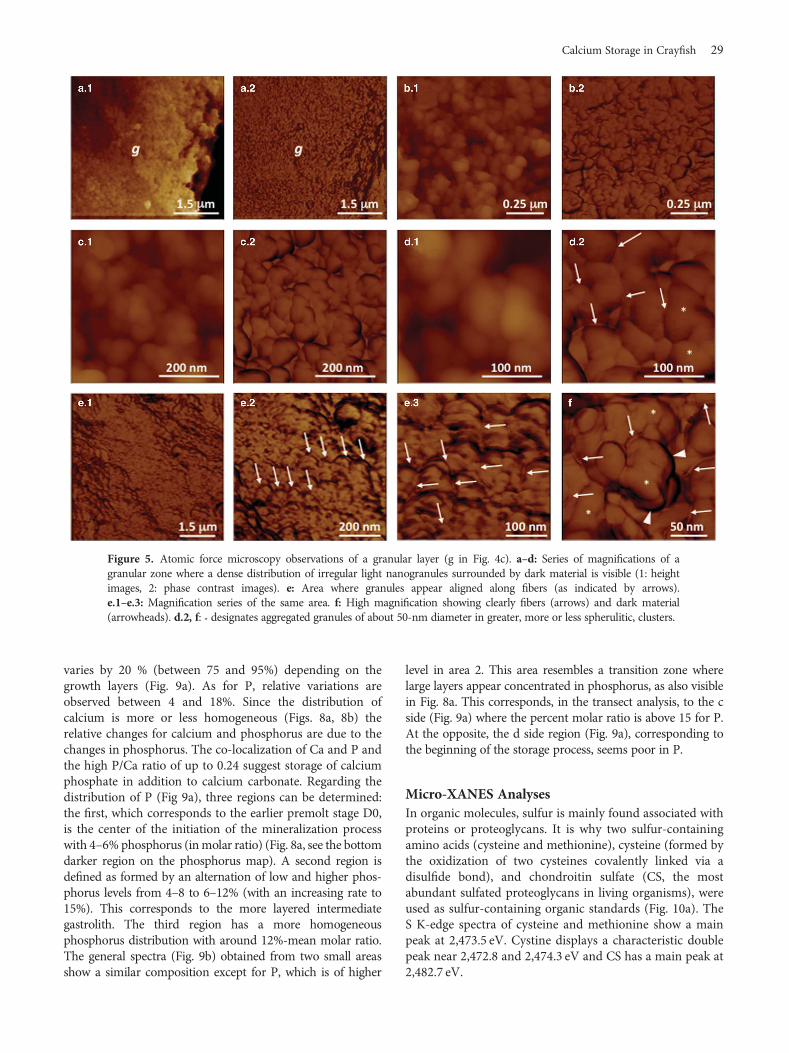
Figure 5 corresponds to a granular zone. Figures 5b.1,5c.1, and 5d.1 are height images whereas all the others are
phase contrast images. All the pictures show irregularnanogranules of 50 nm diameter surrounded by darkmaterial. Figure 5e corresponds to a region where thegranules are well aligned to each other and along fibers(arrows). These fibers are better visible in Figures 5e.3 and 5f.
Granules are surrounded by a dark cortex in phaseimages (Fig. 5f, arrowheads). The phase signal changes whenthe probe encounters regions of different compositions: asoft material is usually “darker” than a hard material(Haugstad, 2012; Mittal & Matsko, 2012). Thus, from thesedata and what is known about the organo-mineral compo-sition of the samples, it is suggested that the cortex is amixture of amorphous mineral and organic components(Romano et al., 2007; Thormann et al., 2012).
The biggest granules seem to be the result of fusion/aggregation of single granules of around 50-nm diameter(also visible in Fig. 2c).
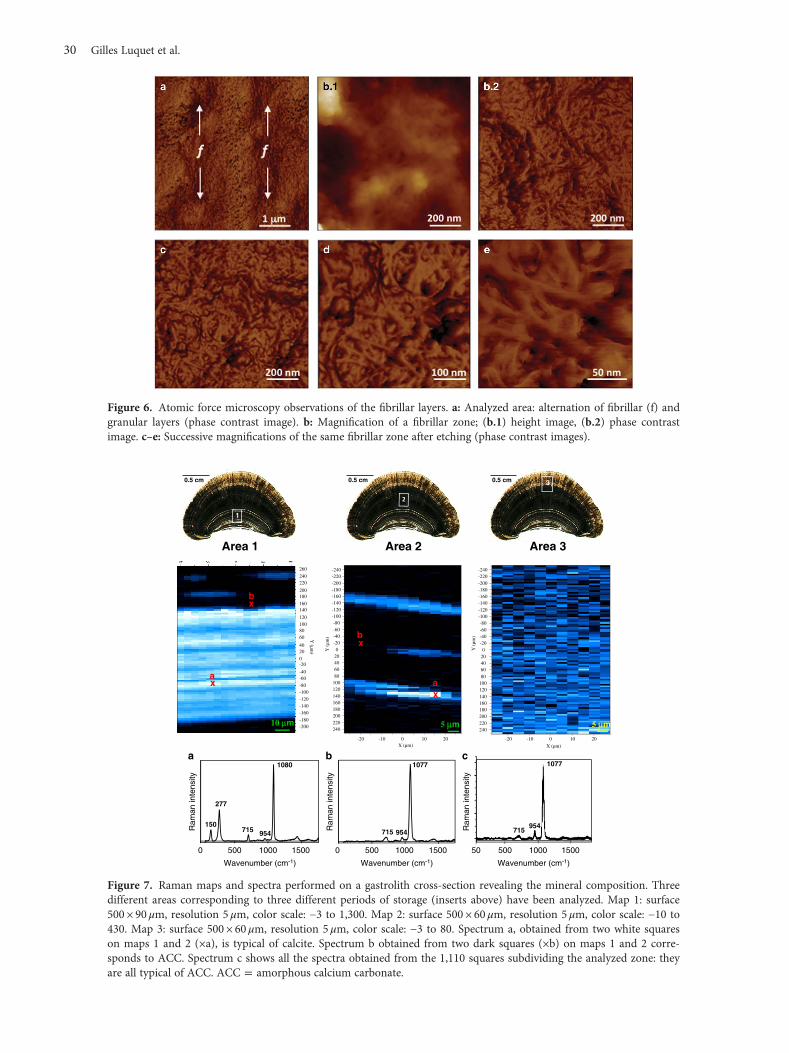
The layers richest in fibers are shown at various mag-nifications in Figure 6. The light color of the fibers, similar tothe granules, is probably due to the presence of mineralssheathing these fibers, as described for the chitin-proteinfibers of the crustacean cuticle (Romano et al., 2007).
Micro-Raman Spectroscopy AnalysisRaman analyses were performed on particular points ongastrolith cross-sections and by mapping some regions. Thespectrum shown in Figure 7a is characteristic of biogeniccalcite with peaks at 150, 277, 715, and 1,080 cm−1 (Urmos
Figure 2. Field emission scanning electron microscopy images of the surface of a naturally broken gastrolith observedon the convex side (end of the storage). a: Parallel layers of organic fibers surrounded by mineralized granules arevisible [(a.2), magnification of (a.1)]. b, c: Magnifications showing details of the chitin-protein fibers network withnanogranules of around 100-nm diameter.
26 Gilles Luquet et al.
et al., 1991). The strongest band at 1,080 cm−1 is an Ag internalmode that derives from the symmetric stretching mode (ν1) ofcarbonate ions. The peaks visible at 150 and 277 cm−1 in map 1correspond to translational (Eg) and rotational (Eg) latticemodes of calcite carbonate ions, respectively. The band at715 cm−1 is the internal Eg mode corresponding to the in-planebending (ν4) mode of calcite carbonate ions. The shift of themain peak from 1,080 cm−1 towards 1,077 cm−1 in maps b andc is typical of the ACC polymorph (Wehrmeister et al., 2010).Similarly, the only other broad peak observed at 715 cm−1 isalso characteristic of ACC.
The presence of a faint band at 954 cm−1 in the threespectra (Figs. 7a–7c) can be attributed to the presence ofphosphate group (ν1 PO4 vibration band, P = O stretchingmode; Khan et al., 2013). The shift of the band positionobserved at 960 cm−1 for hydroxyapatite (HAP) and othercrystallized calcium phosphates to 954 cm−1 can be attrib-uted both to the presence of ACP (Sauer et al., 1994) and toorganic phosphated compounds (Bentov et al., 2010).However, this shift could also correspond to the presence ofnanocrystalline HAP as suggested (Combes & Rey, 2010).
Raman maps were obtained from three different regions,which means different periods of calcium storage, 1:beginning, 2: middle, 3: end of the process. Maps wereobtained by integrating the surface of the band at around277 cm−1 because this band is characteristic of the calcitepolymorph of calcium carbonate (spectrum a in Fig. 7). Thisband is of very low level, almost absent, in the ACC (spectra band c, Fig. 7). The color of each square, from white (presence)to dark blue (absence), visible on maps 1 (color scale: −3 to1,300), and 2 (color scale: −10 to 430) is representativeof the surface values obtained. The bottom of map 1 corre-sponds to the limit of the flat region, which means the earlierstorage region. We can observe the presence of calcite [spec-trum a, white squares/pixels (×a) in maps 1 and 2] and ACC[spectrum b, black squares/pixels ( ×b) inmaps 1 and 2]. Map 2reveals ACC as the main mineral (dark zones), with layersshowing patches of calcite (clear zones). In map 3, whateverthe analyzed square (of 5×5μm) and the color observed(color scale: −3 to 80 to increase contrast), the band at 277 cm−1
is virtually undetectable. Spectrum c shows an accumulatedspectrum of the 1,100 squares of map 3. All the spectra exhibit
Figure 3. Field emission scanning electron microscopy images of the inner part of a gastrolith, observed on the flatside close to the cuticle (as shown on the insert). a: Alternation of bright granular and dark dense layers (a.1–a.3: suc-cessive magnifications of the same area). b: The denser layers are composed of aggregated and fused granules (b.1–b.3:different magnifications of a dense layer). Pores visible here correspond to spaces between fused spherules. Rectangleswith italics in different pictures indicate the areas that were shown magnified in the corresponding micrographs.
Calcium Storage in Crayfish 27
only three broad peaks at 715, 954, and 1,077 cm−1 with lowlevel variations for each one, which means that the polymorphof calcium carbonate comprising this region is ACC in allareas. We cannot exclude the presence of ACP in a lesserextent in the three different regions because every spectrumexhibits a broad peak at 954 cm−1, putatively indicative ofthe presence of ACP.
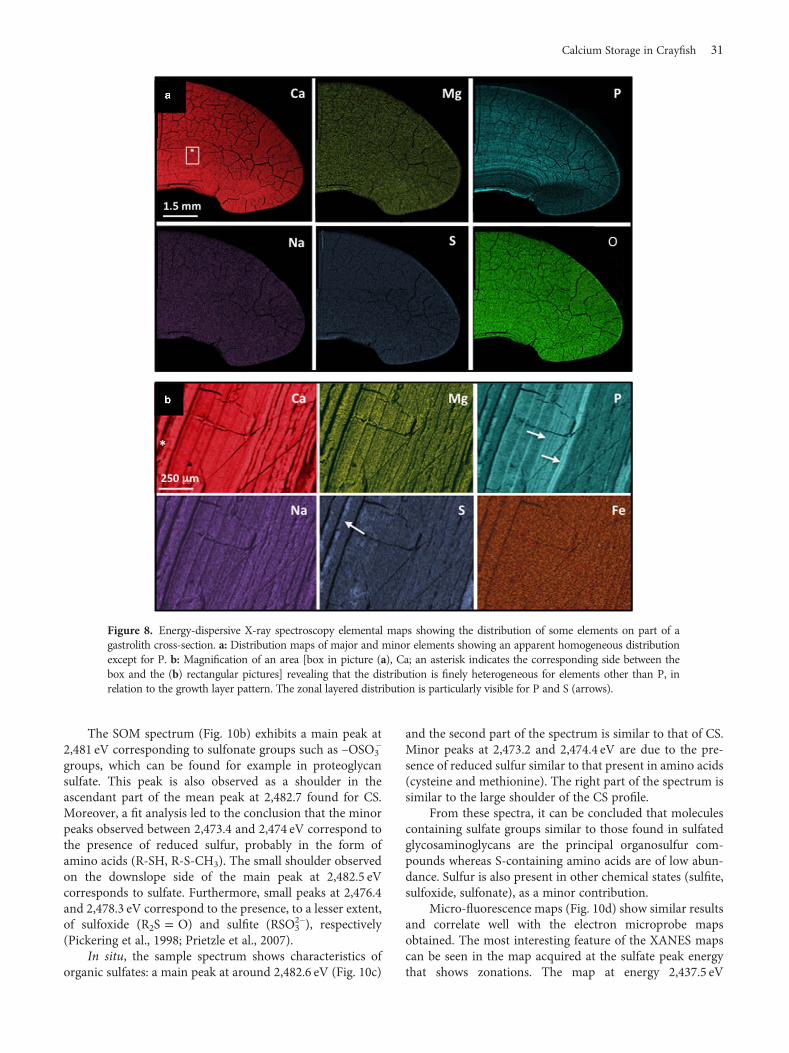
Elemental Composition AnalysisEDS maps of the same cross-section of a gastrolith have beenobtained for selected elements. Growth bands are more or lessvisible in distribution maps (Fig. 8a). Whereas elemental dis-tribution seems homogeneous at this magnification for all theelements except for P, growth layers with a faint heterogeneousdistribution are better shown in Figure 8b, an enlargement ofpart of a gastrolith surface (box in Fig. 8a). On these magnifiedpictures, the distribution of Ca, O, Na, Fe seems homogeneous
whereas P, S, andMg have a visible heterogeneous distribution.More particularly a distribution following a subdivision of thethick growth layers (only visible in Fig. 8a) in thinner layers isclearly shown for P (Fig. 8b, arrows). Note that the amount ofFe is very low (Fig. 9b), probably below the limit of detection.
Note that differences in thickness of the growth bandsobserved in the FESEM images are also visible in themagnified pictures of Figure 8b.
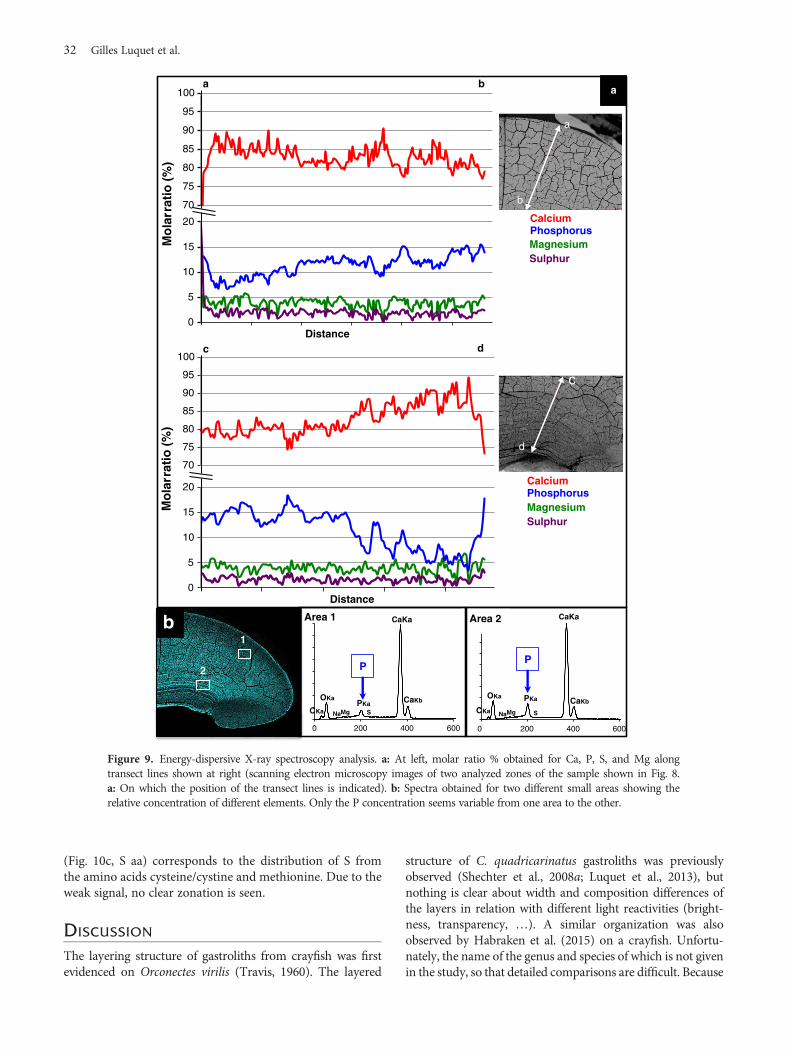
For a better understanding of the topographical rela-tionships between chemical elements, a profile has been donealong a transect line in the same region (Fig. 9).
Relative amounts (molar ratio in %) for Ca, P, Mg, and S,are shown along the two lines, a–b and c–d. The beginning ofthe c–d line, in c, does not coincide exactly with the end of thea–b line, on the b side. If the proportions of magnesiumand sulfur rarely exceed 5% along the transect line with arelatively homogeneous distribution, the level of calcium
Figure 4. Atomic force microscopy analyses (Tapping mode). a: Gastrolith cross-section used for observations afterpolishing and light etching (light microscopy). b: Layered structure visible in the analyzed region (light microscopy; anasterisk indicates the position of the enlarged area shown in Fig. 5). c: Phase contrast image showing an alternation offibrillar (f) and granular (g) layers. d: Magnification of a granular area. e: Magnification of a fibrillar area. (d.1) and(e.1): Height images (topography), (d.2) and (e.2): Amplitude images (chemical interactions), (d.3) and (e.3): Phasecontrast images (chemical composition differences).
28 Gilles Luquet et al.
varies by 20 % (between 75 and 95%) depending on thegrowth layers (Fig. 9a). As for P, relative variations areobserved between 4 and 18%. Since the distribution ofcalcium is more or less homogeneous (Figs. 8a, 8b) therelative changes for calcium and phosphorus are due to thechanges in phosphorus. The co-localization of Ca and P andthe high P/Ca ratio of up to 0.24 suggest storage of calciumphosphate in addition to calcium carbonate. Regarding thedistribution of P (Fig 9a), three regions can be determined:the first, which corresponds to the earlier premolt stage D0,is the center of the initiation of the mineralization processwith 4–6% phosphorus (inmolar ratio) (Fig. 8a, see the bottomdarker region on the phosphorus map). A second region isdefined as formed by an alternation of low and higher phos-phorus levels from 4–8 to 6–12% (with an increasing rate to15%). This corresponds to the more layered intermediategastrolith. The third region has a more homogeneousphosphorus distribution with around 12%-mean molar ratio.The general spectra (Fig. 9b) obtained from two small areasshow a similar composition except for P, which is of higher
level in area 2. This area resembles a transition zone wherelarge layers appear concentrated in phosphorus, as also visiblein Fig. 8a. This corresponds, in the transect analysis, to the cside (Fig. 9a) where the percent molar ratio is above 15 for P.At the opposite, the d side region (Fig. 9a), corresponding tothe beginning of the storage process, seems poor in P.
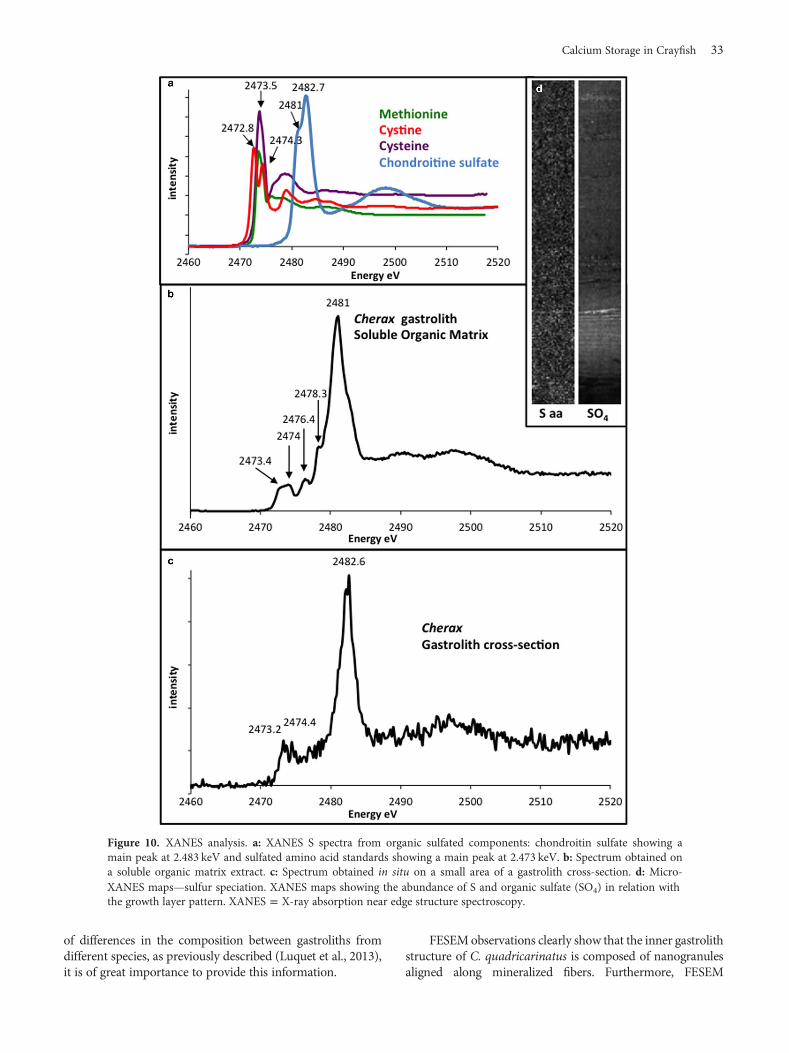
Micro-XANES AnalysesIn organic molecules, sulfur is mainly found associated withproteins or proteoglycans. It is why two sulfur-containingamino acids (cysteine and methionine), cysteine (formed bythe oxidization of two cysteines covalently linked via adisulfide bond), and chondroitin sulfate (CS, the mostabundant sulfated proteoglycans in living organisms), wereused as sulfur-containing organic standards (Fig. 10a). TheS K-edge spectra of cysteine and methionine show a mainpeak at 2,473.5 eV. Cystine displays a characteristic doublepeak near 2,472.8 and 2,474.3 eV and CS has a main peak at2,482.7 eV.
Figure 5. Atomic force microscopy observations of a granular layer (g in Fig. 4c). a–d: Series of magnifications of agranular zone where a dense distribution of irregular light nanogranules surrounded by dark material is visible (1: heightimages, 2: phase contrast images). e: Area where granules appear aligned along fibers (as indicated by arrows).e.1–e.3: Magnification series of the same area. f: High magnification showing clearly fibers (arrows) and dark material(arrowheads). d.2, f: * designates aggregated granules of about 50-nm diameter in greater, more or less spherulitic, clusters.
Calcium Storage in Crayfish 29
Figure 6. Atomic force microscopy observations of the fibrillar layers. a: Analyzed area: alternation of fibrillar (f) andgranular layers (phase contrast image). b: Magnification of a fibrillar zone; (b.1) height image, (b.2) phase contrastimage. c–e: Successive magnifications of the same fibrillar zone after etching (phase contrast images).
0.5 cm
1
Area 3 Area 1
0.5 cm 3
Area 2
0.5 cm
0 500 1000 1500
a
Wavenumber (cm-1)
715 954150
277
1080
Ram
an in
tens
ity
c
Ram
an in
tens
ity
1077
715954
Wavenumber (cm-1)
500 1000 150050
1077
715 954
b
Wavenumber (cm-1)
Ram
an in
tens
ity
0 500 1000 1500
Figure 7. Raman maps and spectra performed on a gastrolith cross-section revealing the mineral composition. Threedifferent areas corresponding to three different periods of storage (inserts above) have been analyzed. Map 1: surface500 × 90 μm, resolution 5 μm, color scale: −3 to 1,300. Map 2: surface 500 × 60 μm, resolution 5 μm, color scale: −10 to430. Map 3: surface 500 × 60 μm, resolution 5 μm, color scale: −3 to 80. Spectrum a, obtained from two white squareson maps 1 and 2 (×a), is typical of calcite. Spectrum b obtained from two dark squares (×b) on maps 1 and 2 corre-sponds to ACC. Spectrum c shows all the spectra obtained from the 1,110 squares subdividing the analyzed zone: theyare all typical of ACC. ACC = amorphous calcium carbonate.
30 Gilles Luquet et al.
The SOM spectrum (Fig. 10b) exhibits a main peak at2,481 eV corresponding to sulfonate groups such as –OSO3
−
groups, which can be found for example in proteoglycansulfate. This peak is also observed as a shoulder in theascendant part of the mean peak at 2,482.7 found for CS.Moreover, a fit analysis led to the conclusion that the minorpeaks observed between 2,473.4 and 2,474 eV correspond tothe presence of reduced sulfur, probably in the form ofamino acids (R-SH, R-S-CH3). The small shoulder observedon the downslope side of the main peak at 2,482.5 eVcorresponds to sulfate. Furthermore, small peaks at 2,476.4and 2,478.3 eV correspond to the presence, to a lesser extent,of sulfoxide (R2S = O) and sulfite (RSO3
2−), respectively(Pickering et al., 1998; Prietzle et al., 2007).
In situ, the sample spectrum shows characteristics oforganic sulfates: a main peak at around 2,482.6 eV (Fig. 10c)
and the second part of the spectrum is similar to that of CS.Minor peaks at 2,473.2 and 2,474.4 eV are due to the pre-sence of reduced sulfur similar to that present in amino acids(cysteine and methionine). The right part of the spectrum issimilar to the large shoulder of the CS profile.
From these spectra, it can be concluded that moleculescontaining sulfate groups similar to those found in sulfatedglycosaminoglycans are the principal organosulfur com-pounds whereas S-containing amino acids are of low abun-dance. Sulfur is also present in other chemical states (sulfite,sulfoxide, sulfonate), as a minor contribution.
Micro-fluorescence maps (Fig. 10d) show similar resultsand correlate well with the electron microprobe mapsobtained. The most interesting feature of the XANES mapscan be seen in the map acquired at the sulfate peak energythat shows zonations. The map at energy 2,437.5 eV
Figure 8. Energy-dispersive X-ray spectroscopy elemental maps showing the distribution of some elements on part of agastrolith cross-section. a: Distribution maps of major and minor elements showing an apparent homogeneous distributionexcept for P. b: Magnification of an area [box in picture (a), Ca; an asterisk indicates the corresponding side between thebox and the (b) rectangular pictures] revealing that the distribution is finely heterogeneous for elements other than P, inrelation to the growth layer pattern. The zonal layered distribution is particularly visible for P and S (arrows).
Calcium Storage in Crayfish 31
(Fig. 10c, S aa) corresponds to the distribution of S fromthe amino acids cysteine/cystine and methionine. Due to theweak signal, no clear zonation is seen.
DISCUSSION
The layering structure of gastroliths from crayfish was firstevidenced on Orconectes virilis (Travis, 1960). The layered
structure of C. quadricarinatus gastroliths was previouslyobserved (Shechter et al., 2008a; Luquet et al., 2013), butnothing is clear about width and composition differences ofthe layers in relation with different light reactivities (bright-ness, transparency, …). A similar organization was alsoobserved by Habraken et al. (2015) on a crayfish. Unfortu-nately, the name of the genus and species of which is not givenin the study, so that detailed comparisons are difficult. Because
0
5
10
15
20
70
75
80
85
90
95
100
70
75
80
85
90
95
100c d
c
d
a
b
b
Sulphur
Calcium
MagnesiumPhosphorus
a
Mo
larr
atio
(%
)
0
5
10
15
20
Sulphur
Calcium
MagnesiumPhosphorus
Mo
larr
atio
(%
)
Distance
Distance
a
0
1000
2000
3000
4000
5000
6000
7000
8000
9000
10000
0 200 400 600
CaKb
Area 2
KaC 0
0 200 400 600
Area 1
CaKbOKa
C KaPKa
CaKa
SMg
1
2
Na
CaKa
PKaOKa
SMgNa
b
PP
Figure 9. Energy-dispersive X-ray spectroscopy analysis. a: At left, molar ratio % obtained for Ca, P, S, and Mg alongtransect lines shown at right (scanning electron microscopy images of two analyzed zones of the sample shown in Fig. 8.a: On which the position of the transect lines is indicated). b: Spectra obtained for two different small areas showing therelative concentration of different elements. Only the P concentration seems variable from one area to the other.
32 Gilles Luquet et al.
of differences in the composition between gastroliths fromdifferent species, as previously described (Luquet et al., 2013),it is of great importance to provide this information.
FESEMobservations clearly show that the inner gastrolithstructure of C. quadricarinatus is composed of nanogranulesaligned along mineralized fibers. Furthermore, FESEM
Figure 10. XANES analysis. a: XANES S spectra from organic sulfated components: chondroitin sulfate showing a main peak at 2.483 keV and sulfated amino acid standards showing a main peak at 2.473 keV. b: Spectrum obtained on a soluble organic matrix extract. c: Spectrum obtained in situ on a small area of a gastrolith cross-section. d: Micro-XANES maps—sulfur speciation. XANES maps showing the abundance of S and organic sulfate (SO4) in relation with the growth layer pattern. XANES = X-ray absorption near edge structure spectroscopy.
Calcium Storage in Crayfish 33
pictures also reveal that some layers result in the aggregationof nanogranules in a denser and more homogenous structureas also shown by Habraken et al. (2015). This type of denserlayer appears more abundant on the flat side (earlier storageregion) of the gastrolith than in the latter convex storage zone.Analogous calcium deposits, the sternal plates, synthesized byterrestrial isopods such as the woodlice Porcellio scaber, Ligi-dium hypnorum, and Armadillidium vulgare, exhibit similaragglomerated zones depending on the species from an evolu-tionary viewpoint (Ziegler & Miller, 1997; Ziegler et al., 2005).It could be linked to the need to store more and more calciumduring the terrestrialization of isopods in relation to thethickening of the cuticle. This aspect has not been investigatedso far for gastrolith-forming decapods.
AFM analyses show the presence of alternatinggranular-rich and fibrillar-rich layers. This corresponds tothe previously observed richness differences in chitin-protein fibers forming meshes of different sizes filled withCaCO3 (see Figs. 3d, 3e in Luquet et al., 2013). The smallestgranules are of 50-nm mean diameter for the majority ofthem. Fibers are also visible, the light aspect of which sug-gests they are mineralized. Some granules seem furthermoresurrounded by material probably of organic origin. We alsoobserved aggregations of granules in largest structures moreor less spherulitic that vary in size from 100 to 200 nm. Thisis in accordance with the two-step mode of growth theorypreviously described for other calcareous crystallinebiominerals (Cuif & Dauphin, 2005; Cuif et al., 2008, 2012).This suggests that this mode of growth is probably universalwhatever the nature of the mineral, crystalline, or amor-phous, as is the layered mode of growth (Cuif et al., 2012).
Micro-Raman analyses reveal the presence of calciumcarbonate as ACC and calcite and probably also calciumphosphate as ACP. Calcite seems restricted to the first storageregion where dense layers are observed. Its presence in vivocannot be ascertained. It has been known for a long time thatthe local chemical environment, as well as availability ofspecific molecules and mineral ions, are fundamental in thedevelopment of a biomineral (Mann, 1983; Lowenstam &Weiner, 1989). This is the case for such ACC-stabilizedgastroliths. The presence of calcite could be here the effect of asecondary crystallization process resulting from the exposureof such an ACC-biomineral to air atmosphere duringdissection and sample preparation. It has been previouslydemonstrated that, during experimentation, exposure todifferent conditions (of humidity notably) than the environ-mental in vivo conditions could induce such a recrystalliza-tion process (Raz et al., 2002; Luquet et al., 2013; Reeder et al.,2013). It has been notably mentioned that, in aged gastroliths,calcite, vaterite, and trace amounts of monetite (CaHPO4) aredetected (Reeder et al., 2013). We must notice neverthelessthat only the earlier synthesized zone of a gastrolith is affectedby the presence of calcite, whereas ACC and ACP seempresent everywhere in the gastrolith.
The spatial distribution of some elements corroboratesthe layered pattern. P and S for example are clearly hetero-geneously distributed.
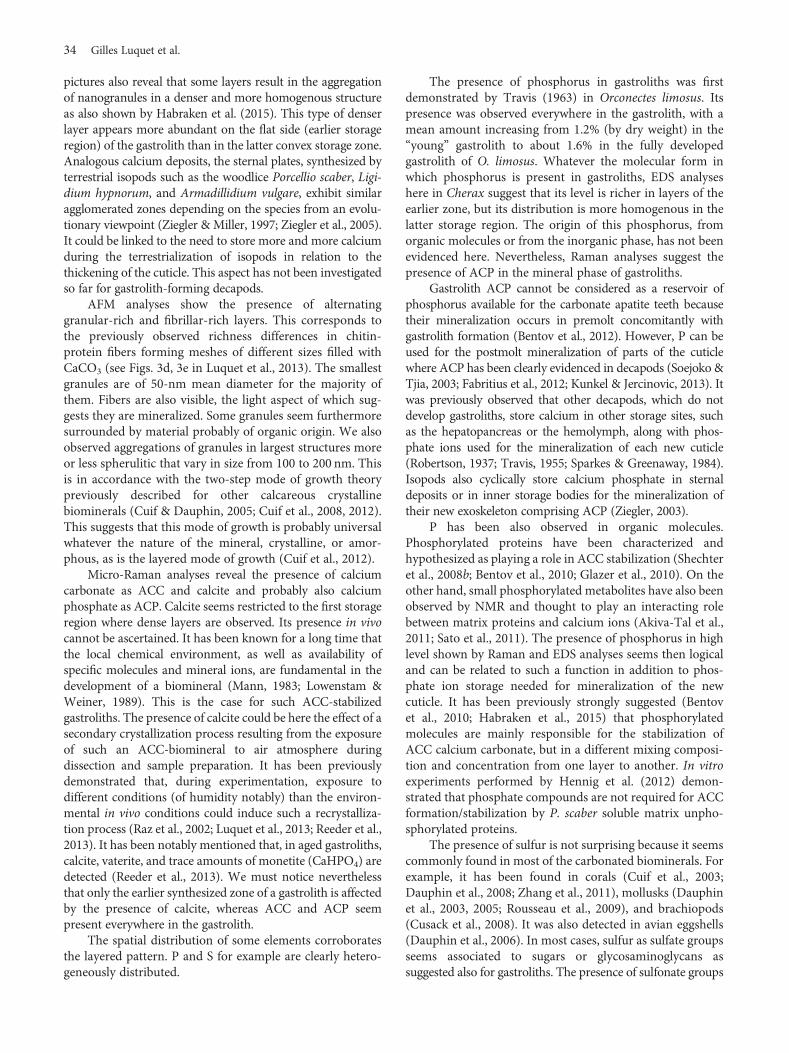
The presence of phosphorus in gastroliths was firstdemonstrated by Travis (1963) in Orconectes limosus. Itspresence was observed everywhere in the gastrolith, with amean amount increasing from 1.2% (by dry weight) in the“young” gastrolith to about 1.6% in the fully developedgastrolith of O. limosus. Whatever the molecular form inwhich phosphorus is present in gastroliths, EDS analyseshere in Cherax suggest that its level is richer in layers of theearlier zone, but its distribution is more homogenous in thelatter storage region. The origin of this phosphorus, fromorganic molecules or from the inorganic phase, has not beenevidenced here. Nevertheless, Raman analyses suggest thepresence of ACP in the mineral phase of gastroliths.
Gastrolith ACP cannot be considered as a reservoir ofphosphorus available for the carbonate apatite teeth becausetheir mineralization occurs in premolt concomitantly withgastrolith formation (Bentov et al., 2012). However, P can beused for the postmolt mineralization of parts of the cuticlewhere ACP has been clearly evidenced in decapods (Soejoko &Tjia, 2003; Fabritius et al., 2012; Kunkel & Jercinovic, 2013). Itwas previously observed that other decapods, which do notdevelop gastroliths, store calcium in other storage sites, suchas the hepatopancreas or the hemolymph, along with phos-phate ions used for the mineralization of each new cuticle(Robertson, 1937; Travis, 1955; Sparkes & Greenaway, 1984).Isopods also cyclically store calcium phosphate in sternaldeposits or in inner storage bodies for the mineralization oftheir new exoskeleton comprising ACP (Ziegler, 2003).
P has been also observed in organic molecules.Phosphorylated proteins have been characterized andhypothesized as playing a role in ACC stabilization (Shechteret al., 2008b; Bentov et al., 2010; Glazer et al., 2010). On theother hand, small phosphorylated metabolites have also beenobserved by NMR and thought to play an interacting rolebetween matrix proteins and calcium ions (Akiva-Tal et al.,2011; Sato et al., 2011). The presence of phosphorus in highlevel shown by Raman and EDS analyses seems then logicaland can be related to such a function in addition to phos-phate ion storage needed for mineralization of the newcuticle. It has been previously strongly suggested (Bentovet al., 2010; Habraken et al., 2015) that phosphorylatedmolecules are mainly responsible for the stabilization ofACC calcium carbonate, but in a different mixing composi-tion and concentration from one layer to another. In vitroexperiments performed by Hennig et al. (2012) demon-strated that phosphate compounds are not required for ACCformation/stabilization by P. scaber soluble matrix unpho-sphorylated proteins.
The presence of sulfur is not surprising because it seemscommonly found in most of the carbonated biominerals. Forexample, it has been found in corals (Cuif et al., 2003;Dauphin et al., 2008; Zhang et al., 2011), mollusks (Dauphinet al., 2003, 2005; Rousseau et al., 2009), and brachiopods(Cusack et al., 2008). It was also detected in avian eggshells(Dauphin et al., 2006). In most cases, sulfur as sulfate groupsseems associated to sugars or glycosaminoglycans assuggested also for gastroliths. The presence of sulfonate groups
34 Gilles Luquet et al.
R–SO2OH could correspond to S linked to carbohydratesor to the sugar domain of proteoglycans (O-sulfonatedglycosaminoglycans). Sulfate groups can be also associatedwith glycosylated proteins containing sulfated sugar moieties.Carbohydrates and proteoglycans have been found in gastroliths(Fernandez et al., 2012; Luquet et al., 2013).
A role of acidic glycoproteins (possibly sulfated) in thecontrol of nucleation and growth as well as inhibition ofcrystallization has been suggested (Wheeler et al., 1981;Addadi et al., 1996; Albeck et al., 1996).
Inorganic sulfate can also be incorporated in the mineralbulk in place of carbonate ions, but most often in associationwith calcite (Busenberg & Plummer, 1985; Kontrec et al.,2004). If the presence of calcite in gastrolith was detected byRaman spectroscopy, it could be the result of an experi-mental recrystallization process. Its real presence in vivocannot be asserted.
Travis (1963) described three developmental steps of O.virilis gastrolith formation resulting in a “young, intermediate,and mature” gastrolith. Microscopy, Raman, and EDS results,obtained for C. quadricarinatus gastroliths, corroborate theseconclusions: three distinct regions can be defined in a maturegastrolith. The first region, which corresponds to the begin-ning of the storage (flat side) exhibits denser layers, withmainly calcite, but also ACC and ACP and with a low level ofphosphorus. The second intermediate region presents mainlyACC, and lesser calcite and ACP with the higher content ofphosphorus increasing from the beginning of the gastrolithsynthesis. The third region (convex side, end of storage)appears less densely packed, more regularly layered withseparated nanogranules of ACC and probably also phosphateas ACP, with a regular intermediary level of phosphorus.
The reason for this spatial/temporal organization is notwell established. It could be related to three differentperiods of storage occurring during the premolt. The “softer”last-synthesized region could coincide with an increase of thetwo concomitant processes, decalcification of the endocuticleandmineral ion storage, as ecdysis approaches (Travis, 1963).This was previously well established for other storage depositselaborated in the terrestrial amphipod, Orchestia cavimana(Testeniere et al., 2012). It could also correspond to a part ofthe gastrolith more easily and quickly mobilizable afterecdysis. Just after ecdysis, these deposits collapse in the gastriclumen where they are completely dissolved within2–3 days. The real cuticular targets of the reused calcium ionshave not been clearly determined. Nevertheless, it is generallyconsidered that gastrolith calcium, which represents from4–7 (in Austropotamobius pallipes) to 18% (in Procambarusclarkii) of the complete intermolt skeleton calcium amount, ispreferentially used to harden mouthparts and the gastric millso that feeding can resume (Ryhänen, 1962; Chaisemartin,1964; Graf, 1978; Greenaway, 1985).
CONCLUSIONS
The layered structure of a gastrolith can be related to itselemental composition. The distribution of some elements
seems closely related to the spatial-temporal events oforganic synthesis concomitant to the mineralization process.
The most abundant secondary element (after C, O, andCa), phosphorus, because of its general spatial distributionobserved by EDS and XANES, appears to be incorporated asan element of bothmineral and organic compounds all duringthe synthesis of gastroliths. Therefore, it is probably animportant element at various steps of gastrolith formation, aspreviously evoked (Travis, 1963; Bentov et al., 2010; Akiva-Tal et al., 2011; Sato et al., 2011; Luquet, 2012; Habraken et al.,2015). If ACP and phosphorylated proteins are present, fur-ther investigations are necessary to clearly identify the natureof all the phosphorus-composed molecules and their dis-tribution linked to their function in the formation of thesecyclically synthesized and resorbed calcified deposits.
The presence of sulfur clearly shown here seems mainlyrelated to sulfated organic components, more especially withsulfated sugars and, to a lesser extent, with amino acids con-taining sulfur. Their distribution appears relatively homo-geneous, but the real function of these molecules has not beenclearly deciphered. As phosphorylated molecules, they couldbe involved in interactions with calcium ions promoting orpreventing the crystallization process of CaCO3.
For explaining ACC stabilization over time in gastroliths,a mixed repertoire of interacting compounds is probablynecessary. Besides previously observed low-molecular weightmetabolites (citrate, PEP), Mg and sulfate and phosphategroups probably linked to proteins and sugars were found.Their respective involvement in the control of gastrolithformation remains to be determined, as does their involvementin the pathway leading to inhibition of the crystallizationprocess in a way that allows perennial stabilization of themineral phase in an amorphous form.
ACKNOWLEDGMENTS
The authors would like to thank Valentin Seizilles deMazancourt for the drawing in Figure 1. Part of this workreceived financial support from the French Ministry of For-eign Affairs and the Chilean Ministry of Research (ECOS/CONYCIT Project C07B02; coordinators: G.L. and M.S.F.).This work was also financially supported in part by theMNHN by an ATM funding attribution (ATM “InteractionsMineral-Vivant”). This research work is part of an INSU-INTERRVIE project funded by the CNRS in 2015. This workhas also been made possible thanks to ESRF grants EC24 andEU-IHP Program (SYNTHESYS).
REFERENCESADDADI, L., MORADIAN, J., SHAY, E., MAROUDAS, M.G. & WEINER, S.
(1987). A chemical model for the cooperation of sulfates andcarboxylates in calcite crystal nucleation: Relevance tobiomineralization. Proc Natl Acad Sci USA 84, 2732–2736.
ADDADI, L., RAZ, S. & WEINER, S. (2003). Taking advantage ofdisorder: Amorphous calcium carbonate and its role inbiomineralization. Adv Mater 15, 959–970.
Calcium Storage in Crayfish 35
AIZENBERG, J., LAMBERT, G., WEINER, S. & ADDADI, L. (2001). Factorsinvolved in the formation of amorphous and crystalline calciumcarbonate: A study of an ascidian skeleton. J Am Chem Soc 124,32–39.
AKIVA-TAL, A., KABAYA, S., BALAZS, Y.S., GLAZER, L., BERMAN, A., SAGI, A.& SCHMIDT, A. (2011). In situ molecular NMR picture ofbioavailable calcium stabilized as amorphous CaCO3 biomineralin crayfish gastroliths. Proc Natl Acad Sci USA 108, 14763–14768.
ALBECK, S., ADDADI, L. & WEINER, S. (1996). Regulation of calcitecrystal morphology by intracrystalline acidic proteins andglycoproteins. Connect Tissue Res 35, 365–370.
BECKER, A., ZIEGLER, A. & EPPPLE, M. (2005). The mineral phase inthe cuticles of two species of Crustacea consists of magnesiumcalcite, amorphous calcium carbonate, and amorphous calciumphosphate. Dalton Trans, 1814–1820.
BENTOV, S., WEIL, S., GLAZER, L., SAGI, A. & BERMAN, A. (2010).Stabilization of amorphous calcium carbonate by phosphate richorganic matrix proteins and by single phosphoamino acids.J Struct Biol 17, 207–215.
BENTOV, S., ZASLANSKY, P., AL-SAWALMIH, A., MASIC, A., FRATZL, P.,SAGI, A., BERMAN, A. & AICHMAYER, B. (2012). Enamel-like apatitecrown covering amorphous mineral in a crayfish mandible. NatCommun 3, 839–845.
BLISS, D.E. (1953). Endocrine control of metabolism in the landcrab, Gecarcinus lateralis (Freminville). I. Differences in therespiratory metabolism of sinusglandless and eyestalkless crabs.Biol Bull 104, 275–296.
BUSENBERG, E. & PLUMMER, L.N. (1985). Kinetic and thermodynamicfactors controlling the distribution of SO42- and Na+ in calcitesand selected aragonites. Geochim Cosmochim Acta 49, 713–725.
CHAISEMARTIN, C. (1964). Importance des gastrolithes dansl’économie du calcium chez Astacus pallipes (Lereboullet).Bilan calcique de l’exuviation. Vie Milieu 15, 457–474.
CHANTRAN, M.S. (1874). Observations sur la formation des pierreschez les écrevisses. C R Acad Sci Paris 78, 6555–6557.
COMBES, C. & REY, C. (2010). Amorphous calcium phosphates:Synthesis, properties and uses in biomaterials. Acta Biomater 6,3362–3378.
CUIF, J.P. & DAUPHIN, Y. (2005). The two-step mode of growth in thescleractinian coral skeletons from the micrometre to theoverall scale. J Struct Biol 150, 319–331.
CUIF, J.P., DAUPHIN, Y., DOUCET, J., SALOME, M. & SUSINI, J. (2003).XANES mapping of organic sulfate in three scleractinan coralskeletons. Geochim Cosmochim Acta 67, 75–83.
CUIF, J.-P., DAUPHIN, Y., FARRE, B., NEHRKE, G. & NOUET, J. (2008).Distribution of sulfated polysaccharides within calcareousbiominerals suggests a widely shared two-step crystallizationprocess for the microstructural growth units. Mineral Mag 72,233–237.
CUIF, J.-P., DAUPHIN, Y., FARRE, B., NEHRKE, G., NOUET, J. & PEREZ-HUERTA, A. (2012). Layered growth and crystallization incalcareous biominerals: Impact of structural and chemicalevidence on two major concepts in invertebratebiomineralization studies. Minerals 2, 11–39.
CUSACK, M., DAUPHIN, Y., CUIF, J.P., SALOME, M., FREER, A. & YIN, H.(2008). Micro-XANES mapping of sulfur and its associationwith magnesium and phosphorus in the shell of the brachiopod,Terebratulina retusa. Chem Geol 253, 172–179.
DAUPHIN, Y., CUIF, J.P., DOUCET, J., SALOME, M., SUSINI, J. &WILLIAMS, T.(2003). In situ chemical speciation of sulfur in calciticbiominerals and the simple prism concept. J Struct Biol 142,272–280.
DAUPHIN, Y., CUIF, J.P., SALOME, M. & SUSINI, J. (2005). Speciation anddistribution of sulfur in a mollusk shell as revealed byin situ maps using X-ray absorption near-edge structure(XANES) spectroscopy at the SK-edge. Am Mineral 90,1748–1758.
DAUPHIN, Y., CUIF, J.P., SALOME, M., SUSINI, J. & WILLIAMS, T. (2006).Microstructure and chemical composition of giant avianeggshells. Anal Bioanal Chem 386, 1761–1771.
DAUPHIN, Y., CUIF, J.P. & WILLIAMS, T. (2008). Soluble organicmatrices of aragonitic skeletons of Merulinidae (Cnidaria,Anthozoa). Comp Biochem Physiol B 150, 10–22.
DAUPHIN, Y. & DUFOUR, E. (2008). Nanostructures of the aragoniticotolith of cod (Gadus morhua). Micron 39, 891–896.
DILLAMAN, R., HEQUEMBOURG, S. & GAY, M. (2005). Early pattern ofcalcification in the dorsal carapace of the blue crab, Callinectessapidus. J Morphol 263, 356–374.
FABRITIUS, H.-O., BALASUNDARAM, E.S., HILD, S., HUEMER, K. &RAABE, D. (2012). Correlation of structure, composition andlocal mechanical properties in the dorsal carapace of the ediblecrab Cancer pagurus. Z Kristallog Kristallgeom KristallphysicKristallchem 227, 766–776.
FARMER, A.S. (1973). Age and growth in Nephrops norvegicus(Decapoda: Nephropoidae). Mar Biol 23, 315–325.
FERNANDEZ, M.S., BUSTOS, C., LUQUET, G., SAEZ, D., NEIRA-CARRILLO, A.,CORNEILLAT, M., ALCARAZ, G. & ARIAS, J.L. (2012). Proteoglycanoccurrence in gastrolith of the crayfish Cherax quadricarinatus(Crustacea, Malacostraca, Decapoda). J Crust Biol 32, 802–815.
GLAZER, L. & SAGI, A. (2012). On the involvement of proteins in theassembly of the crayfish gastrolith extracellular matrix. InvertRep Dev 56, 57–65.
GLAZER, L., SHECHTER, A., TOM, M., YUDKOVSKI, Y., WELL, S.,AFLALO, E.D., PAMURU, R.R., KHALAILA, I., BENTOV, S., BERMAN, A.& SAGI, A. (2010). A protein involved in the assembly ofan extracellular calcium storage matrix. J Biol Chem 285,12831–12839.
GLAZER, L., TOM, M., WEIL, S., ROTH, Z., KHALAILA, I., MITTELMAN, B.& SAGI, A. (2013). Hemocyanin with phenoloxidase activity inthe chitin matrix of the crayfish gastrolith. J Exp Biol 216,1898–1904.
GRAF, F. (1978). Les sources de calcium pour les crustacés venantde muer. Arch Zool Exp Gen 119, 143–161.
GREENAWAY, P. (1985). Calcium balance and molting in theCrustacea. Biol Rev 60, 425–454.
GRUNENFELDER, L.K., HERRERA, S. & KISALIUS, D. (2014). Crustacean-derived biomimetic components and nanostructuredcomposites. Small 16, 30207–30232.
HABRAKEN, W.J.E.M., MASIC, A., BERTINETTI, L., AL-SAWALMIH, A.,GLAZER, L., BENTOV, S., FRATZL, P., SAGI, A., AICHMAYER, B. &BERMAN, A. (2015). Layered growth of crayfish gastrolith: Aboutthe stability of amorphous calcium carbonate and role ofadditives. J Struct Biol 189, 28–36.
HAN, T.Y.-J. & AIZENBERG, J. (2008). Calcium carbonate storage inamorphous form and its template-induced crystallization. ChemMater 20, 1064–1068.
HAUGSTAD, G. (2012). Atomic Force Microscopy: UnderstandingBasic Modes and Advanced Applications. Hoboken, NJ, USA:John Wiley & Sons.
HENNIG, S., HILD, S., FABRITIUS, H.-O., SOOR, C. & ZIEGLER, A. (2012).Influence of near-physiological salines and organic matrixproteins from amorphous CaCO3 deposits of Porcellioscaber on in vitro CaCO3 precipitation. Cryst Growth Des 12,646–655.
36 Gilles Luquet et al.
HERRICK, F.H. (1911). Natural History of the American Lobster.Cambridge: U.S. Government Printing Office, HarvardUniversity Press.
HIKIDA, T., NAGASAWA, H. & KOGURE, T. (2003). Characterization ofamorphous calcium carbonate in the gastrolith of crayfish,Procambarus clarkii. In Biomineralization: Formation, Diversity,Evolution and Application, Kobayashi, I. & Ozawa, H. (Eds.),pp. 81–84. Kanagawa: Tokai University Press.
HUXLEY, T.H. (1879). The Crayfish: An Introduction to the Study ofZoology. The International Scientific Series, vol. XXVIII. London,UK: C. Kegan Paul & Company, Oxford University Press.
ISHII, K., YANAGISAWA, T. & NAGASAWA, H. (1996). Characterizationof a matrix protein in the gastroliths of the crayfish Procambarusclarkii. Biosci Biotechnol Biochem 60, 1479–1482.
KHAN, A.F., AWAIS, M., KHAN, S.A, TABASSUM, S., CHAUDHRY, A.A. &REHMAN, I.U. (2013). Raman spectroscopy of natural bone andsynthetic apatites. Appl Spectrosc Rev 48, 329–355.
KONTREC, J., KRALJ, D., BRECEVIC, L., FALINI, G., FERMANI, S.,NOETHIG-LASLO, V. & MIROSAVLJEVIC, K. (2004). Incorporationof inorganic anions in calcite. Eur J Inorg Chem 2004,4579–4595.
KUGLER, O.E. & BIRKNER, M.L. (1948). Histochemical observations ofalkaline phosphatase in the integument, gastrolith sac, digestivegland and nephridium of the crayfish. Physiol Zool 21, 105–110.
KUNKEL, J.G. & JERCINOVIC, M.J. (2013). Carbonate apatiteformulation in cuticle structure adds resistance to microbialattack for American lobster. Mar Biol Res 9, 27–34.
LOSTE, A., WILSON, R.M., SESHADRIC, R. & MELDRUM, F.C. (2003). Therole of magnesium in stabilising amorphous calcium carbonateand controlling calcite morphologies. J Cryst Growth 254,206–208.
LOWENSTAM, H.A. & WEINER, S. (1989). On Biomineralization.London, UK: Oxford University Press.
LUQUET, G. (2012). Biomineralizations: Insights and prospects fromcrustaceans. Zookeys 176, 103–121.
LUQUET, G., FERNANDEZ, M.S., BADOU, A., GUICHARD, N., LE ROY, N.,CORNEILLAT, M., ALCARAZ, G. & ARIAS, J.L. (2013). Comparativeultrastructure and carbohydrate composition of gastroliths fromAstacidae, Cambaridae and Parastacidae freshwater crayfish(Crustacea, Decapoda). Biomolecules 3, 18–38.
LUQUET, G., LE ROY, N., ZANELLA-CLÉON, I., BECCHI, M., BUCAREY, S.,FERNANDEZ, M.S., ARIAS, J.L., GUICHARD, N., MARIE, B. & MARIN, F.(2009). Characterization of crustacyanin-A2 subunit as acomponent of the organic matrix of gastroliths from thecrayfish Cherax quadricarinatus. Mater Res Soc Symp Proc1187, 69–75.
LUQUET, G. & MARIN, F. (2004). Biomineralizations in crustaceans:Storage strategies. C R Palevol 3, 515–534.
MANN, S. (1983). Mineralization in biological systems. Struct Bond54, 125–174.
MITTAL, V. & MATSKO, N.B. (2012). Analytical Imaging Techniquesfor Soft Matter Characterization. New York, NY, USA: SpringerScience & Business Media.
NEUES, F., ZIEGLER, A. & EPPLE, M. (2007). The composition of themineralized cuticle in marine and terrestrial isopods: Acomparative study. Cryst Eng Comm 9, 1245–1251.
NUMANOI, H. (1939). Behavior of blood calcium in the formation ofgastroliths in some decapod crustaceans. Jap J Zool 8, 357–363.
PICKERING, I.J., PRINCE, R.C., DIVERS, T. & GEORGE, G.N. (1998). SulfurK-edge X-ray absorption spectroscopy for determining thechemical speciation of sulfur in biological systems. FEBS Lett441, 11–14.
POLITI, Y., METZLER, R.A., ABRECHT, M., GILBERT, B., WILT, F.H.,SAGI, I., ADDADI, L., WEINER, S. & GILBERT, P.U. (2008).Transformation mechanism of amorphous calcium carbonateinto calcite in the sea urchin larval spicule. Proc Natl Acad SciUSA 105, 17362–17366.
PRIETZEL, J., THIEME, J., SALOME, M. & KNICKER, H. (2007). SulfurK-edge XANES spectroscopy reveals differences in sulfurspeciation of bulk soils, humic acid, fulvic acid and particlesize separates. Soil Biol Biochem 39, 877–890.
RAVEL, B. & NEWVILLE, M. (2005). ATHENA, ARTEMIS,HEPHAESTUS: data analysis for X-ray absorptionspectroscopy using IFEFFIT. J Synchrotron Rad 12,537–541.
RAZ, S., HAMILTON, P., WILT, F., WEINER, S. & ADDADI, L. (2003). Thetransient phase of amorphous calcium carbonate in sea urchinspicules: The involvement of proteins and magnesiumions in their formation and stabilization. Adv Funct Mater 13,480–486.
RAZ, S., TESTENIERE, O., HECKER, A., WEINER, S. & LUQUET, G. (2002).Stable amorphous calcium carbonate is the main components ofthe calcium storage structures of the crustacean Orchestiacavimana. Biol Bull 203, 269–274.
REEDER, R.J., TANG, Y., SCHMIDT, D.T., KUBISTA, L.M., COWAN, D.F. &PHILIPS, B.L. (2013). Characterization of structure in biogenicamorphous calcium carbonate: Pair distribution function andnuclear magnetic resonance studies of lobster gastrolith. CrystGrowth Des 13, 1905–1914.
ROBERTSON, J.D. (1937). Some features of calcium metabolism of theshore crab (Carcinus maenas Pennant). Proc Roy Soc London B124, 162–182.
ROMANO, P., FABRITIUS, H. & RAABE, D. (2007). The exoskeleton ofthe lobster, Homarus americanus, as an example of a smartanisotropic biological material. Acta Biomater 3, 301–309.
ROUSSEAU, M., MEIBOM, A., GEZE, M., BOURRAT, X., ANGELLIER, M. &LOPEZ, E. (2009). Dynamics of sheet nacre formation in bivalves.J Struct Biol 165, 190–195.
RYHÄNEN, R. (1962). Beobachtungrn über Häutungsvorgang undCa-Haushalt beim Edelkrebs Astacus astacus. Arch Soc Vanamo17, 25–38.
SARDA, F. (1991). Reproduction and moult synchronism inNephrops norvegicus (L.) (Decapoda, Nephropidae) in thewestern mediterranean is spawning annual or biennial?Crustaceana 60, 186–199.
SATO, A., NAGASAKA, S., FUHIRATA, K., NAGATA, S., ARAI, S.,SARUWATARI, K., KOGURE, T., SAKUDA, S. & NAGASAWA, H.(2011). Glycolytic intermediates induce amorphouscalcium carbonate formation in crustaceans. Nat Chem Biol 7,197–199.
SHECHTER, A., BERMAN, A., SINGER, A., FREIMAN, A., GRINSTEIN, M.,EREZ, J., AFLALO, E.D. & SAGI, A. (2008a). Reciprocal changes incalcification of the gastrolith and cuticle during the molt cycle ofthe red claw crayfish Cherax quadricarinatus. Biol Bull 214,122–134.
SHECHTER, A., GLAZER, L., CHELED, S., MOR, E., WEIL, S., BERMAN, A.,BENTOV, S., AFLALO, E.D., KHALAILA, I. & SAGI, A. (2008b).A gastrolith protein serving a dual role in the formation of anamorphous mineral containing extracellular matrix. Proc NatlAcad Sci USA 105, 7129–7134.
Calcium Storage in Crayfish 37
SOEJOKO, D.S. & TJIA, M.O. (2003). Infrared spectroscopy and X raydiffraction study on the morphological variations of carbonateand phosphate compounds in giant prawn (Macrobrachiumrosenbergii) skeletons during its moulting period. J Mater Sci 38,2087–2093.
SPARKES, S. & GREENAWAY, P. (1984). The haemolymph as a storagesite for cuticular ions during premoult in the freshwater/landcrab Holthuisana transversa. J Exp Biol 113, 43–54.
TESTENIERE, O., HECKER, A., LE GURUN, S., QUENNEDEY, B., GRAF, F. &LUQUET, G. (2012). Characterization and spatiotemporalexpression of orchestin, a gene encoding an ecdysone-inducibleprotein from a crustacean organic matrix. Biochem J 361,327–335.
THORMANN, E., MIZUNO, H., JANSSON, K., HEDIN, N., FERNANDEZ, M.S.,ARIAS, J.L., RUTLAND, M.W., PAI, R.K. & BERGSTRÖM, L.(2012). Embedded proteins and sacrificial bonds provide thestrong adhesive properties of gastroliths. Nanoscale 4,3910–3916.
TRAVIS, D.F. (1955). The molting cycle of the spiny lobster,Panulirus argus latreille. II. Pre-ecdysial histological andhistochemical changes in the hepatopancreas andintegumental tisues. Biol Bull 108, 88–112.
TRAVIS, D.F. (1960). The deposition of the skeletal structures in theCrustacea. I. The histology of the gastrolith skeletal tissuecomplex and the gastrolith in the crayfish, Orconectes(Cambarus) virilis Hagen—Decapoda. Biol Bull 118, 137–149.
TRAVIS, D.F. (1963). Structural features of mineralization fromtissue to macromolecular levels of organization in the decapodCrustacea. Ann N Y Acad Sci 109, 177–245.
TSUTSUI, N., ISHII, K., TAKAGI, Y., WATANABE, T. & NAGASAWA, H.(1999). Cloning and expression of a cDNA encoding aninsoluble matrix protein in the gastroliths of a crayfish,Procambarus clarkii. Zoolog Sci 16, 619–628.
URMOS, J., SHARMA, S.K. & MACKENZIE, F.T. (1991). Characterizationof some biogenic carbonates with Raman spectroscopy.Am Mineral 76, 641–646.
WEHRMEISTER, U., JACOB, D.E., SOLDATI, A.L., LOGES, N., HÄGER, T. &HOFMEISTER, W. (2010). Amorphous, nanocrystalline andcrystalline calcium carbonates in biological materials. J RamanSpectrosc 42, 926–935.
WHEELER, A.P., GEORGE, J.W. & EVANS, C.A. (1981). Control ofcalcium carbonate nucleation and crystal growth by solublematrix of oyster shell. Science 212, 1397–1398.
ZHANG, F., CAI, W., ZHU, J., SUN, Z. & ZHANG, J. (2011). In situRaman spectral mapping study on the microscale fibers inblue coral (Heliopora coerulea) skeletons. Anal Chem 83,7870–7875.
ZIEGLER, A. (2003). Variation of calcium deposition in terrestrialisopods. In The Biology of Terrestrial Isopods, vol. 2Sfenthourakis, S., de Araujo, P.B., Hornung, E., Schmalfuss, H.,Taiti, S. & Szlavecz, K. (Eds.), pp. 299–309. Leiden: KoninklijkeBrill NV.
ZIEGLER, A., FABRITIUS, H. & HAGEDORN, M. (2005). Microscopicaland functional aspects of calcium-transport and deposition interrestrial isopods. Micron 36, 137–153.
ZIEGLER, A. &MILLER, B. (1997). Ultrastructure of CaCO3 deposits ofterrestrial isopods (Crustacea, Oniscidea). Zoomorphol 117,181–187.