164
Volume 37 No. 4 የኢትዮጵያ ብሔራዊ ባንክ National Bank of Ethiopia

Fourth Quarter 2020/21
Volume 37 No. 4
የኢትዮጵያብሔራዊባንክNational Bank of Ethiopia

National Bank of Ethiopia (Central Bank)
: http://www.nbe.gov.et
Prepared By: Domestic Economic Analysis & Publications Directorate
Domestic Economic Analysis & Publications DirectorateNational Bank of EthiopiaP. O. Box 5550Tel. 251 11 517 2247/ 11 517 5297Addis Ababa, Ethiopia
National Bank of Ethiopia
Web Site
This Publication can be acquired by subscription or exchange. Please Contact:
P.O. Box: 5550, Addis Ababa, Ethiopia
Tel. 251-11-551 7430
Tel. 251-11-551 4588
Telegraphic Address:
NATIONAL BANK, TELEX 21020, CODES
USED PETERSON 3rd & 4th ED
BENTLEY’S 2nd PHRAS A.B.C...6th H EDITION

NATIONAL BANK OF ETHIOPIAQuarterly Bulletin
Volume 37, No.4Fourth Quarter 2020/21
Fiscal year Series
Addis Ababa 2021
National Bank of Ethiopia (Central Bank)
: http://www.nbe.gov.et
Prepared By: Domestic Economic Analysis & Publications Directorate
Domestic Economic Analysis & Publications DirectorateNational Bank of EthiopiaP. O. Box 5550Tel. 251 11 517 2247/ 11 517 5297Addis Ababa, Ethiopia
National Bank of Ethiopia
Web Site
This Publication can be acquired by subscription or exchange. Please Contact:
P.O. Box: 5550, Addis Ababa, Ethiopia
Tel. 251-11-551 7430
Tel. 251-11-551 4588
Telegraphic Address:
NATIONAL BANK, TELEX 21020, CODES
USED PETERSON 3rd & 4th ED
BENTLEY’S 2nd PHRAS A.B.C...6th H EDITION


Table of Contents Pages
Ethiopia: Macroeconomic and Social Indicators .....................................................................i
I. Overview ....................................................................................................................................1
1.1: International Economic Developments .................................................................. 1
1.2: Macroeconomic Developments in Ethiopia .......................................................... 2
II. Energy Production and Processing .........................................................................................8
2.1: Import of Petroleum Products .................................................................................... 8
2.2: Electric Power Generation ......................................................................................... 13
III. Quarterly Price Developments ...............................................................................................15
3.1: Developments in National CPI .................................................................................. 15
3.2: Developments in Regional Inflation ......................................................................... 19
IV. Monetary Developments .......................................................................................................21
4.1: Money Supply and Credit ........................................................................................... 21
4.2: Developments in Reserve Money and Monetary Ratio .......................................... 25
4.3: Interest Rate Developments ...................................................................................... 27
4.4: Developments in the Financial Sector ...................................................................... 29
4.5: Activities of the Banking System ................................................................................. 31
4.5.1: Resource Mobilization ....................................................................................... 31
4.5.1.1: Deposit Mobilization ............................................................................... 33
4.5.1.2: Collection of Loans ................................................................................ 34
4.5.1.3: Borrowing ................................................................................................ 34
4.5.2: Disbursement of Fresh Loans ........................................................................... 35
4.5.3: Outstanding Credit ............................................................................................ 37
4.6: Financial Activities of NBE .......................................................................................... 38
4.7: Developments in Financial Markets .......................................................................... 39
4.7.1:Treasury Bills Market ........................................................................................ 39
4.7.2: Inter-bank Money Market ............................................................................ 42
4.7.3: Corporate Bond Market ................................................................................ 42
V. External Sector Developments ...............................................................................................44
5.1: Balance of Payments ................................................................................................ 44
5.2: Balance of Trade ......................................................................................................... 47
5.2.1: Exports of Goods ........................................................................................... 48
5.2.2: Imports of Goods ........................................................................................... 53
5.2.3: Direction of Trade ........................................................................................ 56
5.2.3.1: Exports of goods ................................................................................... 56

5.2.3.2: Imports of goods .................................................................................. 57
5.3: Services and Transfers ................................................................................................. 58
5.4: Current Account Balance ......................................................................................... 61
5.5: Capital Account .......................................................................................................... 61
5.6: Changes in Reserve Position ..................................................................................... 62
5.7: Developments in Foreign Exchange Market ............................................................ 62
5.7.1: Exchange Rate Movements ........................................................................ 62
5.7.2: Movements in the Real Effective Exchange Rate .................................... 69
5.7.3: Volume of Transactions ................................................................................ 71
VI. Federal Government Finance ................................................................................................72
6.1: Revenue and Grants ................................................................................................... 74
6.2: Expenditure ................................................................................................................... 77
6.3: Deficit Financing .......................................................................................................... 79
VII. Developments in Investment .................................................................................................81
VIII. International Economic Developments ...............................................................................86
8.1: Overview of the World Economy .............................................................................. 86
8.2: Inflation Developments ............................................................................................... 87
8.3: Commodity Price ......................................................................................................... 88
8.4: Exchange Rate Development .................................................................................... 88
8.5: Impact of Global Economic Dev't on Ethiopian Economy .................................. 89
Statistical Tables .........................................................................................................................92
Currency and Time
Currency Currency Unit: Birr (Br) Exchange Rate: Look at Page 62
Time
** There is a difference of about 73/4 Years between Gregorian and Ethiopian Calendar
Fisical Year: July 8th to July 7th
Coffee Year: October to SeptemberCalendar Year: September 11 to September 10

|I
National Bank of Ethiopia Quarterly BulletinEt
hiop
ia: M
acro
econ
omic
and
Soc
ial I
ndic
ator
s
Indi
cato
rs20
03/0
420
04/0
520
05/0
620
06/0
720
07/0
820
08/0
920
09/1
020
10/1
1 2
011/
12 2
012/
13 2
013/
14 2
014/
15 2
015/
16 2
016/
1720
17/1
8 2
018/
19 2
019/
20
(199
6)(1
997)
(199
8)(1
999)
(200
0)(2
001)
(200
2)(2
003)
(200
4)(2
005)
(200
6)(2
007)
(200
8)(2
009)
(201
0)(2
011)
(201
2)
1.
Cou
ntry
Pro
file
L
and
Are
a (t
otal
, In
Sq.K
m)
1.14
milli
on1.
14m
illion
1.14
milli
on1.
14m
illion
1.14
milli
on1.
14m
illion
1.1
4milli
on 1
.14
milli
on 1
.14
milli
on 1
.14
milli
on 1
.14
milli
on 1
.14
milli
on 1
.14
milli
on 1
.14
milli
on
1.14
milli
on1.
14 m
illion
1.14
milli
on
A
rabl
e La
nd (
% o
f tot
al a
rea
)45
.045
.045
.045
.045
.045
.0 4
5.00
4
5.00
4
5.00
N
A
NA
N
A
NA
N
A
15.
20
15.2
10
Ir
rigat
ed L
and
( %
of t
otal
are
a )
3.0
3.0
3.0
3.0
3.0
3.0
NA
N
A
NA
N
A
NA
N
A
NA
N
A
2,9
00.0
0 3
,100
.00
5.0
P
opul
atio
n D
ensit
y ( p
erso
n pe
r sq.
km )*
95.8
99.7
101.
299
.610
2.1
104.
7 1
07.4
0 1
10.1
4 1
12.9
4 1
15.7
6 1
18.6
1 1
21.5
0
2.
Soci
al In
dica
tors
Pop
ulat
ion
tota
l, in
milli
ons (
Mid
-Yea
r po
pula
tion)
66.5
068
.30
70.0
072
.40
74.9
076
.8 7
8.80
8
0.70
8
2.7
84.
8 8
7.0
89.
1 9
1.2
93.
4 9
5.5
97.6
99.7
5
(o/w
Urb
an P
oula
tion,
in %
)15
.815
.97
16.2
116
.45
1716
.14
16.
30
16.
10
16.
3 1
8.6
19.
0 1
9.5
19.
9 2
0.3
20.
8 21
22.8
Wor
king
Age
Pop
ulat
ion
( In
Milli
ons )
Urb
an7
6.95
7.6
7.6
8.0
8.4
8.9
2 9
.43
10.
0 1
0.5
11.
1 1
1.6
12.
2 1
2.8
7
10.1
NA
Rur
al
31.4
32.6
33.2
32.9
31.3
33.0
33.
89
34.
83
35.
8 3
6.8
37.
7 3
8.7
39.
7 4
0.8
49
49.8
NA
Tot
al
38.4
39.6
40.7
40.6
39.3
41.4
42.
82
44.
26
45.
7 4
7.3
48.
8 5
0.4
52.
0 5
3.6
56
59.9
NA
Age
Dep
end
ency
Rat
io85
.284
.784
.384
.393
93 9
3.00
9
3.00
9
3.0
75.
0 7
5.0
75.
0 7
5.0
75.
0 6
9 69
69
Life
Expe
ctan
cy a
t Birt
h ( M
ale
- Fem
ale
)53
-55
53.4
2-55
.42
55.6
-57.
955
.6-5
7.9
53.4
-55.
453
.4-5
5.4
53.
4-55
.4
58.
4-60
.4
53.
4-55
.4
60.
2-64
.2
60.
2-64
.2
60.
2-64
.2
60.
2-64
.2
60.
2-64
.2
62.
4-66
.6
62.4
-66.
662
.4-6
6.7
Cru
de
Birth
Rat
e39
.9:1
,000
35.7
:1,0
0036
.9:1
,000
36.9
:1,0
0035
.7:1
,000
35.7
:100
0 3
5.7:
1000
3
3.6:
1000
3
3.6:
1000
3
0.3:
1000
3
0.3:
1000
3
0.3:
1000
3
0.3:
1000
3
0.3:
1000
2
7:10
00
27:1
000
27:1
001
Cru
de
Dea
th R
ate
12.6
:100
012
.6:1
000
10.8
:1,0
0010
.8:1
,000
10.8
:1,0
00N
A N
A
9.2
:1,0
00
9.2
:1,0
00
7.2
:100
0 7
.2:1
000
7.2
:100
0 7
.2:1
000
7.2
:100
0 6
.30
66
Nat
ural
Rat
e of
Pop
ulat
ion
Incr
ease
( In
% )
2.7
2.7
2.7
2.7
2.7
2.7
2.6
0 2
.40
2.4
0 2
.31
2.3
1 2
.31
2.3
1 2
.31
2.0
7 2.
072.
07
Tot
al F
ertil
ity R
ate
5.8c
hild
:W5.
4chi
ld:W
5.4c
hild
:W5.
4chi
ld:W
5.4c
hild
:W5.
4chi
ld:W
5 c
hild
:W
4.8c
hild
:W
4.8c
hild
:W
3.94
chil:W
3.
94ch
il:W
3.94
chil:W
3.
94ch
il:W
3.94
chil:W
3
.45c
hil:W
3.
45ch
il:W3.
5chi
l:W
Peo
ple
: Hos
pita
l Bed
s 57
21.4
:152
73.5
:150
28:1
5293
:156
98:1
5082
:1 7
815:
1 N
A
NA
2
516:
1 N
A
NA
28
50:1
2980
:136
17:1
3150
:127
50
Peo
ple
: Phy
sicia
n136
954:
129
777:
135
493:
149
888:
136
374:
136
175:
1 5
6013
:1
536
42:1
2
8847
:1
321
32:1
2
0970
:1
171
60:1
1
4045
:1
227
66:1
2
6635
:1
-99
77
Peo
ple
: Nur
se 1
4621
:139
56.8
:142
06:1
4601
:145
24:1
3870
:1 3
012:
1 2
762:
1 2
299:
1 1
884:
1 1
995:
1 19
99:0
1:00
1999
:111
94:1
1780
:116
24:1
1705
Infa
nt M
orta
lity
Rate
97:1
,003
80:1
,000
80:1
,000
80:1
,000
77:1
,000
77:1
,000
77:
1,00
0 7
3:10
00
59:
1000
6
2.2:
1000
6
2.4:
1000
6
2.4:
1000
6
2.4:
1000
6
2.4:
100
53.
3:10
00
53.3
:100
043
.3:1
000
Acc
ess t
o Sa
fe W
ater
( In
%)
C
ount
ry L
evel
35
.945
.647
.352
.559
.566
.2 6
8.50
7
3.30
5
8.3
68.
5 7
6.7
84.
0 6
1.0
66.
0 7
1.0
7679
Ur
ban
Popu
latio
n N
.A82
NA
82.0
86.2
88.6
91.
50
92.
50
78.
7 8
1.3
84.
2 9
1.0
52.
5 5
5.0
60.
0 66
66.5
Ru
ral P
opul
atio
n 25
.238
.442
.246
.453
.961
.5 6
5.80
7
1.30
5
5.2
66.
5 7
5.5
82.
0 6
3.1
68.
0 7
4.0
7982
.7
Stu
den
t-Tea
cher
Rat
io
Prim
ary
( 1-8
)65
:166
:162
:159
:157
:154
:1 5
1:1
51:
1 5
0:1
49:
1 4
7:1
46:
1 4
6:1
- 39
39
Sec
ond
ary
( 9-1
2 )
48:1
51:1
57:1
48:1
43:1
41:1
36:
1 3
1:1
29:
1 2
8.7:
1 2
7.8:
1 2
6.4:
1 2
6.5:
1 -
22.5
24
Tec
hnic
al &
Voc
atio
nal
22:1
21:1
20:1
27:1
25:1
34:1
NA
2
9:1
24.
7:1
18.
6:1
16.
5:1
16.
5:1
12.
6:1
- 13
.313
.3
Stu
den
t-Sch
ool R
atio
Pr
imar
y ( 1
-8 )
724:
169
0:1
654:
167
7:1
657:
161
9:1
573
:1
590
:1
576
:1
571
:1
571
:1
744
.9:1
5
73:1
-
628
528
Sec
ond
ary
( 9-1
2 )
1312
:113
50:1
1425
:114
40:1
1381
:113
45:1
127
0:1
116
0:1
103
3:1
994
:1
857
:1
369
:1
767
.2:1
-
568
940
Tec
hnic
al &
Voc
atio
nal
552:
153
4:1
468:
149
3:1
501:
167
3:1
788
:1
735
:1
654
:1
544
:1
545
:1
383
:1
523
:1
- 24
6.8
NA

II | Fourth Quarter 2020/21
National Bank of Ethiopia Quarterly BulletinC
ontin
ued…
. Indi
cato
rs20
03/0
420
04/0
520
05/0
620
06/0
720
07/0
820
08/0
920
09/1
020
10/1
1 2
011/
12 2
012/
13 2
013/
14 2
014/
15 2
015/
16 2
016/
1720
17/1
8 2
018/
19 2
019/
20
(199
6)(1
997)
(199
8)(1
999)
(200
0)(2
001)
(200
2)(2
003)
(200
4)(2
005)
(200
6)(2
007)
(200
8)(2
009)
(201
0)(2
011)
(201
2)
3.
Mac
roec
onom
ic In
dic
ator
s
3.1:
Rea
l sec
tor D
evel
opm
ent2
GD
P at
Cur
rent
Mar
ket P
rice
(In M
n. B
irr)
85,
800.
0 1
05,4
15.0
1
30,3
34.0
1
70,2
81.0
2
45,8
36.0
3
32,0
60.0
37
9,13
5.00
5
15,0
78.5
7
47,3
26.5
8
66,9
21.1
1,06
0,82
5.4
1,
297,
961.
4
1,56
8,09
7.5
1,
717,
127.
2 1
,834
,066
.5
1987
157.
533
7434
9.0
Nom
inal
GD
P G
row
th R
ate
(In %
) 1
8.0
22.
9 2
3.6
30.
6 4
4.4
35.
1 1
4.18
3
5.9
45.
1 1
5.3
22.
4 2
2.4
18.
2 1
7.7
21.
4 23
.325
.5A
vera
ge M
argi
nal E
xcha
nge
Rate
(Birr
pe
r USD
) 8
.630
0 8
.651
8 8
.681
0 8
.794
3 9
.240
0 1
0.42
00
12.
89
16.
1 1
7.3
18.
3 1
9.1
20.
1 2
1.10
2
2.40
2
6.10
2
8.10
3
1.34
GD
P at
Cur
rent
Mar
ket P
rice
(IN M
n. U
SD)
9,9
42.1
1
2,18
4.2
15,
013.
7 1
9,36
2.7
26,
605.
6 3
1,86
7.6
29,
413.
11
31,
957.
1 4
3,31
4.2
47,
424.
6 5
5,62
8.0
64,
575.
2 7
4,29
7.0
81,
760.
0 8
4,35
6.0
9610
7.0
1076
60.0
Nom
inal
GD
P pe
r Cap
ita (I
n US
D)
149
.5
178
.4
214
.5
267
.4
355
.2
415
3
73.2
6 3
96.1
5
23.5
5
59.1
6
39.6
7
25.0
8
15.0
8
76.0
8
83.0
98
5.0
1080
.0
Real
GD
P pe
r Cap
ita (
In B
irr )
3,6
52.6
3
,976
.7
4,3
00.5
4
,634
.2
4,9
62.8
5
,266
.1
5,7
76.6
0 5
,895
.00
6,9
47.5
7
,299
.1
7,6
25.2
8
,571
.2
8,8
64.0
1
8,25
7.5
19,
204.
9 20
360.
221
144.
1
Real
GD
P pe
r Cap
ita G
row
th R
ate
(In %
) 1
0.7
8.9
8
.1
7.8
7
.1
6.1
9
.69
9.0
0 6
.1
5.1
4
.5
12.
4 3
.4
8.0
5
.2
6.0
3.8
GD
P D
eflat
or (%
cha
nge)
3.9
9
.9
11.
6 1
7.2
30.
3 2
4.2
1.7
0 2
0.08
3
3.5
4.9
1
1.0
10.
8 9
.5
6.7
1
2.5
20.1
18.2
Real
GD
P a
t con
stan
t bas
ic p
rice
(In
Mn.
Birr
) 2
20,4
77.2
2
48,3
54.8
2
77,0
13.3
3
09,6
86.8
3
44,3
31.9
3
78,9
07.4
41
8,94
6.95
47
5,64
7.50
5
17,0
26.5
5
68,4
32.3
6
26,9
77.4
6
92,2
21.7
1,44
9,39
7.5
1,
596,
481.
6 1
,719
,491
.3
1874
689.
319
8951
9005
.0Re
al G
DP
at c
onst
ant m
arke
t pric
e (In
M
n. B
irr)
242
,897
.6
271
,605
.2
301
,032
.7
335
,519
.0
371
,716
.7
404
,437
.0
455,
196.
02
515,
078.
50
559
,621
.6
618
,842
.2
682
,358
.5
753
,229
.7
1,
568,
097.
5
1,71
7,12
7.2
1,8
34,0
66.5
1
,987
,157
.5
2,1
09,1
22.2
Real
GD
P G
row
th R
ate
(In %
) 1
1.7
12.
6 1
1.5
11.
8 1
1.2
10.
0 1
0.57
1
1.40
8
.7
9.9
1
0.3
10.
4 8
.0
10.
1 7
.7
9.0
6.1
Agr
icul
ture
& A
llied
Act
ivtie
s(In
Billi
on B
irr)
115
.0
130
.5
144
.8
158
.5
170
.3
181
.2
195
.00
212
.50
222
.9
238
.8
251
.8
267
.8
544
.1
580
.4
600
.9
624
650
Ind
ustri
al S
ecto
r (In
Billi
on B
irr)
23.
7 2
5.9
28.
4 3
0.6
33.
9 3
7.3
41.
99
49.
80
59.
6 7
3.9
86.
5 1
03.7
3
43.9
4
13.8
4
64.4
52
6.2
576.
9
Serv
ice
Sect
or(In
Billi
on B
irr)
84.
2 9
4.6
107
.6
124
.1
144
.1
163
.9
185
.10
216
.60
237
.4
258
.8
292
.5
325
.0
575
.9
619
.3
673
.9
745.
778
6.8
A
gric
ultu
re &
Allie
d A
ctiv
ties (
%
of G
DP)
51.
6 5
1.9
51.
5 5
0.5
48.
8 4
7.3
46.
13
44.
37
43.
1 4
2.0
40.
2 3
8.7
37.
5 3
6.4
34.
9 33
.332
.7
I
ndus
trial
Sec
tor (
% o
f GD
P )
10.
9 1
0.6
10.
4 1
0.2
10.
1 1
0.1
10.
17
10.
40
11.
5 1
3.0
13.
8 1
5.0
23.
7 2
5.9
27.
0 28
.129
S
ervi
ce S
ecto
r ( %
of G
DP
) 3
7.5
37.
5 3
8.0
39.
3 4
1.0
42.
6 4
3.70
4
5.23
4
5.9
45.
5 4
6.6
47.
0 3
9.7
38.
8 3
9.2
4040
Priv
ate
Con
sum
ptio
n Ex
pend
iture
60,
866.
0 8
1,44
5.0
102
,537
.0
130
,118
.0
197
,461
.0
268
,002
.0
309,
132.
00
373,
088.
50
541
,536
.3
636
,901
.3
744
,978
.0
1,
042,
265.
0
1,21
9,36
6.0
1,
147,
628.
0 1
,441
,581
.0
1884
070.
023
6089
6.0
Gov
ernm
ent C
onsu
mpt
ion
Expe
nditu
re 1
1,97
3.0
13,
971.
0 1
7,01
6.0
19,
123.
0 2
5,78
2.0
31,
544.
0 3
4,80
1.00
5
3,14
7.10
6
2,04
4.5
77,
636.
9 9
8,12
1.0
116
,995
.0
174
,599
.0
203
,608
.0
225
,523
.0
2473
62.0
3077
69.0
Inve
stm
ent
24,
902.
0 2
7,40
9.0
35,
952.
0 4
1,22
7.0
60,
156.
0 8
2,56
0.0
102
,403
.00
165
,380
.00
277
,243
.7
295
,456
.4
402
,922
.0
511
,618
.0
585
,665
.0
704
,596
.0
751
,626
.0
9488
66.0
1037
685.
0
Expo
rts 1
2,91
3.6
16,
076.
9 1
8,20
5.4
21,
854.
2 2
8,31
7.0
35,
233.
0 5
2,16
8.00
8
5,94
9.80
1
02,8
87.0
1
08,2
27.1
1
23,4
96.0
1
21,5
32.2
1
22,5
01.0
1
39,8
30.0
1
84,2
82.0
21
3437
.023
9229
.0
Impo
rts 2
7,36
6.8
37,
776.
3 4
8,09
2.4
55,
088.
7 7
6,56
4.0
96,
285.
0 1
26,3
19.0
0 1
62,4
86.8
0 2
36,3
84.7
2
51,3
00.6
3
08,6
91.3
3
93,1
89.0
4
24,7
50.0
4
30,2
33.0
5
02,1
13.0
56
1512
.057
1230
.0
Reso
urce
Bal
ance
-14,
453.
2-2
1,69
9.4
-29,
887.
0-3
3,23
4.4
-48,
247.
0-6
1,05
2.0
(74,
151.
00)
(76,
537.
00)
(133
,498
.0)
(143
,073
.5)
(185
,195
.3)
(271
,656
.0)
(302
,249
.0)
(290
,403
.0)
(317
,831
.0)
-348
075.
0-3
3200
1.0
G
ross
Priv
ate
Con
sum
ptio
n (%
of
GD
P) 7
0.9
77.
3 7
8.7
76.
4 8
0.3
80.
7 8
1.54
7
2.43
7
2.5
73.
5 7
0.2
69.
0 6
7.9
63.
5 7
5.7
94.8
70.0
G
ross
Gov
ernm
ent C
osum
ptio
n (%
of
GD
P) 1
4.0
13.
3 1
3.1
11.
2 1
0.5
9.5
9
.18
10.
32
8.3
9
.0
9.2
9
.0
9.7
1
2.3
10.
2 12
.49.
1
Gro
ss D
omes
tic F
ixed
Inve
stm
ent
(% o
f GD
P) 2
9.0
26.
0 2
7.6
24.
2 2
4.5
24.
9 2
7.01
3
2.11
3
7.1
34.
1 3
8.0
39.
4 3
7.3
38.
4 3
4.1
47.7
30.8
R
esou
rce
Bala
nce
(% o
f GD
P)-1
6.8
-20.
6-2
2.9
-19.
5-1
9.6
-18.
4 (1
9.56
) (1
4.86
) (1
7.9)
(16.
5) (1
7.5)
(20.
9) (1
9.3)
(15.
9) (1
4.4)
(17.
5) (9
.8)
3.2:
Mon
etor
y In
dic
tors
Nar
row
Mon
ey S
uppl
y (M
1) (
In M
n.
Birr
)19
,065
.921
,289
.823
,811
.929
,773
.436
,875
.542
,112
.752
,434
.6 7
6,17
1.00
9
4,84
9.88
11
4,74
5.69
13
4,06
3.78
15
4,70
6.34
17
8,60
9.66
21
6,79
4.60
2
81,1
54.7
0 3
08,9
37.1
3
60,5
85.5
Bro
ad M
oney
Sup
ply
(M2)
( In
Mn.
Birr
)34
,655
.940
,212
.146
,377
.456
,860
.369
,918
.282
,509
.810
4,43
2.4
145
,376
.97
189
,398
.78
235
,313
.59
297
,746
.59
371
,328
.91
445
,266
.25
573
,408
.60
740
,572
.50
886
,752
.5
1,0
37,6
46.3
Net
For
eign
Ass
ets (
In M
n. B
irr )
11,7
66.9
13,8
68.0
12,1
09.6
13,9
27.3
12,1
40.6
17,9
76.8
27,1
89.8
55,
534.
68
39,
787.
69
45,
648.
53
45,
972.
30
37,
570.
95
21,
524.
19
38,
034.
79
39,
376.
20
14,
505.
2 (2
2,10
1.0)
Res
erve
Req
uire
men
t ( C
Bs )
1549
.35
1,82
8.4
2,12
0.9
2,59
2.5
9,11
2.9
11,1
83.3
14,3
68.0
20,
495.
20
18,
080.
56
11,
708.
82
14,
479.
39
18,
250.
35
21,
745.
43
28,
280.
80
36,
385.
80
44,
861.
8 5
1,95
2.6

|III
National Bank of Ethiopia Quarterly BulletinC
ontin
ued…
. Indi
cato
rs20
03/0
420
04/0
520
05/0
620
06/0
720
07/0
820
08/0
920
09/1
020
10/1
1 2
011/
12 2
012/
13 2
013/
14 2
014/
15 2
015/
16 2
016/
1720
17/1
8 2
018/
19 2
019/
20
(199
6)(1
997)
(199
8)(1
999)
(200
0)(2
001)
(200
2)(2
003)
(200
4)(2
005)
(200
6)(2
007)
(200
8)(2
009)
(201
0)(2
011)
(201
2)
Inte
rest
Rat
e ( I
n %
)
Min
imum
Dep
osit
Rate
3
33
44
4.0
4.0
5.0
0 5
.00
5.0
0 5
.00
5.0
0 5
.00
5.0
0 7
.00
7.0
7
.0
Lend
ing
Rate
8.
0-10
.57-
147-
147-
148-
158-
16.5
12.2
5 1
1.88
1
1.88
1
1.88
1
1.88
1
1.88
1
2.75
1
2.75
1
3.50
1
3.5
14.
3
T
otal
Net
Dom
estic
Cre
dit
(in m
n. B
irr)
3113
8.78
140
305.
849
295.
961
585.
080
772.
689
,203
.010
4,41
3.5
135
,553
.87
189
,080
.81
233
,404
.32
300
,026
.58
393
,421
.73
490
,230
.35
631
,092
.70
784
,621
.70
963
,699
.9
1,1
90,7
05.1
Gov
ernm
ent
1919
9.15
421
663.
825
266.
430
290.
234
169.
232
,786
.533
,013
.1 2
8,65
1.65
2
1,55
7.41
2
1,96
5.52
2
6,92
9.74
3
0,73
5.25
4
7,54
8.36
8
5,44
1.85
10
2,00
2.80
109
,799
.2
150
,861
.6
O
ther
Sec
tors
1193
9.62
718
642.
024
029.
631
294.
846
603.
456
,416
.571
,400
.4 1
06,9
02.2
2 1
67,5
23.4
0 2
11,4
38.8
0 2
73,0
96.8
4 3
62,6
86.4
8 4
42,6
81.9
9 54
5,65
0.85
682,
618.
90 8
53,9
00.7
1
,039
,843
.5
3.3:
Ave
rage
ann
ual in
flatio
n ra
te (C
PI g
row
th ra
te)3
Cou
ntry
Lev
el
-G
ener
al in
flatio
n7.
36.
110
.615
.825
.336
.42.
818
.134
.113
.58.
17.
79.
77.
414
.612
.619
.9
-Fo
od in
flatio
n11
.57.
413
.017
.534
.944
.2-5
.415
.742
.912
.65.
97.
411
.27.
213
.413
.123
.3
-Non
-food
infla
tion
(cor
e in
flatio
n)2.
24.
47.
113
.512
.523
.518
.221
.822
.714
.610
.68
8.1
7.5
15.8
11.9
15.8
A
dd
is A
baba
-G
ener
al in
flatio
n5.
67.
28.
419
.220
.829
.410
.119
.424
.812
.68.
57.
610
.32.
316
.514
.618
.8
-Fo
od in
flatio
n8.
65.
713
.025
.432
.141
.54.
114
.830
.613
.14.
612
.216
.61.
28.
715
.025
.9
-Non
-Foo
d in
flatio
n (c
ore
infla
tion)
3.0
7.6
4.6
14.0
12.7
19.2
16.0
23.5
21.1
11.9
11.4
4.4
5.8
3.2
22.6
14.0
13.9
3.4:
Ext
erna
l Tra
de(
In M
n.US
D)
E
xpor
t of g
ood
s & se
rvic
es15
20.6
1895
.821
49.5
2498
.131
27.9
3399
.5 4
,050
.33
5,3
43.1
2 5
,993
.41
5,9
78.4
7 6
,451
.62
6,0
46.5
1 6
,077
.3
6,2
57.2
7
,095
.9
7,6
94.9
7
,715
.7
I
mpo
rt of
goo
ds &
serv
ices
3,2
59.8
4
,439
.6
5,6
02.7
6
,254
.2
8,3
26.9
9
,292
.3
9,8
58.4
0 1
0,16
0.72
1
3,80
5.17
1
3,86
4.19
1
6,19
7.24
1
9,84
2.8
20,
552.
1 1
9,71
4.0
19,
707.
4 2
0,69
1.0
18,
822.
8
N
et tr
ade
in g
ood
s & se
rvic
es-1
,739
.3-2
,543
.8-3
,453
.2-3
,756
.1-5
,199
.0-5
,892
.8-5
,808
.4-4
,817
.6-7
,811
.8-7
,885
.7-9
,745
.6-1
3,79
6.3
-14,
474.
7-1
3,45
6.9
-12,
611.
4-1
2,99
6.1
-11,
107.
1
C
urre
nt a
ccou
nt b
alan
ce in
clud
ing
offic
ial t
rans
fers
-401
.5-7
71.3
-1,4
70.9
-991
.3-1
,492
.4-1
,634
.7-1
,193
.2-2
01.9
-2,7
78.0
-2,7
80.3
-4,1
68.1
-7,4
06.8
-6,6
55.1
-6,5
43.2
-5,2
85.0
-4,9
34.2
-4,3
96.4
C
apita
l acc
ount
bal
ance
386.
749
1.9
614.
376
0.4
1,03
1.5
1648
2,4
21.0
2 2
,995
.93
2,2
83.2
8 3
,291
.23
4,1
34.5
7 7
,816
.92
6,5
54.1
6
,885
.3
6,1
84.6
4
,807
.5
4,1
47.3
O
vera
ll bal
ance
of p
aym
ents
389.
5463
487
66.4
0934
667
3729
.98
-251
.693
9401
18.7
316
.68
1,3
84.2
0 (9
72.7
9)-6
.5-9
6.9
-521
.4-8
30.9
658.
6-2
01.6
-941
.6-1
227.
3
3.5:
Gov
ernm
ent F
inan
ce (I
n M
n .B
irr4)
Tot
al R
even
ue (i
nclu
din
g gr
ants
)17
,918
.020
,147
.023
,225
.029
,381
.039
,705
.040
,421
.9 6
6,23
7.44
8
5,61
1.00
11
5,65
8.50
13
7,19
2.00
15
8,07
6.52
19
9,63
9.11
24
3,67
1.56
26
9,10
5.94
2
87,5
62.1
4 3
44,9
36.5
0 3
94,9
65.8
3
Tot
al R
even
ue (e
xclu
din
g gr
ants
)13
,917
.015
,582
.019
,493
.021
,797
.029
,794
.031
,924
.0 5
3,86
1.34
6
9,12
0.00
10
2,86
3.65
12
4,07
7.00
14
6,17
2.77
18
6,61
8.69
23
0,65
7.28
25
6,62
9.04
2
69,6
48.1
9 3
11,3
17.4
3 3
54,3
12.8
0
o
/w T
ax-R
even
ue10
,906
.012
398.
014
122.
017
354.
023
801.
023
216.
2 4
3,31
5.36
5
8,98
1.00
8
5,73
9.86
10
7,01
0.30
13
3,11
8.26
16
5,31
2.47
18
9,71
7.18
21
0,13
5.85
2
35,2
29.4
8 2
68,4
57.4
1 3
11,4
76.4
6
Tax
-Rev
enue
as %
of G
DP
12.7
11.8
10.8
10.2
9.7
7.0
11.
42
11.
45
11.
47
12.
50
12.
71
15.
09
14.
71
14.
00
12.
26
11.
55
10.
50
Tot
al E
xpen
ditu
res
20,5
20.0
2480
3.0
2932
5.0
3560
7.0
4691
5.0
4387
5.2
71,
334.
79
93,
831.
00
124,
416.
72
153,
929.
00
185,
471.
78
230,
521.
18
272,
930.
09
329,
286.
84
354
,205
.32
413
,105
.72
480
,143
.19
C
urre
nt E
xpen
ditu
res
11,9
77.0
13,2
35.0
15,2
34.0
17,1
65.0
22,7
94.0
2631
5.5
32,
012.
38
40,
535.
00
51,
445.
45
62,
745.
80
78,
086.
90
113,
375.
50
131,
902.
78
176,
703.
00
210
,470
.21
238
,156
.59
275
,967
.04
C
apita
l Exp
end
iture
s8,
271.
011
,343
.014
,042
.018
,398
.024
,121
.017
,559
.7 3
9,32
2.41
5
3,29
7.00
7
2,97
1.26
9
1,18
2.90
10
7,38
4.88
11
7,14
5.68
14
1,02
7.31
15
2,58
3.83
1
43,7
35.1
0 1
74,9
49.1
3 2
04,1
76.1
5
E
quity
Con
tribu
tion
( Sin
king
Fun
d )
S
peci
al P
rogr
ams
272
224.
050
.044
.00.
00.
00.
0 -
- -
T
otal
Exp
end
iture
s as %
of G
DP
23.9
23.5
22.5
20.9
19.1
13.2
18.8
18.
2 1
6.6
18.
1 1
7.7
18.
64
17.
41
17.
97
16.
10
15.
32
14.
23
Cur
rent
Sur
plus
/Defi
cit
1,94
0.0
6,65
2.7
4,25
9.0
4,63
2.0
7,00
0.0
5,60
8.5
34,2
25.1
45,
076.
5 6
4,21
3.0
74,
447.
0 7
9,98
9.6
86,
263.
61
111,
768.
78
92,
402.
94
77,
091.
92
106
,779
.91
118
,998
.78
Ove
rall B
udge
t Defi
cit (
incl
udin
g gr
ants
)-2
,602
.0-4
,655
.0-6
,100
.0-6
226.
0-7
210.
0-3
453.
3-5
,097
.4 (8
,220
.2)
(8,7
58.2
) (1
6,73
6.0)
(27,
395.
3) (3
0,88
2.07
) (2
9,25
8.53
) (6
0,18
0.90
) (6
6,64
3.18
) (6
8,16
9.22
) (8
5,17
7.36
)

IV | Fourth Quarter 2020/21
National Bank of Ethiopia Quarterly BulletinC
ontin
ued…
. Indi
cato
rs20
03/0
420
04/0
520
05/0
620
06/0
720
07/0
820
08/0
920
09/1
020
10/1
1 2
011/
12 2
012/
13 2
013/
14 2
014/
15 2
015/
16 2
016/
1720
17/1
8 2
018/
19 2
019/
20
(199
6)(1
997)
(199
8)(1
999)
(200
0)(2
001)
(200
2)(2
003)
(200
4)(2
005)
(200
6)(2
007)
(200
8)(2
009)
(201
0)(2
011)
(201
2)
Defi
cit a
s % o
f GD
P-3
.0-4
.4-4
.7-3
.7-2
.9-1
.0-1
.3-1
.6-1
.2-2
.0-2
.6 (2
.50)
(1.8
7) (3
.28)
(3.0
3) (2
.53)
(2.5
2)
Ove
rall B
udge
t Defi
cit (
exc
lud
ing
gran
ts )
-6,6
03.0
-9,2
20.0
-9,8
32.0
-13,
810.
0-1
7,12
1.0
-119
51.1
-174
73.5
(24,
711.
5) (2
1,55
3.1)
(29,
851.
0) (3
9,29
9.0)
(43,
902.
49)
(42,
272.
81)
(72,
657.
79)
(84,
557.
13)
(101
,788
.29)
(125
,830
.40)
Defi
cit a
s % o
f GD
P-7
.7-8
.7-7
.5-8
.1-7
.0-3
.6-4
.6-4
.8-2
.9-3
.5-3
.8 (3
.55)
(2.7
0) (3
.96)
(3.8
4) (3
.78)
(3.7
3)
3.6:
Exc
hang
e Ra
te (B
irr/
USD
)
Inte
r-Ban
k Fo
rex
Mar
ket R
ate5
*
Per
iod
wei
ghte
d A
vera
ge8.
635
8.65
28.
681
8.79
49.
244
10.4
205
12.8
909
16.1
178
17.2
536
18.1
947
19.0
748
20.
0956
2
1.10
59
22.
4137
2
6.10
82
28.
0543
3
1.34
27
* En
d p
erio
d8.
630
8.66
08.
.69
9.03
09.
610
11.3
009
13.5
321
16.9
081
17.7
305
18.6
426
19.5
771
20.
5659
2
1.80
04
23.
1081
2
7.26
21
28.
9109
3
4.98
22
3.7:
Tre
asur
y Bi
ll Mar
ket (
In M
n .B
irr)
T-B
ills D
eman
ded
( To
tal )
61,1
43.2
56,8
96.2
60,6
03.5
78,9
22.0
59,8
88.5
46,7
67.2
51,
258.
02
55,
760.
03
77,
194.
80
109,
184.
60
113,
527.
98
136,
536.
80
161,
575.
24
225,
321.
24
323
,991
.24
422
,633
.54
242
,155
.09
T-B
ills S
old
51,6
45.0
41,0
65.0
47,7
93.5
63,3
15.0
47,7
16.5
27,8
39.8
41,
736.
42
52,
316.
03
74,
694.
80
109,
184.
60
95,
314.
98
110,
593.
30
161,
475.
24
225,
321.
24
323
,991
.24
422
,633
.54
242
,155
.09
Ave
rage
Wei
ghte
d Y
ield
(in
%)
0.5
0.09
50.
038
0.53
00.
677
0.74
3 0
.79
1.1
3 1
.87
1.8
9 1
.60
1.4
3 1
.44
1.4
2 1
.42
1.7
4 4
.81
T-B
ills O
utst
and
ing
by h
old
er12
485
6595
1163
8.5
1154
682
39.5
7783
.1 1
1,56
6.20
1
0,70
6.62
2
0,01
1.86
2
6,04
4.90
3
2,28
6.86
4
1,70
4.80
5
7,25
2.56
7
3,27
1.56
1
11,2
13.5
6 1
38,0
54.3
6 2
3,72
4.00
Ban
ks11
418
6295
1061
2.3
9135
2739
1672
4,4
00.0
0 9
00.0
0 2
,383
.50
3,4
36.0
0 -
- -
- -
650
.00
5,6
04.0
0
Non
-Ban
ks10
6730
010
26.2
2411
5500
.561
11.1
7,1
66.2
0 9
,896
.62
17,
628.
40
22,
608.
90
32,
286.
86
41,
704.
80
57,
252.
56
73,
271.
56
111
,213
.56
137
,404
.36
18,
120.
00
3.8:
Inte
r Ban
k M
oney
Mar
ket R
ate5
7.5
_
_
7.5
8.5
_
_
_
_
_
_
_
_
_
- -
3.9:
Fin
anci
al In
stitu
tions
Num
ber o
f Com
mer
cial
Ban
ks9
910
1111
12.
00
14.
00
17.
00
17.
00
17.
00
17.
00
17.
00
17.
00
17.
00
17.
00
17.
00
17.
00
(
o/w
Priv
ate
bank
s )7
78
99
10.
00
12.
00
14.
00
16.
00
16.
00
16.
00
16.
00
16.
00
16.
00
16.
00
16.
00
16.
00
N
umbe
r of B
ank
Bran
ches
358
389
421
487
562
636
.00
681
.00
970
.00
1,2
89.0
0 1
,724
.00
2,2
08.0
0 2
,693
.00
3,3
01.0
0 4
,257
.00
4,7
57.0
0 5
,564
.00
6,5
11.0
0
P
opul
atio
n : B
ank
Bran
ch18
5754
.2:1
1757
78.4
:116
6,27
0.8:
114
8,66
5.3:
113
3,27
4:1
12
0,75
4.7:
1
115,
712.
2:1
83,
195.
9:1
64,
158.
3:1
496
74.8
:1
41,
088
33,
448.
00
27,
932.
00
22,
164.
00
20,
286.
50
17,
732.
20
15,
702.
00
Num
ber o
f In
sura
nce
Com
pani
es9
99
910
12.
00
12.
00
14.
00
15.
00
16.
00
17.
00
17.
00
17.
00
17.
00
17.
00
17.
00
18.
00
(
o/w
Priv
ate
Insu
ranc
e C
ompa
nies
)8
88
89
11.
00
11.
00
13.
00
14.
00
15.
00
16.
00
16.
00
16.
00
16.
00
16.
00
16.
00
17.
00
N
umbe
r of I
nsur
ance
Bra
nche
s12
113
313
914
617
2 1
94.0
0 2
07.0
0 2
21.0
0 2
43.0
0 2
73.0
0 3
32.0
0 3
77
426
4
92.0
0 5
32.0
0 5
68.0
0 6
05.0
0
P
opul
atio
n : I
nsur
ance
Bra
nch
5495
87:1
5135
34:1
5035
97:1
4958
90:1
4354
65:1
395
876:
1 3
8384
4:1
366
063:
1
340
329:
1 3
1442
8.9:
1 2
6491
8.8:
1 2
38,9
28.0
0 2
16,4
43.0
0 1
91,7
72.0
0 1
81,3
96.0
0 1
73,8
48.0
0 1
68,9
83.0
0
Num
ber o
f Dev
elop
men
t Ban
ks1
11
11
1.0
0 1
.00
1.0
0 1
.00
1.0
0 1
.00
1.0
0 1
.00
1.0
0 1
.00
1.0
0 1
.00
Num
ber o
f Dev
elop
men
t Ban
k Br
anch
es32
3232
3232
32.
00
32.
00
32.
00
32.
00
32.
00
32.
00
32
110
1
10.0
0 1
07.0
0 1
07.0
0 9
3.00
Num
ber o
f Mic
ro-fi
nanc
ial I
nstit
utio
ns22
2627
2828
30.
00
30.
00
31.
00
31.
00
31.
00
31.
00
35.
00
35.
00
35.
00
38.
00
38.
00
41.
00
Sour
ce :
Min
istrie
s of A
gric
ultu
re, R
even
ue, H
ealth
, and
Ed
ucat
ion;
Nat
iona
l Ban
k of
Eth
iopi
a; C
ente
ral S
tatis
tical
Aut
horit
y, …
etc
Not
e:-
*pop
ulat
ion
is es
timat
ed u
sing
com
pone
nt m
etho
d a
fter 2
006/
2007
1.
Exc
lud
ing
man
pow
er o
ut si
de
the
Min
istry
of H
ealth
.
2.
The
GD
P d
ata
serie
s is r
evise
d o
n ba
sis o
f 20
10/1
1=10
0 ba
se y
ear
3.
Infl
atio
n d
ata
is c
alcu
late
d u
sing
the
new
bas
e ye
ar (D
ecem
ber 2
011=
100)
4.
Fi
gure
s for
gov
ernm
ent fi
nanc
e ar
e pr
elim
inar
y es
timat
es fr
om 1
999/
00 o
nwar
ds.
5.
In
ter-b
ank
mon
ey m
arke
t was
firs
t int
rod
uced
in A
ug.1
998
and
Inte
r-ban
k fo
rex
mar
ket s
tarte
d a
s of S
epte
mbe
r 199
8, a
nd th
e d
aily
tras
actio
ns in
trod
uced
beg
inni
ng fr
om o
ctob
er 2
4, 2
001.
*Mid
yea
r pop
ulat
ion
was
obt
aine
d fr
om M
oFED
National Bank of Ethiopia Quarterly Bulletin
Third Quarter 2020/21 | 1
I. OVERVIEW
1.1 International Economic Developments
According to the European Central
Bank’s monthly bulletin of 5/2021,
the global economic recovery
momentum remains solid amid
divergent pandemic developments.
Global real GDP growth (excluding
the euro area) increased by 0.9
percent in the third quarter of 2020/21.
The growth momentum is expected
to remain solid in the fourth quarter
as advanced and emerging market
economies continue to reopen
their economies amid divergent
pandemic developments. The global
recovery is also reflected in strong
survey data. The composite output
Purchasing Managers’ Index (PMI)
excluding the euro area rose to a
15-year high in the fourth quarter of
2020/21.
In the United States, the economy
continues to recover strongly. Survey
data showed that manufacturing
and service activity remained at
very high levels in June. At the same
time, supply constraints are creating
headwinds to the recovery, with
a growing backlog of work and
lengthening supplier delivery times.
While the labour market continues
to improve, skill mismatches in some
sectors are leading to labour market
tightness in the near term.
In the United Kingdom, the economy
is rebounding, although rising
COVID-19 cases increasingly pose
downside risks. Monthly GDP growth
in May continues to point to a strong
recovery in the fourth quarter of
2020/21. Similarly, business surveys,
consumer confidence and mobility
trackers signal a strong rise in activity,
particularly in the services sector.
In Japan, the pace of economic
activity has slowed in the
fourth quarter, owing in part to
supply constraints and pandemic
developments. Real GDP growth
is expected to remain weak in the
fourth quarter as a renewed rise
in COVID-19 cases prompted a
tightening of containment measures.

Fourth Quarter 2020/21 | 1
National Bank of Ethiopia Quarterly BulletinNational Bank of Ethiopia Quarterly Bulletin
Third Quarter 2020/21 | 1
I. OVERVIEW
1.1 International Economic Developments
According to the European Central
Bank’s monthly bulletin of 5/2021,
the global economic recovery
momentum remains solid amid
divergent pandemic developments.
Global real GDP growth (excluding
the euro area) increased by 0.9
percent in the third quarter of 2020/21.
The growth momentum is expected
to remain solid in the fourth quarter
as advanced and emerging market
economies continue to reopen
their economies amid divergent
pandemic developments. The global
recovery is also reflected in strong
survey data. The composite output
Purchasing Managers’ Index (PMI)
excluding the euro area rose to a
15-year high in the fourth quarter of
2020/21.
In the United States, the economy
continues to recover strongly. Survey
data showed that manufacturing
and service activity remained at
very high levels in June. At the same
time, supply constraints are creating
headwinds to the recovery, with
a growing backlog of work and
lengthening supplier delivery times.
While the labour market continues
to improve, skill mismatches in some
sectors are leading to labour market
tightness in the near term.
In the United Kingdom, the economy
is rebounding, although rising
COVID-19 cases increasingly pose
downside risks. Monthly GDP growth
in May continues to point to a strong
recovery in the fourth quarter of
2020/21. Similarly, business surveys,
consumer confidence and mobility
trackers signal a strong rise in activity,
particularly in the services sector.
In Japan, the pace of economic
activity has slowed in the
fourth quarter, owing in part to
supply constraints and pandemic
developments. Real GDP growth
is expected to remain weak in the
fourth quarter as a renewed rise
in COVID-19 cases prompted a
tightening of containment measures.

2 | Fourth Quarter 2020/21
National Bank of Ethiopia Quarterly Bulletin
2 | Third Quarter 2020/21
National Bank of Ethiopia Quarterly Bulletin
In China, The recovery is progressing,
while producer price pressures
remain high. Monthly data point
to continuing robust growth during
the fourth quarter of 2020/21,
notwithstanding a dampening in
June. Meanwhile, annual producer
price inflation. stabilised at 8.8
percent in June, which remains close
to the 12-year high of 9.0 percent
recorded in May. As base effects and
the impact of raw commodity prices
fade, producer prices are expected
to normalise.
Global inflation rose further in May,
driven largely by transitory factors.
Annual consumer price inflation in
the countries of the Organisation
for Economic Co-operation and
Development (OECD) increased
to 3.8 percent in May, up from 3.3
percent in April. Higher commodity
prices, pushed up further by base
year effects, contributed significantly
to this development, while supply
bottlenecks and fiscal stimulus
also supported price pressures.
Meanwhile, core inflation (excluding
food and energy) rose to 2.9 percent
in May, compared with 2.4 percent in
the previous month.
Over all, during the fourth quarter
of 2020/21, the global economic
recovery momentum remains solid
while global inflation rose further
in May, driven largely by transitory
factors. Due to the rapid global
economic recovery, oil prices have
increased further since the Governing
Council meeting in June.
I.2. Macroeconomic Developments in Ethiopia
I.2.1. Inflation
Headline inflation went up to 8.2
percent in the fourth quarter of 2020/21,
from 5.5 percent a quarter earlier.
This was attributed to acceleration
in food & non-alcoholic beverages
inflation by 6.6 percentage points,
which offset the 2.5 percentage point
decline in non-food inflation.
National Bank of Ethiopia Quarterly Bulletin
Third Quarter 2020/21 | 3
Likewise, headline inflation scaled up
annually by 0.9 percentage point on
account of a 2.0 percentage point
increase in food & non- alcoholic
beverages inflation while, non-food
inflation, however, declined by 0.5
percentage point. Food & non-
alcoholic beverages and non-food
inflations contributed 6.0 and 2.2
percent to the headline inflation
registered in the review quarter,
respectively.
I.2.2. Monetary Developments
At the end of fourth quarter of 2021,
broad money supply (M2) reached Birr
1.3 trillion exhibiting a 30 percent annual
growth, owing to 25.9 percent growth in
domestic credit and 1.4 percent in other
items (net).
Likewise, reserve money stood at Birr
264.3, billion showing 7.2 percent annual
expansion while excess reserve of
commercial banks can track by 36.9
percent.
I.2.3. Interest rate
Average savings deposit rate
remained at 8.0 percent while
weighted average time deposit rate
witnessed a 0.3 percent decline while
average lending interest rate also
remained unchanged at 14.25 year-
on-year basis. Meanwhile, weighted
average yield on T-bills increased
from 6.6 percent in June 2020 to 9.97
percent in June 2021. Considering the
June, 2021 headline inflation of 24.5
percent, real interest rates on deposit,
lending and T-bills yield remained
negative.

Fourth Quarter 2020/21 | 3
National Bank of Ethiopia Quarterly Bulletin
2 | Third Quarter 2020/21
National Bank of Ethiopia Quarterly Bulletin
In China, The recovery is progressing,
while producer price pressures
remain high. Monthly data point
to continuing robust growth during
the fourth quarter of 2020/21,
notwithstanding a dampening in
June. Meanwhile, annual producer
price inflation. stabilised at 8.8
percent in June, which remains close
to the 12-year high of 9.0 percent
recorded in May. As base effects and
the impact of raw commodity prices
fade, producer prices are expected
to normalise.
Global inflation rose further in May,
driven largely by transitory factors.
Annual consumer price inflation in
the countries of the Organisation
for Economic Co-operation and
Development (OECD) increased
to 3.8 percent in May, up from 3.3
percent in April. Higher commodity
prices, pushed up further by base
year effects, contributed significantly
to this development, while supply
bottlenecks and fiscal stimulus
also supported price pressures.
Meanwhile, core inflation (excluding
food and energy) rose to 2.9 percent
in May, compared with 2.4 percent in
the previous month.
Over all, during the fourth quarter
of 2020/21, the global economic
recovery momentum remains solid
while global inflation rose further
in May, driven largely by transitory
factors. Due to the rapid global
economic recovery, oil prices have
increased further since the Governing
Council meeting in June.
I.2. Macroeconomic Developments in Ethiopia
I.2.1. Inflation
Headline inflation went up to 8.2
percent in the fourth quarter of 2020/21,
from 5.5 percent a quarter earlier.
This was attributed to acceleration
in food & non-alcoholic beverages
inflation by 6.6 percentage points,
which offset the 2.5 percentage point
decline in non-food inflation.
National Bank of Ethiopia Quarterly Bulletin
Third Quarter 2020/21 | 3
Likewise, headline inflation scaled up
annually by 0.9 percentage point on
account of a 2.0 percentage point
increase in food & non- alcoholic
beverages inflation while, non-food
inflation, however, declined by 0.5
percentage point. Food & non-
alcoholic beverages and non-food
inflations contributed 6.0 and 2.2
percent to the headline inflation
registered in the review quarter,
respectively.
I.2.2. Monetary Developments
At the end of fourth quarter of 2021,
broad money supply (M2) reached Birr
1.3 trillion exhibiting a 30 percent annual
growth, owing to 25.9 percent growth in
domestic credit and 1.4 percent in other
items (net).
Likewise, reserve money stood at Birr
264.3, billion showing 7.2 percent annual
expansion while excess reserve of
commercial banks can track by 36.9
percent.
I.2.3. Interest rate
Average savings deposit rate
remained at 8.0 percent while
weighted average time deposit rate
witnessed a 0.3 percent decline while
average lending interest rate also
remained unchanged at 14.25 year-
on-year basis. Meanwhile, weighted
average yield on T-bills increased
from 6.6 percent in June 2020 to 9.97
percent in June 2021. Considering the
June, 2021 headline inflation of 24.5
percent, real interest rates on deposit,
lending and T-bills yield remained
negative.

4 | Fourth Quarter 2020/21
National Bank of Ethiopia Quarterly Bulletin
1.2.4. Financial Sector Developments
a) Banks
The number of banks operating in
Ethiopia reached 19 of which 17
were private and 2 state owned.
These banks have opened 248 new
branches during the review period
thereby raising the total number of
bank branches to 7,344. As a result,
population to bank branch ratio
stood at 13,9211. About 34.5
percent of the total bank branches
were located in Addis Ababa. Of
the total bank branches, the share
of state owned banks was 27.3
percent and that of private banks
72.7 percent.
Total capital of the banking system
amounted to Birr 153.7 billion, of
which state owned banks
accounted for 51.8 percent and
private banks 48.2 percent. The
share of Commercial Bank of
Ethiopia, the biggest state owned
1 Total population is 102,998,000 as CSA Estimation for 2020
bank, in total capital of the banking
system was 32.7 percent.
During the review quarter, Birr 105.9
billion was disbursed in fresh loans,
indicating a 66.2 percent annual
increase. Of the total new loans
disbursed, the share of state owned
banks was 39.8 percent and that of
private banks was 60.2 percent
(Table 4.12).
Of the total new loans, industry took
Birr 27.9 billion (26.4 percent),
followed by international trade Birr
23.6 billion (22.3 percent),
agriculture Birr 14.5 billion (13.7
percent), domestic trade Birr 10.6
billion (10 percent), housing &
construction Birr 9.8 billion (9.2
percent), personal Birr 8.2 billion (7.7
percent). The remaining balance
was taken up by other sectors.
During the review period, the
banking system collected loans
amounting to Birr 67.5 billion. Of the
total loans, 63.5 percent was
collected by private banks and 36.5
percent by state owned banks.
Total outstanding credit of the
banking system (including
corporate bond) reached Birr 1.3
trillion, about 24.3 percent higher
than last year same quarter. About
99.7 percent of the total
outstanding credit of private banks
was claims on the private sector
and 20 percent on state owned
banks.
b) Insurance Sector
The number of insurance
companies stood at 18, of which 17
were private and 1 state owned.
Their branches increased to 635
from 605 a year ago, of which,
about 54.3 percent were located in
Addis Ababa. Likewise, the total
capital of insurance companies
reached Birr 11.1 billion, with private
insurance companies accounting
for 73.6 percent.
c) Microfinance Institutions
In total, 39 micro-finance institutions
(MFIs) were operating in the
country. They mobilized Birr 52.4
billion in saving deposit which grew
by 17.2 percent over last year same
period. Their total outstanding credit
also increased by 6.7 percent to Birr
69.3 billion while their total asset
grew by 13.8 percent to Birr 105
billion.
1.2.5. External Sector and Foreign Exchange Developments
a) External Sector Development
In the fourth quarter of 2020/21,
merchandise export earnings
amounted to USD 1.2 billion showing
24.8 percent annual growth due to
higher export revenue from coffee
(34.9 percent), gold (30.6 percent),
flower (23.4 percent), chat (70.1
percent), leather & leather products
(9.4 percent), meat & meat
products (49.3 percent), fruits &
14,024.81

Fourth Quarter 2020/21 | 5
National Bank of Ethiopia Quarterly Bulletin
collected by private banks and 36.5
percent by state owned banks.
Total outstanding credit of the
banking system (including
corporate bond) reached Birr 1.3
trillion, about 24.3 percent higher
than last year same quarter. About
99.7 percent of the total
outstanding credit of private banks
was claims on the private sector
and 20 percent on state owned
banks.
b) Insurance Sector
The number of insurance
companies stood at 18, of which 17
were private and 1 state owned.
Their branches increased to 635
from 605 a year ago, of which,
about 54.3 percent were located in
Addis Ababa. Likewise, the total
capital of insurance companies
reached Birr 11.1 billion, with private
insurance companies accounting
for 73.6 percent.
c) Microfinance Institutions
In total, 39 micro-finance institutions
(MFIs) were operating in the
country. They mobilized Birr 52.4
billion in saving deposit which grew
by 17.2 percent over last year same
period. Their total outstanding credit
also increased by 6.7 percent to Birr
69.3 billion while their total asset
grew by 13.8 percent to Birr 105
billion.
1.2.5. External Sector and Foreign Exchange Developments
a) External Sector Development
In the fourth quarter of 2020/21,
merchandise export earnings
amounted to USD 1.2 billion showing
24.8 percent annual growth due to
higher export revenue from coffee
(34.9 percent), gold (30.6 percent),
flower (23.4 percent), chat (70.1
percent), leather & leather products
(9.4 percent), meat & meat
products (49.3 percent), fruits &

6 | Fourth Quarter 2020/21
National Bank of Ethiopia Quarterly Bulletin
Fourth Quarter 2020/21 3
vegetables (47.2 percent), live-
animals (0.9 percent), textile & textile
products (26.6 percent), electricity
(19.8 percent) and other export
items (59.7 percent).
On the other hand, receipts from
oilseeds and pulses tended to
decline by 30.6 percent and 3.3
percent, respectively.
Likewise, merchandise import bill at
USD 3.9 billion depicted a 45.5
percent annual surge import of
capital goods increased 31.8
percent, fuel 94.5 percent,
consumer goods 89.2 percent,
miscellaneous goods 20.3 percent
and franco-valuta 125.3 percent.
Imports of Semi-finished goods and
raw materials, however, have
dropped.
During the review period, current
account receipts amounted to USD
4.5 billion, about 19.5 percent higher
than a year earlier. This was due to a
rise in receipts from merchandise
proceeds (24.8 percent), service
proceeds (32 percent) and private
transfers (49.2 percent) despite a
64.2 percent decrease in public
transfers.
Meanwhile, total current payments
increased by 47.1 percent and
reached USD 5.4 billion on account
of higher merchandise import (45.5
percent), services payment (48
percent) and private transfers (26.1
percent) and public transfers (292.5
percent).
Hence, current account balance
(including official transfer) has shifted
from USD 76.7 million in surplus to a
USD 926.6 million in deficits.
On the other hand, capital account
balance registered USD 1,851.7
million in surplus, about 50.6 percent
higher than that of a year earlier.
Consequently, the overall balance
of payments registered USD 933.5
million in surplus compared to USD
659.5 million surplus a year earlier.
b) Exchange Rate Development
During the fourth quarter of 2020/21,
the weighted average official
exchange rate of the Birr showed a
25.6 percent annual depreciation
and reached Birr 42.5284/USD while
real effective exchange rate index
(REERI) depreciated by 5.1 percent.
NEERI, however, appreciated by
80.1 percent during the same
quarter.
1.2.6. Federal Government Fiscal Operations
Total revenue and grants collected
by the Federal government during
the fourth quarter of 2020/21
declined by 8.5 percent to Birr 73.8
billion while its total expenditure
increased by 3.2 percent to Birr
121.0 billion compared to a year
ago. As a result, the overall fiscal
deficit (including grants) reached
Birr 47.1 billion during the review
quarter.
1.2.7. Investment During the fourth quarter of 2020/21,
22 investment projects having
investment capital of Birr 752.7
million became operational.
Compared to last year same
quarter, the number of investment
projects showed no progress while
investment capitals move up by
242.2 percent.

Fourth Quarter 2020/21 | 7
National Bank of Ethiopia Quarterly Bulletin
Fourth Quarter 2020/21 3
vegetables (47.2 percent), live-
animals (0.9 percent), textile & textile
products (26.6 percent), electricity
(19.8 percent) and other export
items (59.7 percent).
On the other hand, receipts from
oilseeds and pulses tended to
decline by 30.6 percent and 3.3
percent, respectively.
Likewise, merchandise import bill at
USD 3.9 billion depicted a 45.5
percent annual surge import of
capital goods increased 31.8
percent, fuel 94.5 percent,
consumer goods 89.2 percent,
miscellaneous goods 20.3 percent
and franco-valuta 125.3 percent.
Imports of Semi-finished goods and
raw materials, however, have
dropped.
During the review period, current
account receipts amounted to USD
4.5 billion, about 19.5 percent higher
than a year earlier. This was due to a
rise in receipts from merchandise
proceeds (24.8 percent), service
proceeds (32 percent) and private
transfers (49.2 percent) despite a
64.2 percent decrease in public
transfers.
Meanwhile, total current payments
increased by 47.1 percent and
reached USD 5.4 billion on account
of higher merchandise import (45.5
percent), services payment (48
percent) and private transfers (26.1
percent) and public transfers (292.5
percent).
Hence, current account balance
(including official transfer) has shifted
from USD 76.7 million in surplus to a
USD 926.6 million in deficits.
On the other hand, capital account
balance registered USD 1,851.7
million in surplus, about 50.6 percent
higher than that of a year earlier.
Consequently, the overall balance
of payments registered USD 933.5
million in surplus compared to USD
659.5 million surplus a year earlier.
b) Exchange Rate Development
During the fourth quarter of 2020/21,
the weighted average official
exchange rate of the Birr showed a
25.6 percent annual depreciation
and reached Birr 42.5284/USD while
real effective exchange rate index
(REERI) depreciated by 5.1 percent.
NEERI, however, appreciated by
80.1 percent during the same
quarter.
1.2.6. Federal Government Fiscal Operations
Total revenue and grants collected
by the Federal government during
the fourth quarter of 2020/21
declined by 8.5 percent to Birr 73.8
billion while its total expenditure
increased by 3.2 percent to Birr
121.0 billion compared to a year
ago. As a result, the overall fiscal
deficit (including grants) reached
Birr 47.1 billion during the review
quarter.
1.2.7. Investment During the fourth quarter of 2020/21,
22 investment projects having
investment capital of Birr 752.7
million became operational.
Compared to last year same
quarter, the number of investment
projects showed no progress while
investment capitals move up by
242.2 percent.

8 | Fourth Quarter 2020/21
National Bank of Ethiopia Quarterly Bulletin
II. ENERGY PRODUCTION AND PROCESSING
2.1. Import of Petroleum Products The volume of petroleum products
imported during the fourth quarter
of 2020/21 was about 943.1
thousand metric tons, and showed
a 6.2 percent annual growth owing
to the increase in import of all
petroleum product despite a 1
percent decrease in import of gas
oil.
The share of gas oil in total
petroleum import was 67.5 percent
while that of regular gasoline and
jet fuel constituted 18.7 and 11.3
percent, respectively (Table 2.1).
Table 2.1: Volume of Petroleum Products Imported
(In Metric Ton)
Petroleum Products
2019/20 2020/21 Percentage
Change Qtr. IV Qtr. III Qtr. IV
A Share (In %) B
Share (In %) C
Share (In %) C/A C/B
Regular Gasoline (MGR)
142,182.9 16.0 154,240.3 16.1 176,255.2 18.7 24.0 14.3
Jet Fuel 84,127.5 9.5 129,945.4 13.5 106,927.1 11.3 27.1 -17.7
Fuel Oil 18,390.9 2.1 21,352.4 2.2 23,310.8 2.5 26.8 9.2
Gas Oil (ADO) 643,282.9 72.4 654,442.0 68.2 636,567.6 67.5 -1.0 -2.7
Total 887,984.1 100 959,980.1 100 943,060.7 100 6.2 -1.8
Source: Ethiopian Petroleum Enterprise
Fig.2.1: Trends in the Volume of Petroleum Products Imported
-
100,000
200,000
300,000
400,000
500,000
600,000
700,000
800,000
I II III IV I II III IV I II III IV I II III IV I II III IV
2016/17 2017/18 2018/19 2019/20 2020/21
In M
etri
c T
on
Quarter
MGR
Jet Fuel
Fuel Oil
Gas Oil
Source: Ethiopian Petroleum Enterprise
Total petroleum import value stood
at Birr 24.3 billion, about 142.9
percent higher than last year same
quarter. This was in response to an
increase in both international oil
price and volume of petroleum
imports. All types of petroleum
products registered increment in
their import bill during the review
quarter (Table 2.2).
Table 2.2: Value of Petroleum Products Imported (In ‘000Birr)
Petroleum
Products
2019/20 2020/21 Percentage Change Qtr. IV Qtr. III Qtr. IV
A Share (In %) B
Share (In %) C
Share (In %) C/A C/B
Regular Gasoline
(MGR) 1,764,786.0 17.7 3,901,026.5 18.8 5,313,499.7 21.9 201.1 36.2
Jet Fuel 955,056.6 9.6 2,712,282.7 13.0 2,721,997.7 11.2 185.0 0.4
Fuel Oil 175,453.4 1.8 394,447.7 1.9 481,336.1 2.0 174.3 22.0
Gas Oil (ADO)
7,093,675.5 71.0 13,795,483.3 66.3 15,751,059.8 64.9 122.0 14.2
Total 9,988,971.5 100 20,803,240.2 100 24,267,893.2 100 142.9 16.7
PetroleumProducts
2019/20 2020/21 Percentage ChangeQtr. IV Qtr. III Qtr. IV
AShare (In %) B
Share (In %) C
Share (In %) C/A C/B
Regular Gasoline (MGR) 142,182.9 16.0 154,240.3 16.1 176,255.2 18.7 24.0 14.3
Jet Fuel 84,127.5 9.5 129,945.4 13.5 106,927.1 11.3 27.1 -17.7
Fuel Oil 18,390.9 2.1 21,352.4 2.2 23,310.8 2.5 26.8 9.2
Gas Oil (ADO) 643,282.9 72.4 654,442.0 68.2 636,567.6 67.5 -1.0 -2.7
Total 887,584.1 100 959,980.1 100 943,060.7 100 6.2 -1.8
(In Metric Ton)
Source: Ethiopian Petroleum Enterpris

Fourth Quarter 2020/21 | 9
National Bank of Ethiopia Quarterly Bulletin
II. ENERGY PRODUCTION AND PROCESSING
2.1. Import of Petroleum Products The volume of petroleum products
imported during the fourth quarter
of 2020/21 was about 943.1
thousand metric tons, and showed
a 6.2 percent annual growth owing
to the increase in import of all
petroleum product despite a 1
percent decrease in import of gas
oil.
The share of gas oil in total
petroleum import was 67.5 percent
while that of regular gasoline and
jet fuel constituted 18.7 and 11.3
percent, respectively (Table 2.1).
Table 2.1: Volume of Petroleum Products Imported
(In Metric Ton)
Petroleum Products
2019/20 2020/21 Percentage
Change Qtr. IV Qtr. III Qtr. IV
A Share (In %) B
Share (In %) C
Share (In %) C/A C/B
Regular Gasoline (MGR)
142,182.9 16.0 154,240.3 16.1 176,255.2 18.7 24.0 14.3
Jet Fuel 84,127.5 9.5 129,945.4 13.5 106,927.1 11.3 27.1 -17.7
Fuel Oil 18,390.9 2.1 21,352.4 2.2 23,310.8 2.5 26.8 9.2
Gas Oil (ADO) 643,282.9 72.4 654,442.0 68.2 636,567.6 67.5 -1.0 -2.7
Total 887,984.1 100 959,980.1 100 943,060.7 100 6.2 -1.8
Source: Ethiopian Petroleum Enterprise
II. ENERGY PRODUCTION AND PROCESSING
2.1. Import of Petroleum Products The volume of petroleum products
imported during the fourth quarter
of 2020/21 was about 943.1
thousand metric tons, and showed
a 6.2 percent annual growth owing
to the increase in import of all
petroleum product despite a 1
percent decrease in import of gas
oil.
The share of gas oil in total
petroleum import was 67.5 percent
while that of regular gasoline and
jet fuel constituted 18.7 and 11.3
percent, respectively (Table 2.1).
Table 2.1: Volume of Petroleum Products Imported
(In Metric Ton)
Petroleum Products
2019/20 2020/21 Percentage
Change Qtr. IV Qtr. III Qtr. IV
A Share (In %) B
Share (In %) C
Share (In %) C/A C/B
Regular Gasoline (MGR)
142,182.9 16.0 154,240.3 16.1 176,255.2 18.7 24.0 14.3
Jet Fuel 84,127.5 9.5 129,945.4 13.5 106,927.1 11.3 27.1 -17.7
Fuel Oil 18,390.9 2.1 21,352.4 2.2 23,310.8 2.5 26.8 9.2
Gas Oil (ADO) 643,282.9 72.4 654,442.0 68.2 636,567.6 67.5 -1.0 -2.7
Total 887,984.1 100 959,980.1 100 943,060.7 100 6.2 -1.8
Source: Ethiopian Petroleum Enterprise
Fig.2.1: Trends in the Volume of Petroleum Products Imported
-
100,000
200,000
300,000
400,000
500,000
600,000
700,000
800,000
I II III IV I II III IV I II III IV I II III IV I II III IV
2016/17 2017/18 2018/19 2019/20 2020/21
In M
etri
c T
on
Quarter
MGR
Jet Fuel
Fuel Oil
Gas Oil
Source: Ethiopian Petroleum Enterprise
Total petroleum import value stood
at Birr 24.3 billion, about 142.9
percent higher than last year same
quarter. This was in response to an
increase in both international oil
price and volume of petroleum
imports. All types of petroleum
products registered increment in
their import bill during the review
quarter (Table 2.2).
Table 2.2: Value of Petroleum Products Imported (In ‘000Birr)
Petroleum
Products
2019/20 2020/21 Percentage Change Qtr. IV Qtr. III Qtr. IV
A Share (In %) B
Share (In %) C
Share (In %) C/A C/B
Regular Gasoline
(MGR) 1,764,786.0 17.7 3,901,026.5 18.8 5,313,499.7 21.9 201.1 36.2
Jet Fuel 955,056.6 9.6 2,712,282.7 13.0 2,721,997.7 11.2 185.0 0.4
Fuel Oil 175,453.4 1.8 394,447.7 1.9 481,336.1 2.0 174.3 22.0
Gas Oil (ADO)
7,093,675.5 71.0 13,795,483.3 66.3 15,751,059.8 64.9 122.0 14.2
Total 9,988,971.5 100 20,803,240.2 100 24,267,893.2 100 142.9 16.7
PetroleumProducts
2019/20 2020/21 PercentageChangeQtr. IV Qtr. III Qtr. IV
AShare (In %) B
Share (In %) C
Share (In %) C/A C/B
Regular Gasoline (MGR) 1,764,786.0 17.7 3,901,026.5 18.8 5,313,499.7 21.9 201.1 36.2
Jet Fuel 955,056.6 9.6 2,712,282.7 13.0 2,721,997.7 11.2 185.0 0.4Fuel Oil 175,453.4 1.8 394,447.7 1.9 481,336.1 2.0 174.3 22.0
Gas Oil (ADO) 7,093,675.5 71.0 13,795,483.3 66.3 15,751,059.8 64.9 122.0 14.2Total 9,988,971.5 100.0 20,803,240.2 100.0 24,267,893.2 100 142.9 16.7
Table 2.2: Value of Petroleum Products Imported(In ‘000Birr)
Source: Ethiopian Petroleum Enterprise

10 | Fourth Quarter 2020/21
National Bank of Ethiopia Quarterly Bulletin
Source: Ethiopian Petroleum Enterprise Fig.2.2: Trends in the Value of Petroleum Products Imported
02000000400000060000008000000
1000000012000000140000001600000018000000
I II III IV I II III IV I II III IV I II III IV I II III IV
2016/17 2017/18 2018/19 2019/20 2020/21
In '0
00 B
irr
Quarter
MGR
Jet Fuel
Fuel Oil
Gas Oil
Source: Ethiopian Petroleum Enterprise
Average FOB price of petroleum
products surged 135.1 percent over
the same period of last year due to
higher FOB price of all types of
petroleum products.
Likewise, average FOB price of
petroleum products increased by
12.9 percent vis-a-vis the preceding
quarter (Table 2.3).
Table 2.3: FOB Price of Petroleum Products Imported
(In USD/ Metric Ton)
Petroleum Products
2019/20 2020/21 Percentage Change Qtr. IV Qtr. III Qtr. IV
A B C C/A C/B Regular Gasoline
(MGR) 380.9 555.7 639.2 67.8 15.0
Jet Fuel 104.4 486.0 556.7 433.0 14.5
Fuel Oil 164.2 349.9 376.8 129.4 7.7
Gas Oil (ADO) 248.4 477.5 538.3 116.7 12.7
Average 224.5 467.3 527.8 135.1 12.9
Brent Crude Oil (USD/Barrel)
29.3 60.82 68.83 134.6 13.2
Source: Ethiopian Petroleum Enterprise
Fig.2.3: Trends in the FOB Price of Imported Petroleum Products
0100200300400500600700800900
1000
I II III IV I II III IV I II III IV I II III IV I II III IV
2016/17 2017/18 2018/19 2019/20 2020/21
USD
per
Met
ric T
on
Quarter
MGR
Jet Fuel
Fuel Oil
Gas Oil
Source: Ethiopian Petroleum Enterprise
Similarly, average price of Brent
crude oil, which is used as a point of
reference for international oil price,
hiked by 134.6 percent and
reached USD 68.8 per barrel
compared with USD 29.3 a year
ago. Likewise, compared to the
preceding quarter, it has increased
by 13.2 percent (Table 2.3).
Average retail price of fuel in Addis
Ababa during the review period
rose 43.2 percent to Birr 32.81 per
liter from Birr 22.91 on account of
higher retail prices of all petroleum
products (Table 2.4).
Petroleum Products2019/20 2020/21 Percentage ChangeQtr. IV Qtr. III Qtr. IV
A B C C/A C/B
Regular Gasoline (MGR) 380.9 555.7 639.2 67.8 15.0Jet Fuel 104.4 486.0 556.7 433.0 14.5Fuel Oil 164.2 349.9 376.8 129.4 7.7
Gas Oil (ADO) 248.4 477.5 538.3 116.7 12.7Average 224.5 467.3 527.8 135.1 12.9
Brent Crude Oil (USD/Barrel) 29.3 60.82 68.83 134.6 13.2
Source: Ethiopian Petroleum Enterprise
Table 2.3: FOB Price of Petroleum Products Imported (In USD/ Metric Ton)

Fourth Quarter 2020/21 | 11
National Bank of Ethiopia Quarterly Bulletin
Fig.2.3: Trends in the FOB Price of Imported Petroleum Products
0100200300400500600700800900
1000
I II III IV I II III IV I II III IV I II III IV I II III IV
2016/17 2017/18 2018/19 2019/20 2020/21
USD
per
Met
ric T
on
Quarter
MGR
Jet Fuel
Fuel Oil
Gas Oil
Source: Ethiopian Petroleum Enterprise
Similarly, average price of Brent
crude oil, which is used as a point of
reference for international oil price,
hiked by 134.6 percent and
reached USD 68.8 per barrel
compared with USD 29.3 a year
ago. Likewise, compared to the
preceding quarter, it has increased
by 13.2 percent (Table 2.3).
Average retail price of fuel in Addis
Ababa during the review period
rose 43.2 percent to Birr 32.81 per
liter from Birr 22.91 on account of
higher retail prices of all petroleum
products (Table 2.4).

12 | Fourth Quarter 2020/21
National Bank of Ethiopia Quarterly Bulletin
Table2.4: Addis Ababa Average Retail Prices of Fuel Birr/Liter)
Petroleum Products
2019/20 2020/21 Percentage Change Qtr. IV Qtr. III Qtr. IV
A B C C/A C/B Regular Gasoline (MGR)
21.53 25.12 25.86 20.1 3.0
Fuel Oil 32.91 37.96 40.05 21.7 5.5
Gas Oil (ADO) 18.75 22.42 23.18 23.6 3.4
Kerosene 18.75 22.42 23.18 23.6 3.4
Jet fuel 22.62 35.51 51.76 128.8 45.8
Average 22.91 28.68 32.81 43.18 14.37
Source: Ministry of Trade Fig.2.4: Trends of Addis Ababa Average Retail Prices
0.00
10.00
20.00
30.00
40.00
50.00
60.00
I II III IV I II III IV I II III IV I II III IV I II III IV
2016/17 2017/18 2018/19 2019/20 2020/21
MGR Fuel Oil Gas Oil Kerosene Jet Fuel
Source: Ministry of Trade
2.2. Electric Power Generation
Total electric power generated
during the quarter under review
went up by 6.5 percent annually
and 9.1 percent quarterly to 4 billion
KWH (Table 2.5). On account of
higher power production from
hydropower sources (Table 2.5).

Fourth Quarter 2020/21 | 13
National Bank of Ethiopia Quarterly Bulletin
2.2. Electric Power Generation
Total electric power generated during the quarter under review dropped 4.9 percent on annual and 2.4 percent quarter basis and reached 3.7 billion KWH (Table 2.5). The year- on-year decrease
was attributed to 4.7 percent decline in electric production from hydropower and 69.4 percent from biomass sources (table 2.5).
Table 2.5: Electricity Generation by Sources (In ‘000 of K.W.H)
Power Source
2019/20 2020/21Percentage ChangeQtr. IV Qtr. III Qtr. IV
A Share (In %) B Share
(In %) C Share (In %) C/A C/B
Hydropower 3,632,638.5 96.2 3,476,666.2 94.4 3,901,015.3 97.0 7.4 12.2
Thermal Power - - - - - - - -
Geothermal - - - - - - - -
Wind 111,301.5 2.9 191,319.9 5.2 105,800.0 2.6 -4.7 -44.7
Biomass 32,217.6 0.9 16,309.90 0.4 13,677.50 0.3 -57.5 -16.1
Total 3,775,887.5 100 3,684,296.0 100 4,020,492.8 100 6.5 9.1
Source: Ethiopian Electric Power
Of the total energy generated, 94.4 percent was from hydropower, 5.2 percent from wind and 0.4 percent from biomass sources (Table 2.5).
By system of generation, virtually all the power was generated through interconnected systems (ICS)1(Table 2.6).
2The generated power from different power stations stored in substations before distribution.

14 | Fourth Quarter 2020/21
National Bank of Ethiopia Quarterly Bulletin
Fig.2.5: Volume of Electricity Production by Type
010000002000000300000040000005000000
2016
/17Q
1Q
2Q
3Q
420
17/1
8Q1
QII
QIII
QIV
2018
/19Q
1Q
IIQ
IIIQ
IV20
19/2
0 Q
IQ
IIQ
IIIQ
IV20
20/2
1 Q
IQ
IIQ
IIIQ
IV
Thou
sand
kw
h
Quarter
Hydropower Thermal Power Geo- thermal Wind Biomass
Source: Ethiopian Electric Power
III. QUARTERLY PRICE DEVELOPMENTS
3.1 Developments in National CPI
Headline inflation increased to 8.2
percent from 5.5 percent a quarter
earlier and 7.3 percent inflation last
year same quarter. The rise in
quarterly and annual headline
inflation was attributed to
acceleration in food & non-alcoholic
beverages inflation. While non-food
inflation declined Food & non-
alcoholic beverages and non-food
inflations contributed 6.0 and 2.2
percent, respectively, to the headline
inflation in the review quarter (Table
3.1 and Fig 3.1).
In the review quarter, food & non-
alcoholic beverages inflation surged
to 10.9 percent from 4.3 percent in
the previous quarter, owing to higher
price inflation of oils & fats, meat,
bread & cereals, food products
n.e.c, non-alcoholic beverages, milk,
cheese & egg and vegetables (Table
3.2).
In contrast, non-food inflation
decreased to 4.7 percent from 7.2
percent a quarter earlier and 5.2
percent last year same quarter
mainly due to slowdown in inflation
for transport, housing, water,
electricity, gas & fuel, and alcoholic
beverage & tobacco (Table 3.3).
Table 2.6: Generation of electricity power in the interconnected system (ICS) and self-contained system (SCS)
System ofPower supply
2019/20 2020/21 PercentageShareQtr. IV Qtr. III Qtr. IV
AShare(in %)
BShare(in %)
CShare(In %)
C/A C/B
ICSHydro power 3,632,638.5 96.2 3,476,666.2 94.4 3,901,015.3 97.0 7.4 12.2ThermalPower - - - - - - - -Geothermal - - - - - - - -Wind 111,031.5 2.9 191,319.9 5.2 105,800.0 2.6 -4.7 -44.7Biomass 32,217.6 0.9 16,309.9 0.4 13,677.5 0.3 -57.5 -16.1Sub-Total 3,775,887.5 100 3,684,296.0 100 4,020,492.8 100 6.5 9.1SCSHydro power - - - - - - - -ThermalPower - - - - - - - -Geothermal - - - - - - - -Wind - - - - - - - -Sub-Total - - - - - - - -Grand Total 3,775,887.5 100 3,684,296.0 100.0 4,020,492.8 100 6.5 9.1
Source: Ethiopian Electric Power

Fourth Quarter 2020/21 | 15
National Bank of Ethiopia Quarterly Bulletin
III. QUARTERLY PRICE DEVELOPMENTS
3.1 Developments in National CPI
Headline inflation increased to 8.2
percent from 5.5 percent a quarter
earlier and 7.3 percent inflation last
year same quarter. The rise in
quarterly and annual headline
inflation was attributed to
acceleration in food & non-alcoholic
beverages inflation. While non-food
inflation declined Food & non-
alcoholic beverages and non-food
inflations contributed 6.0 and 2.2
percent, respectively, to the headline
inflation in the review quarter (Table
3.1 and Fig 3.1).
In the review quarter, food & non-
alcoholic beverages inflation surged
to 10.9 percent from 4.3 percent in
the previous quarter, owing to higher
price inflation of oils & fats, meat,
bread & cereals, food products
n.e.c, non-alcoholic beverages, milk,
cheese & egg and vegetables (Table
3.2).
In contrast, non-food inflation
decreased to 4.7 percent from 7.2
percent a quarter earlier and 5.2
percent last year same quarter
mainly due to slowdown in inflation
for transport, housing, water,
electricity, gas & fuel, and alcoholic
beverage & tobacco (Table 3.3).

16 | Fourth Quarter 2020/21
National Bank of Ethiopia Quarterly Bulletin
Source: CSA
Table 3.1: Quarterly National General Consumer Prices (%) (Dec2016=100)
2019/20
2020/21
Change in %age Points
Contributions in (%) to
Weights in %
QIV QIII QIV
A B C C-A C-B
Headline
Inflation Change
over QIV-
2019/20
Headline
Inflation Change
Over QIII-
2020/21
QIV-2020/21 Headline Inflation
Absolute
Relative
Headline
100 7.3 5.5 8.2 0.9 2.7 0.9 2.7 8.2 100 Food & Non-alcoholic beverage
54 8.9 4.3 10.9
2.0 6.6 1.1 3.6 6.0 73.1
Non-food
46 5.2 7.2 4.7 -0.5 -2.5 -0.2 -1.2 2.2 26.9
Source: CSA and NBE Staff Computation
-4.0
-2.0
0.0
2.0
4.0
6.0
8.0
10.0
12.0
14.0
16.0
QIII
QIV Q
I
QII
QIII
QIV Q
I
QII
QIII
QIV Q
I
QII
QIII
QIV
2018/19 2019/20 2020/21
Perc
ent
Headline Food & Non-alcoholic bevarages Bread & Cereals Non-Food
Fig 3.1 Quarterly Movement in National Inflation
Source: NBE Staff Computation
Table 3.2: Quarterly National Food & non-alcoholic beverages CPI Inflation (Dec2016=100)
Items Weights
2019/20
2020/21 Change in %age points Contribution to
QIV QIII QIV
A B C C-A C-B
Food Inflation Change
over QIV-2019/20(%
)
Food Inflation Change
over QIII-2020/21(%)
Food and Non-alcoholic Beverages
0.54 8.9 4.3 10.9 2.0 6.6 1.1 3.5
Bread and Cereals 0.17 10.3 4.4 13.6 3.3 9.2 0.6 1.6Meat 0.04 5.8 2.2 12.5 6.7 10.3 0.3 0.4Fish and Sea food 0.00 13.3 6.5 2.0 -11.3 -4.5 0.0 0.0Milk, cheese and egg 0.03 3.6 11.2 13.1 9.5 1.9 0.3 0.1Oils & Fats 0.04 5.0 8.5 21.5 16.4 12.9 0.7 0.6Fruit 0.00 -0.4 7.0 4.7 5.1 -2.3 0.0 0.0Vegetables 0.12 10.4 4.8 5.1 -5.2 0.4 -0.6 0.0Sugar jam, honey, chocolate
0.01 2.2 3.3 2.0 -0.2 -1.4 0.0 0.0Food products n.e.c 0.06 10.2 1.6 10.1 -0.1 8.5 0.0 0.5Non-alcoholic beverages
0.05 8.1 -0.2 7.2 -1.0 7.4 0.0 0.4Source: CSA and NBE Staff Computation
Table 3.1: Quarterly National General Consumer Prices (%) (Dec2016=100)2019/20 2020/21 Change in
%age Points Contributions in (%) to
Weights (in %)
QIV QIII QIV
A B C C-A C-B
HeadlineInflation
Change overQIV-2019/20
HeadlineInflation
Change OverQIII-2020/21
QIII-2020/21Headline Inflation
Absolute RelativeHeadline 100 7.3 5.5 8.2 0.9 2.7 0.9 2.7 8.2 100Food& Non-alcoholicbeverage
54 8.9 4.3 10.9 2.0 6.6 1.1 3.6 6.0 73.1
Non-food 46 5.2 7.2 4.7 -0.5 -2.5 -0.2 -1.2 2.2 26.9Source: CSA and NBE Staff Computation

Fourth Quarter 2020/21 | 17
National Bank of Ethiopia Quarterly Bulletin
Source: NBE Staff Computation
Table 3.2: Quarterly National Food & non-alcoholic beverages CPI Inflation (Dec2016=100)
Items Weights
2019/20
2020/21 Change in %age points Contribution to
QIV QIII QIV
A B C C-A C-B
Food Inflation Change
over QIV-2019/20(%
)
Food Inflation Change
over QIII-2020/21(%)
Food and Non-alcoholic Beverages
0.54 8.9 4.3 10.9 2.0 6.6 1.1 3.5
Bread and Cereals 0.17 10.3 4.4 13.6 3.3 9.2 0.6 1.6Meat 0.04 5.8 2.2 12.5 6.7 10.3 0.3 0.4Fish and Sea food 0.00 13.3 6.5 2.0 -11.3 -4.5 0.0 0.0Milk, cheese and egg 0.03 3.6 11.2 13.1 9.5 1.9 0.3 0.1Oils & Fats 0.04 5.0 8.5 21.5 16.4 12.9 0.7 0.6Fruit 0.00 -0.4 7.0 4.7 5.1 -2.3 0.0 0.0Vegetables 0.12 10.4 4.8 5.1 -5.2 0.4 -0.6 0.0Sugar jam, honey, chocolate
0.01 2.2 3.3 2.0 -0.2 -1.4 0.0 0.0Food products n.e.c 0.06 10.2 1.6 10.1 -0.1 8.5 0.0 0.5Non-alcoholic beverages
0.05 8.1 -0.2 7.2 -1.0 7.4 0.0 0.4Source: CSA and NBE Staff Computation
Table 3.2: Quarterly National Food & non-alcoholic beverages CPI Inflation (Dec2016=100)
Items Weights
2019/20 2020/21 Change in%age points Contribution to
QIV QIII QIV
A B C C-A C-B
FoodInflationChange
over QIV-(%)2019/20
FoodInflationChange
over QIII-(%)2020/21
Food and Non-alcoholicBeverages 0.54 8.9 4.3 10.9 2.0 6.6 1.1 3.5
Bread and Cereals 0.17 10.3 4.4 13.6 3.3 9.2 0.6 1.6Meat 0.04 5.8 2.2 12.5 6.7 10.3 0.3 0.4Fish and Sea food 0.00 13.3 6.5 2.0 -11.3 -4.5 0.0 0.0Milk, cheese and egg 0.03 3.6 11.2 13.1 9.5 1.9 0.3 0.1Oils & Fats 0.04 5.0 8.5 21.5 16.4 12.9 0.7 0.6Fruit 0.00 -0.4 7.0 4.7 5.1 -2.3 0.0 0.0Vegetables 0.12 10.4 4.8 5.1 -5.2 0.4 -0.6 0.0Sugar jam, honey, chocolate 0.01 2.2 3.3 2.0 -0.2 -1.4 0.0 0.0Food products n.e.c 0.06 10.2 1.6 10.1 -0.1 8.5 0.0 0.5Non-alcoholic beverages 0.05 8.1 -0.2 7.2 -1.0 7.4 0.0 0.4
Source: CSA and NBE Staff Computation
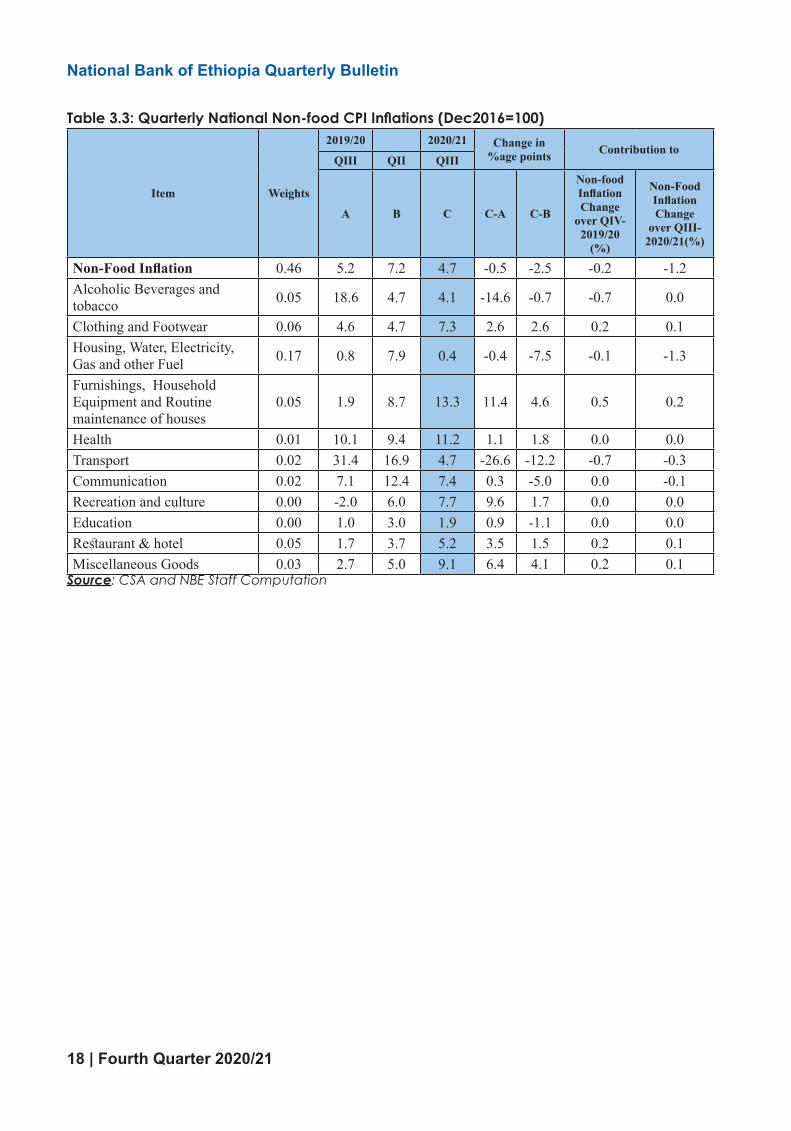
18 | Fourth Quarter 2020/21
National Bank of Ethiopia Quarterly Bulletin
Table 3.3: Quarterly National Non-food CPI Inflations (Dec2016=100)
Item Weights
2019/20 2020/21 Change in%age points Contribution to
QIII QII QIII
A B C C-A C-B
Non-food Inflation Changeover QIV- 2019/20
(%)
Non-Food Inflation Change
over QIII-2020/21(%)
Non-Food Inflation 0.46 5.2 7.2 4.7 -0.5 -2.5 -0.2 -1.2 Alcoholic Beverages andtobacco 0.05 18.6 4.7 4.1 -14.6 -0.7 -0.7 0.0
Clothing and Footwear 0.06 4.6 4.7 7.3 2.6 2.6 0.2 0.1 Housing, Water, Electricity, Gas and other Fuel 0.17 0.8 7.9 0.4 -0.4 -7.5 -0.1 -1.3
Furnishings, Household Equipment and Routinemaintenance of houses
0.05 1.9 8.7 13.3 11.4 4.6 0.5 0.2
Health 0.01 10.1 9.4 11.2 1.1 1.8 0.0 0.0 Transport 0.02 31.4 16.9 4.7 -26.6 -12.2 -0.7 -0.3Communication 0.02 7.1 12.4 7.4 0.3 -5.0 0.0 -0.1Recreation and culture 0.00 -2.0 6.0 7.7 9.6 1.7 0.0 0.0Education 0.00 1.0 3.0 1.9 0.9 -1.1 0.0 0.0Restaurant & hotel 0.05 1.7 3.7 5.2 3.5 1.5 0.2 0.1Miscellaneous Goods 0.03 2.7 5.0 9.1 6.4 4.1 0.2 0.1
Source: CSA and NBE Staff Computation
4 | Third Quarter 2020/21
National Bank of Ethiopia Quarterly Bulletin
3.2 Developments in Regional CPI
Regional average headline inflation
scaled up to 7.5 percent from 3.8
percent in the preceding quarter and
6.9 percent last year same quarter.
SNNP, Somali, Afar, Addis Ababa and
Oromia registered higher headline
inflation than the regional average.
The highest headline inflation (12.0
percent) was registered in SNNP while
the lowest headline inflation (4.8
percent) was in Gambella. Hence,
the margin between the highest
and lowest headline inflation was 7.2
percentage points. The deviation in
the regional headline inflation from
the average, as signified by standard
deviation, increased to 3.4 percent
from 2.6 percent in the preceding
quarter and 3.3 percent last year
same quarter (Table 3.4)
The regional average food & non-
alcoholic beverage inflation increased
to 10.1 percent from 3.6 percent in the
preceding quarter and 8.8 percent
last year same quarter. Food & non-
alcoholic be verages inflation in SNNP,
Afar, Addis Abab, Somali, Oromia, and
Harari was higher than the regional
average. The highest food & non-
alcoholic beverages inflation was seen
in SNNP (16.7 percent) and the lowest
in Gambella (7.1 percent), showing a
9.6 percentage point margin. Hence,
the variation in food & non-alcoholic
beverages inflation, measured by
standard deviation increased to 4.7
percent in from 3.3 percent a quarter
earlier and 4.3 percent last year same
quarter (Table 3.4).
Likewise, the regional average non-
food inflation slightly rose to 4.5 percent
from 4.2 percent in the previous
quarter while it declined from 4.8
percent last year same quarter. Somali,
Benshangul Gumuz, Addis Ababa,
SNNP and Amhara recorded higher
non-food inflation than the regional
average. Non-food inflation was the
highest in Somali (10.0 percent) and
the lowest in Gambella (1.3 percent)
with a 8.7 percentage point margin.
The variation in non-food inflation,
measured by the standard deviation,
decreased to 2.8 percent from 3.4
percent in the previous quarter and
3.0 percent last year same quarter.

Fourth Quarter 2020/21 | 19
National Bank of Ethiopia Quarterly Bulletin
4 | Third Quarter 2020/21
National Bank of Ethiopia Quarterly Bulletin
3.2 Developments in Regional CPI
Regional average headline inflation
scaled up to 7.5 percent from 3.8
percent in the preceding quarter and
6.9 percent last year same quarter.
SNNP, Somali, Afar, Addis Ababa and
Oromia registered higher headline
inflation than the regional average.
The highest headline inflation (12.0
percent) was registered in SNNP while
the lowest headline inflation (4.8
percent) was in Gambella. Hence,
the margin between the highest
and lowest headline inflation was 7.2
percentage points. The deviation in
the regional headline inflation from
the average, as signified by standard
deviation, increased to 3.4 percent
from 2.6 percent in the preceding
quarter and 3.3 percent last year
same quarter (Table 3.4)
The regional average food & non-
alcoholic beverage inflation increased
to 10.1 percent from 3.6 percent in the
preceding quarter and 8.8 percent
last year same quarter. Food & non-
alcoholic be verages inflation in SNNP,
Afar, Addis Abab, Somali, Oromia, and
Harari was higher than the regional
average. The highest food & non-
alcoholic beverages inflation was seen
in SNNP (16.7 percent) and the lowest
in Gambella (7.1 percent), showing a
9.6 percentage point margin. Hence,
the variation in food & non-alcoholic
beverages inflation, measured by
standard deviation increased to 4.7
percent in from 3.3 percent a quarter
earlier and 4.3 percent last year same
quarter (Table 3.4).
Likewise, the regional average non-
food inflation slightly rose to 4.5 percent
from 4.2 percent in the previous
quarter while it declined from 4.8
percent last year same quarter. Somali,
Benshangul Gumuz, Addis Ababa,
SNNP and Amhara recorded higher
non-food inflation than the regional
average. Non-food inflation was the
highest in Somali (10.0 percent) and
the lowest in Gambella (1.3 percent)
with a 8.7 percentage point margin.
The variation in non-food inflation,
measured by the standard deviation,
decreased to 2.8 percent from 3.4
percent in the previous quarter and
3.0 percent last year same quarter.
.

20 | Fourth Quarter 2020/21
National Bank of Ethiopia Quarterly BulletinTa
ble
3.4:
Qua
rterly
Reg
iona
l Gen
eral
, Foo
d &
non-
alco
holic
bev
erag
es a
nd N
on-fo
od In
flatio
n
Reg
ions
2019
/20
2020
/21
Ann
ual C
hang
eQ
uart
erly
Cha
nge
QIV
QII
IQ
IVA
BC
C-A
C-B
General
Foo
d&
Non
- a
lcoh
olic
beve
rage
s
Non-food
General
Foo
d&
Non
- a
lcoh
olic
beve
rage
s
Non-food
General
Foo
d&
Non
- a
lcoh
olic
beve
rage
s
Non-food
General
Foo
d&
Non
- a
lcoh
olic
beve
rage
s
Non-food
General
Foo
d&
Non
- a
lcoh
olic
beve
rage
s
Non-food
SNN
P10
.812
.58.
76.
94.
610
.112
.016
.75.
61.
24.
2-3
.15.
112
.1-4
.5H
arar
i6.
78.
65.
31.
40.
42.
26.
511
.03.
1-0
.22.
3-2
.25.
110
.60.
9O
rom
ia7.
19.
24.
16.
74.
99.
58.
411
.34.
11.
32.
2-0
.11.
76.
5-5
.5Ti
gray
--
--
--
--
--
--
--
-G
ambe
lla11
.213
.97.
76.
36.
75.
84.
87.
11.
3-6
.5-6
.7-6
.4-1
.50.
5-4
.5
Add
is A
baba
9.3
11.0
7.9
4.3
3.6
4.8
9.6
13.9
6.0
0.3
2.9
-1.8
5.3
10.3
1.3
Dire
Daw
a9.
212
.06.
53.
65.
61.
55.
88.
52.
9-3
.4-3
.6-3
.62.
22.
91.
3
Ben
shan
gul.
Gum
uz7.
610
.44.
80.
2-1
.31.
87.
37.
57.
1-0
.3-2
.92.
37.
18.
85.
3
Som
ali
3.5
1.8
5.6
6.6
9.5
3.3
11.6
12.8
10.0
8.1
11.1
4.4
5.0
3.4
6.7
Afa
r5.
010
.1-0
.43.
15.
00.
910
.015
.03.
95.
04.
94.
36.
910
.03.
1A
mha
ra5.
57.
62.
93.
30.
76.
66.
37.
45.
10.
9-0
.32.
13.
16.
7-1
.6
Reg
ions
Ave
rage
6.9
8.8
4.8
3.8
3.6
4.2
7.5
10.1
4.5
Stan
dard
dev
iatio
n3.
34.
33.
02.
63.
33.
43.
44.
72.
8
Coe
ffici
ent o
fva
riat
ion
0.5
0.5
0.6
0.7
0.9
0.8
0.5
0.5
0.6
Sou
rce:
CSA
and
NBE
Sta
ff C
ompu
tatio
n
National Bank of Ethiopia Quarterly Bulletin
23 Fourth Quarter (2020/21)
4.1 MONETARY DEVELOPMENTS
4.1. Money Supply and Credit
Broad money supply (M2) stood at
Birr 1.3 trillion, exhibiting a 30 percent
annual expansion as a result of 25.9
percent growth of domestic credit
and 1.4 increases in other items
(net).
Table 4.1: Factors Influencing Broad Money (In Millions of Birr)
Particulars Qtr. IV Qtr. III Qtr. IV
Percentage Change
Contributions of Each
Component to Broad Money growth
(June. 20) (March. 21) (June. 21)
C/A C/B Annual A B C
1. External Assets (net)
(8,321.3)
(27,372.9)
(812.3) -90.2 97.0 2.4
2. Domestic Credit
1,176,926.4
1,373,546.7
1,481,844.4 25.9 7.9 98.2
. Claims on Central Gov't (net)
137,082.9 163,476.9
214,269.2 56.3 31.1 24.8
. Claims on Non-Central Gov't
1,039,843.5
1,210,069.8
1,267,575.3 21.9 4.8 54.8
. Financial Institutions 58,142.7 56,642.7 56,642.7 -2.6 0.0 -0.5
. Others 981,700.8 1,153,427.0 1,210,932.6 23.4 5.0 73.8
3. Other Items (net) 130,957.8 86,563.5 132,765.0 1.4 53.4 0.6
4. Broad Money (M2) 1,037,646.3 1,259,610.3 1,348,266.1 29.9 7.0 100.0
Source: Staff Computation, NBE

Fourth Quarter 2020/21 | 21
National Bank of Ethiopia Quarterly Bulletin National Bank of Ethiopia Quarterly Bulletin
23 Fourth Quarter (2020/21)
4.1 MONETARY DEVELOPMENTS
4.1. Money Supply and Credit
Broad money supply (M2) stood at
Birr 1.3 trillion, exhibiting a 30 percent
annual expansion as a result of 25.9
percent growth of domestic credit
and 1.4 increases in other items
(net).
Table 4.1: Factors Influencing Broad Money (In Millions of Birr)
Particulars Qtr. IV Qtr. III Qtr. IV
Percentage Change
Contributions of Each
Component to Broad Money growth
(June. 20) (March. 21) (June. 21)
C/A C/B Annual A B C
1. External Assets (net)
(8,321.3)
(27,372.9)
(812.3) -90.2 97.0 2.4
2. Domestic Credit
1,176,926.4
1,373,546.7
1,481,844.4 25.9 7.9 98.2
. Claims on Central Gov't (net)
137,082.9 163,476.9
214,269.2 56.3 31.1 24.8
. Claims on Non-Central Gov't
1,039,843.5
1,210,069.8
1,267,575.3 21.9 4.8 54.8
. Financial Institutions 58,142.7 56,642.7 56,642.7 -2.6 0.0 -0.5
. Others 981,700.8 1,153,427.0 1,210,932.6 23.4 5.0 73.8
3. Other Items (net) 130,957.8 86,563.5 132,765.0 1.4 53.4 0.6
4. Broad Money (M2) 1,037,646.3 1,259,610.3 1,348,266.1 29.9 7.0 100.0
Source: Staff Computation, NBE
Table 4.1: Factors Influencing Broad Money)In Millions of Birr(
Particulars Qtr. IV Qtr. III Qtr. IV PercentageChange
Contributions of Each Component to Broad Money
growth (June. 20) (March. 21) (June. 21)
C/A C/B Annual A B C
1. External Assets (net) (8,321.3) (27,372.9) (812.3) -90.2 97.0 2.4
2. Domestic Credit 1,176,926.4 1,373,546.7 1,481,844.4 25.9 7.9 98.2
. Claims on Central Gov't )net( 137,082.9 163,476.9 214,269.2 56.3 31.1 24.8
. Claims on Non-Central Gov't 1,039,843.5 1,210,069.8 1,267,575.3 21.9 4.8 54.8
. Financial Institutions 58,142.7 56,642.7 56,642.7 -2.6 0.0 -0.5 . Others 981,700.8 1,153,427.0 1,210,932.6 23.4 5.0 73.83. Other Items (net) 130,957.8 86,563.5 132,765.0 1.4 53.4 0.64. Broad Money (M2) 1,037,646.3 1,259,610.3 1,348,266.1 29.9 7.0 100.0
Source: Staff Computation, NBE

22 | Fourth Quarter 2020/21
National Bank of Ethiopia Quarterly Bulletin
22 Fourth Quarter 2020/21
Fig IV.1: Major Determinants of Monetary Expansion
(Quarterly Change in Percent)
Source: Staff Computation, NBE
-200.0
-150.0
-100.0
-50.0
0.0
50.0
100.0
-30.0
-20.0
-10.0
0.0
10.0
20.0
30.0
40.0
50.0
60.0
Net Foreign A
ssets (NFA
) (in percent)
Oth
er th
an N
FA
Broad Money Domestic Credit Other Items Net Net Foreign Assets
Fourth Quarter 2020/21 23
Fig IV.2: Composition of Domestic Credit
(Quarterly Change in Percent)
Source: Staff computation, NBE
Component wise, quasi-money supply
showed 34.5 percent annual and 8.4
percent quarterly growth as
commercial banks continued to
expand their service outreach,
currency demonetization and cash
withdrawal limit set by the NBE which
helped commercial banks to mobilize
deposits.
Similarly, narrow money supply
exhibited a 21.3 percent annual year-
on-year, 4.3 percent quarter-on-
quarter expansion. On annual bases,
narrow money contributed 24.7
percent and quasi money 75.3
percent to the broad money growth
(Table 4.2).
-20.0
-10.0
0.0
10.0
20.0
30.0
40.0
Domestic Credit Credit to Non-Central Government Credit to Central Government
Fig.IV.1: Major Determinants of Monetary Expansion
(Quarterly Change in Percent

Fourth Quarter 2020/21 | 23
National Bank of Ethiopia Quarterly Bulletin
Fourth Quarter 2020/21 23
Fig IV.2: Composition of Domestic Credit
(Quarterly Change in Percent)
Source: Staff computation, NBE
Component wise, quasi-money supply
showed 34.5 percent annual and 8.4
percent quarterly growth as
commercial banks continued to
expand their service outreach,
currency demonetization and cash
withdrawal limit set by the NBE which
helped commercial banks to mobilize
deposits.
Similarly, narrow money supply
exhibited a 21.3 percent annual year-
on-year, 4.3 percent quarter-on-
quarter expansion. On annual bases,
narrow money contributed 24.7
percent and quasi money 75.3
percent to the broad money growth
(Table 4.2).
-20.0
-10.0
0.0
10.0
20.0
30.0
40.0
Domestic Credit Credit to Non-Central Government Credit to Central Government
Fig.IV.2: Composition of Domestic Credit
(Quarterly Change in Percent
Component wise, quasi-money
supply showed 34.5 percent annual
and 8.4 percent quarterly growth
as commercial banks continued
to expand their service outreach,
currency demonetization and cash
withdrawal limit set by the NBE which
helped commercial banks to mobilize
deposits.
Similarly, narrow money supply
exhibited a 21.3 percent annual
year-on-year, 4.3 percent quarter-
on-quarter expansion. On annual
bases, narrow money contributed
24.7 percent and quasi money 75.3
percent to the broad money growth
(Table 4.2).

24 | Fourth Quarter 2020/21
National Bank of Ethiopia Quarterly Bulletin
25
Fig. IV. 3: Composition of Monetary Stock
In Billions of Birr
Bir
r)
0.0100.0200.0300.0400.0500.0600.0700.0800.0900.0
In B
illion
s of B
irr
Time Dep. Currency Outside Banks Demand Dep.(net) Saving Dep.
Table 4.2: Components of Broad Money (In millions of Birr, unless specified)
Particulars Qtr. IV Qtr. III Qtr. IV PercentageChange
Contributions ofEach Componentto Broad Money
growth
(June. 20) (March. 21) (June. 21)C/A C/B Annual A B C
1. Narrow Money Supply 360,585.5 419,347.7 437,392.0 21.3 4.3 24.7 . Currency outside banks 109,071.8 127,518.3 133,621.3 22.5 4.8 7.9 . Demand Deposits (net) 251,513.7 291,829.4 303,770.7 20.8 4.1 16.82. Quasi-Money 677,060.8 840,262.6 910,874.2 34.5 8.4 75.3 . Savings Deposits 589,174.1 748,589.6 816,380.3 38.6 9.1 73.1 . Time Deposits 87,886.8 91,673.0 94,493.8 7.5 3.1 2.13. Broad Money Supply 1,037,646.3 1,259,610.3 1,348,266.1 29.9 7.0 100.0Source: Staff Computation, NBE
Fig. IV. 3: Composition of Monetary Stock In Billions of Birr
26
4.2. Developments in Reserve Money and Monetary Ratio
Reserve money reached Birr 264.3
billion in showing a 7.2 percent yearly
expansion and 0.8 percent quarterly
contraction. On the other hand,
excess reserve of commercial banks
contracted of 36.9 percent on annual
and 22.5 percent quarterly basis
(Table 4.3).
The money multiplier, measured by
the ratio of broad money to reserve
money, increased to 5.1 from 4.2 a
year ago. The multiplier measured by
the ratio of narrow money to reserve
money also showed a slight increment
during the same period.
Table 4.3: Monetary Aggregates and Ratios
(In millions of Birr unless otherwise indicated)
Particulars Qtr. IV Qtr. III Qtr. IV Percentage Change (June. 20) (March. 21) (June. 21)
A B C C/A C/B 1. Reserve Requirement (CB's) 51,952.6 61,208.0 67,732.4 30.4 10.7 2. Actual Reserve (CB's) 105,289.1 104,642.4 101,384.0 -3.7 -3.1 3. Excess Reserve (CB's) 53,336.5 43,434.3 33,651.6 -36.9 -22.5
4. Reserve Money 246,545.4 266,479.7 264,301.8 7.2 -0.8 . Currency in Circulation 140,521.1 159,484.8 163,709.1 16.5 2.6 . Banks deposits at NBE 106,024.2 106,994.9 100,592.8 -5.1 -6.0 5. Money Multiplier (Ratio): . Narrow Money to Reserve Money 1.5 1.6 1.7 13.2 5.2 . Broad Money to Reserve Money 4.2 4.7 5.1 21.2 7.9 6. Other Monetary Ratios (%): . Currency to Narrow Money 39.0 38.0 37.4 -4.0 -1.6 . Currency to Broad Money 13.5 12.7 12.1 -10.3 -4.1 . Narrow Money to Broad Money 34.8 33.3 32.4 -6.6 -2.6 . Quasi Money to Broad Money 65.2 66.7 67.6 3.5 1.3
Source: Staff Computation, NBE

Fourth Quarter 2020/21 | 25
National Bank of Ethiopia Quarterly Bulletin
25
Fig. IV. 3: Composition of Monetary Stock
In Billions of Birr
Bir
r)
0.0100.0200.0300.0400.0500.0600.0700.0800.0900.0
In B
illion
s of B
irr
Time Dep. Currency Outside Banks Demand Dep.(net) Saving Dep.
26
4.2. Developments in Reserve Money and Monetary Ratio
Reserve money reached Birr 264.3
billion in showing a 7.2 percent yearly
expansion and 0.8 percent quarterly
contraction. On the other hand,
excess reserve of commercial banks
contracted of 36.9 percent on annual
and 22.5 percent quarterly basis
(Table 4.3).
The money multiplier, measured by
the ratio of broad money to reserve
money, increased to 5.1 from 4.2 a
year ago. The multiplier measured by
the ratio of narrow money to reserve
money also showed a slight increment
during the same period.
Table 4.3: Monetary Aggregates and Ratios
(In millions of Birr unless otherwise indicated)
Particulars Qtr. IV Qtr. III Qtr. IV Percentage Change (June. 20) (March. 21) (June. 21)
A B C C/A C/B 1. Reserve Requirement (CB's) 51,952.6 61,208.0 67,732.4 30.4 10.7 2. Actual Reserve (CB's) 105,289.1 104,642.4 101,384.0 -3.7 -3.1 3. Excess Reserve (CB's) 53,336.5 43,434.3 33,651.6 -36.9 -22.5
4. Reserve Money 246,545.4 266,479.7 264,301.8 7.2 -0.8 . Currency in Circulation 140,521.1 159,484.8 163,709.1 16.5 2.6 . Banks deposits at NBE 106,024.2 106,994.9 100,592.8 -5.1 -6.0 5. Money Multiplier (Ratio): . Narrow Money to Reserve Money 1.5 1.6 1.7 13.2 5.2 . Broad Money to Reserve Money 4.2 4.7 5.1 21.2 7.9 6. Other Monetary Ratios (%): . Currency to Narrow Money 39.0 38.0 37.4 -4.0 -1.6 . Currency to Broad Money 13.5 12.7 12.1 -10.3 -4.1 . Narrow Money to Broad Money 34.8 33.3 32.4 -6.6 -2.6 . Quasi Money to Broad Money 65.2 66.7 67.6 3.5 1.3
Source: Staff Computation, NBE
Table 4.3: Monetary Aggregates and Ratios(In millions of Birr unless otherwise indicated)
ParticularsQtr. IV Qtr. III Qtr. IV Percentage
Change(June. 20) (March. 21) (June. 21)A B C C/A C/B
1. Reserve Requirement (CB's) 51,952.6 61,208.0 67,732.4 30.4 10.72. Actual Reserve (CB's) 105,289.1 104,642.4 101,384.0 -3.7 -3.13. Excess Reserve (CB's) 53,336.5 43,434.3 33,651.6 -36.9 -22.54. Reserve Money 246,545.4 266,479.7 264,301.8 7.2 -0.8 . Currency in Circulation 140,521.1 159,484.8 163,709.1 16.5 2.6 . Banks deposits at NBE 106,024.2 106,994.9 100,592.8 -5.1 -6.05. Money Multiplier (Ratio): . Narrow Money to Reserve Money 1.5 1.6 1.7 13.2 5.2 . Broad Money to Reserve Money 4.2 4.7 5.1 21.2 7.96. Other Monetary Ratios (%): . Currency to Narrow Money 39.0 38.0 37.4 -4.0 -1.6 . Currency to Broad Money 13.5 12.7 12.1 -10.3 -4.1 . Narrow Money to Broad Money 34.8 33.3 32.4 -6.6 -2.6 . Quasi Money to Broad Money 65.2 66.7 67.6 3.5 1.3
Source: Staff Computation, NBE

26 | Fourth Quarter 2020/21
National Bank of Ethiopia Quarterly Bulletin
27
Fig. IV.4: Quarterly Growth of Reserve Money and Its Components
(Quarterly Change in Percent)
Source: Staff Computation NBE
Figure IV.5: Monetary Aggregates
0
20
40
60
80
100
120
140
In Bil
lions
of Bi
rr
Required Reserve Actual Reserve Excess Reserve
(In Billions of Birr)
Source: Staff Computation NBE
-30
-20
-10
0
10
20
30
40
50
60
QI
QII
QIII
QIV Q
I
QII
QIII
QIV Q
I
QII
QIII
QIV Q
I
QII
QIII
QIV
2017/18 2018/19 2019/20 2020/21
Perc
enta
ge C
hang
es
Reserve Money Currency in Circulation Bank Deposits
27
Fig. IV.4: Quarterly Growth of Reserve Money and Its Components
(Quarterly Change in Percent)
Source: Staff Computation NBE
Figure IV.5: Monetary Aggregates
0
20
40
60
80
100
120
140
In Bil
lions
of Bi
rr
Required Reserve Actual Reserve Excess Reserve
(In Billions of Birr)
Source: Staff Computation NBE
-30
-20
-10
0
10
20
30
40
50
60Q
I
QII
QIII
QIV Q
I
QII
QIII
QIV Q
I
QII
QIII
QIV Q
I
QII
QIII
QIV
2017/18 2018/19 2019/20 2020/21
Perc
enta
ge C
hang
es
Reserve Money Currency in Circulation Bank Deposits
0
20
40
60
80
100
120
140
In Bil
lions
of Bi
rr
Required Reserve Actual Reserve Excess Reserve
Fig.IV.5: Monetary Aggregates(In Billions of Birr)

Fourth Quarter 2020/21 | 27
National Bank of Ethiopia Quarterly Bulletin
27
Fig. IV.4: Quarterly Growth of Reserve Money and Its Components
(Quarterly Change in Percent)
Source: Staff Computation NBE
Figure IV.5: Monetary Aggregates
0
20
40
60
80
100
120
140
In Bil
lions
of Bi
rr
Required Reserve Actual Reserve Excess Reserve
(In Billions of Birr)
Source: Staff Computation NBE
-30
-20
-10
0
10
20
30
40
50
60
QI
QII
QIII
QIV Q
I
QII
QIII
QIV Q
I
QII
QIII
QIV Q
I
QII
QIII
QIV
2017/18 2018/19 2019/20 2020/21
Perc
enta
ge C
hang
es
Reserve Money Currency in Circulation Bank Deposits
4.3. Interest Rate Developments
Average savings deposit rate and lending rate remained at 8.0 percent and 14.25 percent, respectively while weighted average time deposit rate witnessed minor decline on annual basis. In contrast, the yield on T-bills significantly improved following the introduction of market based T-bills auction. Thus, weighted average yield
on T-bills increased from 6.6 percent in June 2020 to 9.97 percent in June 2021. Yet, considering the June, 2021 headline inflation of 24.5 percent, real interest rates on deposit, lending and T-bill yield remained negative (Table 4.4).
Table 4.4: Interest Rate Structure of Commercial Banks (Percent per annum)
Particulars2019/20 2020/21 Percentage point Changes
QIV QIII QIV Annual Quarterly
1. Savings Deposit Rate 1/Minimum 7.00 7.00 7.00 - -Maximum 9.00 9.00 9.00 - -Average Saving Rate 8.00 8.00 8.00 - -2. Time DepositsUp to 1yr 8.02 7.69 7.75 (0.27) 0.06years 1-2 8.07 7.74 7.81 (0.26) 0.07Over 2 years 8.11 7.79 7.83 (0.28) 0.04Average Time Dep. Rate (Weighted) 8.07 7.74 7.80 (0.27) 0.063. Demand Deposit (Weighted) 0.04 0.04 0.04 0.00 -4. Lending Rate 2/Minimum 7.00 7.00 7.00 - -Maximum 21.50 21.50 21.50 - -Average Lending Rate 14.25 14.25 14.25 - -5. T-bills Rate (Weighted) 6.60 8.17 9.97 3.37 1.816. GERD Bond Yield 3/ 6.1 Maturity within 5 Years 7.50 7.50 7.50 - - 6.1 Maturity above 5 Years 8.00 8.00 8.00 - -7. Headline Inflation (Year-on-year) 21.7 20.6 24.5 2.80 3.908. Food Inflation (Year-on-year) 23.0 22.1 19.0 (4.00) (3.10)9. Core/non-food Inflation (Year-on-year) 19.7 18.9 28.7 9.00 9.80
1/ Minimum interest rate on saving deposit is set by NBE, whereas the maximum indicates the highest rate some banks are paying voluntarily.
2/ NBE does not control lending rates. Hence, the minimum & maximum rates presented here are market determined.
3/ GERD stands for Grand Ethiopian Renaissance Dam.
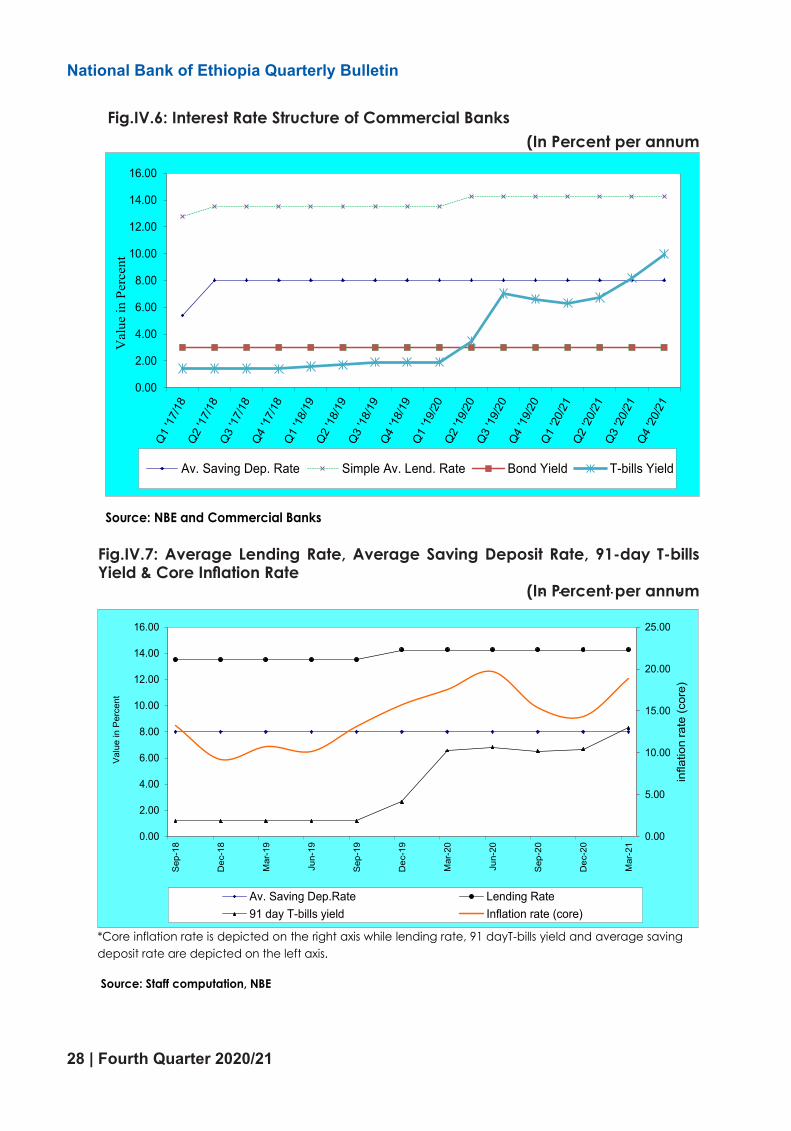
28 | Fourth Quarter 2020/21
National Bank of Ethiopia Quarterly Bulletin
29 Fourth Quarter 2020/21
1/ Minimum interest rate on saving deposit is set by NBE, whereas the maximum indicates the highest rate some banks are paying voluntarily.
2/ NBE does not control lending rates. Hence, the minimum & maximum rates presented here are market determined.
3/ GERD stands for Grand Ethiopian Renaissance Dam.
Fig IV.6: Interest Rate Structure of Commercial Banks (In percent per annum)
Source: NBE and Commercial Banks
0.00
2.00
4.00
6.00
8.00
10.00
12.00
14.00
16.00
Val
ue in
Per
cent
Av. Saving Dep. Rate Simple Av. Lend. Rate Bond Yield T-bills Yield
30 Fourth Quarter 2020/21
Fig IV.7: Average Lending Rate, Average Saving Deposit Rate, 91-day T-bills Yield & Core Inflation Rate
(In percent per annum)
*Core inflation rate is depicted on the right axis while lending rate, 91 dayT-bills yield and average saving deposit rate are depicted on the left axis.
Source: Staff computation, NBE
4.4. Developments in the Financial Sector
By the end of fourth quarter 2020/21,
there were 19 banks, of which 17 were
private and 2 state owned. About 248
new bank branches were opened
during the review period, thereby
raising the number of bank branches
to 7,344. As a result, population to
bank branch ratio reached 13,9213.
3 Total population is 102,998,000 as CSA Estimation for 2020
About 34.5 percent of the total bank
branches were located in Addis
Ababa. Of the total bank branches,
the share of state owned banks was
27.3 percent while private banks took
72.7 percent share (Table 4.5).
Total capital of the banking system
reached Birr 153.7 billion, of which
state owned banks accounted for
51.8 percent and private banks 48.2
percent. The share of Commercial
0.00
5.00
10.00
15.00
20.00
25.00
0.00
2.00
4.00
6.00
8.00
10.00
12.00
14.00
16.00
Sep
-18
Dec
-18
Mar
-19
Jun-
19
Sep
-19
Dec
-19
Mar
-20
Jun-
20
Sep
-20
Dec
-20
Mar
-21
infla
tion
rate
(cor
e)
Val
ue in
Per
cent
Av. Saving Dep.Rate Lending Rate91 day T-bills yield Inflation rate (core)
Fig.IV.6: Interest Rate Structure of Commercial Banks(In Percent per annum
Fig.IV.7: Average Lending Rate, Average Saving Deposit Rate, 91-day T-bills Yield & Core Inflation Rate
(In Percent per annum

Fourth Quarter 2020/21 | 29
National Bank of Ethiopia Quarterly Bulletin
4.4. Developments in the Financial Sector
By the end of fourth quarter 2020/21, there were 19 banks, of which 17 were private and 2 state owned. About 248 new bank branches were opened during the review period, thereby raising the number of bank branches to 7,344. As a result, population to bank branch ratio reached 14,024.83 . About 34.5 percent of the total bank branches were located in Addis Ababa. Of the total bank branches, the share of state owned banks was 27.3 percent while private banks took 72.7 percent share (Table 4.5).
Total capital of the banking system reached Birr 153.7 billion, of which state owned banks accounted for 51.8 percent and private banks 48.2 percent. The share of Commercial Bank of Ethiopia (CBE) in total capital of the banking system was 32.7 percent (Table 4.5).
The number of insurance companies stood at 18, of which 17 were private and 1 state owned. Their branch network increased to 635 from 605 a year ago. Of
the total branches, about 54.3 percent were situated in Addis Ababa.
Total capital of insurance companies rose to Birr 11.1 billion from Birr 9.7 billion a year ago. Private insurance companies accounted for 73.6 percent of the total capital of the insurance sector (Table 4.6).
During the review quarter, there were 39 micro-finance institutions (MFIs) which have mobilized close to Birr 52.4 billion in saving deposit, depicting 17.2 percent annual growth. Their outstanding credit went up by 6.7 percent to Birr 69.3 Billion. Their total asset also exhibited 13.8 percent annual increase to Birr 105 billion and their capital showing a 43.4 percent growth to Birr 27.9 billion (Table 4.7).
The top five largest MFIs namely, Amhara, Dedebit, Oromia, Omo & Addis Credit and Savings Institutions accounted for 84.8 percent of the total capital, 88.8 percent of total deposit, 82.7 percent of total credit and 84.3 percent of total assets of MFIs.
30 Fourth Quarter 2020/21
Fig IV.7: Average Lending Rate, Average Saving Deposit Rate, 91-day T-bills Yield & Core Inflation Rate
(In percent per annum)
*Core inflation rate is depicted on the right axis while lending rate, 91 dayT-bills yield and average saving deposit rate are depicted on the left axis.
Source: Staff computation, NBE
4.4. Developments in the Financial Sector
By the end of fourth quarter 2020/21,
there were 19 banks, of which 17 were
private and 2 state owned. About 248
new bank branches were opened
during the review period, thereby
raising the number of bank branches
to 7,344. As a result, population to
bank branch ratio reached 13,9213.
3 Total population is 102,998,000 as CSA Estimation for 2020
About 34.5 percent of the total bank
branches were located in Addis
Ababa. Of the total bank branches,
the share of state owned banks was
27.3 percent while private banks took
72.7 percent share (Table 4.5).
Total capital of the banking system
reached Birr 153.7 billion, of which
state owned banks accounted for
51.8 percent and private banks 48.2
percent. The share of Commercial
0.00
5.00
10.00
15.00
20.00
25.00
0.00
2.00
4.00
6.00
8.00
10.00
12.00
14.00
16.00
Sep-
18
Dec
-18
Mar
-19
Jun-
19
Sep-
19
Dec
-19
Mar
-20
Jun-
20
Sep-
20
Dec
-20
Mar
-21
infla
tion
rate
(cor
e)
Valu
e in
Per
cent
Av. Saving Dep.Rate Lending Rate91 day T-bills yield Inflation rate (core)

30 | Fourth Quarter 2020/21
National Bank of Ethiopia Quarterly Bulletin
32 Fourth Quarter 2020/21
Table 4.5: Branch Network and Capital of the Banking System
(Branch in Number & Capital in Millions of Birr)
Source: Bank Supervision Directorate (BSD), National Bank of Ethiopia (NBE)
Note: ‘Reg’ Stands for Region and ‘A.A’ for Addis Ababa
Capital 2019/20
1,423 402 1,825 28.0 1,463 417 1,880 26.5 1,489 431 1,920 26.1 49,646 50,323 50,342 88 5 93 1.4 77 5 82 1.2 77 5 82 1.1 7,677 7,748 29,236
1,511 407 1,918 29 1,540 422 1,962 28 1,566 436 2,002 27.3 57,322.5 58,071.5 79,578.0 -
285 196 481 7.4 344 219 563 7.9 381 229 610 8.3 8,095.9 10,981.5 11,084.4 277 159 436 6.7 294 166 460 6.5 302 167 469 6.4 5,464.4 6,362.6 6,757.4 358 221 579 8.9 402 245 647 9.1 423 252 675 9.2 4,179.2 4,807.8 6,425.7 254 145 399 6.1 269 148 417 5.9 271 148 419 5.7 4,137.1 4,917.1 4,987.1 186 165 351 5.4 198 177 375 5.3 206 184 390 5.3 4,374.5 5,080.1 5,091.1 153 174 327 5.0 197 217 414 5.8 198 218 416 5.7 4,950.8 5,670.3 5,689.8 348 82 430 6.6 363 104 467 6.6 371 110 481 6.5 3,906.3 5,051.8 5,968.7 186 86 272 4.2 203 86 289 4.1 203 86 289 3.9 2,767.1 3,194.6 3,246.6 206 108 314 4.8 217 109 326 4.6 219 109 328 4.5 3,650.6 4,268.2 4,328.9 22 30 52 0.8 22 39 61 0.9 25 42 67 0.9 2,376.8 2,793.6 3,543.0
130 114 244 3.7 158 132 290 4.1 169 137 306 4.2 2,552.4 2,922.6 2,993.5 135 121 256 3.9 145 135 280 3.9 152 139 291 4.0 2,742.5 3,256.7 3,434.4 149 83 232 3.6 187 98 285 4.0 199 100 299 4.1 2,580.1 3,278.8 3,367.2 31 50 81 1.2 34 58 92 1.3 36 60 96 1.3 1,113.3 1,260.7 1,307.7 36 46 82 1.3 43 64 107 1.5 52 67 119 1.6 1,099.9 1,426.1 1,554.1
Enat Bank S.C 27 30 57 1.2 28 33 61 1.2 37 43 80 1.5 1,584.8 1,796.4 1,814.5 ZamZam Bank S.S 1 6 7 0.1 2,555.5
2,783 1,810 4,593 71 3,104 2,030 5,134 73 3,245 2,097 5,342 73.1 55,576 67,069 74,149 3.Grand Total Banks 4,294 2,217 6,511 100 4,644 2,452 7,096 100 4,811 2,533 7,344 100 112,898 125,140 153,727
2019/20 2020/21
Reg%
Share Reg. A.A TotalReg. A.A Total
Zemen BankBuna International Bank
Addis Interational Bank Debub Global Bank
Total Private Banks
Abay BankBerhan International Bank
1. State owned Banks
Oromia International Bank
Nib International BankUnited BankWegagen Bank
Lion International BankCooperative Bank of Oromiya
Commercial Bank of Ethiopia
Abyssinia Bank
Development Bank of Ethiopia
Dashen Bank
2. Private BanksAwash International Bank
Total State owned Banks
2020/21
Quarter III
Quarter IV%
ShareA.A%
Share
Quarter IV Quarter III Quarter IVQuarter
IVBanks
Branch Network
Total
33 Fourth Quarter 2020/21
Fig.IV.8: Share of Branch Network and Capital of Banking System
Source: Staff Compilation, NBE
Table 4.6: Branch Network & Capital of Insurance Companies
(Branch in Number & Capital in Millions of Birr)
Source: Insurance Supervision Directorate, NBE
29.5 27.6 27.350.8 46.4 51.8
70.5 72.4 72.749.2 53.6 48.2
0%10%20%30%40%50%60%70%80%90%
100%
perce
ntage
share
from
total
Public Private
2019/20
Quarter IV Quarter III Quarter IVA.A Reg Total A.A Reg Total A.A Reg Total Capital Capital Capital
1 25 65 90 25 65 90 25 65 90 2,828 2,944 2,924 2 28 20 48 28 22 50 29 23 52 1,311 1,509 1,551 3 18 14 32 18 14 32 18 14 32 283 344 367
4 22 17 39 22 17 39 22 17 39 175 197 206 5 28 12 40 28 12 40 28 12 40 676 700 723 6 12 8 20 12 8 20 12 8 20 198 219 230 7 26 22 48 29 22 51 29 22 51 627 596 678 8 16 17 33 17 18 35 17 18 35 891 1,015 1,049 9 27 14 41 28 14 42 28 14 42 597 644 718
10 16 19 35 16 20 36 16 20 36 221 377 380 11 18 5 23 18 6 24 18 6 24 165 167 187 12 22 20 42 22 21 43 22 21 43 548 621 690 13 15 13 28 15 14 29 15 14 29 331 380 382 14 Berhan insurance S.C 12 7 19 13 8 21 13 8 21 162 191 215 15 18 9 27 18 9 27 19 9 28 212 303 310 16 Lucy Insurance S.C. 12 5 17 15 6 21 16 6 22 141 119 112 17 Bunna Insurance S.C. 14 9 23 16 11 27 16 12 28 169 200 214 18 Zemen Insurance S.C. - - - 2 - 2 2 1 3 115 112 130
329 276 605 342 287 629 345 290 635 9,650 10,638 11,066
Africa Insurance Company
Quarter III
Branch Capital
Quarter IVInsurance Companies
2020/212019/20 2020/21
TOTAL
United Insurance Company Global Insurance Company Nile Insurance Company Nyala Insurance Company Nib Insurance Company
Ethio Life & General Insurance S.C.Oromia Insurance CompanyAbay Insurance Company S.C.
Lion Insurance Company
Tsehay Insurance S.C.
National Insurance Corporation of Ethiopia
Quarter IV
Ethiopian Insurance CorporationAwash Insurance Company
34 Fourth Quarter 2020/21
Table 4.7: Microfinance Institutions Performance as of June 30, 2021
(In Thousands of Birr)
2019/20QIV QIII QIV
A B C C/A C/BTotal Capital 19,440,089.7 20,911,888.5 27,875,026.1 43.4 33.3Saving 44,714,061.1 50,983,126.8 52,404,252.3 17.2 2.8Credit 64,901,669.5 64,309,039.7 69,275,733.1 6.7 7.7Total Assets 92,200,086.4 100,522,180.0 104,960,572.8 13.8 4.4
% ChangeParticulars2020/21
Source: Microfinance Supervision Directorate, NBE
4.5. Activities of the Banking System
4.5.1. Resource Mobilization
Total resources mobilized by the banking
system (the sum of net change in
deposit, loans collected and net change
in borrowings) surged 43.8 percent over
last year owing to policies that restrict
cash holding and cash withdrawal levels
as well as currency demonetization that
helped higher deposit mobilization
through the banking system (Table4.8).

Fourth Quarter 2020/21 | 31
National Bank of Ethiopia Quarterly Bulletin
33 Fourth Quarter 2020/21
Fig.IV.8: Share of Branch Network and Capital of Banking System
Source: Staff Compilation, NBE
Table 4.6: Branch Network & Capital of Insurance Companies
(Branch in Number & Capital in Millions of Birr)
Source: Insurance Supervision Directorate, NBE
29.5 27.6 27.350.8 46.4 51.8
70.5 72.4 72.749.2 53.6 48.2
0%10%20%30%40%50%60%70%80%90%
100%
perce
ntage
share
from
total
Public Private
2019/20
Quarter IV Quarter III Quarter IVA.A Reg Total A.A Reg Total A.A Reg Total Capital Capital Capital
1 25 65 90 25 65 90 25 65 90 2,828 2,944 2,924 2 28 20 48 28 22 50 29 23 52 1,311 1,509 1,551 3 18 14 32 18 14 32 18 14 32 283 344 367
4 22 17 39 22 17 39 22 17 39 175 197 206 5 28 12 40 28 12 40 28 12 40 676 700 723 6 12 8 20 12 8 20 12 8 20 198 219 230 7 26 22 48 29 22 51 29 22 51 627 596 678 8 16 17 33 17 18 35 17 18 35 891 1,015 1,049 9 27 14 41 28 14 42 28 14 42 597 644 718
10 16 19 35 16 20 36 16 20 36 221 377 380 11 18 5 23 18 6 24 18 6 24 165 167 187 12 22 20 42 22 21 43 22 21 43 548 621 690 13 15 13 28 15 14 29 15 14 29 331 380 382 14 Berhan insurance S.C 12 7 19 13 8 21 13 8 21 162 191 215 15 18 9 27 18 9 27 19 9 28 212 303 310 16 Lucy Insurance S.C. 12 5 17 15 6 21 16 6 22 141 119 112 17 Bunna Insurance S.C. 14 9 23 16 11 27 16 12 28 169 200 214 18 Zemen Insurance S.C. - - - 2 - 2 2 1 3 115 112 130
329 276 605 342 287 629 345 290 635 9,650 10,638 11,066
Africa Insurance Company
Quarter III
Branch Capital
Quarter IVInsurance Companies
2020/212019/20 2020/21
TOTAL
United Insurance Company Global Insurance Company Nile Insurance Company Nyala Insurance Company Nib Insurance Company
Ethio Life & General Insurance S.C.Oromia Insurance CompanyAbay Insurance Company S.C.
Lion Insurance Company
Tsehay Insurance S.C.
National Insurance Corporation of Ethiopia
Quarter IV
Ethiopian Insurance CorporationAwash Insurance Company
Table 4.7: Microfinance Institutions Performance as of June 30, 2021 (In Thousands of Birr)
Particulars
2019/20 2020/21% Change
QIV QIII QIV
A B C C/A C/B
Total Capital 19,440,089.7 20,911,888.5 27,875,026.1 43.4 33.3
Saving 44,714,061.1 50,983,126.8 52,404,252.3 17.2 2.8
Credit 64,901,669.5 64,309,039.7 69,275,733.1 6.7 7.7
Total Assets 92,200,086.4 100,522,180.0 104,960,572.8 13.8 4.4
Source: Microfinance Supervision Directorate, NBE
34 Fourth Quarter 2020/21
Table 4.7: Microfinance Institutions Performance as of June 30, 2021
(In Thousands of Birr)
2019/20QIV QIII QIV
A B C C/A C/BTotal Capital 19,440,089.7 20,911,888.5 27,875,026.1 43.4 33.3Saving 44,714,061.1 50,983,126.8 52,404,252.3 17.2 2.8Credit 64,901,669.5 64,309,039.7 69,275,733.1 6.7 7.7Total Assets 92,200,086.4 100,522,180.0 104,960,572.8 13.8 4.4
% ChangeParticulars2020/21
Source: Microfinance Supervision Directorate, NBE
4.5. Activities of the Banking System
4.5.1. Resource Mobilization
Total resources mobilized by the banking
system (the sum of net change in
deposit, loans collected and net change
in borrowings) surged 43.8 percent over
last year owing to policies that restrict
cash holding and cash withdrawal levels
as well as currency demonetization that
helped higher deposit mobilization
through the banking system (Table4.8).

32 | Fourth Quarter 2020/21
National Bank of Ethiopia Quarterly Bulletin
35 Fourth Quarter 2020/21
Table 4.8: Summary of Resource Mobilization & Disbursement of the Banking System
(In Millions of Birr)
Qtr.IV 2019/20
Qtr.III 2020/21
Qtr.IV 2020/21
A B C C/A C/B1.Deposits (net change) 19,225.1 37,135.2 35,175.3 55,348.1 52,216.0 54,400.4 92,483.2 77.1 70.0 -Demand -7,675.9 6,143.0 9,060.7 18,633.5 6,083.9 1,384.9 24,776.5 307.2 1,689.1 -Saving 25,612.7 34,391.0 24,886.1 34,294.3 38,854.8 50,498.7 68,685.3 76.8 36.0 -Time 1,288.3 -3,398.8 1,228.6 2,420.3 7,277.2 2,516.8 -978.5 -113.4 -138.92. Borrowing (net change) 1,231.5 1,351.7 0.0 0.0 2,889.8 1,231.5 1,351.7 -53.2 9.8 -Local 831.6 170.0 0.0 0.0 2,602.8 831.6 170.0 -93.5 -79.6 -Foreign 399.9 1,181.6 0.0 0.0 287.0 399.9 1,181.6 311.8 195.53. Collection of Loans 12,985.0 24,638.1 30,838.7 42,904.3 57,081.1 43,823.7 67,542.4 18.3 54.14. Total Resources Mobilized (1+2+3) 33,441.5 63,124.9 66,014.0 98,252.4 112,186.8 99,455.5 161,377.3 43.8 62.35. Disbursement 21,903.0 42,122.2 46,258.9 63,758.6 63,710.5 68,161.9 105,880.7 66.2 55.36. Change in Liquidity (4-5) 11,538.5 21,002.7 19,755.1 34,493.8 48,476.4 31,293.6 55,496.5 14.5 77.3 Memorandum Item:
Outstanding Credit* 748,138.2 763,657.4 476,237.5 519,626.4 1,032,203.0 1,224,375.7 1,283,283.8 24.3 4.8
Particulars
Public Banks Private Banks Grand Total
% Change
1 2 (3) = (1) + (2)
Qtr.III 2020/21
Qtr.IV 2020/21
Qtr.III 2020/21
Qtr.IV 2020/21
Source: Commercial Banks and staff computation
Notes: *Includes corporate bonds of Commercial Bank of Ethiopia
Fig.IV.9: Trends in Resource Mobilization and Disbursement of Loans
-
20,000.00
40,000.00
60,000.00
80,000.00
100,000.00
120,000.00
140,000.00
160,000.00
180,000.00
I II III IV I II III IV I II III IV I II III IV
2017/18 2018/19 2019/20 2020/21
In M
illion
s of
Birr
Total Resource Mobilization Net Deposit Collection of Loans Disbursement of Loans
Source: Staff computation
36 Fourth Quarter 2020/21
4.5.1.1. Deposit Mobilization
Total deposit liability of the banking
system reached Birr 1.4 trillion
indicating 30.3 percent annual
growth.
Demand deposits, which accounted
for 32.4 percent of the total deposits
and reached Birr 439.8 billion showing a
23.4 percent year-on-year growth while
saving deposits went up by 38.7
percent to Birr 817.6 billion and
accounted for 60.3 percent of the total
deposits. Time deposits, which
constituted 7.3 percent of the total
deposit liabilities, increased by 3.9
percent to Birr 99.4 billion. The share of
state owned banks in total deposit
mobilization was 54.3 percent and that
of private banks 45.7 percent (Table
4.9).
Table 4.9: Stock of Deposits Mobilized by the Banking System
(In Millions of Birr)
Quarter IV Quarter III Quarter IV2019/20 2020/21 2020/21
A B CDemand Deposit 356,328.6 34.2 415,054.6 32.8 439,831.1 32.4 23.4 6.0 Saving Deposit 589,465.0 56.6 748,934.5 59.2 817,619.8 60.3 38.7 9.2 Time Deposit 95,616.7 9.2 100,349.9 7.9 99,371.4 7.3 3.9 (1.0)Total 1,041,410.3 100.0 1,264,339.1 100.0 1,356,822.3 100.0 30.3 7.3 Share of State owned Banks 57.4 55.4 54.3 Share of Private Banks 42.6 44.6 45.7
C/A C/B
% Share
Deposit by types %
Share%
Share
Source: Commercial Banks and DBE
Table 4.8: Summary of Resource Mobilization & Disbursement of the Banking System (In millions of USD)
Particulars
Public Banks Private Banks Grand Total
% Change1 2 (3) = (1) + (2)
Qtr.III 2020/21
Qtr.IV 2020/21
Qtr.III 2020/21
Qtr.IV 2020/21
Qtr.IV 2019/20
Qtr.III 2020/21
Qtr.IV 2020/21
A B C C/A C/B
1.Deposits (net change) 19,225.1 37,135.2 35,175.3 55,348.1 52,216.0 54,400.4 92,483.2 77.1 70.0
-Demand -7,675.9 6,143.0 9,060.7 18,633.5 6,083.9 1,384.9 24,776.5 307.2 1,689.1
-Saving 25,612.7 34,391.0 24,886.1 34,294.3 38,854.8 50,498.7 68,685.3 76.8 36.0
-Time 1,288.3 -3,398.8 1,228.6 2,420.3 7,277.2 2,516.8 -978.5 -113.4 -138.9
2. Borrowing (net change) 1,231.5 1,351.7 0.0 0.0 2,889.8 1,231.5 1,351.7 -53.2 9.8
-Local 831.6 170.0 0.0 0.0 2,602.8 831.6 170.0 -93.5 -79.6
-Foreign 399.9 1,181.6 0.0 0.0 287.0 399.9 1,181.6 311.8 195.5
3. Collection of Loans 12,985.0 24,638.1 30,838.7 42,904.3 57,081.1 43,823.7 67,542.4 18.3 54.1
4. Total Resources Mobilized (1+2+3) 33,441.5 63,124.9 66,014.0 98,252.4 112,186.8 99,455.5 161,377.3 43.8 62.3
5. Disbursement 21,903.0 42,122.2 46,258.9 63,758.6 63,710.5 68,161.9 105,880.7 66.2 55.3
6. Change in Liquid-ity (4-5) 11,538.5 21,002.7 19,755.1 34,493.8 48,476.4 31,293.6 55,496.5 14.5 77.3
Memorandum Item:
Outstanding Credit* 748,138.2 763,657.4 476,237.5 519,626.4 1,032,203.0 1,224,375.7 1,283,283.8 24.3 4.8
Source: Commercial Banks and staff computation Notes: *Excludes government borrowing in the form of bonds and treasury bills from commercial banks and other sectors other than NBE

Fourth Quarter 2020/21 | 33
National Bank of Ethiopia Quarterly Bulletin
35 Fourth Quarter 2020/21
Table 4.8: Summary of Resource Mobilization & Disbursement of the Banking System
(In Millions of Birr)
Qtr.IV 2019/20
Qtr.III 2020/21
Qtr.IV 2020/21
A B C C/A C/B1.Deposits (net change) 19,225.1 37,135.2 35,175.3 55,348.1 52,216.0 54,400.4 92,483.2 77.1 70.0 -Demand -7,675.9 6,143.0 9,060.7 18,633.5 6,083.9 1,384.9 24,776.5 307.2 1,689.1 -Saving 25,612.7 34,391.0 24,886.1 34,294.3 38,854.8 50,498.7 68,685.3 76.8 36.0 -Time 1,288.3 -3,398.8 1,228.6 2,420.3 7,277.2 2,516.8 -978.5 -113.4 -138.92. Borrowing (net change) 1,231.5 1,351.7 0.0 0.0 2,889.8 1,231.5 1,351.7 -53.2 9.8 -Local 831.6 170.0 0.0 0.0 2,602.8 831.6 170.0 -93.5 -79.6 -Foreign 399.9 1,181.6 0.0 0.0 287.0 399.9 1,181.6 311.8 195.53. Collection of Loans 12,985.0 24,638.1 30,838.7 42,904.3 57,081.1 43,823.7 67,542.4 18.3 54.14. Total Resources Mobilized (1+2+3) 33,441.5 63,124.9 66,014.0 98,252.4 112,186.8 99,455.5 161,377.3 43.8 62.35. Disbursement 21,903.0 42,122.2 46,258.9 63,758.6 63,710.5 68,161.9 105,880.7 66.2 55.36. Change in Liquidity (4-5) 11,538.5 21,002.7 19,755.1 34,493.8 48,476.4 31,293.6 55,496.5 14.5 77.3 Memorandum Item:
Outstanding Credit* 748,138.2 763,657.4 476,237.5 519,626.4 1,032,203.0 1,224,375.7 1,283,283.8 24.3 4.8
Particulars
Public Banks Private Banks Grand Total
% Change
1 2 (3) = (1) + (2)
Qtr.III 2020/21
Qtr.IV 2020/21
Qtr.III 2020/21
Qtr.IV 2020/21
Source: Commercial Banks and staff computation
Notes: *Includes corporate bonds of Commercial Bank of Ethiopia
Fig.IV.9: Trends in Resource Mobilization and Disbursement of Loans
-
20,000.00
40,000.00
60,000.00
80,000.00
100,000.00
120,000.00
140,000.00
160,000.00
180,000.00
I II III IV I II III IV I II III IV I II III IV
2017/18 2018/19 2019/20 2020/21
In M
illion
s of
Birr
Total Resource Mobilization Net Deposit Collection of Loans Disbursement of Loans
Source: Staff computation
36 Fourth Quarter 2020/21
4.5.1.1. Deposit Mobilization
Total deposit liability of the banking
system reached Birr 1.4 trillion
indicating 30.3 percent annual
growth.
Demand deposits, which accounted
for 32.4 percent of the total deposits
and reached Birr 439.8 billion showing a
23.4 percent year-on-year growth while
saving deposits went up by 38.7
percent to Birr 817.6 billion and
accounted for 60.3 percent of the total
deposits. Time deposits, which
constituted 7.3 percent of the total
deposit liabilities, increased by 3.9
percent to Birr 99.4 billion. The share of
state owned banks in total deposit
mobilization was 54.3 percent and that
of private banks 45.7 percent (Table
4.9).
Table 4.9: Stock of Deposits Mobilized by the Banking System
(In Millions of Birr)
Quarter IV Quarter III Quarter IV2019/20 2020/21 2020/21
A B CDemand Deposit 356,328.6 34.2 415,054.6 32.8 439,831.1 32.4 23.4 6.0 Saving Deposit 589,465.0 56.6 748,934.5 59.2 817,619.8 60.3 38.7 9.2 Time Deposit 95,616.7 9.2 100,349.9 7.9 99,371.4 7.3 3.9 (1.0)Total 1,041,410.3 100.0 1,264,339.1 100.0 1,356,822.3 100.0 30.3 7.3 Share of State owned Banks 57.4 55.4 54.3 Share of Private Banks 42.6 44.6 45.7
C/A C/B
% Share
Deposit by types %
Share%
Share
Source: Commercial Banks and DBE
36 Fourth Quarter 2020/21
4.5.1.1. Deposit Mobilization
Total deposit liability of the banking
system reached Birr 1.4 trillion
indicating 30.3 percent annual
growth.
Demand deposits, which accounted
for 32.4 percent of the total deposits
and reached Birr 439.8 billion showing a
23.4 percent year-on-year growth while
saving deposits went up by 38.7
percent to Birr 817.6 billion and
accounted for 60.3 percent of the total
deposits. Time deposits, which
constituted 7.3 percent of the total
deposit liabilities, increased by 3.9
percent to Birr 99.4 billion. The share of
state owned banks in total deposit
mobilization was 54.3 percent and that
of private banks 45.7 percent (Table
4.9).
Table 4.9: Stock of Deposits Mobilized by the Banking System
(In Millions of Birr)
Quarter IV Quarter III Quarter IV2019/20 2020/21 2020/21
A B CDemand Deposit 356,328.6 34.2 415,054.6 32.8 439,831.1 32.4 23.4 6.0 Saving Deposit 589,465.0 56.6 748,934.5 59.2 817,619.8 60.3 38.7 9.2 Time Deposit 95,616.7 9.2 100,349.9 7.9 99,371.4 7.3 3.9 (1.0)Total 1,041,410.3 100.0 1,264,339.1 100.0 1,356,822.3 100.0 30.3 7.3 Share of State owned Banks 57.4 55.4 54.3 Share of Private Banks 42.6 44.6 45.7
C/A C/B
% Share
Deposit by types %
Share%
Share
Source: Commercial Banks and DBE
Table 4.9: Stock of Deposits Mobilized by the Banking System (In millions of USD)
Deposit by types
Quarter IV2019/20 %
Share
Quarter III2020/21 %
Share
Quarter IV2020/21 %
Share C/A C/BA B C
Demand Deposit 356,328.6 34.2 415,054.6 32.8 439,831.1 32.4 23.4 6.0
Saving Deposit 589,465.0 56.6 748,934.5 59.2 817,619.8 60.3 38.7 9.2
Time Deposit 95,616.7 9.2 100,349.9 7.9 99,371.4 7.3 3.9 (1.0)
Total 1,041,410.3 100.0 1,264,339.1 100.0 1,356,822.3 100.0 30.3 7.3
Share of State owned Banks 57.4 55.4 54.3
Share of Private Banks 42.6 44.6 45.7
Source: Commercial Banks and DBE

34 | Fourth Quarter 2020/21
National Bank of Ethiopia Quarterly Bulletin
37 Fourth Quarter 2020/21
Fig.IV.10: Quarterly Growth of Banks’ Deposit Liabilities by Ownership
-2.0
0.0
2.0
4.0
6.0
8.0
10.0
12.0
I II III IV I II III IV I II III IV I II III IV
2017/18 2018/19 2019/20 2020/21
In p
erce
nt
State Owned Banks Private Banks All Banks
Source: Staff Computation, NBE
4.5.1.2. Collection of Loans
During the review period, banks
collected loans (including
corporate bonds) close to Birr 67.5
billion; about 18.3 percent higher
than last year same quarter (Table
4.8). About 63.5 percent of the total
loan was collected by private banks
and 36.5 percent by state owned
banks whereby 95.3 percent of the
total loan was collected from
cooperatives and private
enterprises (Table 4.12).
4.5.1.3. Borrowing
Total outstanding borrowing of the
banking system stood at Birr 84.2
billion, showing 4.6 percent annual
growth.
Of the total borrowing, Birr 68.5 billion
(81.3 percent) was from domestic
and Birr 15.7 billion (18.7 percent)
from external sources (Table 4.10).
38 Fourth Quarter 2020/21
Table 4.10: Banks’ Outstanding Borrowing by Sources
(In Millions of Birr)
2019/20Quarter IV Quarter III Quarter IV
A B C C/B C/ADomestic Borrowing 68,416.9 68,296.3 68,466.3 0.2 0.1 Foreign Borrowing 12,026.0 14,534.3 15,716.0 8.1 30.7 Total 80,442.9 82,830.6 84,182.3 1.6 4.6
Borrowings Percentage change2020/21
Source: Development Bank of Ethiopia
4.5.2. Disbursement of Fresh Loans
During the review quarter, Birr 105.9
billion was disbursed in fresh loans
(including CBE bond purchases),
indicating 66.2 percent annual
growth. Of the total new loans
disbursed, the share of state owned
banks was 39.8 percent with private
banks taking up 60.2 percent (Table
4.12).
The major beneficiaries of the fresh
loans were industry (Birr 27.9 billion or
26.4 percent), international trade (Birr
23.6 billion or 22.3 percent),
agriculture (Birr 14.5 billion or 13.7
percent), domestic trade (Birr 10.6
billion or 10 percent), housing &
construction (Birr 9.8 billion or 9.2
percent), and personal (Birr 8.2 billion
or 7.7 percent). The remaining
balance was taken by other sectors
(Table4.11).
4.5.1.2. Collection of Loans
During the review period, banks
collected loans (including corporate
bonds) close to Birr 67.5 billion; about
18.3 percent higher than last year
same quarter (Table 4.8). About
63.5 percent of the total loan was
collected by private banks and
36.5 percent by state owned banks
whereby 95.3 percent of the total
loan was collected from cooperatives
and private enterprises (Table 4.12).
4.5.1.3. Borrowing
Total outstanding borrowing of the
banking system stood at Birr 84.2
billion, showing 4.6 percent annual
growth.
Of the total borrowing, Birr 68.5 billion
(81.3 percent) was from domestic
and Birr 15.7 billion (18.7 percent)
from external sources (Table 4.10).

Fourth Quarter 2020/21 | 35
National Bank of Ethiopia Quarterly Bulletin
38 Fourth Quarter 2020/21
Table 4.10: Banks’ Outstanding Borrowing by Sources
(In Millions of Birr)
2019/20Quarter IV Quarter III Quarter IV
A B C C/B C/ADomestic Borrowing 68,416.9 68,296.3 68,466.3 0.2 0.1 Foreign Borrowing 12,026.0 14,534.3 15,716.0 8.1 30.7 Total 80,442.9 82,830.6 84,182.3 1.6 4.6
Borrowings Percentage change2020/21
Source: Development Bank of Ethiopia
4.5.2. Disbursement of Fresh Loans
During the review quarter, Birr 105.9
billion was disbursed in fresh loans
(including CBE bond purchases),
indicating 66.2 percent annual
growth. Of the total new loans
disbursed, the share of state owned
banks was 39.8 percent with private
banks taking up 60.2 percent (Table
4.12).
The major beneficiaries of the fresh
loans were industry (Birr 27.9 billion or
26.4 percent), international trade (Birr
23.6 billion or 22.3 percent),
agriculture (Birr 14.5 billion or 13.7
percent), domestic trade (Birr 10.6
billion or 10 percent), housing &
construction (Birr 9.8 billion or 9.2
percent), and personal (Birr 8.2 billion
or 7.7 percent). The remaining
balance was taken by other sectors
(Table4.11).
Table 4.10: Banks’ Outstanding Borrowing by Sources (In millions of USD)
Borrowings
2019/20 2020/21Percentage change
Quarter IV Quarter III Quarter IV
A B C C/B C/A
Domestic Borrowing 68,416.9 68,296.3 68,466.3 0.2 0.1
Foreign Borrowing 12,026.0 14,534.3 15,716.0 8.1 30.7
Total 80,442.9 82,830.6 84,182.3 1.6 4.6
Source: Development Bank of Ethiopia

36 | Fourth Quarter 2020/21
National Bank of Ethiopia Quarterly Bulletin
39 Fourth Quarter 2020/21
Fig.IV.11: Trends in Fresh Loan Disbursement by Ownership
-
20,000.00
40,000.00
60,000.00
80,000.00
100,000.00
120,000.00
QI
QII
QIII
QIV Q
I
QII
QIII
QIV Q
I
QII
QIII
QIV Q
I
QII
QIII
QIV
2017/18 2018/19 2019/20 2020/21
Valu
e in
Mill
ion
Birr
Years/QuartersTotal State Owned Banks Private Banks
Source: Commercial Banks and Development Bank of Ethiopia
40 Fourth Quarter 2020/21
Table 4.11: Banking Loans & advances by Sectors (including corporate bond) in QIV-2020/21 (In Millions of Birr)
D* C* O/S* D* C* O/S * D* C* O/S* Corporate Bonds 4,153 2,105 444,872 - - - 4,153 2,105 444,872 Agriculture 13,409 12,558 25,750 1,092 370 6,074 14,501 12,928 31,824 Industry 18,352 4,575 190,908 9,596 4,780 82,076 27,948 9,355 272,984 Domestic Trade 827 1,159 8,190 9,804 9,432 106,899 10,630 10,591 115,088 International Trade 178 460 23,628 23,389 18,450 173,655 23,567 18,910 197,283 Export 173 399 10,703 18,996 14,805 125,219 19,169 15,204 135,921 Imports 5 61 12,925 4,393 3,645 48,437 4,398 3,706 61,361 Hotels and Tourism 192 571 4,301 2,259 1,043 21,662 2,451 1,613 25,964 Transport & Communication 17 78 72,578 1,995 1,329 12,597 2,013 1,407 85,175 Housing & Construction 994 2,042 67,674 8,779 4,999 72,898 9,774 7,041 140,572 Mines, Power & Water Res. 4,250 424 322,054 41 37 468 4,291 461 322,522 Others 1,569 814 17,068 955 497 5,239 2,525 1,310 22,306 Personal 2,332 1,958 31,508 5,849 1,970 38,057 8,181 3,927 69,565
Total 42,122 24,638 763,657 63,759 42,904 519,626 105,881 67,542 1,283,284
Borrowing Sector
Public Banks Private Banks Total (1) (2) (3)
D*= Disbursement, C*= Collection, O/S*= Outstanding Credit
4.5.3. Outstanding Credit
Total outstanding credit of the
banking system (including corporate
bond) went up by 24.3 percent to Birr
1.3 trillion. About 99.7 percent of the
total outstanding credit of private
banks was claims on the private
sector (including comparatives) while
claims of state owned banks’ on
private sector stood at 19.9 percent
(Table 4.12).
‘Mines, power & water resource’
sector is the major holder of the
outstanding credit with Birr 322.5
billion (25.1 percent) followed by
Industry (Birr 273 billion or 21.3
percent), International trade (Birr
41 Fourth Quarter 2020/21
197.3 billion or 15.4 percent), Housing
& construction (Birr 140.6 billion or 11.0
percent), Domestic trade (Birr 115.1
billion or 9 percent), Transport &
communication (Birr 85.2 billion or 6.6
percent) and other economic sectors
took the remaining balance (Table
4.11).
Table 4.12: Breakdown of Banking System Credit by Clients
(In Millions of Birr)
Particulars Loan Disbursement % Share Loan Collection % Share
Outstanding Loan % Share
State Owned Banks 42,122.2 39.8 24,638.1 36.5 763,657.4 59.5Corporate Bonds* 4,153.4 0.0 2,105.4 0.0 444,871.7 58.3State Enterprises 16,707.6 39.7 1,027.7 4.2 166,391.4 21.8Cooperatives 14,335.1 34.0 12,553.7 51.0 23,737.4 3.1Private Enterprises 6,926.1 16.4 8,951.2 36.3 128,656.9 16.8Private Banks 63,758.6 60.2 42,904.3 63.5 519,626.4 40.5State Enterprises 229.6 0.4 60.9 0.1 1,511.2 0.3Cooperatives 492.6 0.8 613.5 1.4 5,392.4 1.0Private Enterprises 63,036.4 98.9 42,230.0 98.4 512,722.7 98.7Grand Total 105,880.7 100.0 67,542.4 100.0 1,283,283.8 100.0
Source: Commercial banks and staff computation
Notes: *Corporate Bonds of Commercial Bank of Ethiopia
Fig.IV.12: Share of State Owned and Private Banks in Outstanding Credit
0.010.020.030.040.050.060.070.080.0
QI QII
QIII
QIV QI QII
QIII
QIV QI QII
QIII
QIV QI QII
QIII
QIV
2017/18 2018/19 2019/20 2020/21
Value
in Pe
rcent
Years/Quarters
Total State Owned Total Private
Source: Staff computation, NBE
Table 4.11: Banking Loans & advances by Sectors (including corporate bond) in QIV-2020/21 (In millions of USD)
Borrowing Sector
Public Banks Private Banks Total
(1) (2) (3)
D* C* O/S* D* C* O/S * D* C* O/S*
Corporate Bonds 4,153 2,105 444,872 - - - 4,153 2,105 444,872
Agriculture 13,409 12,558 25,750 1,092 370 6,074 14,501
12,928 31,824
Industry 18,352 4,575 190,908 9,596 4,780 82,076 27,948 9,355 272,984
Domestic Trade 827 1,159 8,190 9,804 9,432 106,899 10,630
10,591 115,088
International Trade 178 460 23,628 23,389 18,450 173,655 23,567
18,910 197,283
Export 173 399 10,703 18,996 14,805 125,219 19,169
15,204 135,921
Imports 5 61 12,925 4,393 3,645 48,437 4,398 3,706 61,361
Hotels and Tourism 192 571 4,301 2,259 1,043 21,662 2,451 1,613 25,964
Transport &Communication 17 78 72,578 1,995 1,329 12,597 2,013 1,407 85,175
Housing &Construction 994 2,042 67,674 8,779 4,999 72,898 9,774 7,041 140,572
Mines, Power & Wa-ter Res. 4,250 424 322,054 41 37 468 4,291 461 322,522
Others 1,569 814 17,068 955 497 5,239 2,525 1,310 22,306
Personal 2,332 1,958 31,508 5,849 1,970 38,057 8,181 3,927 69,565
Total 42,122 24,638 763,657 63,759 42,904 519,626 105,881
67,542
1,283,284
D*= Disbursement, C*= Collection, O/S*= Outstanding Credit

Fourth Quarter 2020/21 | 37
National Bank of Ethiopia Quarterly Bulletin
40 Fourth Quarter 2020/21
Table 4.11: Banking Loans & advances by Sectors (including corporate bond) in QIV-2020/21 (In Millions of Birr)
D* C* O/S* D* C* O/S * D* C* O/S* Corporate Bonds 4,153 2,105 444,872 - - - 4,153 2,105 444,872 Agriculture 13,409 12,558 25,750 1,092 370 6,074 14,501 12,928 31,824 Industry 18,352 4,575 190,908 9,596 4,780 82,076 27,948 9,355 272,984 Domestic Trade 827 1,159 8,190 9,804 9,432 106,899 10,630 10,591 115,088 International Trade 178 460 23,628 23,389 18,450 173,655 23,567 18,910 197,283 Export 173 399 10,703 18,996 14,805 125,219 19,169 15,204 135,921 Imports 5 61 12,925 4,393 3,645 48,437 4,398 3,706 61,361 Hotels and Tourism 192 571 4,301 2,259 1,043 21,662 2,451 1,613 25,964 Transport & Communication 17 78 72,578 1,995 1,329 12,597 2,013 1,407 85,175 Housing & Construction 994 2,042 67,674 8,779 4,999 72,898 9,774 7,041 140,572 Mines, Power & Water Res. 4,250 424 322,054 41 37 468 4,291 461 322,522 Others 1,569 814 17,068 955 497 5,239 2,525 1,310 22,306 Personal 2,332 1,958 31,508 5,849 1,970 38,057 8,181 3,927 69,565
Total 42,122 24,638 763,657 63,759 42,904 519,626 105,881 67,542 1,283,284
Borrowing Sector
Public Banks Private Banks Total (1) (2) (3)
D*= Disbursement, C*= Collection, O/S*= Outstanding Credit
4.5.3. Outstanding Credit
Total outstanding credit of the
banking system (including corporate
bond) went up by 24.3 percent to Birr
1.3 trillion. About 99.7 percent of the
total outstanding credit of private
banks was claims on the private
sector (including comparatives) while
claims of state owned banks’ on
private sector stood at 19.9 percent
(Table 4.12).
‘Mines, power & water resource’
sector is the major holder of the
outstanding credit with Birr 322.5
billion (25.1 percent) followed by
Industry (Birr 273 billion or 21.3
percent), International trade (Birr
Total outstanding credit of the banking system (including corporate bond) went up by 24.3 percent to Birr 1.3 trillion. About 99.7 percent of the total outstanding credit of private banks was claims on the private sector (including comparatives) while claims of state owned banks’ on private sector stood at 19.9 percent (Table 4.12).
‘Mines, power & water resource’ sector is the major holder of the outstanding
credit with Birr 322.5 billion (25.1 percent) followed by Industry (Birr 273 billion or 21.3 percent), International trade (Birr 197.3 billion or 15.4 percent), Housing & construction (Birr 140.6 billion or 11.0 percent), Domestic trade (Birr 115.1 billion or 9 percent), Transport & communication (Birr 85.2 billion or 6.6 percent) and other economic sectors took the remaining balance (Table 4.11).
41 Fourth Quarter 2020/21
197.3 billion or 15.4 percent), Housing
& construction (Birr 140.6 billion or 11.0
percent), Domestic trade (Birr 115.1
billion or 9 percent), Transport &
communication (Birr 85.2 billion or 6.6
percent) and other economic sectors
took the remaining balance (Table
4.11).
Table 4.12: Breakdown of Banking System Credit by Clients
(In Millions of Birr)
Particulars Loan Disbursement % Share Loan Collection % Share
Outstanding Loan % Share
State Owned Banks 42,122.2 39.8 24,638.1 36.5 763,657.4 59.5Corporate Bonds* 4,153.4 0.0 2,105.4 0.0 444,871.7 58.3State Enterprises 16,707.6 39.7 1,027.7 4.2 166,391.4 21.8Cooperatives 14,335.1 34.0 12,553.7 51.0 23,737.4 3.1Private Enterprises 6,926.1 16.4 8,951.2 36.3 128,656.9 16.8Private Banks 63,758.6 60.2 42,904.3 63.5 519,626.4 40.5State Enterprises 229.6 0.4 60.9 0.1 1,511.2 0.3Cooperatives 492.6 0.8 613.5 1.4 5,392.4 1.0Private Enterprises 63,036.4 98.9 42,230.0 98.4 512,722.7 98.7Grand Total 105,880.7 100.0 67,542.4 100.0 1,283,283.8 100.0
Source: Commercial banks and staff computation
Notes: *Corporate Bonds of Commercial Bank of Ethiopia
Fig.IV.12: Share of State Owned and Private Banks in Outstanding Credit
0.010.020.030.040.050.060.070.080.0
QI QII
QIII
QIV QI QII
QIII
QIV QI QII
QIII
QIV QI QII
QIII
QIV
2017/18 2018/19 2019/20 2020/21
Value
in Pe
rcent
Years/Quarters
Total State Owned Total Private
Source: Staff computation, NBE
Table 4.12: Breakdown of Banking System Credit by Clients (In millions of USD)
Particulars LoanDisbursement
% Share
LoanCollection
% Share
Outstanding Loan
% Share
State Owned Banks 42,122.2 39.8 24,638.1 36.5 763,657.4 59.5Corporate Bonds* 4,153.4 0.0 2,105.4 0.0 444,871.7 58.3State Enterprises 16,707.6 39.7 1,027.7 4.2 166,391.4 21.8Cooperatives 14,335.1 34.0 12,553.7 51.0 23,737.4 3.1
Private Enterprises 6,926.1 16.4 8,951.2 36.3 128,656.9 16.8Private Banks 63,758.6 60.2 42,904.3 63.5 519,626.4 40.5State Enterprises 229.6 0.4 60.9 0.1 1,511.2 0.3Cooperatives 492.6 0.8 613.5 1.4 5,392.4 1.0
Private Enterprises 63,036.4 98.9 42,230.0 98.4 512,722.7 98.7Grand Total 105,880.7 100.0 67,542.4 100.0 1,283,283.8 100.0
Source: Commercial banks and staff computation Notes: *Corporate Bonds of Commercial Bank of Ethiopia

38 | Fourth Quarter 2020/21
National Bank of Ethiopia Quarterly Bulletin
National Bank of Ethiopia Quarterly Bulletin
Fourth Quarter 2020/21 42
4.6. Financial Activities of NBE
NBE’s gross claims on the central
government as end June 2021 has
reached Birr 281.9 billion, about 22.4
percent higher than a year earlier. Of
this sum, government bonds
accounted for 70.4 percent and direct
advance 29.6 percent. Direct advance
to the central government rose by
169.4 percent compared with last year
due to law enforcement and COVID-19
expenditures.
By end of June 2021, NBE’s deposit
liabilities shrunk by 3.5 owing to a
slowdown in banks’ reserve (Table
4.13).
Table 4 .13: Financial Activities of NBE
(In Millions of Birr)
2019/20Qtr.IV Qtr.III Qtr.IV
A B C C/A C/B1.Loans and Advances 288,380.46 308,505.36 338,505.36 17.4 9.7
1.1. To Central Government 230,237.75 251,862.65 281,862.65 22.4 11.9 Direct Advances 31,000.00 53,500.00 83,500.00 169.4 56.1 Bonds 199,237.75 198,362.65 198,362.65 -0.4 0.0
1.2.To Development Bank of Ethiopia 58,142.71 56,642.71 56,642.71 -2.6 0.02.Deposit Liabilities 142,563.35 137,707.07 137,565.84 -3.5 -0.1
2.1. Government 34,526.76 30,602.71 36,843.46 6.7 20.4 2.2. Financial Institutions 108,036.59 107,104.36 100,722.38 -6.8 -6.0
O/W: -Banks 108,028.03 107,098.66 100,710.32 -6.8 -6.0 -Insurance companies 8.6 5.7 12.1 40.9 111.53.Net Claims of NBE(1-2) 145,817.1 170,798.3 200,939.5 37.8 17.6
% Change Particulars
2020/21
Source: National Bank of Ethiopia (NBE)
National Bank of Ethiopia Quarterly Bulletin
43 Fourth Quarter 2020/21
4.7. Developments in Financial Markets
4.7.1. Treasury Bills Market
The amount of T-bills supplied to the
bi-weekly T-bills auction during the
fourth quarter of the fiscal year
2020/21, reached Birr 130.0 billion,
reflecting a 367.8 percent
increment over last year same
period. Similarly, the demand for T-
bills rose 376.1 percent relative to a
year earlier to Birr 126.8 billion
(Table 14.4). Thus, the value of T-
bills sold stood at Birr 110.6 billion,
about 438.4 percent higher than
last year same quarter. Non-bank
institutions bought T-bills worth Birr
57.3 billion while the share of banks
was Birr 53.2 billion.
In addition, Birr 82.2 billion (net of
redemption) was mobilized to
finance government operations
using T-bills auctions during the
recent quarter.
Hence, total outstanding T-bills
reached Birr 116.6 billion, reflecting
a 309.4 percent increase over last
year. The average weighted T-bills
yield during the review quarter was
9.970 percent compared to 6.604
percent a year earlier. This was
mainly due to policy change on
issuance of T-bills (Table 4.14).
Table 4 .13: Financial Activities of NBE (In millions of USD)
Particulars
2019/20 2020/21% Change
Qtr.IV Qtr.III Qtr.IV
A B C C/A C/B
1. Loans and Advances 288,380.46
308,505.36
338,505.36 17.4 9.7
1.1. To Central Government 230,237.75
251,862.65
281,862.65 22.4 11.9
Direct Advances 31,000.00 53,500.00 83,500.00 169.4 56.1
Bonds 199,237.75
198,362.65
198,362.65 -0.4 0.0
1.2. To Development Bank of Ethiopia 58,142.71 56,642.71 56,642.71 -2.6 0.0
2. Deposit Liabilities 142,563.35
137,707.07
137,565.84 -3.5 -0.1
2.1. Government 34,526.76 30,602.71 36,843.46 6.7 20.4
2.2. Financial Institutions 108,036.59
107,104.36
100,722.38 -6.8 -6.0
O/W:
-Banks 108,028.03
107,098.66
100,710.32 -6.8 -6.0
-Insurance companies 8.6 5.7 12.1 40.9 111.5
3. Net Claims of NBE(1-2) 145,817.1 170,798.3 200,939.5 37.8 17.6
Source: National Bank of Ethiopia (NBE)

Fourth Quarter 2020/21 | 39
National Bank of Ethiopia Quarterly BulletinNational Bank of Ethiopia Quarterly Bulletin
43 Fourth Quarter 2020/21
4.7. Developments in Financial Markets
4.7.1. Treasury Bills Market
The amount of T-bills supplied to the
bi-weekly T-bills auction during the
fourth quarter of the fiscal year
2020/21, reached Birr 130.0 billion,
reflecting a 367.8 percent
increment over last year same
period. Similarly, the demand for T-
bills rose 376.1 percent relative to a
year earlier to Birr 126.8 billion
(Table 14.4). Thus, the value of T-
bills sold stood at Birr 110.6 billion,
about 438.4 percent higher than
last year same quarter. Non-bank
institutions bought T-bills worth Birr
57.3 billion while the share of banks
was Birr 53.2 billion.
In addition, Birr 82.2 billion (net of
redemption) was mobilized to
finance government operations
using T-bills auctions during the
recent quarter.
Hence, total outstanding T-bills
reached Birr 116.6 billion, reflecting
a 309.4 percent increase over last
year. The average weighted T-bills
yield during the review quarter was
9.970 percent compared to 6.604
percent a year earlier. This was
mainly due to policy change on
issuance of T-bills (Table 4.14).

40 | Fourth Quarter 2020/21
National Bank of Ethiopia Quarterly Bulletin
National Bank of Ethiopia Quarterly Bulletin
44Fourth Quarter 2020/21
Source: National Bank of Ethiopia (NBE)
Fig.IV.13: Development in Treasury- bills Markets
Source NBE
Fig.IV.14: Developments in Average weighted Yields of T-bills
-
50,000.00
100,000.00
150,000.00
200,000.00
250,000.00
300,000.00
IV I II III IV I II III IV I II III IV I II III IV
2017/18 2018/19 2019/20 2020/21
Supply
Demand
0
2.5
5
7.5
10
IV I II III IV I II III IV I II III IV I II III IV
2017/18 2018/19 2019/20 2020/21(In
per
cent
)
28-day
91-day
182-day
364-day
-
50,000.00
100,000.00
150,000.00
200,000.00
250,000.00
300,000.00
IV I II III IV I II III IV I II III IV I II III IV
2017/18 2018/19 2019/20 2020/21
Supply
Demand
National Bank of Ethiopia Quarterly Bulletin
45 Fourth Quarter 2020/21
Source NBE
4.7.2. Inter- Bank Money Market
No inter-bank money market
transactions were conducted during
the 4th quarter of 2020/21.
4.7.3. Corporate Bond Market
Although, corporate bond market is not
well developed in Ethiopia, few public
institutions and regional governments
have continued to play a pivotal role in
the corporate bond market. The sole
purchaser of these bonds is the
Commercial Bank of Ethiopia (CBE).
Accordingly, CBE has purchased
corporate bonds worth Birr 4.2 billion,
which, were solely issued by Ethiopian
Electric Power (EEP) and Ethiopian
Electric Utility (EEU) during the review
quarter. At the same time, the amount
of corporate bonds redeemed reached
Birr 2.1 billion, of which Birr 1.8 billion was
by the Addis Ababa, city administration
and Birr 334.4 million was by EEP&EEU.
At the end of June 2021, the stock of
corporate bonds held by the CBE stood
at Birr 444.9 billion, of which 88.2
percent was a claim on public
enterprises, while the remaining
balance was held by regional
governments (Table 4.15). Corporate
bonds issued by EEP&EEU accounted
72.1 percent of the total outstanding
corporate bond balance.
0
2.5
5
7.5
10
4.9238
I II III IV I II III IV I II III IV I II III IV I II III IV I II III IV I II III IV I II III IV I II III IV I II III IV I II III IV I II III IV I II
2008/9 2009/10 2010/11 2011/12 2012/13 2013/14 2014/15 2015/16 2016/17 2017/18 2018/19 2019/20 2020/21
(In p
erce
nt)
Fig IV.14: Developments in Average Weighted Yields of T-bills with Different Maturities
28-day
91-day
182-day
364-day
0
2.5
5
7.5
10
4.9238
I II III IV I II III IV I II III IV I II
2017/18 2018/19 2019/20 2020/21
(In p
erce
nt)
Fig IV.14: Developments in Average Weighted Yields of T-bills with Different Maturities
28-day
91-day
182-day
364-day
0
2.5
5
7.5
10
4.9238
I II III IV I II III IV I II III IV I II
2017/18 2018/19 2019/20 2020/21
(In p
erce
nt)
Fig IV.14: Developments in Average Weighted Yields of T-bills with Different Maturities
28-day
91-day
182-day
364-day
0
2.5
5
7.5
10
4.9238
I II III IV I II III IV I II III IV I II
2017/18 2018/19 2019/20 2020/21
(In p
erce
nt)
Fig IV.14: Developments in Average Weighted Yields of T-bills with Different Maturities
28-day
91-day
182-day
364-day
Table 4.14: Results of Treasury Bills Auction
(In Millions of Birr)2019/20 2020/21
Change %Quarter IV Quarter III Quarter IV
A B C C/A C/B
Number of Bidders 41.00 55.00 107.00 160.98 94.55
Public 21.00 25.00 53.00 152.38 112.00
Private 20.00 30.00 54.00 0.00 80.00
Number of Bids received 50.00 55.00 107.00 114.00 94.55
Public 21.00 25.00 53.00 152.38 112.00
Private 29.00 30.00 54.00 86.21 80.00
(Amount Demanded (Mn. Birr 26,634.00 48,908.10 126,797.85 376.08 159.26
28-day bill 904.00 5,875.00 28,705.55 3075.39 388.61
91-day bill 17,150.00 20,876.00 55,231.30 222.05 164.57
182-day bill 8,580.00 10,083.70 24,067.00 180.50 138.67
364-day bill - 12,073.40 18,794.00 - 55.66
(Amount Supplied (Mn. Birr 27,791.00 100,000.00 130,000.00 367.78 30.00
28-day bill 660.00 5,100.00 22,000.00 3233.33 331.37
91-day bill 12,046.00 29,200.00 39,000.00 223.76 33.56
182-day bill 15,085.00 44,300.00 40,500.00 168.48 (8.58)
364-day bill - 21,400.00 28,500.00 - 33.18
(Amount Sold (Mn. Birr 20,534.00 48,633.10 110,553.85 438.39 127.32
Banks 5,644.00 19,980.00 53,214.55 842.85 166.34
Non-Banks 14,890.00 28,653.10 57,339.30 285.09 100.12
(Redemption (Mn. Birr 28,309.00 28,309.00
(%) Average Weighted Price for Successful bids 98.13 96.37 95.87 (2.31) -0.52
28-day bill 99.56 99.42 99.28 -0.28 -0.14
91-day bill 98.33 97.97 97.16 -1.19 -0.83
182-day bill 96.52 96.23 95.54 -1.01 -0.71
364-day bill - 91.86 91.49 - -0.41
(%) Average Weighted Yield for Successful bids 6.604 8.165 9.970 50.97 22.10
28-day bill 5.75 7.599 9.450 64.35 24.36
91-day bill 6.822 8.310 11.743 72.13 41.31
182-day bill 7.24 7.864 9.354 29.21 18.94
364-day bill - 8.888 9.332 - 5.00
(.Outstanding bills at the end of Period (Mn.Br 28,474.00 68,893.70 116,559.95 309.36 69.19
Banks 5,604.00 18,970.00 52,040.00 828.62 174.33Non-Banks 22,870.00 49,923.70 64,519.95 182.12 29.24
Source: National Bank of Ethiopia (NBE)

Fourth Quarter 2020/21 | 41
National Bank of Ethiopia Quarterly Bulletin
National Bank of Ethiopia Quarterly Bulletin
44Fourth Quarter 2020/21
Source: National Bank of Ethiopia (NBE)
Fig.IV.13: Development in Treasury- bills Markets
Source NBE
Fig.IV.14: Developments in Average weighted Yields of T-bills
-
50,000.00
100,000.00
150,000.00
200,000.00
250,000.00
300,000.00
IV I II III IV I II III IV I II III IV I II III IV
2017/18 2018/19 2019/20 2020/21
Supply
Demand
0
2.5
5
7.5
10
IV I II III IV I II III IV I II III IV I II III IV
2017/18 2018/19 2019/20 2020/21
(In p
erce
nt)
28-day
91-day
182-day
364-day
-
50,000.00
100,000.00
150,000.00
200,000.00
250,000.00
300,000.00
IV I II III IV I II III IV I II III IV I II III IV
2017/18 2018/19 2019/20 2020/21
Supply
Demand
National Bank of Ethiopia Quarterly Bulletin
45 Fourth Quarter 2020/21
Source NBE
4.7.2. Inter- Bank Money Market
No inter-bank money market
transactions were conducted during
the 4th quarter of 2020/21.
4.7.3. Corporate Bond Market
Although, corporate bond market is not
well developed in Ethiopia, few public
institutions and regional governments
have continued to play a pivotal role in
the corporate bond market. The sole
purchaser of these bonds is the
Commercial Bank of Ethiopia (CBE).
Accordingly, CBE has purchased
corporate bonds worth Birr 4.2 billion,
which, were solely issued by Ethiopian
Electric Power (EEP) and Ethiopian
Electric Utility (EEU) during the review
quarter. At the same time, the amount
of corporate bonds redeemed reached
Birr 2.1 billion, of which Birr 1.8 billion was
by the Addis Ababa, city administration
and Birr 334.4 million was by EEP&EEU.
At the end of June 2021, the stock of
corporate bonds held by the CBE stood
at Birr 444.9 billion, of which 88.2
percent was a claim on public
enterprises, while the remaining
balance was held by regional
governments (Table 4.15). Corporate
bonds issued by EEP&EEU accounted
72.1 percent of the total outstanding
corporate bond balance.
0
2.5
5
7.5
10
4.9238
I II III IV I II III IV I II III IV I II III IV I II III IV I II III IV I II III IV I II III IV I II III IV I II III IV I II III IV I II III IV I II
2008/9 2009/10 2010/11 2011/12 2012/13 2013/14 2014/15 2015/16 2016/17 2017/18 2018/19 2019/20 2020/21
(In p
erce
nt)
Fig IV.14: Developments in Average Weighted Yields of T-bills with Different Maturities
28-day
91-day
182-day
364-day
0
2.5
5
7.5
10
4.9238
I II III IV I II III IV I II III IV I II
2017/18 2018/19 2019/20 2020/21
(In p
erce
nt)
Fig IV.14: Developments in Average Weighted Yields of T-bills with Different Maturities
28-day
91-day
182-day
364-day
0
2.5
5
7.5
10
4.9238
I II III IV I II III IV I II III IV I II
2017/18 2018/19 2019/20 2020/21
(In p
erce
nt)
Fig IV.14: Developments in Average Weighted Yields of T-bills with Different Maturities
28-day
91-day
182-day
364-day
0
2.5
5
7.5
10
4.9238
I II III IV I II III IV I II III IV I II
2017/18 2018/19 2019/20 2020/21
(In p
erce
nt)
Fig IV.14: Developments in Average Weighted Yields of T-bills with Different Maturities
28-day
91-day
182-day
364-day

42 | Fourth Quarter 2020/21
National Bank of Ethiopia Quarterly Bulletin
National Bank of Ethiopia Quarterly Bulletin
45 Fourth Quarter 2020/21
Source NBE
4.7.2. Inter- Bank Money Market
No inter-bank money market
transactions were conducted during
the 4th quarter of 2020/21.
4.7.3. Corporate Bond Market
Although, corporate bond market is not
well developed in Ethiopia, few public
institutions and regional governments
have continued to play a pivotal role in
the corporate bond market. The sole
purchaser of these bonds is the
Commercial Bank of Ethiopia (CBE).
Accordingly, CBE has purchased
corporate bonds worth Birr 4.2 billion,
which, were solely issued by Ethiopian
Electric Power (EEP) and Ethiopian
Electric Utility (EEU) during the review
quarter. At the same time, the amount
of corporate bonds redeemed reached
Birr 2.1 billion, of which Birr 1.8 billion was
by the Addis Ababa, city administration
and Birr 334.4 million was by EEP&EEU.
At the end of June 2021, the stock of
corporate bonds held by the CBE stood
at Birr 444.9 billion, of which 88.2
percent was a claim on public
enterprises, while the remaining
balance was held by regional
governments (Table 4.15). Corporate
bonds issued by EEP&EEU accounted
72.1 percent of the total outstanding
corporate bond balance.
0
2.5
5
7.5
10
4.9238
I II III IV I II III IV I II III IV I II III IV I II III IV I II III IV I II III IV I II III IV I II III IV I II III IV I II III IV I II III IV I II
2008/9 2009/10 2010/11 2011/12 2012/13 2013/14 2014/15 2015/16 2016/17 2017/18 2018/19 2019/20 2020/21
(In p
erce
nt)
Fig IV.14: Developments in Average Weighted Yields of T-bills with Different Maturities
28-day
91-day
182-day
364-day
0
2.5
5
7.5
10
4.9238
I II III IV I II III IV I II III IV I II
2017/18 2018/19 2019/20 2020/21
(In p
erce
nt)
Fig IV.14: Developments in Average Weighted Yields of T-bills with Different Maturities
28-day
91-day
182-day
364-day
0
2.5
5
7.5
10
4.9238
I II III IV I II III IV I II III IV I II
2017/18 2018/19 2019/20 2020/21
(In p
erce
nt)
Fig IV.14: Developments in Average Weighted Yields of T-bills with Different Maturities
28-day
91-day
182-day
364-day
0
2.5
5
7.5
10
4.9238
I II III IV I II III IV I II III IV I II
2017/18 2018/19 2019/20 2020/21
(In p
erce
nt)
Fig IV.14: Developments in Average Weighted Yields of T-bills with Different Maturities
28-day
91-day
182-day
364-day

Fourth Quarter 2020/21 | 43
National Bank of Ethiopia Quarterly Bulletin
Table 4.15: Corporate Bond Purchase, Redemption and Outstanding In millions of Birr
Issuer of the Bond
2019/20 2020/21
QIV QIV
NP Red O/S NP Red O/S
1.Puplic Enterprises 12,271.8 10,400.5 359,032.7 4,153.37 334.42 392,271.95
EEP&EEU 9,516.2
4,856.6 302,345.73 4,153.37 334.42 320,885.72
Railways Corporation 2,755.6
5,543.9 56,686.98 - 71,386.23
DBE -
- - -
2. Regional Governments 1,300.0 724.9 46,192.35 - 1,771.00 52,599.78
Oromia -
3.7 414.12 -
376.06 Amhara
-
- - - -
Tigray -
0.1 91.54 - 91.54
SNNPRS -
- - - -
Dire Dawa -
- 0.00 -
0.00 Harari
-
- 0.00 - 0.00
City Government of Addis Ababa
1,300.0
721.1 45,686.69 - 1,771.00 52,132.19
3.Grand Total (1+2) 13,571.8 11,125.4 405,225.05 4,153.37 2,105.43 444,871.73
Source: NBENote: NP= New Purchase, Red. = Redemption, O/S= outstanding

44 | Fourth Quarter 2020/21
National Bank of Ethiopia Quarterly Bulletin
V. EXTERNAL SECTOR DEVELOPMENTS 5.1. Balance of Payments The overall balance of payments
resulted in USD 933.5 million surplus
compared to USD 659.5 million surplus
a year ago owing to 50.6 percent
upsurge in net inflow of capital
account in contrast to net deficit in
current account balance including
official transfers. Both merchandise
trade balance and net services
recorded substantial reduction while
net private transfers saw a 49.3
percent increase and net capital
account recorded 50.6 percent surge
mainly due to privatization proceeds
from telecom sector (Table 5.1).

Fourth Quarter 2020/21 | 45
National Bank of Ethiopia Quarterly Bulletin
Table 5.1: Balance of Payments (In Millions of USD)
S/N Particulars
2019/20 2020/21 Percentage ChangeQIV QIII1 QIV2
A B C D=C/A E=C/B
1 Exports, f.o.b. 942.9 883.1 1,176.9 24.8 33.3 Coffee 293.1 208.4 395.4 34.9 89.7 Other 649.8 674.7 781.5 20.3 15.82 Imports 2,688.7 3,573.9 3,911.9 45.5 9.5 Fuel 308.6 558.3 600.2 94.5 7.5 Cereals 134.2 306.4 507.3 278.1 65.5 Aircraft 4.5 31.0 72.4 1,501.6 133.7 Imports excl. fuel, cereals, aircraft 2,241.4 2,678.1 2,731.9 21.9 2.03 Trade Balance (1-2) -1,745.8 -2,690.8 -2,735.1 56.7 1.64 Services, net 2.3 187.2 -154.8 -6,937.7 -182.7 Non-factor services, net 112.6 257.2 -15.8 -114.1 -106.2 Exports of non-factor services 987.8 1,202.5 1,302.7 31.9 8.3 Imports of non-factor services 875.2 945.3 1,318.5 50.7 39.5 Factor services (Investment income), net -110.3 -70.0 -139.0 26.0 98.5 Interest, net -110.3 -70.0 -138.9 26.0 98.4 Dividend, net -0.1 5 Private transfers, net 1,200.3 1,443.4 1,792.5 49.3 24.2 o/w: NGO's,(Net) 240.8 264.0 378.8 57.3 43.5 Private Individuals 959.5 1,179.4 1,413.7 47.3 19.96 Current account balance excluding official transfers (3+4+5) -543.2 -1,060.2 -1,097.5 102.0 3.57 Official transfers, net 619.9 160.9 170.7 -72.5 6.18 Current account balance including official transfers(6+7) 76.7 -899.2 -926.7 -1,307.9 3.19 Capital account 1,229.2 587.9 1,851.7 50.6 215.0 Official Long-term Capital, net 985.9 134.5 216.5 -78.0 60.9 Disbursements 1,024.9 149.6 269.5 -73.7 80.1 Amortization 39.0 15.1 53.0 35.6 251.5 Other public long-term capital -137.4 -280.9 -238.1 73.2 -15.2 Private sector, long term 18.6 32.3 63.7 242.1 97.2 Foreign Direct Investment, net 495.9 725.1 1,906.7 284.5 163.0 Short-term Capital -133.8 -23.1 -97.1 -27.4 320.6
10 Errors and Omissions [11-(9+8)] -646.4 25.4 8.6 11 Overall balance (-13) 659.5 -285.9 933.5 12 Financing (13+16) -659.5 285.9 -933.5 13 Reserves [ Increase(-), Decrease (+)] (14+15) -659.5 285.9 -933.5 14 Central Bank (NFA) -396.3 490.7 -488.4 Asset -659.8 803.0 -647.5 Liabilities 263.5 -312.3 159.1
15 Commercial banks (NFA) -263.2 -204.8 -445.1 16 Debt Relief Principal Interest
Source: NBE Staff Compilation
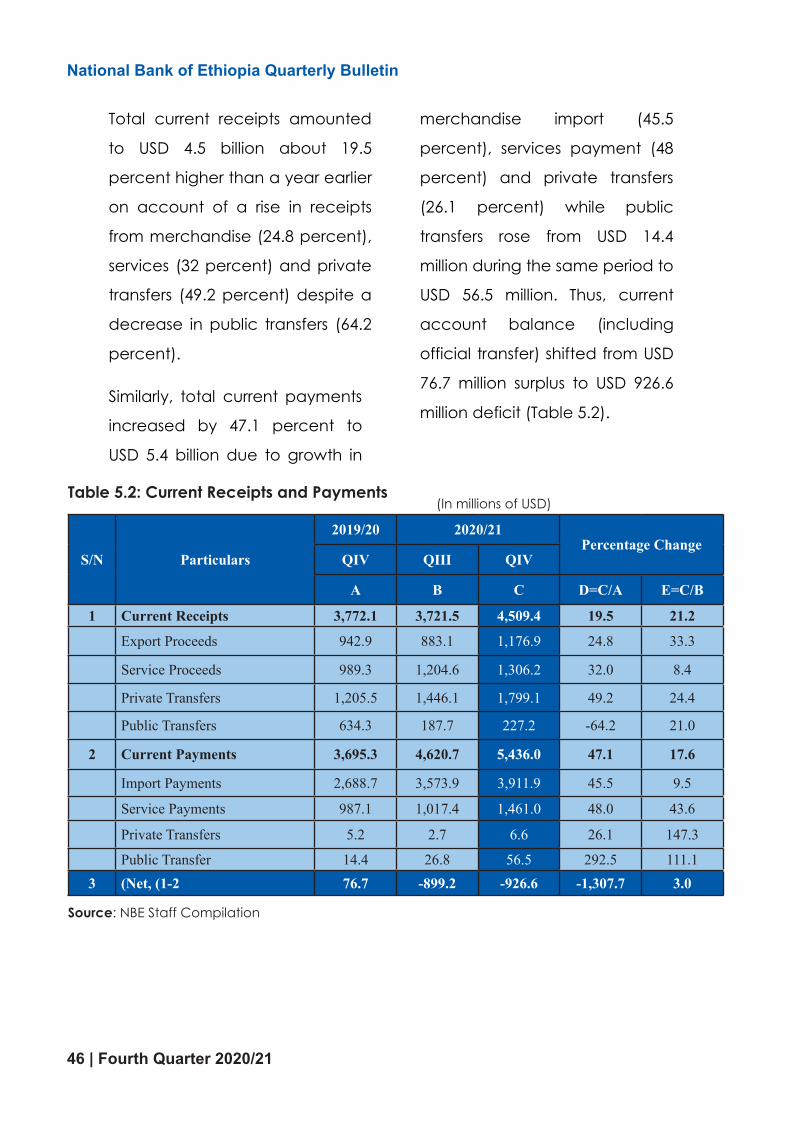
46 | Fourth Quarter 2020/21
National Bank of Ethiopia Quarterly Bulletin National Bank of Ethiopia Quarterly Bulletin
49
Total current receipts amounted
to USD 4.5 billion about 19.5
percent higher than a year earlier
on account of a rise in receipts
from merchandise (24.8 percent),
services (32 percent) and private
transfers (49.2 percent) despite a
decrease in public transfers (64.2
percent).
Similarly, total current payments
increased by 47.1 percent to
USD 5.4 billion due to growth in
merchandise import (45.5
percent), services payment (48
percent) and private transfers
(26.1 percent) while public
transfers rose from USD 14.4
million during the same period to
USD 56.5 million. Thus, current
account balance (including
official transfer) shifted from USD
76.7 million surplus to USD 926.6
million deficit (Table 5.2).
Table 5.2: Current Receipts and Payments
(In millions of USD)
S/N Particulars
2019/20 2020/21 Percentage Change QIV QIII QIV
A B C D=C/A E=C/B
1 Current Receipts 3,772.1 3,721.5 4,509.4 19.5 21.2
Export Proceeds 942.9 883.1 1,176.9 24.8 33.3
Service Proceeds 989.3 1,204.6 1,306.2 32.0 8.4
Private Transfers 1,205.5 1,446.1 1,799.1 49.2 24.4
Public Transfers 634.3 187.7 227.2 -64.2 21.0
2 Current Payments 3,695.3 4,620.7 5,436.0 47.1 17.6
Import Payments 2,688.7 3,573.9 3,911.9 45.5 9.5
Service
Payments 987.1 1,017.4 1,461.0 48.0 43.6
Private Transfers 5.2 2.7 6.6 26.1 147.3
Public Transfer 14.4 26.8 56.5 292.5 111.1
3 Net, (1-2) 76.7 -899.2 -926.6 -1,307.7 3.0 Source: NBE Staff Compilation
Table 5.2: Current Receipts and Payments (In millions of USD)
S/N Particulars
2019/20 2020/21Percentage Change
QIV QIII QIV
A B C D=C/A E=C/B
1 Current Receipts 3,772.1 3,721.5 4,509.4 19.5 21.2
Export Proceeds 942.9 883.1 1,176.9 24.8 33.3
Service Proceeds 989.3 1,204.6 1,306.2 32.0 8.4
Private Transfers 1,205.5 1,446.1 1,799.1 49.2 24.4
Public Transfers 634.3 187.7 227.2 -64.2 21.0
2 Current Payments 3,695.3 4,620.7 5,436.0 47.1 17.6
Import Payments 2,688.7 3,573.9 3,911.9 45.5 9.5
Service Payments 987.1 1,017.4 1,461.0 48.0 43.6
Private Transfers 5.2 2.7 6.6 26.1 147.3
Public Transfer 14.4 26.8 56.5 292.5 111.13 (Net, (1-2 76.7 -899.2 -926.6 -1,307.7 3.0
Source: NBE Staff Compilation
National Bank of Ethiopia Quarterly Bulletin
50
Source: NBE Staff Compilation
5.2. Balance of Trade
During the fourth quarter of
2020/21, merchandise trade
deficit widened to USD 2.7 billion
from USD 1.7 billion a
year ago as import payments
outweighed merchandise export
receipts.
-
1,000.0
2,000.0
3,000.0
4,000.0
5,000.0
6,000.0
7,000.0
Qtr
I
Qtr
II
Qtr
III
Qtr
IV
Qtr
I
Qtr
II
Qtr
III
Qtr
IV
Qtr
I
Qtr
II
Qtr
III
Qtr
IV
Qtr
I
Qtr
II
Qtr
III
Qtr
IV
Qtr
I
Qtr
II
Qtr
III
Qtr
IV
2016/17 2017/18 2018/19 2019/20 2020/21
In M
illio
ns o
f USD
Fig V.1: Trends in Current Receipts and Payments
Current Receipts Current Payments
National Bank of Ethiopia Quarterly Bulletin
51
Source: Ethiopian Customs Commission
Source: Ethiopian Customs Commission
5.2.1. Export of Goods
Total receipts from export of
goods increased by 24.8 percent
over last year same quarter
owing to higher export revenue
mainly from coffee (34.9 percent),
gold (30.6 percent), flower (23.4
0.0
1000.0
2000.0
3000.0
4000.0
5000.0
6000.0
Q1 Q2 Q3 Q4 Q1 Q2 Q3 Q4 Q1 Q2 Q3 Q4 Q1 Q2 Q3 Q4 Q1 Q2 Q3 Q4
2016/17 2017/18 2018/19 2019/20 2020/21(In
Mill
ions
of U
SD)
Fig.V.2: Quarterly Movements in Export Proceeds & Import Payments
Export Import
0.0
500.0
1000.0
1500.0
2000.0
2500.0
3000.0
3500.0
4000.0
4500.0
Q1 Q2 Q3 Q4 Q1 Q2 Q3 Q4 Q1 Q2 Q3 Q4 Q1 Q2 Q3 Q4 Q1 Q2 Q3 Q4
2016/17 2017/18 2018/19 2019/20 2020/21
(In
Mill
ions
USD
)
Fig.V.3:Evolution of Trade Deficit

Fourth Quarter 2020/21 | 47
National Bank of Ethiopia Quarterly BulletinNational Bank of Ethiopia Quarterly Bulletin
49
Total current receipts amounted
to USD 4.5 billion about 19.5
percent higher than a year earlier
on account of a rise in receipts
from merchandise (24.8 percent),
services (32 percent) and private
transfers (49.2 percent) despite a
decrease in public transfers (64.2
percent).
Similarly, total current payments
increased by 47.1 percent to
USD 5.4 billion due to growth in
merchandise import (45.5
percent), services payment (48
percent) and private transfers
(26.1 percent) while public
transfers rose from USD 14.4
million during the same period to
USD 56.5 million. Thus, current
account balance (including
official transfer) shifted from USD
76.7 million surplus to USD 926.6
million deficit (Table 5.2).
Table 5.2: Current Receipts and Payments
(In millions of USD)
S/N Particulars
2019/20 2020/21 Percentage Change QIV QIII QIV
A B C D=C/A E=C/B
1 Current Receipts 3,772.1 3,721.5 4,509.4 19.5 21.2
Export Proceeds 942.9 883.1 1,176.9 24.8 33.3
Service Proceeds 989.3 1,204.6 1,306.2 32.0 8.4
Private Transfers 1,205.5 1,446.1 1,799.1 49.2 24.4
Public Transfers 634.3 187.7 227.2 -64.2 21.0
2 Current Payments 3,695.3 4,620.7 5,436.0 47.1 17.6
Import Payments 2,688.7 3,573.9 3,911.9 45.5 9.5
Service
Payments 987.1 1,017.4 1,461.0 48.0 43.6
Private Transfers 5.2 2.7 6.6 26.1 147.3
Public Transfer 14.4 26.8 56.5 292.5 111.1
3 Net, (1-2) 76.7 -899.2 -926.6 -1,307.7 3.0 Source: NBE Staff Compilation
National Bank of Ethiopia Quarterly Bulletin
50
Source: NBE Staff Compilation
5.2. Balance of Trade
During the fourth quarter of
2020/21, merchandise trade
deficit widened to USD 2.7 billion
from USD 1.7 billion a
year ago as import payments
outweighed merchandise export
receipts.
-
1,000.0
2,000.0
3,000.0
4,000.0
5,000.0
6,000.0
7,000.0
Qtr
I
Qtr
II
Qtr
III
Qtr
IV
Qtr
I
Qtr
II
Qtr
III
Qtr
IV
Qtr
I
Qtr
II
Qtr
III
Qtr
IV
Qtr
I
Qtr
II
Qtr
III
Qtr
IV
Qtr
I
Qtr
II
Qtr
III
Qtr
IV
2016/17 2017/18 2018/19 2019/20 2020/21
In M
illio
ns o
f USD
Fig V.1: Trends in Current Receipts and Payments
Current Receipts Current Payments
National Bank of Ethiopia Quarterly Bulletin
51
Source: Ethiopian Customs Commission
Source: Ethiopian Customs Commission
5.2.1. Export of Goods
Total receipts from export of
goods increased by 24.8 percent
over last year same quarter
owing to higher export revenue
mainly from coffee (34.9 percent),
gold (30.6 percent), flower (23.4
0.0
1000.0
2000.0
3000.0
4000.0
5000.0
6000.0
Q1 Q2 Q3 Q4 Q1 Q2 Q3 Q4 Q1 Q2 Q3 Q4 Q1 Q2 Q3 Q4 Q1 Q2 Q3 Q4
2016/17 2017/18 2018/19 2019/20 2020/21
(In M
illio
ns o
f USD
)
Fig.V.2: Quarterly Movements in Export Proceeds & Import Payments
Export Import
0.0
500.0
1000.0
1500.0
2000.0
2500.0
3000.0
3500.0
4000.0
4500.0
Q1 Q2 Q3 Q4 Q1 Q2 Q3 Q4 Q1 Q2 Q3 Q4 Q1 Q2 Q3 Q4 Q1 Q2 Q3 Q4
2016/17 2017/18 2018/19 2019/20 2020/21
(In
Mill
ions
USD
)
Fig.V.3:Evolution of Trade Deficit
5.2. Balance of Trade During the fourth quarter of 2020/21,
merchandise trade deficit widened
to USD 2.7 billion from USD 1.7 billion a
year ago as import payments
outweighed merchandise export
receipts.

48 | Fourth Quarter 2020/21
National Bank of Ethiopia Quarterly Bulletin
National Bank of Ethiopia Quarterly Bulletin
51
Source: Ethiopian Customs Commission
Source: Ethiopian Customs Commission
5.2.1. Export of Goods
Total receipts from export of
goods increased by 24.8 percent
over last year same quarter
owing to higher export revenue
mainly from coffee (34.9 percent),
gold (30.6 percent), flower (23.4
0.0
1000.0
2000.0
3000.0
4000.0
5000.0
6000.0
Q1 Q2 Q3 Q4 Q1 Q2 Q3 Q4 Q1 Q2 Q3 Q4 Q1 Q2 Q3 Q4 Q1 Q2 Q3 Q4
2016/17 2017/18 2018/19 2019/20 2020/21
(In M
illio
ns o
f USD
)
Fig.V.2: Quarterly Movements in Export Proceeds & Import Payments
Export Import
0.0
500.0
1000.0
1500.0
2000.0
2500.0
3000.0
3500.0
4000.0
4500.0
Q1 Q2 Q3 Q4 Q1 Q2 Q3 Q4 Q1 Q2 Q3 Q4 Q1 Q2 Q3 Q4 Q1 Q2 Q3 Q4
2016/17 2017/18 2018/19 2019/20 2020/21
(In
Mill
ions
USD
) Fig.V.3:Evolution of Trade Deficit
Total receipts from export of goods increased by 24.8 percent over last year same quarter owing to higher export revenue mainly from coffee (34.9 percent), gold (30.6 percent), flower (23.4 percent), chat (70.1 percent), leather & leather products (9.4 percent), meat & meat products (49.3 percent), fruits & vegetables (47.2 percent), textile & textile products (26.6 percent), electricity (19.8 percent) and other export items (59.7 percent). On the other hand, receipts from oilseeds (30.6 percent) and pulses (3.3 percent) have decided during the review quarter.
Export revenue from coffee surged 34.9 percent over last year due to international price (2.1 percent) and export volume (32.2 percent). As a result, the share of coffee in total export earnings rose to 33.6 percent from 31.1 percent a year earlier.
Likewise, export earnings from gold went up 30.6 percent year-on-year mainly as a result of 26.0 percent and increase in export volume and 3.7 percent in international price. Hence, the share of gold in total merchandise export slightly rose to 18.8 percent from 18.0 percent last year same quarter.
Export receipts from flower grew 23.4 percent due to a 17.3 percent increase in export volume and 5.2 percent in price. The share of flower in total merchandise export, however, remained around 10.7 percent.
Earnings from chat export surged 70.1 percent and reached USD 116.5 million as a result of higher export volume (68.5 percent) and international price (0.9 percent). With its share in total merchandise export reaching 9.9 percent compared with 7.3 percent a year earlier.
5.2.1. Export of Goods

Fourth Quarter 2020/21 | 49
National Bank of Ethiopia Quarterly Bulletin
National Bank of Ethiopia Quarterly Bulletin
51
Source: Ethiopian Customs Commission
Source: Ethiopian Customs Commission
5.2.1. Export of Goods
Total receipts from export of
goods increased by 24.8 percent
over last year same quarter
owing to higher export revenue
mainly from coffee (34.9 percent),
gold (30.6 percent), flower (23.4
0.0
1000.0
2000.0
3000.0
4000.0
5000.0
6000.0
Q1 Q2 Q3 Q4 Q1 Q2 Q3 Q4 Q1 Q2 Q3 Q4 Q1 Q2 Q3 Q4 Q1 Q2 Q3 Q4
2016/17 2017/18 2018/19 2019/20 2020/21
(In M
illio
ns o
f USD
)
Fig.V.2: Quarterly Movements in Export Proceeds & Import Payments
Export Import
0.0
500.0
1000.0
1500.0
2000.0
2500.0
3000.0
3500.0
4000.0
4500.0
Q1 Q2 Q3 Q4 Q1 Q2 Q3 Q4 Q1 Q2 Q3 Q4 Q1 Q2 Q3 Q4 Q1 Q2 Q3 Q4
2016/17 2017/18 2018/19 2019/20 2020/21
(In
Mill
ions
USD
)
Fig.V.3:Evolution of Trade Deficit Export revenue from electricity increased 19.8 percent over last year as export volume increased 23.8 percent despite 3.2 percent decline in international price. The share of electricity in total export earnings was to 2.4 percent.
Export receipts from meat & meat products stood at USD 22.8 million, showing 49.3 percent annual growth as export volume rose 49.1 percent and international price by 0.1 percent. Thus the share of meat & meat products in total export earnings increased to 1.9 percent from 1.6 percent a year ago.
Similarly, export revenue from live-animals depicted 0.9 percent annual increase owing to 4.7 percent rise in export volume albeit 3.6 percent drop in international price. Hence, the share of live-animals in total merchandise export earnings stood at 1.1 percent.
Export receipts from fruits & vegetables reached USD 19.1 million, showing 47.2 percent year-on-year growth owing to 5.9 percent growth in price and 39.1 percent in volume. Hence, the share of fruits & vegetables in total merchandise export receipt slightly increased to 1.6 percent from 1.4 percent a year earlier. Likewise, export revenue from textile & textile products having a 3.2 percent share in total merchandise export increased 26.6 percent on account of 63.7 percent hike in export volume despite 22.7 percent fall in international
price. Similarly, revenue from export of leather & leather products increased by 9.4 percent vis-à-vis same quarter of last year owing to a 15.4 percent rise in export volume despite a 5.2 percent drops in price. The share of these export items in total merchandise export was 0.8 percent.
Meanwhile, export revenue from oilseeds declined 30.6 percent due to a 29.4 percent fall in export volume and 1.6 percent in international price. The share of oilseeds in total export earnings also declined to 6.4 percent from 11.6 percent a year ago.
Likewise, export receipts from pulses showed 3.3 percent decrement which was mainly attributed to the fall in export volume (23.6 percent) despite the rise in international price (26.5 percent). Hence, the share of pulses in total merchandise export revenue decreased to 5.8 percent from 7.4 percent last year (Tables 5.3, 5.4 and 5.5).

50 | Fourth Quarter 2020/21
National Bank of Ethiopia Quarterly Bulletin
Table 5.3: Values of Major Export Items (In Millions of USD)
Particulars
2019/20 2020/21 Percentage ChangeQIV QIII QIV
A share% B share% C share% C/A C/B
Coffee 293.1 31.1 208.4 23.6 395.4 33.6 34.9 89.7
Oilseeds 109.2 11.6 106.1 12.0 75.8 6.4 -30.6 -28.6
Leather and Leather Products 8.7 0.9 9.1 1.0 9.6 0.8 9.4 5.1
Pulses 70.2 7.4 81.0 9.2 67.8 5.8 -3.3 -16.3
Meat & Meat Products 15.2 1.6 20.2 2.3 22.8 1.9 49.3 12.7
Fruits & Vegetables 13.0 1.4 22.2 2.5 19.1 1.6 47.2 -13.9
Textile & TextileProducts 29.5 3.1 34.4 3.9 37.3 3.2 26.6 8.6
Live Animals 13.0 1.4 10.8 1.2 13.1 1.1 0.9 20.8
Chat 68.5 7.3 98.3 11.1 116.5 9.9 70.1 18.5
Gold 169.4 18.0 114.9 13.0 221.3 18.8 30.6 92.6
Flower 102.0 10.8 131.4 14.9 125.8 10.7 23.4 -4.3
Electricity 23.5 2.5 20.1 2.3 28.1 2.4 19.8 40.0
Others 27.7 2.9 26.2 3.0 44.3 3.8 59.7 69.2
Total Export 942.9 100 883.1 100 1176.9 100 24.8 33.3
Total ExportExcluding Electricity 919.4 863.1 1148.7 24.9 33.1
Source: Customs Commission, Ethiopian Electric Utility and Ethiopian Electric PowerNational Bank of Ethiopia Quarterly Bulletin
55
Source: NBE Staff Compilation
Table 5.4: Volume of Major Export Items (In millions of Kg)
Particulars 2019/20 2020/21 Percentage
Change QIV QIII QIV A B C C/A C/B
Coffee 76.9 55.0 101.7 32.2 84.9 Oilseeds 77.4 76.2 54.6 -29.4 -28.3 Leather and Leather Products 0.5 0.6 0.6 15.4 -5.7
Pulses 97.0 92.3 74.1 -23.6 -19.7 Meat & Meat Products 2.9 4.0 4.3 49.1 8.7 Fruits & Vegetables 51.7 64.7 71.9 39.1 11.1 Textile & Textile Products 4.2 5.7 6.8 63.7 18.5 Live Animals 7.3 6.6 7.7 4.7 16.6 Chat 12.2 17.2 20.6 68.5 19.8 Gold(In mn. of grams) 2.6 1.6 3.3 26.0 102.4 Flower 23.4 27.4 27.5 17.3 0.4 Electricity(In mn of kwh) 408.0 359.6 505.2 23.8 40.5
Source: Ethiopian Customs Commission, Ethiopian Electric Utility and Ethiopian Electric Power
04080
120160200240280320360400
QI QII QIIIQIV QI QII QIIIQIV QI QII QIIIQIV QI QII QIIIQIV QI QII QIIIQIV
2016/17 2017/18 2018/19 2019/20 2020/21
(Mill
ions
USD
)
Fig.V.4: Export Value of Selected Commodities
Coffee Oil Seeds Leather and Leather Products Pulses Flower Gold Chat
National Bank of Ethiopia Quarterly Bulletin
56
Source: NBE Staff Computation
Table 5.5: Unit Value of Major Export Items
(In USD/kg unless and otherwise specified)
Particulars
2019/20 2020/21 Percentage Change QIV QIII QIV
A B C C/A C/B
Coffee 3.8 3.8 3.9 2.1 2.6 Oilseeds 1.4 1.4 1.4 -1.6 -0.3 Leather and Leather Products 17.1 14.5 16.2 -5.2 11.5
Pulses 0.7 0.9 0.9 26.5 4.2 Meat & Meat Products 5.3 5.1 5.3 0.1 3.7 Fruits & Vegetables 0.3 0.3 0.3 5.9 -22.5 Textile & Textile Products 7.1 6.0 5.5 -22.7 -8.4 Live Animals 1.8 1.6 1.7 -3.6 3.6 Chat 5.6 5.7 5.7 0.9 -1.0 Gold(USD/gram) 64.4 70.1 66.7 3.7 -4.9 Flower 4.4 4.8 4.6 5.2 -4.6 Electricity(USD/kwh) 0.1 0.1 0.1 -3.2 -0.3
Source: Ethiopian Customs Commission, Ethiopian Electric Utility and Ethiopian Electric Power
020406080
100120140160
QI QII QIII QIV QI QII QIII QIV QI QII QIII QIV QI QII QIII QIV QI QII QIII QIV
2016/17 2017/18 2018/19 2019/20 2020/21
(Mill
ions
Kg.
)
Fig.V.5: Export Volume of Selected Commodities
Coffee Oil Seeds Leather & Leather Products Pulses Flower Gold Chat

Fourth Quarter 2020/21 | 51
National Bank of Ethiopia Quarterly Bulletin
Table 5.4: Volume of Major Export Items (In Millions of Kg)
Particulars
2019/20 2020/21 Percentage Change
QIV QIII QIV
A B C C/A C/BCoffee 76.9 55.0 101.7 32.2 84.9Oilseeds 77.4 76.2 54.6 -29.4 -28.3
Leather and Leather Products 0.5 0.6 0.6 15.4 -5.7Pulses 97.0 92.3 74.1 -23.6 -19.7Meat & Meat Products 2.9 4.0 4.3 49.1 8.7Fruits & Vegetables 51.7 64.7 71.9 39.1 11.1Textile & Textile Products 4.2 5.7 6.8 63.7 18.5Live Animals 7.3 6.6 7.7 4.7 16.6Chat 12.2 17.2 20.6 68.5 19.8(Gold(In mn. of grams 2.6 1.6 3.3 26.0 102.4Flower 23.4 27.4 27.5 17.3 0.4(Electricity(In mn of kwh 408.0 359.6 505.2 23.8 40.5
Source: Custom Commissions, Ethiopian Electric Utility and Ethiopian Electric Power
National Bank of Ethiopia Quarterly Bulletin
56
Source: NBE Staff Computation
Table 5.5: Unit Value of Major Export Items
(In USD/kg unless and otherwise specified)
Particulars
2019/20 2020/21 Percentage Change QIV QIII QIV
A B C C/A C/B
Coffee 3.8 3.8 3.9 2.1 2.6 Oilseeds 1.4 1.4 1.4 -1.6 -0.3 Leather and Leather Products 17.1 14.5 16.2 -5.2 11.5
Pulses 0.7 0.9 0.9 26.5 4.2 Meat & Meat Products 5.3 5.1 5.3 0.1 3.7 Fruits & Vegetables 0.3 0.3 0.3 5.9 -22.5 Textile & Textile Products 7.1 6.0 5.5 -22.7 -8.4 Live Animals 1.8 1.6 1.7 -3.6 3.6 Chat 5.6 5.7 5.7 0.9 -1.0 Gold(USD/gram) 64.4 70.1 66.7 3.7 -4.9 Flower 4.4 4.8 4.6 5.2 -4.6 Electricity(USD/kwh) 0.1 0.1 0.1 -3.2 -0.3
Source: Ethiopian Customs Commission, Ethiopian Electric Utility and Ethiopian Electric Power
020406080
100120140160
QI QII QIII QIV QI QII QIII QIV QI QII QIII QIV QI QII QIII QIV QI QII QIII QIV
2016/17 2017/18 2018/19 2019/20 2020/21
(Mill
ions
Kg.
)
Fig.V.5: Export Volume of Selected Commodities
Coffee Oil Seeds Leather & Leather Products Pulses Flower Gold Chat

52 | Fourth Quarter 2020/21
National Bank of Ethiopia Quarterly Bulletin
Table 5.5: Unit Value of Major Export Items (In USD/kg)
Particulars2019/20 2020/21
Percentage ChangeQIV QIII QIV
A B C C/A C/BCoffee 3.8 3.8 3.9 2.1 2.6Oilseeds 1.4 1.4 1.4 -1.6 -0.3
Leather and Leather Products 17.1 14.5 16.2 -5.2 11.5
Pulses 0.7 0.9 0.9 26.5 4.2Meat & Meat Products 5.3 5.1 5.3 0.1 3.7Fruits & Vegetables 0.3 0.3 0.3 5.9 -22.5Textile & Textile Products 7.1 6.0 5.5 -22.7 -8.4Live Animals 1.8 1.6 1.7 -3.6 3.6Chat 5.6 5.7 5.7 0.9 -1.0(Gold(USD/gram 64.4 70.1 66.7 3.7 -4.9Flower 4.4 4.8 4.6 5.2 -4.6(Electricity(USD/kwh 0.1 0.1 0.1 -3.2 -0.3
Source: Custom Commission, Ethiopian Electric Utility and Ethiopian Electric Power
National Bank of Ethiopia Quarterly Bulletin
57
Source: NBE Staff Computation
5.2.2. Import of Goods
Total merchandise import stood
at USD 3.9 billion during the fourth
quarter of 2020/21, depicting 45.5
percent annual growth due to
significant surge in import values
of capital goods, consumer
goods, fuel and miscellaneous
goods.
Capital goods import increased
by 31.8 percent as import bills of
transport and industrial capital
goods hiked 103.3 percent and
28.4 percent, respectively.
Nonetheless, the share of capital
goods in total imports declined to
25.6 percent from 28.3 percent a
year earlier.
Likewise, import value of fuel
surged by 94.5 percent and its
share in total import payments
went up 15.3 percent from 11.5
percent a year ago.
Imports of consumer goods grew
89.2 percent over last year same
quarter as import payments for
non-durable goods accelerated
by 99.9 percent and durable
goods import by 41.7 percent. As
0.0
1.0
2.0
3.0
4.0
5.0
6.0
7.0
01020304050607080
QI
QII
QII
I
QIV Q
I
QII
QII
I
QIV Q
I
QII
QII
I
QIV Q
I
QII
QII
I
QIV Q
I
QII
QII
I
QIV
2016/17 2017/18 2018/19 2019/20 2020/21
(USD
/Kg)
(USD
/kg,
, USD
/gm
(Gol
d))
Fig.V.6: Unit Value of Selected Export Commodities
Leather & Leather Products Gold Coffee (SA) Oil Seeds (SA) Pulses (SA) Flower (SA) Chat (SA)
5.2.2. Import of Goods
Total merchandise import stood at USD 3.9 billion during the fourth quarter of 2020/21, depicting 45.5 percent annual growth due to significant surge in import values of capital goods, consumer goods, fuel and miscellaneous goods.
Capital goods import increased by 31.8 percent as import bills of transport and industrial capital goods hiked 103.3 percent and 28.4 percent, respectively. Nonetheless, the share of capital goods in total imports declined to 25.6 percent from 28.3 percent a year earlier.
Likewise, import value of fuel surged by 94.5 percent and its share in total import payments went up 15.3 percent from 11.5 percent a year ago.
Imports of consumer goods grew 89.2 percent over last year same quarter as import payments for non-durable goods accelerated by 99.9 percent and durable goods import by 41.7 percent. As a result, the share of consumer goods in total imports increased
to 38.5 percent from 29.6 percent last year.
Similarly, imports of miscellaneous goods increased by 20.3 percent, although, their share in total imports slightly decreased to 1.1 percent from 1.4 percent during the same period.
On the other hand, imports of semi-finished goods decreased by 3.1 percent despite 14.7 percent growth in import bills of fertilizer. Thus, the share of semi-finished goods in total merchandise import dropped to 18.6 percent from 28.0 percent a year earlier.
Similarly, import of raw materials declined by 9.1 percent and their share in total merchandise import stood at 0.8 percent.
Meanwhile, Franco-valuta imports accelerated by 125.3 percent and reached at USD 1.8 billion accounting for 44.9 percent of total import value of the review period.

Fourth Quarter 2020/21 | 53
National Bank of Ethiopia Quarterly Bulletin
National Bank of Ethiopia Quarterly Bulletin
57
Source: NBE Staff Computation
5.2.2. Import of Goods
Total merchandise import stood
at USD 3.9 billion during the fourth
quarter of 2020/21, depicting 45.5
percent annual growth due to
significant surge in import values
of capital goods, consumer
goods, fuel and miscellaneous
goods.
Capital goods import increased
by 31.8 percent as import bills of
transport and industrial capital
goods hiked 103.3 percent and
28.4 percent, respectively.
Nonetheless, the share of capital
goods in total imports declined to
25.6 percent from 28.3 percent a
year earlier.
Likewise, import value of fuel
surged by 94.5 percent and its
share in total import payments
went up 15.3 percent from 11.5
percent a year ago.
Imports of consumer goods grew
89.2 percent over last year same
quarter as import payments for
non-durable goods accelerated
by 99.9 percent and durable
goods import by 41.7 percent. As
0.0
1.0
2.0
3.0
4.0
5.0
6.0
7.0
01020304050607080
QI
QII
QII
I
QIV Q
I
QII
QII
I
QIV Q
I
QII
QII
I
QIV Q
I
QII
QII
I
QIV Q
I
QII
QII
I
QIV
2016/17 2017/18 2018/19 2019/20 2020/21
(USD
/Kg)
(USD
/kg,
, USD
/gm
(Gol
d))
Fig.V.6: Unit Value of Selected Export Commodities
Leather & Leather Products Gold Coffee (SA) Oil Seeds (SA) Pulses (SA) Flower (SA) Chat (SA)
5.2.2. Import of Goods
Total merchandise import stood at USD 3.9 billion during the fourth quarter of 2020/21, depicting 45.5 percent annual growth due to significant surge in import values of capital goods, consumer goods, fuel and miscellaneous goods.
Capital goods import increased by 31.8 percent as import bills of transport and industrial capital goods hiked 103.3 percent and 28.4 percent, respectively. Nonetheless, the share of capital goods in total imports declined to 25.6 percent from 28.3 percent a year earlier.
Likewise, import value of fuel surged by 94.5 percent and its share in total import payments went up 15.3 percent from 11.5 percent a year ago.
Imports of consumer goods grew 89.2 percent over last year same quarter as import payments for non-durable goods accelerated by 99.9 percent and durable goods import by 41.7 percent. As a result, the share of consumer goods in total imports increased
to 38.5 percent from 29.6 percent last year.
Similarly, imports of miscellaneous goods increased by 20.3 percent, although, their share in total imports slightly decreased to 1.1 percent from 1.4 percent during the same period.
On the other hand, imports of semi-finished goods decreased by 3.1 percent despite 14.7 percent growth in import bills of fertilizer. Thus, the share of semi-finished goods in total merchandise import dropped to 18.6 percent from 28.0 percent a year earlier.
Similarly, import of raw materials declined by 9.1 percent and their share in total merchandise import stood at 0.8 percent.
Meanwhile, Franco-valuta imports accelerated by 125.3 percent and reached at USD 1.8 billion accounting for 44.9 percent of total import value of the review period.
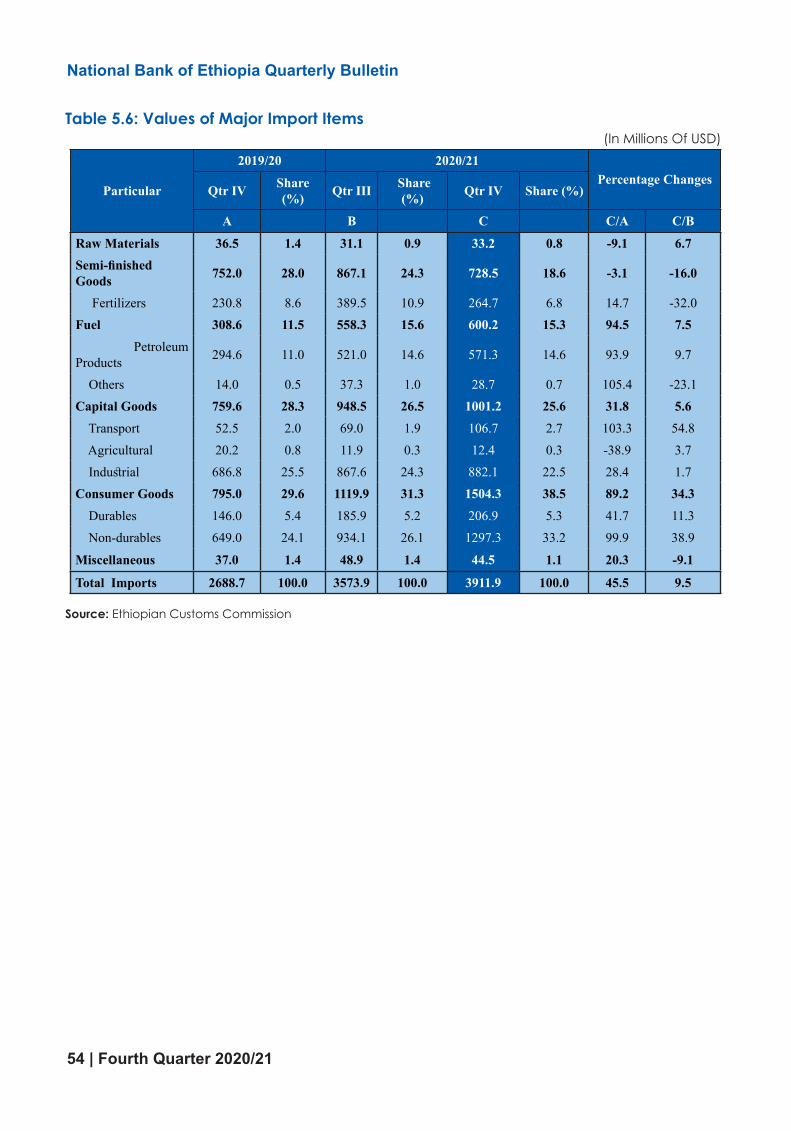
54 | Fourth Quarter 2020/21
National Bank of Ethiopia Quarterly Bulletin
Table 5.6: Values of Major Import Items (In Millions Of USD)
Particular
2019/20 2020/21Percentage Changes
Qtr IV Share (%) Qtr III Share
(%) Qtr IV Share (%)
A B C C/A C/B
Raw Materials 36.5 1.4 31.1 0.9 33.2 0.8 -9.1 6.7Semi-finished Goods 752.0 28.0 867.1 24.3 728.5 18.6 -3.1 -16.0
Fertilizers 230.8 8.6 389.5 10.9 264.7 6.8 14.7 -32.0Fuel 308.6 11.5 558.3 15.6 600.2 15.3 94.5 7.5 Petroleum Products 294.6 11.0 521.0 14.6 571.3 14.6 93.9 9.7
Others 14.0 0.5 37.3 1.0 28.7 0.7 105.4 -23.1Capital Goods 759.6 28.3 948.5 26.5 1001.2 25.6 31.8 5.6 Transport 52.5 2.0 69.0 1.9 106.7 2.7 103.3 54.8 Agricultural 20.2 0.8 11.9 0.3 12.4 0.3 -38.9 3.7 Industrial 686.8 25.5 867.6 24.3 882.1 22.5 28.4 1.7Consumer Goods 795.0 29.6 1119.9 31.3 1504.3 38.5 89.2 34.3 Durables 146.0 5.4 185.9 5.2 206.9 5.3 41.7 11.3 Non-durables 649.0 24.1 934.1 26.1 1297.3 33.2 99.9 38.9
Miscellaneous 37.0 1.4 48.9 1.4 44.5 1.1 20.3 -9.1
Total Imports 2688.7 100.0 3573.9 100.0 3911.9 100.0 45.5 9.5
Source: Ethiopian Customs Commission

Fourth Quarter 2020/21 | 55
National Bank of Ethiopia Quarterly Bulletin
Table 5.7: The Value of Franco Valuta Import (In Millions of USD)
Commodity Group
2019/20 2020/21 Percentage Change
Qtr IV Qtr III Qtr IV
A B C C/A C/B
Beverages 2.9 0.8 0.2 -93.5 -77.6
Chemicals 3.0 2.8 7.5 149.2 167.4
Clothing 3.9 7.1 5.1 29.0 -28.5
Food and live animals 95.6 239.3 478.3 400.5 99.9
Textiles 14.4 21.4 20.6 43.7 -3.5
Tobacco 0.0 0.0 0.0 40.1 238.6
Soap & polish 0.3 2.0 1.0 280.9 -48.6
Fertilizer 130.7 82.5 59.7 -54.3 -27.5
Paper & paper manufacturing 1.3 2.1 5.5 308.6 155.7
Metal & metal manufacturing 101.5 80.3 100.0 -1.5 24.5
Medical and pharmaceuticals products 11.2 28.0 31.7 183.6 13.2
Rubber products 10.2 13.8 9.7 -5.0 -29.6
Petroleum Crude 0.0 0.0 0.0
Petroleum product 6.8 3.1 3.6 -46.5 17.3
Glass & glass ware 2.8 1.8 2.6 -5.5 45.7
Electrical material 38.3 110.6 67.4 76.1 -39.1
Machine 189.9 277.0 414.7 118.3 49.7
Road & motor vehicles 5.6 2.8 4.6 -18.3 64.4
Tele apparatus 0.4 0.4 0.8 71.9 73.9
Cement 0.1 0.1 0.1 0.0 0.0
Others 160.3 322.5 541.9 238.1 68.0
Total 779.1 1198.4 1755.0 125.3 46.4
Source: Ethiopian Customs Commission

56 | Fourth Quarter 2020/21
National Bank of Ethiopia Quarterly Bulletin
National Bank of Ethiopia Quarterly Bulletin
60
Source: Ethiopian Customs Commission
5.2.3. Direction of Trade
5.2.3.1. Export of Goods
Europe, Asia and Africa
constituted major destinations for
Ethiopian exports where Europe
accounted for 42.3 percent of
Ethiopia’s total export revenue,
with Switzerland taking up 44.9
percent share, followed by the
Netherlands (11.8 percent),
Germany (8.8 percent), Belgium
(5.8 percent), Italy (2.8 percent),
United Kingdom (1.8 percent)
and France (1.6 percent). These
European countries together had
a 77.5 percent share of Ethiopia’s
total exports to Europe.
Asia accounted for 29.4 percent
of the total export receipts with
Saudi Arabia being the main
destination. Its share in Asia stood
at 13.2 percent followed by
United Arab Emirates (10.7
percent), Japan (5.9 percent),
India (5.9 percent), South Korea
(5.8 percent), China (5.3
percent), Israel (4.5 percent),
Yemen (2.2 percent), Indonesia
(2.0 Percent), Singapore (1.8
percent), Taiwan (1.3 percent)
and Hong Kong (1.3 percent).
These countries altogether
constituted 60.1 percent of
Ethiopia’s total export to Asia.
About 16.0 percent of Ethiopia’s
export earnings originated from
Africa, mainly Somalia (39.6
percent), Djibouti (14.2 percent),
Sudan (12.4 percent), Kenya (1.6
percent) and South Africa (1.3
percent), which altogether
accounted for 69.1 percent of
the total exports to Africa.
America had 11.1 percent share
in Ethiopia’s total export earnings,
of which 64.3 percent was from
exports to the United States
followed by Canada (3.6
percent). These countries
accounted for 67.9 percent of National Bank of Ethiopia Quarterly Bulletin
61
Ethiopia’s total exports to
America.
Source: NBE Staff Compilation
5.2.3.2. Import of Goods
During the fourth quarter of
2020/21, Asia accounted for 56.1
percent of the total import bills of
Ethiopia with the major imports
coming from China (28.4
percent), India (18.6 percent),
Kuwait (15.9 percent), Malaysia
(12.6 percent), UAE (9.6 percent),
South Korea (2.8 percent), Saudi
Arabia (2.7 percent) and
Indonesia (2.2 percent) whose
combined share was 92.9
percent.
Imports from Europe constituted
22.6 percent of Ethiopia’s total
imports with the major countries
being Ukraine (18.5 percent),
Turkey (16.9 percent), United
Kingdom (11.0 percent), Belgium
(9.9 percent), Rumania (8.9
16.0%
42.3% 11.1%
29.4%
1.2%
Fig V.7: Export By Destination
Africa
Europe
America
Asia
Oceania

Fourth Quarter 2020/21 | 57
National Bank of Ethiopia Quarterly Bulletin
National Bank of Ethiopia Quarterly Bulletin
60
Source: Ethiopian Customs Commission
5.2.3. Direction of Trade
5.2.3.1. Export of Goods
Europe, Asia and Africa
constituted major destinations for
Ethiopian exports where Europe
accounted for 42.3 percent of
Ethiopia’s total export revenue,
with Switzerland taking up 44.9
percent share, followed by the
Netherlands (11.8 percent),
Germany (8.8 percent), Belgium
(5.8 percent), Italy (2.8 percent),
United Kingdom (1.8 percent)
and France (1.6 percent). These
European countries together had
a 77.5 percent share of Ethiopia’s
total exports to Europe.
Asia accounted for 29.4 percent
of the total export receipts with
Saudi Arabia being the main
destination. Its share in Asia stood
at 13.2 percent followed by
United Arab Emirates (10.7
percent), Japan (5.9 percent),
India (5.9 percent), South Korea
(5.8 percent), China (5.3
percent), Israel (4.5 percent),
Yemen (2.2 percent), Indonesia
(2.0 Percent), Singapore (1.8
percent), Taiwan (1.3 percent)
and Hong Kong (1.3 percent).
These countries altogether
constituted 60.1 percent of
Ethiopia’s total export to Asia.
About 16.0 percent of Ethiopia’s
export earnings originated from
Africa, mainly Somalia (39.6
percent), Djibouti (14.2 percent),
Sudan (12.4 percent), Kenya (1.6
percent) and South Africa (1.3
percent), which altogether
accounted for 69.1 percent of
the total exports to Africa.
America had 11.1 percent share
in Ethiopia’s total export earnings,
of which 64.3 percent was from
exports to the United States
followed by Canada (3.6
percent). These countries
accounted for 67.9 percent of
National Bank of Ethiopia Quarterly Bulletin
61
Ethiopia’s total exports to
America.
Source: NBE Staff Compilation
5.2.3.2. Import of Goods
During the fourth quarter of
2020/21, Asia accounted for 56.1
percent of the total import bills of
Ethiopia with the major imports
coming from China (28.4
percent), India (18.6 percent),
Kuwait (15.9 percent), Malaysia
(12.6 percent), UAE (9.6 percent),
South Korea (2.8 percent), Saudi
Arabia (2.7 percent) and
Indonesia (2.2 percent) whose
combined share was 92.9
percent.
Imports from Europe constituted
22.6 percent of Ethiopia’s total
imports with the major countries
being Ukraine (18.5 percent),
Turkey (16.9 percent), United
Kingdom (11.0 percent), Belgium
(9.9 percent), Rumania (8.9
16.0%
42.3% 11.1%
29.4%
1.2%
Fig V.7: Export By Destination
Africa
Europe
America
Asia
Oceania
5.2.3.2. Import of Goods
During the fourth quarter of 2020/21, Asia accounted for 56.1 percent of the total import bills of Ethiopia with the major imports coming from China (28.4 percent), India (18.6 percent), Kuwait (15.9 percent), Malaysia (12.6 percent), UAE (9.6 percent), South Korea (2.8 percent), Saudi Arabia (2.7 percent) and Indonesia (2.2 percent) whose combined share was 92.9 percent.
Imports from Europe constituted 22.6 percent of Ethiopia’s total imports with the major countries being Ukraine (18.5 percent), Turkey (16.9 percent), United Kingdom (11.0 percent), Belgium (9.9 percent), Rumania (8.9 percent), Italy (6.6) percent), France (6.3 percent), Germany (4.5 percent), Switzerland (4.0 percent), the Netherlands (2.6 percent)
and Spain (2.2 percent). These countries jointly accounted for 91.4 percent of Ethiopia’s total imports from Europe.
Africa accounted for about 12.4 percent of Ethiopia’s total merchandise import. The major countries of origin were Morocco (48.9 percent), Egypt (17.2 percent), Djibouti (16.9 percent), South Africa (9.2 percent), Kenya (3.5 percent) and Rwanda (3.3 percent) which altogether represented 98.9 percent of the total imports from the continent.
Imports from America comprised 8.8 percent of the total import bills, of which the share of United States was 95.4 percent followed by Brazil (2.3 percent) and Canada (1.3 percent).

58 | Fourth Quarter 2020/21
National Bank of Ethiopia Quarterly Bulletin
National Bank of Ethiopia Quarterly Bulletin
62
percent), Italy (6.6) percent),
France (6.3 percent), Germany
(4.5 percent), Switzerland (4.0
percent), the Netherlands (2.6
percent) and Spain (2.2 percent).
These countries jointly accounted
for 91.4 percent of Ethiopia’s total
imports from Europe.
Africa accounted for about 12.4
percent of Ethiopia’s total
merchandise import. The major
countries of origin were Morocco
(48.9 percent), Egypt (17.2
percent), Djibouti (16.9 percent),
South Africa (9.2 percent), Kenya
(3.5 percent) and Rwanda (3.3
percent) which altogether
represented 98.9 percent of the
total imports from the continent.
Imports from America comprised
8.8 percent of the total import
bills, of which the share of United
States was 95.4 percent followed
by Brazil (2.3 percent) and
Canada (1.3 percent).
Source: NBE Staff Compilation
12.4%
22.6%
8.8%
56.0%
0.2%
Fig V.8: Import By Origin
Africa
Europe
America
Asia
Oceania
5.3. Services and Transfers5.3.1. Net Services During the review quarter, net deficit in services trade reached USD 154.7 million compared to USD 2.3 million in surplus due to slowdown in surpluses of both net travel (34 percent) and net transport (0.9
percent) accompanied by the widening of net deficits of other services (25.5 percent) and investment income (26 percent) despite 45.9 percent growth in net government services (Table 5.8).
National Bank of Ethiopia Quarterly Bulletin
63
5.3. Services and Transfers
5.3.1. Net Services
During the review quarter, net
deficit in services trade reached
USD 154.7 million compared to
USD 2.3 million in surplus due to
slowdown in surpluses of both net
travel (34 percent) and net
transport (0.9 percent)
accompanied by the widening of
net deficits of other services (25.5
percent) and investment income
(26 percent) despite 45.9 percent
growth in net government
services (Table 5.8).
Source: NBE Staff Compilation
-400.0
-300.0
-200.0
-100.0
0.0
100.0
200.0
300.0
400.0
Qtr
I
Qtr
II
Qtr
III
Qtr
IV
Qtr
I
Qtr
II
Qtr
III
Qtr
IV
Qtr
I
Qtr
II
Qtr
III
Qtr
IV
Qtr
I
Qtr
II
Qtr
III
Qtr
IV
Qtr
I
Qtr
II
Qtr
III
Qtr
IV
2016/17 2017/18 2018/19 2019/20 2020/21
(In
Mill
ion
USD
)
Fig V.9: Trends in Net Service
Net Service Net Travel Net Transportation Net Government (n.i.e) Net Investment Income

Fourth Quarter 2020/21 | 59
National Bank of Ethiopia Quarterly Bulletin
Table 5.8: Developments in Services Accounts (In Millions of USD)
S/N Particulars
2019/20 2020/21Percentage Change
QIV QIII QIV
A B C D=C/A E=C/B
1 Investment Income (2+5) -110.3 -70.0 -139.0 26.0 98.5
2 Interest, net (3-4) -110.3 -70.0 -138.9 25.9 98.4
3 Credit 1.5 2.1 3.6 135.5 71.7
4 Debit 111.9 72.1 142.5 27.4 97.6
5 Dividend, net -0.1
6 NON-FACTOR SERVICES, net (7-8) 112.6 257.2 -15.8 -114.1 -106.2
7 Exports of non-factor services 987.8 1,202.5 1,302.7 31.9 8.3
8 Travel 255.9 245.7 281.4 10.0 14.5
9 Transport 1 638.3 804.2 879.2 37.7 9.3
10 Gov't 2 24.9 49.1 40.7 63.8 -17.0
11 Other 3 68.7 103.5 101.4 47.6 -2.0
12 Imports of non-factor services 875.2 945.3 1,318.5 50.7 39.5
13 Travel 57.4 121.6 150.4 162.1 23.8
14 Transport 1 473.3 637.1 715.6 51.2 12.3
15 Gov't 2 2.4 3.7 7.9 231.4 116.9
16 Other 3 342.1 182.9 444.5 29.9 143.0
17 Net Services (18+19+20+21+22) 2.3 187.2 -154.8 -182.7
18 Travel (8-13) 198.5 124.2 130.9 -34.0 5.4
19 Transport (9-14) 165.0 167.1 163.5 -0.9 -2.1
20 Gov't (10-15) 22.5 45.4 32.8 45.9 -27.8
21 Other (11-16) -273.4 -79.4 -343.1 25.5 331.9
22 Investment Income (2+5) -110.3 -70.0 -139.0 26.0 98.5
Source: MoF, Transport and Telecommunication Companies, NBE- FEMRMD and Staff Compilation 1/ Includes Ethiopian Airlines receipts and payments 2/ Includes transactions with Embassies and international organizations such as UN-ECA, AU, EU, IMF and WB 3/ Includes communication, construction, insurance, financial, information, other business

60 | Fourth Quarter 2020/21
National Bank of Ethiopia Quarterly Bulletin
National Bank of Ethiopia Quarterly Bulletin
65
5.3.2. Transfers
During the review period, total
transfer receipts grew 10.1 percent
and reached USD 2.03 billion due to
49.2 percent increase in private
transfers which affect the 64.2
percent reduction in official transfers.
On the other hand, transfer
payments significantly rose from USD
19.6 million to USD 63.1 million as a
result of 26.1 percent increase in
private transfer payments and 292.5
percent hike in official transfers.
Consequently, net transfers grew by
7.9 percent and reached USD 2
billion (Table 5.9).
Table 5.9: Developments in Transfer Accounts (In Millions of USD)
S/N Particulars
2019/20 2020/21 Percentage Change QIV Share
(In %)
QIII Share
(In %)
QIV Share
(In %) A B C D=C/A
E=C/B 1 Private transfers,
net (2-5) 1,200.3 65.9 1,443.4 90.0 1,792.5 91.3 49.3 24.2
2 Credit (3+4) 1,205.5 65.5 1,446.1 88.5 1,799.1 88.8 49.2 24.4 3 NGO's 246.1 13.4 266.7 16.3 385.4 19.0 56.6 44.5 4 Private
individuals 959.5 52.1 1,179.4 72.2 1,413.7 69.8 47.3 19.9
5 Debit 5.2 26.7 2.7 9.1 6.6 10.5 26.1 147.3 6 Official transfers,
net (7-8) 619.9 34.1 160.9 10.0 170.7 8.7 -72.5 6.1
7 Credit 634.3 34.5 187.7 11.5 227.2 11.2 -64.2 21.0 8 Debit 14.4 73.3 26.8 90.9 56.5 89.5 292.5 111.1 9 Total Receipts 1,839.9 100.0 1,633.8 100.0 2,026.3 100.0 10.1 24.0
10 Total Payments 19.6 100.0 29.4 100.0 63.1 100.0 221.4 114.4 11 Net Transfers 1,820.2 100.0 1,604.4 100.0 1,963.2 100.0 7.9 22.4
Source: NBE Staff Computation
Table 5.9: Developments in Transfer Accounts(In Millions of USD)
S/N Particulars
2019/20 2020/21 PercentageChangeQIV Share
(In %)
QIII Share
(In %)
QIV Share
(In %)A B C D=C/A E=C/B
1 Private transfers, net (2-5) 1,200.3 65.9 1,443.4 90.0 1,792.5 91.3 49.3 24.22 Credit (3+4) 1,205.5 65.5 1,446.1 88.5 1,799.1 88.8 49.2 24.43 NGO's 246.1 13.4 266.7 16.3 385.4 19.0 56.6 44.54 Private individuals 959.5 52.1 1,179.4 72.2 1,413.7 69.8 47.3 19.95 Debit 5.2 26.7 2.7 9.1 6.6 10.5 26.1 147.36 Official transfers, net (7-8) 619.9 34.1 160.9 10.0 170.7 8.7 -72.5 6.17 Credit 634.3 34.5 187.7 11.5 227.2 11.2 -64.2 21.08 Debit 14.4 73.3 26.8 90.9 56.5 89.5 292.5 111.1
9 Total Receipts 1,839.9 100.0 1,633.8 100.0 2,026.3 100.0 10.1 24.0
10 Total Payments 19.6 100.0 29.4 100.0 63.1 100.0 221.4 114.4
11 Net Transfers 1,820.2 100.0 1,604.4 100.0 1,963.2 100.0 7.9 22.4
Source: NBE Staff Computation
National Bank of Ethiopia Quarterly Bulletin
66
Source: NBE Staff Compilation
5.4. Current Account Balance
The current account balance
(including official transfers) shifted
from a surplus of USD 76.7 million
surplus to a USD 926.7 million
deficit during the last quarter of
2020/21 as merchandise trade
deficit widened by 56.7 percent,
net services turned from a USD 2.3
million surplus to a USD 154.8
million deficit and net official
transfers dropped by 72.5 (Table
5.1).
5.5. Capital Account
Capital account recorded USD
1.18 billion in surplus which was
50.6 percent higher than that of
last year mainly due to upsurge in
FDI from USD 495.9 million to USD
1.9 billion largely on account of
USD 850 million FDI in the Telecom
sector. In addition, the private
sector received higher long term
capital while short term capital
outflow showed contraction and
net official long term capital
0200400600800
100012001400160018002000
Qtr
I
Qtr
II
Qtr
III
Qtr
IV
Qtr
I
Qtr
II
Qtr
III
Qtr
IV
Qtr
I
Qtr
II
Qtr
III
Qtr
IV
Qtr
I
Qtr
II
Qtr
III
Qtr
IV
Qtr
I
Qtr
II
Qtr
III
Qtr
IV
2016/17 2017/18 2018/19 2019/20 2020/21
(In
Mill
ions
of U
SD)
Fig V.10: Trends in Private and Official Transfers, (Receipts)
Private Transfers Official Transfers

Fourth Quarter 2020/21 | 61
National Bank of Ethiopia Quarterly Bulletin
National Bank of Ethiopia Quarterly Bulletin
65
5.3.2. Transfers
During the review period, total
transfer receipts grew 10.1 percent
and reached USD 2.03 billion due to
49.2 percent increase in private
transfers which affect the 64.2
percent reduction in official transfers.
On the other hand, transfer
payments significantly rose from USD
19.6 million to USD 63.1 million as a
result of 26.1 percent increase in
private transfer payments and 292.5
percent hike in official transfers.
Consequently, net transfers grew by
7.9 percent and reached USD 2
billion (Table 5.9).
Table 5.9: Developments in Transfer Accounts (In Millions of USD)
S/N Particulars
2019/20 2020/21 Percentage Change QIV Share
(In %)
QIII Share
(In %)
QIV Share
(In %) A B C D=C/A
E=C/B 1 Private transfers,
net (2-5) 1,200.3 65.9 1,443.4 90.0 1,792.5 91.3 49.3 24.2
2 Credit (3+4) 1,205.5 65.5 1,446.1 88.5 1,799.1 88.8 49.2 24.4 3 NGO's 246.1 13.4 266.7 16.3 385.4 19.0 56.6 44.5 4 Private
individuals 959.5 52.1 1,179.4 72.2 1,413.7 69.8 47.3 19.9
5 Debit 5.2 26.7 2.7 9.1 6.6 10.5 26.1 147.3 6 Official transfers,
net (7-8) 619.9 34.1 160.9 10.0 170.7 8.7 -72.5 6.1
7 Credit 634.3 34.5 187.7 11.5 227.2 11.2 -64.2 21.0 8 Debit 14.4 73.3 26.8 90.9 56.5 89.5 292.5 111.1 9 Total Receipts 1,839.9 100.0 1,633.8 100.0 2,026.3 100.0 10.1 24.0
10 Total Payments 19.6 100.0 29.4 100.0 63.1 100.0 221.4 114.4 11 Net Transfers 1,820.2 100.0 1,604.4 100.0 1,963.2 100.0 7.9 22.4
Source: NBE Staff Computation
National Bank of Ethiopia Quarterly Bulletin
66
Source: NBE Staff Compilation
5.4. Current Account Balance
The current account balance
(including official transfers) shifted
from a surplus of USD 76.7 million
surplus to a USD 926.7 million
deficit during the last quarter of
2020/21 as merchandise trade
deficit widened by 56.7 percent,
net services turned from a USD 2.3
million surplus to a USD 154.8
million deficit and net official
transfers dropped by 72.5 (Table
5.1).
5.5. Capital Account
Capital account recorded USD
1.18 billion in surplus which was
50.6 percent higher than that of
last year mainly due to upsurge in
FDI from USD 495.9 million to USD
1.9 billion largely on account of
USD 850 million FDI in the Telecom
sector. In addition, the private
sector received higher long term
capital while short term capital
outflow showed contraction and
net official long term capital
0200400600800
100012001400160018002000
Qtr
I
Qtr
II
Qtr
III
Qtr
IV
Qtr
I
Qtr
II
Qtr
III
Qtr
IV
Qtr
I
Qtr
II
Qtr
III
Qtr
IV
Qtr
I
Qtr
II
Qtr
III
Qtr
IV
Qtr
I
Qtr
II
Qtr
III
Qtr
IV
2016/17 2017/18 2018/19 2019/20 2020/21
(In
Mill
ions
of U
SD)
Fig V.10: Trends in Private and Official Transfers, (Receipts)
Private Transfers Official Transfers
5.5. Capital Account Capital account recorded USD 1.18
billion in surplus which was 50.6 percent
higher than that of last year mainly due
to upsurge in FDI from USD 495.9 million
to USD 1.9 billion largely on account of
USD 850 million FDI in the Telecom sector.
In addition, the private sector received
higher long term capital while short term
capital outflow showed contraction and
net official long term capital registered
78 percent drop vis-à-vis higher public
sector long term capital outflow.

62 | Fourth Quarter 2020/21
National Bank of Ethiopia Quarterly Bulletin
National Bank of Ethiopia Quarterly Bulletin
67
registered 78 percent drop vis-à-
vis higher public sector long term
capital outflow.
5.6. Changes in Reserve Position
The surplus in the overall balance of
payments during the fourth quarter
of 2020/21 reached USD 933.5 million
compared to USD 659.5 million
surplus a year earlier. Consequently,
net foreign assets of the National
Bank of Ethiopia and that of
commercial banks showed a USD
488.4 million and USD 445.1 million
build up, respectively. Thus, as of
June 30, 2021, gross foreign reserve
coverage stood at 2.2 months of
imports of goods and non-factor
services of next fiscal year (Table
5.1).
5.7. Developments in the Foreign Exchange Market
5.7.1. Exchange Rate Movements
Owing the review quarter, the
weighted average official
exchange rate of the in Birr in
the inter-bank forex market
reached 42.5284/USD, depicting
a 25.6 percent annual
depreciation. The end period
exchange rate of the Birr was
43.6910/USD, indicating that the
Birr has weakened against USD
by 24.9 percent over last year
same period.
National Bank of Ethiopia Quarterly Bulletin
68
Table 5.10: Developments in Inter-bank Market Forex Traded and Exchange Rates
(USD/ETB)
Period
Official Market
End Period Weighted Rate
Average Weighted Rate
Amount Traded in Millions of USD
Total Among CBs
2019/20 34.9822 31.3427 12.55 0.0 Qtr. IV C 34.9822 33.8507 3.0 0.0 April 33.5347 33.1908 1.05 0.0 May 34.1621 33.8600 0.9 0.0 June 34.9822 34.5012 1.05 0.0
2020/21 Qtr. III B 41.3165 39.8933 3.05 0.0 January 39.4355 39.3287 0.95 0.0 February 39.9715 39.6855 1.0 0.0 March 41.3165 40.6658 1.1 0.0 Qtr. IV A 43.6910 42.5284 3.0 0.0 April 41.9424 41.6437 1.05 0.0 May 43.0853 42.5444 0.9 0.0 June 43.6910 43.3970 1.05 0.0
Percentage Changes
A/B 5.75 6.61 -1.64 A/C 24.89 25.64 0.00
Source: National Bank of Ethiopia
In the retail foreign exchange
market, average buying rate in the
forex bureau of commercial banks
stood at Birr 42.5392/USD, showing a
25.6 percent annual depreciation,
while the selling rate (Birr
43.3765/USD) depreciated by 25.7
percent.
Thus, the average spread between
the buying and the selling rates
increased to 2.0 percent from 1.9
percent a year ago (Table 5.11).
5.7. Developments in the Foreign Exchange Market
5.7.1. Exchange Rate Movements Owing the review quarter, the
weighted average official exchange
rate of the in Birr in the inter-bank
forex market reached 42.5284/USD,
depicting a 25.6 percent annual
depreciation. The end period
exchange rate of the Birr was
43.6910/USD, indicating that the Birr
has weakened against USD by 24.9
percent over last year same period.

Fourth Quarter 2020/21 | 63
National Bank of Ethiopia Quarterly Bulletin
National Bank of Ethiopia Quarterly Bulletin
67
registered 78 percent drop vis-à-
vis higher public sector long term
capital outflow.
5.6. Changes in Reserve Position
The surplus in the overall balance of
payments during the fourth quarter
of 2020/21 reached USD 933.5 million
compared to USD 659.5 million
surplus a year earlier. Consequently,
net foreign assets of the National
Bank of Ethiopia and that of
commercial banks showed a USD
488.4 million and USD 445.1 million
build up, respectively. Thus, as of
June 30, 2021, gross foreign reserve
coverage stood at 2.2 months of
imports of goods and non-factor
services of next fiscal year (Table
5.1).
5.7. Developments in the Foreign Exchange Market
5.7.1. Exchange Rate Movements
Owing the review quarter, the
weighted average official
exchange rate of the in Birr in
the inter-bank forex market
reached 42.5284/USD, depicting
a 25.6 percent annual
depreciation. The end period
exchange rate of the Birr was
43.6910/USD, indicating that the
Birr has weakened against USD
by 24.9 percent over last year
same period.
National Bank of Ethiopia Quarterly Bulletin
68
Table 5.10: Developments in Inter-bank Market Forex Traded and Exchange Rates
(USD/ETB)
Period
Official Market
End Period Weighted Rate
Average Weighted Rate
Amount Traded in Millions of USD
Total Among CBs
2019/20 34.9822 31.3427 12.55 0.0 Qtr. IV C 34.9822 33.8507 3.0 0.0 April 33.5347 33.1908 1.05 0.0 May 34.1621 33.8600 0.9 0.0 June 34.9822 34.5012 1.05 0.0
2020/21 Qtr. III B 41.3165 39.8933 3.05 0.0 January 39.4355 39.3287 0.95 0.0 February 39.9715 39.6855 1.0 0.0 March 41.3165 40.6658 1.1 0.0 Qtr. IV A 43.6910 42.5284 3.0 0.0 April 41.9424 41.6437 1.05 0.0 May 43.0853 42.5444 0.9 0.0 June 43.6910 43.3970 1.05 0.0
Percentage Changes
A/B 5.75 6.61 -1.64 A/C 24.89 25.64 0.00
Source: National Bank of Ethiopia
In the retail foreign exchange
market, average buying rate in the
forex bureau of commercial banks
stood at Birr 42.5392/USD, showing a
25.6 percent annual depreciation,
while the selling rate (Birr
43.3765/USD) depreciated by 25.7
percent.
Thus, the average spread between
the buying and the selling rates
increased to 2.0 percent from 1.9
percent a year ago (Table 5.11).
Table 5.10: Developments in Inter-bank Market Forex Traded and Exchange Rates (USD/ETB)
Period
Official Market
End PeriodRate
AverageWeighted Rate
Amount Traded in Millions of USD
Total AmongCBs
2019/20 34.9822 31.3427 12.55 0.0Qtr. IV C 34.9822 33.8507 3.0 0.0April 33.5347 33.1908 1.05 0.0May 34.1621 33.8600 0.9 0.0June 34.9822 34.5012 1.05 0.0
2020/21Qtr. III B 41.3165 39.8933 3.05 0.0 January 39.4355 39.3287 0.95 0.0February 39.9715 39.6855 1.0 0.0March 41.3165 40.6658 1.1 0.0Qtr. IV A 43.6910 42.5284 3.0 0.0April 41.9424 41.6437 1.05 0.0May 43.0853 42.5444 0.9 0.0June 43.6910 43.3970 1.05 0.0
Percentage ChangesA/B 5.75 6.61 -1.64 A/C 24.89 25.64 0.00
Source: National Bank of Ethiopia

64 | Fourth Quarter 2020/21
National Bank of Ethiopia Quarterly BulletinTa
ble
5.11
: A
mou
nt o
f For
eign
Exc
hang
e Pu
rcha
sed
and
Sold
by
Fore
x Bu
reau
of C
omm
erci
al B
anks
(In
‘000
of U
SD)
No.
Nam
e of
For
ex B
urea
ux
2019
/20
2020
/21
Perc
enta
ge c
hang
eQ
uart
er IV
Qua
rter
III
Qua
rter
IVA
BC
C/B
C/A
Purc
hase
sSa
les
Purc
hase
sSa
les
Purc
hase
sSa
les
Purc
hase
sSa
les
Purc
hase
sSa
les
1C
omm
erci
al B
ank
of E
thio
pia
13,9
59.6
6,93
9.4
33,3
30.3
5,02
5.2
30,4
92.3
6,02
2.7
-8.5
119
.85
118.
43-1
3.21
2B
ank
of A
byss
inia
869.
113
0.6
399.
63,
289.
968
3.8
2,13
7.6
71.1
2-3
5.02
-21.
3215
37.3
93
Das
hen
Ban
k80
3.9
313.
53,
577.
34,
517.
52,
668.
61,
850.
0-2
5.40
-59.
0523
1.97
490.
044
Awas
h In
tern
atio
nal B
ank
437.
424
8.4
464.
53,
620.
480
5.1
2,51
0.0
73.3
-30.
784
.091
0.5
5C
onstr
uctio
n &
Bus
ines
s Ban
k-
--
6W
egag
en B
ank
823.
364
.31,
431.
796
2.8
502.
937
5.9
-64.
9-6
1.0
-38.
948
4.4
7 U
nite
d B
ank
66,4
07.4
201.
03,
650.
31,
869.
31,
631.
31,
207.
1-5
5.3
-35.
4-9
7.5
500.
58
Dev
elop
men
t Ban
k-
-1.
018
.81.
54.
49
Nib
Inte
rnat
iona
l Ban
k43
9.3
65.8
583.
195
9.7
1,14
7.4
236.
296
.8-7
5.4
161.
225
9.2
10Li
on In
tern
atio
nal B
ank
101.
70.
921
3.7
83.1
286.
333
.234
.0-6
0.1
181.
535
83.5
11O
rom
ia In
tern
atio
nal B
ank
3,32
7.4
49.8
3,04
8.9
1,32
1.3
1,42
7.0
429.
9-5
3.2
-67.
5-5
7.1
762.
812
Zem
en B
ank
3.6
193.
268
.66,
813.
372
.681
9.0
5.8
-88.
019
30.4
324.
013
Coo
pera
tive
Ban
k of
Oro
mia
4.2
-17
4.0
1,76
7.6
338.
967
1.1
94.7
-62.
080
38.2
14B
una
Inte
rnat
iona
l Ban
k1,
514.
4-
435.
825
9.4
593.
013
6.0
36.1
-47.
6-6
0.8
15B
irhan
Inte
rnat
iona
l Ban
k80
.340
.432
9.6
777.
647
2.2
305.
3-
-60.
748
8.1
-16
Aba
y B
ank
917.
84.
826
4.1
155.
815
8.9
92.1
-39.
8-
-82.
718
19.4
17A
ddis
Inte
rnat
iona
l Ban
k69
4.8
12.7
971.
721
9.9
627.
818
2.7
-35.
4-1
6.9
-9.7
1338
.818
Deb
ub G
loba
l Ban
k10
4.4
21.9
1,20
6.6
366.
569
2.5
75.5
-42.
6-7
9.4
563.
424
4.5
19En
at B
ank
34.5
11.0
91.4
263.
954
.823
1.0
-40.
1-1
2.4
58.9
2004
.2
Tota
l90
,522
.88,
297.
750
,242
.232
,292
.042
,656
.917
,319
.6-1
5.1
-46.
4-5
2.9
108.
7
Aver
age
Exc
hang
e R
ate
33.8
563
34.5
128
39.9
398
40.7
138
42.5
392
43.3
765
6.5
6.5
25.6
25.7
Sp
read
1.9
1.9
2.0
So
urce
: Nat
iona
l Ban
k of
Eth
iopi
a N
ote:
* R
efer
s the
per
cent
age
spre
ad b
etw
een
fore
x bu
reau
s ave
rage
buy
ing
and
sellin
g ex
chan
ge ra
te in
a g
iven
qua
rter.
National Bank of Ethiopia Quarterly Bulletin
70
Fig.V.11: Average Buying, Selling Rates and Spread of Forex Bureau of Commercial Banks
Source: NBE Staff Compilation
In the official forex market, US dollar
has depreciated against major
currencies except Japanese Yen,
both on quarterly and annual basis.
On annual terms, USD depreciated
against Pound Sterling (10.2
percent), Euro (7.7 percent), Swiss
Franc (3.5 percent) and SDR (3.1
percent), whereas it appreciated
against Japanese Yen (3.6 percent).
Likewise, USD depreciated against
Pound Sterling (4.1 percent), Euro
(3.1 percent), SDR (3.1 percent) and
Swiss Franc (1.8 percent) while it
strengthened against Japanese Yen
(0.5 percent) vis-à-vis the preceding
quarter (Table 5.12).
1.8
1.9
1.9
2.0
2.0
2.1
05
101520253035404550
QI
QII
QII
I
QIV Q
I
QII
QII
I
QIV Q
I
QII
QII
I
QIV Q
I
QII
QII
I
QIV Q
I
QII
QII
I
QIV
2016/17 2017/18 2018/19 2019/20 2020/21
(Per
cent
)
(Birr
per
USD
)
Buying Rate Selling Rate Spread (SA)

Fourth Quarter 2020/21 | 65
National Bank of Ethiopia Quarterly BulletinNational Bank of Ethiopia Quarterly Bulletin
70
Fig.V.11: Average Buying, Selling Rates and Spread of Forex Bureau of Commercial Banks
Source: NBE Staff Compilation
In the official forex market, US dollar
has depreciated against major
currencies except Japanese Yen,
both on quarterly and annual basis.
On annual terms, USD depreciated
against Pound Sterling (10.2
percent), Euro (7.7 percent), Swiss
Franc (3.5 percent) and SDR (3.1
percent), whereas it appreciated
against Japanese Yen (3.6 percent).
Likewise, USD depreciated against
Pound Sterling (4.1 percent), Euro
(3.1 percent), SDR (3.1 percent) and
Swiss Franc (1.8 percent) while it
strengthened against Japanese Yen
(0.5 percent) vis-à-vis the preceding
quarter (Table 5.12).
1.8
1.9
1.9
2.0
2.0
2.1
05
101520253035404550
QI
QII
QII
I
QIV Q
I
QII
QII
I
QIV Q
I
QII
QII
I
QIV Q
I
QII
QII
I
QIV Q
I
QII
QII
I
QIV
2016/17 2017/18 2018/19 2019/20 2020/21
(Per
cent
)
(Birr
per
USD
)
Buying Rate Selling Rate Spread (SA)
National Bank of Ethiopia Quarterly Bulletin
70
Fig.V.11: Average Buying, Selling Rates and Spread of Forex Bureau of Commercial Banks
Source: NBE Staff Compilation
In the official forex market, US dollar
has depreciated against major
currencies except Japanese Yen,
both on quarterly and annual basis.
On annual terms, USD depreciated
against Pound Sterling (10.2
percent), Euro (7.7 percent), Swiss
Franc (3.5 percent) and SDR (3.1
percent), whereas it appreciated
against Japanese Yen (3.6 percent).
Likewise, USD depreciated against
Pound Sterling (4.1 percent), Euro
(3.1 percent), SDR (3.1 percent) and
Swiss Franc (1.8 percent) while it
strengthened against Japanese Yen
(0.5 percent) vis-à-vis the preceding
quarter (Table 5.12).
1.8
1.9
1.9
2.0
2.0
2.1
05
101520253035404550
QI
QII
QII
I
QIV Q
I
QII
QII
I
QIV Q
I
QII
QII
I
QIV Q
I
QII
QII
I
QIV Q
I
QII
QII
I
QIV
2016/17 2017/18 2018/19 2019/20 2020/21
(Per
cent
)
(Birr
per
USD
)
Buying Rate Selling Rate Spread (SA)

66 | Fourth Quarter 2020/21
National Bank of Ethiopia Quarterly Bulletin
Tabl
e 5.
12: A
vera
ge O
ffici
al E
xcha
nge
Rate
s (U
SD p
er M
ajor
Inte
rnat
iona
l Cur
renc
ies)
Peri
od
E
UR
OJA
PAN
ESE
YE
NSD
RPO
UN
DST
EL
ING
SWIS
S FR
AN
K
B
uyin
gSe
lling
Mid
-R
ate
Buy
ing
Selli
ng M
id-
Rat
eB
uyin
gSe
lling
Mid
-R
ate
Buy
ing
Selli
ng M
id-
Rat
eB
uyin
gSe
lling
Mid
-R
ate
2019
/20
QIV
C1.
1007
1.10
071.
1007
0.00
930.
0093
0.00
931.
3686
1.36
871.
3686
1.24
151.
2415
1.24
151.
0368
1.03
691.
0369
Apr
il
1.08
731.
0873
1.08
730.
0093
0.00
930.
0093
1.36
371.
3637
1.36
371.
2405
1.24
051.
2405
1.03
051.
0305
1.03
05
May
1.
0880
1.08
801.
0880
0.00
930.
0093
0.00
931.
3628
1.36
271.
3627
1.22
921.
2292
1.22
921.
0301
1.03
011.
0301
June
1.
1269
1.12
691.
1269
0.00
930.
0093
0.00
931.
3794
41.
3795
1.37
951.
2548
1.25
481.
2548
1.05
001.
0500
1.05
00
2020
/21
QII
IB
1.14
961.
1496
1.14
960.
0090
0.00
900.
0090
1.36
951.
3694
1.36
951.
3133
1.31
361.
3134
1.05
491.
0546
1.05
47
Janu
ary
1.
1573
1.15
731.
1573
0.00
920.
0092
0.00
921.
3700
1.37
001.
3700
1.29
621.
2962
1.29
621.
0715
1.07
151.
0715
Febr
uary
1.
1521
1.15
211.
1521
0.00
900.
0090
0.00
901.
3712
1.37
121.
3712
1.31
861.
3186
1.31
861.
0629
1.06
211.
0625
Mar
ch
1.13
941.
1394
1.13
940.
0088
0.00
880.
0088
1.36
721.
3672
1.36
721.
3250
1.32
591.
3254
1.03
031.
0303
1.03
03
QIV
A1.
1869
1.18
561.
1856
0.00
900.
0090
0.00
901.
4117
1.41
141.
4116
1.36
761.
3676
1.36
761.
0735
1.07
351.
0735
Apr
il
1.13
911.
1352
1.13
520.
0087
0.00
870.
0087
1.35
811.
3573
1.35
771.
3155
1.31
551.
3155
1.02
811.
0281
1.02
81
May
1.
2154
1.21
541.
2154
0.00
910.
0091
0.00
911.
4399
1.43
991.
4399
1.38
351.
3835
1.38
351.
0898
1.08
981.
0898
June
1.
2062
1.20
621.
2062
0.00
910.
0091
0.00
911.
4371
1.43
711.
4371
1.40
391.
4039
1.40
391.
1024
1.10
241.
1024
Per
cen
tage
Cha
nges
A/B
3.24
3.13
3.13
-0.5
0-0
.45
-0.4
73.
093.
063.
084.
144.
124.
131.
761.
791.
77
A/C
7.83
7.71
7.71
-3.6
4-3
.64
-3.6
43.
153.
133.
1410
.16
10.1
610
.16
3.53
3.53
3.53
Sour
ce: N
atio
nal B
ank
of E
thio
pia
National Bank of Ethiopia Quarterly Bulletin
73
Similarly, the Birr has depreciated
against all major currencies on
annual and quarterly basis. On
yearly basis, it depreciated against
Pound Sterling (41.6 percent), Euro
(37.7 percent), Swiss Franc (33.0
percent), SDR (31.7 percent), USD
(25.6 percent) and Japanese Yen
(23.5 percent).
On quarterly basis also, the Birr
weakened against Pound Sterling
(8.2 percent), Euro (6.6 percent), USD
(6.6 percent), SDR (6.5 percent),
Swiss Franc (5.8 percent) and
Japanese Yen (3.1 percent)
(Table5.13).

Fourth Quarter 2020/21 | 67
National Bank of Ethiopia Quarterly BulletinNational Bank of Ethiopia Quarterly Bulletin
73
Similarly, the Birr has depreciated
against all major currencies on
annual and quarterly basis. On
yearly basis, it depreciated against
Pound Sterling (41.6 percent), Euro
(37.7 percent), Swiss Franc (33.0
percent), SDR (31.7 percent), USD
(25.6 percent) and Japanese Yen
(23.5 percent).
On quarterly basis also, the Birr
weakened against Pound Sterling
(8.2 percent), Euro (6.6 percent), USD
(6.6 percent), SDR (6.5 percent),
Swiss Franc (5.8 percent) and
Japanese Yen (3.1 percent)
(Table5.13).
National Bank of Ethiopia Quarterly Bulletin
73
Similarly, the Birr has depreciated
against all major currencies on
annual and quarterly basis. On
yearly basis, it depreciated against
Pound Sterling (41.6 percent), Euro
(37.7 percent), Swiss Franc (33.0
percent), SDR (31.7 percent), USD
(25.6 percent) and Japanese Yen
(23.5 percent).
On quarterly basis also, the Birr
weakened against Pound Sterling
(8.2 percent), Euro (6.6 percent), USD
(6.6 percent), SDR (6.5 percent),
Swiss Franc (5.8 percent) and
Japanese Yen (3.1 percent)
(Table5.13).

68 | Fourth Quarter 2020/21
National Bank of Ethiopia Quarterly Bulletin
Tabl
e 5.
13: P
erio
d A
vera
ge E
xcha
nge
Rate
s (B
irr p
er M
ajor
Cur
renc
ies)
Peri
od
Cur
renc
y
USD
EU
RO
JAPA
NE
SE Y
EN
SDR
POU
ND
STE
RL
ING
SWIS
S FR
AN
K
Buy
ing
Selli
ngM
id-R
ate
Buy
ing
Selli
ngM
id-R
ate
Buy
ing
Selli
ngM
id-R
ate
Buy
ing
Selli
ngM
id-R
ate
Buy
ing
Selli
ngM
id-R
ate
Buy
ing
Selli
ngM
id-R
ate
2019
/20
QIV
C33
.850
734
.189
034
.019
937
.248
837
.621
337
.435
00.
3148
0.31
790.
3164
46.3
261
46.7
892
46.5
576
41.9
986
42.4
190
42.2
088
35.1
040
35.4
551
35.2
795
Apr
il
33.1
908
33.5
227
33.3
568
36.0
868
36.4
477
36.2
672
0.30
770.
3108
0.30
9245
.263
845
.716
445
.490
141
.172
241
.584
041
.378
134
.202
334
.544
434
.373
3
May
33
.860
034
.198
634
.029
336
.842
037
.210
437
.026
20.
3159
0.31
910.
3175
46.1
427
46.6
037
46.3
732
41.6
199
42.0
360
41.8
279
34.8
789
35.2
277
35.0
533
June
34
.501
234
.845
834
.673
538
.817
539
.205
739
.011
60.
3207
0.32
390.
3223
47.5
718
48.0
475
47.8
097
43.2
036
43.6
369
43.4
203
36.2
308
36.5
931
36.4
120
2020
/21
QII
IB
39.8
933
40.2
923
40.0
966
48.1
187
48.5
999
48.3
612
0.37
690.
3805
0.37
8857
.325
257
.898
457
.611
554
.979
855
.542
155
.259
744
.147
844
.578
344
.364
6
Janu
ary
39
.328
739
.722
039
.536
847
.910
148
.389
248
.155
30.
3793
0.38
260.
3814
56.7
143
57.2
814
56.9
971
53.6
623
54.1
989
53.9
268
44.3
568
44.8
004
44.5
833
Febr
uary
39
.685
540
.082
439
.883
948
.008
748
.488
948
.248
80.
3768
0.38
060.
3787
57.1
363
57.7
077
57.4
220
54.9
480
55.4
975
55.2
228
44.2
886
44.6
984
44.4
935
Mar
ch
40.6
658
41.0
725
40.8
691
48.4
374
48.9
218
48.6
796
0.37
440.
3782
0.37
6358
.124
958
.706
258
.415
656
.329
256
.929
756
.629
543
.798
044
.235
944
.016
9
QIV
A42
.528
442
.953
742
.741
051
.258
951
.771
551
.527
80.
3886
0.39
250.
3907
61.0
200
61.6
203
61.3
301
59.4
806
60.0
755
59.7
822
46.6
729
47.1
396
46.9
207
Apr
il
41.6
437
42.0
601
41.8
519
49.6
979
50.1
948
49.9
841
0.38
150.
3853
0.38
3759
.418
359
.982
859
.730
357
.600
158
.176
257
.900
645
.014
745
.464
945
.283
2
May
42
.544
442
.969
842
.757
151
.708
752
.225
851
.967
20.
3902
0.39
410.
3921
61.2
605
61.8
731
61.5
668
59.8
872
60.4
861
60.1
867
47.1
336
47.6
050
47.3
693
June
43
.397
043
.831
043
.614
052
.370
352
.894
052
.632
10.
3942
0.39
820.
3962
62.3
811
63.0
050
62.6
931
60.9
546
61.5
642
61.2
594
47.8
702
48.3
489
48.1
096
Per
cent
age
Cha
nge
A/B
6.61
6.61
6.60
6.53
6.53
6.55
3.12
3.17
3.14
6.45
6.43
6.45
8.19
8.16
8.18
5.72
5.75
5.76
A/C
25.6
425
.64
25.6
437
.61
37.6
137
.65
23.4
623
.46
23.4
931
.72
31.7
031
.73
41.6
341
.62
41.6
332
.96
32.9
633
.00
Sour
ce: N
atio
nal B
ank
of E
thio
pia
National Bank of Ethiopia Quarterly Bulletin
76
5.7.2. Movements in the Real Effective Exchange Rate
During the fourth quarter of 2020/21,
the Birr remained unaffected in real
terms largely as the gains from the
surge in trading partners’ price
particularly that of the Sudanese
were neutralized by the
appreciation of the Birr and rising
domestic inflation. When, excluding
Sudan from the partners’ list,
however, the REERI has depreciated
by 5.1 percent.
Likewise, the NEERI appreciated by
80.1 percent compared with last
year same quarter due to significant
depreciation of Sudanese Pound
against USD following the decision of
the Central Bank of Sudan to float
the currency (Table 5.15).

Fourth Quarter 2020/21 | 69
National Bank of Ethiopia Quarterly Bulletin
National Bank of Ethiopia Quarterly Bulletin
76
5.7.2. Movements in the Real Effective Exchange Rate
During the fourth quarter of 2020/21,
the Birr remained unaffected in real
terms largely as the gains from the
surge in trading partners’ price
particularly that of the Sudanese
were neutralized by the
appreciation of the Birr and rising
domestic inflation. When, excluding
Sudan from the partners’ list,
however, the REERI has depreciated
by 5.1 percent.
Likewise, the NEERI appreciated by
80.1 percent compared with last
year same quarter due to significant
depreciation of Sudanese Pound
against USD following the decision of
the Central Bank of Sudan to float
the currency (Table 5.15).
Table 5.14: Birr per Unit of Currency End Period Mid-Market Rate
CurrencyJune 30, 2020 March 31, 2021 June 30, 2021 Percentage change
A B C C/B C/AUSD 35.1571 41.5231 43.9095 5.75 24.89
Pound 43.3216 57.0652 60.7444 6.45 40.22
Swedish Kroner 3.7833 4.7565 5.1500 8.27 36.12
Djibouti Frank 0.1973 0.2330 0.2464 5.75 24.89
Swiss Frank 37.2230 44.0750 47.6655 8.15 28.05
Saudi Riyal 9.3694 11.0714 11.7077 5.75 24.96
UAE Dirhams 9.5705 11.3034 11.9531 5.75 24.89
Canadian Dollar 25.7429 32.9026 35.4767 7.82 37.81
Japanese Yen 0.3280 0.3764 0.3971 5.50 21.07
Euro 39.6713 48.7398 52.2610 7.22 31.74
SDR 48.4571 58.9711 62.7291 6.37 29.45
Source: NBE Staff Compilation

70 | Fourth Quarter 2020/21
National Bank of Ethiopia Quarterly Bulletin
National Bank of Ethiopia Quarterly Bulletin
77
Table 5.15: Trends in the Real and Nominal Effective Exchange Rates
Item
2019/20 2020/21 Percentage Change
QIV QIII QIV
A B C C/B C/A
REERI 179.4 150.6 179.4 19.1 -0.01 NEERI 38.6 46.3 69.6 50.4 80.1
Source: NBE Staff Compilation
NB:
REERI = Real Effective Exchange Rate Index, NEERI = Nominal Effective Exchange Rate Index
A decrease in the REERI and NEERI implies depreciation and vice versa.
Fig.V.12: Movements in the Real and Nominal Effective Exchange Rate
Source: NBE Staff Compilation
0
50
100
150
200
250
QI
QII
QII
I
QIV Q
I
QII
QII
I
QIV Q
I
QII
QII
I
QIV Q
I
QII
QII
I
QIV Q
I
QII
QII
I
QIV
2016/17 2017/18 2018/19 2019/20 2020/21
REERI NEERI
Table 5.15: Trends in the Real and Nominal Effective Exchange Rates
Item
2019/20 2020/21Percentage Change
QIV QIII QIV
A B C C/B C/A
REERI 179.4 150.6 179.4 19.1 -0.01
NEERI 38.6 46.3 69.6 50.4 80.1
Source: NBE Staff Compilation NB: REERI = Real Effective Exchange Rate Index, NEERI = Nominal Effective Exchange Rate IndexA decrease in the REERI and NEERI implies depreciation and vice versa.
National Bank of Ethiopia Quarterly Bulletin
78
5.7.3. Volume of Transactions
In the fourth quarter of 2020/21, the
volume of foreign exchange traded
in the inter-bank foreign exchange
market remained at USD 3.0 million
were all the foreign exchange was
supplied exclusively by NBE in order
to stabilize the foreign exchange
market (Table 5:10).
Fig.V.13: Foreign Exchange Trade in the Interbank Foreign Exchange Market
Source: NBE Staff Compilation
In the same period, forex bureaus of
commercial banks purchased USD
42.7 million and sold USD 17.3 million.
Hence, the amount of forex
purchased fell by 52.9 percent, while
the amount of forex sold surged by
108.7 percent largely impacted by
the COVID-19 pandemic (Table
5.11).
0
1
2
3
4
QI QII QIII QIV QI QII QIII QIV QI QII QIII QIV QI QII QIII QIV QI QII QIII QIV
2016/17 2017/18 2018/19 2019/20 2020/21
(In
Mill
. USD
)
Total Amount Traded Amount Traded among CBs

Fourth Quarter 2020/21 | 71
National Bank of Ethiopia Quarterly BulletinNational Bank of Ethiopia Quarterly Bulletin
78
5.7.3. Volume of Transactions
In the fourth quarter of 2020/21, the
volume of foreign exchange traded
in the inter-bank foreign exchange
market remained at USD 3.0 million
were all the foreign exchange was
supplied exclusively by NBE in order
to stabilize the foreign exchange
market (Table 5:10).
Fig.V.13: Foreign Exchange Trade in the Interbank Foreign Exchange Market
Source: NBE Staff Compilation
In the same period, forex bureaus of
commercial banks purchased USD
42.7 million and sold USD 17.3 million.
Hence, the amount of forex
purchased fell by 52.9 percent, while
the amount of forex sold surged by
108.7 percent largely impacted by
the COVID-19 pandemic (Table
5.11).
0
1
2
3
4
QI QII QIII QIV QI QII QIII QIV QI QII QIII QIV QI QII QIII QIV QI QII QIII QIV
2016/17 2017/18 2018/19 2019/20 2020/21
(In
Mill
. USD
)
Total Amount Traded Amount Traded among CBs
National Bank of Ethiopia Quarterly Bulletin
78
5.7.3. Volume of Transactions
In the fourth quarter of 2020/21, the
volume of foreign exchange traded
in the inter-bank foreign exchange
market remained at USD 3.0 million
were all the foreign exchange was
supplied exclusively by NBE in order
to stabilize the foreign exchange
market (Table 5:10).
Fig.V.13: Foreign Exchange Trade in the Interbank Foreign Exchange Market
Source: NBE Staff Compilation
In the same period, forex bureaus of
commercial banks purchased USD
42.7 million and sold USD 17.3 million.
Hence, the amount of forex
purchased fell by 52.9 percent, while
the amount of forex sold surged by
108.7 percent largely impacted by
the COVID-19 pandemic (Table
5.11).
0
1
2
3
4
QI QII QIII QIV QI QII QIII QIV QI QII QIII QIV QI QII QIII QIV QI QII QIII QIV
2016/17 2017/18 2018/19 2019/20 2020/21
(In
Mill
. USD
)
Total Amount Traded Amount Traded among CBs

72 | Fourth Quarter 2020/21
National Bank of Ethiopia Quarterly Bulletin
National Bank of Ethiopia Quarterly Bulletin
Fourth Quarter 2020/21 79
VI. FEDERAL GOVERNMENT FINANCE
Total revenue and grants of the
Federal government reached Birr
73.8 billion during the fourth quarter
of 2020/21 about 8.5 percent lower
than last year same quarter. (Table
6.1).
On the other hand, the Federal
government’s total expenditure
went up to Birr 121.0 billion showing a
3.2 percent annual growth. As a
result, the overall fiscal balance
(including grants) was Birr 47.1 billion
deficit.

Fourth Quarter 2020/21 | 73
National Bank of Ethiopia Quarterly Bulletin
National Bank of Ethiopia Quarterly Bulletin
Fourth Quarter 2020/21 79
VI. FEDERAL GOVERNMENT FINANCE
Total revenue and grants of the
Federal government reached Birr
73.8 billion during the fourth quarter
of 2020/21 about 8.5 percent lower
than last year same quarter. (Table
6.1).
On the other hand, the Federal
government’s total expenditure
went up to Birr 121.0 billion showing a
3.2 percent annual growth. As a
result, the overall fiscal balance
(including grants) was Birr 47.1 billion
deficit.
Table 6.1: Summary of Quarterly Federal Government Finance]in millions of Birr[
No Finer points
2019/20 2020/21 PercentageChanges
PerformanceRate
A B C DD/A D/C D/B
QIV Budget QIII QIV
1 Revenue and Grants 80,750.1 336,177.0 68,804.1 73,872.2 (8.5) 7.4 22.0
1.1 Total Revenue 59,238.1 305,268.7 68,804.1 73,872.2 24.7 7.4 24.2
Tax Revenue 49,557.3 271,748.2 61,555.8 65,316.6 31.8 6.1 24.0
Direct tax 14,063.7 65,850.7 14,953.1 20,044.4 42.5 34.0 30.4
Indirect tax 35,493.6 205,897.5 46,602.8 45,272.2 27.6 (2.9) 22.0
Non-Tax Revenue 9,680.8 33,520.5 7,248.3 8,555.6 (11.6) 18.0 25.5
1.2 Grant & Relief 21,512.0 30,908.3 0.0 - - -
2 Current Expenditure 31,978.2 141,935.5 22,285.2 48,066.3 50.3 115.7 33.9
3 Current Surplus/Deficit - -
(Including Grants) 48,771.9 194,241.4 46,518.9 25,805.9 (47.1) (44.5) 13.3
(Excluding Grants) 27,259.9 163,333.1 46,518.9 25,805.9 (5.3) (44.5) 15.8
4 Capital Expenditure 40,212.5 137,396.5 24,622.9 32,543.9 (19.1) 32.2 23.7
5 Regional Transfers 45,102.4 175,805.7 49,083.7 40,435.3 (10.3) (17.6) 23.0
6 (Total Expenditure (2+4+5 117,293.2 455,137.7 95,991.8 121,045.5 3.2 26.1 26.6
7 Overall Surplus/Deficit
(Including Grants) (36,543.1) (118,960.7) (27,187.7) (47,173.3) 29.1 73.5 39.7
(Excluding Grants) (58,055.1) (149,869.0) (27,187.7) (47,173.3) (18.7) 73.5 31.5
8 Total Financing 36,543.1 118,960.7 27,187.7 47,173.3 29.1 73.5 39.7
8.1 Net External Borrowings 37,484.9 20,515.2 6,220.9 4,216.5 (88.8) (32.2) 20.6
External Borrowing 11,677.7 21,557.2 6,804.2 4,995.1 (57.2) (26.6) 23.2
Amortization 1,373.4 11,755.4 583.3 2,294.5 67.1 293.4 19.5
8.2 NetDomestic Borrowings 14,485.5 98,445.6 38,195.2 69,116.2 377.1 81.0 70.2
Banking System (2,932.5) 25,749.1 50,255.9 (1,813.8) 95.2
Non-Bank Sources 17,418.0 12,446.1 18,860.3 8.3 51.5
8.3 Privatization receipts 1,799.7
8.4 Others and Residuals (15,427.3) 0 (17,228.4) (26,159.4) 69.6 51.8
Source: Ministry of Finance
74 | Fourth Quarter 2020/21
National Bank of Ethiopia Quarterly Bulletin
National Bank of Ethiopia Quarterly Bulletin
Fourth Quarter 2020/21 81
Source Ministry of finance
6.1 Revenue and Grants
With no grants, total domestic
revenue reached Birr 73.8 billion
during the review quarter. About Birr
65.3 billion or 88.4 percent of the
domestic revenue was generated
from taxes and Birr 8.5 billion (or 11.6
percent) from non-taxes (Table 6.2).

Fourth Quarter 2020/21 | 75
National Bank of Ethiopia Quarterly Bulletin
Table 6.2: Summary of Quarterly Federal Government Revenue by Components (In million Birr)
No Particulars
2019/20 2020/21 Percentage Change
PerformanceRate
QIV Budget QIII QIVD/A D/C D/B
A B C D
Total Revenue and Grants 80,750.1 336,177.0 68,804.1 73,872.2 (8.5) 7.4 22.0
TotalDomestic Revenue 59,238.1 305,268.7 68,804.1 73,872.2 24.7 7.4 24.2
1 Tax Revenue 49,557.3 271,748.2 61,555.8 65,316.6 31.8 6.1 24.0
1.1 Direct Tax Revenue 14,063.7 65,850.7 14,953.1 20,044.4 42.5 34.0 30.4
1.1.1 Income Taxes 11,523.2 52,164.8 12,310.4 16,917.5 46.8 37.4 32.4
- Personal 3,125.6 15,255.1 4,197.8 3834.9 22.7 (8.6) 25.1
- Business 8,397.6 36,909.7 8,112.6 13082.6 55.8 61.3 35.4
1.1.2 Others1 2,540.5 13,685.9 2,642.6 3126.9 23.1 18.3 22.8
1.2 Indirect Taxes 35,493.6 205,897.5 46,602.8 45,272.2 27.6 (2.9) 22.0
1.2.1 Domestic Taxes 13,783.3 84,518.0 19,745.0 18,354.4 33.2 (7.0) 21.7
1.2.2 Foreign Trade Taxes 21,710.3 121,379.5 26,857.8 26,917.8 24.0 0.2 22.2
- Import 21,710.3 121,379.5 26,857.8 26,917.8 24.0 0.2 22.2
2 Non-Tax Revenue 9,680.8 33,520.5 7,248.3 8555.6 (11.6) 18.0 25.5
3 Privatization - - - - - - -
4 Grants and Relief 21,512.0 30,908.3 - - - - -
Source: Ministry of Finance
1/ includes Withholding tax on import, tax on dividend,royality and interest income

76 | Fourth Quarter 2020/21
National Bank of Ethiopia Quarterly Bulletin
National Bank of Ethiopia Quarterly Bulletin
Fourth Quarter 2020/21 83
income
Fig.VI.1: Quarterly Developments in Major Components of Domestic Revenue of the Federal Government
Tax revenue reached Birr 65.3 billion indicating a 31.8 percent annual increase due to 42.5 percent growth in revenue from direct taxes and 27.6 percent from indirect taxes.
Direct tax revenue, which mostly
comprises business and personal
income taxes, stood at Birr 20.0 billion
showing a 34.0 percent quarterly
and 42.5 percent annual growth.
Meanwhile, revenue from indirect
tax reached Birr 45.2 billion and grew
by 27.6 percent compared to a year
ago while it declined by 2.9 percent
vis-a-vis the preceding quarter.
0
10000
20000
30000
40000
50000
60000
70000
80000
90000
100000
Q1 Q2 Q3 Q4 Q1 Q2 Q3 Q4 Q1 Q2 Q3 Q4 Q1 Q2 Q3 Q4
2017/18 2018/19 201920 2020/21
(In
Mill
ions
of B
irr)
Total Domestic Revenue Tax Revenue Direct Tax Revenue
Indirect Taxes Non -Tax Revenue
National Bank of Ethiopia Quarterly Bulletin
Fourth Quarter 2020/21 84
Fig.VI.2: Domestic Revenue by Major Components
6.2 Expenditure
During the review period, Federal
government expenditure (including
regional transfers) reached Birr 121.0
billion, depicting a 3.2 percent
annual and 26.1 percent quarterly
increase. On quarterly basis, the
increase was attributed to higher
current and capital expenditures
(Table 6.3).
(Table 6.3).
On yearly terms, current expenditure
at Birr 48.0 billion went up by 50.3
percent, mainly on account of
higher expenses on general services
and debt service while, capital
expenditure (Birr 32.5 billion) showed
a 19.1 percent decline.
Direct Tax Revenue
27.1%
Indirect Tax Revenue
61.3%
Non Tax Revenue
11.6%
Fourth Quarter 2020/21 4
Tax revenue reached Birr 65.3 billion
indicating a 31.8 percent annual
increase due to 42.5 percent growth
in revenue from direct taxes and 27.6
percent from indirect taxes.
Direct tax revenue, which mostly
comprises business and personal
income taxes, stood at Birr 20.0 billion
showing a 34.0 percent quarterly
and 42.5 percent annual growth.
Meanwhile, revenue from indirect
tax reached Birr 45.2 billion and grew
by 27.6 percent compared to a year
ago while it declined by 2.9 percent
vis-a-vis the preceding quarter.

Fourth Quarter 2020/21 | 77
National Bank of Ethiopia Quarterly Bulletin
National Bank of Ethiopia Quarterly Bulletin
Fourth Quarter 2020/21 83
income
Fig.VI.1: Quarterly Developments in Major Components of Domestic Revenue of the Federal Government
Tax revenue reached Birr 65.3 billion indicating a 31.8 percent annual increase due to 42.5 percent growth in revenue from direct taxes and 27.6 percent from indirect taxes.
Direct tax revenue, which mostly
comprises business and personal
income taxes, stood at Birr 20.0 billion
showing a 34.0 percent quarterly
and 42.5 percent annual growth.
Meanwhile, revenue from indirect
tax reached Birr 45.2 billion and grew
by 27.6 percent compared to a year
ago while it declined by 2.9 percent
vis-a-vis the preceding quarter.
0
10000
20000
30000
40000
50000
60000
70000
80000
90000
100000
Q1 Q2 Q3 Q4 Q1 Q2 Q3 Q4 Q1 Q2 Q3 Q4 Q1 Q2 Q3 Q4
2017/18 2018/19 201920 2020/21
(In
Mill
ions
of B
irr)
Total Domestic Revenue Tax Revenue Direct Tax Revenue
Indirect Taxes Non -Tax Revenue
National Bank of Ethiopia Quarterly Bulletin
Fourth Quarter 2020/21 84
Fig.VI.2: Domestic Revenue by Major Components
6.2 Expenditure
During the review period, Federal
government expenditure (including
regional transfers) reached Birr 121.0
billion, depicting a 3.2 percent
annual and 26.1 percent quarterly
increase. On quarterly basis, the
increase was attributed to higher
current and capital expenditures
(Table 6.3).
(Table 6.3).
On yearly terms, current expenditure
at Birr 48.0 billion went up by 50.3
percent, mainly on account of
higher expenses on general services
and debt service while, capital
expenditure (Birr 32.5 billion) showed
a 19.1 percent decline.
Direct Tax Revenue
27.1%
Indirect Tax Revenue
61.3%
Non Tax Revenue
11.6%
National Bank of Ethiopia Quarterly Bulletin
Fourth Quarter 2020/21 84
Fig.VI.2: Domestic Revenue by Major Components
6.2 Expenditure
During the review period, Federal
government expenditure (including
regional transfers) reached Birr 121.0
billion, depicting a 3.2 percent
annual and 26.1 percent quarterly
increase. On quarterly basis, the
increase was attributed to higher
current and capital expenditures
(Table 6.3).
(Table 6.3).
On yearly terms, current expenditure
at Birr 48.0 billion went up by 50.3
percent, mainly on account of
higher expenses on general services
and debt service while, capital
expenditure (Birr 32.5 billion) showed
a 19.1 percent decline.
Direct Tax Revenue
27.1%
Indirect Tax Revenue
61.3%
Non Tax Revenue
11.6%
Fourth Quarter 2020/21 4
Tax revenue reached Birr 65.3 billion
indicating a 31.8 percent annual
increase due to 42.5 percent growth
in revenue from direct taxes and 27.6
percent from indirect taxes.
Direct tax revenue, which mostly
comprises business and personal
income taxes, stood at Birr 20.0 billion
showing a 34.0 percent quarterly
and 42.5 percent annual growth.
Meanwhile, revenue from indirect
tax reached Birr 45.2 billion and grew
by 27.6 percent compared to a year
ago while it declined by 2.9 percent
vis-a-vis the preceding quarter.
National Bank of Ethiopia Quarterly Bulletin
Fourth Quarter 2020/21 84
Fig.VI.2: Domestic Revenue by Major Components
6.2 Expenditure
During the review period, Federal
government expenditure (including
regional transfers) reached Birr 121.0
billion, depicting a 3.2 percent
annual and 26.1 percent quarterly
increase. On quarterly basis, the
increase was attributed to higher
current and capital expenditures
(Table 6.3).
(Table 6.3).
On yearly terms, current expenditure
at Birr 48.0 billion went up by 50.3
percent, mainly on account of
higher expenses on general services
and debt service while, capital
expenditure (Birr 32.5 billion) showed
a 19.1 percent decline.
Direct Tax Revenue
27.1%
Indirect Tax Revenue
61.3%
Non Tax Revenue
11.6%

78 | Fourth Quarter 2020/21
National Bank of Ethiopia Quarterly Bulletin
Table 6.3: Summary of Federal Government Expenditure by Component(In Millions of Birr)
No Particulars
2019/20 2020/21
PercentageChange
PerformanceRate
QIV Budget QIII QIV
A B C D D/A D/C D/B
Total Expenditure 117,293.2 455,137.7 95,991.8 121,045.5 3.2 26.1 26.6
1 Current Expenditure 31,978.2 141,935.5 22,285.2 48,066.3 50.3 115.7 33.9
- General Services 9,996.6 38,465.5 10,157.6 21,332.0 113.4 110.0 55.5
- Economic Services 3,085.2 6,770.2 1,532.0 1,831.8 (40.6) 19.6 27.1
- Social Services 16,469.4 37,099.0 9,346.7 12,889.2 (21.7) 37.9 34.7
- Others expenditure 547.0 39,835.8 87.5 83.3 (84.8) (4.9) 0.2
- Debt Service 1,880.0 19,765.1 1,161.4 11,930.1 534.6 927.2 60.4
2 Capital Expenditure 40,212.5 137,396.5 24,622.9 32,543.9 (19.1) 32.2 23.7
-Economic Development 28,176.4 100,349.2 20,207.1 17,698.7 (37.2) (12.4) 17.6
- Social Development 10,765.0 29,180.2 3,776.7 12,566.3 16.7 232.7 43.1- General Development 1,271.1 7,867.1 639.0 2,278.9 79.3 256.6 29.0
4 Regional Transfers 45,102.4 175,805.7 49,083.7 40,435.3 (10.3) (17.6) 23.0Source: Ministry of Finance National Bank of Ethiopia Quarterly Bulletin
Fourth Quarter 2020/21 86
Fig.VI.3: Major Components of Federal Governments Expenditure
Current Expenditure
39.7%
Capital Expenditure26.9%
Regional Transfer33.4%

Fourth Quarter 2020/21 | 79
National Bank of Ethiopia Quarterly Bulletin
National Bank of Ethiopia Quarterly Bulletin
Fourth Quarter 2020/21 86
Fig.VI.3: Major Components of Federal Governments Expenditure
Current Expenditure
39.7%
Capital Expenditure26.9%
Regional Transfer33.4%
National Bank of Ethiopia Quarterly Bulletin
Fourth Quarter 2020/21 87
Fig.VI.4: Quarterly Development in Federal Government Expenditure by Components
6.3 Deficit Financing
Federal government budget
operation during the review
period reached in Birr 47.1 billion
deficits much higher than Birr 36.5
billion deficit recorded last year
same period.
The deficit was financed by net
domestic and external borrowing
(Table 6.1).
0
20000
40000
60000
80000
100000
120000
140000
2017/18 2018/19 2019/20 2020/21
(In
Mill
ions
of B
irr)
Quarters/Years Total Expenditure Current Expenditure
Capital Expenditure Regional Transfers

80 | Fourth Quarter 2020/21
National Bank of Ethiopia Quarterly Bulletin
National Bank of Ethiopia Quarterly Bulletin
88 | 2020/21 Fourth Quarter
Fig.VI.5: Federal Government Finance during Fourth Quarter of F.Y 2020/21
020000400006000080000
100000120000140000160000180000200000
2017/18 2018/19 2019/20 2020/21
(In
Mill
ions
of B
irr)
Quarters/Years
Expenditure Deficit Revenue Including Grants

Fourth Quarter 2020/21 | 81
National Bank of Ethiopia Quarterly Bulletin
National Bank of Ethiopia Quarterly Bulletin
88 | 2020/21 Fourth Quarter
Fig.VI.5: Federal Government Finance during Fourth Quarter of F.Y 2020/21
020000400006000080000
100000120000140000160000180000200000
2017/18 2018/19 2019/20 2020/21
(In
Mill
ions
of B
irr)
Quarters/Years
Expenditure Deficit Revenue Including Grants
VII. DEVELOPMENTS IN INVESTMENT During the fourth quarter of 2020/21,
22 investment projects having
investment capital of Birr 752.7 million
became operational. Compared to
last year same quarter, the number
of investment projects showed no
progress while investment capitals
move up by 242.2 percent.
All reported investment projects were
private and about 72.7 percent were
domestic and 27.3 percent foreign.
The domestic projects had Birr 716.9
million (95.2 percent) investment
capitals while that of foreign projects
Birr 35.8 million (4.8 percent).
These investment projects
have generated employment
opportunities for 871 employees
which was 988.8 percent higher
than the same quarter of last year.
Of the total employment created
during the period, 44.3 percent was
permanent and 55.7 percent casual
(Table 7.1).

82 | Fourth Quarter 2020/21
National Bank of Ethiopia Quarterly Bulletin
Table 7.1: Performance of Operational Investment ProjectsCapital (In millions of Birr)
Type of Projects Items
2019/20 2020/21 PercentageChangesQIV QIII QIV
A B C Share C/A C/B
1. Total Investment
Number of projects 22 20 22 100 0.0 10.0
Capital 219.9 81.3 752.7 100 242.2 825.8
Permanent Employment 44 244 386 100 777.3 58.2
Temporary Employment 36 99 485 100 1,247.2 389.9
2. Private Investment
Number of projects 22 20 22 100 0.0 10.0
Capital 219.9 81.3 752.7 100 242.2 825.8
Permanent Employment 44 244 386 100 777.3 58.2
Temporary Employment 36 99 485 100 1,247.2 389.9
2.1 Domestic Investment
Number of projects 21 14 16 72.7 -23.8 14.3
Capital 213.0 45.4 716.9 95.2 236.6 1,477.6
Permanent Employment 34 0 177 45.9 420.6 -
Temporary Employment 31 27 166 34.2 435.5 514.8
2.2. Foreign Investment
Number of projects 1 6 6 27.3 500.0 0.0
Capital 7 35.9 35.8 4.8 413.9 -0.2
Permanent Employment 10 244 209 54.1 1,990.0 -14.3
Temporary Employment 5 72 319 65.8 6,280.0 343.1
3. Public Investment
Number of projects - - - - - -
Capital - - - - - -
Permanent Employment - - - - - -
Temporary Employment - - - - - -Source: Ethiopian Investment Commission

Fourth Quarter 2020/21 | 83
National Bank of Ethiopia Quarterly Bulletin
As for sectoral distribution, real
estate, renting and business
activities constituted 36.4 percent
of total investment projects followed
by construction (31.8 percent),
manufacturing (18.2 percent)
while that of hotels & restaurants,
tour operation, transport, &
communication and others on
their parts constitutes (4.5 percent
each). Out of the total Birr 752.7
million capitals invested, hotels and
restaurants received 66.4 percent,
manufacturing 25 percent, real
estate, renting and business activities
4.7 percent and construction 2.2
percent.
About 38.9 percent of the permanent
employment was created by hotels
and restaurants, 34.2 percent by real
estate, renting and business activities,
22 percent by manufacturing and
4.4 percent by other sector. On
the other hand, real estate, renting
and business activities is the leading
sector by accounting 59.8 percent of
temporary employment followed by
hotels and restaurants (30.9 percent),
manufacturing (7.6 percent) and
construction (1.6 percent) (Table
7.2).

84 | Fourth Quarter 2020/21
National Bank of Ethiopia Quarterly Bulletin
Table 7.2: Investment Distribution by Sector during the Third Quarter of 2020/21
Sectors No. ofProj.
Share (%)
Capital(in Million Birr)
Share (%) Perm. Emp.
Share (%)
Temp. Emp.
Share (%)
Agriculture, hunting and forestry - - - - - - - -
Construction 7 31.8 16.4 2.2 2 0.5 8 1.6Education - - - - - - - -Electricity, gas, steam and water supply
- - - - - - - -
Health and social work - - - - - - - -
Hotels and restaurants 1 4.5 500.0 66.4 150 38.9 150 30.9
Manufacturing 4 18.2 188.5 25.0 85 22.0 37 7.6Mining and quarrying - - - - - - -
Other community, social and personal service activities
- - - - - - - -
Real estate, renting and business activities
8 36.4 35.4 4.7 132 34.2 290 59.8
Tour operation, transport, and communication
1 4.5 4.0 0.5 - - - -
Wholesale, retail trade & repair service
- - - - - - - -
Others* 1 4.5 8.3 1.1 17 4.4 - -
Grand Total 22 100 752.7 100 386 100 485 100
Source: Ethiopian Investment Commission *Export of flowers, spices, cotton and cotton product, cly spots, wooden handicrafts, souvenirs and flower baskets, data center services.
In terms of regional distribution,
Addis Ababa account about 72.7
percent of the total projects with
95.2 percent of total investment
capital while multiregional projects
constitutes 27.3 percent of the total
projects with 4.8 percent of total
investment capital. In terms of job
creation Addis Ababa accounted
for 45.9 and 34.2 percent of the
total permanent and temporary
employments respectively while
multiregional projects on their part
constitutes 54.1 and 65.8 percent
of permanent and temporary
employment respectively (Table 7.3).

Fourth Quarter 2020/21 | 85
National Bank of Ethiopia Quarterly Bulletin
Nat
iona
l Ban
k of
Eth
iopi
a Q
uart
erly
Bul
letin
93|
2020
/21
Four
thQ
uart
er
Tabl
e 7.
3: P
erfo
rman
ce o
f Ope
ratio
nal I
nves
tmen
t Pro
ject
s by
III. I
NTE
RNA
TION
AL
ECO
NO
MIC
DEVE
LOPM
ENTS
Region20
19/2
020
20/2
1G
row
th R
ate
QIV
QII
IQ
IVC
/AC
/B
AB
CSh
are
In (%
)No of Proj
Capital
Perm emp
Temp emp
No of Proj
Capital
Perm emp
Temp emp
No of Proj
Capital
Perm emp
Temp emp
No of Proj
Capital
Perm emp
Temp emp
No of Proj
Capital.
Perm emp
Temp emp
No of Proj
Capital.
Perm emp
Temp emp
Add
is
Aba
ba21
213.
034
3114
45-
2716
716.
917
716
672
.795
.245
.934
.2-2
3.8
236.
642
0.6
435.
514
.31,
477.
6-
514.
8
Afa
r-
--
--
--
--
--
--
--
--
--
--
--
-
Am
hara
--
--
--
--
--
--
--
--
--
--
--
--
B.G
umuz
--
--
--
--
--
--
--
--
--
--
--
--
Dire
Daw
a-
--
--
--
--
--
--
--
--
--
--
--
-
Oro
mia
--
--
--
--
--
--
--
--
--
--
--
--
SNN
PR-
--
--
--
--
--
--
--
--
--
--
--
-
Gam
b-
--
--
--
--
--
--
--
--
--
--
--
-
Som
ali
--
--
--
--
--
--
--
--
--
--
--
--
Har
ari
--
--
--
--
--
--
--
--
--
--
--
--
Tigr
ay-
--
--
--
--
--
--
--
--
--
--
--
-M
ulti-
regi
onal
17.
010
56
3624
472
635
.820
931
927
.34.
854
.165
.850
041
4.1
1,99
0.0
6,28
0.0
0.0
-0.1
-14.
334
3.1
Gran
d To
tal
2221
9.9
4436
2081
244
9922
752.
738
648
510
010
010
010
00.
024
2.2
777.
31,
247.
240
0.0
23.0
-59.
01.
0So
urce
: Eth
iopi
an In
vest
men
t Com
mis
sion
Region20
19/2
020
20/2
1G
row
th R
ate
QIV
QIII
QIV
Shar
e In
(%)
C/A
C/B
AB
CNo of Proj
Capital
Perm emp
Temp emp
No of Proj
Capital
Perm emp
Temp emp
No of Proj
Capital
Perm emp
Temp emp
No of Proj
Capital
Perm emp
Temp emp
No of Proj
Capital.
Perm emp
Temp emp
No of Proj
Capital.
Perm emp
Temp emp
Ad
disA
baba
2121
3.0
3431
1445
-27
1671
6.9
177
166
72.7
95.2
45.9
34.2
-23.
823
6.6
420.
643
5.5
14.3
1,47
7.6
-51
4.8
Afa
r-
--
--
--
--
--
--
--
--
--
--
--
-
Am
hara
--
--
--
--
--
--
--
--
--
--
--
--
B.G
umuz
--
--
--
--
--
--
--
--
--
--
--
--
Dire
Daw
a-
--
--
--
--
--
--
--
--
--
--
--
-
Oro
mia
--
--
--
--
--
--
--
--
--
--
--
--
SNN
PR-
--
--
--
--
--
--
--
--
--
--
--
-
Gam
b-
--
--
--
--
--
--
--
--
--
--
--
-
Som
ali
--
--
--
--
--
--
--
--
--
--
--
--
Hara
ri-
--
--
--
--
--
--
--
--
--
--
--
-
Tigra
y-
--
--
--
--
--
--
--
--
--
--
--
-M
ulti-
regi
onal
17.
010
56
3624
472
635
.820
931
927
.34.
854
.165
.850
041
4.1
1,99
0.0
6,28
0.0
0.0
-0.1
-14.
334
3.1
Gra
nd T
otal
2221
9.9
4436
2081
244
9922
752.
738
648
510
010
010
010
00.
024
2.2
777.
31,
247.
240
0.0
23.0
-59.
01.
0
Tabl
e 7.
3:Pe
rform
ance
of O
pera
tiona
l Inv
estm
ent P
roje
cts
by R
egio
n
Cap
ital (
In m
illion
s of B
irr)

86 | Fourth Quarter 2020/21
National Bank of Ethiopia Quarterly Bulletin National Bank of Ethiopia Quarterly Bulletin
94 | 2020/21 Fourth Quarter
VIII. INTERNATIONAL ECONOMIC DEVELOPMENTS
8.1. Overview of the World
Economy4
The global economic recovery
momentum remains solid amid
divergent pandemic developments.
Global real GDP growth (excluding
the euro area) increased by 0.9
percent quarter on quarter in the
third quarter of 2020/21. The growth
momentum is expected to remain
solid in the fourth quarter as
advanced and emerging market
economies continue to reopen their
economies amid divergent
pandemic developments. The global
recovery is also reflected in strong
survey data. The composite output
Purchasing Managers’ Index (PMI)
excluding the euro area rose to a 15-
year high in the fourth quarter of
2020/21. Economic activity remains
solid in manufacturing and is gaining
strength in the services sector. The
survey data softened somewhat
4Sections 8.1– 8.3 are excerpted from European
Central Bank monthly bulletin of 5/2021.
towards the end of the fourth
quarter, as the high PMI readings
normalised to some extent in a
number of countries, including the
United States and China.
In the United States, the economy
continues to recover strongly. Survey
data showed that manufacturing
and service activity remained at
very high levels in June. At the same
time, supply constraints are creating
headwinds to the recovery, with a
growing backlog of work and
lengthening supplier delivery times.
While the labour market continues to
improve, skill mismatches in some
sectors are leading to labour market
tightness in the near term.
In the United Kingdom, the economy
is rebounding, although rising
COVID-19 cases increasingly pose
downside risks. Monthly GDP growth
in May continues to point to a strong
recovery in the fourth quarter of
2020/21. Similarly, business surveys,
consumer confidence and mobility
National Bank of Ethiopia Quarterly Bulletin
95 | 2020/21 Fourth Quarter
trackers signal a strong rise in activity,
particularly in the services sector.
In the Japan, the pace of economic
activity has slowed in the fourth
quarter, owing in part to supply
constraints and pandemic
developments. Real GDP growth is
expected to remain weak in the
fourth quarter as a renewed rise in
COVID-19 cases prompted a
tightening of containment measures.
In China, The recovery is progressing,
while producer price pressures
remain high. Monthly data point to
continuing robust growth during the
fourth quarter of 2020/21,
notwithstanding a dampening in
June. Meanwhile, annual producer
price inflation stabilised at 8.8
percent in June, which remains close
to the 12-year high of 9.0 percent
recorded in May. As base effects
and the impact of raw commodity
prices fade, producer prices are
expected to normalise.
8.2. Inflation Developments
Global inflation rose further in May,
driven largely by transitory factors.
Annual consumer price inflation in
the countries of the Organisation for
Economic Co-operation and
Development (OECD) increased to
3.8 percent in May, up from 3.3
percent in April. Higher commodity
prices, pushed up further by base
year effects, contributed significantly
to this development, while supply
bottlenecks and fiscal stimulus also
supported price pressures.
Meanwhile, core inflation (excluding
food and energy) rose to 2.9 percent
in May, compared with 2.4 percent
in the previous month.
National Bank of Ethiopia Quarterly Bulletin
94 | 2020/21 Fourth Quarter
VIII. INTERNATIONAL ECONOMIC DEVELOPMENTS
8.1. Overview of the World
Economy4
The global economic recovery
momentum remains solid amid
divergent pandemic developments.
Global real GDP growth (excluding
the euro area) increased by 0.9
percent quarter on quarter in the
third quarter of 2020/21. The growth
momentum is expected to remain
solid in the fourth quarter as
advanced and emerging market
economies continue to reopen their
economies amid divergent
pandemic developments. The global
recovery is also reflected in strong
survey data. The composite output
Purchasing Managers’ Index (PMI)
excluding the euro area rose to a 15-
year high in the fourth quarter of
2020/21. Economic activity remains
solid in manufacturing and is gaining
strength in the services sector. The
survey data softened somewhat
4Sections 8.1– 8.3 are excerpted from European
Central Bank monthly bulletin of 5/2021.
towards the end of the fourth
quarter, as the high PMI readings
normalised to some extent in a
number of countries, including the
United States and China.
In the United States, the economy
continues to recover strongly. Survey
data showed that manufacturing
and service activity remained at
very high levels in June. At the same
time, supply constraints are creating
headwinds to the recovery, with a
growing backlog of work and
lengthening supplier delivery times.
While the labour market continues to
improve, skill mismatches in some
sectors are leading to labour market
tightness in the near term.
In the United Kingdom, the economy
is rebounding, although rising
COVID-19 cases increasingly pose
downside risks. Monthly GDP growth
in May continues to point to a strong
recovery in the fourth quarter of
2020/21. Similarly, business surveys,
consumer confidence and mobility

Fourth Quarter 2020/21 | 87
National Bank of Ethiopia Quarterly BulletinNational Bank of Ethiopia Quarterly Bulletin
95 | 2020/21 Fourth Quarter
trackers signal a strong rise in activity,
particularly in the services sector.
In the Japan, the pace of economic
activity has slowed in the fourth
quarter, owing in part to supply
constraints and pandemic
developments. Real GDP growth is
expected to remain weak in the
fourth quarter as a renewed rise in
COVID-19 cases prompted a
tightening of containment measures.
In China, The recovery is progressing,
while producer price pressures
remain high. Monthly data point to
continuing robust growth during the
fourth quarter of 2020/21,
notwithstanding a dampening in
June. Meanwhile, annual producer
price inflation stabilised at 8.8
percent in June, which remains close
to the 12-year high of 9.0 percent
recorded in May. As base effects
and the impact of raw commodity
prices fade, producer prices are
expected to normalise.
8.2. Inflation Developments
Global inflation rose further in May,
driven largely by transitory factors.
Annual consumer price inflation in
the countries of the Organisation for
Economic Co-operation and
Development (OECD) increased to
3.8 percent in May, up from 3.3
percent in April. Higher commodity
prices, pushed up further by base
year effects, contributed significantly
to this development, while supply
bottlenecks and fiscal stimulus also
supported price pressures.
Meanwhile, core inflation (excluding
food and energy) rose to 2.9 percent
in May, compared with 2.4 percent
in the previous month.

88 | Fourth Quarter 2020/21
National Bank of Ethiopia Quarterly Bulletin
National Bank of Ethiopia Quarterly Bulletin
96 | 2020/21 Fourth Quarter
8.3. Commodity Price
Due to the rapid global economic recovery, oil prices have increased further
since the Governing Council meeting in June, and now hover around their
highest level since October 2018. Oil demand has increased substantially
following a pick-up in mobility, particularly air travel, amid the swift reopening in
some economies. Although OPEC plus recently reached a deal to expand its
production, supply is lagging. The consequence has been a tightening of oil
markets, spurring higher prices as consumption recovers. In contrast, metal
commodity prices have plateaued since the last Governing Council meeting,
while global food prices have fallen.
8.4. Exchange Rate Developments
In foreign exchange markets during
June 2021, the euro depreciated in
trade-weighted terms. Over the
review period, the nominal effective
exchange rate of the euro, as
measured against the currencies of
42 of the euro area’s most important
trading partners, weakened by 0.8
percent. The euro depreciated
against the US dollar (by 3.3
percent), mainly reflecting the
widening of the short-term interest
rate expectations differential
between the euro area and the
United States, due to the perceived
change in the timing of US monetary
policy normalisation. The euro also
weakened against other major
currencies, including the Chinese
renminbi (by 2.1 percent), the
Japanese yen (by 2.8 percent) and
the Swiss franc (by 0.6 percent), as
well as against the currencies of
some major emerging market
economies. Over the same period,
the euro continued appreciating
against the currencies of several
non-euro area European Union
Member States, including the
Hungarian forint (by 4.1 percent), the
Polish zloty (by 2.6 percent) and the
Czech koruna (by 1.2 percent).
8.3. Commodity Price
Due to the rapid global economic
recovery, oil prices have increased
further since the Governing Council
meeting in June, and now hover
around their highest level since
October 2018. Oil demand has
increased substantially following a
pick-up in mobility, particularly air
travel, amid the swift reopening in
some economies. Although OPEC
plus recently reached a deal to
expand its production, supply is
lagging. The consequence has been
a tightening of oil markets, spurring
higher prices as consumption
recovers. In contrast, metal
commodity prices have plateaued
since the last Governing Council
meeting, while global food prices
have fallen.
Fourth Quarter 2020/21 | 89
National Bank of Ethiopia Quarterly Bulletin
8.3. Commodity Price
Due to the rapid global economic
recovery, oil prices have increased
further since the Governing Council
meeting in June, and now hover
around their highest level since
October 2018. Oil demand has
increased substantially following a
pick-up in mobility, particularly air
travel, amid the swift reopening in
some economies. Although OPEC
plus recently reached a deal to
expand its production, supply is
lagging. The consequence has been
a tightening of oil markets, spurring
higher prices as consumption
recovers. In contrast, metal
commodity prices have plateaued
since the last Governing Council
meeting, while global food prices
have fallen.
8.5. Impact of Global Economic Development on Ethiopian Economy
During the fourth quarter of 2020/21,
the global economic recovery
momentum remains solid while
global inflation rose further in May,
driven largely by transitory factors.
Due to the rapid global economic
recovery, oil prices have increased
further since the Governing Council
meeting in June,
During the review quarter, though
the fast depreciation of Birr along
with the relative price advantage
of domestic economy NEER
appreciated by 80.1 percent and
resulted in REER to depreciate by 0.01
percent. Thus, it slightly enhances
international competitiveness of the
country in global market. On the
other hand, the rise of crude oil prices
aggravates the country from paying
extra foreign exchange payments so
that further suppressing impact on
current account balance compared
to last year the same period.

90 | Fourth Quarter 2020/21
National Bank of Ethiopia Quarterly Bulletin
STATISTICAL TABLES
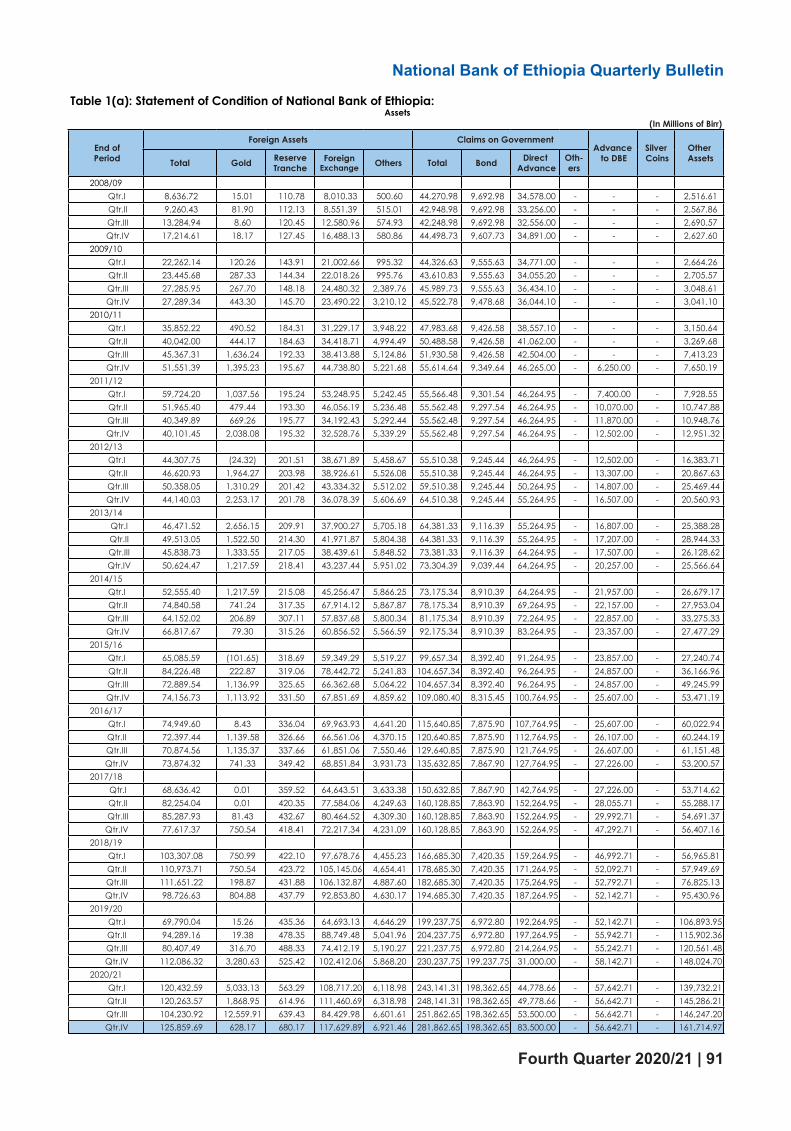
Fourth Quarter 2020/21 | 91
National Bank of Ethiopia Quarterly Bulletin
STATISTICAL TABLES
Table 1(a): Statement of Condition of National Bank of Ethiopia: Assets
(In Millions of Birr)
End of Period
Foreign Assets Claims on GovernmentAdvance
to DBESilver Coins
Other AssetsTotal Gold Reserve
TrancheForeign
Exchange Others Total Bond Direct Advance
Oth-ers
2008/09 Qtr.I 8,636.72 15.01 110.78 8,010.33 500.60 44,270.98 9,692.98 34,578.00 - - - 2,516.61 Qtr.II 9,260.43 81.90 112.13 8,551.39 515.01 42,948.98 9,692.98 33,256.00 - - - 2,567.86 Qtr.III 13,284.94 8.60 120.45 12,580.96 574.93 42,248.98 9,692.98 32,556.00 - - - 2,690.57 Qtr.IV 17,214.61 18.17 127.45 16,488.13 580.86 44,498.73 9,607.73 34,891.00 - - - 2,627.60
2009/10 Qtr.I 22,262.14 120.26 143.91 21,002.66 995.32 44,326.63 9,555.63 34,771.00 - - - 2,664.26 Qtr.II 23,445.68 287.33 144.34 22,018.26 995.76 43,610.83 9,555.63 34,055.20 - - - 2,705.57 Qtr.III 27,285.95 267.70 148.18 24,480.32 2,389.76 45,989.73 9,555.63 36,434.10 - - - 3,048.61 Qtr.IV 27,289.34 443.30 145.70 23,490.22 3,210.12 45,522.78 9,478.68 36,044.10 - - - 3,041.10
2010/11 Qtr.I 35,852.22 490.52 184.31 31,229.17 3,948.22 47,983.68 9,426.58 38,557.10 - - - 3,150.64 Qtr.II 40,042.00 444.17 184.63 34,418.71 4,994.49 50,488.58 9,426.58 41,062.00 - - - 3,269.68 Qtr.III 45,367.31 1,636.24 192.33 38,413.88 5,124.86 51,930.58 9,426.58 42,504.00 - - - 7,413.23 Qtr.IV 51,551.39 1,395.23 195.67 44,738.80 5,221.68 55,614.64 9,349.64 46,265.00 - 6,250.00 - 7,650.19
2011/12 Qtr.I 59,724.20 1,037.56 195.24 53,248.95 5,242.45 55,566.48 9,301.54 46,264.95 - 7,400.00 - 7,928.55 Qtr.II 51,965.40 479.44 193.30 46,056.19 5,236.48 55,562.48 9,297.54 46,264.95 - 10,070.00 - 10,747.88 Qtr.III 40,349.89 669.26 195.77 34,192.43 5,292.44 55,562.48 9,297.54 46,264.95 - 11,870.00 - 10,948.76 Qtr.IV 40,101.45 2,038.08 195.32 32,528.76 5,339.29 55,562.48 9,297.54 46,264.95 - 12,502.00 - 12,951.32
2012/13 Qtr.I 44,307.75 (24.32) 201.51 38,671.89 5,458.67 55,510.38 9,245.44 46,264.95 - 12,502.00 - 16,383.71 Qtr.II 46,620.93 1,964.27 203.98 38,926.61 5,526.08 55,510.38 9,245.44 46,264.95 - 13,307.00 - 20,867.63 Qtr.III 50,358.05 1,310.29 201.42 43,334.32 5,512.02 59,510.38 9,245.44 50,264.95 - 14,807.00 - 25,469.44 Qtr.IV 44,140.03 2,253.17 201.78 36,078.39 5,606.69 64,510.38 9,245.44 55,264.95 - 16,507.00 - 20,560.93
2013/14 Qtr.I 46,471.52 2,656.15 209.91 37,900.27 5,705.18 64,381.33 9,116.39 55,264.95 - 16,807.00 - 25,388.28 Qtr.II 49,513.05 1,522.50 214.30 41,971.87 5,804.38 64,381.33 9,116.39 55,264.95 - 17,207.00 - 28,944.33 Qtr.III 45,838.73 1,333.55 217.05 38,439.61 5,848.52 73,381.33 9,116.39 64,264.95 - 17,507.00 - 26,128.62 Qtr.IV 50,624.47 1,217.59 218.41 43,237.44 5,951.02 73,304.39 9,039.44 64,264.95 - 20,257.00 - 25,566.64
2014/15 Qtr.I 52,555.40 1,217.59 215.08 45,256.47 5,866.25 73,175.34 8,910.39 64,264.95 - 21,957.00 - 26,679.17 Qtr.II 74,840.58 741.24 317.35 67,914.12 5,867.87 78,175.34 8,910.39 69,264.95 - 22,157.00 - 27,953.04 Qtr.III 64,152.02 206.89 307.11 57,837.68 5,800.34 81,175.34 8,910.39 72,264.95 - 22,857.00 - 33,275.33 Qtr.IV 66,817.67 79.30 315.26 60,856.52 5,566.59 92,175.34 8,910.39 83,264.95 - 23,357.00 - 27,477.29
2015/16 Qtr.I 65,085.59 (101.65) 318.69 59,349.29 5,519.27 99,657.34 8,392.40 91,264.95 - 23,857.00 - 27,240.74 Qtr.II 84,226.48 222.87 319.06 78,442.72 5,241.83 104,657.34 8,392.40 96,264.95 - 24,857.00 - 36,166.96 Qtr.III 72,889.54 1,136.99 325.65 66,362.68 5,064.22 104,657.34 8,392.40 96,264.95 - 24,857.00 - 49,245.99 Qtr.IV 74,156.73 1,113.92 331.50 67,851.69 4,859.62 109,080.40 8,315.45 100,764.95 - 25,607.00 - 53,471.19
2016/17 Qtr.I 74,949.60 8.43 336.04 69,963.93 4,641.20 115,640.85 7,875.90 107,764.95 - 25,607.00 - 60,022.94 Qtr.II 72,397.44 1,139.58 326.66 66,561.06 4,370.15 120,640.85 7,875.90 112,764.95 - 26,107.00 - 60,244.19 Qtr.III 70,874.56 1,135.37 337.66 61,851.06 7,550.46 129,640.85 7,875.90 121,764.95 - 26,607.00 - 61,151.48 Qtr.IV 73,874.32 741.33 349.42 68,851.84 3,931.73 135,632.85 7,867.90 127,764.95 - 27,226.00 - 53,200.57
2017/18 Qtr.I 68,636.42 0.01 359.52 64,643.51 3,633.38 150,632.85 7,867.90 142,764.95 - 27,226.00 - 53,714.62 Qtr.II 82,254.04 0.01 420.35 77,584.06 4,249.63 160,128.85 7,863.90 152,264.95 - 28,055.71 - 55,288.17 Qtr.III 85,287.93 81.43 432.67 80,464.52 4,309.30 160,128.85 7,863.90 152,264.95 - 29,992.71 - 54,691.37 Qtr.IV 77,617.37 750.54 418.41 72,217.34 4,231.09 160,128.85 7,863.90 152,264.95 - 47,292.71 - 56,407.16
2018/19 Qtr.I 103,307.08 750.99 422.10 97,678.76 4,455.23 166,685.30 7,420.35 159,264.95 - 46,992.71 - 56,965.81 Qtr.II 110,973.71 750.54 423.72 105,145.06 4,654.41 178,685.30 7,420.35 171,264.95 - 52,092.71 - 57,949.69 Qtr.III 111,651.22 198.87 431.88 106,132.87 4,887.60 182,685.30 7,420.35 175,264.95 - 52,792.71 - 76,825.13 Qtr.IV 98,726.63 804.88 437.79 92,853.80 4,630.17 194,685.30 7,420.35 187,264.95 - 52,142.71 - 95,430.96
2019/20 Qtr.I 69,790.04 15.26 435.36 64,693.13 4,646.29 199,237.75 6,972.80 192,264.95 - 52,142.71 - 106,893.95 Qtr.II 94,289.16 19.38 478.35 88,749.48 5,041.96 204,237.75 6,972.80 197,264.95 - 55,942.71 - 115,902.36 Qtr.III 80,407.49 316.70 488.33 74,412.19 5,190.27 221,237.75 6,972.80 214,264.95 - 55,242.71 - 120,561.48 Qtr.IV 112,086.32 3,280.63 525.42 102,412.06 5,868.20 230,237.75 199,237.75 31,000.00 - 58,142.71 - 148,024.70
2020/21 Qtr.I 120,432.59 5,033.13 563.29 108,717.20 6,118.98 243,141.31 198,362.65 44,778.66 - 57,642.71 - 139,732.21 Qtr.II 120,263.57 1,868.95 614.96 111,460.69 6,318.98 248,141.31 198,362.65 49,778.66 - 56,642.71 - 145,286.21 Qtr.III 104,230.92 12,559.91 639.43 84,429.98 6,601.61 251,862.65 198,362.65 53,500.00 - 56,642.71 - 146,247.20 Qtr.IV 125,859.69 628.17 680.17 117,629.89 6,921.46 281,862.65 198,362.65 83,500.00 - 56,642.71 - 161,714.97

92 | Fourth Quarter 2020/21
National Bank of Ethiopia Quarterly Bulletin
Table 1(b): Statement of Condition of National Bank of Ethipia: Liabilities
(In Millions of Birr)
End of PeriodTotal
Liab.= Assets
Currency (Notes
+ Coins)
Deposits Foreign Liabilities Capital Account
Other Liab.Total Gov’t Banker Total Fund
Credit Others
2008/09 Qtr.I 55,424.30 19,640.12 23,365.96 7,222.97 16,143.00 3,660.06 - 3,660.06 3,592.76 5,165.40 Qtr.II 54,777.27 20,870.35 25,148.92 6,215.84 18,933.09 3,123.02 - 3,123.02 2,088.31 3,546.68 Qtr.III 58,224.49 23,303.92 24,710.29 6,682.81 18,027.48 3,713.38 556.02 3,157.36 2,101.15 4,395.76 Qtr.IV 64,340.94 23,836.35 27,942.19 6,671.53 21,270.67 5,380.94 588.35 4,792.59 2,094.84 5,086.60
2009/10 Qtr.I 69,253.03 22,773.23 31,494.51 7,373.32 24,121.19 8,049.53 2,127.19 5,922.33 1,588.53 5,347.24 Qtr.II 69,762.08 25,663.17 28,307.16 7,785.92 20,521.24 8,693.10 2,132.24 6,560.86 1,576.74 5,521.92 Qtr.III 76,324.29 27,277.96 30,107.70 7,036.56 23,071.13 10,995.53 2,188.91 8,806.62 1,576.18 6,366.93 Qtr.IV 75,853.22 28,802.93 26,803.98 6,182.46 20,621.52 11,906.03 2,152.27 9,753.76 1,574.95 6,765.34
2010/11 Qtr.I 86,986.54 29,711.72 31,872.51 8,265.64 23,606.88 12,848.92 2,722.65 10,126.26 2,809.67 9,743.72 Qtr.II 93,800.26 33,949.03 32,141.88 9,369.75 22,772.12 15,062.65 4,769.71 10,292.95 2,757.53 9,889.18 Qtr.III 104,711.13 37,456.68 37,453.93 11,276.68 26,177.25 15,282.84 4,972.05 10,310.80 2,757.53 11,760.16 Qtr.IV 121,066.21 39,100.58 40,233.45 10,290.93 29,942.52 18,695.39 5,058.24 13,637.15 2,749.74 20,287.05
2011/12 Qtr.I 130,619.23 38,732.57 48,523.29 19,133.30 29,389.99 20,368.49 5,047.27 15,321.22 8,848.06 14,146.82 Qtr.II 128,345.76 42,048.13 43,045.28 17,307.05 25,738.23 17,289.74 4,996.96 12,292.78 8,848.06 17,114.54 Qtr.III 118,731.13 44,710.64 29,832.27 11,962.11 17,870.17 15,825.84 5,060.88 10,764.96 8,831.80 19,530.58 Qtr.IV 121,117.25 45,785.24 30,405.78 10,218.40 20,187.38 18,847.12 5,049.31 13,797.81 4,841.48 21,237.65
2012/13 Qtr.I 128,703.84 46,183.34 38,073.19 17,980.48 20,092.72 19,311.91 5,209.14 14,102.77 4,841.92 20,293.48 Qtr.II 136,305.95 50,971.94 36,872.57 12,778.13 24,094.44 20,263.30 5,273.03 14,990.27 4,833.78 23,364.36 Qtr.III 150,144.87 54,292.91 34,503.60 17,952.55 16,551.06 20,750.51 5,181.16 15,569.34 4,833.78 35,764.07 Qtr.IV 145,718.34 54,917.74 29,031.39 9,133.04 19,898.35 19,494.41 5,297.81 14,196.60 4,834.47 37,440.33
2013/14 Qtr.I 153,048.13 50,571.65 37,323.17 16,548.01 20,775.16 23,064.82 5,426.52 17,638.30 4,842.06 37,246.44 Qtr.II 160,045.71 53,864.09 32,759.15 14,339.95 18,419.21 28,216.04 5,456.21 22,759.83 4,842.06 40,364.38 Qtr.III 162,855.69 61,372.47 35,971.75 12,807.36 23,164.39 22,394.73 5,468.90 16,925.83 4,842.06 38,274.68 Qtr.IV 169,752.50 64,355.05 33,760.96 8,793.48 24,967.48 23,910.57 5,685.44 18,225.13 4,849.06 42,876.86
2014/15 Qtr.I 174,366.91 63,714.21 37,053.76 14,407.98 22,645.78 25,489.57 5,577.32 19,912.25 4,849.07 43,260.30 Qtr.II 203,125.95 70,709.06 33,899.35 13,882.20 20,017.15 46,447.12 5,577.32 40,869.81 4,849.07 47,221.36 Qtr.III 201,459.69 74,337.79 42,291.49 21,308.75 20,982.74 36,511.44 5,490.54 31,020.90 4,849.07 43,469.91 Qtr.IV 209,827.30 75,240.70 42,325.60 15,098.54 27,227.06 36,844.30 5,034.04 31,810.26 4,849.07 50,567.64
2015/16 Qtr.I 215,840.68 74,745.66 48,887.10 31,740.19 17,146.91 36,004.39 4,988.41 31,015.98 4,849.20 51,354.33 Qtr.II 249,907.78 77,830.00 49,034.83 25,739.39 23,295.44 61,731.80 4,662.00 57,069.80 4,849.20 56,461.95 Qtr.III 251,649.87 80,258.93 45,004.03 20,077.26 24,926.76 59,027.31 4,479.63 54,547.68 4,849.20 62,510.41 Qtr.IV 262,315.31 82,592.70 50,614.34 14,042.32 36,572.02 63,650.30 4,271.47 59,378.84 4,849.20 60,608.76 2016/17 Qtr.I 276,220.38 85,811.90 54,484.65 18,220.23 36,264.42 71,483.16 4,027.65 67,455.51 4,849.20 59,591.48 Qtr.II 279,389.48 90,247.04 53,908.66 15,628.13 38,280.53 66,855.56 3,645.20 63,210.36 4,849.20 63,529.02 Qtr.III 288,273.88 92,212.49 66,239.19 19,084.80 47,154.39 56,579.86 3,434.90 53,144.96 4,849.20 68,393.15 Qtr.IV 289,933.74 94,245.51 66,754.22 14,741.81 52,012.41 49,897.29 3,296.00 46,601.29 4,849.20 74,187.52
2017/18 Qtr.I 300,209.88 94,962.74 76,379.95 19,337.75 57,042.20 50,984.56 3,036.68 47,947.88 4,849.20 73,033.43 Qtr.II 325,726.77 105,936.80 61,913.44 16,680.94 45,232.50 70,862.22 3,239.47 67,622.75 4,849.20 82,165.11 Qtr.III 330,100.86 112,438.63 68,720.48 18,874.93 49,845.54 59,522.34 2,907.62 56,614.71 4,849.20 84,570.22
Qtr.IV 341,446.08 112,910.96 81,186.45 19,921.99 61,264.46 48,857.99 2,502.21 46,355.78 4,849.20 93,641.49 2018/19
Qtr.I 373,950.89 110,876.51 83,541.82 19,601.81 63,940.01 82,036.37 2,107.92 79,928.45 4,849.20 92,646.99 Qtr.II 399,701.41 120,349.03 73,912.83 23,783.26 50,129.57 99,909.75 1,802.49 98,107.25 4,849.20 100,680.60 Qtr.III 423,954.35 125,298.33 90,171.76 37,661.76 52,510.00 93,865.15 1,705.62 92,159.53 4,849.20 109,769.91 Qtr.IV 440,985.60 121,800.02 101,463.14 22,513.90 78,949.25 94,758.88 1,106.63 93,652.25 4,849.20 118,114.36
2019/20 Qtr.I 428,064.45 123,976.32 83,257.85 20,433.47 62,824.38 94,208.78 805.24 93,403.54 4,849.20 121,772.30 Qtr.II 470,371.98 128,071.58 99,917.83 30,939.51 68,978.32 111,833.99 530.84 111,303.15 4,849.20 125,699.38 Qtr.III 477,449.43 139,106.29 109,747.07 26,131.42 83,615.66 110,558.25 6,560.60 103,997.65 4,849.20 113,188.61 Qtr.IV 548,491.47 140,521.13 140,553.83 34,529.59 106,024.24 127,307.32 6,670.16 120,637.16 4,849.20 135,260.00
2020/21 Qtr.I 560,948.82 124,403.48 170,497.94 33,548.57 136,949.38 154,135.85 24,550.96 129,584.89 4,849.20 107,062.35 Qtr.II 570,333.80 138,864.54 151,544.16 31,702.07 119,842.09 172,023.04 24,979.40 147,043.65 1,013.45 106,888.61 Qtr.III 558,983.48 159,484.75 137,597.63 30,602.71 106,994.93 153,966.87 11,502.32 142,464.55 1,013.45 106,920.77 Qtr.IV 626,080.02 163,709.05 137,436.24 36,843.46 100,592.78 169,766.69 12,004.53 157,762.16 3,109.44 152,058.60

Fourth Quarter 2020/21 | 93
National Bank of Ethiopia Quarterly Bulletin
Table 1(b): Statement of Condition of National Bank of Ethipia: Liabilities
(In Millions of Birr)
End of PeriodTotal
Liab.= Assets
Currency (Notes
+ Coins)
Deposits Foreign Liabilities Capital Account
Other Liab.Total Gov’t Banker Total Fund
Credit Others
2008/09 Qtr.I 55,424.30 19,640.12 23,365.96 7,222.97 16,143.00 3,660.06 - 3,660.06 3,592.76 5,165.40 Qtr.II 54,777.27 20,870.35 25,148.92 6,215.84 18,933.09 3,123.02 - 3,123.02 2,088.31 3,546.68 Qtr.III 58,224.49 23,303.92 24,710.29 6,682.81 18,027.48 3,713.38 556.02 3,157.36 2,101.15 4,395.76 Qtr.IV 64,340.94 23,836.35 27,942.19 6,671.53 21,270.67 5,380.94 588.35 4,792.59 2,094.84 5,086.60
2009/10 Qtr.I 69,253.03 22,773.23 31,494.51 7,373.32 24,121.19 8,049.53 2,127.19 5,922.33 1,588.53 5,347.24 Qtr.II 69,762.08 25,663.17 28,307.16 7,785.92 20,521.24 8,693.10 2,132.24 6,560.86 1,576.74 5,521.92 Qtr.III 76,324.29 27,277.96 30,107.70 7,036.56 23,071.13 10,995.53 2,188.91 8,806.62 1,576.18 6,366.93 Qtr.IV 75,853.22 28,802.93 26,803.98 6,182.46 20,621.52 11,906.03 2,152.27 9,753.76 1,574.95 6,765.34
2010/11 Qtr.I 86,986.54 29,711.72 31,872.51 8,265.64 23,606.88 12,848.92 2,722.65 10,126.26 2,809.67 9,743.72 Qtr.II 93,800.26 33,949.03 32,141.88 9,369.75 22,772.12 15,062.65 4,769.71 10,292.95 2,757.53 9,889.18 Qtr.III 104,711.13 37,456.68 37,453.93 11,276.68 26,177.25 15,282.84 4,972.05 10,310.80 2,757.53 11,760.16 Qtr.IV 121,066.21 39,100.58 40,233.45 10,290.93 29,942.52 18,695.39 5,058.24 13,637.15 2,749.74 20,287.05
2011/12 Qtr.I 130,619.23 38,732.57 48,523.29 19,133.30 29,389.99 20,368.49 5,047.27 15,321.22 8,848.06 14,146.82 Qtr.II 128,345.76 42,048.13 43,045.28 17,307.05 25,738.23 17,289.74 4,996.96 12,292.78 8,848.06 17,114.54 Qtr.III 118,731.13 44,710.64 29,832.27 11,962.11 17,870.17 15,825.84 5,060.88 10,764.96 8,831.80 19,530.58 Qtr.IV 121,117.25 45,785.24 30,405.78 10,218.40 20,187.38 18,847.12 5,049.31 13,797.81 4,841.48 21,237.65
2012/13 Qtr.I 128,703.84 46,183.34 38,073.19 17,980.48 20,092.72 19,311.91 5,209.14 14,102.77 4,841.92 20,293.48 Qtr.II 136,305.95 50,971.94 36,872.57 12,778.13 24,094.44 20,263.30 5,273.03 14,990.27 4,833.78 23,364.36 Qtr.III 150,144.87 54,292.91 34,503.60 17,952.55 16,551.06 20,750.51 5,181.16 15,569.34 4,833.78 35,764.07 Qtr.IV 145,718.34 54,917.74 29,031.39 9,133.04 19,898.35 19,494.41 5,297.81 14,196.60 4,834.47 37,440.33
2013/14 Qtr.I 153,048.13 50,571.65 37,323.17 16,548.01 20,775.16 23,064.82 5,426.52 17,638.30 4,842.06 37,246.44 Qtr.II 160,045.71 53,864.09 32,759.15 14,339.95 18,419.21 28,216.04 5,456.21 22,759.83 4,842.06 40,364.38 Qtr.III 162,855.69 61,372.47 35,971.75 12,807.36 23,164.39 22,394.73 5,468.90 16,925.83 4,842.06 38,274.68 Qtr.IV 169,752.50 64,355.05 33,760.96 8,793.48 24,967.48 23,910.57 5,685.44 18,225.13 4,849.06 42,876.86
2014/15 Qtr.I 174,366.91 63,714.21 37,053.76 14,407.98 22,645.78 25,489.57 5,577.32 19,912.25 4,849.07 43,260.30 Qtr.II 203,125.95 70,709.06 33,899.35 13,882.20 20,017.15 46,447.12 5,577.32 40,869.81 4,849.07 47,221.36 Qtr.III 201,459.69 74,337.79 42,291.49 21,308.75 20,982.74 36,511.44 5,490.54 31,020.90 4,849.07 43,469.91 Qtr.IV 209,827.30 75,240.70 42,325.60 15,098.54 27,227.06 36,844.30 5,034.04 31,810.26 4,849.07 50,567.64
2015/16 Qtr.I 215,840.68 74,745.66 48,887.10 31,740.19 17,146.91 36,004.39 4,988.41 31,015.98 4,849.20 51,354.33 Qtr.II 249,907.78 77,830.00 49,034.83 25,739.39 23,295.44 61,731.80 4,662.00 57,069.80 4,849.20 56,461.95 Qtr.III 251,649.87 80,258.93 45,004.03 20,077.26 24,926.76 59,027.31 4,479.63 54,547.68 4,849.20 62,510.41 Qtr.IV 262,315.31 82,592.70 50,614.34 14,042.32 36,572.02 63,650.30 4,271.47 59,378.84 4,849.20 60,608.76 2016/17 Qtr.I 276,220.38 85,811.90 54,484.65 18,220.23 36,264.42 71,483.16 4,027.65 67,455.51 4,849.20 59,591.48 Qtr.II 279,389.48 90,247.04 53,908.66 15,628.13 38,280.53 66,855.56 3,645.20 63,210.36 4,849.20 63,529.02 Qtr.III 288,273.88 92,212.49 66,239.19 19,084.80 47,154.39 56,579.86 3,434.90 53,144.96 4,849.20 68,393.15 Qtr.IV 289,933.74 94,245.51 66,754.22 14,741.81 52,012.41 49,897.29 3,296.00 46,601.29 4,849.20 74,187.52
2017/18 Qtr.I 300,209.88 94,962.74 76,379.95 19,337.75 57,042.20 50,984.56 3,036.68 47,947.88 4,849.20 73,033.43 Qtr.II 325,726.77 105,936.80 61,913.44 16,680.94 45,232.50 70,862.22 3,239.47 67,622.75 4,849.20 82,165.11 Qtr.III 330,100.86 112,438.63 68,720.48 18,874.93 49,845.54 59,522.34 2,907.62 56,614.71 4,849.20 84,570.22
Qtr.IV 341,446.08 112,910.96 81,186.45 19,921.99 61,264.46 48,857.99 2,502.21 46,355.78 4,849.20 93,641.49 2018/19
Qtr.I 373,950.89 110,876.51 83,541.82 19,601.81 63,940.01 82,036.37 2,107.92 79,928.45 4,849.20 92,646.99 Qtr.II 399,701.41 120,349.03 73,912.83 23,783.26 50,129.57 99,909.75 1,802.49 98,107.25 4,849.20 100,680.60 Qtr.III 423,954.35 125,298.33 90,171.76 37,661.76 52,510.00 93,865.15 1,705.62 92,159.53 4,849.20 109,769.91 Qtr.IV 440,985.60 121,800.02 101,463.14 22,513.90 78,949.25 94,758.88 1,106.63 93,652.25 4,849.20 118,114.36
2019/20 Qtr.I 428,064.45 123,976.32 83,257.85 20,433.47 62,824.38 94,208.78 805.24 93,403.54 4,849.20 121,772.30 Qtr.II 470,371.98 128,071.58 99,917.83 30,939.51 68,978.32 111,833.99 530.84 111,303.15 4,849.20 125,699.38 Qtr.III 477,449.43 139,106.29 109,747.07 26,131.42 83,615.66 110,558.25 6,560.60 103,997.65 4,849.20 113,188.61 Qtr.IV 548,491.47 140,521.13 140,553.83 34,529.59 106,024.24 127,307.32 6,670.16 120,637.16 4,849.20 135,260.00
2020/21 Qtr.I 560,948.82 124,403.48 170,497.94 33,548.57 136,949.38 154,135.85 24,550.96 129,584.89 4,849.20 107,062.35 Qtr.II 570,333.80 138,864.54 151,544.16 31,702.07 119,842.09 172,023.04 24,979.40 147,043.65 1,013.45 106,888.61 Qtr.III 558,983.48 159,484.75 137,597.63 30,602.71 106,994.93 153,966.87 11,502.32 142,464.55 1,013.45 106,920.77 Qtr.IV 626,080.02 163,709.05 137,436.24 36,843.46 100,592.78 169,766.69 12,004.53 157,762.16 3,109.44 152,058.60
Table 2(a): Statement of Condition of Commercial Banks: Assets
(In Millions of Birr)
End of Period
Total (2+3)
1
Reserves Cash in Hand
2
Deposits with NBE 3"
"Foreign Assets
4
ClaimsOn Gov't
5
Total(7+8+9)
6
Claims on Non-Central Gov’t Other Assets
10Loans &
Adv.7
Invest-ment
8
Commercial Banks
92008/09
Qtr.I 17,673.90 3,302.53 14,371.38 7,726.62 6,234.94 50,116.36 34,397.64 14,818.58 900.13 26,922.77 Qtr.II 20,659.25 3,437.48 17,221.77 6,950.64 5,547.24 54,252.77 35,946.71 17,436.57 869.49 33,601.83 Qtr.III 21,886.74 4,039.91 17,846.83 8,093.58 5,548.90 57,041.57 37,079.81 18,852.70 1,109.06 31,611.17 Qtr.IV 23,690.72 4,121.34 19,569.38 9,219.66 5,409.36 57,651.07 38,802.03 17,614.51 1,234.53 49,113.08
2009/10 Qtr.I 27,119.02 4,226.02 22,893.00 9,172.96 5,740.11 60,703.15 39,701.38 19,805.10 1,196.66 40,436.92 Qtr.II 24,371.67 3,907.33 20,464.34 9,731.23 5,177.56 65,942.83 44,092.84 20,297.50 1,552.48 48,475.03 Qtr.III 26,921.09 4,209.86 22,711.23 12,949.12 5,627.86 70,716.27 46,900.67 21,733.09 2,082.51 48,973.02 Qtr.IV 25,217.08 4,596.14 20,620.94 15,060.75 7,415.27 73,299.81 47,540.18 23,796.85 1,962.79 36,932.92
2010/11 Qtr.I 28,768.06 5,861.80 22,906.26 19,245.97 5,480.72 75,434.99 48,436.98 25,124.50 1,873.51 38,067.24 Qtr.II 27,486.93 5,636.70 21,850.23 20,194.12 4,102.86 85,357.09 55,653.80 27,485.93 2,217.36 44,732.22 Qtr.III 31,482.17 6,921.98 24,560.19 21,148.87 4,953.20 100,590.17 62,088.83 35,549.12 2,952.21 52,150.16 Qtr.IV 34,282.97 6,525.71 27,757.27 28,394.16 3,568.67 110,114.46 61,871.31 45,547.45 2,695.70 49,545.00
2011/12 Qtr.I 34,514.38 6,658.96 27,855.43 22,565.30 4,121.67 118,399.53 64,979.01 50,781.33 2,639.19 51,494.85 Qtr.II 30,154.47 5,773.53 24,380.95 23,089.59 2,857.24 135,328.52 75,725.46 58,171.12 1,431.94 63,801.94 Qtr.III 17,652.45 6,982.96 10,669.49 28,640.04 3,068.28 156,445.50 88,608.28 66,455.73 1,381.50 70,487.48 Qtr.IV 29,039.93 7,248.10 21,791.83 24,017.57 4,421.18 170,379.68 94,617.04 73,472.51 2,290.12 105,360.90
2012/13 Qtr.I 27,882.48 8,265.81 19,616.67 20,182.74 8,511.89 171,722.32 94,081.93 75,849.86 1,790.53 83,987.99 Qtr.II 33,108.11 8,294.92 24,813.19 19,475.22 6,693.03 188,001.68 102,409.08 83,727.13 1,865.48 80,835.23 Qtr.III 32,417.53 9,150.51 23,267.02 23,412.02 5,407.49 208,833.85 113,423.09 92,141.62 3,269.14 103,959.36 Qtr.IV 30,375.31 9,236.07 21,139.24 28,509.18 5,699.97 222,393.59 114,378.39 99,396.97 8,618.23 82,403.13
2013/14 Qtr.I 31,747.72 9,699.16 22,048.56 22,706.08 4,089.11 228,006.18 112,906.99 106,635.50 8,463.70 75,318.88 Qtr.II 29,413.17 9,778.39 19,634.78 20,170.98 3,464.05 253,312.63 127,152.46 117,797.59 8,362.58 68,754.51 Qtr.III 34,921.78 11,397.19 23,524.59 21,162.46 1,753.80 272,894.01 138,291.24 126,344.08 8,258.68 66,924.58 Qtr.IV 35,672.30 11,179.02 24,493.28 27,253.50 1,629.68 288,212.71 141,975.83 136,904.30 9,332.58 70,099.87
2014/15 Qtr.I 38,690.72 12,931.48 25,759.24 19,597.01 1,227.50 297,817.51 144,435.07 144,679.15 8,703.29 69,897.16 Qtr.II 35,148.79 12,580.20 22,568.59 18,800.84 1,246.35 329,512.50 162,570.66 159,004.32 7,937.52 68,417.37 Qtr.III 35,280.66 13,872.76 21,407.90 15,862.13 1,252.35 355,615.38 179,552.27 173,479.03 2,584.09 78,370.49 Qtr.IV 42,342.37 14,779.78 27,562.60 15,924.15 1,256.02 379,393.58 185,501.92 191,246.21 2,645.44 79,584.26
2015/16 Qtr.I 39,809.59 15,337.93 24,471.66 15,463.04 905.43 390,966.45 188,671.02 199,896.80 2,398.62 79,531.91 Qtr.II 37,943.40 14,322.94 23,620.46 18,368.24 905.43 421,417.51 206,946.76 212,968.82 1,501.93 87,671.16 Qtr.III 40,401.93 14,635.18 25,766.75 21,316.42 905.43 445,653.52 219,399.61 225,001.87 1,252.04 92,444.68 Qtr.IV 50,905.91 15,906.53 34,999.38 20,898.27 785.65 461,664.43 226,849.25 231,953.28 2,861.91 98,731.37
2016/17 Qtr.I 53,728.78 17,326.81 36,401.97 21,116.01 554.28 475,564.62 231,569.06 240,872.08 3,123.48 106,597.14 Qtr.II 54,499.76 16,544.49 37,955.27 20,370.84 554.28 509,890.48 253,196.53 252,915.43 3,778.52 101,539.01 Qtr.III 64,854.52 17,034.56 47,819.97 20,975.60 530.28 544,327.92 272,606.06 267,906.04 3,815.82 109,207.67 Qtr.IV 75,305.69 20,327.77 54,977.93 24,876.54 21,982.71 582,426.70 283,911.51 294,089.24 4,425.95 111,779.13
2017/18 Qtr.I 81,683.92 21,035.73 60,648.19 25,253.39 22,208.82 594,599.99 288,878.52 300,579.22 5,142.26 110,830.25 Qtr.II 68,091.41 19,152.65 48,938.76 26,326.86 22,186.62 635,646.86 308,050.08 322,392.50 5,204.29 120,419.44 Qtr.III 74,352.05 21,843.87 52,508.19 24,664.20 22,186.62 673,008.41 327,935.85 338,881.74 6,190.82 129,191.54 Qtr.IV 89,611.48 26,493.67 63,117.81 25,121.57 22,186.62 714,685.11 346,314.30 359,418.93 8,951.88 137,783.39
2018/19 Qtr.I 91,062.85 27,496.50 63,566.35 30,835.45 22,567.12 731,013.59 355,971.41 364,102.91 10,939.27 151,722.28 Qtr.II 85,123.08 28,156.45 56,966.63 28,357.05 22,521.73 779,265.80 392,263.57 378,472.13 8,530.10 165,243.37 Qtr.III 82,819.61 28,223.23 54,596.39 26,880.84 22,952.93 843,659.70 418,777.00 417,474.71 7,408.00 168,443.19 Qtr.IV 118,506.49 29,783.05 88,723.44 28,543.82 23,620.21 898,733.08 443,362.21 447,380.43 7,990.45 170,578.44
2019/20 Qtr.I 116,740.09 32,453.58 84,286.52 25,980.84 22,927.78 928,496.12 463,151.74 456,261.93 9,082.46 211,425.69 Qtr.II 117,120.70 29,406.33 87,714.37 23,973.08 23,123.42 977,370.59 512,299.58 456,233.83 8,837.18 232,194.69 Qtr.III 114,998.82 29,771.00 85,227.82 24,606.29 22,927.78 1,025,047.29 528,438.89 487,766.96 8,841.44 257,616.79 Qtr.IV 136,738.41 31,449.32 105,289.09 35,116.52 28,838.49 1,074,869.20 571,811.98 490,492.71 12,564.51 219,185.38
2020/21 Qtr.I 184,698.60 59,737.43 124,961.18 33,204.14 36,506.06 1,126,390.63 611,983.47 500,592.74 13,814.42 233,131.04 Qtr.II 146,676.51 30,538.49 116,138.02 43,367.05 32,698.32 1,203,355.10 660,534.64 526,006.13 16,814.34 259,022.95 Qtr.III 136453.386 31966.433 104486.953 55078.762 40993.814 1254219.055 704083.351 530694.8 19440.904 286075.072
Qtr.IV 131,471.76 30,087.76 101,384.00 76,945.12 76,773.86 1,312,731.74 758,869.37 532,913.44 20,948.94 285,977.43

94 | Fourth Quarter 2020/21
National Bank of Ethiopia Quarterly Bulletin
Table 2(b): Statement of Condition of Commercial Banks: Liabilities
(In Millions of Birr)
End of Period
Total (Liab.= Assets)
1
Non-Central Gov’t Deposits Gov’t Depos.
6
Foreign Liab.
7
Capital Account Other Liab.
12Total
(3+4+5) 2
Demand 3
Time 4
Saving 5
Total (9+10+11)
8Capital 9
Legal Reserve
10
Others 11
2008/09Qtr.I 108,674.58 56,010.62 21,545.78 3,001.17 31,463.68 8,410.60 2,315.51 9,645.17 6,733.48 1,230.03 1,681.66 32,292.69 Qtr.II 121,011.72 59,279.79 23,758.17 2,977.84 32,543.78 10,336.00 2,854.59 10,537.09 7,140.83 1,251.78 2,144.49 38,004.24 Qtr.III 124,181.95 62,157.88 24,447.53 3,051.31 34,659.04 11,766.01 2,801.54 11,577.30 7,188.23 1,251.88 3,137.19 35,879.23 Qtr.IV 145,083.89 64,134.18 23,737.09 3,248.37 37,148.72 10,450.06 3,076.51 10,286.27 7,289.87 1,817.11 1,179.29 57,136.87
2009/10Qtr.I 143,172.15 69,799.47 26,482.89 3,502.06 39,814.53 10,193.02 3,856.62 11,615.74 7,351.48 1,864.96 2,399.30 47,707.30 Qtr.II 153,698.31 70,853.05 25,540.12 3,498.80 41,814.13 12,446.66 3,690.78 12,382.87 7,779.28 1,999.39 2,604.20 54,324.95 Qtr.III 165,187.35 76,068.96 28,137.85 3,568.66 44,362.45 14,542.87 3,960.93 13,733.68 7,988.50 1,999.39 3,745.79 56,880.92 Qtr.IV 157,925.83 81,081.39 29,083.62 3,956.21 48,041.57 13,742.50 3,254.28 12,410.85 8,104.15 2,627.14 1,679.56 47,436.80
2010/11Qtr.I 166,996.99 85,850.72 30,488.06 3,901.29 51,461.37 13,830.65 4,246.06 16,074.71 8,251.77 2,800.15 5,022.79 46,994.83 Qtr.II 181,873.22 90,753.82 33,017.73 3,860.06 53,876.03 17,847.47 4,942.59 15,372.02 8,814.85 2,875.59 3,681.59 52,957.32 Qtr.III 210,324.55 101,160.55 36,557.44 4,462.70 60,140.41 22,023.33 5,595.24 17,203.71 8,993.68 2,875.59 5,334.44 64,341.73 Qtr.IV 225,905.26 114,155.42 44,949.45 4,666.41 64,539.56 20,240.72 5,715.48 15,598.31 9,352.31 3,720.04 2,525.97 70,195.32
2011/12Qtr.I 231,095.73 119,908.86 47,241.19 4,679.92 67,987.76 20,211.73 6,441.17 18,039.70 9,463.93 3,873.96 4,701.81 66,494.27 Qtr.II 255,231.76 120,849.46 44,105.79 5,165.29 71,578.38 27,669.07 8,419.69 20,118.90 10,273.75 4,082.96 5,762.20 78,174.64 Qtr.III 276,293.75 135,663.57 49,133.42 10,136.38 76,393.77 30,994.76 7,392.24 23,505.51 10,588.88 4,082.96 8,833.67 78,737.68 Qtr.IV 333,219.25 152,894.71 58,345.81 12,061.06 82,487.84 28,207.85 5,484.21 26,333.75 10,766.19 4,341.88 11,225.68 120,298.72
2012/13Qtr.I 312,287.41 154,727.02 55,112.80 12,112.46 87,501.75 29,560.96 5,873.98 22,096.52 10,848.48 5,848.45 5,399.59 100,028.94 Qtr.II 328,113.27 163,882.22 57,818.51 12,930.05 93,133.66 35,693.26 6,078.30 23,819.49 11,410.19 6,095.88 6,313.43 98,639.99 Qtr.III 374,030.25 181,078.62 66,836.46 13,515.66 100,726.49 34,173.15 6,038.08 26,732.87 11,848.34 6,095.79 8,788.74 126,007.54 Qtr.IV 369,381.17 189,762.82 69,253.31 14,278.69 106,230.82 39,111.79 7,515.18 23,668.93 16,207.65 3,737.13 3,724.15 109,322.44
2013/14Qtr.I 361,867.96 196,546.98 67,873.86 15,611.58 113,061.54 30,347.65 7,787.68 27,244.86 16,648.31 4,289.25 6,307.29 99,940.79 Qtr.II 375,115.34 208,389.34 69,703.14 15,928.74 122,757.46 35,196.57 7,933.50 29,890.38 18,021.29 4,432.14 7,436.95 93,705.55 Qtr.III 397,656.63 223,632.13 71,185.39 17,192.59 135,254.15 41,483.14 7,843.13 34,089.20 19,040.22 4,452.88 10,596.10 90,609.01 Qtr.IV 422,868.05 244,630.10 80,947.33 17,872.27 145,810.51 39,210.84 7,995.09 28,116.57 19,412.60 4,874.11 3,829.87 102,915.44
2014/15Qtr.I 427,229.91 253,720.44 79,404.57 18,878.38 155,437.49 34,524.85 7,599.61 33,579.69 19,576.17 6,809.31 7,194.22 97,805.31 Qtr.II 453,125.86 267,761.37 82,145.60 21,324.70 164,291.07 41,958.38 7,784.85 35,980.61 20,786.66 7,102.85 8,091.10 99,640.66 Qtr.III 486,381.01 288,748.61 87,992.92 37,731.13 163,024.57 39,876.94 7,985.81 41,100.74 21,089.10 7,150.07 12,861.57 108,668.91 Qtr.IV 518,500.38 310,905.47 94,282.90 41,990.59 174,631.98 47,597.57 8,326.57 46,345.99 21,607.18 7,657.37 17,081.44 105,324.78
2015/16Qtr.I 526,676.42 321,277.08 94,511.03 44,846.83 181,919.21 44,750.57 8,351.74 40,988.33 21,854.91 10,061.03 9,072.39 111,308.70 Qtr.II 566,305.74 333,108.04 95,784.87 45,039.02 192,284.15 54,814.93 9,418.30 44,605.48 22,365.60 10,260.55 11,979.33 124,358.98 Qtr.III 600,721.98 346,500.77 97,666.68 47,318.84 201,515.25 55,903.51 10,021.13 50,099.86 23,925.73 10,503.55 15,670.58 138,196.72 Qtr.IV 632,985.63 378,580.10 111,923.51 49,622.31 217,034.28 48,275.36 9,880.50 54,282.67 24,741.97 11,066.22 18,474.49 141,967.00
2016/17 Qtr.I 657,560.82 395,283.96 114,563.30 52,113.56 228,607.10 48,122.05 10,224.60 48,306.09 25,430.72 13,555.78 9,319.59 155,624.12 Qtr.II 686,854.36 422,592.69 122,551.62 56,019.12 244,021.95 59,973.04 9,442.47 53,837.72 25,907.50 14,058.71 13,871.51 141,008.44 Qtr.III 739,896.00 459,035.83 134,885.28 59,330.90 264,819.66 59,514.06 9,775.10 58,827.88 28,022.68 14,160.64 16,644.56 152,743.14 Qtr.IV 816,370.77 499,497.48 142,883.04 63,182.74 293,431.70 57,431.90 10,818.77 91,591.79 60,893.89 9,875.33 20,822.57 157,030.82
2017/18 Qtr.I 834,576.37 528,377.97 155,587.95 65,890.63 306,899.39 57,282.65 11,920.65 82,506.03 61,439.56 11,571.16 9,495.31 154,489.07 Qtr.II 872,671.18 557,368.92 161,094.75 71,726.79 324,547.38 65,662.50 15,190.78 82,934.75 62,190.72 12,080.49 8,663.54 151,514.23 Qtr.III 923,402.82 605,324.66 178,222.22 74,478.38 352,624.07 66,838.21 14,436.48 88,987.79 63,762.86 12,299.12 12,925.81 147,815.69 Qtr.IV 989,388.16 654,155.59 194,737.37 76,868.79 382,549.43 60,390.64 14,504.75 95,507.04 66,196.61 12,595.70 16,714.73 164,830.14
2018/19 Qtr.I 1,027,201.29 668,751.40 182,882.17 78,698.46 407,170.77 66,445.07 14,163.89 94,700.64 67,062.59 14,917.55 12,720.51 183,140.28 Qtr.II 1,080,511.02 696,969.21 185,405.32 81,465.14 430,098.75 78,865.30 15,913.29 103,262.58 69,816.60 16,293.97 17,152.00 185,500.64 Qtr.III 1,144,756.26 734,934.84 186,067.65 86,071.53 462,795.66 84,437.25 17,251.34 114,740.74 71,712.80 17,604.93 25,423.00 193,392.10 Qtr.IV 1,239,982.05 794,735.58 216,920.17 90,513.29 487,302.12 85,992.40 18,006.38 123,412.65 73,711.99 17,916.21 31,784.45 217,835.04
2019/20 Qtr.I 1,305,570.51 818,414.16 225,668.94 90,546.90 502,198.32 79,401.21 18,605.21 120,129.32 74,852.82 21,407.51 23,869.00 269,020.62 Qtr.II 1,373,782.48 851,887.36 233,018.82 89,720.91 529,147.63 85,267.44 21,056.84 123,826.12 77,283.99 23,471.46 23,070.67 291,744.72 Qtr.III 1,445,196.96 877,428.13 246,556.75 80,765.27 550,106.12 87,691.14 23,358.51 136,459.58 80,471.39 23,493.66 32,494.53 320,259.61 Qtr.IV 1,494,747.98 928,574.53 251,513.71 87,886.77 589,174.06 87,466.56 24,579.24 134,232.91 82,108.81 23,579.76 28,544.34 319,894.74
2020/21 Qtr.I 1,613,930.46 1,020,322.63 269,917.20 91,583.91 658,821.52 97,699.75 27,650.16 132,885.23 83,326.31 26,401.11 23,157.80 335,372.71 Qtr.II 1,685,119.93 1,069,388.57 282,154.65 89,154.94 698,078.98 109,414.14 30,184.61 133,129.90 86,224.23 27,173.26 19,732.41 343,002.71 Qtr.III 1,772,820.09 1,132,091.96 291,829.38 91,673.01 748,589.57 98,776.82 32,715.75 145,544.84 90,327.76 27,272.10 27,944.97 363,690.72 Qtr.IV 1,883,899.91 1,214,644.86 303,770.68 94,493.84 816,380.34 107,523.89 33,851.44 163,931.60 94,830.26 27,285.92 41,815.42 363,948.11

Fourth Quarter 2020/21 | 95
National Bank of Ethiopia Quarterly Bulletin
Table 2(b): Statement of Condition of Commercial Banks: Liabilities
(In Millions of Birr)
End of Period
Total (Liab.= Assets)
1
Non-Central Gov’t Deposits Gov’t Depos.
6
Foreign Liab.
7
Capital Account Other Liab.
12Total
(3+4+5) 2
Demand 3
Time 4
Saving 5
Total (9+10+11)
8Capital 9
Legal Reserve
10
Others 11
2008/09Qtr.I 108,674.58 56,010.62 21,545.78 3,001.17 31,463.68 8,410.60 2,315.51 9,645.17 6,733.48 1,230.03 1,681.66 32,292.69 Qtr.II 121,011.72 59,279.79 23,758.17 2,977.84 32,543.78 10,336.00 2,854.59 10,537.09 7,140.83 1,251.78 2,144.49 38,004.24 Qtr.III 124,181.95 62,157.88 24,447.53 3,051.31 34,659.04 11,766.01 2,801.54 11,577.30 7,188.23 1,251.88 3,137.19 35,879.23 Qtr.IV 145,083.89 64,134.18 23,737.09 3,248.37 37,148.72 10,450.06 3,076.51 10,286.27 7,289.87 1,817.11 1,179.29 57,136.87
2009/10Qtr.I 143,172.15 69,799.47 26,482.89 3,502.06 39,814.53 10,193.02 3,856.62 11,615.74 7,351.48 1,864.96 2,399.30 47,707.30 Qtr.II 153,698.31 70,853.05 25,540.12 3,498.80 41,814.13 12,446.66 3,690.78 12,382.87 7,779.28 1,999.39 2,604.20 54,324.95 Qtr.III 165,187.35 76,068.96 28,137.85 3,568.66 44,362.45 14,542.87 3,960.93 13,733.68 7,988.50 1,999.39 3,745.79 56,880.92 Qtr.IV 157,925.83 81,081.39 29,083.62 3,956.21 48,041.57 13,742.50 3,254.28 12,410.85 8,104.15 2,627.14 1,679.56 47,436.80
2010/11Qtr.I 166,996.99 85,850.72 30,488.06 3,901.29 51,461.37 13,830.65 4,246.06 16,074.71 8,251.77 2,800.15 5,022.79 46,994.83 Qtr.II 181,873.22 90,753.82 33,017.73 3,860.06 53,876.03 17,847.47 4,942.59 15,372.02 8,814.85 2,875.59 3,681.59 52,957.32 Qtr.III 210,324.55 101,160.55 36,557.44 4,462.70 60,140.41 22,023.33 5,595.24 17,203.71 8,993.68 2,875.59 5,334.44 64,341.73 Qtr.IV 225,905.26 114,155.42 44,949.45 4,666.41 64,539.56 20,240.72 5,715.48 15,598.31 9,352.31 3,720.04 2,525.97 70,195.32
2011/12Qtr.I 231,095.73 119,908.86 47,241.19 4,679.92 67,987.76 20,211.73 6,441.17 18,039.70 9,463.93 3,873.96 4,701.81 66,494.27 Qtr.II 255,231.76 120,849.46 44,105.79 5,165.29 71,578.38 27,669.07 8,419.69 20,118.90 10,273.75 4,082.96 5,762.20 78,174.64 Qtr.III 276,293.75 135,663.57 49,133.42 10,136.38 76,393.77 30,994.76 7,392.24 23,505.51 10,588.88 4,082.96 8,833.67 78,737.68 Qtr.IV 333,219.25 152,894.71 58,345.81 12,061.06 82,487.84 28,207.85 5,484.21 26,333.75 10,766.19 4,341.88 11,225.68 120,298.72
2012/13Qtr.I 312,287.41 154,727.02 55,112.80 12,112.46 87,501.75 29,560.96 5,873.98 22,096.52 10,848.48 5,848.45 5,399.59 100,028.94 Qtr.II 328,113.27 163,882.22 57,818.51 12,930.05 93,133.66 35,693.26 6,078.30 23,819.49 11,410.19 6,095.88 6,313.43 98,639.99 Qtr.III 374,030.25 181,078.62 66,836.46 13,515.66 100,726.49 34,173.15 6,038.08 26,732.87 11,848.34 6,095.79 8,788.74 126,007.54 Qtr.IV 369,381.17 189,762.82 69,253.31 14,278.69 106,230.82 39,111.79 7,515.18 23,668.93 16,207.65 3,737.13 3,724.15 109,322.44
2013/14Qtr.I 361,867.96 196,546.98 67,873.86 15,611.58 113,061.54 30,347.65 7,787.68 27,244.86 16,648.31 4,289.25 6,307.29 99,940.79 Qtr.II 375,115.34 208,389.34 69,703.14 15,928.74 122,757.46 35,196.57 7,933.50 29,890.38 18,021.29 4,432.14 7,436.95 93,705.55 Qtr.III 397,656.63 223,632.13 71,185.39 17,192.59 135,254.15 41,483.14 7,843.13 34,089.20 19,040.22 4,452.88 10,596.10 90,609.01 Qtr.IV 422,868.05 244,630.10 80,947.33 17,872.27 145,810.51 39,210.84 7,995.09 28,116.57 19,412.60 4,874.11 3,829.87 102,915.44
2014/15Qtr.I 427,229.91 253,720.44 79,404.57 18,878.38 155,437.49 34,524.85 7,599.61 33,579.69 19,576.17 6,809.31 7,194.22 97,805.31 Qtr.II 453,125.86 267,761.37 82,145.60 21,324.70 164,291.07 41,958.38 7,784.85 35,980.61 20,786.66 7,102.85 8,091.10 99,640.66 Qtr.III 486,381.01 288,748.61 87,992.92 37,731.13 163,024.57 39,876.94 7,985.81 41,100.74 21,089.10 7,150.07 12,861.57 108,668.91 Qtr.IV 518,500.38 310,905.47 94,282.90 41,990.59 174,631.98 47,597.57 8,326.57 46,345.99 21,607.18 7,657.37 17,081.44 105,324.78
2015/16Qtr.I 526,676.42 321,277.08 94,511.03 44,846.83 181,919.21 44,750.57 8,351.74 40,988.33 21,854.91 10,061.03 9,072.39 111,308.70 Qtr.II 566,305.74 333,108.04 95,784.87 45,039.02 192,284.15 54,814.93 9,418.30 44,605.48 22,365.60 10,260.55 11,979.33 124,358.98 Qtr.III 600,721.98 346,500.77 97,666.68 47,318.84 201,515.25 55,903.51 10,021.13 50,099.86 23,925.73 10,503.55 15,670.58 138,196.72 Qtr.IV 632,985.63 378,580.10 111,923.51 49,622.31 217,034.28 48,275.36 9,880.50 54,282.67 24,741.97 11,066.22 18,474.49 141,967.00
2016/17 Qtr.I 657,560.82 395,283.96 114,563.30 52,113.56 228,607.10 48,122.05 10,224.60 48,306.09 25,430.72 13,555.78 9,319.59 155,624.12 Qtr.II 686,854.36 422,592.69 122,551.62 56,019.12 244,021.95 59,973.04 9,442.47 53,837.72 25,907.50 14,058.71 13,871.51 141,008.44 Qtr.III 739,896.00 459,035.83 134,885.28 59,330.90 264,819.66 59,514.06 9,775.10 58,827.88 28,022.68 14,160.64 16,644.56 152,743.14 Qtr.IV 816,370.77 499,497.48 142,883.04 63,182.74 293,431.70 57,431.90 10,818.77 91,591.79 60,893.89 9,875.33 20,822.57 157,030.82
2017/18 Qtr.I 834,576.37 528,377.97 155,587.95 65,890.63 306,899.39 57,282.65 11,920.65 82,506.03 61,439.56 11,571.16 9,495.31 154,489.07 Qtr.II 872,671.18 557,368.92 161,094.75 71,726.79 324,547.38 65,662.50 15,190.78 82,934.75 62,190.72 12,080.49 8,663.54 151,514.23 Qtr.III 923,402.82 605,324.66 178,222.22 74,478.38 352,624.07 66,838.21 14,436.48 88,987.79 63,762.86 12,299.12 12,925.81 147,815.69 Qtr.IV 989,388.16 654,155.59 194,737.37 76,868.79 382,549.43 60,390.64 14,504.75 95,507.04 66,196.61 12,595.70 16,714.73 164,830.14
2018/19 Qtr.I 1,027,201.29 668,751.40 182,882.17 78,698.46 407,170.77 66,445.07 14,163.89 94,700.64 67,062.59 14,917.55 12,720.51 183,140.28 Qtr.II 1,080,511.02 696,969.21 185,405.32 81,465.14 430,098.75 78,865.30 15,913.29 103,262.58 69,816.60 16,293.97 17,152.00 185,500.64 Qtr.III 1,144,756.26 734,934.84 186,067.65 86,071.53 462,795.66 84,437.25 17,251.34 114,740.74 71,712.80 17,604.93 25,423.00 193,392.10 Qtr.IV 1,239,982.05 794,735.58 216,920.17 90,513.29 487,302.12 85,992.40 18,006.38 123,412.65 73,711.99 17,916.21 31,784.45 217,835.04
2019/20 Qtr.I 1,305,570.51 818,414.16 225,668.94 90,546.90 502,198.32 79,401.21 18,605.21 120,129.32 74,852.82 21,407.51 23,869.00 269,020.62 Qtr.II 1,373,782.48 851,887.36 233,018.82 89,720.91 529,147.63 85,267.44 21,056.84 123,826.12 77,283.99 23,471.46 23,070.67 291,744.72 Qtr.III 1,445,196.96 877,428.13 246,556.75 80,765.27 550,106.12 87,691.14 23,358.51 136,459.58 80,471.39 23,493.66 32,494.53 320,259.61 Qtr.IV 1,494,747.98 928,574.53 251,513.71 87,886.77 589,174.06 87,466.56 24,579.24 134,232.91 82,108.81 23,579.76 28,544.34 319,894.74
2020/21 Qtr.I 1,613,930.46 1,020,322.63 269,917.20 91,583.91 658,821.52 97,699.75 27,650.16 132,885.23 83,326.31 26,401.11 23,157.80 335,372.71 Qtr.II 1,685,119.93 1,069,388.57 282,154.65 89,154.94 698,078.98 109,414.14 30,184.61 133,129.90 86,224.23 27,173.26 19,732.41 343,002.71 Qtr.III 1,772,820.09 1,132,091.96 291,829.38 91,673.01 748,589.57 98,776.82 32,715.75 145,544.84 90,327.76 27,272.10 27,944.97 363,690.72 Qtr.IV 1,883,899.91 1,214,644.86 303,770.68 94,493.84 816,380.34 107,523.89 33,851.44 163,931.60 94,830.26 27,285.92 41,815.42 363,948.11
Table 3(a): Consolidated Statement of Condition of Development Bank of Ethipia: Assets
(In Millions of Birr)
End of Period
Cash & Banks
Foreign Assets
Claims on Central
Gov’t
Claims on Non-Central Gov’tOther Assets
Total Assets
Total Public Enterprise
Cooper- atives
Private &
Individuals2008/09
Qtr.I 639.13 226.80 253.93 5,579.55 527.45 178.53 4,873.57 688.57 7,387.97 Qtr.II 320.37 243.70 237.52 5,976.99 535.00 215.62 5,226.37 864.87 7,643.45 Qtr.III 174.66 248.80 219.42 6,246.95 539.70 222.66 5,484.59 834.94 7,724.78 Qtr.IV 137.89 374.59 219.42 6,435.92 546.22 193.14 5,696.57 743.24 7,911.07 2009/10
Qtr.I 205.29 549.70 219.42 7,135.13 597.47 164.88 6,372.78 720.57 8,830.11 Qtr.II 303.62 595.20 218.83 7,671.64 582.63 246.00 6,843.01 1,103.73 9,893.01 Qtr.III 219.98 1,513.01 203.02 8,068.25 609.20 235.01 7,224.04 1,147.57 11,151.83 Qtr.IV 422.78 1,023.91 184.92 8,787.24 699.57 202.47 7,885.20 919.24 11,338.08 2010/11
Qtr.I 505.43 1,058.79 184.92 8,952.77 703.88 143.97 8,104.93 1,140.16 11,842.07 Qtr.II 200.52 1,031.98 184.92 9,516.13 711.06 226.46 8,578.61 736.37 11,669.91 Qtr.III 810.38 1,175.29 176.42 10,355.88 928.65 202.34 9,224.88 995.52 13,513.49 Qtr.IV 810.38 1,175.29 176.42 10,355.88 928.65 202.34 9,224.88 995.52 13,513.49 2011/12
Qtr.I 810.38 1,175.29 176.42 10,355.88 928.65 202.34 9,224.88 995.52 13,513.49 Qtr.II 810.38 1,175.29 176.42 10,355.88 928.65 202.34 9,224.88 995.52 13,513.49 Qtr.III 810.38 1,175.29 176.42 10,355.88 928.65 202.34 9,224.88 995.52 13,513.49 Qtr.IV 810.38 1,175.29 176.42 10,355.88 928.65 202.34 9,224.88 995.52 13,513.49
2012/13 Qtr.I 710.96 1,122.00 7,866.42 15,323.90 1,385.16 102.91 13,835.83 1,867.93 26,891.21 Qtr.II 400.61 794.52 7,832.51 16,707.86 1,770.72 147.06 14,790.08 1,341.19 27,076.70 Qtr.III 281.13 190.20 8,814.41 17,657.91 1,910.88 196.39 15,550.65 856.25 27,799.89 Qtr.IV 379.77 457.00 9,819.44 17,928.90 1,660.21 87.79 16,180.91 1,374.79 29,959.90
2013/14 Qtr.I 1,948.03 350.90 8,425.93 18,556.52 1,791.63 78.99 16,685.89 1,723.32 31,004.70 Qtr.II 380.83 1,575.49 9,664.19 20,103.24 1,880.18 152.18 18,070.87 1,905.11 33,628.87 Qtr.III 535.83 1,888.62 9,807.16 18,542.19 1,930.05 108.33 16,503.81 2,545.42 33,319.20 Qtr.IV 1,156.66 1,890.59 11,337.60 21,443.02 2,003.46 63.56 19,376.00 1,971.93 37,799.81
2014/15Qtr.I 1,175.45 1,511.30 13,148.05 20,197.59 1,996.89 54.11 18,146.59 2,550.90 38,583.28 Qtr.II 544.45 1,744.17 13,141.88 21,381.44 2,019.13 184.95 19,177.37 2,648.93 39,460.87 Qtr.III 1,143.62 1,803.01 13,112.08 22,224.86 2,002.19 165.61 20,057.07 2,719.16 41,002.74 Qtr.IV 1,173.92 1,635.37 13,289.06 25,677.84 2,675.48 130.93 22,871.43 2,343.58 44,119.75
2015/16 Qtr.I 1,175.45 1,511.30 13,148.05 20,197.59 1,996.89 54.11 18,146.59 2,550.90 38,583.28 Qtr.II 544.45 1,744.17 13,141.88 21,381.44 2,019.13 184.95 19,177.37 2,648.93 39,460.87 Qtr.III 1,143.62 1,803.01 13,112.08 22,224.86 2,002.19 165.61 20,057.07 2,719.16 41,002.74 Qtr.IV 1,173.92 1,635.37 13,289.06 25,677.84 2,675.48 130.93 22,871.43 2,343.58 44,119.75
2016/17 Qtr.I 2,434.51 2,430.84 15,836.85 29,770.27 2,838.72 104.12 26,827.43 3,846.72 54,319.19 Qtr.II 1,585.15 2,065.49 15,836.85 30,986.45 3,007.68 106.31 27,872.46 3,940.08 54,414.01 Qtr.III 1,462.81 2,849.59 15,816.87 31,734.09 2,765.88 107.49 28,860.71 4,032.03 55,895.39 Qtr.IV 1,232.72 3,225.53 15,816.87 31,590.85 2,632.74 108.69 28,849.42 5,223.28 57,089.25
2017/18 Qtr.I 824.85 2,902.01 15,816.87 32,396.06 2,605.80 127.06 29,663.20 5,273.55 57,213.34 Qtr.II 888.91 3,223.37 15,816.87 35,413.14 3,992.24 116.26 31,304.64 4,229.09 59,571.38 Qtr.III 1,049.8 4,813.1 15,796.9 37,322.9 4,081.2 108.8 33,132.8 6,278.0 65,260.8Qtr.IV 2,703.06 4,387.68 32,797.34 39,155.36 4,113.94 438.25 34,603.17 4,804.21 83,847.64
2018/19 Qtr.I 956.91 4,783.60 32,796.90 40,801.82 4,158.57 487.14 36,156.11 4,950.16 84,289.39 Qtr.II 4,779.94 4,389.26 32,794.45 45,856.04 4,341.33 542.46 40,972.25 5,907.38 93,727.06 Qtr.III 3,626.79 5,565.72 32,717.96 44,217.12 4,419.41 620.85 39,176.87 43,323.30 129,450.88 Qtr.IV 2,144.76 5,383.60 31,993.93 47,577.14 4,895.24 310.46 42,371.44 5,623.22 92,722.64
2019/20 Qtr.I 4,681.92 4,548.77 32,110.73 45,107.52 4,996.09 424.00 39,687.43 7,843.40 94,292.34 Qtr.II 8,243.21 2,471.15 26,627.38 47,326.26 5,148.78 532.67 41,644.81 10,844.09 95,512.09 Qtr.III 8,447.33 2,301.93 32,663.59 48,471.20 5,417.10 694.38 42,359.71 10,051.30 101,935.35 Qtr.IV 8,022.54 4,718.27 33,036.37 51,103.50 3,519.43 889.98 46,694.08 7,209.88 104,090.56
2020/21 Qtr.I 8,684.02 2,625.89 33,416.61 51,992.48 4,732.12 5,476.46 41,783.90 7,416.75 104,135.75 Qtr.II 6,225.58 5,639.41 32,913.18 53,384.20 5,038.49 5,560.51 42,785.20 8,170.46 106,332.83 Qtr.III 7733.372 4649.867 54303.833 54214.048 5247.078 4955.843 44011.127 16860.804 138029.484 Qtr.IV 8,319.83 4,661.02 53,927.17 55,431.44 5,487.58 5,012.91 44,930.95 17,624.66 139,723.58
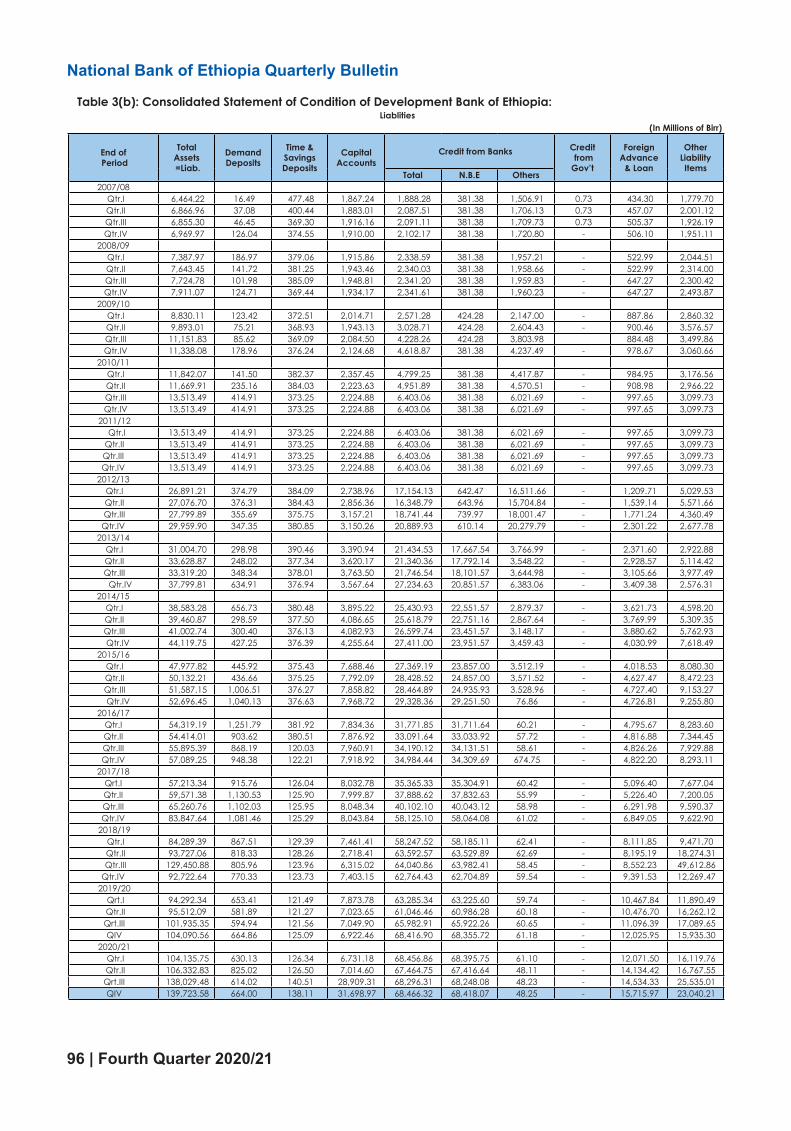
96 | Fourth Quarter 2020/21
National Bank of Ethiopia Quarterly Bulletin
Table 3(b): Consolidated Statement of Condition of Development Bank of Ethiopia: Liablities
(In Millions of Birr)
End of Period
Total Assets =Liab.
Demand Deposits
Time & Savings Deposits
Capital Accounts
Credit from Banks Credit from Gov’t
Foreign Advance
& Loan
Other Liability Items
Total N.B.E Others2007/08
Qtr.I 6,464.22 16.49 477.48 1,867.24 1,888.28 381.38 1,506.91 0.73 434.30 1,779.70 Qtr.II 6,866.96 37.08 400.44 1,883.01 2,087.51 381.38 1,706.13 0.73 457.07 2,001.12 Qtr.III 6,855.30 46.45 369.30 1,916.16 2,091.11 381.38 1,709.73 0.73 505.37 1,926.19 Qtr.IV 6,969.97 126.04 374.55 1,910.00 2,102.17 381.38 1,720.80 - 506.10 1,951.11 2008/09
Qtr.I 7,387.97 186.97 379.06 1,915.86 2,338.59 381.38 1,957.21 - 522.99 2,044.51 Qtr.II 7,643.45 141.72 381.25 1,943.46 2,340.03 381.38 1,958.66 - 522.99 2,314.00 Qtr.III 7,724.78 101.98 385.09 1,948.81 2,341.20 381.38 1,959.83 - 647.27 2,300.42 Qtr.IV 7,911.07 124.71 369.44 1,934.17 2,341.61 381.38 1,960.23 - 647.27 2,493.87 2009/10
Qtr.I 8,830.11 123.42 372.51 2,014.71 2,571.28 424.28 2,147.00 - 887.86 2,860.32 Qtr.II 9,893.01 75.21 368.93 1,943.13 3,028.71 424.28 2,604.43 - 900.46 3,576.57 Qtr.III 11,151.83 85.62 369.09 2,084.50 4,228.26 424.28 3,803.98 884.48 3,499.86 Qtr.IV 11,338.08 178.96 376.24 2,124.68 4,618.87 381.38 4,237.49 - 978.67 3,060.66 2010/11
Qtr.I 11,842.07 141.50 382.37 2,357.45 4,799.25 381.38 4,417.87 - 984.95 3,176.56 Qtr.II 11,669.91 235.16 384.03 2,223.63 4,951.89 381.38 4,570.51 - 908.98 2,966.22 Qtr.III 13,513.49 414.91 373.25 2,224.88 6,403.06 381.38 6,021.69 - 997.65 3,099.73 Qtr.IV 13,513.49 414.91 373.25 2,224.88 6,403.06 381.38 6,021.69 - 997.65 3,099.73
2011/12 Qtr.I 13,513.49 414.91 373.25 2,224.88 6,403.06 381.38 6,021.69 - 997.65 3,099.73 Qtr.II 13,513.49 414.91 373.25 2,224.88 6,403.06 381.38 6,021.69 - 997.65 3,099.73 Qtr.III 13,513.49 414.91 373.25 2,224.88 6,403.06 381.38 6,021.69 - 997.65 3,099.73 Qtr.IV 13,513.49 414.91 373.25 2,224.88 6,403.06 381.38 6,021.69 - 997.65 3,099.73
2012/13 Qtr.I 26,891.21 374.79 384.09 2,738.96 17,154.13 642.47 16,511.66 - 1,209.71 5,029.53 Qtr.II 27,076.70 376.31 384.43 2,856.36 16,348.79 643.96 15,704.84 - 1,539.14 5,571.66 Qtr.III 27,799.89 355.69 375.75 3,157.21 18,741.44 739.97 18,001.47 - 1,771.24 4,360.49 Qtr.IV 29,959.90 347.35 380.85 3,150.26 20,889.93 610.14 20,279.79 - 2,301.22 2,677.78
2013/14 Qtr.I 31,004.70 298.98 390.46 3,390.94 21,434.53 17,667.54 3,766.99 - 2,371.60 2,922.88 Qtr.II 33,628.87 248.02 377.34 3,620.17 21,340.36 17,792.14 3,548.22 - 2,928.57 5,114.42 Qtr.III 33,319.20 348.34 378.01 3,763.50 21,746.54 18,101.57 3,644.98 - 3,105.66 3,977.49
Qtr.IV 37,799.81 634.91 376.94 3,567.64 27,234.63 20,851.57 6,383.06 - 3,409.38 2,576.31 2014/15
Qtr.I 38,583.28 656.73 380.48 3,895.22 25,430.93 22,551.57 2,879.37 - 3,621.73 4,598.20 Qtr.II 39,460.87 298.59 377.50 4,086.65 25,618.79 22,751.16 2,867.64 - 3,769.99 5,309.35 Qtr.III 41,002.74 300.40 376.13 4,082.93 26,599.74 23,451.57 3,148.17 - 3,880.62 5,762.93
Qtr.IV 44,119.75 427.25 376.39 4,255.64 27,411.00 23,951.57 3,459.43 - 4,030.99 7,618.49 2015/16
Qtr.I 47,977.82 445.92 375.43 7,688.46 27,369.19 23,857.00 3,512.19 - 4,018.53 8,080.30 Qtr.II 50,132.21 436.66 375.25 7,792.09 28,428.52 24,857.00 3,571.52 - 4,627.47 8,472.23 Qtr.III 51,587.15 1,006.51 376.27 7,858.82 28,464.89 24,935.93 3,528.96 - 4,727.40 9,153.27
Qtr.IV 52,696.45 1,040.13 376.63 7,968.72 29,328.36 29,251.50 76.86 - 4,726.81 9,255.80 2016/17
Qtr.I 54,319.19 1,251.79 381.92 7,834.36 31,771.85 31,711.64 60.21 - 4,795.67 8,283.60 Qtr.II 54,414.01 903.62 380.51 7,876.92 33,091.64 33,033.92 57.72 - 4,816.88 7,344.45 Qtr.III 55,895.39 868.19 120.03 7,960.91 34,190.12 34,131.51 58.61 - 4,826.26 7,929.88 Qtr.IV 57,089.25 948.38 122.21 7,918.92 34,984.44 34,309.69 674.75 - 4,822.20 8,293.11
2017/18 Qrt.I 57,213.34 915.76 126.04 8,032.78 35,365.33 35,304.91 60.42 - 5,096.40 7,677.04 Qtr.II 59,571.38 1,130.53 125.90 7,999.87 37,888.62 37,832.63 55.99 - 5,226.40 7,200.05 Qtr.III 65,260.76 1,102.03 125.95 8,048.34 40,102.10 40,043.12 58.98 - 6,291.98 9,590.37 Qtr.IV 83,847.64 1,081.46 125.29 8,043.84 58,125.10 58,064.08 61.02 - 6,849.05 9,622.90
2018/19 Qtr.I 84,289.39 867.51 129.39 7,461.41 58,247.52 58,185.11 62.41 - 8,111.85 9,471.70 Qtr.II 93,727.06 818.33 128.26 2,718.41 63,592.57 63,529.89 62.69 - 8,195.19 18,274.31 Qtr.III 129,450.88 805.96 123.96 6,315.02 64,040.86 63,982.41 58.45 - 8,552.23 49,612.86 Qtr.IV 92,722.64 770.33 123.73 7,403.15 62,764.43 62,704.89 59.54 - 9,391.53 12,269.47
2019/20 Qrt.I 94,292.34 653.41 121.49 7,873.78 63,285.34 63,225.60 59.74 - 10,467.84 11,890.49 Qtr.II 95,512.09 581.89 121.27 7,023.65 61,046.46 60,986.28 60.18 - 10,476.70 16,262.12 Qrt.III 101,935.35 594.94 121.56 7,049.90 65,982.91 65,922.26 60.65 - 11,096.39 17,089.65 QIV 104,090.56 664.86 125.09 6,922.46 68,416.90 68,355.72 61.18 - 12,025.95 15,935.30
2020/21 - Qtr.I 104,135.75 630.13 126.34 6,731.18 68,456.86 68,395.75 61.10 - 12,071.50 16,119.76 Qtr.II 106,332.83 825.02 126.50 7,014.60 67,464.75 67,416.64 48.11 - 14,134.42 16,767.55 Qrt.III 138,029.48 614.02 140.51 28,909.31 68,296.31 68,248.08 48.23 - 14,534.33 25,535.01 QIV 139,723.58 664.00 138.11 31,698.97 68,466.32 68,418.07 48.25 - 15,715.97 23,040.21

Fourth Quarter 2020/21 | 97
National Bank of Ethiopia Quarterly Bulletin
Table 3(b): Consolidated Statement of Condition of Development Bank of Ethiopia: Liablities
(In Millions of Birr)
End of Period
Total Assets =Liab.
Demand Deposits
Time & Savings Deposits
Capital Accounts
Credit from Banks Credit from Gov’t
Foreign Advance
& Loan
Other Liability Items
Total N.B.E Others2007/08
Qtr.I 6,464.22 16.49 477.48 1,867.24 1,888.28 381.38 1,506.91 0.73 434.30 1,779.70 Qtr.II 6,866.96 37.08 400.44 1,883.01 2,087.51 381.38 1,706.13 0.73 457.07 2,001.12 Qtr.III 6,855.30 46.45 369.30 1,916.16 2,091.11 381.38 1,709.73 0.73 505.37 1,926.19 Qtr.IV 6,969.97 126.04 374.55 1,910.00 2,102.17 381.38 1,720.80 - 506.10 1,951.11 2008/09
Qtr.I 7,387.97 186.97 379.06 1,915.86 2,338.59 381.38 1,957.21 - 522.99 2,044.51 Qtr.II 7,643.45 141.72 381.25 1,943.46 2,340.03 381.38 1,958.66 - 522.99 2,314.00 Qtr.III 7,724.78 101.98 385.09 1,948.81 2,341.20 381.38 1,959.83 - 647.27 2,300.42 Qtr.IV 7,911.07 124.71 369.44 1,934.17 2,341.61 381.38 1,960.23 - 647.27 2,493.87 2009/10
Qtr.I 8,830.11 123.42 372.51 2,014.71 2,571.28 424.28 2,147.00 - 887.86 2,860.32 Qtr.II 9,893.01 75.21 368.93 1,943.13 3,028.71 424.28 2,604.43 - 900.46 3,576.57 Qtr.III 11,151.83 85.62 369.09 2,084.50 4,228.26 424.28 3,803.98 884.48 3,499.86 Qtr.IV 11,338.08 178.96 376.24 2,124.68 4,618.87 381.38 4,237.49 - 978.67 3,060.66 2010/11
Qtr.I 11,842.07 141.50 382.37 2,357.45 4,799.25 381.38 4,417.87 - 984.95 3,176.56 Qtr.II 11,669.91 235.16 384.03 2,223.63 4,951.89 381.38 4,570.51 - 908.98 2,966.22 Qtr.III 13,513.49 414.91 373.25 2,224.88 6,403.06 381.38 6,021.69 - 997.65 3,099.73 Qtr.IV 13,513.49 414.91 373.25 2,224.88 6,403.06 381.38 6,021.69 - 997.65 3,099.73
2011/12 Qtr.I 13,513.49 414.91 373.25 2,224.88 6,403.06 381.38 6,021.69 - 997.65 3,099.73 Qtr.II 13,513.49 414.91 373.25 2,224.88 6,403.06 381.38 6,021.69 - 997.65 3,099.73 Qtr.III 13,513.49 414.91 373.25 2,224.88 6,403.06 381.38 6,021.69 - 997.65 3,099.73 Qtr.IV 13,513.49 414.91 373.25 2,224.88 6,403.06 381.38 6,021.69 - 997.65 3,099.73
2012/13 Qtr.I 26,891.21 374.79 384.09 2,738.96 17,154.13 642.47 16,511.66 - 1,209.71 5,029.53 Qtr.II 27,076.70 376.31 384.43 2,856.36 16,348.79 643.96 15,704.84 - 1,539.14 5,571.66 Qtr.III 27,799.89 355.69 375.75 3,157.21 18,741.44 739.97 18,001.47 - 1,771.24 4,360.49 Qtr.IV 29,959.90 347.35 380.85 3,150.26 20,889.93 610.14 20,279.79 - 2,301.22 2,677.78
2013/14 Qtr.I 31,004.70 298.98 390.46 3,390.94 21,434.53 17,667.54 3,766.99 - 2,371.60 2,922.88 Qtr.II 33,628.87 248.02 377.34 3,620.17 21,340.36 17,792.14 3,548.22 - 2,928.57 5,114.42 Qtr.III 33,319.20 348.34 378.01 3,763.50 21,746.54 18,101.57 3,644.98 - 3,105.66 3,977.49
Qtr.IV 37,799.81 634.91 376.94 3,567.64 27,234.63 20,851.57 6,383.06 - 3,409.38 2,576.31 2014/15
Qtr.I 38,583.28 656.73 380.48 3,895.22 25,430.93 22,551.57 2,879.37 - 3,621.73 4,598.20 Qtr.II 39,460.87 298.59 377.50 4,086.65 25,618.79 22,751.16 2,867.64 - 3,769.99 5,309.35 Qtr.III 41,002.74 300.40 376.13 4,082.93 26,599.74 23,451.57 3,148.17 - 3,880.62 5,762.93
Qtr.IV 44,119.75 427.25 376.39 4,255.64 27,411.00 23,951.57 3,459.43 - 4,030.99 7,618.49 2015/16
Qtr.I 47,977.82 445.92 375.43 7,688.46 27,369.19 23,857.00 3,512.19 - 4,018.53 8,080.30 Qtr.II 50,132.21 436.66 375.25 7,792.09 28,428.52 24,857.00 3,571.52 - 4,627.47 8,472.23 Qtr.III 51,587.15 1,006.51 376.27 7,858.82 28,464.89 24,935.93 3,528.96 - 4,727.40 9,153.27
Qtr.IV 52,696.45 1,040.13 376.63 7,968.72 29,328.36 29,251.50 76.86 - 4,726.81 9,255.80 2016/17
Qtr.I 54,319.19 1,251.79 381.92 7,834.36 31,771.85 31,711.64 60.21 - 4,795.67 8,283.60 Qtr.II 54,414.01 903.62 380.51 7,876.92 33,091.64 33,033.92 57.72 - 4,816.88 7,344.45 Qtr.III 55,895.39 868.19 120.03 7,960.91 34,190.12 34,131.51 58.61 - 4,826.26 7,929.88 Qtr.IV 57,089.25 948.38 122.21 7,918.92 34,984.44 34,309.69 674.75 - 4,822.20 8,293.11
2017/18 Qrt.I 57,213.34 915.76 126.04 8,032.78 35,365.33 35,304.91 60.42 - 5,096.40 7,677.04 Qtr.II 59,571.38 1,130.53 125.90 7,999.87 37,888.62 37,832.63 55.99 - 5,226.40 7,200.05 Qtr.III 65,260.76 1,102.03 125.95 8,048.34 40,102.10 40,043.12 58.98 - 6,291.98 9,590.37 Qtr.IV 83,847.64 1,081.46 125.29 8,043.84 58,125.10 58,064.08 61.02 - 6,849.05 9,622.90
2018/19 Qtr.I 84,289.39 867.51 129.39 7,461.41 58,247.52 58,185.11 62.41 - 8,111.85 9,471.70 Qtr.II 93,727.06 818.33 128.26 2,718.41 63,592.57 63,529.89 62.69 - 8,195.19 18,274.31 Qtr.III 129,450.88 805.96 123.96 6,315.02 64,040.86 63,982.41 58.45 - 8,552.23 49,612.86 Qtr.IV 92,722.64 770.33 123.73 7,403.15 62,764.43 62,704.89 59.54 - 9,391.53 12,269.47
2019/20 Qrt.I 94,292.34 653.41 121.49 7,873.78 63,285.34 63,225.60 59.74 - 10,467.84 11,890.49 Qtr.II 95,512.09 581.89 121.27 7,023.65 61,046.46 60,986.28 60.18 - 10,476.70 16,262.12 Qrt.III 101,935.35 594.94 121.56 7,049.90 65,982.91 65,922.26 60.65 - 11,096.39 17,089.65 QIV 104,090.56 664.86 125.09 6,922.46 68,416.90 68,355.72 61.18 - 12,025.95 15,935.30
2020/21 - Qtr.I 104,135.75 630.13 126.34 6,731.18 68,456.86 68,395.75 61.10 - 12,071.50 16,119.76 Qtr.II 106,332.83 825.02 126.50 7,014.60 67,464.75 67,416.64 48.11 - 14,134.42 16,767.55 Qrt.III 138,029.48 614.02 140.51 28,909.31 68,296.31 68,248.08 48.23 - 14,534.33 25,535.01 QIV 139,723.58 664.00 138.11 31,698.97 68,466.32 68,418.07 48.25 - 15,715.97 23,040.21
Table 4: Money Supply and its Determinants(In Millions of Birr)
End of Period
Money and Quasi-Money Domestic Credit
Net Foreign Assets
Other Items Net 14
Currency Outside Banks
1
Net Demand Deposit
2
Money Supply (1+2)
3
Quasi- Money
4
Total Volume
(3+4) 5
Total Credit (7+10)
6
Net Claims on Gov’t
Claims on Non-Cen
Gov’t 10
Total (8+9)
7
Nat. Bank
8
Comm. Banks
9
Total (13+12)
11
Nat. Bank
12
Comm. Banks
13
2008/09
Qtr.I 16,337.59 20,633.90 36,971.49 34,464.85 71,436.34 84,088.59 34,872.36 37,048.01 (2,175.65) 49,216.23 10,387.77 4,976.66 5,411.11 23,040.02
Qtr.II 17,432.87 22,949.25 40,382.11 35,521.62 75,903.73 85,327.66 31,944.38 36,733.14 (4,788.76) 53,383.28 10,233.46 6,137.41 4,096.05 19,657.39
Qtr.III 19,264.00 23,589.18 42,853.18 37,710.34 80,563.52 85,281.56 29,349.06 35,566.17 (6,217.11) 55,932.51 14,863.60 9,571.56 5,292.04 19,581.64
Qtr.IV 19,715.01 22,397.64 42,112.66 40,397.09 82,509.75 89,203.04 32,786.50 37,827.20 (5,040.70) 56,416.54 17,976.81 11,833.66 6,143.15 24,670.10
2009/10
Qtr.I 18,547.21 25,572.45 44,119.66 43,316.58 87,436.24 92,006.88 32,500.40 36,953.31 (4,452.91) 59,506.48 19,528.96 14,212.62 5,316.34 24,099.60
Qtr.II 21,755.84 24,372.26 46,128.10 45,312.93 91,441.03 92,946.17 28,555.82 35,824.91 (7,269.09) 64,390.35 20,793.03 14,752.59 6,040.45 22,298.18
Qtr.III 23,068.09 26,271.82 49,339.91 47,931.11 97,271.03 98,671.91 30,038.16 38,953.17 (8,915.01) 68,633.76 25,278.62 16,290.43 8,988.19 26,679.50
Qtr.IV 24,206.80 27,727.99 51,934.78 51,997.77 103,932.56 104,350.11 33,013.08 39,340.32 (6,327.24) 71,337.03 27,189.78 15,383.31 11,806.47 27,607.34
2010/11
Qtr.I 23,849.92 29,249.39 53,099.31 55,362.66 108,461.97 104,929.59 31,368.11 39,718.05 (8,349.93) 73,561.48 38,003.21 23,003.30 14,999.91 34,470.83
Qrt II 28,312.32 31,751.83 60,064.16 57,736.08 117,800.24 110,513.95 27,374.22 41,118.83 (13,744.61) 83,139.73 40,230.88 24,979.34 15,251.53 32,944.59
Qtr.III 30,534.69 35,171.96 65,706.66 64,603.11 130,309.77 121,221.73 23,583.78 40,653.91 (17,070.13) 97,637.96 45,638.10 30,084.47 15,553.63 36,550.06
Qtr.IV 32,574.88 43,596.12 76,171.00 69,205.97 145,376.97 142,320.42 28,651.65 45,323.71 (16,672.05) 113,668.76 55,534.68 32,856.00 22,678.68 52,478.12
2011/12
Qtr.I 32,073.62 46,068.57 78,142.18 72,667.68 150,809.86 143,503.46 20,343.12 36,433.18 (16,090.06) 123,160.34 55,479.84 39,355.70 16,124.13 48,173.44
Qtr.II 36,274.61 42,879.96 79,154.57 76,743.67 155,898.24 157,410.18 13,443.60 38,255.43 (24,811.83) 143,966.58 49,345.56 34,675.66 14,669.91 50,857.50
Qtr.III 37,727.68 47,246.43 84,974.11 86,530.15 171,504.25 182,607.91 15,673.90 43,600.37 (27,926.47) 166,934.01 45,771.85 24,524.05 21,247.79 56,875.50
Qtr.IV 38,537.14 56,312.74 94,849.88 94,548.90 189,398.78 202,148.96 21,557.41 45,344.08 (23,786.67) 180,591.55 39,787.69 21,254.33 18,533.36 52,537.88
2012/13
Qtr.I 37,917.53 54,544.75 92,462.28 99,614.21 192,076.50 198,914.63 16,480.84 37,529.91 (21,049.06) 182,433.79 39,304.60 24,995.84 14,308.76 46,142.73
Qtr.II 42,677.02 57,524.67 100,201.69 106,063.71 206,265.39 213,175.22 13,732.02 42,732.25 (29,000.24) 199,443.21 39,754.55 26,357.64 13,396.92 46,664.38
Qtr.III 45,142.40 66,203.30 111,345.70 114,242.15 225,587.85 233,163.88 12,792.18 41,557.83 (28,765.66) 220,371.71 46,981.49 29,607.54 17,373.94 54,557.52
Qtr.IV 45,681.67 69,052.38 114,734.05 120,509.51 235,243.56 252,247.88 21,965.52 55,377.34 (33,411.82) 230,282.36 45,639.62 24,645.62 20,994.00 62,643.94
2013/14
Qtr.I 40,872.49 67,625.20 108,497.69 128,673.13 237,170.82 257,924.26 21,574.78 47,833.32 (26,258.54) 236,349.48 38,325.10 23,406.69 14,918.40 59,078.54
Qtr.II 44,085.69 69,579.58 113,665.27 138,686.20 252,351.47 280,465.92 18,308.87 50,041.39 (31,732.52) 262,157.05 33,534.49 21,297.01 12,237.48 61,648.94
Qtr.III 49,975.27 71,046.94 121,022.21 152,446.74 273,468.95 302,986.96 20,844.63 60,573.97 (39,729.34) 282,142.33 36,763.33 23,444.00 13,319.32 66,281.33
Qtr.IV 53,176.03 80,887.76 134,063.78 163,682.78 297,746.56 326,066.87 26,929.74 64,510.91 (37,581.17) 299,137.13 45,972.30 26,713.89 19,258.41 74,292.61
2014/15
Qtr.I 50,782.73 79,355.45 130,138.19 174,315.87 304,454.06 336,541.23 25,470.01 58,767.36 (33,297.35) 311,071.22 39,063.23 27,065.83 11,997.40 71,150.40
Qtr.II 58,128.86 82,081.55 140,210.40 185,615.77 325,826.17 367,313.10 23,581.11 64,293.14 (40,712.03) 343,731.98 39,409.45 28,393.45 11,015.99 80,896.38
Qtr.III 60,465.03 87,943.76 148,408.79 200,755.69 349,164.48 397,130.29 21,241.99 59,866.59 (38,624.59) 375,888.30 35,516.90 27,640.58 7,876.32 83,482.71
Qtr.IV 60,460.92 94,245.42 154,706.34 216,622.57 371,328.91 430,840.39 30,735.25 77,076.80 (46,341.55) 400,105.14 37,570.95 29,973.37 7,597.57 97,082.42
2015/16
Qtr.I 59,407.73 94,503.33 153,911.06 226,766.04 380,677.10 436,496.83 24,072.01 67,917.15 (43,845.14) 412,424.83 36,192.52 29,081.21 7,111.31 92,012.25
Qtr.II 63,507.06 95,784.79 159,291.85 237,323.17 396,615.02 469,781.03 25,008.45 78,917.95 (53,909.50) 444,772.58 31,444.63 22,494.68 8,949.94 104,610.63
Qtr.III 65,623.75 97,666.63 163,290.39 248,834.10 412,124.48 498,840.49 29,582.00 84,580.08 (54,998.07) 469,258.48 25,157.52 13,862.23 11,295.29 111,873.52
Qtr.IV 66,686.17 111,923.49 178,609.66 266,656.59 445,266.25 531,957.89 47,548.36 95,038.07 (47,489.71) 484,409.53 21,524.19 10,506.42 11,017.77 108,215.83
2016/17
Qtr.I 68,485.09 114,563.29 183,048.38 280,720.66 463,769.04 547,900.98 49,852.85 97,420.62 (47,567.77) 498,048.14 14,357.85 3,466.44 10,891.41 98,489.79
Qtr.II 73,702.55 122,551.62 196,254.17 300,041.07 496,295.24 577,812.91 45,593.96 105,012.72 (59,418.76) 532,218.95 16,470.24 5,541.88 10,928.36 97,987.92
Qtr.III 75,177.93 134,885.28 210,063.21 324,150.56 534,213.77 618,691.36 51,572.27 110,556.05 (58,983.78) 567,119.09 25,495.21 14,294.70 11,200.51 109,972.80
Qtr.IV 73,917.75 142,883.04 216,800.79 356,614.44 573,415.22 690,668.59 85,441.85 120,891.04 (35,449.19) 605,226.75 38,034.79 23,977.03 14,057.76 155,288.16
2017/18
Qtr.I 73,927.01 155,587.95 229,514.96 372,790.02 602,304.98 712,905.00 96,221.26 131,295.09 (35,073.83) 616,683.74 30,984.60 17,651.86 13,332.74 141,584.62
Qtr.II 86,784.15 161,094.75 247,878.90 396,274.17 644,153.07 758,470.30 99,972.02 143,447.90 (43,475.88) 658,498.28 22,527.90 11,391.82 11,136.08 136,845.13
Qtr.III 90,594.76 178,222.22 268,816.98 427,102.45 695,919.43 793,412.62 96,602.32 141,253.91 (44,651.59) 696,810.30 35,993.32 25,765.59 10,227.72 133,486.51
Qtr.IV 86,417.30 194,737.37 281,154.67 459,418.22 740,572.89 855,028.77 102,002.83 140,206.86 (38,204.03) 753,025.94 39,376.20 28,759.38 10,616.82 153,832.08
2018/19
Qtr.I 83,380.01 182,882.17 266,262.18 485,869.24 752,131.42 870,272.56 103,205.53 147,083.49 (43,877.95) 767,067.02 37,942.27 21,270.71 16,671.56 156,083.41
Qtr.II 92,192.59 185,405.32 277,597.90 511,563.89 789,161.79 921,386.87 98,558.46 154,902.04 (56,343.57) 822,828.41 23,507.72 11,063.97 12,443.76 155,732.81
Qtr.III 97,075.11 186,067.65 283,142.75 548,867.19 832,009.94 972,583.62 83,539.21 145,023.53 (61,484.32) 889,044.41 27,415.57 17,786.07 9,629.50 167,989.25
Qtr.IV 92,017.0 216,920.17 308,937.14 577,815.41 886,752.54 1,052,684.55 109,799.21 172,171.40 (62,372.19) 942,885.35 14,505.19 3,967.75 10,537.44 180,437.20
2019/20
Qtr.I 91,522.75 225,668.94 317,191.69 592,745.22 909,936.90 1,093,887.22 122,330.84 178,804.28 (56,473.43) 971,556.37 (17,043.11) (24,418.74) 7,375.63 166,907.21
Qtr.II 98,665.25 233,018.82 331,684.07 618,868.54 950,552.61 1,135,630.34 111,154.23 173,298.24 (62,144.01) 1,024,476.11 (14,628.59) (17,544.83) 2,916.24 170,449.14
Qtr.III 109,335.29 246,556.75 355,892.04 630,871.38 986,763.42 1,201,791.53 130,342.97 195,106.33 (64,763.36) 1,071,448.56 (28,902.99) (30,150.76) 1,247.77 186,125.12
Qtr.IV 109,071.81 251,513.71 360,585.51 677,060.82 1,037,646.34 1,257,527.48 137,080.08 195,708.16 (58,628.07) 1,120,447.40 (4,683.72) (15,221.00) 10,537.27 215,197.43
2020/21
Qtr.I 64,666.05 269,917.20 334,583.25 750,405.43 1,084,988.68 1,318,617.97 148,399.05 209,592.74 (61,193.69) 1,170,218.92 (28,149.28) (33,703.26) 5,553.98 205,480.01
Qtr.II 108,326.05 282,154.64 390,480.69 787,233.92 1,177,714.61 1,382,906.89 139,723.41 216,439.24 (76,715.83) 1,243,183.48 (38,577.03) (51,759.47) 13,182.44 166,615.25
Qtr.III 127,518.32 291,829.37 419,347.69 840,262.58 1,259,610.27 1,454,897.79 163,476.93 221,259.94 (57,783.01) 1,291,420.86 (10,275.23) (32,638.24) 22,363.01 185,012.29
Qtr.IV 133,621.30 303,770.68 437,391.98 910,874.18 1,348,266.16 1,562,694.68 214,269.16 245,019.19 (30,750.03) 1,348,425.52 10,455.44 (32,638.24) 43,093.68 224,883.96

98 | Fourth Quarter 2020/21
National Bank of Ethiopia Quarterly Bulletin
Table 5: Seasonally adjusted data of Monetary Variables (1)(In Millions of Birr)
End of Period
Money and Quasi-Money Domestic CreditCurrency Outside Banks
Net Demand Deposit
Money Supply
Quasi Money
Total Volume
Central Gov’t (Net)
Non-Cent. Gov’t
Foreign Assets (Net)
2008/09 Qtr.I 17,236.16 20,076.78 37,312.94 35,567.72 72,880.66 80,977.31 52,956.66 10,003.42 Qtr.II 13,853.90 22,627.96 36,481.86 34,811.19 71,293.04 85,412.99 37,368.30 10,243.69 Qtr.III 19,013.57 24,296.85 43,310.42 37,031.56 80,341.98 89,119.23 42,508.70 15,532.46 Qtr.IV 22,934.47 22,938.32 45,872.80 40,397.09 86,269.89 90,455.45 78,306.15 18,229.20 2009/10
Qtr.I 19,567.31 24,881.99 44,449.30 44,486.13 88,935.43 88,602.63 64,028.97 18,806.39 Qtr.II 17,289.37 24,031.04 41,320.41 44,406.67 85,727.08 93,039.12 45,073.24 20,813.83 Qtr.III 21,937.76 26,455.72 48,393.48 47,835.25 96,228.73 98,671.91 52,161.65 25,278.62 Qtr.IV 28,159.77 28,397.34 56,557.11 51,997.77 108,554.88 105,815.19 99,015.79 27,571.53 2010/11
Qtr.I 25,161.66 28,459.66 53,621.32 57,134.27 110,755.59 101,047.20 79,152.15 36,597.10 Qrt.II 22,499.80 31,307.31 53,807.11 56,581.36 110,388.47 110,624.46 58,197.81 40,271.11
Qtr.III 30,137.74 36,227.12 66,364.87 63,440.25 129,805.12 126,676.71 74,204.85 47,691.82 Qtr.IV 37,894.35 44,648.53 82,542.89 69,205.97 151,748.85 144,318.59 157,772.24 56,314.38 2011/12 Qtr.I 33,837.67 44,824.71 78,662.38 74,993.04 153,655.42 138,193.83 132,520.53 53,427.08 Qtr.II 28,827.43 42,279.64 71,107.07 75,208.80 146,315.87 157,567.59 100,776.61 49,394.91 Qtr.III 37,237.22 48,663.82 85,901.04 84,972.60 170,873.64 190,825.26 126,869.85 47,831.58 Qtr.IV 44,830.25 57,672.13 102,502.38 94,548.90 197,051.28 204,987.13 250,661.08 40,346.31
2012/13 Qtr.I 40,003.00 53,072.04 93,075.04 102,801.87 195,876.91 191,554.79 196,298.76 37,850.33 Qtr.II 33,915.43 56,719.32 90,634.75 103,942.43 194,577.18 213,388.40 139,610.24 39,794.31 Qtr.III 44,555.55 68,189.40 112,744.94 112,185.79 224,930.74 243,656.26 167,482.50 49,095.65 Qtr.IV 53,141.49 70,719.31 123,860.79 120,509.51 244,370.30 255,789.44 319,631.91 46,280.40
2013/14 Qtr.I 43,120.48 65,799.32 108,919.80 132,790.67 241,710.46 248,381.06 254,312.04 36,907.07 Qtr.II 35,034.90 68,605.47 103,640.37 135,912.48 239,552.84 280,746.38 183,509.94 33,568.03 Qtr.III 49,325.59 73,178.35 122,503.94 149,702.70 272,206.64 316,621.37 214,428.17 38,417.68 Qtr.IV 61,859.67 82,840.39 144,700.06 163,682.78 308,382.84 330,644.85 415,202.34 46,617.75
2014/15 Qtr.I 53,575.78 77,212.86 130,788.64 179,893.98 310,682.62 324,089.21 334,712.63 37,617.89 Qtr.II 46,195.00 80,932.40 127,127.41 181,903.45 309,030.86 367,680.41 240,612.39 39,448.86 Qtr.III 59,678.99 90,582.08 150,261.06 197,142.09 347,403.15 415,001.15 285,675.10 37,115.16 Qtr.IV 70,334.19 96,520.51 166,854.69 216,622.57 383,477.26 436,889.39 555,345.93 38,098.44
2015/16 Qtr.I 62,675.16 91,951.74 154,626.90 234,022.56 388,649.45 420,346.45 443,769.11 34,853.39 Qtr.II 50,469.06 94,443.80 144,912.87 232,576.71 377,489.57 470,250.81 311,340.80 31,476.07 Qtr.III 64,770.64 100,596.63 165,367.28 244,355.08 409,722.36 521,288.31 356,636.45 26,289.61 Qtr.IV 77,576.03 114,625.32 192,201.35 266,656.59 458,857.94 539,426.58 672,360.42 21,826.39
2016/17 Qtr.I 72,251.77 111,470.08 183,721.85 289,703.72 473,425.57 527,628.65 535,899.79 13,826.61 Qtr.II 58,571.42 120,835.90 179,407.32 294,040.25 473,447.56 578,390.72 372,553.27 16,486.71 Qtr.III 74,200.62 138,931.83 213,132.45 318,315.85 531,448.30 646,532.47 431,010.51 26,642.49 Qtr.IV 85,988.51 146,332.24 232,320.75 356,614.44 588,935.19 700,365.58 840,054.73 38,568.80
2017/18 Qtr.I 77,993.00 151,387.08 229,380.07 384,719.30 614,099.37 686,527.51 663,551.70 29,838.17 Qtr.II 68,967.37 158,839.42 227,806.79 388,348.68 616,155.47 759,228.77 460,948.80 22,550.43 Qtr.III 89,417.03 183,568.88 272,985.92 419,414.60 692,400.52 829,116.19 37,613.02 Qtr.IV 100,529.24 199,438.33 299,967.57 459,418.22 759,385.79 867,033.37 1,045,200.01 39,929.04
2018/19 Qtr.I 87,965.91 177,944.35 265,910.26 501,417.05 767,327.31 838,072.47 825,364.12 36,538.41 Qtr.II 73,265.45 182,809.64 256,075.09 501,332.61 757,407.70 922,308.26 575,979.89 23,531.23 Qtr.III 95,813.13 191,649.68 287,462.80 538,987.58 826,450.38 1,016,349.89 675,673.75 28,649.27 Qtr.IV 107,043.34 222,156.62 329,199.96 577,815.41 907,015.37 1,067,464.25 1,308,724.86 14,708.85
2019/20 Qtr.I 96,556.50 219,575.88 316,132.37 611,713.06 927,845.44 1,053,413.39 1,045,394.66 (16,412.51) Qtr.II 78,409.27 229,756.55 308,165.83 606,491.17 914,657.00 1,136,765.97 717,133.28 (14,643.22) Qtr.III 107,913.93 253,953.45 361,867.38 619,515.70 981,383.08 1,255,872.15 814,300.90 (30,203.62) QIV 126,883.23 257,585.25 384,468.48 677,060.82 1,061,529.30 1,275,183.17 1,555,180.99 (4,749.48)
2020/21 Qtr.I 68,222.69 262,629.43 330,852.12 774,418.40 1,105,270.52 1,269,829.10 1,259,155.56 (27,107.75) Qtr.II 86,086.71 278,204.48 364,291.19 771,489.24 1,135,780.43 1,384,289.79 870,228.43 (38,615.60) Qtr.III 101,338.81 287,743.76 389,082.57 823,457.33 1,212,539.89 1,456,352.69 903,994.60 (10,285.50)
QIV 155,441.65 311,103.71 466,545.36 910,874.18 1,377,419.54 1,584,634.91 1,871,614.62 10,602.23 1/ Obtained by multiplying each original observation by appropriate index for the month

Fourth Quarter 2020/21 | 99
National Bank of Ethiopia Quarterly Bulletin
Table 5: Seasonally adjusted data of Monetary Variables (1)(In Millions of Birr)
End of Period
Money and Quasi-Money Domestic CreditCurrency Outside Banks
Net Demand Deposit
Money Supply
Quasi Money
Total Volume
Central Gov’t (Net)
Non-Cent. Gov’t
Foreign Assets (Net)
2008/09 Qtr.I 17,236.16 20,076.78 37,312.94 35,567.72 72,880.66 80,977.31 52,956.66 10,003.42 Qtr.II 13,853.90 22,627.96 36,481.86 34,811.19 71,293.04 85,412.99 37,368.30 10,243.69 Qtr.III 19,013.57 24,296.85 43,310.42 37,031.56 80,341.98 89,119.23 42,508.70 15,532.46 Qtr.IV 22,934.47 22,938.32 45,872.80 40,397.09 86,269.89 90,455.45 78,306.15 18,229.20 2009/10
Qtr.I 19,567.31 24,881.99 44,449.30 44,486.13 88,935.43 88,602.63 64,028.97 18,806.39 Qtr.II 17,289.37 24,031.04 41,320.41 44,406.67 85,727.08 93,039.12 45,073.24 20,813.83 Qtr.III 21,937.76 26,455.72 48,393.48 47,835.25 96,228.73 98,671.91 52,161.65 25,278.62 Qtr.IV 28,159.77 28,397.34 56,557.11 51,997.77 108,554.88 105,815.19 99,015.79 27,571.53 2010/11
Qtr.I 25,161.66 28,459.66 53,621.32 57,134.27 110,755.59 101,047.20 79,152.15 36,597.10 Qrt.II 22,499.80 31,307.31 53,807.11 56,581.36 110,388.47 110,624.46 58,197.81 40,271.11
Qtr.III 30,137.74 36,227.12 66,364.87 63,440.25 129,805.12 126,676.71 74,204.85 47,691.82 Qtr.IV 37,894.35 44,648.53 82,542.89 69,205.97 151,748.85 144,318.59 157,772.24 56,314.38 2011/12 Qtr.I 33,837.67 44,824.71 78,662.38 74,993.04 153,655.42 138,193.83 132,520.53 53,427.08 Qtr.II 28,827.43 42,279.64 71,107.07 75,208.80 146,315.87 157,567.59 100,776.61 49,394.91 Qtr.III 37,237.22 48,663.82 85,901.04 84,972.60 170,873.64 190,825.26 126,869.85 47,831.58 Qtr.IV 44,830.25 57,672.13 102,502.38 94,548.90 197,051.28 204,987.13 250,661.08 40,346.31
2012/13 Qtr.I 40,003.00 53,072.04 93,075.04 102,801.87 195,876.91 191,554.79 196,298.76 37,850.33 Qtr.II 33,915.43 56,719.32 90,634.75 103,942.43 194,577.18 213,388.40 139,610.24 39,794.31 Qtr.III 44,555.55 68,189.40 112,744.94 112,185.79 224,930.74 243,656.26 167,482.50 49,095.65 Qtr.IV 53,141.49 70,719.31 123,860.79 120,509.51 244,370.30 255,789.44 319,631.91 46,280.40
2013/14 Qtr.I 43,120.48 65,799.32 108,919.80 132,790.67 241,710.46 248,381.06 254,312.04 36,907.07 Qtr.II 35,034.90 68,605.47 103,640.37 135,912.48 239,552.84 280,746.38 183,509.94 33,568.03 Qtr.III 49,325.59 73,178.35 122,503.94 149,702.70 272,206.64 316,621.37 214,428.17 38,417.68 Qtr.IV 61,859.67 82,840.39 144,700.06 163,682.78 308,382.84 330,644.85 415,202.34 46,617.75
2014/15 Qtr.I 53,575.78 77,212.86 130,788.64 179,893.98 310,682.62 324,089.21 334,712.63 37,617.89 Qtr.II 46,195.00 80,932.40 127,127.41 181,903.45 309,030.86 367,680.41 240,612.39 39,448.86 Qtr.III 59,678.99 90,582.08 150,261.06 197,142.09 347,403.15 415,001.15 285,675.10 37,115.16 Qtr.IV 70,334.19 96,520.51 166,854.69 216,622.57 383,477.26 436,889.39 555,345.93 38,098.44
2015/16 Qtr.I 62,675.16 91,951.74 154,626.90 234,022.56 388,649.45 420,346.45 443,769.11 34,853.39 Qtr.II 50,469.06 94,443.80 144,912.87 232,576.71 377,489.57 470,250.81 311,340.80 31,476.07 Qtr.III 64,770.64 100,596.63 165,367.28 244,355.08 409,722.36 521,288.31 356,636.45 26,289.61 Qtr.IV 77,576.03 114,625.32 192,201.35 266,656.59 458,857.94 539,426.58 672,360.42 21,826.39
2016/17 Qtr.I 72,251.77 111,470.08 183,721.85 289,703.72 473,425.57 527,628.65 535,899.79 13,826.61 Qtr.II 58,571.42 120,835.90 179,407.32 294,040.25 473,447.56 578,390.72 372,553.27 16,486.71 Qtr.III 74,200.62 138,931.83 213,132.45 318,315.85 531,448.30 646,532.47 431,010.51 26,642.49 Qtr.IV 85,988.51 146,332.24 232,320.75 356,614.44 588,935.19 700,365.58 840,054.73 38,568.80
2017/18 Qtr.I 77,993.00 151,387.08 229,380.07 384,719.30 614,099.37 686,527.51 663,551.70 29,838.17 Qtr.II 68,967.37 158,839.42 227,806.79 388,348.68 616,155.47 759,228.77 460,948.80 22,550.43 Qtr.III 89,417.03 183,568.88 272,985.92 419,414.60 692,400.52 829,116.19 37,613.02 Qtr.IV 100,529.24 199,438.33 299,967.57 459,418.22 759,385.79 867,033.37 1,045,200.01 39,929.04
2018/19 Qtr.I 87,965.91 177,944.35 265,910.26 501,417.05 767,327.31 838,072.47 825,364.12 36,538.41 Qtr.II 73,265.45 182,809.64 256,075.09 501,332.61 757,407.70 922,308.26 575,979.89 23,531.23 Qtr.III 95,813.13 191,649.68 287,462.80 538,987.58 826,450.38 1,016,349.89 675,673.75 28,649.27 Qtr.IV 107,043.34 222,156.62 329,199.96 577,815.41 907,015.37 1,067,464.25 1,308,724.86 14,708.85
2019/20 Qtr.I 96,556.50 219,575.88 316,132.37 611,713.06 927,845.44 1,053,413.39 1,045,394.66 (16,412.51) Qtr.II 78,409.27 229,756.55 308,165.83 606,491.17 914,657.00 1,136,765.97 717,133.28 (14,643.22) Qtr.III 107,913.93 253,953.45 361,867.38 619,515.70 981,383.08 1,255,872.15 814,300.90 (30,203.62) QIV 126,883.23 257,585.25 384,468.48 677,060.82 1,061,529.30 1,275,183.17 1,555,180.99 (4,749.48)
2020/21 Qtr.I 68,222.69 262,629.43 330,852.12 774,418.40 1,105,270.52 1,269,829.10 1,259,155.56 (27,107.75) Qtr.II 86,086.71 278,204.48 364,291.19 771,489.24 1,135,780.43 1,384,289.79 870,228.43 (38,615.60) Qtr.III 101,338.81 287,743.76 389,082.57 823,457.33 1,212,539.89 1,456,352.69 903,994.60 (10,285.50)
QIV 155,441.65 311,103.71 466,545.36 910,874.18 1,377,419.54 1,584,634.91 1,871,614.62 10,602.23 1/ Obtained by multiplying each original observation by appropriate index for the month
Table 6: International Reserves and Net Foreign Assets of National Bank & Commercial Banks(In Millions of Birr)
End of Period
Gross ReserveForeign Liabilities Net Foreign Assets
National Bank of Ethiopia International ReservesComm. Banks
Reserve 6
Gross Reserve 1=2+6
NBE Total
2=3 to 5
Gold 3
Foreign Exc.
4Others
Reserve Tranche
Posi. 5
Total Liab.
7=8+9
Comm. Banks
8
NBE 9
Total 10=11+12
NBE 11=2-9
Comm. Banks 12=6-8
2007/08 Qtr.I 20,016.34 13,021.85 375.82 12,080.02 463.88 102.13 6,994.50 4,787.11 2,113.06 2,674.04 15,229.24 10,347.81 4,881.43 Qtr.II 19,194.15 12,829.31 491.81 11,759.64 472.18 105.68 6,364.83 4,983.72 2,221.78 2,761.94 14,210.43 10,067.38 4,143.05 Qtr.III 19,005.66 10,875.89 502.52 9,772.72 486.96 113.69 8,129.78 6,005.59 2,384.41 3,621.19 13,000.07 7,254.70 5,745.37 Qtr.IV 16,735.51 8,708.66 5.47 8,093.97 495.26 113.96 8,026.85 5,069.87 2,301.87 2,768.01 11,665.63 5,940.65 5,724.98 2008/09
Qtr.I 16,363.33 8,636.72 15.01 8,010.33 500.60 110.78 7,726.62 5,975.57 2,315.51 3,660.06 10,387.77 4,976.66 5,411.11 Qtr.II 16,211.07 9,260.43 81.90 8,551.39 515.01 112.13 6,950.64 5,977.61 2,854.59 3,123.02 10,233.46 6,137.41 4,096.05 Qtr.III 21,378.52 13,284.94 8.60 12,580.96 574.93 120.45 8,093.58 6,514.92 2,801.54 3,713.38 14,863.60 9,571.56 5,292.04 Qtr.IV 26,434.27 17,214.61 18.17 16,488.13 580.86 127.45 9,219.66 8,457.46 3,076.51 5,380.94 17,976.81 11,833.66 6,143.15 2009/10
Qtr.I 31,435.10 22,262.14 120.26 21,002.66 995.32 143.91 9,172.96 11,906.14 3,856.62 8,049.53 19,528.96 14,212.62 5,316.34 Qtr.II 33,176.91 23,445.68 287.33 22,018.26 995.76 144.34 9,731.23 12,383.88 3,690.78 8,693.10 20,793.03 14,752.59 6,040.45 Qtr.III 40,235.07 27,285.95 267.70 24,480.32 2,389.76 148.18 12,949.12 14,956.45 3,960.93 10,995.53 25,278.62 16,290.43 8,988.19 Qtr.IV 42,350.09 27,289.34 443.30 23,490.22 3,210.12 145.70 15,060.75 15,160.31 3,254.28 11,906.03 27,189.78 15,383.31 11,806.47 2010/11
Qtr.I 55,098.19 35,852.22 490.52 31,229.17 3,948.22 184.31 19,245.97 17,094.98 4,246.06 12,848.92 38,003.21 23,003.30 14,999.91 Qrt.II 60,236.11 40,042.00 444.17 34,418.71 4,994.49 184.63 20,194.12 20,005.24 4,942.59 15,062.65 40,230.88 24,979.34 15,251.53
Qtr.III 66,516.18 45,367.31 1,636.24 38,413.88 5,124.86 192.33 21,148.87 20,878.08 5,595.24 15,282.84 45,638.10 30,084.47 15,553.63 Qtr.IV 79,945.54 51,551.39 1,395.23 44,738.80 5,221.68 195.67 28,394.16 24,410.87 5,715.48 18,695.39 55,534.68 32,856.00 22,678.68 2011/12 Qtr.I 82,289.50 59,724.20 1,037.56 53,248.95 5,242.45 195.24 22,565.30 26,809.66 6,441.17 20,368.49 55,479.84 39,355.70 16,124.13 Qtr.II 75,054.99 51,965.40 479.44 46,056.19 5,236.48 193.30 23,089.59 25,709.43 8,419.69 17,289.74 49,345.56 34,675.66 14,669.91
Qtr.III 68,989.93 40,349.89 669.26 34,192.43 5,292.44 195.77 28,640.04 23,218.08 7,392.24 15,825.84 45,771.85 24,524.05 21,247.79 Qtr.IV 64,119.02 40,101.45 2,038.08 32,528.76 5,339.29 195.32 24,017.57 24,331.33 5,484.21 18,847.12 39,787.69 21,254.33 18,533.36
2012/13 Qtr.I 64,490.48 44,307.75 (24.32) 38,671.89 5,458.67 201.51 20,182.74 25,185.88 5,873.98 19,311.91 39,304.60 24,995.84 14,308.76 Qtr.II 66,096.15 46,620.93 1,964.27 38,926.61 5,526.08 203.98 19,475.22 26,341.60 6,078.30 20,263.30 39,754.55 26,357.64 13,396.92 Qtr.III 73,770.07 50,358.05 1,310.29 43,334.32 5,512.02 201.42 23,412.02 26,788.59 6,038.08 20,750.51 46,981.49 29,607.54 17,373.94 Qtr.IV 72,649.20 44,140.03 2,253.17 36,078.39 5,606.69 201.78 28,509.18 27,009.59 7,515.18 19,494.41 45,639.62 24,645.62 20,994.00
2013/14 Qtr.I 69,177.60 46,471.52 2,656.15 37,900.27 5,705.18 209.91 22,706.08 30,852.50 7,787.68 23,064.82 38,325.10 23,406.69 14,918.40 Qtr.II 69,684.03 49,513.05 1,522.50 41,971.87 5,804.38 214.30 20,170.98 36,149.54 7,933.50 28,216.04 33,534.49 21,297.01 12,237.48 Qtr.III 67,001.19 45,838.73 1,333.55 38,439.61 5,848.52 217.05 21,162.46 30,237.86 7,843.13 22,394.73 36,763.33 23,444.00 13,319.32 Qtr.IV 77,877.97 50,624.47 1,217.59 43,237.44 5,951.02 218.41 27,253.50 31,905.67 7,995.09 23,910.57 45,972.30 26,713.89 19,258.41
2014/15 Qtr.I 72,152.41 52,555.40 1,217.59 45,256.47 5,866.25 215.08 19,597.01 33,089.18 7,599.61 25,489.57 39,063.23 27,065.83 11,997.40 Qtr.II 93,641.42 74,840.58 741.24 67,914.12 5,867.87 317.35 18,800.84 54,231.97 7,784.85 46,447.12 39,409.45 28,393.45 11,015.99 Qtr.III 80,014.15 64,152.02 206.89 57,837.68 5,800.34 307.11 15,862.13 44,497.25 7,985.81 36,511.44 35,516.90 27,640.58 7,876.32 Qtr.IV 82,741.82 66,817.67 79.30 60,856.52 5,566.59 315.26 15,924.15 45,170.87 8,326.57 36,844.30 37,570.95 29,973.37 7,597.57
2015/16 Qtr.I 80,548.64 65,085.59 (101.65) 59,349.29 5,519.27 318.69 15,463.04 44,356.12 8,351.74 36,004.39 36,192.52 29,081.21 7,111.31 Qtr.II 102,594.72 84,226.48 222.87 78,442.72 5,241.83 319.06 18,368.24 71,150.10 9,418.30 61,731.80 31,444.63 22,494.68 8,949.94 Qtr.III 94,205.95 72,889.54 1,136.99 66,362.68 5,064.22 325.65 21,316.42 69,048.43 10,021.13 59,027.31 25,157.52 13,862.23 11,295.29 Qtr.IV 95,054.99 74,156.73 1,113.92 67,851.69 4,859.62 331.50 20,898.27 73,530.80 9,880.50 63,650.30 21,524.19 10,506.42 11,017.77
2016/17 Qtr.I 96,065.61 74,949.60 8.43 69,963.93 4,641.20 336.04 21,116.01 81,707.76 10,224.60 71,483.16 14,357.85 3,466.44 10,891.41 Qtr.III 92,768.28 72,397.44 1,139.58 66,561.06 4,370.15 326.66 20,370.84 76,298.03 9,442.47 66,855.56 16,470.24 5,541.88 10,928.36 Qtr.III 91,850.16 70,874.56 1,135.37 61,851.06 7,550.46 337.66 20,975.60 66,354.95 9,775.10 56,579.86 25,495.21 14,294.70 11,200.51 Qtr.IV 98,750.85 73,874.32 741.33 68,851.84 3,931.73 349.42 24,876.54 60,716.07 10,818.77 49,897.29 38,034.79 23,977.03 14,057.76
2017/18 Qtr.I 93,889.81 68,636.42 0.01 64,643.51 3,633.38 359.52 25,253.39 62,905.21 11,920.65 50,984.56 30,984.60 17,651.86 13,332.74 Qtr.II 108,580.90 82,254.04 0.01 77,584.06 4,249.63 420.35 26,326.86 86,053.00 15,190.78 70,862.22 22,527.90 11,391.82 11,136.08 Qtr.III 109,952.13 85,287.93 81.43 80,464.52 4,309.30 432.67 24,664.20 73,958.81 14,436.48 59,522.34 35,993.32 25,765.59 10,227.72 Qtr.IV 102,738.94 77,617.37 750.54 72,217.34 4,231.09 418.41 25,121.57 63,362.74 14,504.75 48,857.99 39,376.20 28,759.38 10,616.82
2018/19 Qtr.I 134,142.53 103,307.08 750.99 97,678.76 4,455.23 422.10 30,835.45 96,200.25 14,163.89 82,036.37 37,942.27 21,270.71 16,671.56 Qtr.II 139,330.76 110,973.71 750.54 105,145.06 4,654.41 423.72 28,357.05 115,823.04 15,913.29 99,909.75 23,507.72 11,063.97 12,443.76 Qtr.III 138,532.05 111,651.22 198.87 106,132.87 4,887.60 431.88 26,880.84 111,116.48 17,251.34 93,865.15 27,415.57 17,786.07 9,629.50 Qtr.IV 127,270.46 98,726.63 804.88 92,853.80 4,630.17 437.79 28,543.82 112,765.27 18,006.38 94,758.88 14,505.19 3,967.75 10,537.44
2019/20 Qtr.I 95770.9 69790.0 15.3 64693.1 4646.3 435.4 25980.8 112814.0 18605.2 94208.8 -17043.1 -24418.7 7375.6 Qtr.II 118262.2 94289.2 19.4 88749.5 5042.0 478.3 23973.1 132890.8 21056.8 111834.0 -14628.6 -17544.8 2916.2 Qtr.III 105013.8 80407.5 316.7 74412.2 5190.3 488.3 24606.3 133916.8 23358.5 110558.3 -28903.0 -30150.8 1247.8Qtr.IV 147202.8 112086.3 3280.6 102412.1 5868.2 525.4 35116.5 151886.6 24579.2 127307.3 -4683.7 -15221.0 10537.3
2020/21 Qtr.I 153636.7 120432.6 5033.1 108717.2 6119.0 563.3 33204.1 181786.0 27650.2 154135.8 -28149.3 -33703.3 5554.0 Qtr.II 163630.6 120263.6 1868.9 111460.7 6319.0 615.0 43367.0 202207.6 30184.6 172023.0 -38577.0 -51759.5 13182.4 Qtr.III 159309.7 104230.9 12559.9 84430.0 6601.6 639.4 55078.8 186682.6 32715.7 153966.9 -27372.9 -49735.9 22363.0Qtr.IV 202804.8 125859.7 628.2 117629.9 6921.5 680.2 76945.1 203618.1 33851.4 169766.7 -813.3 -43907.0 43093.7

100 | Fourth Quarter 2020/21
National Bank of Ethiopia Quarterly Bulletin
Table 7: Domestic Credit by Sector(In Millions of Birr)
End of Period
Gross Domestic
Credit 1=2+5
Claims on Central Gov’t Claims on Non-Central Gov’t
Total 2=3+4
NBE 3
Comm. Banks
4
Total 5=6+7
Loans & Advances
6
Invest- ments
7
2007/08 Qtr.I 77,648.79 46,319.15 30,269.27 16,049.88 31,329.65 22,920.83 8,408.81 Qtr.II 83,224.02 48,069.23 31,995.27 16,073.96 35,154.79 25,761.00 9,393.79 Qtr.III 88,852.79 46,095.09 33,917.27 12,177.81 42,757.71 31,682.65 11,075.06 Qtr.IV 95,104.83 48,211.24 41,563.08 6,648.16 46,893.59 33,600.67 13,292.93 2008/09
Qtr.I 99,722.15 50,505.92 44,270.98 6,234.94 49,216.23 34,397.64 14,818.58 Qtr.II 101,879.50 48,496.21 42,948.98 5,547.24 53,383.28 35,946.71 17,436.57 Qtr.III 103,730.38 47,797.88 42,248.98 5,548.90 55,932.51 37,079.81 18,852.70 Qtr.IV 106,324.63 49,908.09 44,498.73 5,409.36 56,416.54 38,802.03 17,614.51 2009/10
Qtr.I 109,573.22 50,066.74 44,326.63 5,740.11 59,506.48 39,701.38 19,805.10 Qtr.II 113,178.74 48,788.40 43,610.83 5,177.56 64,390.35 44,092.84 20,297.50 Qtr.III 120,251.34 51,617.59 45,989.73 5,627.86 68,633.76 46,900.67 21,733.09 Qtr.IV 124,275.08 52,938.05 45,522.78 7,415.27 71,337.03 47,540.18 23,796.85 2010/11
Qtr.I 127,025.88 53,464.40 47,983.68 5,480.72 73,561.48 48,436.98 25,124.50 Qrt.II 137,731.17 54,591.45 50,488.58 4,102.86 83,139.73 55,653.80 27,485.93
Qtr.III 154,521.74 56,883.78 51,930.58 4,953.20 97,637.96 62,088.83 35,549.12 Qtr.IV 172,852.07 59,183.31 55,614.64 3,568.67 113,668.76 68,121.31 45,547.45 2011/12 Qtr.I 182,848.50 59,688.15 55,566.48 4,121.67 123,160.34 72,379.01 50,781.33 Qtr.II 202,386.30 58,419.72 55,562.48 2,857.24 143,966.58 85,795.46 58,171.12 Qrt.III 225,564.77 58,630.77 55,562.48 3,068.28 166,934.01 100,478.28 66,455.73 Qtr.IV 240,575.21 59,983.66 55,562.48 4,421.18 180,591.55 107,119.04 73,472.51
2012/13 Qtr.I 246,456.06 64,022.27 55,510.38 8,511.89 182,433.79 106,583.93 75,849.86 Qtr.II 261,646.62 62,203.41 55,510.38 6,693.03 199,443.21 115,716.08 83,727.13 Qtr.III 285,289.57 64,917.87 59,510.38 5,407.49 220,371.71 128,230.09 92,141.62 Qtr.IV 300,492.71 70,210.35 64,510.38 5,699.97 230,282.36 130,885.39 99,396.97
2013/14 Qtr.I 304,819.92 68,470.44 64,381.33 4,089.11 236,349.48 129,713.99 106,635.50 Qtr.II 330,002.44 67,845.38 64,381.33 3,464.05 262,157.05 144,359.46 117,797.59 Qtr.III 357,277.46 75,135.14 73,381.33 1,753.80 282,142.33 155,798.24 126,344.08 Qtr.IV 374,071.19 74,934.06 73,304.39 1,629.68 299,137.13 162,232.83 136,904.30
2014/15 Qtr.I 385,474.06 74,402.84 73,175.34 1,227.50 311,071.22 166,392.07 144,679.15 Qtr.II 423,153.67 79,421.69 78,175.34 1,246.35 343,731.98 184,727.66 159,004.32 Qtr.III 458,315.98 82,427.69 81,175.34 1,252.35 375,888.30 202,409.27 173,479.03 Qtr.IV 493,536.50 93,431.36 92,175.34 1,256.02 400,105.14 208,858.92 191,246.21
2015/16 Qtr.I 512,987.60 100,562.77 99,657.34 905.43 412,424.83 212,528.02 199,896.80 Qtr.II 550,335.35 105,562.77 104,657.34 905.43 444,772.58 231,803.76 212,968.82 Qtr.III 574,821.26 105,562.77 104,657.34 905.43 469,258.48 244,256.61 225,001.87 Qtr.IV 594,275.57 109,866.05 109,080.40 785.65 484,409.53 252,456.25 231,953.28
2016/17Qtr.I 614,243.26 116,195.13 115,640.85 554.28 498,048.14 257,176.06 240,872.08 Qtr.II 653,414.08 121,195.13 120,640.85 554.28 532,218.95 279,303.53 252,915.43 Qtr.III 697,290.22 130,171.13 129,640.85 530.28 567,119.09 299,213.06 267,906.04 Qtr.IV 762,842.31 157,615.56 135,632.85 21,982.71 605,226.75 311,137.51 294,089.24
2017/18 Qtr.I 789,525.40 172,841.67 150,632.85 22,208.82 616,683.74 316,104.52 300,579.22 Qtr.II 840,813.75 182,315.46 160,128.85 22,186.62 658,498.28 336,105.79 322,392.50 Qtr.III 879,125.76 182,315.46 160,128.85 22,186.62 696,810.30 357,928.56 338,881.74 Qtr.IV 935,341.40 182,315.46 160,128.85 22,186.62 753,025.94 393,607.01 359,418.93
2018/19 Qtr.I 956,319.44 189,252.41 166,685.30 22,567.12 767,067.02 402,964.12 364,102.91 Qtr.II 1,024,035.43 201,207.02 178,685.30 22,521.73 822,828.41 444,356.28 378,472.13 Qtr.III 1,094,682.64 205,638.22 182,685.30 22,952.93 889,044.41 471,569.71 417,474.71 Qtr.IV 1,161,190.85 218,305.50 194,685.30 23,620.21 942,885.35 495,504.92 447,380.43
2019/20 Qtr.I 1,193,721.90 222,165.52 199,237.75 22,927.78 971,556.37 515,294.45 456,261.93 Qtr.II 1,251,837.28 227,361.17 204,237.75 23,123.42 1,024,476.11 568,242.29 456,233.83 Qtr.III 1,315,614.08 244,165.52 221,237.75 22,927.78 1,071,448.56 583,681.60 487,766.96 QIV 1,379,523.63 259,076.23 230,237.75 28,838.49 1,120,447.40 629,954.69 490,492.71
2020/21 Qtr.I 1,449,866.28 279,647.36 243,141.31 36,506.06 1,170,218.92 669,626.18 500,592.74 Qtr.II 1,524,023.10 280,839.63 248,141.31 32,698.32 1,243,183.48 717,177.35 526,006.13 Qtr.III 1,584,277.32 292,856.46 251,862.65 40,993.81 1,291,420.86 760,726.06 530,694.80 Qtr.IV 1,707,062.02 358,636.51 281,862.65 76,773.86 1,348,425.52 815,512.08 532,913.44

Fourth Quarter 2020/21 | 101
National Bank of Ethiopia Quarterly Bulletin
Table 7: Domestic Credit by Sector(In Millions of Birr)
End of Period
Gross Domestic
Credit 1=2+5
Claims on Central Gov’t Claims on Non-Central Gov’t
Total 2=3+4
NBE 3
Comm. Banks
4
Total 5=6+7
Loans & Advances
6
Invest- ments
7
2007/08 Qtr.I 77,648.79 46,319.15 30,269.27 16,049.88 31,329.65 22,920.83 8,408.81 Qtr.II 83,224.02 48,069.23 31,995.27 16,073.96 35,154.79 25,761.00 9,393.79 Qtr.III 88,852.79 46,095.09 33,917.27 12,177.81 42,757.71 31,682.65 11,075.06 Qtr.IV 95,104.83 48,211.24 41,563.08 6,648.16 46,893.59 33,600.67 13,292.93 2008/09
Qtr.I 99,722.15 50,505.92 44,270.98 6,234.94 49,216.23 34,397.64 14,818.58 Qtr.II 101,879.50 48,496.21 42,948.98 5,547.24 53,383.28 35,946.71 17,436.57 Qtr.III 103,730.38 47,797.88 42,248.98 5,548.90 55,932.51 37,079.81 18,852.70 Qtr.IV 106,324.63 49,908.09 44,498.73 5,409.36 56,416.54 38,802.03 17,614.51 2009/10
Qtr.I 109,573.22 50,066.74 44,326.63 5,740.11 59,506.48 39,701.38 19,805.10 Qtr.II 113,178.74 48,788.40 43,610.83 5,177.56 64,390.35 44,092.84 20,297.50 Qtr.III 120,251.34 51,617.59 45,989.73 5,627.86 68,633.76 46,900.67 21,733.09 Qtr.IV 124,275.08 52,938.05 45,522.78 7,415.27 71,337.03 47,540.18 23,796.85 2010/11
Qtr.I 127,025.88 53,464.40 47,983.68 5,480.72 73,561.48 48,436.98 25,124.50 Qrt.II 137,731.17 54,591.45 50,488.58 4,102.86 83,139.73 55,653.80 27,485.93
Qtr.III 154,521.74 56,883.78 51,930.58 4,953.20 97,637.96 62,088.83 35,549.12 Qtr.IV 172,852.07 59,183.31 55,614.64 3,568.67 113,668.76 68,121.31 45,547.45 2011/12 Qtr.I 182,848.50 59,688.15 55,566.48 4,121.67 123,160.34 72,379.01 50,781.33 Qtr.II 202,386.30 58,419.72 55,562.48 2,857.24 143,966.58 85,795.46 58,171.12 Qrt.III 225,564.77 58,630.77 55,562.48 3,068.28 166,934.01 100,478.28 66,455.73 Qtr.IV 240,575.21 59,983.66 55,562.48 4,421.18 180,591.55 107,119.04 73,472.51
2012/13 Qtr.I 246,456.06 64,022.27 55,510.38 8,511.89 182,433.79 106,583.93 75,849.86 Qtr.II 261,646.62 62,203.41 55,510.38 6,693.03 199,443.21 115,716.08 83,727.13 Qtr.III 285,289.57 64,917.87 59,510.38 5,407.49 220,371.71 128,230.09 92,141.62 Qtr.IV 300,492.71 70,210.35 64,510.38 5,699.97 230,282.36 130,885.39 99,396.97
2013/14 Qtr.I 304,819.92 68,470.44 64,381.33 4,089.11 236,349.48 129,713.99 106,635.50 Qtr.II 330,002.44 67,845.38 64,381.33 3,464.05 262,157.05 144,359.46 117,797.59 Qtr.III 357,277.46 75,135.14 73,381.33 1,753.80 282,142.33 155,798.24 126,344.08 Qtr.IV 374,071.19 74,934.06 73,304.39 1,629.68 299,137.13 162,232.83 136,904.30
2014/15 Qtr.I 385,474.06 74,402.84 73,175.34 1,227.50 311,071.22 166,392.07 144,679.15 Qtr.II 423,153.67 79,421.69 78,175.34 1,246.35 343,731.98 184,727.66 159,004.32 Qtr.III 458,315.98 82,427.69 81,175.34 1,252.35 375,888.30 202,409.27 173,479.03 Qtr.IV 493,536.50 93,431.36 92,175.34 1,256.02 400,105.14 208,858.92 191,246.21
2015/16 Qtr.I 512,987.60 100,562.77 99,657.34 905.43 412,424.83 212,528.02 199,896.80 Qtr.II 550,335.35 105,562.77 104,657.34 905.43 444,772.58 231,803.76 212,968.82 Qtr.III 574,821.26 105,562.77 104,657.34 905.43 469,258.48 244,256.61 225,001.87 Qtr.IV 594,275.57 109,866.05 109,080.40 785.65 484,409.53 252,456.25 231,953.28
2016/17Qtr.I 614,243.26 116,195.13 115,640.85 554.28 498,048.14 257,176.06 240,872.08 Qtr.II 653,414.08 121,195.13 120,640.85 554.28 532,218.95 279,303.53 252,915.43 Qtr.III 697,290.22 130,171.13 129,640.85 530.28 567,119.09 299,213.06 267,906.04 Qtr.IV 762,842.31 157,615.56 135,632.85 21,982.71 605,226.75 311,137.51 294,089.24
2017/18 Qtr.I 789,525.40 172,841.67 150,632.85 22,208.82 616,683.74 316,104.52 300,579.22 Qtr.II 840,813.75 182,315.46 160,128.85 22,186.62 658,498.28 336,105.79 322,392.50 Qtr.III 879,125.76 182,315.46 160,128.85 22,186.62 696,810.30 357,928.56 338,881.74 Qtr.IV 935,341.40 182,315.46 160,128.85 22,186.62 753,025.94 393,607.01 359,418.93
2018/19 Qtr.I 956,319.44 189,252.41 166,685.30 22,567.12 767,067.02 402,964.12 364,102.91 Qtr.II 1,024,035.43 201,207.02 178,685.30 22,521.73 822,828.41 444,356.28 378,472.13 Qtr.III 1,094,682.64 205,638.22 182,685.30 22,952.93 889,044.41 471,569.71 417,474.71 Qtr.IV 1,161,190.85 218,305.50 194,685.30 23,620.21 942,885.35 495,504.92 447,380.43
2019/20 Qtr.I 1,193,721.90 222,165.52 199,237.75 22,927.78 971,556.37 515,294.45 456,261.93 Qtr.II 1,251,837.28 227,361.17 204,237.75 23,123.42 1,024,476.11 568,242.29 456,233.83 Qtr.III 1,315,614.08 244,165.52 221,237.75 22,927.78 1,071,448.56 583,681.60 487,766.96 QIV 1,379,523.63 259,076.23 230,237.75 28,838.49 1,120,447.40 629,954.69 490,492.71
2020/21 Qtr.I 1,449,866.28 279,647.36 243,141.31 36,506.06 1,170,218.92 669,626.18 500,592.74 Qtr.II 1,524,023.10 280,839.63 248,141.31 32,698.32 1,243,183.48 717,177.35 526,006.13 Qtr.III 1,584,277.32 292,856.46 251,862.65 40,993.81 1,291,420.86 760,726.06 530,694.80 Qtr.IV 1,707,062.02 358,636.51 281,862.65 76,773.86 1,348,425.52 815,512.08 532,913.44
Table 8: Deposits by Type and Sector(In Millions of Birr)
End of Period
Total Deposits
6+2=1
Non-Central Gov’t Deposits with CBs Central Gov’t Dep. with
Total 3=2 to 5
Net Demand Deposit
3
Savings Deposit
4
Time Dep. (30 days & over)
5
Total 8+7=6
National Bank
7
Comm. Banks
8
2007/08 Qtr.I 61,683.06 45,481.93 16,968.54 24,994.43 3,518.97 16,201.13 8,032.28 8,168.85 Qtr.II 62,526.95 46,703.07 16,652.00 26,300.71 3,750.36 15,823.89 6,740.91 9,082.98 Qtr.III 64,318.55 48,941.84 17,462.77 27,829.80 3,649.27 15,376.71 5,966.52 9,410.19 Qtr.IV 65,663.61 50,528.03 17,696.26 29,477.65 3,354.13 15,135.58 6,157.32 8,978.26 2008/09
Qtr.I 70,732.30 55,098.74 20,633.90 31,463.68 3,001.17 15,633.56 7,222.97 8,410.60 Qtr.II 75,022.70 58,470.86 22,949.25 32,543.78 2,977.84 16,551.83 6,215.84 10,336.00 Qtr.III 79,748.34 61,299.52 23,589.18 34,659.04 3,051.31 18,448.82 6,682.81 11,766.01 Qtr.IV 79,916.41 62,794.83 22,397.64 37,148.81 3,248.37 17,121.59 6,671.53 10,450.06 2009/10
Qtr.I 86,455.99 68,889.65 25,572.45 39,815.15 3,502.06 17,566.34 7,373.32 10,193.02 Qtr.II 89,917.82 69,685.24 24,372.26 41,814.19 3,498.80 20,232.57 7,785.92 12,446.66 Qtr.III 95,782.45 74,203.02 26,271.82 44,362.54 3,568.66 21,579.43 7,036.56 14,542.87 Qtr.IV 99,652.87 79,727.91 27,727.99 48,043.71 3,956.21 19,924.97 6,182.46 13,742.50 2010/11
Qtr.I 107,047.07 84,950.78 29,584.52 51,464.97 3,901.29 22,096.29 8,265.64 13,830.65 Qrt.II 116,681.78 89,464.56 31,725.01 53,879.49 3,860.06 27,217.22 9,369.75 17,847.47
Qtr.III 132,852.12 99,552.12 34,948.61 60,140.80 4,462.70 33,300.00 11,276.68 22,023.33 Qtr.IV 143,339.26 112,807.61 43,596.12 64,545.08 4,666.41 30,531.65 10,290.93 20,240.72 2011/12 Qtr.I 158,086.94 118,741.91 46,068.57 67,993.43 4,679.92 39,345.03 19,133.30 20,211.73 Qtr.II 164,606.16 119,630.04 42,879.96 71,584.79 5,165.29 44,976.12 17,307.05 27,669.07 Qrt.III 176,742.06 133,785.19 47,246.43 76,402.38 10,136.38 42,956.87 11,962.11 30,994.76 Qtr.IV 189,288.75 150,862.50 56,312.74 82,488.70 12,061.06 38,426.25 10,218.40 28,207.85
2012/13 Qtr.I 201,701.35 154,159.92 54,544.75 87,502.71 12,112.46 47,541.43 17,980.48 29,560.96 Qtr.II 212,060.37 163,588.98 57,524.67 93,134.26 12,930.05 48,471.40 12,778.13 35,693.26 Qtr.III 232,572.14 180,446.45 66,203.30 100,727.49 13,515.66 52,125.69 17,952.55 34,173.15 Qtr.IV 237,807.95 189,563.12 69,052.38 106,232.04 14,278.69 48,244.83 9,133.04 39,111.79
2013/14 Qtr.I 243,194.15 196,298.49 67,625.20 113,061.71 15,611.58 46,895.66 16,548.01 30,347.65 Qtr.II 257,802.58 208,266.07 69,579.58 122,757.75 15,928.74 49,536.52 14,339.95 35,196.57 Qtr.III 277,784.24 223,493.74 71,046.94 135,254.21 17,192.59 54,290.51 12,807.36 41,483.14 Qtr.IV 292,574.89 244,570.57 80,887.76 145,810.54 17,872.27 48,004.32 8,793.48 39,210.84
2014/15 Qtr.I 302,604.19 253,671.36 79,355.45 155,437.52 18,878.38 48,932.83 14,407.98 34,524.85 Qtr.II 323,537.99 267,697.42 82,081.55 164,291.18 21,324.70 55,840.58 13,882.20 41,958.38 Qtr.III 349,885.26 288,699.57 87,943.76 163,024.68 37,731.13 61,185.70 21,308.75 39,876.94 Qtr.IV 373,564.10 310,867.99 94,245.42 174,631.98 41,990.59 62,696.11 15,098.54 47,597.57
2015/16 Qtr.I 397,760.17 321,269.40 94,503.33 181,919.24 44,846.83 76,490.77 31,740.19 44,750.57 Qtr.II 413,662.32 333,107.99 95,784.79 192,284.18 45,039.02 80,554.32 25,739.39 54,814.93 Qtr.III 422,481.50 346,500.73 97,666.63 201,515.25 47,318.84 75,980.77 20,077.26 55,903.51 Qtr.IV 440,897.76 378,580.08 111,923.49 217,034.28 49,622.31 62,317.68 14,042.32 48,275.36
2016/17 Qtr.I 461,626.23 395,283.95 114,563.29 228,607.10 52,113.56 66,342.28 18,220.23 48,122.05 Qtr.II 498,193.86 422,592.69 122,551.62 244,021.95 56,019.12 75,601.17 15,628.13 59,973.04 Qtr.III 537,634.69 459,035.83 134,885.28 264,819.66 59,330.90 78,598.86 19,084.80 59,514.06 Qtr.IV 571,671.19 499,497.48 142,883.04 293,431.70 63,182.74 72,173.71 14,741.81 57,431.90
2017/18 Qtr.I 605,014.07 528,393.66 155,587.95 306,915.08 65,890.63 76,620.40 19,337.75 57,282.65 Qtr.II 639,712.39 557,368.95 161,094.75 324,547.41 71,726.79 82,343.44 16,680.94 65,662.50 Qtr.III 691,047.39 605,334.25 178,222.22 352,633.66 74,478.38 85,713.14 18,874.93 66,838.21 Qtr.IV 734,482.46 654,169.83 194,737.37 382,563.67 76,868.79 80,312.63 19,921.99 60,390.64
2018/19 Qtr.I 754,813.22 668,766.34 182,882.17 407,185.70 78,698.46 86,046.88 19,601.81 66,445.07 Qtr.II 799,642.99 696,994.43 185,405.32 430,123.97 81,465.14 102,648.56 23,783.26 78,865.30 Qtr.III 857,091.15 734,992.14 186,067.65 462,852.96 86,071.53 122,099.01 37,661.76 84,437.25 Qtr.IV 903,483.68 794,977.38 216,920.17 487,543.93 90,513.29 108,506.29 22,513.90 85,992.40
2019/20 Qtr.I 918,495.03 818,660.35 225,668.94 502,444.51 90,546.90 99,834.68 20,433.47 79,401.21 Qtr.II 968,377.71 852,170.77 233,018.82 529,431.05 89,720.91 116,206.94 30,939.51 85,267.44 Qtr.III 991,737.27 877,914.72 246,556.75 550,592.71 80,765.27 113,822.55 26,131.42 87,691.14 Qtr.IV 1,050,842.01 928,845.86 251,513.71 589,445.39 87,886.77 121,996.15 34,529.59 87,466.56
2020/21 Qtr.I 1,151,766.44 1,020,518.13 269,917.20 659,017.03 91,583.91 131,248.31 33,548.57 97,699.75
Qtr.II 1,210,840.93 1,069,724.72 282,154.64 698,415.14 89,154.94 141,116.21 31,702.07 109,414.14
Qtr.III 1,261,780.28 1,132,400.75 291,829.37 748,898.37 91,673.01 129,379.53 30,602.71 98,776.82
Qtr.IV 1,360,219.55 1,215,852.20 303,770.67 817,587.69 94,493.84 144,367.35 36,843.46 107,523.89

102 | Fourth Quarter 2020/21
National Bank of Ethiopia Quarterly Bulletin
Table 9: Reserve and Liquidity Position of the Commercial Banks, and Turnover of Deposits(In Millions of Birr)
End of Period
Reserve Requir- ments
1
Actual Rese.
2
Excess Rese. 3=2-1
Foreign Assets
4
Foreign Liabilities Actual Reserve+ Net For. Assets
7=2+4-5
Liqui- dity
Ratio 8
Ratio: Loans Adv.to Dep.
9
Debit Bal-
ance 10
Turn- Over of Deposit
11Total
5=6+7
Short Term
6
Long Term
72007/08
Qtr.I 5,365.08 13,865.27 8,500.19 6,994.50 2,113.06 2,113.06 - 18,746.71 41.22 42.72 76,830.15 2.32 Qtr.II 5,578.60 14,355.51 8,776.91 6,364.83 2,221.78 2,221.78 - 18,498.56 39.61 46.18 82,185.63 2.53 Qtr.III 5,835.20 12,463.60 6,628.40 8,129.78 2,384.41 2,384.41 - 18,208.97 37.21 54.30 90,495.30 2.76 Qtr.IV 8,925.94 17,795.25 8,869.31 8,026.85 2,301.87 2,301.87 - 23,520.23 46.55 56.47 90,493.46 2.76 2008/09
Qtr.I 9,526.40 17,673.90 8,147.50 7,726.62 2,315.51 2,315.51 - 23,085.01 41.90 54.16 93,429.37 2.58 Qtr.II 10,321.03 20,659.25 10,338.22 6,950.64 2,854.59 2,854.59 - 24,755.30 42.34 52.24 102,943.96 2.61 Qtr.III 10,959.83 21,886.74 10,926.91 8,093.58 2,801.54 2,801.54 - 27,178.78 44.34 50.75 105,249.56 2.50 Qtr.IV 10,986.73 23,690.72 12,703.99 9,219.66 3,076.51 3,076.51 - 29,833.87 47.51 52.98 124,300.65 3.15 2009/10
Qtr.I 11,398.99 27,119.02 15,720.02 9,172.96 3,856.62 3,856.62 - 32,435.36 48.58 51.27 119,082.48 2.93 Qtr.II 11,983.78 24,371.67 12,387.89 9,731.23 3,690.78 3,690.78 - 30,412.11 44.65 53.63 131,681.49 3.04 Qtr.III 12,695.80 26,921.09 14,225.29 12,949.12 3,960.93 3,960.93 - 35,909.28 50.53 54.01 140,393.61 3.01 Qtr.IV 13,973.16 25,217.08 11,243.92 15,060.75 3,254.28 3,254.28 - 37,023.55 47.14 52.64 135,342.10 2.72 2010/11
Qtr.I 14,425.68 28,768.06 14,342.38 19,245.97 4,246.06 4,246.06 - 43,767.97 52.16 50.04 142,217.22 2.86 Qrt.II 15,192.46 27,486.93 12,294.47 20,194.12 4,942.59 4,942.59 - 42,738.46 49.33 51.14 157,805.63 2.92
Qtr.III 17,642.76 31,482.17 13,839.40 21,148.87 5,595.24 5,595.24 - 47,035.80 48.70 51.76 182,812.16 2.73 Qtr.IV 19,025.55 34,282.97 15,257.42 28,394.16 5,715.48 5,715.48 - 56,961.65 53.00 51.32 195,452.30 2.84 2011/12 Qtr.I 20,126.73 34,514.38 14,387.65 22,565.30 6,441.17 6,441.17 - 50,638.52 43.68 52.65 (9,492.66) (0.11) Qtr.II 21,519.95 30,154.47 8,634.53 23,089.59 8,419.69 8,419.69 - 44,824.38 37.92 55.15 (2,172.31) (0.02)Qrt.III 23,815.67 17,652.45 (6,163.22) 28,640.04 7,392.24 7,392.24 - 38,900.24 29.94 60.46 17,694.84 0.19 Qtr.IV 25,253.90 29,039.93 3,786.03 24,017.57 5,484.21 5,484.21 - 47,573.29 33.72 61.61 4,861.45 0.05
2012/13 Qtr.I 26,887.04 27,882.48 995.43 20,182.74 5,873.98 5,873.98 - 42,191.23 27.86 59.18 1,243.93 0.01 Qtr.II 28,886.85 33,108.11 4,221.25 19,475.22 6,078.30 6,078.30 - 46,505.03 29.49 58.13 (393.14) (0.00)Qtr.III 31,682.68 32,417.53 734.85 23,412.02 6,038.08 6,038.08 - 49,791.47 28.61 59.23 9,287.24 0.08 Qtr.IV 33,194.01 30,375.31 (2,818.70) 28,509.18 7,515.18 7,515.18 - 51,369.31 27.80 59.17 17,366.28 0.15
2013/14 Qtr.I 11,141.57 31,747.72 20,606.14 22,706.08 7,787.68 7,787.68 - 46,666.12 23.76 57.70 9,229.02 0.08 Qtr.II 11,623.52 29,413.17 17,789.65 20,170.98 7,933.50 7,933.50 - 41,650.65 20.86 59.24 5,710.64 0.05 Qtr.III 12,841.04 34,921.78 22,080.74 21,162.46 7,843.13 7,843.13 - 48,241.10 22.27 59.34 175.83 0.00 Qtr.IV 13,653.84 35,672.30 22,018.46 27,253.50 7,995.09 7,995.09 - 54,930.71 23.40 58.46 4,339.82 0.03
2014/15 Qtr.I 14,375.89 38,690.72 24,314.83 19,597.01 7,599.61 7,599.61 - 50,688.12 19.88 57.30 2,953.29 0.02 Qtr.II 14,936.11 35,148.79 20,212.68 18,800.84 7,784.85 7,784.85 - 46,164.79 17.77 59.30 6,009.59 0.04 Qtr.III 16,089.21 35,280.66 19,191.45 15,862.13 7,985.81 7,985.81 - 43,156.97 15.51 61.63 18,711.98 0.13 Qtr.IV 17,277.43 42,342.37 25,064.94 15,924.15 8,326.57 8,326.57 - 49,939.95 16.80 60.16 15,260.52 0.10
2015/16 Qtr.I 18,154.75 39,809.59 21,654.84 15,463.04 8,351.74 8,351.74 - 46,920.90 14.65 58.02 12,689.06 0.07 Qtr.II 18,915.62 37,943.40 19,027.78 18,368.24 9,418.30 9,418.30 - 46,893.34 14.39 59.75 21,979.28 0.13 Qtr.III 19,737.07 40,401.93 20,664.86 21,316.42 10,021.13 10,021.13 - 51,697.22 15.38 60.76 21,123.17 0.12 Qtr.IV 21,091.12 50,905.91 29,814.79 20,898.27 9,880.50 9,880.50 - 61,923.67 17.26 59.00 11,998.99 0.07
2016/17 Qtr.I 21,607.98 53,728.78 32,120.80 21,116.01 10,224.60 10,224.60 - 64,620.18 16.58 59.07 9,035.88 0.05 Qtr.II 23,442.03 54,499.76 31,057.72 20,370.84 9,442.47 9,442.47 - 65,428.12 15.95 57.14 1,283.95 0.01 Qtr.III 25,206.43 64,854.52 39,648.09 20,975.60 9,775.10 9,775.10 - 76,055.03 17.20 57.42 6,627.15 0.03 Qtr.IV 26,950.85 75,305.69 48,354.85 24,876.54 10,818.77 10,818.77 - 89,363.46 18.71 56.11 1,282.86 0.01
2017/18 Qtr.I 28,587.02 81,683.92 53,096.91 25,253.39 11,920.65 11,920.65 - 95,016.66 18.28 54.86 (15,668.39) (0.07) Qtr.II 30,398.50 68,091.41 37,692.91 26,326.86 15,190.78 15,190.78 - 79,227.48 14.73 54.20 (443.57) (0.00) Qtr.III 32,735.93 74,352.05 41,616.12 24,664.20 14,436.48 14,436.48 - 84,579.78 14.43 53.77 (1,452.41) (0.01)Qtr.IV 34,423.80 89,611.48 55,187.68 25,121.57 14,504.75 14,504.75 - 100,228.29 16.02 55.08 (7,299.45) (0.03)
2018/19 Qtr.I 36,595.29 91,062.85 54,467.56 30,835.45 14,163.89 14,163.89 - 107,734.41 16.13 54.41 (7,494.41) (0.03) Qtr.II 38,073.40 85,123.08 47,049.67 28,357.05 15,913.29 15,913.29 - 97,566.83 14.26 55.87 2,464.99 0.01 Qtr.III 39,995.88 82,819.61 42,823.73 26,880.84 17,251.34 17,251.34 - 92,449.11 12.90 57.40 8,337.54 0.03 Qtr.IV 41,140.08 118,506.49 77,366.41 28,543.82 18,006.38 18,006.38 - 129,043.93 17.23 58.71 (26,020.41) (0.09)
2019/20 Qtr.I 43,740.81 116,740.09 72,999.28 25,980.84 18,605.21 18,605.21 - 124,115.72 15.70 57.37 2,290.04 0.01 Qtr.II 45,358.63 117,120.70 71,762.07 23,973.08 21,056.84 21,056.84 - 120,036.93 14.67 60.26 6,788.45 0.02 Qtr.III 47,088.05 114,998.82 67,910.77 24,606.29 23,358.51 23,358.51 - 116,246.59 13.63 62.54 30,715.28 0.09 Qtr.IV 49,370.84 136,738.41 87,367.57 35,116.52 24,579.24 24,579.24 - 147,275.68 16.61 62.77 (11,125.89) (0.03)
2020/21 Qtr.I 53,516.97 184,698.60 131,181.63 33,204.14 27,650.16 27,650.16 - 190,252.58 19.61 60.67 (31,821.59) (0.08) Qtr.II 57,514.76 146,676.51 89,161.75 43,367.05 30,184.61 30,184.61 - 159,858.95 15.28 59.88 (28,127.24) (0.07) Qtr.III 59,747.70 136,453.39 76,705.69 55,078.76 32,715.75 32,715.75 - 158,816.40 14.54 62.09 (5,192.09) (0.01) Qtr.IV 64,445.41 131,471.76 67,026.34 76,945.12 33,851.44 33,851.44 - 174,565.43 14.85 61.15 (17,860.57) (0.04)
1. Actual Reserve: Reserves with the National Bank of Ethiopia Plus Cash in Hand (Local Currency). 2. Liquidity Ratio: Actual Reserves + Foreign Asset, net of short term liabilities, divided by Demand Deposits, net.“ 3. Ratio of Loans and Advances to Deposits: Gross Commercial Bank Loans and discounts plus credit to Central Government divided by Gross Demand Deposits (of private and others) + Demand Deposits of domestic banks + Time and Savings Deposits + Government Deposits with commercial banks.”4. Debit Balance: Total Debit Balance less debit against the deposits of the commercial banks.5. Turnover of Deposits: Debit Balances divided by Gross Demand Deposits of private and others + Government Deposits.

Fourth Quarter 2020/21 | 103
National Bank of Ethiopia Quarterly Bulletin
Table 9: Reserve and Liquidity Position of the Commercial Banks, and Turnover of Deposits(In Millions of Birr)
End of Period
Reserve Requir- ments
1
Actual Rese.
2
Excess Rese. 3=2-1
Foreign Assets
4
Foreign Liabilities Actual Reserve+ Net For. Assets
7=2+4-5
Liqui- dity
Ratio 8
Ratio: Loans Adv.to Dep.
9
Debit Bal-
ance 10
Turn- Over of Deposit
11Total
5=6+7
Short Term
6
Long Term
72007/08
Qtr.I 5,365.08 13,865.27 8,500.19 6,994.50 2,113.06 2,113.06 - 18,746.71 41.22 42.72 76,830.15 2.32 Qtr.II 5,578.60 14,355.51 8,776.91 6,364.83 2,221.78 2,221.78 - 18,498.56 39.61 46.18 82,185.63 2.53 Qtr.III 5,835.20 12,463.60 6,628.40 8,129.78 2,384.41 2,384.41 - 18,208.97 37.21 54.30 90,495.30 2.76 Qtr.IV 8,925.94 17,795.25 8,869.31 8,026.85 2,301.87 2,301.87 - 23,520.23 46.55 56.47 90,493.46 2.76 2008/09
Qtr.I 9,526.40 17,673.90 8,147.50 7,726.62 2,315.51 2,315.51 - 23,085.01 41.90 54.16 93,429.37 2.58 Qtr.II 10,321.03 20,659.25 10,338.22 6,950.64 2,854.59 2,854.59 - 24,755.30 42.34 52.24 102,943.96 2.61 Qtr.III 10,959.83 21,886.74 10,926.91 8,093.58 2,801.54 2,801.54 - 27,178.78 44.34 50.75 105,249.56 2.50 Qtr.IV 10,986.73 23,690.72 12,703.99 9,219.66 3,076.51 3,076.51 - 29,833.87 47.51 52.98 124,300.65 3.15 2009/10
Qtr.I 11,398.99 27,119.02 15,720.02 9,172.96 3,856.62 3,856.62 - 32,435.36 48.58 51.27 119,082.48 2.93 Qtr.II 11,983.78 24,371.67 12,387.89 9,731.23 3,690.78 3,690.78 - 30,412.11 44.65 53.63 131,681.49 3.04 Qtr.III 12,695.80 26,921.09 14,225.29 12,949.12 3,960.93 3,960.93 - 35,909.28 50.53 54.01 140,393.61 3.01 Qtr.IV 13,973.16 25,217.08 11,243.92 15,060.75 3,254.28 3,254.28 - 37,023.55 47.14 52.64 135,342.10 2.72 2010/11
Qtr.I 14,425.68 28,768.06 14,342.38 19,245.97 4,246.06 4,246.06 - 43,767.97 52.16 50.04 142,217.22 2.86 Qrt.II 15,192.46 27,486.93 12,294.47 20,194.12 4,942.59 4,942.59 - 42,738.46 49.33 51.14 157,805.63 2.92
Qtr.III 17,642.76 31,482.17 13,839.40 21,148.87 5,595.24 5,595.24 - 47,035.80 48.70 51.76 182,812.16 2.73 Qtr.IV 19,025.55 34,282.97 15,257.42 28,394.16 5,715.48 5,715.48 - 56,961.65 53.00 51.32 195,452.30 2.84 2011/12 Qtr.I 20,126.73 34,514.38 14,387.65 22,565.30 6,441.17 6,441.17 - 50,638.52 43.68 52.65 (9,492.66) (0.11) Qtr.II 21,519.95 30,154.47 8,634.53 23,089.59 8,419.69 8,419.69 - 44,824.38 37.92 55.15 (2,172.31) (0.02)Qrt.III 23,815.67 17,652.45 (6,163.22) 28,640.04 7,392.24 7,392.24 - 38,900.24 29.94 60.46 17,694.84 0.19 Qtr.IV 25,253.90 29,039.93 3,786.03 24,017.57 5,484.21 5,484.21 - 47,573.29 33.72 61.61 4,861.45 0.05
2012/13 Qtr.I 26,887.04 27,882.48 995.43 20,182.74 5,873.98 5,873.98 - 42,191.23 27.86 59.18 1,243.93 0.01 Qtr.II 28,886.85 33,108.11 4,221.25 19,475.22 6,078.30 6,078.30 - 46,505.03 29.49 58.13 (393.14) (0.00)Qtr.III 31,682.68 32,417.53 734.85 23,412.02 6,038.08 6,038.08 - 49,791.47 28.61 59.23 9,287.24 0.08 Qtr.IV 33,194.01 30,375.31 (2,818.70) 28,509.18 7,515.18 7,515.18 - 51,369.31 27.80 59.17 17,366.28 0.15
2013/14 Qtr.I 11,141.57 31,747.72 20,606.14 22,706.08 7,787.68 7,787.68 - 46,666.12 23.76 57.70 9,229.02 0.08 Qtr.II 11,623.52 29,413.17 17,789.65 20,170.98 7,933.50 7,933.50 - 41,650.65 20.86 59.24 5,710.64 0.05 Qtr.III 12,841.04 34,921.78 22,080.74 21,162.46 7,843.13 7,843.13 - 48,241.10 22.27 59.34 175.83 0.00 Qtr.IV 13,653.84 35,672.30 22,018.46 27,253.50 7,995.09 7,995.09 - 54,930.71 23.40 58.46 4,339.82 0.03
2014/15 Qtr.I 14,375.89 38,690.72 24,314.83 19,597.01 7,599.61 7,599.61 - 50,688.12 19.88 57.30 2,953.29 0.02 Qtr.II 14,936.11 35,148.79 20,212.68 18,800.84 7,784.85 7,784.85 - 46,164.79 17.77 59.30 6,009.59 0.04 Qtr.III 16,089.21 35,280.66 19,191.45 15,862.13 7,985.81 7,985.81 - 43,156.97 15.51 61.63 18,711.98 0.13 Qtr.IV 17,277.43 42,342.37 25,064.94 15,924.15 8,326.57 8,326.57 - 49,939.95 16.80 60.16 15,260.52 0.10
2015/16 Qtr.I 18,154.75 39,809.59 21,654.84 15,463.04 8,351.74 8,351.74 - 46,920.90 14.65 58.02 12,689.06 0.07 Qtr.II 18,915.62 37,943.40 19,027.78 18,368.24 9,418.30 9,418.30 - 46,893.34 14.39 59.75 21,979.28 0.13 Qtr.III 19,737.07 40,401.93 20,664.86 21,316.42 10,021.13 10,021.13 - 51,697.22 15.38 60.76 21,123.17 0.12 Qtr.IV 21,091.12 50,905.91 29,814.79 20,898.27 9,880.50 9,880.50 - 61,923.67 17.26 59.00 11,998.99 0.07
2016/17 Qtr.I 21,607.98 53,728.78 32,120.80 21,116.01 10,224.60 10,224.60 - 64,620.18 16.58 59.07 9,035.88 0.05 Qtr.II 23,442.03 54,499.76 31,057.72 20,370.84 9,442.47 9,442.47 - 65,428.12 15.95 57.14 1,283.95 0.01 Qtr.III 25,206.43 64,854.52 39,648.09 20,975.60 9,775.10 9,775.10 - 76,055.03 17.20 57.42 6,627.15 0.03 Qtr.IV 26,950.85 75,305.69 48,354.85 24,876.54 10,818.77 10,818.77 - 89,363.46 18.71 56.11 1,282.86 0.01
2017/18 Qtr.I 28,587.02 81,683.92 53,096.91 25,253.39 11,920.65 11,920.65 - 95,016.66 18.28 54.86 (15,668.39) (0.07) Qtr.II 30,398.50 68,091.41 37,692.91 26,326.86 15,190.78 15,190.78 - 79,227.48 14.73 54.20 (443.57) (0.00) Qtr.III 32,735.93 74,352.05 41,616.12 24,664.20 14,436.48 14,436.48 - 84,579.78 14.43 53.77 (1,452.41) (0.01)Qtr.IV 34,423.80 89,611.48 55,187.68 25,121.57 14,504.75 14,504.75 - 100,228.29 16.02 55.08 (7,299.45) (0.03)
2018/19 Qtr.I 36,595.29 91,062.85 54,467.56 30,835.45 14,163.89 14,163.89 - 107,734.41 16.13 54.41 (7,494.41) (0.03) Qtr.II 38,073.40 85,123.08 47,049.67 28,357.05 15,913.29 15,913.29 - 97,566.83 14.26 55.87 2,464.99 0.01 Qtr.III 39,995.88 82,819.61 42,823.73 26,880.84 17,251.34 17,251.34 - 92,449.11 12.90 57.40 8,337.54 0.03 Qtr.IV 41,140.08 118,506.49 77,366.41 28,543.82 18,006.38 18,006.38 - 129,043.93 17.23 58.71 (26,020.41) (0.09)
2019/20 Qtr.I 43,740.81 116,740.09 72,999.28 25,980.84 18,605.21 18,605.21 - 124,115.72 15.70 57.37 2,290.04 0.01 Qtr.II 45,358.63 117,120.70 71,762.07 23,973.08 21,056.84 21,056.84 - 120,036.93 14.67 60.26 6,788.45 0.02 Qtr.III 47,088.05 114,998.82 67,910.77 24,606.29 23,358.51 23,358.51 - 116,246.59 13.63 62.54 30,715.28 0.09 Qtr.IV 49,370.84 136,738.41 87,367.57 35,116.52 24,579.24 24,579.24 - 147,275.68 16.61 62.77 (11,125.89) (0.03)
2020/21 Qtr.I 53,516.97 184,698.60 131,181.63 33,204.14 27,650.16 27,650.16 - 190,252.58 19.61 60.67 (31,821.59) (0.08) Qtr.II 57,514.76 146,676.51 89,161.75 43,367.05 30,184.61 30,184.61 - 159,858.95 15.28 59.88 (28,127.24) (0.07) Qtr.III 59,747.70 136,453.39 76,705.69 55,078.76 32,715.75 32,715.75 - 158,816.40 14.54 62.09 (5,192.09) (0.01) Qtr.IV 64,445.41 131,471.76 67,026.34 76,945.12 33,851.44 33,851.44 - 174,565.43 14.85 61.15 (17,860.57) (0.04)
1. Actual Reserve: Reserves with the National Bank of Ethiopia Plus Cash in Hand (Local Currency). 2. Liquidity Ratio: Actual Reserves + Foreign Asset, net of short term liabilities, divided by Demand Deposits, net.“ 3. Ratio of Loans and Advances to Deposits: Gross Commercial Bank Loans and discounts plus credit to Central Government divided by Gross Demand Deposits (of private and others) + Demand Deposits of domestic banks + Time and Savings Deposits + Government Deposits with commercial banks.”4. Debit Balance: Total Debit Balance less debit against the deposits of the commercial banks.5. Turnover of Deposits: Debit Balances divided by Gross Demand Deposits of private and others + Government Deposits.
Table 10: Circulating Notes and Coins by Denomination(In Millions of Birr)
End of Period
Value of
Notes &
Coins
Denomination of Notes: Birr Denominations of Coins: Cents
Total Value
(Notes) 1 5 10 50 100 200
Total Value
(Coins) 1 5 10 25 50 100
(coin)
2008/09 Qtr.I 6,788.5 6,591.0 417.0 162.8 2,456.7 3,554.5 13,600.0 197.5 0.8 30.4 69.6 37.8 58.9 Qtr.II 7,177.9 6,974.0 441.7 259.8 2,514.7 3,757.7 14,952.0 203.9 0.8 31.3 71.5 39.4 60.8 Qtr.III 7,452.4 7,242.4 459.8 268.9 2,581.7 3,931.9 16,576.4 210.1 0.8 32.2 73.0 41.3 62.8 Qtr.IV 7,034.6 6,818.9 449.0 245.7 2,227.0 3,897.3 17,099.3 215.7 0.8 33.2 74.3 42.8 64.72009/10
Qtr.I 6,424.3 6,203.5 426.3 231.8 2,023.7 3,521.7 16,612.0 220.7 0.9 33.9 75.6 44.1 66.2 Qtr.II 6,689.4 6,464.9 458.5 258.6 2,023.7 3,724.2 19,321.9 224.5 0.9 34.3 76.8 45.2 67.3 Qtr.III 7,727.5 7,497.9 466.2 364.7 2,943.1 3,723.9 20,605.6 229.6 0.9 34.8 78.9 45.9 69.2 Qtr.IV 7,282.1 7,046.3 462.6 356.9 2,842.9 3,383.9 21,530.6 235.8 0.9 35.4 80.6 46.6 72.32010/11
Qtr.I 7,303.7 6,960.8 482.3 366.6 2,618.5 3,493.4 23,316.4 342.9 1.0 36.2 83.5 52.0 127.7 42.5 Qtr.II 8,178.7 7,835.2 404.1 223.3 3,124.9 4,082.8 25,896.0 343.5 1.0 36.2 83.6 50.9 122.9 49.0 Qtr.III 9,673.9 9,396.0 471.9 310.0 4,012.5 4,601.5 27,803.9 278.0 1.0 36.3 83.9 26.1 73.1 57.6 Qtr.IV 8,781.1 8,485.1 482.9 293.4 3,425.0 4,283.8 30,363.2 296.0 0.8 37.0 86.0 30.1 76.3 65.9
2011/12 Qtr.I 9,219.4 8,912.8 486.5 287.1 3,526.7 4,612.6 29,562.4 306.6 0.8 37.2 86.8 31.0 77.6 73.2 Qtr.II 10,552.7 10,233.0 496.5 287.4 3,563.9 5,885.1 31,503.3 319.7 0.8 37.2 87.0 32.4 81.3 80.9Qtr.III 13,387.9 13,060.6 661.5 659.5 4,605.1 7,134.5 31,330.1 327.3 0.8 37.2 87.7 33.9 84.5 83.1Qtr.IV 5,100.8 4,767.1 626.3 514.8 1,144.0 2,482.0 40,701.3 333.7 0.8 37.3 88.4 35.2 86.4 85.6
2012/13 Qtr.I 6,211.5 5,963.9 677.6 626.9 1,545.6 3,113.7 40,027.1 247.6 0.8 27.3 69.6 6.9 55.8 87.3Qtr II 9,019.3 8,764.0 700.2 465.3 2,533.4 5,065.1 41,963.6 255.3 0.8 28.2 70.7 8.9 58.6 88.1Qtr II 11,257.6 10,985.5 614.7 513.6 3,368.2 6,488.9 43,080.0 272.2 0.8 28.5 73.8 14.2 66.9 88.0Qtr.IV 11,586.7 11,225.8 659.6 533.0 3,430.7 6,602.4 43,407.0 360.9 0.8 34.2 84.0 57.7 96.0 88.3
2013/14 Qtr.I 11,262.4 10,893.1 683.6 589.5 3,222.9 6,397.1 39,329.5 369.3 0.8 34.2 84.9 59.0 98.1 92.2Qtr.II 11,472.5 11,098.5 692.6 609.2 3,321.6 6,475.1 41,023.4 374.0 0.8 34.4 85.3 59.6 99.1 94.9Qtr.III 11,029.7 10,617.7 659.9 867.2 2,421.4 6,669.2 53,612.6 412.0 0.8 39.3 94.9 61.9 100.1 114.9Qtr.IV 11,108.5 10,683.8 634.9 906.9 2,368.8 6,773.2 53,364.4 424.8 0.8 39.5 95.4 62.8 101.4 124.8
2014/15 Qtr.I 10,917.9 10,477.9 618.3 964.8 2,339.5 6,555.3 52,928.7 440.1 0.8 39.7 95.9 63.9 102.9 136.8Qtr.II 12,314.8 11,858.1 602.5 1,097.3 2,550.7 7,607.6 58,526.7 456.6 0.8 39.9 96.2 64.5 104.0 151.2Qtr.III 12,693.4 12,212.3 589.0 1,161.0 2,695.0 7,767.3 61,776.9 481.1 0.8 40.0 96.7 65.6 105.9 172.1Qtr.IV 12,383.0 11,871.1 557.8 1,177.8 2,675.6 7,459.8 62,975.8 511.9 0.8 40.1 97.1 66.4 107.3 200.1
2015/16 Qtr.I 12,327.4 11,777.6 538.9 1,209.0 2,725.7 7,304.0 62,536.1 549.8 0.8 40.3 97.6 67.1 108.6 235.4Qtr.II 12,863.1 12,272.6 507.3 1,306.8 2,885.2 7,573.2 65,084.8 590.5 0.8 40.5 97.9 67.8 109.8 273.7Qtr.III 12,624.2 11,979.8 479.6 1,325.7 2,807.1 7,367.4 67,752.0 644.4 0.8 40.6 98.3 68.3 110.7 325.6QIV 13,164.0 12,466.9 455.8 1,337.4 2,766.9 7,906.8 69,600.9 697.1 0.8 40.7 98.4 68.7 111.5 376.9
2016/17 Qtr.I 14,241.1 13,500.0 439.3 1,355.6 2,793.4 8,911.7 71,743.1 741.0 0.8 40.9 98.7 69.4 112.5 418.7QII 15,014.6 14,224.9 425.9 1,456.3 2,925.0 9,417.7 75,404.3 789.6 0.8 41.0 98.9 69.9 113.5 465.6QIII 15,312.7 14,470.9 411.7 1,461.3 2,982.7 9,615.2 77,070.3 841.8 0.8 41.1 99.1 70.6 114.7 515.5QIV 15,442.8 14,554.8 403.8 1,418.7 3,010.1 9,722.2 78,972.8 888.0 0.8 41.2 99.4 71.4 115.8 559.3
2017/18 Qtr.I 15,423.3 14,497.0 396.4 1,396.7 3,025.7 9,678.2 79,709.5 926.3 0.8 41.3 99.6 72.0 116.8 595.8QII 16,995.0 16,025.5 393.8 1,506.7 3,423.5 10,701.5 89,111.8 969.5 0.8 41.3 99.7 72.4 117.7 637.6QIII 17,419.4 16,400.5 388.2 1,507.8 3,487.4 11,017.1 95,189.3 1,018.9 0.8 41.4 99.8 72.7 118.6 685.5QIV 17,568.5 16,508.1 384.1 1,467.8 3,512.8 11,143.4 95,512.5 1,060.4 0.8 41.4 99.8 73.0 118.9 726.5
2018/19 Qtr.I 17,125.8 16,038.5 380.4 1,464.1 3,497.5 10,696.4 93,919.9 1,087.3 0.8 41.4 99.8 73.2 119.9 752.2QII 18,732.9 17,612.0 378.1 1,525.6 3,764.1 11,944.2 101,784.7 1,120.9 0.8 41.5 99.7 73.5 120.5 784.9QIII 18,695.3 17,551.8 375.4 1,533.0 3,747.1 11,896.4 106,771.2 1,143.5 0.8 41.5 99.7 73.4 120.6 807.5QIV 18,185.2 17,022.6 374.5 1,535.7 3,724.9 11,387.5 103,782.4 1,162.5 0.8 41.4 99.6 73.4 120.7 826.5
2019/20 Qtr.I 18,032.3 16,859.3 374.8 1,551.8 3,766.4 11,166.3 106,111.5 1,173.0 0.8 41.5 99.5 73.3 121.0 836.9QII 18,740.4 17,559.4 374.2 1,628.5 4,030.4 11,526.2 109,497.7 1,181.0 0.8 41.5 99.5 73.4 121.2 844.6QIII 19,935.3 18,743.4 376.4 1,709.2 4,226.1 12,431.6 119,337.4 1,192.0 0.8 41.4 99.5 73.3 122.5 854.4QIV 19,859.4 18,664.8 375.8 1,674.6 4,389.0 12,225.4 120,817.5 1,194.6 0.8 41.5 99.5 73.2 123.1 856.5
2020/21 Qtr.I 18,165.6 16,968.7 375.8 1,520.3 4,430.4 10,642.3 106,393.0 0.0 1,196.9 0.8 41.4 99.4 73.1 123.3 858.7Qtr.II 82,325.3 81,125.6 373.0 1,538.1 6,611.0 15,844.8 56,691.9 56,758.8 1,199.7 0.8 41.4 99.4 73.1 123.2 861.7
QIII 159,636.9 158,424.2 372.7 1,605.5 6,789.7 14,970.3 59,977.3 74,708.8 1,212.6 0.8 41.4 99.4 73.0 123.8 874.1
QIV 163,861.0 162,638.3 372.8 1,574.6 6,180.0 14,058.6 60,268.5 80,183.9 1,222.7 0.8 41.4 99.4 73.0 124.3 883.7

104 | Fourth Quarter 2020/21
National Bank of Ethiopia Quarterly BulletinTable 11: Interest Rate StructuresA. Lending rates (by CBE and specialized banks)
SectorThrough September 30, 1992 "Oct. 1, 1992-
Aug 31, 1994""Sept.1,1994- Jan. 1, 1995"Cooperatives State Private
Agriculture 5 6 7 11.0-12 Lending to all sectors 14-15 Industry, mining, power, and water resources 6 8 9 13.0-14 Domestic trade
6 8 9.5 14.0-15 Lending to the Central Gov't 12-13
Transport and communications 6 8 8 13.0-14
Export trade 6 6 6 13.0-14 "NBE Lending to: CBEs/ Discount Rate/" 10.5
Import trade (agricultural inputs) 5 6 7 14.0-15 Import trade (other) 6 8 9.5 14.0-15 Hotels and tourism 6 8 9 14.0-15 Other Financial Inst. 10.5 Construction 6 8 9 11.0-12 Housing (1) purchase 6 6 8 11.0-12 Interbank Rate 10(2) construction 4.5 4.5 7 11.0-12 Central Government -- 3.0-5.0 -- 12.0-13 Banks and financial institutions -- 2.5-4.5 -- 10.0 Personal loans -- -- 10 14.0-15
B. Deposit rates
Deposit rates Through September 30, 1992
"Oct. 1, 1992- Aug 31, 1994"
"Sept.1,1994- Jan. 1, 1995"
1.Time deposits 30 days notice -- 10.5 10.5 3 months to less than 6 months -- 10.5 10.5 6 months to less than 12 months -- 11 11 1 year to less than 2 years Differed by 11.5 11.5 2 years and above ownership 12 12
and maturityMemorandum Items:Rate differentials for 1 year and over Financial institutions (1 year): 1.0 Gov'nt-owned under takings (1 year): 1.0 Individuals, savings and credit cooperatives;self-help organizations: 1 year 6.0 2 years 6.5 3 years 7.0 5 years 7.5Others:1 year 4.0 2 years 0.8 3 years 5.0 5 years 5.5
2. Savings deposits"Differed by
ownership and maturity"
10 10
Rate differentials:Individuals, savings and credit cooperatives;self-help organizations: Up to Br. 100,000 6.0 In excess of Br. 100,000 2.0
C. Minimum and Maximum Interest Rates
Minimum and Maximum Interest Rates
"Jan. 2, 1995-
Nov. 30, 1995"
"Dec. 1, 1995-
May 30, 1996"
"June 1, 1996- Sep. 15,
1996"
"Sep.16,1996- Dec. 31,1997"
"Jan. 1,1998- Mar. 3, 2002"
"Mar. 4,2002- 01/08/2002"
"Aug. 2002 to 07/02/2005"
"08/02/2005 04/07/2007"
"04/07/2007 30/11/2010"
"01/12/2010 to 10-Oct-2017"
"11/10/2017 to todate"
and Savings Deposits 10 11 10 7 6 3 3 3 4 5 7
Maximum lending rate by commercial
banks & other finan-cial institutions, 15 16 15 10.5 Market Market Market Market Market Market Market
except for central government loan determined deter-
mined determined deter-mined determined determined determined
Central Govern-ment loan 12 12 12 12 6 6 5 3 3 3 3
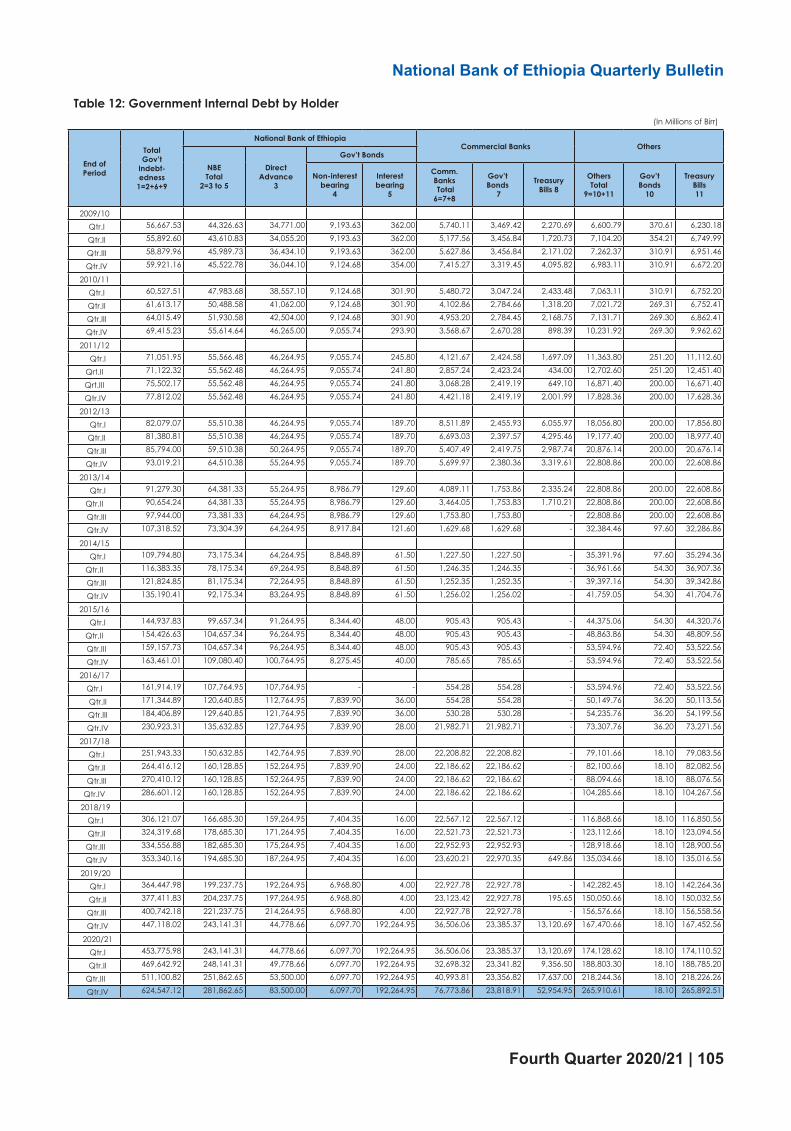
Fourth Quarter 2020/21 | 105
National Bank of Ethiopia Quarterly BulletinTable 11: Interest Rate StructuresA. Lending rates (by CBE and specialized banks)
SectorThrough September 30, 1992 "Oct. 1, 1992-
Aug 31, 1994""Sept.1,1994- Jan. 1, 1995"Cooperatives State Private
Agriculture 5 6 7 11.0-12 Lending to all sectors 14-15 Industry, mining, power, and water resources 6 8 9 13.0-14 Domestic trade
6 8 9.5 14.0-15 Lending to the Central Gov't 12-13
Transport and communications 6 8 8 13.0-14
Export trade 6 6 6 13.0-14 "NBE Lending to: CBEs/ Discount Rate/" 10.5
Import trade (agricultural inputs) 5 6 7 14.0-15 Import trade (other) 6 8 9.5 14.0-15 Hotels and tourism 6 8 9 14.0-15 Other Financial Inst. 10.5 Construction 6 8 9 11.0-12 Housing (1) purchase 6 6 8 11.0-12 Interbank Rate 10(2) construction 4.5 4.5 7 11.0-12 Central Government -- 3.0-5.0 -- 12.0-13 Banks and financial institutions -- 2.5-4.5 -- 10.0 Personal loans -- -- 10 14.0-15
B. Deposit rates
Deposit rates Through September 30, 1992
"Oct. 1, 1992- Aug 31, 1994"
"Sept.1,1994- Jan. 1, 1995"
1.Time deposits 30 days notice -- 10.5 10.5 3 months to less than 6 months -- 10.5 10.5 6 months to less than 12 months -- 11 11 1 year to less than 2 years Differed by 11.5 11.5 2 years and above ownership 12 12
and maturityMemorandum Items:Rate differentials for 1 year and over Financial institutions (1 year): 1.0 Gov'nt-owned under takings (1 year): 1.0 Individuals, savings and credit cooperatives;self-help organizations: 1 year 6.0 2 years 6.5 3 years 7.0 5 years 7.5Others:1 year 4.0 2 years 0.8 3 years 5.0 5 years 5.5
2. Savings deposits"Differed by
ownership and maturity"
10 10
Rate differentials:Individuals, savings and credit cooperatives;self-help organizations: Up to Br. 100,000 6.0 In excess of Br. 100,000 2.0
C. Minimum and Maximum Interest Rates
Minimum and Maximum Interest Rates
"Jan. 2, 1995-
Nov. 30, 1995"
"Dec. 1, 1995-
May 30, 1996"
"June 1, 1996- Sep. 15,
1996"
"Sep.16,1996- Dec. 31,1997"
"Jan. 1,1998- Mar. 3, 2002"
"Mar. 4,2002- 01/08/2002"
"Aug. 2002 to 07/02/2005"
"08/02/2005 04/07/2007"
"04/07/2007 30/11/2010"
"01/12/2010 to 10-Oct-2017"
"11/10/2017 to todate"
and Savings Deposits 10 11 10 7 6 3 3 3 4 5 7
Maximum lending rate by commercial
banks & other finan-cial institutions, 15 16 15 10.5 Market Market Market Market Market Market Market
except for central government loan determined deter-
mined determined deter-mined determined determined determined
Central Govern-ment loan 12 12 12 12 6 6 5 3 3 3 3
Table 12: Government Internal Debt by Holder(In Millions of Birr)
End of Period
Total Gov’t
Indebt-edness
1=2+6+9
National Bank of EthiopiaCommercial Banks Others
NBE Total
2=3 to 5
Direct Advance
3
Gov’t Bonds
Non-interest bearing
4
Interest bearing
5
Comm. Banks Total 6=7+8
Gov’t Bonds
7
Treasury Bills 8
Others Total
9=10+11
Gov’t Bonds
10
Treasury Bills 11
2009/10 Qtr.I 56,667.53 44,326.63 34,771.00 9,193.63 362.00 5,740.11 3,469.42 2,270.69 6,600.79 370.61 6,230.18
Qtr.II 55,892.60 43,610.83 34,055.20 9,193.63 362.00 5,177.56 3,456.84 1,720.73 7,104.20 354.21 6,749.99
Qtr.III 58,879.96 45,989.73 36,434.10 9,193.63 362.00 5,627.86 3,456.84 2,171.02 7,262.37 310.91 6,951.46
Qtr.IV 59,921.16 45,522.78 36,044.10 9,124.68 354.00 7,415.27 3,319.45 4,095.82 6,983.11 310.91 6,672.20
2010/11 Qtr.I 60,527.51 47,983.68 38,557.10 9,124.68 301.90 5,480.72 3,047.24 2,433.48 7,063.11 310.91 6,752.20
Qtr.II 61,613.17 50,488.58 41,062.00 9,124.68 301.90 4,102.86 2,784.66 1,318.20 7,021.72 269.31 6,752.41
Qtr.III 64,015.49 51,930.58 42,504.00 9,124.68 301.90 4,953.20 2,784.45 2,168.75 7,131.71 269.30 6,862.41
Qtr.IV 69,415.23 55,614.64 46,265.00 9,055.74 293.90 3,568.67 2,670.28 898.39 10,231.92 269.30 9,962.62
2011/12 Qtr.I 71,051.95 55,566.48 46,264.95 9,055.74 245.80 4,121.67 2,424.58 1,697.09 11,363.80 251.20 11,112.60
Qrt.II 71,122.32 55,562.48 46,264.95 9,055.74 241.80 2,857.24 2,423.24 434.00 12,702.60 251.20 12,451.40
Qrt.III 75,502.17 55,562.48 46,264.95 9,055.74 241.80 3,068.28 2,419.19 649.10 16,871.40 200.00 16,671.40
Qtr.IV 77,812.02 55,562.48 46,264.95 9,055.74 241.80 4,421.18 2,419.19 2,001.99 17,828.36 200.00 17,628.36
2012/13 Qtr.I 82,079.07 55,510.38 46,264.95 9,055.74 189.70 8,511.89 2,455.93 6,055.97 18,056.80 200.00 17,856.80
Qtr.II 81,380.81 55,510.38 46,264.95 9,055.74 189.70 6,693.03 2,397.57 4,295.46 19,177.40 200.00 18,977.40
Qtr.III 85,794.00 59,510.38 50,264.95 9,055.74 189.70 5,407.49 2,419.75 2,987.74 20,876.14 200.00 20,676.14
Qtr.IV 93,019.21 64,510.38 55,264.95 9,055.74 189.70 5,699.97 2,380.36 3,319.61 22,808.86 200.00 22,608.86
2013/14 Qtr.I 91,279.30 64,381.33 55,264.95 8,986.79 129.60 4,089.11 1,753.86 2,335.24 22,808.86 200.00 22,608.86
Qtr.II 90,654.24 64,381.33 55,264.95 8,986.79 129.60 3,464.05 1,753.83 1,710.21 22,808.86 200.00 22,608.86
Qtr.III 97,944.00 73,381.33 64,264.95 8,986.79 129.60 1,753.80 1,753.80 - 22,808.86 200.00 22,608.86
Qtr.IV 107,318.52 73,304.39 64,264.95 8,917.84 121.60 1,629.68 1,629.68 - 32,384.46 97.60 32,286.86
2014/15 Qtr.I 109,794.80 73,175.34 64,264.95 8,848.89 61.50 1,227.50 1,227.50 - 35,391.96 97.60 35,294.36
Qtr.II 116,383.35 78,175.34 69,264.95 8,848.89 61.50 1,246.35 1,246.35 - 36,961.66 54.30 36,907.36
Qtr.III 121,824.85 81,175.34 72,264.95 8,848.89 61.50 1,252.35 1,252.35 - 39,397.16 54.30 39,342.86
Qtr.IV 135,190.41 92,175.34 83,264.95 8,848.89 61.50 1,256.02 1,256.02 - 41,759.05 54.30 41,704.76
2015/16 Qtr.I 144,937.83 99,657.34 91,264.95 8,344.40 48.00 905.43 905.43 - 44,375.06 54.30 44,320.76
Qtr.II 154,426.63 104,657.34 96,264.95 8,344.40 48.00 905.43 905.43 - 48,863.86 54.30 48,809.56
Qtr.III 159,157.73 104,657.34 96,264.95 8,344.40 48.00 905.43 905.43 - 53,594.96 72.40 53,522.56
Qtr.IV 163,461.01 109,080.40 100,764.95 8,275.45 40.00 785.65 785.65 - 53,594.96 72.40 53,522.56
2016/17 Qtr.I 161,914.19 107,764.95 107,764.95 - - 554.28 554.28 - 53,594.96 72.40 53,522.56
Qtr.II 171,344.89 120,640.85 112,764.95 7,839.90 36.00 554.28 554.28 - 50,149.76 36.20 50,113.56
Qtr.III 184,406.89 129,640.85 121,764.95 7,839.90 36.00 530.28 530.28 - 54,235.76 36.20 54,199.56
Qtr.IV 230,923.31 135,632.85 127,764.95 7,839.90 28.00 21,982.71 21,982.71 - 73,307.76 36.20 73,271.56
2017/18 Qtr.I 251,943.33 150,632.85 142,764.95 7,839.90 28.00 22,208.82 22,208.82 - 79,101.66 18.10 79,083.56
Qtr.II 264,416.12 160,128.85 152,264.95 7,839.90 24.00 22,186.62 22,186.62 - 82,100.66 18.10 82,082.56
Qtr.III 270,410.12 160,128.85 152,264.95 7,839.90 24.00 22,186.62 22,186.62 - 88,094.66 18.10 88,076.56
Qtr.IV 286,601.12 160,128.85 152,264.95 7,839.90 24.00 22,186.62 22,186.62 - 104,285.66 18.10 104,267.56
2018/19 Qtr.I 306,121.07 166,685.30 159,264.95 7,404.35 16.00 22,567.12 22,567.12 - 116,868.66 18.10 116,850.56
Qtr.II 324,319.68 178,685.30 171,264.95 7,404.35 16.00 22,521.73 22,521.73 - 123,112.66 18.10 123,094.56
Qtr.III 334,556.88 182,685.30 175,264.95 7,404.35 16.00 22,952.93 22,952.93 - 128,918.66 18.10 128,900.56
Qtr.IV 353,340.16 194,685.30 187,264.95 7,404.35 16.00 23,620.21 22,970.35 649.86 135,034.66 18.10 135,016.56
2019/20 Qtr.I 364,447.98 199,237.75 192,264.95 6,968.80 4.00 22,927.78 22,927.78 - 142,282.45 18.10 142,264.36
Qtr.II 377,411.83 204,237.75 197,264.95 6,968.80 4.00 23,123.42 22,927.78 195.65 150,050.66 18.10 150,032.56
Qtr.III 400,742.18 221,237.75 214,264.95 6,968.80 4.00 22,927.78 22,927.78 - 156,576.66 18.10 156,558.56
Qtr.IV 447,118.02 243,141.31 44,778.66 6,097.70 192,264.95 36,506.06 23,385.37 13,120.69 167,470.66 18.10 167,452.56
2020/21 Qtr.I 453,775.98 243,141.31 44,778.66 6,097.70 192,264.95 36,506.06 23,385.37 13,120.69 174,128.62 18.10 174,110.52
Qtr.II 469,642.92 248,141.31 49,778.66 6,097.70 192,264.95 32,698.32 23,341.82 9,356.50 188,803.30 18.10 188,785.20
Qtr.III 511,100.82 251,862.65 53,500.00 6,097.70 192,264.95 40,993.81 23,356.82 17,637.00 218,244.36 18.10 218,226.26
Qtr.IV 624,547.12 281,862.65 83,500.00 6,097.70 192,264.95 76,773.86 23,818.91 52,954.95 265,910.61 18.10 265,892.51

106 | Fourth Quarter 2020/21
National Bank of Ethiopia Quarterly BulletinTa
ble
13:
Gen
eral
Gov
ernm
ent Q
uarte
rly R
even
ue
Ethi
opia
n fis
cal y
ear
Fisc
al y
ear
endi
ng Ju
ly 7
2012
2013
2019
/20
2020
/21
pree
actu
alA
ctua
l
Budg
et3
mon
(Q
rt.I)
6m
onQ
rt.II
9 m
onQ
rt.II
I12
m
onQ
rt.IV
Budg
et3m
on
(QI)
6 M
onth
(QII)
9 M
onth
(QIII
)
(In m
illio
n Bi
rr)
Tax
reve
nue
311,
067.
973
,522
.216
7,54
7.4
94,0
25.2
241,
294.
573
,747
.131
1,47
6.5
70,1
81.9
380,
653.
383
,871
.620
4,17
9.8
120,
308.
229
0,56
7.3
86,3
87.5
Dire
ct ta
xes
127,
778.
327
,968
.874
,812
.546
,843
.710
2,82
2.5
28,0
10.0
132,
214.
529
,392
.114
4,45
7.3
34,9
99.0
100,
532.
965
,534
.013
3,59
4.9
33,0
62.0
Inc
ome
and
profi
ts ta
x12
4,75
1.6
27,3
15.0
73,3
81.0
46,0
66.0
100,
643.
827
,262
.812
9,47
9.3
28,8
35.5
140,
363.
633
,946
.498
,397
.064
,450
.513
0,81
5.9
32,4
18.9
P
erso
nal i
ncom
e44
,392
.59,
169.
622
,964
.813
,795
.235
,965
.213
,000
.449
,869
.613
,904
.356
,706
.713
,722
.933
,292
.619
,569
.849
,009
.415
,716
.8
Ren
tal i
ncom
e ta
x2,
556.
51,
049.
62,
318.
61,
269.
02,
476.
515
7.9
2,61
2.2
135.
73,
304.
81,
231.
42,
718.
61,
487.
23,
006.
828
8.2
B
usin
ess
profi
ts65
,411
.514
,246
.542
,088
.127
,841
.652
,963
.010
,875
.064
,664
.111
,701
.159
,532
.016
,355
.656
,437
.240
,081
.569
,582
.213
,145
.0
With
hold
ing
inco
me
tax
on im
port
s3,
806.
81,
208.
32,
511.
41,
303.
13,
851.
71,
340.
34,
892.
71,
041.
05,
945.
41,
233.
02,
446.
41,
213.
43,
799.
01,
352.
6
Agr
icul
ture
inco
me
565.
010
.759
.548
.825
2.6
193.
136
5.3
112.
767
4.9
11.0
144.
313
3.3
334.
419
0.1
O
ther
inco
me
5,38
8.2
984.
22,
152.
01,
167.
82,
947.
579
5.5
4,34
7.0
1,39
9.4
11,0
85.8
711.
71,
803.
11,
091.
42,
780.
597
7.4
I
nter
est i
ncom
e ta
x1,
770.
554
7.9
1,12
7.7
579.
91,
663.
753
6.0
2,13
2.2
468.
62,
588.
163
5.0
1,45
3.5
818.
52,
125.
567
2.0
C
apita
l gai
ns ta
x86
0.6
98.3
159.
060
.752
3.6
364.
659
6.3
72.7
525.
845
.810
1.3
55.5
178.
276
.9 R
ural
land
use
fee
560.
715
.365
.550
.223
8.5
173.
135
8.0
119.
545
2.1
21.0
135.
611
4.6
295.
115
9.5
Urb
an la
nd le
ase
fee
2,46
5.9
638.
61,
366.
072
7.4
1,94
0.1
574.
12,
377.
343
7.2
3,64
1.7
1,03
1.5
2,00
0.4
968.
82,
483.
948
3.6
Dom
estic
indi
rect
taxe
s91
,956
.420
,490
.441
,054
.620
,564
.159
,807
.018
,752
.478
,886
.519
,079
.511
4,81
6.5
22,5
63.6
50,7
84.5
28,2
20.9
77,2
55.3
26,4
70.8
Sa
les/
TOT/
exci
se ta
xes
45
,973
.69,
425.
518
,017
.18,
591.
626
,377
.78,
360.
635
,454
.89,
077.
162
,852
.411
,652
.626
,214
.314
,561
.740
,696
.814
,482
.5
P
etro
leum
pro
duct
s68
8.3
140.
932
3.1
182.
235
8.2
35.1
398.
240
.086
3.2
33.8
131.
197
.325
7.4
126.
3
A
lcoh
ol a
nd to
bacc
o8,
826.
51,
988.
84,
661.
92,
673.
06,
485.
81,
824.
09,
657.
73,
171.
812
,055
.82,
594.
97,
058.
34,
463.
411
,898
.44,
840.
1
O
ther
goo
ds
36,4
58.8
7,29
5.8
13,0
32.1
5,73
6.4
19,5
33.7
6,50
1.5
25,3
98.9
5,86
5.2
49,9
33.3
9,02
3.9
19,0
24.9
10,0
01.0
28,5
41.0
9,51
6.1
Se
rvic
es T
OT/
sal
es ta
x43
,707
.310
,453
.221
,399
.510
,946
.331
,013
.89,
614.
240
,264
.69,
250.
847
,857
.910
,129
.922
,831
.312
,701
.433
,713
.010
,881
.7
Stam
p du
ties
2,27
5.4
611.
71,
637.
91,
026.
22,
415.
577
7.6
3,16
7.1
751.
54,
106.
278
1.1
1,73
9.0
957.
92,
845.
51,
106.
5Im
port
duti
es a
nd ta
xes
91,3
33.3
25,0
62.9
51,6
80.4
26,6
17.4
78,6
65.1
26,9
84.7
100,
375.
421
,710
.312
1,37
9.5
26,3
09.0
52,8
62.3
26,5
53.3
79,7
17.1
26,8
54.8
Cu
stom
duti
es31
,303
.58,
632.
517
,603
.98,
971.
426
,846
.99,
243.
034
,060
.57,
213.
644
,995
.99,
078.
318
,400
.89,
322.
528
,136
.89,
736.
0
Sale
s/ex
cise
taxe
s
42,4
30.6
11,5
83.8
24,0
42.2
12,4
58.4
36,3
83.1
12,3
40.9
46,5
60.0
10,1
76.8
51,6
11.1
12,0
84.0
24,1
95.3
12,1
11.4
36,3
02.7
12,1
07.4
Petr
oleu
m p
rodu
cts
2,28
4.3
726.
91,
584.
285
7.3
2,24
8.8
664.
73,
025.
377
6.4
3,89
1.7
497.
21,
121.
762
4.5
1,47
3.5
351.
7
A
lcoh
ol a
nd to
bacc
o44
5.9
124.
121
7.8
93.6
309.
791
.935
6.0
46.4
825.
012
8.2
218.
590
.335
6.5
138.
0
O
ther
impo
rts
39,7
00.4
10,7
32.8
22,2
40.2
11,5
07.5
33,8
24.6
11,5
84.4
43,1
78.7
9,35
4.0
46,8
94.4
11,4
58.5
22,8
55.1
11,3
96.5
34,4
72.8
11,6
17.8
Su
rtax
on
impo
rts
17,5
99.1
4,84
6.6
10,0
34.3
5,18
7.7
15,4
35.1
5,40
0.8
19,7
55.0
4,31
9.9
24,7
72.5
5,14
6.7
10,2
66.2
5,11
9.5
15,2
77.6
5,01
1.4
Non
-tax
reve
nue
54,1
36.2
12,7
95.2
20,0
49.4
7,25
4.2
26,6
81.1
6,63
1.7
42,8
36.3
16,1
55.2
67,6
50.1
16,0
89.3
24,2
14.8
8,12
5.5
37,4
05.3
13,1
90.5
Cha
rges
and
fees
3,49
2.5
1,08
5.0
2,22
2.8
1,13
7.7
3,40
0.7
1,17
7.9
4,09
5.2
694.
53,
983.
755
3.0
1,71
9.9
1,16
6.9
3,00
7.0
1,28
7.1
Sal
es o
f goo
ds &
ser
vice
s4,
474.
21,
201.
52,
580.
21,
378.
74,
195.
01,
614.
85,
794.
21,
599.
26,
358.
591
4.1
2,46
5.9
1,55
1.9
4,41
5.8
1,94
9.9
Res
idua
l sur
plus
, cap
ital c
harg
e, in
tere
st0.
00.
0
pay
men
ts a
nd s
tate
div
iden
d19
,454
.47,
152.
58,
018.
986
6.4
8,44
3.9
425.
0 1
7,48
8.90
9,
045.
023
,083
.011
,486
.711
,927
.944
1.1
14,0
42.8
2,11
4.9
Rei
mbu
rsem
ent &
pro
pert
y sa
les
543.
425
.715
9.1
133.
417
8.8
19.7
203
.38
24.6
663.
514
4.8
198.
053
.22,
036.
71,
838.
8 M
isce
llane
ous
10,6
19.2
2,00
3.9
3,67
7.1
1,67
3.2
5,88
9.0
2,21
1.9
7,1
99.7
8 1,
310.
812
,865
.21,
723.
34,
983.
63,
260.
38,
581.
73,
598.
1 O
ther
ext
raor
dina
ry0.
00.
00.
00.
00.
00.
00.
00.
00.
00.
00.
00.
00.
0 P
riva
tizati
on p
roce
eds
0.0
0.0
0.0
0.0
0.0
0.0
0.0
0.0
0.0
0.0
0.0
0.0
0.0
0.0
Oth
er re
venu
e15
,552
.51,
326.
53,
391.
32,
064.
84,
573.
71,
182.
38,
054.
93,
481.
220
,696
.21,
267.
52,
919.
61,
652.
15,
321.
32,
401.
8To
tal r
even
ue36
5,20
4.1
86,3
17.4
187,
596.
810
1,27
9.5
267,
975.
780
,378
.835
4,31
2.8
86,3
37.1
448,
303.
499
,960
.922
8,39
4.6
128,
433.
732
7,97
2.7
99,5
78.0
Exte
rnal
gra
nts
36,7
93.6
4,08
3.9
9,36
5.4
5,28
1.6
14,4
42.3
5,07
6.9
40,6
53.0
26,2
10.7
45,4
58.7
11,2
41.5
22,9
26.3
11,6
84.8
29,6
21.8
6,69
5.5
Gra
nts i
n ki
nd/e
arm
arke
d
18,7
94.9
3,75
9.0
8,08
1.8
4,32
2.8
13,1
56.4
5,07
4.6
17,8
55.1
4,69
8.7
24,7
98.3
5,20
7.6
10,6
63.3
5,45
5.6
17,3
58.8
6,69
5.5
Unt
ied
cas
h &
CPF
/gra
nts
17,9
98.8
324.
91,
283.
695
8.7
1,28
5.9
2.3
22,7
97.9
21,5
12.0
20,6
60.4
6,03
3.8
12,2
63.0
6,22
9.2
12,2
63.0
0.0
Tota
l rev
enue
and
gra
nts
401,
997.
790
,401
.219
6,96
2.3
106,
561.
128
2,41
8.0
85,4
55.7
394,
965.
811
2,54
7.8
493,
762.
111
1,20
2.4
251,
320.
914
0,11
8.5
357,
594.
510
6,27
3.6

Fourth Quarter 2020/21 | 107
National Bank of Ethiopia Quarterly Bulletin
Tabl
e 13
: G
ener
al G
over
nmen
t Qua
rterly
Rev
enue
Ethi
opia
n fis
cal y
ear
Fisc
al y
ear
endi
ng Ju
ly 7
2012
2013
2019
/20
2020
/21
pree
actu
alA
ctua
l
Budg
et3
mon
(Q
rt.I)
6m
onQ
rt.II
9 m
onQ
rt.II
I12
m
onQ
rt.IV
Budg
et3m
on
(QI)
6 M
onth
(QII)
9 M
onth
(QIII
)
(In m
illio
n Bi
rr)
Tax
reve
nue
311,
067.
973
,522
.216
7,54
7.4
94,0
25.2
241,
294.
573
,747
.131
1,47
6.5
70,1
81.9
380,
653.
383
,871
.620
4,17
9.8
120,
308.
229
0,56
7.3
86,3
87.5
Dire
ct ta
xes
127,
778.
327
,968
.874
,812
.546
,843
.710
2,82
2.5
28,0
10.0
132,
214.
529
,392
.114
4,45
7.3
34,9
99.0
100,
532.
965
,534
.013
3,59
4.9
33,0
62.0
Inc
ome
and
profi
ts ta
x12
4,75
1.6
27,3
15.0
73,3
81.0
46,0
66.0
100,
643.
827
,262
.812
9,47
9.3
28,8
35.5
140,
363.
633
,946
.498
,397
.064
,450
.513
0,81
5.9
32,4
18.9
P
erso
nal i
ncom
e44
,392
.59,
169.
622
,964
.813
,795
.235
,965
.213
,000
.449
,869
.613
,904
.356
,706
.713
,722
.933
,292
.619
,569
.849
,009
.415
,716
.8
Ren
tal i
ncom
e ta
x2,
556.
51,
049.
62,
318.
61,
269.
02,
476.
515
7.9
2,61
2.2
135.
73,
304.
81,
231.
42,
718.
61,
487.
23,
006.
828
8.2
B
usin
ess
profi
ts65
,411
.514
,246
.542
,088
.127
,841
.652
,963
.010
,875
.064
,664
.111
,701
.159
,532
.016
,355
.656
,437
.240
,081
.569
,582
.213
,145
.0
With
hold
ing
inco
me
tax
on im
port
s3,
806.
81,
208.
32,
511.
41,
303.
13,
851.
71,
340.
34,
892.
71,
041.
05,
945.
41,
233.
02,
446.
41,
213.
43,
799.
01,
352.
6
Agr
icul
ture
inco
me
565.
010
.759
.548
.825
2.6
193.
136
5.3
112.
767
4.9
11.0
144.
313
3.3
334.
419
0.1
O
ther
inco
me
5,38
8.2
984.
22,
152.
01,
167.
82,
947.
579
5.5
4,34
7.0
1,39
9.4
11,0
85.8
711.
71,
803.
11,
091.
42,
780.
597
7.4
I
nter
est i
ncom
e ta
x1,
770.
554
7.9
1,12
7.7
579.
91,
663.
753
6.0
2,13
2.2
468.
62,
588.
163
5.0
1,45
3.5
818.
52,
125.
567
2.0
C
apita
l gai
ns ta
x86
0.6
98.3
159.
060
.752
3.6
364.
659
6.3
72.7
525.
845
.810
1.3
55.5
178.
276
.9 R
ural
land
use
fee
560.
715
.365
.550
.223
8.5
173.
135
8.0
119.
545
2.1
21.0
135.
611
4.6
295.
115
9.5
Urb
an la
nd le
ase
fee
2,46
5.9
638.
61,
366.
072
7.4
1,94
0.1
574.
12,
377.
343
7.2
3,64
1.7
1,03
1.5
2,00
0.4
968.
82,
483.
948
3.6
Dom
estic
indi
rect
taxe
s91
,956
.420
,490
.441
,054
.620
,564
.159
,807
.018
,752
.478
,886
.519
,079
.511
4,81
6.5
22,5
63.6
50,7
84.5
28,2
20.9
77,2
55.3
26,4
70.8
Sa
les/
TOT/
exci
se ta
xes
45
,973
.69,
425.
518
,017
.18,
591.
626
,377
.78,
360.
635
,454
.89,
077.
162
,852
.411
,652
.626
,214
.314
,561
.740
,696
.814
,482
.5
P
etro
leum
pro
duct
s68
8.3
140.
932
3.1
182.
235
8.2
35.1
398.
240
.086
3.2
33.8
131.
197
.325
7.4
126.
3
A
lcoh
ol a
nd to
bacc
o8,
826.
51,
988.
84,
661.
92,
673.
06,
485.
81,
824.
09,
657.
73,
171.
812
,055
.82,
594.
97,
058.
34,
463.
411
,898
.44,
840.
1
O
ther
goo
ds
36,4
58.8
7,29
5.8
13,0
32.1
5,73
6.4
19,5
33.7
6,50
1.5
25,3
98.9
5,86
5.2
49,9
33.3
9,02
3.9
19,0
24.9
10,0
01.0
28,5
41.0
9,51
6.1
Se
rvic
es T
OT/
sal
es ta
x43
,707
.310
,453
.221
,399
.510
,946
.331
,013
.89,
614.
240
,264
.69,
250.
847
,857
.910
,129
.922
,831
.312
,701
.433
,713
.010
,881
.7
Stam
p du
ties
2,27
5.4
611.
71,
637.
91,
026.
22,
415.
577
7.6
3,16
7.1
751.
54,
106.
278
1.1
1,73
9.0
957.
92,
845.
51,
106.
5Im
port
duti
es a
nd ta
xes
91,3
33.3
25,0
62.9
51,6
80.4
26,6
17.4
78,6
65.1
26,9
84.7
100,
375.
421
,710
.312
1,37
9.5
26,3
09.0
52,8
62.3
26,5
53.3
79,7
17.1
26,8
54.8
Cu
stom
duti
es31
,303
.58,
632.
517
,603
.98,
971.
426
,846
.99,
243.
034
,060
.57,
213.
644
,995
.99,
078.
318
,400
.89,
322.
528
,136
.89,
736.
0
Sale
s/ex
cise
taxe
s
42,4
30.6
11,5
83.8
24,0
42.2
12,4
58.4
36,3
83.1
12,3
40.9
46,5
60.0
10,1
76.8
51,6
11.1
12,0
84.0
24,1
95.3
12,1
11.4
36,3
02.7
12,1
07.4
Petr
oleu
m p
rodu
cts
2,28
4.3
726.
91,
584.
285
7.3
2,24
8.8
664.
73,
025.
377
6.4
3,89
1.7
497.
21,
121.
762
4.5
1,47
3.5
351.
7
A
lcoh
ol a
nd to
bacc
o44
5.9
124.
121
7.8
93.6
309.
791
.935
6.0
46.4
825.
012
8.2
218.
590
.335
6.5
138.
0
O
ther
impo
rts
39,7
00.4
10,7
32.8
22,2
40.2
11,5
07.5
33,8
24.6
11,5
84.4
43,1
78.7
9,35
4.0
46,8
94.4
11,4
58.5
22,8
55.1
11,3
96.5
34,4
72.8
11,6
17.8
Su
rtax
on
impo
rts
17,5
99.1
4,84
6.6
10,0
34.3
5,18
7.7
15,4
35.1
5,40
0.8
19,7
55.0
4,31
9.9
24,7
72.5
5,14
6.7
10,2
66.2
5,11
9.5
15,2
77.6
5,01
1.4
Non
-tax
reve
nue
54,1
36.2
12,7
95.2
20,0
49.4
7,25
4.2
26,6
81.1
6,63
1.7
42,8
36.3
16,1
55.2
67,6
50.1
16,0
89.3
24,2
14.8
8,12
5.5
37,4
05.3
13,1
90.5
Cha
rges
and
fees
3,49
2.5
1,08
5.0
2,22
2.8
1,13
7.7
3,40
0.7
1,17
7.9
4,09
5.2
694.
53,
983.
755
3.0
1,71
9.9
1,16
6.9
3,00
7.0
1,28
7.1
Sal
es o
f goo
ds &
ser
vice
s4,
474.
21,
201.
52,
580.
21,
378.
74,
195.
01,
614.
85,
794.
21,
599.
26,
358.
591
4.1
2,46
5.9
1,55
1.9
4,41
5.8
1,94
9.9
Res
idua
l sur
plus
, cap
ital c
harg
e, in
tere
st0.
00.
0
pay
men
ts a
nd s
tate
div
iden
d19
,454
.47,
152.
58,
018.
986
6.4
8,44
3.9
425.
0 1
7,48
8.90
9,
045.
023
,083
.011
,486
.711
,927
.944
1.1
14,0
42.8
2,11
4.9
Rei
mbu
rsem
ent &
pro
pert
y sa
les
543.
425
.715
9.1
133.
417
8.8
19.7
203
.38
24.6
663.
514
4.8
198.
053
.22,
036.
71,
838.
8 M
isce
llane
ous
10,6
19.2
2,00
3.9
3,67
7.1
1,67
3.2
5,88
9.0
2,21
1.9
7,1
99.7
8 1,
310.
812
,865
.21,
723.
34,
983.
63,
260.
38,
581.
73,
598.
1 O
ther
ext
raor
dina
ry0.
00.
00.
00.
00.
00.
00.
00.
00.
00.
00.
00.
00.
0 P
riva
tizati
on p
roce
eds
0.0
0.0
0.0
0.0
0.0
0.0
0.0
0.0
0.0
0.0
0.0
0.0
0.0
0.0
Oth
er re
venu
e15
,552
.51,
326.
53,
391.
32,
064.
84,
573.
71,
182.
38,
054.
93,
481.
220
,696
.21,
267.
52,
919.
61,
652.
15,
321.
32,
401.
8To
tal r
even
ue36
5,20
4.1
86,3
17.4
187,
596.
810
1,27
9.5
267,
975.
780
,378
.835
4,31
2.8
86,3
37.1
448,
303.
499
,960
.922
8,39
4.6
128,
433.
732
7,97
2.7
99,5
78.0
Exte
rnal
gra
nts
36,7
93.6
4,08
3.9
9,36
5.4
5,28
1.6
14,4
42.3
5,07
6.9
40,6
53.0
26,2
10.7
45,4
58.7
11,2
41.5
22,9
26.3
11,6
84.8
29,6
21.8
6,69
5.5
Gra
nts i
n ki
nd/e
arm
arke
d
18,7
94.9
3,75
9.0
8,08
1.8
4,32
2.8
13,1
56.4
5,07
4.6
17,8
55.1
4,69
8.7
24,7
98.3
5,20
7.6
10,6
63.3
5,45
5.6
17,3
58.8
6,69
5.5
Unt
ied
cas
h &
CPF
/gra
nts
17,9
98.8
324.
91,
283.
695
8.7
1,28
5.9
2.3
22,7
97.9
21,5
12.0
20,6
60.4
6,03
3.8
12,2
63.0
6,22
9.2
12,2
63.0
0.0
Tota
l rev
enue
and
gra
nts
401,
997.
790
,401
.219
6,96
2.3
106,
561.
128
2,41
8.0
85,4
55.7
394,
965.
811
2,54
7.8
493,
762.
111
1,20
2.4
251,
320.
914
0,11
8.5
357,
594.
510
6,27
3.6
Tabl
e 14
: G
ener
al G
over
nmen
t Qua
rterly
Exp
endi
ture
In M
illion
s of B
irr
Ethi
opia
n fis
cal y
ear
Fisc
al y
ear e
ndin
g Ju
ly 7
2011
2012
2013
2018
-19
2019
/20
2020
/21
Pre
actu
alPr
e ac
tual
Act
ual
Budg
et3m
on(Q
rt.I.R
e )
6mon
Qrt.
II9m
onQ
rt.III
12 m
on Q
rt.IV
Bu
dget
3mon
(Qrt.
I)6m
onQ
rt.II
9mon
Qrt.
III12
mon
Qrt.
IV
Budg
et3
Mon
(QI)
6Mon
th(Q
II)9M
onth
(QIII
)
A. C
apita
l Exp
end
iture
Econ
omic
dev
elop
men
t 12
0,23
5.1
17,4
74.0
40,7
67.4
23,2
93.4
67,8
03.8
27,0
36.4
106,
518.
038
,714
.214
5,03
0.4
22,8
62.7
51,1
79.8
28,3
17.1
78,2
60.3
27,0
80.5
132
,629
.1
54,
368.
8 1
71,5
47.6
23
,667
.462
,570
.738
,903
.398
,122
.535
,551
.8
Agr
icul
ture
19,5
08.6
1,90
5.5
5,88
8.6
3,98
3.1
13,0
78.0
7,18
9.5
22,2
28.9
9,15
0.9
20,8
61.6
3,88
8.9
8,65
2.0
4,76
3.1
13,6
75.0
5,02
3.0
22,
383.
73
8,70
8.8
22,9
54.9
6,43
2.3
16,1
70.9
9,73
8.6
21,1
20.5
4,94
9.7
N
atur
al R
esou
rce
25,2
13.1
1,44
2.3
6,06
4.0
4,62
1.7
11,2
02.2
5,13
8.2
20,5
63.1
9,36
0.9
30,0
03.2
2,72
6.1
7,15
3.8
4,42
7.7
11,2
80.1
4,12
6.3
22,
116.
65
10,8
36.6
35,6
70.3
1,92
9.8
7,07
3.7
5,14
3.8
12,2
07.9
5,13
4.2
o
/w: W
ater
23,1
09.2
1,02
5.2
5,97
7.3
4,95
2.1
11,0
67.2
5,09
0.0
19,6
99.8
8,63
2.6
29,9
57.3
2,72
4.0
7,07
1.8
4,34
7.8
11,2
73.4
4,20
1.6
21,
921.
86
10,6
48.5
31,9
15.2
1,85
3.4
5,38
7.9
3,53
4.5
9,59
3.0
4,20
5.0
M
ines
& E
nerg
y76
.579
0.6
781.
5-9
.177
8.7
-2.8
788.
19.
449
.82.
515
.613
.123
.68.
0 3
4.64
11
.175
.440
2.3
763.
936
1.7
842.
178
.1
Trad
e, In
dus
try &
Tou
rism
4,68
1.0
1,33
6.2
2,19
1.5
855.
34,
327.
52,
136.
06,
237.
01,
909.
56,
790.
815
5.4
1,01
1.5
856.
12,
036.
21,
024.
7 4
,545
.58
2,50
9.3
8,06
4.1
602.
51,
205.
060
2.5
2,82
6.8
1,62
1.8
U
rban
dev
't &
hou
sing
13,6
37.5
2,21
4.8
5,35
0.5
3,13
5.6
6,41
6.9
1,06
6.4
12,6
19.5
6,20
2.6
25,2
69.8
4,50
4.0
10,1
48.7
5,64
4.7
15,3
31.9
5,18
3.3
26,
837.
44
11,5
05.5
29,4
75.5
2,90
1.3
8,95
0.7
6,04
9.4
15,1
53.9
6,20
3.2
R
oad
con
stru
ctio
n52
,194
.79,
675.
719
,494
.89,
819.
230
,356
.710
,861
.939
,585
.99,
229.
157
,637
.511
,311
.121
,974
.510
,663
.432
,503
.110
,528
.6 5
1,42
9.14
18
,926
.070
,137
.911
,164
.427
,277
.716
,113
.343
,658
.416
,380
.8
Tra
nspo
rt &
com
mun
icat
ion
4,92
3.7
108.
999
6.5
887.
61,
643.
764
7.2
4,49
5.5
2,85
1.8
4,41
7.7
274.
72,
223.
81,
949.
13,
410.
41,
186.
6 5
,281
.95
1,87
1.5
5,16
9.5
234.
91,
128.
989
4.0
2,31
3.0
1,18
4.1
Soc
ial
Dev
elop
men
t47
,525
.48,
921.
218
,585
.79,
664.
429
,144
.710
,559
.047
,891
.418
,746
.751
,314
.610
,759
.922
,661
.211
,901
.331
,965
.79,
304.
551
,316
.119
,350
.461
,925
.88,
400.
123
,277
.214
,877
.134
,322
.211
,045
.0
Ed
ucat
ion
25,7
29.5
6,09
9.7
12,3
74.0
6,27
4.3
19,0
77.4
6,70
3.4
30,1
09.1
11,0
31.7
29,3
80.8
8,20
7.8
14,3
12.5
6,10
4.7
19,8
54.0
5,54
1.5
33,2
03.5
13,3
49.5
33,7
10.1
4,37
5.2
12,0
60.8
7,68
5.6
16,9
91.0
4,93
0.2
H
ealth
14,4
70.9
2,27
4.1
4,79
8.4
2,52
4.3
7,86
8.0
3,06
9.6
12,8
63.1
4,99
5.1
15,6
26.4
2,11
6.4
6,88
2.8
4,76
6.3
10,3
54.1
3,47
1.3
15,0
19.3
4,66
5.2
21,9
12.2
3,53
0.7
9,55
2.1
6,02
1.4
15,0
82.6
5,53
0.5
S
ocai
l wel
fare
1,87
0.9
224.
638
0.8
156.
250
6.7
125.
92,
591.
52,
084.
81,
445.
146
.935
9.8
312.
965
1.7
291.
898
9.9
338.
21,
953.
717
7.1
428.
725
1.6
690.
326
1.6
C
ultu
re &
spor
t5,
454.
132
2.8
1,03
2.4
709.
61,
692.
666
0.2
2,32
7.8
635.
14,
862.
338
8.7
1,10
6.1
717.
41,
105.
92,
103.
499
7.5
4,34
9.8
317.
11,
235.
791
8.5
1,55
8.3
322.
7G
ener
al D
evel
opm
ent
29,7
53.4
1,05
3.4
4,09
5.2
3,04
1.8
8,59
1.2
4,49
6.0
20,5
39.8
11,9
48.6
22,9
26.5
1,88
7.6
5,06
1.0
3,17
3.4
8,44
8.4
3,38
7.4
20,2
31.0
11,7
82.5
29,9
05.2
1,53
0.0
7,59
3.6
6,06
3.6
13,0
04.3
5,41
0.7
Com
pens
atio
n pa
ymen
ts0.
00.
00.
00.
00.
00.
00.
00.
00.
00.
00.
00.
00.
00.
00.
00.
00.
00.
00.
00.
00.
00.
0Ex
tern
al a
ssist
ance
16,8
13.6
3,36
2.7
7,22
9.8
3,86
7.1
12,6
10.2
5,38
0.3
15,9
72.9
3,36
2.7
18,7
94.9
3,75
9.0
8,08
1.8
4,32
2.8
13,1
56.4
5,07
4.6
17,8
55.1
4,69
8.7
24,7
98.3
5,20
7.6
10,6
63.3
5,45
5.6
17,3
58.8
6,69
5.5
Sub
Tota
l Cap
ital E
xpen
ditu
re19
7,51
3.9
27,4
48.6
63,4
48.3
35,9
99.7
105,
539.
742
,091
.417
4,94
9.1
69,4
09.4
219,
271.
535
,510
.178
,902
.043
,391
.911
8,67
4.4
39,7
72.4
204,
176.
185
,501
.726
3,37
8.5
33,5
97.5
93,4
41.5
59,8
44.0
145,
449.
052
,007
.5B.
Cur
rent
Exp
end
iture
G
ener
al S
ervi
ces
65,4
73.6
13,1
22.9
29,3
43.0
16,2
20.2
48,1
49.1
18,8
06.1
74,6
60.4
26,5
11.3
77,0
08.6
15,0
35.1
37,0
75.7
22,0
40.7
59,8
40.1
22,7
64.4
89,9
20.2
30,0
80.1
93,2
21.9
19,3
50.1
59,6
24.2
40,2
74.2
84,7
90.4
25,1
66.1
O
rgan
of t
he S
tate
9,59
4.5
1,64
3.7
4,31
3.5
2,66
9.8
7,53
4.8
3,22
1.3
12,1
75.0
4,64
0.2
12,6
32.8
2,33
2.1
5,85
8.3
3,52
6.2
9,89
4.5
4,03
6.2
15,3
02.1
5,40
7.6
15,6
04.3
2,85
7.5
9,22
6.6
6,36
9.1
14,8
17.3
5,59
0.7
J
ustic
e7,
215.
31,
331.
63,
427.
52,
095.
95,
399.
51,
972.
09,
295.
73,
896.
28,
575.
51,
590.
94,
808.
73,
217.
87,
926.
93,
118.
210
,377
.02,
450.
112
,029
.81,
985.
55,
375.
23,
389.
78,
133.
12,
757.
9
Def
ence
15
,000
.03,
629.
96,
865.
63,
235.
710
,483
.63,
618.
015
,605
.05,
121.
415
,000
.03,
586.
87,
443.
23,
856.
412
,131
.04,
687.
716
,908
.24,
777.
316
,500
.01,
937.
818
,389
.116
,451
.323
,053
.24,
664.
1
Pub
lic o
rder
& se
curit
y15
,932
.42,
982.
26,
882.
53,
900.
211
,671
.84,
789.
417
,221
.15,
549.
320
,581
.83,
875.
78,
984.
35,
108.
614
,226
.85,
242.
524
,174
.29,
947.
425
,247
.27,
466.
511
,907
.64,
441.
118
,528
.16,
620.
5
Oth
er G
ener
al se
rvic
es17
,731
.43,
535.
47,
854.
04,
318.
613
,059
.45,
205.
420
,363
.67,
304.
220
,218
.53,
649.
59,
981.
26,
331.
615
,661
.05,
679.
923
,158
.77,
497.
723
,840
.65,
102.
714
,725
.79,
623.
020
,258
.65,
532.
9 E
cono
mic
Ser
vice
s33
,618
.94,
710.
512
,622
.07,
911.
419
,554
.46,
932.
431
,233
.411
,679
.037
,281
.85,
523.
715
,131
.69,
607.
923
,563
.28,
431.
636
,323
.112
,759
.944
,369
.68,
198.
620
,945
.212
,746
.630
,430
.09,
484.
8
Agr
icul
ture
&na
tura
l res
ourc
e21
,817
.02,
721.
17,
809.
65,
088.
512
,089
.54,
279.
920
,182
.58,
093.
024
,511
.73,
359.
19,
753.
66,
394.
514
,930
.45,
176.
823
,198
.78,
268.
329
,086
.45,
270.
913
,050
.57,
779.
619
,201
.36,
150.
8A
gric
ultu
re17
,056
.52,
053.
95,
757.
73,
703.
79,
122.
23,
364.
615
,397
.66,
275.
319
,298
.32,
967.
67,
360.
74,
393.
211
,453
.54,
092.
817
,895
.36,
441.
724
,068
.54,
709.
310
,942
.76,
233.
416
,362
.25,
419.
4 N
atur
al re
sour
ce4,
760.
566
7.1
2,05
2.0
1,38
4.8
2,96
7.3
915.
34,
784.
91,
817.
75,
213.
439
1.5
2,39
2.8
2,00
1.3
3,47
6.9
1,08
4.1
5303
.51,
826.
65,
017.
956
1.6
2,10
7.8
1,54
6.2
2,83
9.2
731.
4
o/w
: Wat
er3,
947.
245
2.9
1,56
0.2
1,10
7.3
2,21
7.6
657.
43,
746.
11,
528.
55,
128.
534
9.8
1,76
0.0
1,41
0.2
2,57
7.4
817.
447
53.4
2,17
6.0
4,73
3.6
480.
01,
996.
61,
516.
62,
618.
562
1.9
T
rad
e, In
dus
try &
Tou
rism
5,93
0.0
1,01
6.3
2,57
9.9
1,56
3.6
4,05
3.4
1,47
3.5
6,05
8.1
2,00
4.7
6,59
5.2
1,19
9.7
3,17
3.0
1,97
3.3
5,12
7.0
1,95
4.0
7,79
5.5
2,66
8.6
6,82
5.0
1,49
5.4
3,86
8.7
2,37
3.3
5,11
9.2
1,25
0.5
M
ines
& E
nerg
y20
8.1
36.3
61.0
24.7
103.
842
.815
3.6
49.8
192.
448
.210
2.0
53.8
148.
346
.218
8.8
40.5
243.
675
.316
9.4
94.1
238.
469
.0
Tou
rism
0.0
0.0
0.0
0.0
0.0
0.0
0.0
0.0
0.0
0.0
0.0
0.0
0.0
0.0
0.0
0.0
211.
415
8.2
358.
720
0.5
685.
532
6.8
T
rans
port
& c
omm
unic
atio
n1,
622.
816
7.9
309.
414
1.5
470.
216
0.8
684.
621
4.4
1,49
7.1
146.
935
5.6
208.
758
5.6
230.
092
7.3
341.
72,
449.
119
3.2
1,05
1.8
858.
61,
559.
950
8.1
U
rban
dev
t. &
con
stru
ctio
n 3,
456.
964
8.5
1,56
0.1
911.
62,
424.
486
4.2
3,47
4.4
1,05
0.0
3,38
7.4
615.
31,
527.
191
1.8
2,34
8.3
821.
236
67.0
1,31
8.7
4,81
5.1
840.
22,
099.
51,
259.
33,
098.
299
8.8
o
/w: R
oad
Con
stru
ctio
n1,
278.
427
0.2
765.
849
5.7
1,22
4.9
459.
11,
732.
450
7.5
1,36
1.6
305.
485
6.3
550.
91,
298.
644
2.4
2029
.573
0.8
2,00
8.7
459.
091
6.6
457.
51,
371.
045
4.4
E
cono
mic
dev
elop
men
t stu
die
s58
4.1
120.
430
1.9
181.
541
3.0
111.
168
0.2
267.
21,
098.
015
4.5
220.
365
.842
3.7
203.
454
5.8
122.
173
8.9
165.
534
6.6
181.
152
7.4
180.
8 S
ocia
l Ser
vice
s10
3,49
4.0
17,8
66.8
43,2
62.2
25,3
95.4
68,9
85.0
25,7
22.8
112,
516.
043
,531
.111
4,93
3.3
22,6
59.6
54,5
34.3
31,8
74.7
84,0
26.8
29,4
92.5
130,
356.
046
,329
.215
2,83
8.3
31,0
77.8
77,2
22.3
46,1
44.5
114,
999.
537
,777
.2
Ed
ucat
ion
& tr
aini
ng72
,855
.012
,691
.229
,786
.417
,095
.248
,033
.018
,246
.572
,707
.224
,674
.280
,686
.115
,491
.137
,667
.722
,176
.658
,395
.820
,728
.186
,411
.428
,015
.710
7,91
5.7
21,7
00.1
52,2
55.6
30,5
55.5
78,2
02.6
25,9
47.0
C
ultu
re &
spor
ts3,
662.
159
8.5
1,51
6.5
918.
02,
393.
287
6.7
3,47
0.6
1,07
7.4
3,53
9.6
563.
11,
251.
768
8.6
2,00
6.2
754.
42,
817.
681
1.4
3,31
5.9
630.
01,
358.
072
8.0
2,31
5.9
957.
9
Pub
lic h
ealth
25,5
17.3
3,35
0.5
9,48
6.4
6,13
5.9
15,0
94.0
5,60
7.7
25,5
18.5
10,4
24.5
29,0
71.1
4,13
8.9
11,7
35.4
7,59
6.5
19,2
27.6
7,49
2.2
33,4
64.7
14,2
37.1
39,2
62.5
6,74
2.4
17,9
98.6
11,2
56.3
27,1
53.1
9,15
4.5
L
abou
r & so
cial
wel
fare
923.
816
3.6
498.
033
4.4
803.
430
5.5
1,22
9.3
425.
91,
011.
824
0.9
644.
740
3.8
1,04
2.5
397.
91,
878.
283
5.6
1,48
0.5
379.
764
4.6
264.
81,
504.
886
0.2
R
ehab
ilitat
ion
535.
71,
063.
11,
974.
991
1.9
2,66
1.4
686.
49,
590.
46,
929.
162
4.7
2,22
5.6
3,23
4.8
1,00
9.2
3,35
4.7
119.
95,
784.
02,
429.
386
3.8
1,62
5.6
4,96
5.4
3,33
9.8
5,82
3.0
857.
5 I
nter
est &
Cha
rges
15,2
21.9
2,85
0.7
6,32
3.5
3,47
2.8
9,32
6.0
3,00
2.4
13,5
25.8
4,19
9.9
17,4
07.8
8,10
6.3
6,99
0.8
-1,1
15.5
11,3
41.6
4,35
0.8
13,4
81.1
2,13
9.5
19,7
65.1
1,81
9.1
10,9
09.6
9,09
0.5
12,0
71.0
1,16
1.4
In
tern
al d
ebt
7,76
5.3
1,63
8.2
3,39
5.4
1,75
7.2
5,22
3.3
1,82
7.9
7,43
6.1
2,21
2.8
9,35
1.2
6,74
6.2
3,65
8.4
-3,0
87.8
6,37
6.0
2,71
7.6
6,36
6.5
-9.5
10,0
12.5
988.
57,
574.
66,
586.
07,
811.
323
6.7
E
xter
nal d
ebt
7,45
6.6
1,21
2.5
2,92
8.1
1,71
5.6
4,10
2.7
1,17
4.6
6,08
9.8
1,98
7.1
8,05
6.6
1,36
0.0
3,33
2.3
1,97
2.3
4,96
5.6
1,63
3.2
7,11
4.6
2,14
9.0
9,75
2.6
830.
63,
335.
12,
504.
54,
259.
792
4.7
O/w
: def
ence
com
mer
cial
0.0
0.0
0.0
0.0
Misc
ella
neou
s 21
,886
.965
2.3
1,96
6.0
1,31
3.7
4,48
1.3
2,51
5.3
6,22
1.0
1,73
9.7
24,4
22.6
826.
22,
414.
41,
588.
23,
934.
11,
519.
65,
886.
61,
952.
525
,984
.11,
174.
13,
550.
62,
376.
56,
359.
22,
808.
6 E
xter
nal a
ssist
ance
*0.
00.
00.
00.
00.
00.
00.
00.
00.
00.
00.
00.
00.
00.
00.
00.
00.
00.
00.
0 S
ub T
otal
Cur
rent
Exp
end
iture
23
9,69
5.2
39,2
03.2
93,5
16.7
54,3
13.6
150,
495.
756
,979
.023
8,15
6.6
87,6
60.9
271,
054.
252
,150
.811
6,14
6.9
63,9
96.0
182,
705.
866
,559
.027
5,96
7.0
93,2
61.2
336,
179.
061
,619
.617
2,25
1.9
110,
632.
324
8,64
9.9
76,3
98.0
Gra
nd T
otal
Exp
end
iture
437,
209.
266
,651
.815
6,96
5.0
90,3
13.3
256,
035.
499
,070
.441
3,10
5.7
157,
070.
349
0,32
5.7
87,6
60.9
195,
048.
910
7,38
8.0
301,
380.
310
6,33
1.4
480,
143.
217
8,76
2.9
599,
557.
595
,217
.126
5,69
3.4
170,
476.
339
4,09
8.9
128,
405.
5*
Estim
ated
val
ue

108 | Fourth Quarter 2020/21
National Bank of Ethiopia Quarterly Bulletin
Table 15: Domestic Refining and Imports of Petroleum (In Metric Tons)
MGR Jet fuel Gasoil LFO HFO Total fuel oil Total Refined**
2012/13
QI 48,367.80 148,668.08 285,788.92 10,156.70 41,075.11 534,056.62 51,231.82
QII 45,607.59 149,611.12 296,204.43 8,122.04 29,320.00 528,865.18 37,442.04
QIII 52,070.39 156,140.93 360,766.11 8,657.71 28,675.05 606,310.18 37,332.76
QIV 40,471.73 148,006.84 323,803.46 9,486.22 23,804.56 545,572.82 33,290.79
2012/13 Annual 186,517.50 602,426.98 1,266,562.91 36,422.68 122,874.72 2,214,804.79 159,297.40
2013/14
QI 52,821.02 185,032.12 388,200.80 11,512.09 31,974.27 669,540.29 43,486.36
QII 49,883.39 162,038.72 306,082.59 7,551.20 29,090.00 554,645.90 36,641.20
QIII 55,536.11 192,607.72 400,794.60 9,823.04 34,105.49 692,866.95 43,928.53
QIV 53,356.68 161,740.31 463,263.07 7,190.94 20,846.66 706,397.66 28,037.60
2013/14 Annual 211,597.20 701,418.86 1,558,341.05 36,077.28 116,016.41 2,623,450.80 152,093.69
2014/15
QI 52,223.00 169,004.79 359,514.00 10,278.63 32,896.29 623,916.71 43,174.92
QII 57,561.00 171,011.22 435,565.00 9,958.50 32,870.81 706,966.53 42,829.31
QIII 64,895.00 207,909.14 369,681.00 10,398.09 32,223.62 685,106.85 42,621.71
QIV 63,065.00 164,822.86 538,500.77 10,001.11 29,678.58 806,068.32 39,679.69
2014/15 Annual 237,744.00 712,748.00 1,703,260.77 40,636.33 127,669.30 2,822,058.40 168,305.63
2015/16
QI 72,312.74 213,015.55 398,136.40 7,953.19 22,697.05 714,114.92 30,650.23
QII 71,317.00 161,194.00 497,966.00 10,441.00 21,413.00 762,331.00 31,854.00
QIII 77,271.77 197,134.40 509,229.51 10,177.96 14,817.00 808,630.64 24,994.96
QIV 77965.951 164577.794 496459.617 7382.202 12097 758482.564 19479.202
2015/16 Annual 298,867.46 735,921.74 1,901,791.53 35,954.34 71,024.05 3,043,559.12 106,978.39
2016/17
QI 82,152.17 206,560.18 468,051.30 11,312.26 7,675.00 775,750.90 18,987.26
QII 97,258.59 208,282.60 550,034.05 7,804.86 7,775.00 871,155.10 15,579.86
QIII 96,423.57 215,632.55 580,188.02 11,008.68 12,397.12 915,649.94 23,405.80
QIV 88,010.77 170,307.94 601,081.24 9,502.81 7,807.86 876,710.62 17,310.67
2016/17 Annual 363,845.10 800,783.27 2,199,354.60 39,628.60 35,654.98 3,439,266.55 75,283.59
2017/18
QI 106,706.30 165,269.22 591,077.34 10,763.35 10,241.32 884,057.53 21,004.67
QII 99,641.17 234,532.08 608,690.11 8,174.17 10,396.32 961,433.85 18,570.49
QIII 114,839.25 149,872.69 629,025.21 9,240.29 12,457.77 915,435.20 21,698.06
QIV 120,355.57 188,431.77 678,879.80 7,607.48 14,387.83 1,009,662.45 21,995.31
2017/18 Annual 441,542.28 738,105.77 2,507,672.46 35,785.29 47,483.23 3,770,589.02 83,268.52
2018/19
QI 120,069.69 205,741.76 570,182.14 6,646.30 4,500.00 907,139.88 11,146.30
QII 122,357.95 221,894.30 600,552.26 9,751.84 9,596.77 964,153.12 19,348.61
QIII 135,787.58 208,436.33 690,546.55 5,987.23 9,894.90 1,050,652.59 15,882.13
QIV 128,523.96 183,926.16 635,440.86 8,695.82 11,075.96 967,662.76 19,771.77
2018/19 Annual 506,739.18 819,998.55 2,496,721.80 31,081.18 35,067.63 3,889,608.34 66,148.81
2019/20
QI 159,613.12 210,503.47 616,810.64 8,886.66 14,477.84 1,010,291.73 23,364.50
QII 133,745.93 212,529.51 648,408.02 10,582.62 8,425.26 1,013,691.33 19,007.88
QIII 141,900.06 133,970.65 659,674.52 9,393.61 10,290.56 955,229.40 19,684.17
QIV 142,182.87 84,127.50 643,282.89 8,690.86 9,700.00 887,984.11 18,390.86
2019/20 Annual 577,441.98 641,131.13 2,568,176.06 37,553.75 42,893.66 3,867,196.57 80,447.41
2020/21
QI 145,183.01 99,180.54 613,828.06 8,195.65 12,300.00 878,687.25 20,495.65
QII 176,894.50 107,969.29 630,617.51 6,914.50 15,500.00 937,895.80 22,414.50
QIII 154,240.29 129,945.36 654,442.00 7,750.00 13,602.43 959,980.08 21,352.43
QIV 176,255.18 106,927.12 636,567.62 7,300.00 16,010.77 943,060.70 23,310.77
2020/21 Annual 652,572.98 444,022.30 2,535,455.19 30,160.15 57,413.21 3,719,623.83 87,573.35

Fourth Quarter 2020/21 | 109
National Bank of Ethiopia Quarterly Bulletin
Table 15: Domestic Refining and Imports of Petroleum (In Metric Tons)
MGR Jet fuel Gasoil LFO HFO Total fuel oil Total Refined**
2012/13
QI 48,367.80 148,668.08 285,788.92 10,156.70 41,075.11 534,056.62 51,231.82
QII 45,607.59 149,611.12 296,204.43 8,122.04 29,320.00 528,865.18 37,442.04
QIII 52,070.39 156,140.93 360,766.11 8,657.71 28,675.05 606,310.18 37,332.76
QIV 40,471.73 148,006.84 323,803.46 9,486.22 23,804.56 545,572.82 33,290.79
2012/13 Annual 186,517.50 602,426.98 1,266,562.91 36,422.68 122,874.72 2,214,804.79 159,297.40
2013/14
QI 52,821.02 185,032.12 388,200.80 11,512.09 31,974.27 669,540.29 43,486.36
QII 49,883.39 162,038.72 306,082.59 7,551.20 29,090.00 554,645.90 36,641.20
QIII 55,536.11 192,607.72 400,794.60 9,823.04 34,105.49 692,866.95 43,928.53
QIV 53,356.68 161,740.31 463,263.07 7,190.94 20,846.66 706,397.66 28,037.60
2013/14 Annual 211,597.20 701,418.86 1,558,341.05 36,077.28 116,016.41 2,623,450.80 152,093.69
2014/15
QI 52,223.00 169,004.79 359,514.00 10,278.63 32,896.29 623,916.71 43,174.92
QII 57,561.00 171,011.22 435,565.00 9,958.50 32,870.81 706,966.53 42,829.31
QIII 64,895.00 207,909.14 369,681.00 10,398.09 32,223.62 685,106.85 42,621.71
QIV 63,065.00 164,822.86 538,500.77 10,001.11 29,678.58 806,068.32 39,679.69
2014/15 Annual 237,744.00 712,748.00 1,703,260.77 40,636.33 127,669.30 2,822,058.40 168,305.63
2015/16
QI 72,312.74 213,015.55 398,136.40 7,953.19 22,697.05 714,114.92 30,650.23
QII 71,317.00 161,194.00 497,966.00 10,441.00 21,413.00 762,331.00 31,854.00
QIII 77,271.77 197,134.40 509,229.51 10,177.96 14,817.00 808,630.64 24,994.96
QIV 77965.951 164577.794 496459.617 7382.202 12097 758482.564 19479.202
2015/16 Annual 298,867.46 735,921.74 1,901,791.53 35,954.34 71,024.05 3,043,559.12 106,978.39
2016/17
QI 82,152.17 206,560.18 468,051.30 11,312.26 7,675.00 775,750.90 18,987.26
QII 97,258.59 208,282.60 550,034.05 7,804.86 7,775.00 871,155.10 15,579.86
QIII 96,423.57 215,632.55 580,188.02 11,008.68 12,397.12 915,649.94 23,405.80
QIV 88,010.77 170,307.94 601,081.24 9,502.81 7,807.86 876,710.62 17,310.67
2016/17 Annual 363,845.10 800,783.27 2,199,354.60 39,628.60 35,654.98 3,439,266.55 75,283.59
2017/18
QI 106,706.30 165,269.22 591,077.34 10,763.35 10,241.32 884,057.53 21,004.67
QII 99,641.17 234,532.08 608,690.11 8,174.17 10,396.32 961,433.85 18,570.49
QIII 114,839.25 149,872.69 629,025.21 9,240.29 12,457.77 915,435.20 21,698.06
QIV 120,355.57 188,431.77 678,879.80 7,607.48 14,387.83 1,009,662.45 21,995.31
2017/18 Annual 441,542.28 738,105.77 2,507,672.46 35,785.29 47,483.23 3,770,589.02 83,268.52
2018/19
QI 120,069.69 205,741.76 570,182.14 6,646.30 4,500.00 907,139.88 11,146.30
QII 122,357.95 221,894.30 600,552.26 9,751.84 9,596.77 964,153.12 19,348.61
QIII 135,787.58 208,436.33 690,546.55 5,987.23 9,894.90 1,050,652.59 15,882.13
QIV 128,523.96 183,926.16 635,440.86 8,695.82 11,075.96 967,662.76 19,771.77
2018/19 Annual 506,739.18 819,998.55 2,496,721.80 31,081.18 35,067.63 3,889,608.34 66,148.81
2019/20
QI 159,613.12 210,503.47 616,810.64 8,886.66 14,477.84 1,010,291.73 23,364.50
QII 133,745.93 212,529.51 648,408.02 10,582.62 8,425.26 1,013,691.33 19,007.88
QIII 141,900.06 133,970.65 659,674.52 9,393.61 10,290.56 955,229.40 19,684.17
QIV 142,182.87 84,127.50 643,282.89 8,690.86 9,700.00 887,984.11 18,390.86
2019/20 Annual 577,441.98 641,131.13 2,568,176.06 37,553.75 42,893.66 3,867,196.57 80,447.41
2020/21
QI 145,183.01 99,180.54 613,828.06 8,195.65 12,300.00 878,687.25 20,495.65
QII 176,894.50 107,969.29 630,617.51 6,914.50 15,500.00 937,895.80 22,414.50
QIII 154,240.29 129,945.36 654,442.00 7,750.00 13,602.43 959,980.08 21,352.43
QIV 176,255.18 106,927.12 636,567.62 7,300.00 16,010.77 943,060.70 23,310.77
2020/21 Annual 652,572.98 444,022.30 2,535,455.19 30,160.15 57,413.21 3,719,623.83 87,573.35
Table: 16 GDP By Economic Activity at Constant Prices (In millions of Birr)
Sectors/Year2004 2005 2006 2007 2008 2009 2010 2011 2012
2011/12 2012/13 2013/14 2014/15 2015/16 2016/17 2017/18 2018/19 2019/20
Agriculture, Hunting and Forestry 441,832.9 473,132.2 498,733.6 530,341.5 542,700.2 579,022.9 599,331.4 622,220.3 648,711.8
Crop 270,881.6 293,063.1 312,338.7 334,768.6 346,293.6 374,649.8 392,291.8 404,049.6 422,966.5
Animal Farming and Hunting 132,843.6 139,692.4 142,601.9 149,246.8 146,959.5 153,170.4 154,038.0 163,279.5 168,722.4
Forestry 43,440.5 44,867.9 46,751.8 48,368.2 49,447.1 51,202.7 53,001.7 54,891.1 57,022.9
Fishing 668.4 797.8 1,057.4 1,381.1 1,381.9 1,389.4 1,546.7 1,581.8 1,614.0
Mining and Quarrying 8,265.7 8,784.6 8,506.2 6,328.5 6,116.8 4,296.9 3,402.8 2,658.9 5,089.3
Manufacturing 46,752.0 54,668.7 63,764.0 75,383.5 89,246.7 111,249.6 117,410.7 127,986.7 137,601.5
Large and Medium Scale Manufacturing 26,985.0 33,516.2 40,743.0 50,174.6 61,687.4 73,528.2 77,966.5 87,691.9 96,268.6
Small Scale and Cottage Industries 24,366.4 24,838.1 25,895.4 26,874.8 27,559.2 37,721.5 39,444.2 40,294.7 41,332.9
Electricity and Water 7,802.9 8,585.3 9,165.6 9,577.4 11,015.5 11,552.5 11,929.0 14,115.4 15,136.4
Construction 84,041.1 116,588.0 144,420.0 190,028.6 237,545.0 286,749.6 331,691.4 381,443.8 419,078.0
Whole Sale and Retail Trade 128,411.1 141,360.7 166,337.5 186,850.2 202,241.5 215,351.0 241,936.3 268,037.0 285,293.1
Hotels and Restaurants 18,403.7 21,925.0 27,758.6 35,971.8 41,601.3 41,625.2 44,335.3 48,143.8 49,220.4
Transport and Communications 128,411.1 141,360.7 166,337.5 186,850.2 202,241.5 215,351.0 241,936.3 104,436.2 105,579.6
Financial Intermediation 18,403.7 21,925.0 27,758.6 35,971.8 41,601.3 41,625.2 44,335.3 57,368.6 65,290.3
Real Estate, Renting and Business Activities 57,543.4 59,781.2 62,114.2 64,690.9 67,062.9 70,005.2 74,364.3 79,942.0 87,510.2
Public Administration and Defense 45,760.0 49,253.6 54,681.3 57,979.5 62,259.2 70,488.5 76,754.1 83,662.0 85,612.2
Education 31,596.6 34,781.5 35,679.7 38,963.0 42,385.6 41,031.0 42,520.8 44,221.6 44,784.1
Health and Social Work 9,341.3 10,489.0 12,510.3 14,137.2 15,669.4 16,767.9 18,153.4 20,747.2 23,414.2
Other Community , Social & Personal Services 13,986.4 16,560.4 17,193.4 17,828.7 18,371.3 19,198.4 20,178.0 21,454.2 21,995.5
Private Households with Employed Persons 13,069.3 14,136.1 14,758.3 15,401.2 16,063.8 16,633.3 17,276.0 17,707.4 18,115.5
Total 1,011,606.3 1,111,987.7 1,227,058.7 1,355,280.4 1,463,883.2 1,613,519.9 1,739,254.9 1,895,726.7 2,014,046.2
Less : FISIM 8,274.0 8,803.4 10,512.8 12,393.0 14,485.8 17,038.3 19,763.6 21,037.4 24,527.2
Gross Value Added at Constant Basic Prices 1,002,766.9 1,102,467.8 1,216,015.3 1,342,555.9 1,449,397.5 1,596,481.6 1,719,491.3 1,874,689.3 1,989,519.0
Taxes on Products 80,410.1 95,162.9 104,547.5 115,169.8 118,700.0 120,645.6 114,575.2 112,468.2 119,603.2
GDP at Constant Market Prices 1,083,133.7 1,197,753.9 1,320,688.1 1,457,857.6 1,568,097.5 1,717,127.2 1,834,066.5 1,987,157.5 2,109,122.2
Source:MoFED

110 | Fourth Quarter 2020/21
National Bank of Ethiopia Quarterly Bulletin
Table: 17 Growth Rate Of GDP By Economic Activity at Constant Prices ( In percent)
Industry/Year2000 2001 2002 2003 2004 2005 2006 2007 2008 2009 2010 2011 2012
2007/08 2008/09 2009/10 2010/11 2011/12. 2012/13 2013/14 2014/15 2015/16 2016/17 2017/18 2018/19 2019/20
Agriculture, Hunting and Forestry 7.5 6.4 7.6 9.0 4.9 7.1 5.4 6.3 2.3 6.7 3.5 3.8 4.3
Crop 8.0 6.5 8.7 10.3 5.0 8.2 6.6 7.2 3.4 8.2 4.7 3 4.7
Animal Farming and Hunting 7.3 7.0 6.2 7.5 5.4 5.2 2.1 4.7 -1.5 4.2 0.6 6 3.3
Forestry 4.2 3.1 3.3 3.0 3.1 3.3 4.2 3.5 2.2 3.6 3.5 3.8 3.9
Fishing 34.0 26.5 1.7 5.9 21.3 19.4 32.5 30.6 0.1 0.5 11.3 2.3 2
Mining and Quarrying 21.4 12.8 44.2 57.7 12.7 6.3 -3.2 -25.6 -3.3 -29.8 -20.8 -21.9 91.4
Manufacturing 10.3 9.1 11.6 12.1 11.8 16.9 16.6 18.2 18.4 24.7 5.5 7.7 7.5
Large and Medium Scale Manufac-turing 12.6 10.3 13.6 14.1 15.9 24.2 21.6 23.1 22.9 19.2 6.0 10 9.8
Small Scale and Cottage Industries 5.6 6.4 7.0 7.2 4.2 1.9 4.3 3.8 2.5 36.9 4.6 3 2.6
Electricity and Water 4.8 5.0 2.5 19.1 13.5 10.0 6.8 4.5 15.0 4.9 3.3 4 7.2
Construction 11.3 11.7 10.9 12.8 31.5 38.7 23.9 31.6 25.0 20.7 15.7 15 9.9
Whole Sale and Retail Trade 15.8 11.7 9.3 5.9 12.5 10.1 17.7 12.3 8.2 6.5 12.3 11.7 6.4
Hotels and Restaurants 23.3 23.9 24.3 24.6 10.1 19.1 26.6 29.6 15.6 0.1 6.5 9 2.2
Transport and Communications 11.5 8.9 14.4 9.7 12.6 16.5 12.7 13.3 13.7 15.1 6.4 21 1.1
Financial Intermediation 28.1 16.5 -0.3 23.7 23.6 -12.2 14.3 7.5 9.6 18.3 10.7 10.1 10.2
Real Estate, Renting and Business Activities 17.3 15.9 20.0 22.1 3.8 3.9 3.9 4.1 3.7 4.4 6.2 7.5 9.5
Public Administration and Defense 12.5 18.4 8.9 9.4 3.1 7.6 11.0 6.0 7.4 13.2 8.9 9 2.3
Education 14.8 13.0 17.0 4.4 4.5 10.1 2.6 9.2 8.8 -3.2 3.6 4 1.8
Health and Social Work 15.5 20.4 14.0 6.2 9.4 12.3 19.3 13.0 10.8 7.0 8.3 14.3 12.9
Other Community , Social & Personal Services 11.7 6.4 8.1 4.9 12.4 18.4 3.8 3.7 3.0 4.5 5.1 6.3 2.5
Private Households with Employed Persons 5.3 3.8 4.8 5.1 16.1 8.2 4.4 4.4 4.3 3.5 3.9 2.5 2.3
Total 11.4 10.1 10.5 11.4 8.6 9.9 10.3 10.4 8.0 10.2 7.8 8.9 6.2
Less : FISIM 30.0 12.5 7.6 11.1 -10.6 6.4 19.4 17.9 16.9 17.6 16.0 7 14.3
Gross Value Added at Constant Basic Prices 11.2 10.0 10.6 11.4 8.7 9.9 10.3 10.4 8.0 10.1 7.7 9 6.1
Taxes on Products 5.6 -8.3 45.4 8.6 8.0 18.3 9.9 10.2 3.1 1.6 -5.0 -1.8 6.3
GDP at Constant Market Prices 10.8 8.8 12.6 11.2 8.6 10.6 10.3 10.4 7.6 9.5 6.8 8.3 6.1
Source: MoFED

Fourth Quarter 2020/21 | 111
National Bank of Ethiopia Quarterly Bulletin
Table: 17 Growth Rate Of GDP By Economic Activity at Constant Prices ( In percent)
Industry/Year2000 2001 2002 2003 2004 2005 2006 2007 2008 2009 2010 2011 2012
2007/08 2008/09 2009/10 2010/11 2011/12. 2012/13 2013/14 2014/15 2015/16 2016/17 2017/18 2018/19 2019/20
Agriculture, Hunting and Forestry 7.5 6.4 7.6 9.0 4.9 7.1 5.4 6.3 2.3 6.7 3.5 3.8 4.3
Crop 8.0 6.5 8.7 10.3 5.0 8.2 6.6 7.2 3.4 8.2 4.7 3 4.7
Animal Farming and Hunting 7.3 7.0 6.2 7.5 5.4 5.2 2.1 4.7 -1.5 4.2 0.6 6 3.3
Forestry 4.2 3.1 3.3 3.0 3.1 3.3 4.2 3.5 2.2 3.6 3.5 3.8 3.9
Fishing 34.0 26.5 1.7 5.9 21.3 19.4 32.5 30.6 0.1 0.5 11.3 2.3 2
Mining and Quarrying 21.4 12.8 44.2 57.7 12.7 6.3 -3.2 -25.6 -3.3 -29.8 -20.8 -21.9 91.4
Manufacturing 10.3 9.1 11.6 12.1 11.8 16.9 16.6 18.2 18.4 24.7 5.5 7.7 7.5
Large and Medium Scale Manufac-turing 12.6 10.3 13.6 14.1 15.9 24.2 21.6 23.1 22.9 19.2 6.0 10 9.8
Small Scale and Cottage Industries 5.6 6.4 7.0 7.2 4.2 1.9 4.3 3.8 2.5 36.9 4.6 3 2.6
Electricity and Water 4.8 5.0 2.5 19.1 13.5 10.0 6.8 4.5 15.0 4.9 3.3 4 7.2
Construction 11.3 11.7 10.9 12.8 31.5 38.7 23.9 31.6 25.0 20.7 15.7 15 9.9
Whole Sale and Retail Trade 15.8 11.7 9.3 5.9 12.5 10.1 17.7 12.3 8.2 6.5 12.3 11.7 6.4
Hotels and Restaurants 23.3 23.9 24.3 24.6 10.1 19.1 26.6 29.6 15.6 0.1 6.5 9 2.2
Transport and Communications 11.5 8.9 14.4 9.7 12.6 16.5 12.7 13.3 13.7 15.1 6.4 21 1.1
Financial Intermediation 28.1 16.5 -0.3 23.7 23.6 -12.2 14.3 7.5 9.6 18.3 10.7 10.1 10.2
Real Estate, Renting and Business Activities 17.3 15.9 20.0 22.1 3.8 3.9 3.9 4.1 3.7 4.4 6.2 7.5 9.5
Public Administration and Defense 12.5 18.4 8.9 9.4 3.1 7.6 11.0 6.0 7.4 13.2 8.9 9 2.3
Education 14.8 13.0 17.0 4.4 4.5 10.1 2.6 9.2 8.8 -3.2 3.6 4 1.8
Health and Social Work 15.5 20.4 14.0 6.2 9.4 12.3 19.3 13.0 10.8 7.0 8.3 14.3 12.9
Other Community , Social & Personal Services 11.7 6.4 8.1 4.9 12.4 18.4 3.8 3.7 3.0 4.5 5.1 6.3 2.5
Private Households with Employed Persons 5.3 3.8 4.8 5.1 16.1 8.2 4.4 4.4 4.3 3.5 3.9 2.5 2.3
Total 11.4 10.1 10.5 11.4 8.6 9.9 10.3 10.4 8.0 10.2 7.8 8.9 6.2
Less : FISIM 30.0 12.5 7.6 11.1 -10.6 6.4 19.4 17.9 16.9 17.6 16.0 7 14.3
Gross Value Added at Constant Basic Prices 11.2 10.0 10.6 11.4 8.7 9.9 10.3 10.4 8.0 10.1 7.7 9 6.1
Taxes on Products 5.6 -8.3 45.4 8.6 8.0 18.3 9.9 10.2 3.1 1.6 -5.0 -1.8 6.3
GDP at Constant Market Prices 10.8 8.8 12.6 11.2 8.6 10.6 10.3 10.4 7.6 9.5 6.8 8.3 6.1
Source: MoFED
Table: 18 GDP by Economic Activity at Current Prices (In million Birr)
Industry/Year2001 2002 2003 2004 2005 2006 2007 2008 2009 2010 2011 2012
2008/09 2009/10 2010/11 20011/12 2012/13 2013/14 2014/15 2015/16 2016/17 2017/18 2018/19 2019/20
Agriculture, Hunting and Forestry 343,066 370,012 422,902 484,026 542,700 616,843 684,644 910,589 1,196,254 684,644 910,589 1,196,254
Crop 234,212 238,052 272,201 309,349 346,294 393,324 427,193 587,216 797,016 427,193 587,216 797,016
Animal Farming and Hunting 82,070 101,728 113,693 132,287 146,960 164,730 191,867 247,337 303,074 191,867 247,337 303,074
Forestry 24,326 30,470 36,789 42,608 49,447 58,788 65,584 76,036 96,164 65,584 76,036 96,164
Fishing 455 685 796 1,225 1,382 2,259 2,351 3,021 3,720 2,351 3,021 3,720
Mining and Quarrying 9,645 10,045 8,986 6,259 6,117 4,840 4,053 3,368 9,643 4,053 3,368 9,643
Manufacturing 37,272 46,803 61,744 83,370 89,247 113,387 128,200 150,531 178,972 128,200 150,531 178,972
Large and Medium Scale Manufacturing 21,448 28,787 40,111 58,040 61,687 74,763 84,791 104,723 125,758 84,791 104,723 125,758
Small Scale and Cottage Industries 19,541 21,088 23,844 24,972 27,559 38,624 43,410 45,807 53,215 43,410 45,807 53,215
Electricity and Water 8,079 9,604 10,752 10,560 11,015 13,714 15,026 18,726 23,827 15,026 18,726 23,827
Construction 31,459 48,338 88,410 148,198 237,545 300,209 452,978 495,283 567,201 452,978 495,283 567,201
Whole Sale and Retail Trade 105,914 117,028 151,450 187,022 202,241 225,076 275,513 360,656 444,506 275,513 360,656 444,506
Hotels and Restaurants 13,355 18,004 24,954 33,841 41,601 44,922 53,441 66,597 79,304 53,441 66,597 79,304
Transport and Communications 31,954 41,221 49,215 57,579 70,453 77,659 82,947 99,884 140,237 82,947 99,884 140,237
Financial Intermediation 14,214 19,936 24,206 32,684 39,769 51,810 69,359 85,044 102,426 69,359 85,044 102,426
Real Estate, Renting and Business Activities 47,776 54,746 60,283 63,825 67,063 70,793 79,553 106,157 154,804 79,553 106,157 154,804
Public Administration and Defense 29,967 35,401 41,309 51,521 62,259 80,817 94,614 103,262 120,236 94,614 103,262 120,236
Education 17,092 21,637 28,739 35,388 42,386 61,123 75,776 85,739 94,199 75,776 85,739 94,199
Health and Social Work 5,966 7,593 9,881 12,917 15,669 18,770 24,100 27,328 34,928 24,100 27,328 34,928
Other Community , Social & Personal Services 9,618 13,303 14,779 16,721 18,371 20,568 23,634 28,141 33,306 23,634 28,141 33,306
Private Households with Employed Persons 7,678 9,443 12,024 15,327 16,064 19,879 25,428 31,181 38,264 25,428 31,181 38,264
Total 711,975 824,684 1,009,521 1,238,088 1,463,883 1,722,669 2,091,618 2,575,507 3,221,829 2,091,618 2,575,507 3,221,829
Less : FISIM 3,091 6,335 7,796 11,628 14,486 18,870 26,829 31,884 38,830 26,829 31,884 38,830
Gross Value Added at Current Basic Prices 710,012 818,870 1,002,351 1,226,637 1,449,397 1,703,798 2,064,789 2,543,623 3,182,998 2,064,789 2,543,623 3,182,998
Taxes on Products 56,882 70,618 86,098 105,129 118,700 128,755 137,583 152,600 191,351 137,583 152,600 191,351
GDP at Current Market Prices 766,915 889,645 1,088,632 1,331,984 1,568,097 1,832,554 2,202,373 2,696,223 3,374,349 2,202,373 2,696,223 3,374,349
Source: MoFED
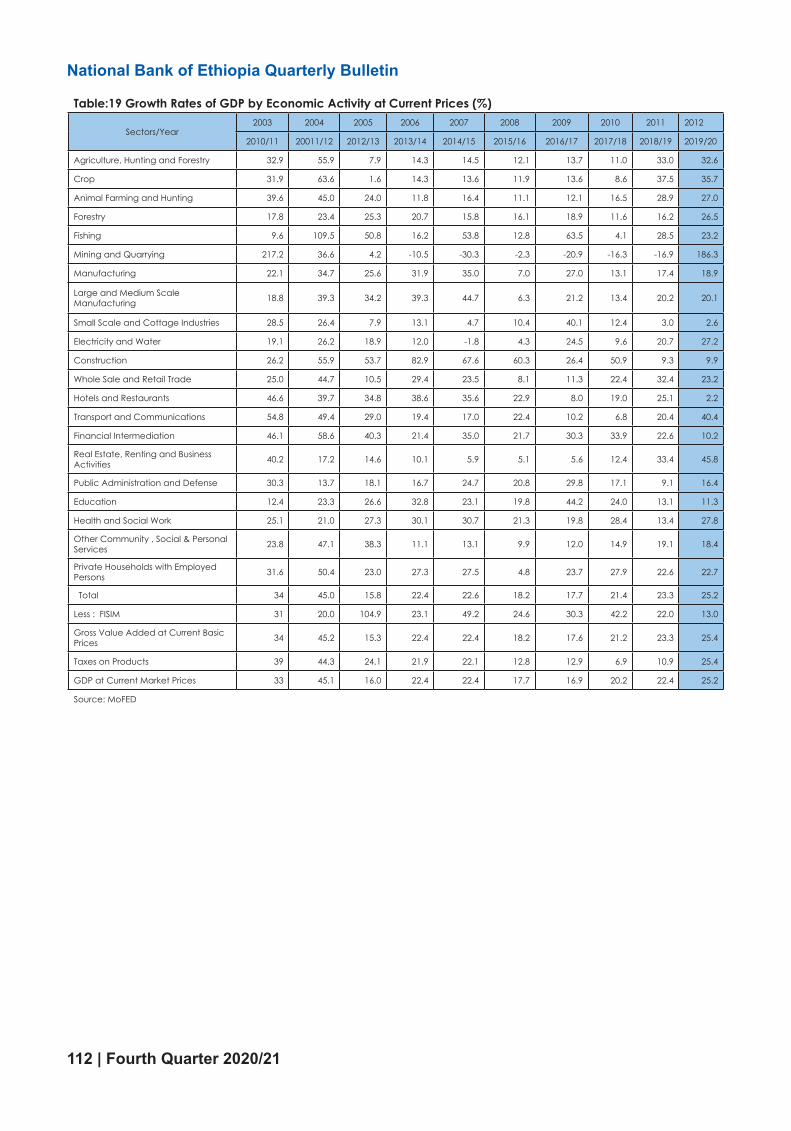
112 | Fourth Quarter 2020/21
National Bank of Ethiopia Quarterly Bulletin
Table:19 Growth Rates of GDP by Economic Activity at Current Prices (%)
Sectors/Year2003 2004 2005 2006 2007 2008 2009 2010 2011 2012
2010/11 20011/12 2012/13 2013/14 2014/15 2015/16 2016/17 2017/18 2018/19 2019/20
Agriculture, Hunting and Forestry 32.9 55.9 7.9 14.3 14.5 12.1 13.7 11.0 33.0 32.6
Crop 31.9 63.6 1.6 14.3 13.6 11.9 13.6 8.6 37.5 35.7
Animal Farming and Hunting 39.6 45.0 24.0 11.8 16.4 11.1 12.1 16.5 28.9 27.0
Forestry 17.8 23.4 25.3 20.7 15.8 16.1 18.9 11.6 16.2 26.5
Fishing 9.6 109.5 50.8 16.2 53.8 12.8 63.5 4.1 28.5 23.2
Mining and Quarrying 217.2 36.6 4.2 -10.5 -30.3 -2.3 -20.9 -16.3 -16.9 186.3
Manufacturing 22.1 34.7 25.6 31.9 35.0 7.0 27.0 13.1 17.4 18.9
Large and Medium Scale Manufacturing 18.8 39.3 34.2 39.3 44.7 6.3 21.2 13.4 20.2 20.1
Small Scale and Cottage Industries 28.5 26.4 7.9 13.1 4.7 10.4 40.1 12.4 3.0 2.6
Electricity and Water 19.1 26.2 18.9 12.0 -1.8 4.3 24.5 9.6 20.7 27.2
Construction 26.2 55.9 53.7 82.9 67.6 60.3 26.4 50.9 9.3 9.9
Whole Sale and Retail Trade 25.0 44.7 10.5 29.4 23.5 8.1 11.3 22.4 32.4 23.2
Hotels and Restaurants 46.6 39.7 34.8 38.6 35.6 22.9 8.0 19.0 25.1 2.2
Transport and Communications 54.8 49.4 29.0 19.4 17.0 22.4 10.2 6.8 20.4 40.4
Financial Intermediation 46.1 58.6 40.3 21.4 35.0 21.7 30.3 33.9 22.6 10.2
Real Estate, Renting and Business Activities 40.2 17.2 14.6 10.1 5.9 5.1 5.6 12.4 33.4 45.8
Public Administration and Defense 30.3 13.7 18.1 16.7 24.7 20.8 29.8 17.1 9.1 16.4
Education 12.4 23.3 26.6 32.8 23.1 19.8 44.2 24.0 13.1 11.3
Health and Social Work 25.1 21.0 27.3 30.1 30.7 21.3 19.8 28.4 13.4 27.8
Other Community , Social & Personal Services 23.8 47.1 38.3 11.1 13.1 9.9 12.0 14.9 19.1 18.4
Private Households with Employed Persons 31.6 50.4 23.0 27.3 27.5 4.8 23.7 27.9 22.6 22.7
Total 34 45.0 15.8 22.4 22.6 18.2 17.7 21.4 23.3 25.2
Less : FISIM 31 20.0 104.9 23.1 49.2 24.6 30.3 42.2 22.0 13.0
Gross Value Added at Current Basic Prices 34 45.2 15.3 22.4 22.4 18.2 17.6 21.2 23.3 25.4
Taxes on Products 39 44.3 24.1 21.9 22.1 12.8 12.9 6.9 10.9 25.4
GDP at Current Market Prices 33 45.1 16.0 22.4 22.4 17.7 16.9 20.2 22.4 25.2
Source: MoFED

Fourth Quarter 2020/21 | 113
National Bank of Ethiopia Quarterly Bulletin
Table:19 Growth Rates of GDP by Economic Activity at Current Prices (%)
Sectors/Year2003 2004 2005 2006 2007 2008 2009 2010 2011 2012
2010/11 20011/12 2012/13 2013/14 2014/15 2015/16 2016/17 2017/18 2018/19 2019/20
Agriculture, Hunting and Forestry 32.9 55.9 7.9 14.3 14.5 12.1 13.7 11.0 33.0 32.6
Crop 31.9 63.6 1.6 14.3 13.6 11.9 13.6 8.6 37.5 35.7
Animal Farming and Hunting 39.6 45.0 24.0 11.8 16.4 11.1 12.1 16.5 28.9 27.0
Forestry 17.8 23.4 25.3 20.7 15.8 16.1 18.9 11.6 16.2 26.5
Fishing 9.6 109.5 50.8 16.2 53.8 12.8 63.5 4.1 28.5 23.2
Mining and Quarrying 217.2 36.6 4.2 -10.5 -30.3 -2.3 -20.9 -16.3 -16.9 186.3
Manufacturing 22.1 34.7 25.6 31.9 35.0 7.0 27.0 13.1 17.4 18.9
Large and Medium Scale Manufacturing 18.8 39.3 34.2 39.3 44.7 6.3 21.2 13.4 20.2 20.1
Small Scale and Cottage Industries 28.5 26.4 7.9 13.1 4.7 10.4 40.1 12.4 3.0 2.6
Electricity and Water 19.1 26.2 18.9 12.0 -1.8 4.3 24.5 9.6 20.7 27.2
Construction 26.2 55.9 53.7 82.9 67.6 60.3 26.4 50.9 9.3 9.9
Whole Sale and Retail Trade 25.0 44.7 10.5 29.4 23.5 8.1 11.3 22.4 32.4 23.2
Hotels and Restaurants 46.6 39.7 34.8 38.6 35.6 22.9 8.0 19.0 25.1 2.2
Transport and Communications 54.8 49.4 29.0 19.4 17.0 22.4 10.2 6.8 20.4 40.4
Financial Intermediation 46.1 58.6 40.3 21.4 35.0 21.7 30.3 33.9 22.6 10.2
Real Estate, Renting and Business Activities 40.2 17.2 14.6 10.1 5.9 5.1 5.6 12.4 33.4 45.8
Public Administration and Defense 30.3 13.7 18.1 16.7 24.7 20.8 29.8 17.1 9.1 16.4
Education 12.4 23.3 26.6 32.8 23.1 19.8 44.2 24.0 13.1 11.3
Health and Social Work 25.1 21.0 27.3 30.1 30.7 21.3 19.8 28.4 13.4 27.8
Other Community , Social & Personal Services 23.8 47.1 38.3 11.1 13.1 9.9 12.0 14.9 19.1 18.4
Private Households with Employed Persons 31.6 50.4 23.0 27.3 27.5 4.8 23.7 27.9 22.6 22.7
Total 34 45.0 15.8 22.4 22.6 18.2 17.7 21.4 23.3 25.2
Less : FISIM 31 20.0 104.9 23.1 49.2 24.6 30.3 42.2 22.0 13.0
Gross Value Added at Current Basic Prices 34 45.2 15.3 22.4 22.4 18.2 17.6 21.2 23.3 25.4
Taxes on Products 39 44.3 24.1 21.9 22.1 12.8 12.9 6.9 10.9 25.4
GDP at Current Market Prices 33 45.1 16.0 22.4 22.4 17.7 16.9 20.2 22.4 25.2
Source: MoFED
Table 20: Value of Aggregate Output, Consumption, Investment and Savings at Current Prices
(In Millions of Birr)
Description / Year2004 2005 2006 2007 2008 2009 2010 2011 2012
2011 /12 2012/13 2013/14 2014/15 2015/16 2016/17 2017/18 2018/19 2019/20
Gross Value Added at Current Basic Prices 710,011.5 818,870.1 1,002,350.9 1,226,637.4 1,449,397.5 1,703,798.2 2,064,789.2 2,543,623.0 3,182,998.0
Taxes on Products, net 56,882.0 70,618.0 86,098.0 105,128.7 118,700.0 128,755.5 137,583.5 152,600.0 191,351.0
GDP at Current Market Prices 766,915.5 889,644.9 1,088,631.8 1,331,983.7 1,568,097.5 1,832,553.7 2,202,372.7 2,696,223.0 3,374,349.0
Incomes from ROW, net (1,659.8) (1,942.8) (2,914.6) (5,275.1) (5,122.4) (10,884.1) (14,349.1) (13,104.0) (18,270.0)
Gross National Income at Current Basic Prices 708,351.7 816,927.4 999,436.3 1,221,362.3 1,444,275.0 1,692,914.1 2,050,440.2 2,530,519.0 3,164,728.0
Gross National Income at Current Market Prices 765,255.7 887,702.1 1,085,717.2 1,326,708.6 1,562,975.0 1,821,669.6 2,188,023.6 2,683,118.6 3,356,079.5
Current Transfers from ROW, net 86,849.9 93,355.1 106,357.3 128,400.8 155,964.2 154,959.4 188,527.3 240,392.0 218,029.0
Gross National Disposable Income 852,105.6 981,057.2 1,192,074.5 1,455,109.4 1,718,939.2 1,976,628.9 2,376,550.9 2,923,510.0 3,574,109.0
Government Final Consumption Expenditure 72,783.5 91,074.7 115,104.0 137,245.8 174,598.8 203,607.9 225,523.2 247,362.0 307,769.0
Private Final Consumption Expenditure 544,140.3 639,963.8 748,560.3 900,516.9 1,042,264.6 1,219,365.9 1,441,581.1 1,848,070.0 2,360,896.0
Gross Capital Formation (Investment) 275,811.3 293,930.7 400,841.2 508,975.9 585,665.0 704,596.0 751,626.2 948,866.0 1,037,685.0
Exports of Goods and Services 102,886.6 108,227.1 123,496.0 121,532.2 122,500.8 139,830.1 184,282.1 213,437.0 239,229.0
Imports of Goods and Services 236,383.9 251,300.6 308,691.3 393,188.5 424,749.9 430,233.2 502,112.9 561,512.0 571,230.0
Resource Balance (133,497.3) (143,073.5) (185,195.3) (271,656.3) (302,249.2) (290,403.1) (317,830.8) (348,075.0) (332,001.0)
Gross Domestic Savings 149,991.7 158,606.3 224,967.5 294,221.0 351,234.0 409,579.8 535,268.5 600,791.0 705684
Gross National Savings 235,181.8 250,018.7 328,410.1 417,346.8 502,075.8 553,655.1 709,446.7 828,078.0 905,444.0
Mid-year Population (In Million) 82.7 84.8 87.0 89.1 91.2 93.4 95.5 97.6 99.7
Per Capita Nominal GDP (In Birr) 9,268.6 10,486.5 12,520.2 14,953.4 17,192.4 19,630.4 23,061.5 27,625.0 33,845.0
Per Capita Real GDP (In Birr) 13,090.3 14,118.3 15,189.1 16,366.5 17,192.4 18,393.9 19,204.9 20,312.5 21,153.1
Average Exchange Rate (Birr/USD) 17.3 18.3 19.1 20.1 21.1 22.4 26.1 28.1 31.3
Real GDP (In USD) 62,777.3 65,528.4 69,237.3 72,546.1 74,296.6 76,610.6 70,249.0 70,666.9 67,287.5
Nominal GDP (In USD)(Million) 44,449.6 48,671.9 57,071.7 66,282.4 74,296.6 81,760.4 84,356.0 96,107.0 107,660.0
Per Capita Nominal GDP (In USD) 537.2 573.7 656.4 744.1 814.6 875.8 883.3 985.0 1,080.0
Per Capita Real GDP (In USD) 758.7 772.4 796.3 814.4 814.6 820.7 735.6 724.3 675.0
GDP Deflator 0.71 0.74 0.82 0.91 1.00 1.07 1.20 1.36 1.60
Source: Planning commission

114 | Fourth Quarter 2020/21
National Bank of Ethiopia Quarterly Bulletin
Table 21: Growth Rates of Aggregate Output, Consumption, Investment and Savings ( Inpercent)
Description / Year2000 2001 2002 2003 2004 2005 2006 2007 2008 2009 2010 2011 2012
2007/08 2008 /09 2009 /10 2010/11 2011 /12 2012/13 2013/14 2014/15 2015/16 2016/17 2017/18 2018/19 2019/20
GDP at Current Basic Prices 45.2 15.3 22.4 22.4 18.2 17.6 21.2 23.3 25.4 17.6 21.2 23.3 25.4
Taxes on Products, net 44.3 24.1 21.9 22.1 12.9 8.5 6.9 10.9 25.4 8.5 6.9 10.9 25.4
GDP at Current Market Prices 45.1 16.0 22.4 22.4 17.7 16.9 20.2 22.5 25.4 16.9 20.2 22.5 25.4
Incomes from ROW, net (48.2) (17.0) (50.0) (81.0) (2.9) (112.5) (31.8) (33.0) (10.5) (112.5) (31.8) (33.0) (10.5)
Gross National Income at Current Basic Price 45.2 15.3 22.3 22.2 18.3 17.2 21.1 23.3 25.5 17.2 21.1 23.3 25.5
Gross National Income at Current Market Price 45.1 16.0 22.3 22.2 17.8 16.6 20.1 22.5 25.5 16.6 20.1 22.5 25.5
Current Transfers from ROW, net 17.0 7.5 13.9 20.7 21.5 (0.6) 21.7 25.7 (3.6) (0.6) 21.7 25.7 (3.6)
Gross National Disposable Income 41.6 15.1 21.5 22.1 18.1 15.0 20.2 22.8 23.2 15.0 20.2 22.8 23.2
Government Final Consump-tion Expenditure 16.7 25.1 26.4 19.2 27.2 16.6 10.8 9.7 24.4 16.6 10.8 9.7 24.4
Private Final Consumption Expenditure 45.1 17.6 17.0 20.3 15.7 17.0 18.2 27.9 27.7 17.0 18.2 27.9 27.7
Gross Capital Formation (Investment) 67.6 6.6 36.4 27.0 15.1 20.3 6.7 26.2 9.4 20.3 6.7 26.2 9.4
Exports of Goods and Services 19.7 5.2 14.1 (1.6) 0.8 14.1 31.8 15.9 12.0 14.1 31.8 15.9 12.0
Imports of Goods and Services 45.5 6.3 22.8 27.4 8.0 1.3 16.7 11.8 1.7 1.3 16.7 11.8 1.7
Resource Balance (74.4) (7.2) (29.4) (46.7) (11.3) 3.9 (9.4) (9.5) 4.6 3.9 (9.4) (9.5) 4.6
Gross Domestic Savings 64.2 5.7 41.8 30.8 19.4 16.6 30.7 12.2 17.5 16.6 30.7 12.2 17.5
Gross National Savings 43.0 6.3 31.4 27.1 20.3 10.3 28.1 16.4 12.5 10.3 28.1 16.4 12.5
Mid-year Population (in Million) 2.6 2.5 2.5 2.4 2.4 2.4 2.3 2.2 2.2 2.4 2.3 2.2 2.2
Per Capita GDP (Birr) (Nominal) 41.5 13.1 19.4 19.4 15.0 14.2 17.5 19.8 22.5 14.2 17.5 19.8 22.5
Per Capita GDP (Birr) (Real) 5.9 7.9 7.6 7.8 5.0 7.0 4.4 5.8 4.1 7.0 4.4 5.8 4.1
Average Exchange Rate (Birr/USD) 7.0 5.9 4.4 5.4 5.0 6.2 16.5 7.6 11.5 6.2 16.5 7.6 11.5
Real GDP (USD) 1.5 4.4 5.7 4.8 2.4 3.1 (8.3) 0.6 (4.8) 3.1 (8.3) 0.6 (4.8)
GDP at Current Market Prices(USD) 35.5 9.5 17.3 16.1 12.1 10.0 3.2 13.7 12.2 10.0 3.2 13.7 12.2
Per Capita GDP (USD) (Nominal) 32.2 6.8 14.4 13.4 9.5 7.5 0.9 11.5 9.6 7.5 0.9 11.5 9.6
Per Capita GDP (USD) (Real) (1.0) 1.8 3.1 2.3 0.0 0.7 (10.4) (1.5) (6.8) 0.7 (10.4) (1.5) (6.8)
Percentage Change in GDP Deflator 33.5 4.9 11.0 10.8 9.5 6.7 12.5 13.3 17.6 6.7 12.5 13.3 17.6
Source:Planning commission

Fourth Quarter 2020/21 | 115
National Bank of Ethiopia Quarterly Bulletin
Table 21: Growth Rates of Aggregate Output, Consumption, Investment and Savings ( Inpercent)
Description / Year2000 2001 2002 2003 2004 2005 2006 2007 2008 2009 2010 2011 2012
2007/08 2008 /09 2009 /10 2010/11 2011 /12 2012/13 2013/14 2014/15 2015/16 2016/17 2017/18 2018/19 2019/20
GDP at Current Basic Prices 45.2 15.3 22.4 22.4 18.2 17.6 21.2 23.3 25.4 17.6 21.2 23.3 25.4
Taxes on Products, net 44.3 24.1 21.9 22.1 12.9 8.5 6.9 10.9 25.4 8.5 6.9 10.9 25.4
GDP at Current Market Prices 45.1 16.0 22.4 22.4 17.7 16.9 20.2 22.5 25.4 16.9 20.2 22.5 25.4
Incomes from ROW, net (48.2) (17.0) (50.0) (81.0) (2.9) (112.5) (31.8) (33.0) (10.5) (112.5) (31.8) (33.0) (10.5)
Gross National Income at Current Basic Price 45.2 15.3 22.3 22.2 18.3 17.2 21.1 23.3 25.5 17.2 21.1 23.3 25.5
Gross National Income at Current Market Price 45.1 16.0 22.3 22.2 17.8 16.6 20.1 22.5 25.5 16.6 20.1 22.5 25.5
Current Transfers from ROW, net 17.0 7.5 13.9 20.7 21.5 (0.6) 21.7 25.7 (3.6) (0.6) 21.7 25.7 (3.6)
Gross National Disposable Income 41.6 15.1 21.5 22.1 18.1 15.0 20.2 22.8 23.2 15.0 20.2 22.8 23.2
Government Final Consump-tion Expenditure 16.7 25.1 26.4 19.2 27.2 16.6 10.8 9.7 24.4 16.6 10.8 9.7 24.4
Private Final Consumption Expenditure 45.1 17.6 17.0 20.3 15.7 17.0 18.2 27.9 27.7 17.0 18.2 27.9 27.7
Gross Capital Formation (Investment) 67.6 6.6 36.4 27.0 15.1 20.3 6.7 26.2 9.4 20.3 6.7 26.2 9.4
Exports of Goods and Services 19.7 5.2 14.1 (1.6) 0.8 14.1 31.8 15.9 12.0 14.1 31.8 15.9 12.0
Imports of Goods and Services 45.5 6.3 22.8 27.4 8.0 1.3 16.7 11.8 1.7 1.3 16.7 11.8 1.7
Resource Balance (74.4) (7.2) (29.4) (46.7) (11.3) 3.9 (9.4) (9.5) 4.6 3.9 (9.4) (9.5) 4.6
Gross Domestic Savings 64.2 5.7 41.8 30.8 19.4 16.6 30.7 12.2 17.5 16.6 30.7 12.2 17.5
Gross National Savings 43.0 6.3 31.4 27.1 20.3 10.3 28.1 16.4 12.5 10.3 28.1 16.4 12.5
Mid-year Population (in Million) 2.6 2.5 2.5 2.4 2.4 2.4 2.3 2.2 2.2 2.4 2.3 2.2 2.2
Per Capita GDP (Birr) (Nominal) 41.5 13.1 19.4 19.4 15.0 14.2 17.5 19.8 22.5 14.2 17.5 19.8 22.5
Per Capita GDP (Birr) (Real) 5.9 7.9 7.6 7.8 5.0 7.0 4.4 5.8 4.1 7.0 4.4 5.8 4.1
Average Exchange Rate (Birr/USD) 7.0 5.9 4.4 5.4 5.0 6.2 16.5 7.6 11.5 6.2 16.5 7.6 11.5
Real GDP (USD) 1.5 4.4 5.7 4.8 2.4 3.1 (8.3) 0.6 (4.8) 3.1 (8.3) 0.6 (4.8)
GDP at Current Market Prices(USD) 35.5 9.5 17.3 16.1 12.1 10.0 3.2 13.7 12.2 10.0 3.2 13.7 12.2
Per Capita GDP (USD) (Nominal) 32.2 6.8 14.4 13.4 9.5 7.5 0.9 11.5 9.6 7.5 0.9 11.5 9.6
Per Capita GDP (USD) (Real) (1.0) 1.8 3.1 2.3 0.0 0.7 (10.4) (1.5) (6.8) 0.7 (10.4) (1.5) (6.8)
Percentage Change in GDP Deflator 33.5 4.9 11.0 10.8 9.5 6.7 12.5 13.3 17.6 6.7 12.5 13.3 17.6
Source:Planning commission
Table 22(A): National Non-Food Consumer Price Index, December 100=2016
Perio
d
Gen
eral
In
dex
Food
and
N
on-
Alc
ohol
ic
Beve
rage
s
Alc
ohol
ic
Beve
rage
s an
d To
bacc
o
Clo
thin
g &
Foot
-wea
r
Hous
ing,
Wat
er,
Elec
trici
ty,
Gas
and
Oth
er
Fuel
s
Furn
ishin
gs,
Hous
ehol
d Eq
uipm
ent
and
Rout
ine
Mai
nten
ance
of
the
Hous
e
Heal
th
Tran
spor
t
Com
mun
icat
ion
Recr
eatio
n an
d C
ultu
re
Educ
atio
n
Rest
aura
nts
and
Hote
ls
Misc
ella
neou
s G
oods
Non
-Foo
d In
dex
2007/08Q.I 26.3 28.0 24.5 21.8 27.6 24.0 32.6 42.7 104.6 29.1 40.0 24.0 32.3 27.1Q.II 27.4 28.6 24.7 22.6 28.2 25.2 33.0 42.5 107.7 29.4 41.5 24.1 32.7 27.7Q.III 29.7 30.4 26.8 23.6 29.9 27.7 34.1 46.2 108.1 30.1 42.7 25.4 34.2 29.4Q.IV 35.1 32.8 29.4 25.0 32.8 30.1 35.6 48.2 107.0 30.6 44.1 27.7 36.3 31.8
2008/09Q.I 42.5 35.3 35.7 26.9 35.1 32.2 37.1 48.2 107.4 31.6 47.5 30.5 38.6 34.1Q.II 40.6 36.8 36.8 28.9 36.3 33.5 38.0 52.1 106.4 33.5 49.0 31.7 39.1 35.5Q.III 38.9 37.4 38.6 30.8 36.2 34.6 38.8 46.5 105.3 35.3 49.6 32.8 40.3 36.1Q.IV 39.6 38.7 39.8 32.4 37.1 36.1 41.1 48.4 104.1 37.1 51.4 33.7 42.7 37.4
2009/10Q.I 40.9 40.9 40.7 34.4 39.3 37.9 42.5 55.0 103.4 39.4 53.9 35.2 45.2 39.6Q.II 41.1 43.0 41.3 36.3 41.6 39.5 43.9 60.2 104.8 39.9 55.6 36.9 47.4 41.6Q.III 41.8 44.9 42.8 38.8 43.1 41.9 46.4 62.4 103.0 40.8 57.3 37.8 49.3 43.4Q.IV 42.5 46.3 44.8 40.4 44.3 43.6 47.8 65.3 101.1 43.2 57.7 38.8 50.3 44.8
2010/11Q.I 43.4 47.8 45.4 42.3 45.7 45.2 47.9 65.7 100.4 44.6 61.3 39.6 51.7 46.1Q.II 45.9 51.4 50.1 45.7 48.8 49.0 50.2 72.5 100.7 49.5 72.3 42.4 56.5 49.7Q.III 50.0 55.4 52.0 50.4 52.9 51.4 51.5 83.8 100.3 52.8 72.3 43.9 60.3 53.4Q.IV 56.9 58.7 57.2 54.2 54.9 54.7 52.9 96.6 100.0 54.3 74.5 48.9 63.3 56.8
2011/12Q.I 60.7 60.6 61.4 56.7 55.5 58.1 54.2 97.2 99.5 58.9 77.8 53.1 67.8 58.9Q.II 63.5 63.3 62.2 61.7 56.7 61.2 55.6 94.7 99.2 61.9 82.7 56.3 72.8 61.3Q.III 67.5 67.6 66.1 67.3 60.6 65.5 56.8 96.9 99.1 66.2 82.6 59.6 76.7 65.3Q.IV 71.5 69.6 65.5 70.9 62.0 68.5 58.0 97.5 99.1 67.5 85.1 63.1 78.5 67.2
2012/13Q.I 73.7 72.0 64.9 73.1 65.7 69.9 59.4 97.1 99.1 69.5 84.1 66.2 80.9 69.6Q.II 74.3 74.7 68.0 73.7 68.4 73.6 70.3 98.5 99.2 72.4 84.1 68.9 82.6 72.2Q.III 74.5 75.7 70.8 75.9 68.5 74.7 71.1 95.6 99.1 73.4 85.3 70.6 85.0 73.2Q.IV 76.2 77.3 70.7 78.0 70.0 77.1 73.3 95.0 99.1 74.6 86.7 72.9 86.2 74.7
2013/14Q.I 79.2 79.8 71.9 80.9 73.3 78.4 72.0 94.6 99.1 77.1 86.7 76.1 88.0 77.1Q.II 80.3 81.8 76.9 82.9 74.4 79.9 77.7 96.7 99.1 79.3 86.7 78.1 89.0 79.0Q.III 80.6 84.4 81.9 84.7 77.6 82.4 80.2 98.5 99.1 77.9 86.7 78.8 89.1 81.5Q.IV 82.9 85.8 82.1 86.4 79.5 83.8 82.9 99.2 99.1 75.5 86.9 80.3 89.2 82.9
2014/15Q.I 84.5 86.7 85.0 88.2 79.5 84.8 82.5 99.0 99.3 76.5 87.7 81.3 90.0 83.7Q.II 85.3 88.2 86.2 91.2 81.1 86.1 83.8 99.3 99.1 79.0 87.0 81.7 91.5 85.2Q.III 87.2 90.6 92.9 93.6 83.4 87.8 86.7 96.3 99.6 78.0 87.1 83.3 92.7 87.5Q.IV 91.0 92.8 96.2 94.5 86.7 89.7 86.1 94.8 101.2 78.4 87.2 85.4 93.9 89.7
2015/16Q.I 94.4 93.9 93.6 96.3 87.7 91.2 87.6 96.5 103.9 83.7 91.4 88.0 94.7 90.8Q.II 94.3 94.8 94.6 96.8 87.7 92.8 92.0 98.2 101.3 88.2 99.8 90.8 95.6 91.8Q.III 94.9 95.2 101.3 97.9 91.1 95.9 93.8 97.2 100.3 91.1 99.8 92.6 96.5 94.6Q.IV 97.8 98.7 94.9 99.0 97.0 96.9 97.4 97.0 101.5 92.3 99.9 94.9 97.8 96.9
2016/17QI 100.4 102.5 92.4 99.2 100.1 97.7 95.1 98.1 99.7 93.5 100.0 97.6 98.5 98.2QII 100.4 101.3 97.3 99.5 100.1 99.2 98.8 99.3 99.9 98.4 100.0 99.1 99.0 99.4QIII 102.4 103.0 104.4 100.7 102.3 101.2 104.3 103.9 99.8 99.0 100.0 98.1 100.9 101.7QIV 106.5 109.5 98.3 102.1 102.8 107.9 113.4 104.7 102.1 111.6 99.4 101.6 101.9 103.0
2017/18QI 112.0 113.9 104.5 116.0 113.3 111.1 97.0 106.3 101.7 113.1 106.0 107.9 102.2 109.9QII 115.6 116.6 110.7 119.8 119.7 115.3 92.9 108.9 103.4 114.0 107.5 113.5 104.5 114.5QIII 118.8 118.7 117.3 126.3 123.4 122.4 99.9 111.4 105.9 117.9 109.2 114.0 109.5 118.9QIV 122.8 123.1 108.2 135.8 127.8 129.1 101.3 113.2 107.2 120.9 110.4 118.6 115.6 122.5
2018/19QI 127.4 128.2 112.3 141.1 131.3 133.9 107.2 115.5 106.7 122.6 117.5 123.7 119.6 126.5QII 127.9 128.3 112.3 144.7 130.0 136.3 110.6 119.7 101.1 124.9 125.8 128.1 119.8 127.4QIII 131.9 132.0 121.2 150.7 133.1 141.5 116.0 128.9 101.5 126.6 126.3 130.8 123.6 131.8QIV 141.0 145.6 125.1 151.6 137.0 147.4 114.8 132.3 105.5 127.7 129.5 135.7 131.4 135.7
2019/20QI 149.5 156.6 127.0 156.4 144.7 150.0 120.2 136.0 105.6 129.8 132.6 145.9 135.6 141.4QII 153.1 158.5 131.5 158.6 153.8 151.4 126.6 139.5 102.8 141.4 134.1 152.0 139.8 146.8QIII 159.6 164.5 137.4 159.7 167.2 153.6 130.3 146.6 101.0 143.2 134.3 156.7 145.5 153.9QIV 171.2 179.2 163.0 167.1 168.5 156.4 143.4 192.6 108.1 140.3 135.6 159.3 149.5 161.9
2020/21QI 179.9 192.1 158.5 170.3 172.2 158.7 147.4 218.3 106.1 140.2 130.3 165.2 155.3 165.8QII 181.9 193.7 168.8 177.3 174.8 159.8 155.9 171.1 104.3 153.9 145.6 176.7 161.3 168.3QIII 191.9 201.8 176.8 185.6 188.5 173.6 170.6 200.0 117.3 163.1 149.9 183.3 169.3 180.4
QIV 207.7 224.0 184.0 199.0 189.2 196.7 189.6 209.5 125.9 175.6 152.8 192.8 184.7 188.9
Source: Central Statistical Agency(CSA) and NBE Staff Compilation

116 | Fourth Quarter 2020/21
National Bank of Ethiopia Quarterly BulletinTable 22 (B): National Food Consumer Price Index,
December 2016=100
Perio
d
Food
&
Non
-al-
coho
lic
Beve
rage
s
Brea
d an
d C
erea
ls
Mea
t
Fish
& S
ea
Food
Milk
, C
hees
e &
Egg
Oils
& F
ats
Fru
its
Vege
tabl
es
Suga
r, ja
m,
hone
y,
choc
olat
e &
conf
ectio
n-er
y
Food
pro
d-uc
ts
Non
-Alc
ohol
ic
Beve
rage
s
2007/08Q.I 25.9 27.2 21.7 19.9 28.2 19.8 21.4 26.7 43.4 26.5Q.II 27.4 29.1 22.2 20.6 31.3 21.0 22.8 26.1 45.0 28.4Q.III 30.0 32.2 23.6 22.6 35.0 24.4 25.9 29.2 43.7 29.8Q.IV 37.5 42.9 26.1 25.6 39.6 25.7 30.2 32.6 50.5 32.1
2008/09Q.I 48.1 60.7 28.7 28.2 39.5 28.7 33.1 39.6 57.0 32.8Q.II 44.1 57.2 28.9 29.1 37.9 34.0 32.5 42.0 44.0 33.0Q.III 40.9 52.5 28.9 30.3 35.9 33.0 34.5 48.4 28.7 33.9Q.IV 41.3 52.1 30.3 32.5 36.5 31.7 36.7 50.3 22.7 34.9
2009/10Q.I 41.9 53.7 31.0 33.4 36.1 34.4 34.1 51.3 23.7 38.0Q.II 41.0 51.8 31.1 34.1 36.0 36.0 34.7 52.4 26.9 41.8QIII 40.9 50.9 31.9 35.4 36.5 37.4 35.6 55.1 30.7 42.6QIV 41.1 49.7 33.2 35.8 38.6 35.6 36.2 56.5 40.6 42.3
2010/11QI 41.7 48.9 34.4 37.3 41.0 36.4 38.3 56.1 46.1 47.3Q.II 43.7 48.3 34.8 40.0 49.5 42.3 43.1 59.0 41.6 57.6Q.III 48.0 50.7 31.9 43.6 54.4 37.9 48.8 57.3 43.3 77.3Q.IV 57.4 58.9 35.9 46.8 74.2 40.1 56.5 60.0 62.4 90.9
2011/12Q.I 62.4 65.4 44.9 48.8 74.4 47.4 56.9 61.2 71.1 91.8Q.II 65.4 69.7 48.8 50.3 71.0 57.7 61.1 64.1 71.3 97.1Q.III 69.5 74.0 54.6 56.1 73.4 62.2 68.6 66.1 62.4 97.9Q.IV 75.4 80.7 64.7 61.1 79.2 62.8 75.4 68.3 67.9 90.3
2012/13Q.I 77.6 85.8 69.5 61.6 76.6 70.2 75.8 69.0 69.7 88.2Q.II 76.3 84.2 70.0 64.3 74.2 79.3 73.8 70.3 67.7 84.7Q.III 75.7 82.5 72.1 67.1 74.6 76.9 73.8 72.9 66.1 80.2Q.IV 77.5 86.1 73.7 67.8 77.0 73.6 74.5 73.2 68.2 78.7
2013/14Q.I 81.2 92.5 76.4 69.4 76.2 72.5 78.4 74.4 69.7 79.3Q.II 81.4 95.1 77.7 70.5 75.8 74.6 75.7 73.8 70.2 78.9Q.III 79.7 85.1 78.6 73.1 78.0 76.4 80.1 73.1 69.1 79.1Q.IV 82.9 88.9 80.5 74.2 81.5 74.2 79.8 74.2 75.1 94.3
2014/15Q.I 85.2 92.7 81.5 76.7 87.0 77.5 78.2 73.9 81.8 99.3Q.II 85.3 89.4 81.5 77.7 89.3 79.9 82.1 75.5 78.7 101.7Q.III 86.9 86.2 83.4 82.1 94.2 85.9 88.7 75.1 82.6 95.9Q.IV 92.1 89.3 86.7 89.5 101.4 84.5 94.3 76.5 100.1 91.1
2015/16Q.I 97.9 94.3 90.9 90.1 102.9 88.7 96.6 76.3 131.6 87.8QII 96.6 94.0 92.1 92.2 99.5 95.7 96.5 77.0 120.8 85.1QIII 95.2 95.7 92.8 96.9 96.6 96.2 96.5 81.7 101.2 81.1QIV 98.7 98.2 96.4 100.2 99.7 96.1 103.0 83.9 101.8 84.1
2016/17Q.I 102.6 102.9 100.7 99.4 99.9 98.7 106.8 86.7 104.6 92.3Q.II 101.3 102.7 100.6 100.0 100.8 99.3 99.6 100.0 94.6 105.6 99.3Q.III 103.0 100.7 100.8 98.9 103.8 102.3 103.2 107.4 96.1 109.2 97.3Q.IV 109.5 110.9 106.9 100.4 108.3 101.7 106.6 114.7 93.9 117.9 97.0
2017/18QI 113.9 123.6 113.8 101.1 108.5 100.5 119.5 110.2 94.4 122.0 101.3QII 116.6 125.7 115.7 104.2 112.4 96.9 128.9 113.8 95.9 125.0 108.5QIII 118.7 123.6 123.0 101.1 115.7 95.1 134.4 120.4 97.2 133.5 105.2QIV 123.1 133.8 131.5 110.8 122.8 95.1 133.8 116.9 98.1 137.4 109.7
2018/19 QI 128.2 139.7 137.0 112.1 127.8 95.9 133.1 124.8 102.1 136.9 115.9QII 128.3 140.0 137.1 114.2 129.8 97.5 141.0 124.3 105.3 137.8 112.1QIII 132.0 142.1 142.0 115.3 135.3 98.0 147.9 133.6 106.7 143.2 106.5QIV 145.7 156.8 157.9 113.3 145.6 104.6 160.2 157.8 112.0 148.1 109.6
2019/20QI 156.6 175.6 170.3 114.5 149.8 107.8 168.7 167.2 115.3 153.1 116.0QII 158.5 182.5 174.5 116.7 149.1 106.5 183.1 163.4 112.7 153.8 119.3QIII 164.5 182.7 179.2 122.9 153.4 112.9 187.7 171.3 104.9 177.4 127.5QIV 179.2 201.5 189.6 139.2 158.9 118.5 187.0 189.1 107.1 195.5 137.9
2020/21QI 192.1 216.9 192.7 150.7 163.3 123.7 175.9 208.2 106.2 209.3 151.4QII 193.7 223.7 196.3 148.8 172.5 135.7 182.6 192.9 114.1 210.0 159.7QIII 201.8 233.6 200.6 158.4 191.7 147.3 195.4 202.0 117.9 213.4 159.4QIV 224.0 265.3 225.7 161.6 216.8 181.1 204.5 212.4 120.3 234.8 170.8
Source: CSA and NBE Staff Compilation.

Fourth Quarter 2020/21 | 117
National Bank of Ethiopia Quarterly BulletinTable 22 (B): National Food Consumer Price Index,
December 2016=100
Perio
d
Food
&
Non
-al-
coho
lic
Beve
rage
s
Brea
d an
d C
erea
ls
Mea
t
Fish
& S
ea
Food
Milk
, C
hees
e &
Egg
Oils
& F
ats
Fru
its
Vege
tabl
es
Suga
r, ja
m,
hone
y,
choc
olat
e &
conf
ectio
n-er
y
Food
pro
d-uc
ts
Non
-Alc
ohol
ic
Beve
rage
s
2007/08Q.I 25.9 27.2 21.7 19.9 28.2 19.8 21.4 26.7 43.4 26.5Q.II 27.4 29.1 22.2 20.6 31.3 21.0 22.8 26.1 45.0 28.4Q.III 30.0 32.2 23.6 22.6 35.0 24.4 25.9 29.2 43.7 29.8Q.IV 37.5 42.9 26.1 25.6 39.6 25.7 30.2 32.6 50.5 32.1
2008/09Q.I 48.1 60.7 28.7 28.2 39.5 28.7 33.1 39.6 57.0 32.8Q.II 44.1 57.2 28.9 29.1 37.9 34.0 32.5 42.0 44.0 33.0Q.III 40.9 52.5 28.9 30.3 35.9 33.0 34.5 48.4 28.7 33.9Q.IV 41.3 52.1 30.3 32.5 36.5 31.7 36.7 50.3 22.7 34.9
2009/10Q.I 41.9 53.7 31.0 33.4 36.1 34.4 34.1 51.3 23.7 38.0Q.II 41.0 51.8 31.1 34.1 36.0 36.0 34.7 52.4 26.9 41.8QIII 40.9 50.9 31.9 35.4 36.5 37.4 35.6 55.1 30.7 42.6QIV 41.1 49.7 33.2 35.8 38.6 35.6 36.2 56.5 40.6 42.3
2010/11QI 41.7 48.9 34.4 37.3 41.0 36.4 38.3 56.1 46.1 47.3Q.II 43.7 48.3 34.8 40.0 49.5 42.3 43.1 59.0 41.6 57.6Q.III 48.0 50.7 31.9 43.6 54.4 37.9 48.8 57.3 43.3 77.3Q.IV 57.4 58.9 35.9 46.8 74.2 40.1 56.5 60.0 62.4 90.9
2011/12Q.I 62.4 65.4 44.9 48.8 74.4 47.4 56.9 61.2 71.1 91.8Q.II 65.4 69.7 48.8 50.3 71.0 57.7 61.1 64.1 71.3 97.1Q.III 69.5 74.0 54.6 56.1 73.4 62.2 68.6 66.1 62.4 97.9Q.IV 75.4 80.7 64.7 61.1 79.2 62.8 75.4 68.3 67.9 90.3
2012/13Q.I 77.6 85.8 69.5 61.6 76.6 70.2 75.8 69.0 69.7 88.2Q.II 76.3 84.2 70.0 64.3 74.2 79.3 73.8 70.3 67.7 84.7Q.III 75.7 82.5 72.1 67.1 74.6 76.9 73.8 72.9 66.1 80.2Q.IV 77.5 86.1 73.7 67.8 77.0 73.6 74.5 73.2 68.2 78.7
2013/14Q.I 81.2 92.5 76.4 69.4 76.2 72.5 78.4 74.4 69.7 79.3Q.II 81.4 95.1 77.7 70.5 75.8 74.6 75.7 73.8 70.2 78.9Q.III 79.7 85.1 78.6 73.1 78.0 76.4 80.1 73.1 69.1 79.1Q.IV 82.9 88.9 80.5 74.2 81.5 74.2 79.8 74.2 75.1 94.3
2014/15Q.I 85.2 92.7 81.5 76.7 87.0 77.5 78.2 73.9 81.8 99.3Q.II 85.3 89.4 81.5 77.7 89.3 79.9 82.1 75.5 78.7 101.7Q.III 86.9 86.2 83.4 82.1 94.2 85.9 88.7 75.1 82.6 95.9Q.IV 92.1 89.3 86.7 89.5 101.4 84.5 94.3 76.5 100.1 91.1
2015/16Q.I 97.9 94.3 90.9 90.1 102.9 88.7 96.6 76.3 131.6 87.8QII 96.6 94.0 92.1 92.2 99.5 95.7 96.5 77.0 120.8 85.1QIII 95.2 95.7 92.8 96.9 96.6 96.2 96.5 81.7 101.2 81.1QIV 98.7 98.2 96.4 100.2 99.7 96.1 103.0 83.9 101.8 84.1
2016/17Q.I 102.6 102.9 100.7 99.4 99.9 98.7 106.8 86.7 104.6 92.3Q.II 101.3 102.7 100.6 100.0 100.8 99.3 99.6 100.0 94.6 105.6 99.3Q.III 103.0 100.7 100.8 98.9 103.8 102.3 103.2 107.4 96.1 109.2 97.3Q.IV 109.5 110.9 106.9 100.4 108.3 101.7 106.6 114.7 93.9 117.9 97.0
2017/18QI 113.9 123.6 113.8 101.1 108.5 100.5 119.5 110.2 94.4 122.0 101.3QII 116.6 125.7 115.7 104.2 112.4 96.9 128.9 113.8 95.9 125.0 108.5QIII 118.7 123.6 123.0 101.1 115.7 95.1 134.4 120.4 97.2 133.5 105.2QIV 123.1 133.8 131.5 110.8 122.8 95.1 133.8 116.9 98.1 137.4 109.7
2018/19 QI 128.2 139.7 137.0 112.1 127.8 95.9 133.1 124.8 102.1 136.9 115.9QII 128.3 140.0 137.1 114.2 129.8 97.5 141.0 124.3 105.3 137.8 112.1QIII 132.0 142.1 142.0 115.3 135.3 98.0 147.9 133.6 106.7 143.2 106.5QIV 145.7 156.8 157.9 113.3 145.6 104.6 160.2 157.8 112.0 148.1 109.6
2019/20QI 156.6 175.6 170.3 114.5 149.8 107.8 168.7 167.2 115.3 153.1 116.0QII 158.5 182.5 174.5 116.7 149.1 106.5 183.1 163.4 112.7 153.8 119.3QIII 164.5 182.7 179.2 122.9 153.4 112.9 187.7 171.3 104.9 177.4 127.5QIV 179.2 201.5 189.6 139.2 158.9 118.5 187.0 189.1 107.1 195.5 137.9
2020/21QI 192.1 216.9 192.7 150.7 163.3 123.7 175.9 208.2 106.2 209.3 151.4QII 193.7 223.7 196.3 148.8 172.5 135.7 182.6 192.9 114.1 210.0 159.7QIII 201.8 233.6 200.6 158.4 191.7 147.3 195.4 202.0 117.9 213.4 159.4QIV 224.0 265.3 225.7 161.6 216.8 181.1 204.5 212.4 120.3 234.8 170.8
Source: CSA and NBE Staff Compilation.
Table 22 (C): Addis Ababa Non-Food Consumer Price Index , December 2016=100
Perio
d
Gen
eral
In
dex
Food
&
Non
-alc
ohol
-ic
Bev
erag
es
Alc
ohol
ic
beve
rage
s &
Toba
cco
Clo
thin
g &
Foo-
twea
r
Hosin
g,W
a-te
r,Ele
ctric
-ity
,Gas
and
O
ther
Fue
ls
Furn
ishin
gs,
Hous
ehol
d Eq
uipm
ent
and
Rout
ine
Mai
nten
ance
of
the
Hous
e
Heal
th
Tran
spor
t
Com
mun
i-ca
tion
Recr
eatio
n an
d C
ultu
re
Educ
atio
n
Rest
aura
nts
and
Hote
ls
Misc
ella
ne-
ous
Goo
ds
Non
-Foo
d In
dex
2006/07Q.I 25.4 20.8 24.0 18.8 38.3 23.1 32.3 42.8 41.9 35.1 31.2 18.7 25.2 29.6Q.II 26.6 22.0 24.2 19.2 39.3 23.8 33.1 45.6 44.7 38.2 34.0 19.4 25.0 30.7Q.III 27.3 23.0 25.0 20.2 39.1 25.0 35.3 45.0 44.1 36.4 32.4 21.2 25.1 30.9Q.IV 28.5 24.8 25.6 20.7 39.6 26.6 37.5 45.0 44.1 36.7 32.6 21.0 25.5 31.6
2007/08Q.I 29.7 26.9 26.2 21.6 39.6 27.1 38.3 45.1 44.1 37.7 33.5 21.4 26.2 32.0Q.II 30.3 27.0 27.1 24.4 38.6 29.6 40.3 44.8 43.9 38.9 34.5 22.6 26.9 32.9Q.III 32.8 29.5 29.8 25.8 41.4 34.0 42.4 48.1 47.1 40.4 35.9 23.0 28.2 35.5Q.IV 37.5 36.3 31.9 27.0 45.7 36.7 43.9 49.7 48.7 42.0 37.3 26.4 30.5 38.0
2008/09Q.I 41.9 43.8 37.0 29.3 46.4 38.0 47.3 49.7 48.6 41.9 37.2 28.6 32.5 39.4Q.II 42.4 42.7 39.2 31.0 48.0 39.4 48.3 55.4 54.2 45.5 40.4 29.8 33.0 41.5Q.III 41.4 40.8 43.2 32.7 46.3 40.4 48.2 51.8 50.7 48.1 42.8 30.2 33.8 41.4Q.IV 42.8 42.2 43.4 34.1 47.2 41.7 49.8 53.8 52.7 49.7 44.2 32.1 36.5 42.8
2009/10Q.I 44.8 43.6 43.7 35.6 49.8 42.6 52.3 61.9 60.6 50.2 44.6 34.2 38.9 45.3Q.II 46.1 44.2 44.3 36.4 51.6 45.4 52.9 67.1 65.7 52.0 46.2 37.4 41.3 47.3Q.III 46.2 43.2 45.1 37.7 52.3 47.4 52.9 68.5 67.1 53.6 47.7 40.2 42.6 48.5Q.IV 48.3 45.5 47.6 39.1 54.1 49.7 55.0 72.3 70.8 53.8 47.8 42.5 43.3 50.4
2010/11Q.I 50.5 48.2 49.7 42.8 54.4 51.6 55.3 71.9 70.4 56.6 50.3 44.9 44.9 52.0Q.II 53.8 49.4 55.9 47.9 59.9 56.1 56.8 80.0 78.3 65.0 57.8 46.8 48.6 57.3Q.III 56.1 49.5 54.3 51.1 65.6 59.7 57.3 88.3 86.5 66.0 58.6 47.6 55.3 61.6Q.IV 61.1 55.4 57.9 55.3 68.2 64.2 60.2 98.7 96.6 65.8 58.5 50.7 59.2 65.7
2011/12Q.I 64.6 60.1 62.7 58.9 69.6 65.2 62.2 98.6 96.5 68.6 61.0 54.4 62.9 67.9Q.II 67.3 64.2 65.6 64.5 69.2 68.5 65.3 99.1 97.1 75.1 66.8 57.3 66.4 70.6Q.III 70.6 67.0 71.4 70.5 70.6 72.4 67.1 102.2 100.0 75.6 67.1 59.0 70.4 73.4Q.IV 74.0 73.3 71.7 72.1 71.8 73.8 69.6 102.2 100.0 76.7 72.2 59.0 72.4 74.6
2012/13Q.I 76.5 75.8 72.0 75.8 77.4 75.6 71.3 101.3 100.0 78.2 70.2 59.0 74.6 77.0Q.II 77.4 74.4 72.4 80.9 80.1 76.8 73.1 101.3 100.0 81.0 70.2 64.8 77.3 79.7Q.III 77.8 73.2 79.0 82.6 81.5 79.5 76.5 101.3 100.0 82.4 72.6 66.8 80.6 81.4Q.IV 79.6 75.7 81.1 84.8 81.5 81.8 80.9 101.2 100.0 84.0 75.0 68.8 82.0 82.5
2013/14Q.I 82.8 78.9 84.0 86.2 85.7 83.4 74.9 101.4 100.0 86.9 75.1 78.3 83.6 85.8Q.II 83.8 77.6 88.6 87.4 88.7 84.8 77.2 106.0 100.0 94.4 75.1 82.8 85.6 88.6Q.III 84.6 76.7 87.6 90.3 91.5 88.3 79.6 110.2 100.0 96.4 75.1 82.3 86.0 90.6Q.IV 86.7 79.6 92.4 93.3 91.9 90.8 85.5 110.4 100.0 98.3 75.1 85.8 85.6 92.1
2014/15Q.I 88.6 83.9 94.0 93.5 91.2 90.0 90.7 110.3 100.0 100.9 75.1 86.9 88.8 92.3Q.II 88.9 84.2 94.1 94.0 91.3 90.6 94.3 109.6 100.0 97.9 75.1 87.0 89.3 92.5Q.III 90.9 87.7 95.9 94.8 92.8 93.1 95.3 101.2 100.0 98.1 75.1 91.2 93.8 93.4Q.IV 95.1 95.4 94.8 97.4 95.2 95.5 96.0 98.8 100.0 97.4 75.1 92.8 96.3 94.8
2015/16Q.I 101.4 107.4 95.7 99.8 97.7 96.1 96.8 99.7 100.0 98.0 83.4 93.9 98.2 96.8QII 100.8 103.3 99.4 100.5 98.2 98.0 99.9 100.0 100.0 99.6 100.0 98.0 99.2 98.9QIII 98.2 97.0 98.4 101.4 96.5 103.8 102.3 98.3 100.0 101.3 100.0 99.4 101.6 99.2QIV 100.6 101.7 100.4 103.5 96.4 105.4 102.7 97.5 100.0 103.5 100.0 100.5 102.5 99.7
2016/17QI 103.9 107.3 109.8 105.0 97.9 107.8 103.6 97.5 100.0 105.0 100.0 103.3 102.1 101.3QII 101.5 102.2 104.7 104.0 98.6 105.1 102.5 98.3 100.0 104.4 100.0 102.5 101.2 100.9QIII 100.9 100.4 103.8 100.6 101.7 101.7 98.5 104.1 100.0 99.5 97.4 100.1 103.2 101.3QIV 104.1 104.4 100.9 94.8 103.0 107.5 107.6 107.9 114.4 105.4 96.9 99.9 102.5 103.8
2017/18QI 112.3 109.2 103.3 98.8 133.7 114.3 113.7 106.5 115.3 107.3 100.4 104.9 100.9 114.8QII 117.6 110.3 103.0 101.2 151.3 120.5 113.9 106.9 116.5 107.3 99.9 118.5 106.5 123.1QIII 121.1 113.1 112.7 104.8 158.3 126.6 117.3 107.7 116.8 109.7 99.7 120.2 111.3 127.2QIV 127.1 117.7 114.1 111.3 170.0 132.4 131.8 109.4 116.8 112.2 100.1 127.5 119.4 134.2
2018/19QI 132.1 125.2 115.1 113.8 171.4 136.5 130.1 113.6 116.8 112.4 113.3 136.1 122.4 137.4QII 133.0 123.7 116.1 115.5 172.8 142.5 135.8 116.1 120.4 112.6 122.3 137.7 123.1 140.0QIII 137.5 127.5 126.1 116.3 186.6 147.0 133.0 117.8 119.2 112.8 120.8 138.7 127.0 145.1QIV 145.3 141.4 127.1 121.1 188.3 153.5 139.6 121.5 118.0 115.7 121.9 142.9 130.7 148.2
2019/20QI 152.8 155.5 126.7 123.3 192.5 155.8 140.5 123.6 118.3 118.2 125.4 144.9 134.5 150.8QII 156.7 157.1 125.2 121.4 207.3 160.0 138.4 125.9 116.8 125.2 128.4 149.4 140.2 156.5QIII 163.1 160.9 149.7 131.6 225.7 163.9 150.4 124.3 114.6 124.4 132.1 154.1 143.7 164.9QIV 178.2 178.6 174.4 138.2 241.2 164.8 155.8 191.5 114.8 119.9 130.6 154.6 147.9 177.9
2020/21QI 186.4 197.7 179.4 149.4 236.5 165.7 162.7 181.7 115.0 122.1 118.1 158.2 154.1 177.7QII 185.7 194.4 175.0 155.2 243.1 169.9 169.6 149.6 115.5 132.1 143.2 160.8 159.0 179.2QIII 193.6 201.4 188.1 165.5 254.3 181.6 184.4 155.2 115.6 131.1 150.5 167.2 166.7 187.7QIV 212.2 229.5 209.6 176.6 267.7 202.7 188.3 161.4 116.8 135.2 148.7 179.1 180.8 199.0
Source: Central Statistical Agency (CSA) & NBE staff Compilation

118 | Fourth Quarter 2020/21
National Bank of Ethiopia Quarterly BulletinTable 22(D): Addis Ababa Food Consumer Price Index
December 2016=100
Perio
d
Food
&
Non
-al-
coho
lic
Beve
rage
s
Brea
d an
d C
erea
ls
Mea
t
Fish
& S
ea
Food
Milk
, C
hees
e &
Egg
Oils
& F
ats
Fru
its
Vege
tabl
es
Suga
r, ja
m,
hone
y,
choc
olat
e an
d co
n-fe
ctio
nery
Food
pro
d-uc
ts
Non
-Al-
coho
lic
Beve
rage
s
2006/07Q.I 20.7 22.4 19.9 16.7 19.3 17.5 16.3 38.6 20.5 19.2Q.II 21.9 23.9 20.5 17.2 21.3 18.4 17.2 36.7 21.6 19.4Q.III 22.9 24.5 20.9 17.8 23.8 21.5 20.0 36.7 28.9 20.7Q.IV 24.7 25.5 22.5 20.2 27.1 20.9 19.5 37.0 44.3 21.0
2007/08Q.I 26.7 26.3 23.0 20.9 29.2 23.4 21.9 36.1 71.8 22.3Q.II 26.9 26.9 23.3 21.2 31.4 26.5 24.8 34.5 62.7 24.8Q.III 29.3 29.6 23.9 22.1 34.9 36.1 33.7 39.8 63.0 26.3Q.IV 36.1 40.5 27.3 25.0 41.9 39.8 37.2 41.3 75.1 27.5
2008/09Q.I 43.5 52.1 31.4 29.8 40.9 42.0 39.2 50.6 80.2 27.4Q.II 42.4 52.8 31.7 31.3 39.1 39.9 37.3 50.2 61.1 26.9Q.III 40.6 50.5 30.7 31.5 37.2 43.7 40.8 61.7 41.2 26.7Q.IV 41.9 51.4 32.2 33.2 40.0 48.6 45.4 66.3 32.1 26.9
2009/10Q.I 43.3 53.8 33.7 36.6 39.6 42.3 39.5 67.7 33.5 32.7Q.II 43.9 53.5 33.7 36.2 39.4 40.9 38.2 74.2 45.3 37.4Q.III 42.9 50.4 34.3 35.9 39.9 41.3 38.6 72.8 45.2 37.0QIV 45.2 51.0 36.9 37.3 40.6 45.2 42.2 73.9 62.7 35.7
2010/11Q.I 47.9 50.7 38.6 38.5 42.9 53.9 50.4 78.7 70.3 39.7Q.II 49.1 50.6 39.2 39.5 50.8 56.8 53.0 82.2 55.6 50.7Q.III 49.2 49.4 38.9 40.9 54.3 60.3 56.3 72.5 60.5 65.4Q.IV 55.0 54.8 40.1 42.6 74.4 62.1 58.0 74.1 87.9 78.1
2011/12Q.I 59.7 58.2 47.5 46.9 77.1 54.1 50.5 74.4 102.7 81.1Q.II 63.8 61.2 52.4 52.0 74.1 57.3 53.5 75.6 95.7 88.4Q.III 66.6 64.1 57.0 55.8 75.5 63.3 63.3 76.7 91.6 89.7Q.IV 72.8 71.7 68.6 58.5 79.3 65.0 68.5 77.6 95.2 86.7
2012/13Q.I 75.4 77.3 70.9 63.4 77.9 71.8 71.8 77.6 88.6 84.6Q.II 74.0 79.7 69.1 67.3 77.6 73.1 66.8 77.6 76.6 82.7Q.III 72.7 78.5 73.3 69.4 79.0 80.4 59.7 77.6 73.0 79.7Q.IV 75.2 79.8 74.3 70.1 81.6 84.0 67.8 77.6 70.9 76.4
2013/14Q.I 78.5 82.3 75.7 71.8 81.6 83.5 75.6 77.6 76.3 78.0Q.II 77.1 84.0 75.4 71.5 81.1 79.1 67.2 77.8 79.4 78.7Q.III 76.2 78.1 77.6 71.6 81.2 86.3 70.4 78.0 73.4 80.3Q.IV 79.1 78.9 81.1 73.4 83.6 87.2 69.9 82.7 95.6 89.6
2014/15Q.I 83.3 82.2 81.4 75.8 89.0 84.3 72.1 82.6 127.8 91.1Q.II 83.7 82.4 78.6 79.3 94.0 84.1 78.0 82.7 104.0 95.0Q.III 87.2 79.8 81.3 80.8 99.9 103.1 86.5 81.2 120.9 94.7Q.IV 94.8 82.1 84.6 88.6 110.4 101.4 91.1 83.1 188.2 91.7
2015/16Q.I 106.7 84.4 93.8 94.3 110.6 101.9 99.0 83.5 317.2 88.5Q.II 102.7 86.1 96.9 95.8 108.1 101.0 100.3 83.6 229.0 87.6QIII 96.4 88.9 95.8 95.7 99.6 113.7 95.4 94.0 141.8 85.8QIV 101.1 93.3 98.4 96.7 101.7 113.7 108.3 99.8 130.6 88.6
2016/17QI 106.7 98.6 101.1 98.9 103.0 103.3 122.3 96.8 130.7 93.1QII 101.8 102.3 100.8 100.0 99.8 102.1 96.9 100.8 96.5 112.0 97.4QIII 100.4 98.6 97.6 91.6 101.8 105.0 108.8 105.5 100.0 93.8 97.7QIV 104.4 101.8 106.4 99.9 102.2 107.3 118.7 112.6 99.0 86.1 94.2
2017/18QI 109.2 109.9 114.6 101.9 105.6 109.5 134.3 111.4 100.0 86.6 100.4QII 110.3 112.8 114.8 98.4 105.5 109.1 132.5 106.9 100.0 104.0 105.8QIII 113.1 111.2 117.2 100.4 110.2 110.2 140.3 106.2 100.0 155.7 105.2QIV 117.7 117.4 126.0 112.3 121.4 114.8 139.3 105.6 100.0 160.3 105.7
2018/19QI 125.2 124.7 130.0 109.2 125.3 116.0 135.4 123.0 100.0 161.4 109.3QII 123.7 125.5 127.9 110.4 129.0 116.1 138.4 117.6 100.0 154.7 109.6QIII 127.5 129.6 135.4 119.4 128.7 117.3 151.8 121.0 100.0 154.9 109.6QIV 141.4 136.3 151.8 114.2 134.9 122.0 170.9 155.0 114.1 154.1 112.8
2019/20QI 155.5 155.6 164.5 133.0 142.5 131.2 176.5 171.6 114.1 162.7 116.0QII 157.1 159.2 171.8 129.1 147.0 133.8 184.5 162.4 114.1 171.0 118.7QIII 160.9 162.1 175.2 131.2 146.6 142.2 190.7 163.6 114.1 183.3 127.6QIV 178.6 181.4 182.7 138.1 153.6 150.4 175.8 185.0 114.1 256.7 138.8
2020/21QI 197.7 194.1 191.8 191.4 158.2 158.2 160.1 218.4 109.3 353.2 144.3QII 211.7 220.8 213.6 181.0 174.8 184.7 205.2 185.9 141.3 414.7 163.2QIII 201.4 212.8 197.9 188.5 170.7 174.0 205.1 180.1 141.3 369.3 161.4QIV 229.5 233.9 238.1 179.6 185.1 204.9 211.6 195.0 141.0 501.2 167.2
Source: Central Statistical Agency & NBE staff Compilation
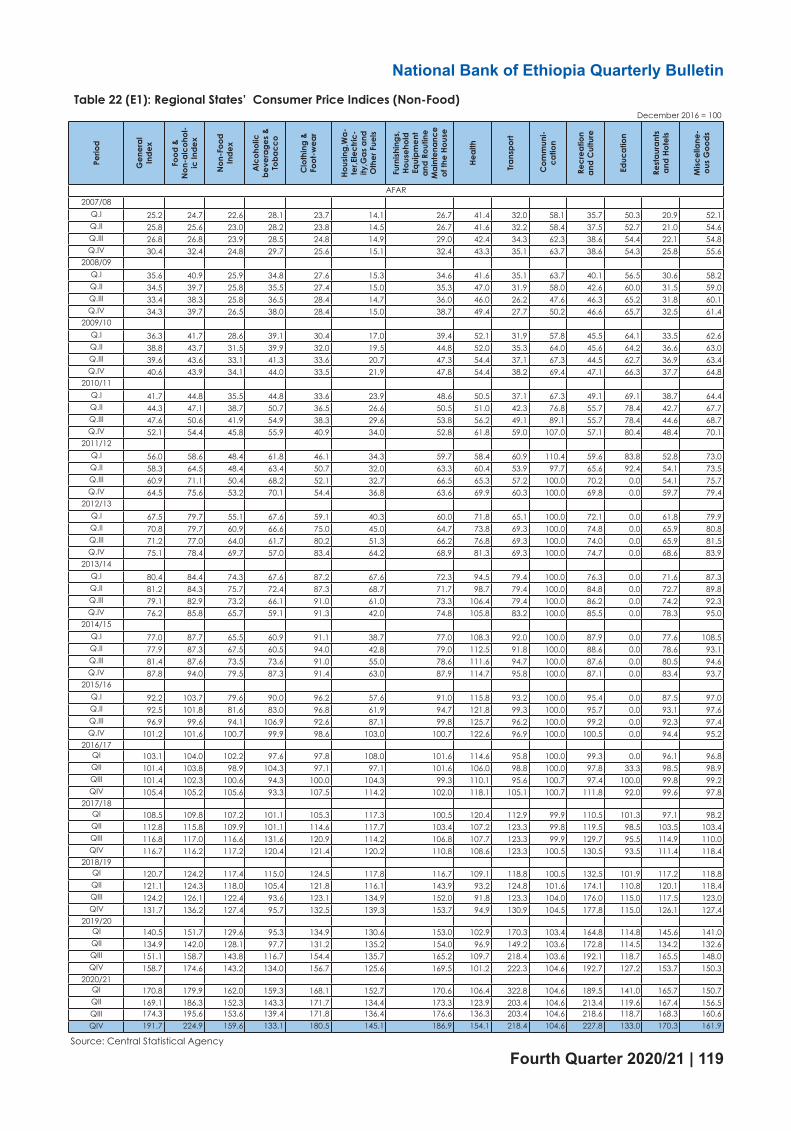
Fourth Quarter 2020/21 | 119
National Bank of Ethiopia Quarterly BulletinTable 22(D): Addis Ababa Food Consumer Price Index
December 2016=100
Perio
d
Food
&
Non
-al-
coho
lic
Beve
rage
s
Brea
d an
d C
erea
ls
Mea
t
Fish
& S
ea
Food
Milk
, C
hees
e &
Egg
Oils
& F
ats
Fru
its
Vege
tabl
es
Suga
r, ja
m,
hone
y,
choc
olat
e an
d co
n-fe
ctio
nery
Food
pro
d-uc
ts
Non
-Al-
coho
lic
Beve
rage
s
2006/07Q.I 20.7 22.4 19.9 16.7 19.3 17.5 16.3 38.6 20.5 19.2Q.II 21.9 23.9 20.5 17.2 21.3 18.4 17.2 36.7 21.6 19.4Q.III 22.9 24.5 20.9 17.8 23.8 21.5 20.0 36.7 28.9 20.7Q.IV 24.7 25.5 22.5 20.2 27.1 20.9 19.5 37.0 44.3 21.0
2007/08Q.I 26.7 26.3 23.0 20.9 29.2 23.4 21.9 36.1 71.8 22.3Q.II 26.9 26.9 23.3 21.2 31.4 26.5 24.8 34.5 62.7 24.8Q.III 29.3 29.6 23.9 22.1 34.9 36.1 33.7 39.8 63.0 26.3Q.IV 36.1 40.5 27.3 25.0 41.9 39.8 37.2 41.3 75.1 27.5
2008/09Q.I 43.5 52.1 31.4 29.8 40.9 42.0 39.2 50.6 80.2 27.4Q.II 42.4 52.8 31.7 31.3 39.1 39.9 37.3 50.2 61.1 26.9Q.III 40.6 50.5 30.7 31.5 37.2 43.7 40.8 61.7 41.2 26.7Q.IV 41.9 51.4 32.2 33.2 40.0 48.6 45.4 66.3 32.1 26.9
2009/10Q.I 43.3 53.8 33.7 36.6 39.6 42.3 39.5 67.7 33.5 32.7Q.II 43.9 53.5 33.7 36.2 39.4 40.9 38.2 74.2 45.3 37.4Q.III 42.9 50.4 34.3 35.9 39.9 41.3 38.6 72.8 45.2 37.0QIV 45.2 51.0 36.9 37.3 40.6 45.2 42.2 73.9 62.7 35.7
2010/11Q.I 47.9 50.7 38.6 38.5 42.9 53.9 50.4 78.7 70.3 39.7Q.II 49.1 50.6 39.2 39.5 50.8 56.8 53.0 82.2 55.6 50.7Q.III 49.2 49.4 38.9 40.9 54.3 60.3 56.3 72.5 60.5 65.4Q.IV 55.0 54.8 40.1 42.6 74.4 62.1 58.0 74.1 87.9 78.1
2011/12Q.I 59.7 58.2 47.5 46.9 77.1 54.1 50.5 74.4 102.7 81.1Q.II 63.8 61.2 52.4 52.0 74.1 57.3 53.5 75.6 95.7 88.4Q.III 66.6 64.1 57.0 55.8 75.5 63.3 63.3 76.7 91.6 89.7Q.IV 72.8 71.7 68.6 58.5 79.3 65.0 68.5 77.6 95.2 86.7
2012/13Q.I 75.4 77.3 70.9 63.4 77.9 71.8 71.8 77.6 88.6 84.6Q.II 74.0 79.7 69.1 67.3 77.6 73.1 66.8 77.6 76.6 82.7Q.III 72.7 78.5 73.3 69.4 79.0 80.4 59.7 77.6 73.0 79.7Q.IV 75.2 79.8 74.3 70.1 81.6 84.0 67.8 77.6 70.9 76.4
2013/14Q.I 78.5 82.3 75.7 71.8 81.6 83.5 75.6 77.6 76.3 78.0Q.II 77.1 84.0 75.4 71.5 81.1 79.1 67.2 77.8 79.4 78.7Q.III 76.2 78.1 77.6 71.6 81.2 86.3 70.4 78.0 73.4 80.3Q.IV 79.1 78.9 81.1 73.4 83.6 87.2 69.9 82.7 95.6 89.6
2014/15Q.I 83.3 82.2 81.4 75.8 89.0 84.3 72.1 82.6 127.8 91.1Q.II 83.7 82.4 78.6 79.3 94.0 84.1 78.0 82.7 104.0 95.0Q.III 87.2 79.8 81.3 80.8 99.9 103.1 86.5 81.2 120.9 94.7Q.IV 94.8 82.1 84.6 88.6 110.4 101.4 91.1 83.1 188.2 91.7
2015/16Q.I 106.7 84.4 93.8 94.3 110.6 101.9 99.0 83.5 317.2 88.5Q.II 102.7 86.1 96.9 95.8 108.1 101.0 100.3 83.6 229.0 87.6QIII 96.4 88.9 95.8 95.7 99.6 113.7 95.4 94.0 141.8 85.8QIV 101.1 93.3 98.4 96.7 101.7 113.7 108.3 99.8 130.6 88.6
2016/17QI 106.7 98.6 101.1 98.9 103.0 103.3 122.3 96.8 130.7 93.1QII 101.8 102.3 100.8 100.0 99.8 102.1 96.9 100.8 96.5 112.0 97.4QIII 100.4 98.6 97.6 91.6 101.8 105.0 108.8 105.5 100.0 93.8 97.7QIV 104.4 101.8 106.4 99.9 102.2 107.3 118.7 112.6 99.0 86.1 94.2
2017/18QI 109.2 109.9 114.6 101.9 105.6 109.5 134.3 111.4 100.0 86.6 100.4QII 110.3 112.8 114.8 98.4 105.5 109.1 132.5 106.9 100.0 104.0 105.8QIII 113.1 111.2 117.2 100.4 110.2 110.2 140.3 106.2 100.0 155.7 105.2QIV 117.7 117.4 126.0 112.3 121.4 114.8 139.3 105.6 100.0 160.3 105.7
2018/19QI 125.2 124.7 130.0 109.2 125.3 116.0 135.4 123.0 100.0 161.4 109.3QII 123.7 125.5 127.9 110.4 129.0 116.1 138.4 117.6 100.0 154.7 109.6QIII 127.5 129.6 135.4 119.4 128.7 117.3 151.8 121.0 100.0 154.9 109.6QIV 141.4 136.3 151.8 114.2 134.9 122.0 170.9 155.0 114.1 154.1 112.8
2019/20QI 155.5 155.6 164.5 133.0 142.5 131.2 176.5 171.6 114.1 162.7 116.0QII 157.1 159.2 171.8 129.1 147.0 133.8 184.5 162.4 114.1 171.0 118.7QIII 160.9 162.1 175.2 131.2 146.6 142.2 190.7 163.6 114.1 183.3 127.6QIV 178.6 181.4 182.7 138.1 153.6 150.4 175.8 185.0 114.1 256.7 138.8
2020/21QI 197.7 194.1 191.8 191.4 158.2 158.2 160.1 218.4 109.3 353.2 144.3QII 211.7 220.8 213.6 181.0 174.8 184.7 205.2 185.9 141.3 414.7 163.2QIII 201.4 212.8 197.9 188.5 170.7 174.0 205.1 180.1 141.3 369.3 161.4QIV 229.5 233.9 238.1 179.6 185.1 204.9 211.6 195.0 141.0 501.2 167.2
Source: Central Statistical Agency & NBE staff Compilation
Table 22 (E1): Regional States’ Consumer Price Indices (Non-Food)December 2016 = 100
Perio
d
Gen
eral
In
dex
Food
&
Non
-alc
ohol
-ic
Inde
x
Non
-Foo
d In
dex
Alc
ohol
ic
beve
rage
s &
Toba
cco
Clo
thin
g &
Foot
-wea
r
Hous
ing,
Wa-
ter,E
lect
ric-
ity,G
as a
nd
Oth
er F
uels
Furn
ishin
gs,
Hous
ehol
d Eq
uipm
ent
and
Rout
ine
Mai
nten
ance
of
the
Hous
e
Heal
th
Tran
spor
t
Com
mun
i-ca
tion
Recr
eatio
n an
d C
ultu
re
Educ
atio
n
Rest
aura
nts
and
Hote
ls
Misc
ella
ne-
ous
Goo
ds
AFAR2007/08
Q.I 25.2 24.7 22.6 28.1 23.7 14.1 26.7 41.4 32.0 58.1 35.7 50.3 20.9 52.1Q.II 25.8 25.6 23.0 28.2 23.8 14.5 26.7 41.6 32.2 58.4 37.5 52.7 21.0 54.6Q.III 26.8 26.8 23.9 28.5 24.8 14.9 29.0 42.4 34.3 62.3 38.6 54.4 22.1 54.8Q.IV 30.4 32.4 24.8 29.7 25.6 15.1 32.4 43.3 35.1 63.7 38.6 54.3 25.8 55.6
2008/09Q.I 35.6 40.9 25.9 34.8 27.6 15.3 34.6 41.6 35.1 63.7 40.1 56.5 30.6 58.2Q.II 34.5 39.7 25.8 35.5 27.4 15.0 35.3 47.0 31.9 58.0 42.6 60.0 31.5 59.0Q.III 33.4 38.3 25.8 36.5 28.4 14.7 36.0 46.0 26.2 47.6 46.3 65.2 31.8 60.1Q.IV 34.3 39.7 26.5 38.0 28.4 15.0 38.7 49.4 27.7 50.2 46.6 65.7 32.5 61.4
2009/10Q.I 36.3 41.7 28.6 39.1 30.4 17.0 39.4 52.1 31.9 57.8 45.5 64.1 33.5 62.6Q.II 38.8 43.7 31.5 39.9 32.0 19.5 44.8 52.0 35.3 64.0 45.6 64.2 36.6 63.0Q.III 39.6 43.6 33.1 41.3 33.6 20.7 47.3 54.4 37.1 67.3 44.5 62.7 36.9 63.4Q.IV 40.6 43.9 34.1 44.0 33.5 21.9 47.8 54.4 38.2 69.4 47.1 66.3 37.7 64.8
2010/11Q.I 41.7 44.8 35.5 44.8 33.6 23.9 48.6 50.5 37.1 67.3 49.1 69.1 38.7 64.4Q.II 44.3 47.1 38.7 50.7 36.5 26.6 50.5 51.0 42.3 76.8 55.7 78.4 42.7 67.7Q.III 47.6 50.6 41.9 54.9 38.3 29.6 53.8 56.2 49.1 89.1 55.7 78.4 44.6 68.7Q.IV 52.1 54.4 45.8 55.9 40.9 34.0 52.8 61.8 59.0 107.0 57.1 80.4 48.4 70.1
2011/12Q.I 56.0 58.6 48.4 61.8 46.1 34.3 59.7 58.4 60.9 110.4 59.6 83.8 52.8 73.0Q.II 58.3 64.5 48.4 63.4 50.7 32.0 63.3 60.4 53.9 97.7 65.6 92.4 54.1 73.5Q.III 60.9 71.1 50.4 68.2 52.1 32.7 66.5 65.3 57.2 100.0 70.2 0.0 54.1 75.7Q.IV 64.5 75.6 53.2 70.1 54.4 36.8 63.6 69.9 60.3 100.0 69.8 0.0 59.7 79.4
2012/13Q.I 67.5 79.7 55.1 67.6 59.1 40.3 60.0 71.8 65.1 100.0 72.1 0.0 61.8 79.9Q.II 70.8 79.7 60.9 66.6 75.0 45.0 64.7 73.8 69.3 100.0 74.8 0.0 65.9 80.8Q.III 71.2 77.0 64.0 61.7 80.2 51.3 66.2 76.8 69.3 100.0 74.0 0.0 65.9 81.5Q.IV 75.1 78.4 69.7 57.0 83.4 64.2 68.9 81.3 69.3 100.0 74.7 0.0 68.6 83.9
2013/14Q.I 80.4 84.4 74.3 67.6 87.2 67.6 72.3 94.5 79.4 100.0 76.3 0.0 71.6 87.3Q.II 81.2 84.3 75.7 72.4 87.3 68.7 71.7 98.7 79.4 100.0 84.8 0.0 72.7 89.8Q.III 79.1 82.9 73.2 66.1 91.0 61.0 73.3 106.4 79.4 100.0 86.2 0.0 74.2 92.3Q.IV 76.2 85.8 65.7 59.1 91.3 42.0 74.8 105.8 83.2 100.0 85.5 0.0 78.3 95.0
2014/15Q.I 77.0 87.7 65.5 60.9 91.1 38.7 77.0 108.3 92.0 100.0 87.9 0.0 77.6 108.5Q.II 77.9 87.3 67.5 60.5 94.0 42.8 79.0 112.5 91.8 100.0 88.6 0.0 78.6 93.1Q.III 81.4 87.6 73.5 73.6 91.0 55.0 78.6 111.6 94.7 100.0 87.6 0.0 80.5 94.6Q.IV 87.8 94.0 79.5 87.3 91.4 63.0 87.9 114.7 95.8 100.0 87.1 0.0 83.4 93.7
2015/16Q.I 92.2 103.7 79.6 90.0 96.2 57.6 91.0 115.8 93.2 100.0 95.4 0.0 87.5 97.0Q.II 92.5 101.8 81.6 83.0 96.8 61.9 94.7 121.8 99.3 100.0 95.7 0.0 93.1 97.6Q.III 96.9 99.6 94.1 106.9 92.6 87.1 99.8 125.7 96.2 100.0 99.2 0.0 92.3 97.4Q.IV 101.2 101.6 100.7 99.9 98.6 103.0 100.7 122.6 96.9 100.0 100.5 0.0 94.4 95.2
2016/17QI 103.1 104.0 102.2 97.6 97.8 108.0 101.6 114.6 95.8 100.0 99.3 0.0 96.1 96.8QII 101.4 103.8 98.9 104.3 97.1 97.1 101.6 106.0 98.8 100.0 97.8 33.3 98.5 98.9QIII 101.4 102.3 100.6 94.3 100.0 104.3 99.3 110.1 95.6 100.7 97.4 100.0 99.8 99.2QIV 105.4 105.2 105.6 93.3 107.5 114.2 102.0 118.1 105.1 100.7 111.8 92.0 99.6 97.8
2017/18QI 108.5 109.8 107.2 101.1 105.3 117.3 100.5 120.4 112.9 99.9 110.5 101.3 97.1 98.2QII 112.8 115.8 109.9 101.1 114.6 117.7 103.4 107.2 123.3 99.8 119.5 98.5 103.5 103.4QIII 116.8 117.0 116.6 131.6 120.9 114.2 106.8 107.7 123.3 99.9 129.7 95.5 114.9 110.0QIV 116.7 116.2 117.2 120.4 121.4 120.2 110.8 108.6 123.3 100.5 130.5 93.5 111.4 118.4
2018/19QI 120.7 124.2 117.4 115.0 124.5 117.8 116.7 109.1 118.8 100.5 132.5 101.9 117.2 118.8QII 121.1 124.3 118.0 105.4 121.8 116.1 143.9 93.2 124.8 101.6 174.1 110.8 120.1 118.4QIII 124.2 126.1 122.4 93.6 123.1 134.9 152.0 91.8 123.3 104.0 176.0 115.0 117.5 123.0QIV 131.7 136.2 127.4 95.7 132.5 139.3 153.7 94.9 130.9 104.5 177.8 115.0 126.1 127.4
2019/20QI 140.5 151.7 129.6 95.3 134.9 130.6 153.0 102.9 170.3 103.4 164.8 114.8 145.6 141.0QII 134.9 142.0 128.1 97.7 131.2 135.2 154.0 96.9 149.2 103.6 172.8 114.5 134.2 132.6QIII 151.1 158.7 143.8 116.7 154.4 135.7 165.2 109.7 218.4 103.6 192.1 118.7 165.5 148.0QIV 158.7 174.6 143.2 134.0 156.7 125.6 169.5 101.2 222.3 104.6 192.7 127.2 153.7 150.3
2020/21QI 170.8 179.9 162.0 159.3 168.1 152.7 170.6 106.4 322.8 104.6 189.5 141.0 165.7 150.7QII 169.1 186.3 152.3 143.3 171.7 134.4 173.3 123.9 203.4 104.6 213.4 119.6 167.4 156.5QIII 174.3 195.6 153.6 139.4 171.8 136.4 176.6 136.3 203.4 104.6 218.6 118.7 168.3 160.6QIV 191.7 224.9 159.6 133.1 180.5 145.1 186.9 154.1 218.4 104.6 227.8 133.0 170.3 161.9
Source: Central Statistical Agency

120 | Fourth Quarter 2020/21
National Bank of Ethiopia Quarterly Bulletin
Table 22 (E2): Regional States’ Consumer Price Indices (Non-Food)December 2016= 100
Perio
d
Gen
eral
Inde
x
Food
&
Non
-alc
ohol
ic
Inde
x
Non
-Foo
d In
dex
Alc
ohol
ic
beve
rage
s &
Toba
cco
Clo
thin
g &
Foot
-wea
r
Hous
ing,
Wa-
ter,E
lect
ricity
,-G
as a
nd O
ther
Fu
els
Furn
ishin
gs,
Hous
ehol
d Eq
uipm
ent
and
Rout
ine
Mai
nten
ance
of
the
Hous
e
Heal
th
Tran
spor
t
Com
mun
i-ca
tion
Recr
eatio
n an
d C
ultu
re
Educ
atio
n
Rest
aura
nts
and
Hote
ls
Misc
ella
neou
s G
oods
AMHARA2007/08
Q.I 28.0 28.7 27.2 26.0 28.3 26.8 22.1 36.2 49.6 52.1 35.9 46.8 23.8 34.0Q.II 28.9 30.5 27.3 25.8 27.9 26.6 23.4 37.1 50.0 52.5 36.7 47.9 25.0 35.3Q.III 30.1 31.7 28.5 28.2 29.1 27.5 25.4 39.9 55.4 58.2 38.0 49.6 26.5 37.4Q.IV 34.0 38.6 29.6 31.9 29.8 28.0 27.5 42.2 58.2 61.1 39.4 51.5 28.6 39.7
2008/09Q.I 41.2 50.7 32.2 41.9 31.4 30.0 29.6 41.3 58.2 61.1 41.0 53.5 32.2 41.3Q.II 40.4 48.2 32.9 42.9 33.8 30.3 30.6 40.8 59.0 62.0 42.6 55.6 33.8 40.9Q.III 38.2 43.1 33.5 43.1 35.7 30.3 32.8 43.3 54.0 56.7 44.6 58.3 34.7 42.0Q.IV 38.6 42.3 35.0 45.4 38.1 31.5 34.3 45.8 55.0 57.8 48.3 63.1 35.1 43.8
2009/10Q.I 40.5 43.8 37.3 45.4 40.3 34.3 35.7 47.2 58.1 61.1 50.4 65.8 36.7 46.5Q.II 41.3 42.9 39.7 45.3 42.9 37.0 37.1 51.2 58.3 61.3 52.1 68.1 38.3 48.9Q.III 41.7 42.2 41.2 46.0 46.3 38.1 38.5 54.2 60.9 64.0 52.6 68.7 39.4 50.5Q.IV 42.5 42.8 42.1 50.1 48.7 38.5 39.7 55.5 63.5 66.6 54.3 70.8 39.4 51.0
2010/11Q.I 43.8 43.6 43.9 51.1 50.7 40.6 40.8 56.2 62.2 65.3 58.4 76.3 40.3 52.5Q.II 46.7 44.8 48.4 54.9 56.0 45.4 43.7 57.6 65.6 68.9 66.7 87.1 42.7 57.7Q.III 49.7 47.0 52.2 55.9 61.5 49.3 46.2 57.8 81.7 85.8 67.1 87.6 44.2 61.0Q.IV 55.4 56.6 54.3 61.4 66.4 50.1 49.2 58.8 90.2 94.7 69.7 91.0 47.5 63.1
2011/12Q.I 59.8 63.0 56.6 66.9 70.8 51.2 52.3 59.3 90.6 95.2 73.0 95.3 51.7 70.3Q.II 62.6 66.7 58.6 62.5 76.1 52.2 54.4 58.0 82.9 87.1 75.9 99.1 54.9 73.8Q.III 65.1 68.6 61.5 64.7 79.7 55.1 56.4 58.8 84.0 87.0 79.4 100.0 57.8 74.9Q.IV 68.7 74.4 63.2 69.7 81.6 55.3 58.4 60.1 83.9 87.0 84.2 100.0 60.4 76.5
2012/13Q.I 71.9 79.1 64.9 73.1 82.7 56.4 59.4 61.6 85.2 87.0 84.2 100.0 63.4 77.5Q.II 73.2 78.5 68.0 74.9 83.9 59.1 68.8 63.4 88.5 87.0 81.1 100.0 65.3 84.5Q.III 73.6 78.1 69.3 76.1 84.6 59.0 72.2 68.8 86.6 87.0 82.3 100.0 68.4 85.8Q.IV 75.6 80.3 71.0 78.6 87.5 59.9 73.8 73.3 83.2 87.0 84.3 100.0 71.2 87.3
2013/14Q.I 77.7 83.6 72.0 81.1 88.7 60.2 74.3 76.0 78.7 87.0 84.1 100.0 73.4 88.1Q.II 79.1 83.0 75.2 86.8 88.8 64.1 76.3 82.5 81.7 87.0 86.5 100.0 76.6 89.9Q.III 79.5 81.5 77.4 89.6 91.3 67.2 78.5 85.6 83.8 87.0 87.7 100.0 77.3 90.6Q.IV 80.8 82.7 78.8 89.1 92.1 69.3 82.3 87.6 84.1 87.0 87.8 100.0 77.9 91.3
2014/15Q.I 81.6 83.8 79.4 90.7 93.9 68.9 82.8 89.0 84.3 88.4 88.1 108.3 79.3 91.6Q.II 82.4 84.0 80.7 91.7 99.1 69.7 83.6 92.6 85.9 87.0 88.0 100.0 80.2 91.9Q.III 83.7 84.7 82.6 92.7 101.9 72.4 85.4 93.5 86.0 90.0 89.2 100.0 81.3 92.6Q.IV 85.8 86.3 85.1 96.3 101.3 75.9 88.1 89.5 85.5 99.5 89.8 100.0 83.9 93.4
2015/16Q.I 89.7 91.5 87.8 95.8 103.5 79.6 90.1 90.0 94.4 108.7 86.6 100.0 86.5 92.7Q.II 90.9 92.7 89.0 95.9 101.8 80.6 92.4 89.1 101.4 97.7 94.9 100.0 89.7 93.1Q.III 92.4 93.0 91.7 99.3 102.2 84.5 94.9 97.3 96.3 98.3 96.2 100.0 92.1 94.1Q.IV 94.9 95.1 94.5 98.9 103.3 89.1 96.1 94.4 101.9 98.8 93.8 100.0 95.3 95.1
2016/17QI 99.8 101.3 98.1 97.1 101.4 96.9 97.8 88.7 103.5 98.3 97.6 100.0 99.2 96.4QIII 101.1 102.3 99.8 99.3 100.0 99.4 99.7 99.8 101.7 99.4 98.5 100.0 100.7 98.1QII 102.4 105.4 99.0 98.4 101.6 98.7 100.3 104.9 102.9 100.0 98.8 95.2 95.9 100.7QIV 108.7 110.1 107.2 124.7 103.6 108.4 101.9 133.6 104.0 99.1 123.5 95.5 102.1 99.9
2017/18QI 119.5 118.2 120.9 135.5 108.2 134.1 106.5 154.5 104.0 95.6 125.2 119.0 111.6 102.9QII 122.4 119.9 125.2 140.4 115.0 138.9 110.2 119.9 105.1 102.7 127.4 119.0 119.5 105.2QIII 125.5 122.0 129.4 144.8 119.5 145.7 121.2 150.8 105.4 112.8 133.4 119.0 111.1 112.4QIV 129.0 127.7 130.5 139.8 127.3 145.8 126.1 131.4 106.3 122.3 138.0 119.0 111.6 115.4
2018/19QI 134.1 133.9 134.2 141.6 132.6 148.5 127.8 155.4 106.9 128.9 140.9 119.0 114.4 124.2QII 134.4 132.9 136.2 141.1 138.1 149.2 129.9 171.6 116.1 115.3 142.3 120.6 118.7 119.1QIII 138.3 136.6 140.2 146.3 141.6 149.7 137.5 196.6 122.8 118.1 142.1 121.6 124.7 120.4QIV 148.6 149.3 147.8 150.3 148.2 161.8 143.7 175.3 125.5 139.3 141.5 136.5 130.1 125.7
2019/20QI 157.6 161.4 153.3 147.1 148.4 169.4 144.5 193.2 120.5 137.3 144.1 134.7 142.7 127.9QII 159.7 161.0 158.3 155.1 150.0 176.1 146.8 200.8 123.1 126.3 148.9 138.8 150.3 129.9QIII 169.7 174.2 164.8 181.6 152.4 180.5 149.5 207.8 148.4 120.4 161.7 126.0 155.8 133.3QIV 179.0 187.5 169.6 207.9 157.9 180.0 153.4 199.3 190.2 160.6 150.6 142.0 151.5 140.0
2020/21QI 185.8 200.0 169.8 193.7 159.8 177.8 155.2 222.7 215.2 149.4 140.2 132.7 153.3 150.5QII 185.9 197.9 172.5 207.2 165.1 182.6 158.3 206.7 143.9 138.8 159.4 138.3 163.6 150.5QIII 192.0 199.2 184.0 225.7 176.7 188.5 169.5 210.0 146.2 215.0 165.3 144.6 175.0 158.9QIV 204.2 213.9 193.3 244.6 192.5 185.4 186.7 248.2 164.0 261.2 184.4 153.5 184.0 168.0
Source: Central Statistical Agency

Fourth Quarter 2020/21 | 121
National Bank of Ethiopia Quarterly Bulletin
Table 22 (E2): Regional States’ Consumer Price Indices (Non-Food)December 2016= 100
Perio
d
Gen
eral
Inde
x
Food
&
Non
-alc
ohol
ic
Inde
x
Non
-Foo
d In
dex
Alc
ohol
ic
beve
rage
s &
Toba
cco
Clo
thin
g &
Foot
-wea
r
Hous
ing,
Wa-
ter,E
lect
ricity
,-G
as a
nd O
ther
Fu
els
Furn
ishin
gs,
Hous
ehol
d Eq
uipm
ent
and
Rout
ine
Mai
nten
ance
of
the
Hous
e
Heal
th
Tran
spor
t
Com
mun
i-ca
tion
Recr
eatio
n an
d C
ultu
re
Educ
atio
n
Rest
aura
nts
and
Hote
ls
Misc
ella
neou
s G
oods
AMHARA2007/08
Q.I 28.0 28.7 27.2 26.0 28.3 26.8 22.1 36.2 49.6 52.1 35.9 46.8 23.8 34.0Q.II 28.9 30.5 27.3 25.8 27.9 26.6 23.4 37.1 50.0 52.5 36.7 47.9 25.0 35.3Q.III 30.1 31.7 28.5 28.2 29.1 27.5 25.4 39.9 55.4 58.2 38.0 49.6 26.5 37.4Q.IV 34.0 38.6 29.6 31.9 29.8 28.0 27.5 42.2 58.2 61.1 39.4 51.5 28.6 39.7
2008/09Q.I 41.2 50.7 32.2 41.9 31.4 30.0 29.6 41.3 58.2 61.1 41.0 53.5 32.2 41.3Q.II 40.4 48.2 32.9 42.9 33.8 30.3 30.6 40.8 59.0 62.0 42.6 55.6 33.8 40.9Q.III 38.2 43.1 33.5 43.1 35.7 30.3 32.8 43.3 54.0 56.7 44.6 58.3 34.7 42.0Q.IV 38.6 42.3 35.0 45.4 38.1 31.5 34.3 45.8 55.0 57.8 48.3 63.1 35.1 43.8
2009/10Q.I 40.5 43.8 37.3 45.4 40.3 34.3 35.7 47.2 58.1 61.1 50.4 65.8 36.7 46.5Q.II 41.3 42.9 39.7 45.3 42.9 37.0 37.1 51.2 58.3 61.3 52.1 68.1 38.3 48.9Q.III 41.7 42.2 41.2 46.0 46.3 38.1 38.5 54.2 60.9 64.0 52.6 68.7 39.4 50.5Q.IV 42.5 42.8 42.1 50.1 48.7 38.5 39.7 55.5 63.5 66.6 54.3 70.8 39.4 51.0
2010/11Q.I 43.8 43.6 43.9 51.1 50.7 40.6 40.8 56.2 62.2 65.3 58.4 76.3 40.3 52.5Q.II 46.7 44.8 48.4 54.9 56.0 45.4 43.7 57.6 65.6 68.9 66.7 87.1 42.7 57.7Q.III 49.7 47.0 52.2 55.9 61.5 49.3 46.2 57.8 81.7 85.8 67.1 87.6 44.2 61.0Q.IV 55.4 56.6 54.3 61.4 66.4 50.1 49.2 58.8 90.2 94.7 69.7 91.0 47.5 63.1
2011/12Q.I 59.8 63.0 56.6 66.9 70.8 51.2 52.3 59.3 90.6 95.2 73.0 95.3 51.7 70.3Q.II 62.6 66.7 58.6 62.5 76.1 52.2 54.4 58.0 82.9 87.1 75.9 99.1 54.9 73.8Q.III 65.1 68.6 61.5 64.7 79.7 55.1 56.4 58.8 84.0 87.0 79.4 100.0 57.8 74.9Q.IV 68.7 74.4 63.2 69.7 81.6 55.3 58.4 60.1 83.9 87.0 84.2 100.0 60.4 76.5
2012/13Q.I 71.9 79.1 64.9 73.1 82.7 56.4 59.4 61.6 85.2 87.0 84.2 100.0 63.4 77.5Q.II 73.2 78.5 68.0 74.9 83.9 59.1 68.8 63.4 88.5 87.0 81.1 100.0 65.3 84.5Q.III 73.6 78.1 69.3 76.1 84.6 59.0 72.2 68.8 86.6 87.0 82.3 100.0 68.4 85.8Q.IV 75.6 80.3 71.0 78.6 87.5 59.9 73.8 73.3 83.2 87.0 84.3 100.0 71.2 87.3
2013/14Q.I 77.7 83.6 72.0 81.1 88.7 60.2 74.3 76.0 78.7 87.0 84.1 100.0 73.4 88.1Q.II 79.1 83.0 75.2 86.8 88.8 64.1 76.3 82.5 81.7 87.0 86.5 100.0 76.6 89.9Q.III 79.5 81.5 77.4 89.6 91.3 67.2 78.5 85.6 83.8 87.0 87.7 100.0 77.3 90.6Q.IV 80.8 82.7 78.8 89.1 92.1 69.3 82.3 87.6 84.1 87.0 87.8 100.0 77.9 91.3
2014/15Q.I 81.6 83.8 79.4 90.7 93.9 68.9 82.8 89.0 84.3 88.4 88.1 108.3 79.3 91.6Q.II 82.4 84.0 80.7 91.7 99.1 69.7 83.6 92.6 85.9 87.0 88.0 100.0 80.2 91.9Q.III 83.7 84.7 82.6 92.7 101.9 72.4 85.4 93.5 86.0 90.0 89.2 100.0 81.3 92.6Q.IV 85.8 86.3 85.1 96.3 101.3 75.9 88.1 89.5 85.5 99.5 89.8 100.0 83.9 93.4
2015/16Q.I 89.7 91.5 87.8 95.8 103.5 79.6 90.1 90.0 94.4 108.7 86.6 100.0 86.5 92.7Q.II 90.9 92.7 89.0 95.9 101.8 80.6 92.4 89.1 101.4 97.7 94.9 100.0 89.7 93.1Q.III 92.4 93.0 91.7 99.3 102.2 84.5 94.9 97.3 96.3 98.3 96.2 100.0 92.1 94.1Q.IV 94.9 95.1 94.5 98.9 103.3 89.1 96.1 94.4 101.9 98.8 93.8 100.0 95.3 95.1
2016/17QI 99.8 101.3 98.1 97.1 101.4 96.9 97.8 88.7 103.5 98.3 97.6 100.0 99.2 96.4QIII 101.1 102.3 99.8 99.3 100.0 99.4 99.7 99.8 101.7 99.4 98.5 100.0 100.7 98.1QII 102.4 105.4 99.0 98.4 101.6 98.7 100.3 104.9 102.9 100.0 98.8 95.2 95.9 100.7QIV 108.7 110.1 107.2 124.7 103.6 108.4 101.9 133.6 104.0 99.1 123.5 95.5 102.1 99.9
2017/18QI 119.5 118.2 120.9 135.5 108.2 134.1 106.5 154.5 104.0 95.6 125.2 119.0 111.6 102.9QII 122.4 119.9 125.2 140.4 115.0 138.9 110.2 119.9 105.1 102.7 127.4 119.0 119.5 105.2QIII 125.5 122.0 129.4 144.8 119.5 145.7 121.2 150.8 105.4 112.8 133.4 119.0 111.1 112.4QIV 129.0 127.7 130.5 139.8 127.3 145.8 126.1 131.4 106.3 122.3 138.0 119.0 111.6 115.4
2018/19QI 134.1 133.9 134.2 141.6 132.6 148.5 127.8 155.4 106.9 128.9 140.9 119.0 114.4 124.2QII 134.4 132.9 136.2 141.1 138.1 149.2 129.9 171.6 116.1 115.3 142.3 120.6 118.7 119.1QIII 138.3 136.6 140.2 146.3 141.6 149.7 137.5 196.6 122.8 118.1 142.1 121.6 124.7 120.4QIV 148.6 149.3 147.8 150.3 148.2 161.8 143.7 175.3 125.5 139.3 141.5 136.5 130.1 125.7
2019/20QI 157.6 161.4 153.3 147.1 148.4 169.4 144.5 193.2 120.5 137.3 144.1 134.7 142.7 127.9QII 159.7 161.0 158.3 155.1 150.0 176.1 146.8 200.8 123.1 126.3 148.9 138.8 150.3 129.9QIII 169.7 174.2 164.8 181.6 152.4 180.5 149.5 207.8 148.4 120.4 161.7 126.0 155.8 133.3QIV 179.0 187.5 169.6 207.9 157.9 180.0 153.4 199.3 190.2 160.6 150.6 142.0 151.5 140.0
2020/21QI 185.8 200.0 169.8 193.7 159.8 177.8 155.2 222.7 215.2 149.4 140.2 132.7 153.3 150.5QII 185.9 197.9 172.5 207.2 165.1 182.6 158.3 206.7 143.9 138.8 159.4 138.3 163.6 150.5QIII 192.0 199.2 184.0 225.7 176.7 188.5 169.5 210.0 146.2 215.0 165.3 144.6 175.0 158.9QIV 204.2 213.9 193.3 244.6 192.5 185.4 186.7 248.2 164.0 261.2 184.4 153.5 184.0 168.0
Source: Central Statistical Agency
Table 22 (E3): Regional States' Consumer Price Indices (Non-Food)December 2016= 100
Perio
d
Gen
eral
In
dex
Food
&
Non
-alc
ohol
-ic
Inde
x
Non
-Foo
d In
dex
Alc
ohol
ic
beve
rage
s &
Toba
cco
Clo
thin
g &
Foot
-wea
r
Hous
ing,
Wa-
ter,E
lect
ric-
ity,G
as a
nd
Oth
er F
uels
Furn
ishin
gs,
Hous
ehol
d Eq
uipm
ent
& Ro
utin
e M
aint
enan
ce
of th
e Ho
use
Heal
th
Tran
spor
t
Com
mun
i-ca
tion
Recr
eatio
n an
d C
ultu
re
Educ
atio
n
Rest
aura
nts
and
Hote
ls
Misc
ella
ne-
ous
Goo
ds
BENISHANGUL GUMUZ2007/08
Q.I 28.9 27.1 32.3 22.7 18.7 49.8 23.6 45.8 64.7 68.5 39.2 47.4 28.4 35.0Q.II 31.0 29.9 33.6 23.3 19.8 51.9 24.1 49.0 64.0 67.8 39.8 48.2 30.2 36.1Q.III 33.6 33.8 34.8 24.8 21.7 51.6 25.5 51.0 63.6 67.4 43.0 52.0 32.3 38.6Q.IV 37.3 39.1 36.7 26.5 23.1 53.7 27.6 54.4 63.6 67.4 44.3 53.6 35.3 41.0
2008/09Q.I 48.7 57.2 40.3 31.3 24.1 56.8 32.7 61.0 63.6 67.4 56.0 67.7 38.4 43.2Q.II 46.0 51.0 41.7 31.1 26.4 57.3 34.5 63.0 67.7 71.7 58.7 71.0 39.1 44.2Q.III 42.8 44.4 42.6 32.5 27.4 58.2 35.8 67.8 61.7 65.4 59.1 71.6 41.4 45.3Q.IV 43.8 45.4 43.6 34.5 27.1 61.2 35.9 67.1 62.1 65.8 61.1 74.0 42.6 46.0
2009/10Q.I 46.8 49.5 45.4 34.8 27.7 62.6 40.4 68.3 66.6 70.6 61.5 74.5 45.3 48.3Q.II 45.6 45.1 48.0 34.5 31.3 66.5 42.1 68.0 71.5 75.8 63.3 76.7 47.6 50.0Q.III 43.6 40.8 48.9 37.0 35.1 63.4 43.8 71.6 74.5 78.9 64.4 77.9 50.9 52.0Q.IV 43.6 39.5 50.4 40.4 35.7 65.7 45.0 69.7 76.2 80.8 65.4 79.2 56.1 53.2
2010/11Q.I 43.3 38.1 51.6 40.4 39.4 62.8 49.0 68.5 75.4 79.9 67.5 81.7 58.1 53.1Q.II 46.2 39.2 56.6 43.8 45.1 67.3 56.1 71.7 80.5 85.3 72.8 88.1 59.4 59.8Q.III 49.4 44.0 58.0 44.7 49.4 64.0 57.9 73.0 86.8 91.9 73.4 88.9 53.8 64.0Q.IV 59.6 60.5 60.9 51.5 52.2 65.1 61.2 71.4 99.1 105.0 76.0 92.0 67.9 70.5
2011/12Q.I 66.0 70.9 62.6 50.4 55.1 60.8 66.7 62.4 99.1 105.0 79.1 95.7 73.9 77.3Q.II 70.8 76.5 65.6 49.6 63.0 60.3 69.1 65.7 92.8 98.3 82.1 99.3 72.5 81.2Q.III 74.2 76.1 71.8 53.3 68.7 70.2 74.9 66.0 98.4 100.0 83.7 0.0 73.8 84.2Q.IV 79.0 81.1 76.2 58.8 73.7 75.8 78.7 66.6 106.4 100.0 82.9 0.0 75.6 88.7
2012/13Q.I 82.1 84.6 78.8 62.1 73.5 82.2 78.9 67.3 106.5 100.0 85.0 0.0 77.6 89.2Q.II 82.2 83.4 80.6 69.9 79.9 81.2 80.2 71.0 99.5 100.0 86.9 0.0 78.6 90.9Q.III 81.4 79.9 83.3 71.5 80.6 89.6 78.7 72.6 96.4 100.0 88.6 0.0 79.6 91.3Q.IV 81.7 79.6 84.5 69.4 80.7 92.7 79.4 79.3 97.1 100.0 89.8 0.0 81.0 91.0
2013/14Q.I 86.6 87.2 85.9 69.5 82.0 93.4 81.5 81.7 97.8 100.0 90.4 0.0 84.4 93.4Q.II 91.3 92.7 89.4 80.0 82.8 97.0 83.8 91.0 100.7 100.0 90.5 0.0 86.3 94.7Q.III 89.2 85.0 94.7 87.4 89.1 108.4 83.7 92.3 102.9 100.0 90.9 0.0 86.4 95.4Q.IV 89.9 85.4 95.9 94.0 92.6 106.4 84.2 92.4 103.2 100.0 91.1 0.0 89.6 96.5
2014/15Q.I 88.0 83.9 93.6 89.4 93.4 99.1 87.5 91.6 101.9 100.0 91.0 0.0 88.3 95.8Q.II 88.4 84.9 93.2 83.9 94.8 98.5 87.9 83.4 100.5 100.0 92.0 0.0 91.8 94.9Q.III 89.1 88.1 90.5 85.5 97.6 85.7 91.0 83.9 100.3 100.0 92.4 0.0 92.0 95.7Q.IV 91.2 90.6 91.9 87.7 98.4 87.9 91.7 84.5 99.5 100.0 93.0 0.0 93.9 95.0
2015/16Q.I 97.2 99.9 93.7 84.1 100.0 93.6 94.9 85.9 99.8 100.0 93.8 0.0 92.2 95.8Q.II 98.4 99.9 96.4 88.6 101.5 97.6 97.0 94.3 100.1 100.0 94.0 0.0 92.1 98.3Q.III 96.1 94.6 98.0 92.5 101.5 98.0 99.7 96.8 103.3 100.0 96.1 0.0 95.2 98.7Q.IV 96.6 95.9 97.5 92.8 101.7 91.6 101.0 134.6 99.1 100.0 96.6 0.0 94.4 101.4
2016/17QI 99.6 100.1 99.0 85.7 100.0 98.9 98.5 149.8 99.6 100.0 98.7 0.0 96.0 100.9QII 99.8 100.4 99.0 92.2 100.2 99.0 99.6 102.4 106.9 100.0 100.0 33.3 97.6 102.1QIII 103.3 103.0 101.7 104.4 100.7 102.3 101.2 104.3 103.9 99.8 99.0 100.0 98.1 100.9QIV 106.5 109.5 103.0 98.3 102.1 102.8 107.9 113.4 104.7 102.1 111.6 99.4 101.6 101.9
2017/18QI 111.4 117.8 105.4 91.6 96.2 100.7 114.1 98.9 113.9 100.0 161.4 100.0 123.5 103.2QII 114.8 121.5 108.5 91.4 94.1 99.4 124.0 100.5 118.8 100.0 168.0 100.0 136.3 104.5QIII 117.6 119.9 115.5 109.9 99.8 102.2 126.8 132.8 122.7 100.0 167.3 100.0 140.8 112.3QIV 120.7 121.2 120.2 111.3 100.3 103.3 140.9 186.7 120.8 100.0 177.4 100.0 139.9 117.7
2018/19QI 125.8 129.2 122.6 106.2 102.9 103.6 147.2 189.5 117.7 100.0 174.9 100.0 152.2 119.1QII 130.0 130.2 129.9 110.3 114.7 101.7 147.5 191.0 119.0 97.8 177.6 100.0 187.4 117.8QIII 134.8 132.8 136.6 115.1 119.8 103.4 150.0 188.8 121.6 97.8 180.8 112.5 213.6 122.5QIV 143.4 142.9 143.9 127.9 119.7 110.8 165.9 189.9 127.5 100.0 184.4 104.2 218.8 132.1
2019/20QI 156.5 164.5 149.1 130.8 134.1 122.3 172.6 196.4 129.1 100.0 200.9 100.0 210.4 135.8QII 158.9 166.7 151.5 134.6 132.3 123.9 164.8 186.9 132.1 100.0 247.9 125.0 219.6 148.9QIII 167.2 173.0 161.9 161.4 136.3 131.0 175.2 192.6 132.1 100.0 238.5 125.0 234.1 158.7QIV 179.9 190.9 169.6 197.1 137.9 128.7 175.7 197.2 140.5 100.0 234.7 125.0 249.5 161.0
2020/21QI 201.1 222.6 180.8 201.3 147.0 141.5 177.9 195.9 177.9 100.0 236.1 114.6 271.0 169.6QII 203.4 220.5 187.2 210.7 149.5 153.1 183.1 198.8 132.7 100.0 268.6 125.0 288.0 170.6QIII 203.7 217.6 190.7 193.5 166.8 188.3 198.5 204.0 139.2 100.0 282.7 125.0 235.4 182.7QIV 218.6 233.9 204.3 201.8 181.8 172.7 230.5 225.2 140.6 100.0 309.8 125.0 295.6 188.2
Source: Central Statistical Agency

122 | Fourth Quarter 2020/21
National Bank of Ethiopia Quarterly Bulletin
Table 22 (E4): Regional States' Consumer Price Indices (Non-Food)December 2016 = 100
Perio
d
Gen
eral
In
dex
Food
&
Non
-alc
ohol
-ic
Inde
x
Non
-Foo
d In
dex
Alc
ohol
ic
beve
rage
s &
Toba
cco
Clo
thin
g &
Foot
-wea
r
Hous
ing,
Wa-
ter,E
lect
ric-
ity,G
as a
nd
Oth
er F
uels
Furn
ishin
gs,
Hous
ehol
d Eq
uipm
ent
and
Rout
ine
Mai
nten
ance
of
the
Hous
e
Heal
th
Tran
spor
t
Com
mun
i-ca
tion
Recr
eatio
n an
d C
ultu
re
Educ
atio
n
Rest
aura
nts
and
Hote
ls
Misc
ella
ne-
ous
Goo
ds
DIRE DAWA2007/08
Q.I 27.3 28.0 28.8 17.8 24.9 29.3 30.2 35.9 62.6 76.7 44.9 60.1 16.0 39.8Q.II 28.1 28.7 30.0 18.1 26.0 29.8 33.6 40.5 62.6 76.7 45.8 61.3 18.1 40.2Q.III 30.5 32.3 31.1 18.7 27.0 30.1 36.3 42.9 65.3 80.0 48.2 64.5 18.0 41.3Q.IV 34.5 38.5 32.8 19.3 28.5 33.0 38.3 43.1 65.6 80.4 49.5 66.1 18.5 41.3
2008/09Q.I 39.6 47.2 34.4 22.8 28.6 35.6 40.0 47.4 64.0 78.4 51.8 69.3 22.7 42.7Q.II 40.2 47.4 35.4 23.1 30.9 35.5 42.7 48.4 62.2 76.2 54.5 72.9 28.5 43.2Q.III 40.0 46.6 35.9 23.3 32.1 35.0 44.7 49.5 60.5 74.2 56.5 75.6 29.3 43.6Q.IV 40.7 46.7 37.3 24.3 33.3 36.4 48.0 49.3 61.6 75.5 56.7 75.9 32.3 45.4
2009/10Q.I 41.5 47.5 38.3 25.3 34.1 38.1 48.0 50.7 62.8 77.0 57.4 76.8 31.8 47.4Q.II 41.8 46.6 40.0 26.4 36.2 38.7 51.2 52.3 64.5 79.0 63.5 85.0 31.3 48.0Q.III 42.6 47.5 40.9 26.5 36.9 38.9 54.2 53.6 65.5 80.3 64.1 85.8 33.2 49.5Q.IV 43.3 48.3 41.3 28.8 35.9 39.6 56.5 52.7 66.0 80.8 64.6 86.4 34.1 50.6
2010/11Q.I 43.9 48.3 42.8 31.0 37.1 41.2 60.5 55.1 66.2 81.1 61.3 82.0 33.0 51.9Q.II 46.9 50.9 46.4 33.1 39.6 45.8 65.1 55.4 69.4 85.0 70.3 94.1 37.4 52.5Q.III 49.0 53.5 48.2 37.6 42.9 49.4 61.6 57.6 73.0 89.4 68.7 91.9 39.8 53.3Q.IV 54.4 62.4 50.0 38.5 44.4 52.0 60.3 64.0 85.3 104.5 65.8 88.0 45.5 54.2
2011/12Q.I 57.7 68.0 51.0 43.5 46.0 52.7 62.4 61.1 82.3 100.8 66.0 88.3 50.7 56.0Q.II 59.1 69.6 52.2 44.4 47.3 51.9 64.0 70.6 81.8 100.2 74.4 99.5 49.1 58.7Q.III 61.4 71.4 55.2 43.5 53.8 53.6 65.7 79.8 84.8 100.0 74.4 100.0 56.2 62.4Q.IV 63.5 75.3 56.0 38.2 57.5 55.7 67.2 80.1 91.2 100.0 75.7 100.0 63.4 64.0
2012/13Q.I 64.8 77.8 56.7 33.4 59.0 60.8 69.7 79.7 91.2 100.0 75.7 100.0 65.8 64.1Q.II 67.5 77.7 61.1 45.5 65.0 61.1 70.0 81.7 93.2 100.0 77.7 100.0 66.3 64.2Q.III 68.2 76.0 63.4 48.8 65.8 63.0 73.0 87.7 99.0 100.0 76.8 100.0 68.2 65.1Q.IV 68.3 78.3 62.1 33.1 69.9 70.4 73.7 88.7 100.0 100.0 79.8 100.0 72.1 66.7
2013/14Q.I 73.5 84.6 66.6 34.9 70.5 85.2 74.6 91.0 98.4 100.0 80.5 100.0 69.9 68.9Q.II 79.9 84.4 77.1 53.6 76.8 97.2 76.3 93.3 100.0 100.0 84.7 100.0 76.6 71.2Q.III 80.2 81.4 79.5 62.4 78.0 92.6 83.7 93.7 97.4 100.0 86.5 100.0 78.8 75.9Q.IV 80.7 81.6 80.2 65.6 77.7 91.9 85.3 94.4 96.2 100.0 86.5 100.0 79.0 76.5
2014/15Q.I 84.6 88.0 82.4 67.7 78.9 93.8 86.6 100.0 99.5 100.0 92.1 100.0 82.6 79.3Q.II 83.8 89.7 80.2 61.9 79.6 93.9 87.4 100.2 103.0 100.0 92.1 100.0 75.9 80.6Q.III 87.7 89.7 86.4 80.5 83.1 94.3 88.6 96.3 98.9 100.0 92.4 100.0 78.0 84.7Q.IV 92.7 90.7 94.0 108.5 82.9 94.8 89.9 95.7 96.2 100.0 94.0 100.0 73.7 86.1
2015/16Q.I 90.6 90.4 90.7 84.8 89.3 97.4 95.0 96.5 95.7 100.0 97.9 100.0 85.8 87.6Q.II 90.4 91.2 89.9 79.0 93.6 95.6 94.6 96.1 94.3 100.0 97.9 100.0 93.2 87.1Q.III 97.0 92.4 99.8 111.4 94.0 95.7 95.2 97.9 96.2 100.0 97.8 100.0 94.0 93.3Q.IV 97.2 97.7 96.9 97.2 95.9 95.2 99.4 99.1 96.2 100.0 97.8 100.0 99.1 95.0
2016/17QI 95.9 100.8 92.8 80.4 95.4 96.8 97.2 98.7 100.0 100.0 97.8 100.0 100.6 97.8QII 99.8 101.5 98.7 95.2 100.8 98.3 99.9 98.6 100.0 100.0 98.6 100.0 103.0 100.6QIII 103.4 101.5 104.8 121.4 106.5 101.9 100.1 99.4 100.1 100.0 102.6 99.8 101.6 100.6QIV 102.8 103.3 102.4 98.5 106.9 106.3 99.4 93.8 95.1 100.0 106.0 101.6 104.0 103.6
2017/18QI 104.8 105.8 104.1 104.1 97.1 117.2 106.3 103.2 97.6 95.3 100.0 106.8 103.1 105.5QII 110.0 111.5 109.0 123.9 123.4 104.6 104.5 97.3 95.9 100.0 115.7 103.1 107.3 99.7QIII 111.0 112.3 110.1 116.3 124.4 105.4 112.9 99.1 98.4 100.0 122.7 103.1 108.0 105.2QIV 117.5 124.2 112.4 104.4 129.7 108.9 124.1 101.5 100.5 100.0 125.3 103.2 111.3 111.4
2018/19QI 123.7 133.8 116.2 111.1 130.2 112.1 126.9 104.4 119.4 86.7 124.2 115.8 120.1 114.7QII 120.0 129.1 113.2 106.5 128.3 114.5 125.2 108.0 107.2 60.2 115.8 112.7 120.2 115.1QIII 123.4 133.8 115.7 110.6 126.4 117.3 122.9 116.8 115.5 60.2 136.6 122.4 123.6 118.2QIV 132.9 150.3 120.0 111.0 133.0 123.2 132.0 118.4 111.1 60.2 133.3 124.5 128.4 125.1
2019/20 119.8QI 140.3 162.6 123.7 104.7 142.0 129.9 138.7 120.4 114.8 60.2 127.9 146.9 133.3 126.1QII 147.6 169.9 131.0 126.4 154.5 132.5 146.6 133.2 113.6 60.2 128.9 152.5 127.8 134.9QIII 150.6 167.3 138.2 153.1 164.7 140.3 148.4 139.1 108.5 60.2 129.5 148.7 125.4 135.2QIV 164.4 187.4 147.2 165.0 167.3 137.9 153.6 137.2 201.8 60.2 129.2 145.4 141.8 135.0
2020/21QI 181.8 216.5 155.9 166.4 166.0 143.3 157.7 147.1 295.0 60.2 131.9 149.7 151.8 136.4QII 172.5 204.1 149.0 157.8 154.7 143.2 153.4 168.9 211.2 60.2 142.4 166.0 160.2 135.6QIII 178.7 215.4 151.3 170.5 160.2 143.1 166.0 176.7 168.6 60.2 151.6 155.3 167.9 131.5
QIV 189.0 233.7 155.6 162.4 168.3 147.0 182.1 166.0 168.6 60.2 186.8 165.8 171.8 138.4
Source: Central Statistical Agency

Fourth Quarter 2020/21 | 123
National Bank of Ethiopia Quarterly Bulletin
Table 22 (E4): Regional States' Consumer Price Indices (Non-Food)December 2016 = 100
Perio
d
Gen
eral
In
dex
Food
&
Non
-alc
ohol
-ic
Inde
x
Non
-Foo
d In
dex
Alc
ohol
ic
beve
rage
s &
Toba
cco
Clo
thin
g &
Foot
-wea
r
Hous
ing,
Wa-
ter,E
lect
ric-
ity,G
as a
nd
Oth
er F
uels
Furn
ishin
gs,
Hous
ehol
d Eq
uipm
ent
and
Rout
ine
Mai
nten
ance
of
the
Hous
e
Heal
th
Tran
spor
t
Com
mun
i-ca
tion
Recr
eatio
n an
d C
ultu
re
Educ
atio
n
Rest
aura
nts
and
Hote
ls
Misc
ella
ne-
ous
Goo
ds
DIRE DAWA2007/08
Q.I 27.3 28.0 28.8 17.8 24.9 29.3 30.2 35.9 62.6 76.7 44.9 60.1 16.0 39.8Q.II 28.1 28.7 30.0 18.1 26.0 29.8 33.6 40.5 62.6 76.7 45.8 61.3 18.1 40.2Q.III 30.5 32.3 31.1 18.7 27.0 30.1 36.3 42.9 65.3 80.0 48.2 64.5 18.0 41.3Q.IV 34.5 38.5 32.8 19.3 28.5 33.0 38.3 43.1 65.6 80.4 49.5 66.1 18.5 41.3
2008/09Q.I 39.6 47.2 34.4 22.8 28.6 35.6 40.0 47.4 64.0 78.4 51.8 69.3 22.7 42.7Q.II 40.2 47.4 35.4 23.1 30.9 35.5 42.7 48.4 62.2 76.2 54.5 72.9 28.5 43.2Q.III 40.0 46.6 35.9 23.3 32.1 35.0 44.7 49.5 60.5 74.2 56.5 75.6 29.3 43.6Q.IV 40.7 46.7 37.3 24.3 33.3 36.4 48.0 49.3 61.6 75.5 56.7 75.9 32.3 45.4
2009/10Q.I 41.5 47.5 38.3 25.3 34.1 38.1 48.0 50.7 62.8 77.0 57.4 76.8 31.8 47.4Q.II 41.8 46.6 40.0 26.4 36.2 38.7 51.2 52.3 64.5 79.0 63.5 85.0 31.3 48.0Q.III 42.6 47.5 40.9 26.5 36.9 38.9 54.2 53.6 65.5 80.3 64.1 85.8 33.2 49.5Q.IV 43.3 48.3 41.3 28.8 35.9 39.6 56.5 52.7 66.0 80.8 64.6 86.4 34.1 50.6
2010/11Q.I 43.9 48.3 42.8 31.0 37.1 41.2 60.5 55.1 66.2 81.1 61.3 82.0 33.0 51.9Q.II 46.9 50.9 46.4 33.1 39.6 45.8 65.1 55.4 69.4 85.0 70.3 94.1 37.4 52.5Q.III 49.0 53.5 48.2 37.6 42.9 49.4 61.6 57.6 73.0 89.4 68.7 91.9 39.8 53.3Q.IV 54.4 62.4 50.0 38.5 44.4 52.0 60.3 64.0 85.3 104.5 65.8 88.0 45.5 54.2
2011/12Q.I 57.7 68.0 51.0 43.5 46.0 52.7 62.4 61.1 82.3 100.8 66.0 88.3 50.7 56.0Q.II 59.1 69.6 52.2 44.4 47.3 51.9 64.0 70.6 81.8 100.2 74.4 99.5 49.1 58.7Q.III 61.4 71.4 55.2 43.5 53.8 53.6 65.7 79.8 84.8 100.0 74.4 100.0 56.2 62.4Q.IV 63.5 75.3 56.0 38.2 57.5 55.7 67.2 80.1 91.2 100.0 75.7 100.0 63.4 64.0
2012/13Q.I 64.8 77.8 56.7 33.4 59.0 60.8 69.7 79.7 91.2 100.0 75.7 100.0 65.8 64.1Q.II 67.5 77.7 61.1 45.5 65.0 61.1 70.0 81.7 93.2 100.0 77.7 100.0 66.3 64.2Q.III 68.2 76.0 63.4 48.8 65.8 63.0 73.0 87.7 99.0 100.0 76.8 100.0 68.2 65.1Q.IV 68.3 78.3 62.1 33.1 69.9 70.4 73.7 88.7 100.0 100.0 79.8 100.0 72.1 66.7
2013/14Q.I 73.5 84.6 66.6 34.9 70.5 85.2 74.6 91.0 98.4 100.0 80.5 100.0 69.9 68.9Q.II 79.9 84.4 77.1 53.6 76.8 97.2 76.3 93.3 100.0 100.0 84.7 100.0 76.6 71.2Q.III 80.2 81.4 79.5 62.4 78.0 92.6 83.7 93.7 97.4 100.0 86.5 100.0 78.8 75.9Q.IV 80.7 81.6 80.2 65.6 77.7 91.9 85.3 94.4 96.2 100.0 86.5 100.0 79.0 76.5
2014/15Q.I 84.6 88.0 82.4 67.7 78.9 93.8 86.6 100.0 99.5 100.0 92.1 100.0 82.6 79.3Q.II 83.8 89.7 80.2 61.9 79.6 93.9 87.4 100.2 103.0 100.0 92.1 100.0 75.9 80.6Q.III 87.7 89.7 86.4 80.5 83.1 94.3 88.6 96.3 98.9 100.0 92.4 100.0 78.0 84.7Q.IV 92.7 90.7 94.0 108.5 82.9 94.8 89.9 95.7 96.2 100.0 94.0 100.0 73.7 86.1
2015/16Q.I 90.6 90.4 90.7 84.8 89.3 97.4 95.0 96.5 95.7 100.0 97.9 100.0 85.8 87.6Q.II 90.4 91.2 89.9 79.0 93.6 95.6 94.6 96.1 94.3 100.0 97.9 100.0 93.2 87.1Q.III 97.0 92.4 99.8 111.4 94.0 95.7 95.2 97.9 96.2 100.0 97.8 100.0 94.0 93.3Q.IV 97.2 97.7 96.9 97.2 95.9 95.2 99.4 99.1 96.2 100.0 97.8 100.0 99.1 95.0
2016/17QI 95.9 100.8 92.8 80.4 95.4 96.8 97.2 98.7 100.0 100.0 97.8 100.0 100.6 97.8QII 99.8 101.5 98.7 95.2 100.8 98.3 99.9 98.6 100.0 100.0 98.6 100.0 103.0 100.6QIII 103.4 101.5 104.8 121.4 106.5 101.9 100.1 99.4 100.1 100.0 102.6 99.8 101.6 100.6QIV 102.8 103.3 102.4 98.5 106.9 106.3 99.4 93.8 95.1 100.0 106.0 101.6 104.0 103.6
2017/18QI 104.8 105.8 104.1 104.1 97.1 117.2 106.3 103.2 97.6 95.3 100.0 106.8 103.1 105.5QII 110.0 111.5 109.0 123.9 123.4 104.6 104.5 97.3 95.9 100.0 115.7 103.1 107.3 99.7QIII 111.0 112.3 110.1 116.3 124.4 105.4 112.9 99.1 98.4 100.0 122.7 103.1 108.0 105.2QIV 117.5 124.2 112.4 104.4 129.7 108.9 124.1 101.5 100.5 100.0 125.3 103.2 111.3 111.4
2018/19QI 123.7 133.8 116.2 111.1 130.2 112.1 126.9 104.4 119.4 86.7 124.2 115.8 120.1 114.7QII 120.0 129.1 113.2 106.5 128.3 114.5 125.2 108.0 107.2 60.2 115.8 112.7 120.2 115.1QIII 123.4 133.8 115.7 110.6 126.4 117.3 122.9 116.8 115.5 60.2 136.6 122.4 123.6 118.2QIV 132.9 150.3 120.0 111.0 133.0 123.2 132.0 118.4 111.1 60.2 133.3 124.5 128.4 125.1
2019/20 119.8QI 140.3 162.6 123.7 104.7 142.0 129.9 138.7 120.4 114.8 60.2 127.9 146.9 133.3 126.1QII 147.6 169.9 131.0 126.4 154.5 132.5 146.6 133.2 113.6 60.2 128.9 152.5 127.8 134.9QIII 150.6 167.3 138.2 153.1 164.7 140.3 148.4 139.1 108.5 60.2 129.5 148.7 125.4 135.2QIV 164.4 187.4 147.2 165.0 167.3 137.9 153.6 137.2 201.8 60.2 129.2 145.4 141.8 135.0
2020/21QI 181.8 216.5 155.9 166.4 166.0 143.3 157.7 147.1 295.0 60.2 131.9 149.7 151.8 136.4QII 172.5 204.1 149.0 157.8 154.7 143.2 153.4 168.9 211.2 60.2 142.4 166.0 160.2 135.6QIII 178.7 215.4 151.3 170.5 160.2 143.1 166.0 176.7 168.6 60.2 151.6 155.3 167.9 131.5
QIV 189.0 233.7 155.6 162.4 168.3 147.0 182.1 166.0 168.6 60.2 186.8 165.8 171.8 138.4
Source: Central Statistical Agency
Table 22 (E5): Regional States' Consumer Price Indices (Non-Food)December 2016 = 100
Perio
d
Gen
eral
Ind
ex
Food
&
Non
-alc
ohol
ic
Ind
ex
Non
-Foo
d
Ind
ex
Alc
ohol
ic
beve
rage
s &
Toba
cco
Clo
thin
g &
Fo
ot-w
ear
Hous
ing,
Wa-
ter,E
lect
ric-
ity,G
as a
nd
Oth
er F
uels
Furn
ishin
gs,
Hous
ehol
d
Equi
pmen
t an
d R
outin
e M
aint
enan
ce
of th
e Ho
use
Heal
th
Tran
spor
t
Com
mun
i-ca
tion
Recr
eatio
n an
d C
ultu
re
Educ
atio
n
Rest
aura
nts
and
Hot
els
Misc
ella
neou
s G
ood
s
GAMBELLA2007/08
Q.I 26.9 23.8 33.0 34.2 26.3 49.1 24.8 29.7 38.5 55.6 20.8 33.8 26.9 39.0Q.II 27.9 25.1 33.3 33.5 27.6 49.4 25.8 29.9 38.5 55.6 21.0 34.0 28.1 39.5Q.III 29.3 26.3 35.2 35.5 29.5 50.7 29.2 30.3 42.1 60.9 21.7 35.2 29.8 39.2Q.IV 33.6 31.4 37.8 36.4 31.0 56.1 34.4 31.6 43.9 63.5 22.2 36.0 31.3 39.7
2008/09Q.I 50.2 52.7 45.1 45.9 35.8 66.5 40.8 32.7 43.9 63.5 23.3 37.7 36.5 43.4Q.II 47.2 46.2 48.9 50.9 38.4 72.9 40.4 33.9 43.4 62.8 27.5 44.6 36.4 43.4Q.III 42.2 39.5 47.3 50.7 37.0 68.1 40.0 33.9 42.6 61.6 28.5 46.2 36.4 43.0Q.IV 44.3 42.1 48.3 52.5 37.3 70.0 39.6 36.1 43.1 62.3 30.4 49.2 36.5 43.6
2009/10Q.I 47.0 45.4 49.9 53.4 37.6 75.3 38.8 38.6 43.8 63.3 32.0 51.9 36.6 44.6Q.II 43.7 40.6 49.7 54.7 38.5 69.9 41.7 40.2 50.6 73.2 31.9 51.7 37.3 45.8Q.III 43.5 39.2 51.7 56.8 39.0 74.4 43.2 40.7 54.1 78.1 34.6 56.1 39.6 46.0Q.IV 43.7 38.4 53.9 59.7 38.7 79.5 44.8 42.3 54.4 78.7 37.5 60.8 39.7 46.5
2010/11Q.I 44.6 39.4 54.6 57.5 40.4 80.9 47.5 42.6 55.2 79.7 42.0 68.2 41.6 46.5Q.II 47.2 41.6 58.0 61.2 44.1 85.8 50.2 44.8 56.5 81.6 45.2 73.2 48.0 48.3Q.III 49.3 43.4 60.9 66.1 45.6 87.4 55.5 47.6 56.6 81.9 48.6 78.7 43.3 49.8Q.IV 56.8 52.9 64.3 72.5 48.6 88.5 60.8 48.6 61.6 89.1 51.6 83.7 48.6 51.5
2011/12Q.I 63.5 60.7 68.7 82.9 51.3 88.5 65.6 48.2 64.1 92.7 54.7 88.6 50.8 55.6Q.II 67.9 66.3 70.7 80.8 53.1 92.9 67.2 49.1 66.1 95.5 58.7 95.1 54.7 58.7Q.III 71.2 71.3 71.9 81.7 57.7 88.8 70.2 50.4 71.1 100.0 61.5 0.0 59.8 62.1Q.IV 75.5 76.9 74.6 83.1 64.0 90.3 72.2 50.3 75.5 100.0 62.6 0.0 64.7 64.9
2012/13Q.I 77.9 78.8 77.6 92.8 65.8 93.9 75.0 52.4 77.0 100.0 62.8 0.0 66.4 64.1Q.II 76.8 75.0 79.7 94.0 70.5 92.2 77.6 56.5 78.0 100.0 67.8 0.0 69.4 70.8Q.III 77.0 74.1 81.2 90.9 72.0 93.5 78.4 58.8 78.9 100.0 73.5 0.0 70.3 81.5Q.IV 80.0 78.1 83.1 86.3 73.5 93.0 85.9 64.1 79.8 100.0 78.4 0.0 71.0 85.7
2013/14Q.I 83.5 81.4 86.8 90.0 78.6 104.4 85.1 65.6 80.8 100.0 82.8 0.0 71.3 85.8Q.II 84.7 82.3 88.4 93.9 82.0 105.0 86.2 67.9 81.3 100.0 82.5 0.0 74.0 86.2Q.III 84.9 81.7 89.5 94.1 83.2 103.4 90.4 69.9 81.3 100.0 83.7 0.0 75.2 89.0Q.IV 87.9 85.9 91.2 95.6 82.9 110.0 88.9 74.0 79.3 100.0 82.5 0.0 78.3 89.3
2014/15Q.I 89.3 86.6 93.4 97.8 79.8 121.3 87.8 74.4 83.0 100.0 84.3 0.0 76.5 88.7Q.II 86.1 84.0 89.5 97.7 80.7 102.1 87.8 75.3 84.3 100.0 85.2 0.0 79.0 86.0Q.III 87.9 87.1 89.7 95.8 84.8 96.9 88.9 79.2 85.9 100.0 86.9 0.0 80.7 90.1Q.IV 90.0 88.8 92.4 102.8 87.6 103.3 90.5 78.5 86.1 100.0 82.2 0.0 79.6 91.2
2015/16Q.I 95.9 96.8 95.8 114.9 94.0 103.3 91.6 81.2 86.5 100.0 87.3 0.0 83.3 94.7QII 94.9 93.2 97.9 111.0 92.3 106.2 92.8 82.0 100.5 100.0 89.9 0.0 89.0 98.0QIII 94.7 93.1 97.6 105.4 92.0 105.6 95.9 84.4 100.7 100.0 90.0 0.0 92.3 90.4QIV 97.9 98.0 97.7 111.6 93.0 100.9 98.6 87.9 91.3 100.0 91.5 0.0 92.5 92.4
2016/17QI 99.9 101.1 97.8 108.9 96.9 98.9 97.4 90.1 95.5 100.0 92.6 0.0 94.3 92.3QII 99.7 99.5 100.1 110.9 98.1 101.0 98.8 94.4 99.8 100.0 97.6 33.3 97.3 95.5QIII 101.2 102.2 100.1 108.2 100.6 100.3 95.7 95.3 100.1 100.0 84.9 100.0 98.7 97.3QIV 103.8 106.5 100.8 114.7 99.8 100.7 99.3 85.0 100.4 100.0 111.9 100.0 98.3 94.2
2017/18QI 107.7 111.7 103.0 122.0 111.6 101.4 101.9 81.5 101.0 100.4 116.3 100.0 99.7 96.1QII 108.1 109.3 106.6 129.7 115.3 103.7 113.4 74.3 102.9 100.4 124.6 100.0 103.6 97.8QIII 108.7 110.1 107.0 132.4 124.4 95.3 120.8 86.4 125.1 100.3 126.0 100.0 115.9 98.6QIV 116.5 120.6 111.8 134.7 128.1 95.4 125.7 96.4 134.4 115.8 128.8 100.0 140.1 101.7
2018/19QI 122.5 127.8 116.3 129.2 131.2 104.9 127.9 95.9 134.5 115.2 130.1 100.0 142.6 103.1QII 119.6 125.0 113.4 134.0 133.5 96.9 131.8 90.1 134.4 109.8 127.0 103.6 143.5 104.8QIII 121.6 129.1 113.0 144.8 130.8 93.1 137.9 89.4 136.0 97.9 122.9 117.1 146.0 106.1QIV 129.0 137.3 119.6 151.8 134.2 102.8 138.6 110.2 136.1 95.8 125.9 107.0 148.7 110.3
2019/20QI 138.9 149.2 127.1 155.7 144.4 109.9 143.2 130.9 149.8 98.2 131.0 143.3 157.4 116.3QII 139.8 147.6 130.7 153.5 152.8 118.6 145.5 105.2 130.9 105.4 149.7 158.9 165.6 111.8QIII 149.0 159.3 137.2 190.5 153.0 124.0 140.0 89.3 151.3 121.7 152.2 163.0 160.4 116.6QIV 165.7 181.3 147.8 250.2 159.3 132.4 151.9 94.0 148.7 120.0 144.8 145.2 150.6 118.6
2020/21QI 173.7 192.1 152.5 269.9 157.7 135.2 150.2 111.3 175.6 115.2 146.0 146.1 152.9 112.0QII 173.6 190.6 154.1 265.4 164.6 134.5 151.6 117.9 180.2 118.8 191.2 160.9 161.5 116.6QIII 184.6 203.3 163.0 283.9 169.5 139.3 163.3 128.4 195.1 124.9 217.1 167.9 178.4 123.5QIV 193.4 217.9 165.1 280.3 187.8 131.6 194.9 140.4 200.9 131.0 217.0 184.4 182.0 128.2
Source: Central Statistical Agency

124 | Fourth Quarter 2020/21
National Bank of Ethiopia Quarterly Bulletin
Table 22 (E6): Regional States' Consumer Price Indices (Non-Food)December 2016 = 100
Perio
d
Gen
eral
In
dex
Food
&
Non
-alc
o-ho
lic In
dex
Non
-Foo
d In
dex
Alc
ohol
ic
beve
rage
s &
Toba
cco
Clo
thin
g &
Foot
-wea
r
Hous
ing,
Wa-
ter,E
lect
ric-
ity,G
as a
nd
Oth
er F
uels
Furn
ishin
gs,
Hous
ehol
d Eq
uipm
ent
and
Rout
ine
Mai
nte-
nanc
e of
the
Hous
e
Heal
th
Tran
spor
t
Com
mun
i-ca
tion
Recr
eatio
n an
d C
ultu
re
Educ
atio
n
Rest
aura
nts
and
Hote
ls
Misc
ella
ne-
ous
Goo
ds
HARARI2007/08
Q.I 24.6 19.2 31.8 21.0 24.9 54.7 31.0 33.5 56.6 60.6 27.1 51.4 23.4 27.4Q.II 25.2 19.7 32.4 21.3 27.2 54.0 32.1 34.0 56.6 60.6 27.3 51.7 23.8 27.9Q.III 27.0 21.5 34.3 21.1 28.6 58.2 33.7 33.3 64.6 69.1 27.1 51.3 25.8 28.2Q.IV 32.9 28.4 38.1 22.4 31.3 67.6 36.8 31.9 68.6 73.4 28.5 54.0 29.9 30.2
2008/09Q.I 38.8 35.7 40.7 28.0 35.0 70.2 38.7 32.8 73.8 79.0 29.5 56.0 35.4 32.2Q.II 39.1 35.2 42.2 29.3 36.6 72.9 40.2 35.7 73.9 79.1 31.0 58.8 37.6 33.6Q.III 38.7 34.1 42.5 35.2 39.1 69.8 42.1 35.7 67.2 71.9 32.0 60.6 37.6 33.7Q.IV 39.6 34.7 43.6 37.4 40.8 69.6 44.4 35.2 67.6 72.3 33.8 64.0 37.9 34.0
2009/10Q.I 40.6 35.0 46.0 37.9 42.7 73.1 46.5 67.2 72.5 77.6 35.7 67.7 38.8 34.8Q.II 41.1 35.1 46.9 38.8 43.8 71.5 49.7 83.6 74.1 79.3 37.9 71.8 39.2 35.1Q.III 42.2 36.4 47.6 39.4 43.7 74.2 50.9 84.5 72.4 77.5 38.1 72.3 40.5 35.6Q.IV 43.0 36.8 49.0 39.3 44.6 77.9 51.4 84.1 72.6 77.7 40.6 77.0 42.1 35.4
2010/11Q.I 44.4 38.2 50.3 41.2 46.5 79.8 51.9 85.0 72.4 77.5 42.0 79.5 43.9 35.8Q.II 47.6 40.8 54.3 45.3 50.2 87.1 54.3 87.5 80.4 86.0 44.5 84.3 45.2 37.6Q.III 51.3 44.8 56.9 47.1 51.1 95.4 52.7 96.5 80.6 86.3 46.4 88.0 46.0 45.1Q.IV 55.7 48.8 61.3 49.3 53.6 104.1 58.3 92.8 85.2 91.3 49.3 93.4 50.5 56.7
2011/12Q.I 58.7 52.4 62.4 52.9 56.2 100.7 60.2 95.2 92.6 99.1 50.6 95.9 60.9 62.0Q.II 61.0 54.8 65.6 52.9 59.8 100.5 61.5 95.2 93.0 99.6 52.2 99.0 62.3 70.3Q.III 65.8 61.2 70.8 55.3 63.4 100.3 64.2 102.6 93.4 100.0 49.8 100.0 65.0 74.4Q.IV 69.4 67.9 71.1 54.4 64.9 100.7 65.6 96.9 96.2 100.0 48.7 100.0 70.3 74.7
2012/13Q.I 70.1 70.1 70.0 50.8 66.9 100.2 65.2 96.2 98.3 100.0 50.6 100.0 75.0 78.2Q.II 71.3 71.1 71.7 52.4 71.2 100.3 68.9 106.3 103.8 100.0 51.4 100.0 74.9 78.0Q.III 72.9 69.1 76.9 63.0 74.4 100.2 71.0 115.4 103.8 100.0 52.9 100.0 76.8 79.0Q.IV 71.3 73.2 69.3 43.5 77.2 99.9 74.3 138.5 100.0 100.0 55.6 100.0 77.8 80.3
2013/14Q.I 76.2 78.7 73.5 51.4 77.8 102.0 76.4 105.3 100.0 100.0 60.1 100.0 83.7 81.7Q.II 77.9 78.4 77.3 55.7 80.1 109.0 77.8 100.0 100.0 100.0 61.9 100.0 84.4 83.5Q.III 81.2 76.9 85.8 71.9 82.1 113.3 78.7 100.0 102.1 100.0 61.9 100.0 86.3 87.0Q.IV 80.7 79.2 82.4 61.8 83.9 115.1 82.9 93.3 98.8 100.0 61.6 100.0 88.5 87.2
2014/15Q.I 82.8 84.8 80.6 56.9 83.7 116.1 84.1 100.0 100.0 100.0 59.7 100.0 87.6 87.6Q.II 83.3 85.8 80.6 57.4 84.8 114.4 83.4 86.6 100.0 100.0 59.9 100.0 90.6 89.2Q.III 87.4 86.2 88.6 77.4 88.5 109.7 82.6 80.0 100.0 100.0 60.1 100.0 93.2 90.0Q.IV 87.9 90.0 85.6 70.7 89.2 107.9 85.3 80.0 100.0 100.0 61.2 100.0 92.8 91.8
2015/16Q.I 87.6 90.6 84.5 65.3 91.0 107.9 90.3 80.0 100.0 100.0 80.9 100.0 97.1 93.8Q.II 89.4 92.1 86.4 68.7 91.6 107.8 94.4 106.0 100.0 100.0 61.1 100.0 97.6 98.0QIII 105.6 92.7 119.4 145.9 93.2 102.6 96.8 120.2 100.0 100.0 97.8 100.0 95.3 104.1QIV 96.1 97.3 94.8 90.0 94.3 100.1 98.5 100.0 100.0 100.0 99.6 100.0 96.8 99.1
2016/17QI 97.8 102.3 93.1 84.4 99.0 100.0 97.5 116.5 100.0 100.0 99.7 100.0 99.2 99.2QIII 97.4 100.7 93.9 85.8 102.3 99.9 98.8 104.3 100.0 100.0 99.5 100.0 97.6 100.6QII 103.6 100.0 106.1 119.7 98.3 105.1 99.3 101.8 100.0 100.0 99.5 101.0 102.9 101.7QIV 102.5 107.5 99.0 94.7 104.3 95.5 103.4 99.7 100.0 100.0 107.5 101.2 101.5 99.9
2017/18QI 103.5 110.8 98.4 86.3 107.9 96.4 102.9 106.7 100.0 100.0 111.6 102.2 104.4 100.5QII 105.1 110.6 101.3 91.6 111.3 94.0 110.1 106.4 102.3 100.0 111.3 115.5 108.1 104.4QIII 112.7 110.1 114.4 131.7 115.5 99.6 116.0 111.7 111.7 100.0 113.5 119.2 113.2 106.5QIV 114.6 116.0 113.6 120.1 115.3 101.4 122.2 111.3 111.7 100.0 114.6 120.3 117.6 113.3
2018/19QI 116.0 123.5 110.8 93.8 121.4 107.3 128.6 110.9 111.6 100.0 110.4 135.6 121.7 116.9QII 117.4 123.7 113.1 96.1 123.5 108.5 127.4 112.5 117.9 100.0 112.6 151.8 125.0 120.2QIII 122.4 125.9 119.9 115.8 128.4 114.4 129.2 110.1 135.1 100.0 111.2 152.3 121.2 127.6QIV 129.8 138.8 123.6 117.8 127.9 113.1 136.4 118.7 139.8 100.0 118.8 151.5 133.6 135.0
2019/20QI 142.3 153.9 134.3 133.3 136.8 129.3 133.4 123.9 150.0 100.0 121.8 149.3 147.7 133.5QII 145.9 160.0 136.0 106.0 136.3 155.8 132.2 139.7 150.0 100.0 138.3 137.6 161.6 133.6QIII 151.8 159.2 146.6 128.9 140.7 166.1 134.0 144.9 156.0 100.0 143.8 139.8 170.7 139.8QIV 162.0 173.0 154.4 140.7 141.6 156.6 142.3 150.3 320.1 100.0 142.9 130.3 171.6 144.7
2020/21QI 178.4 189.7 170.5 175.1 143.0 172.2 151.8 156.8 423.3 100.0 129.9 129.3 170.4 157.7QII 179.7 192.4 170.8 176.1 138.0 190.2 154.7 160.5 258.7 100.0 136.2 155.4 178.9 167.9QIII 182.2 193.2 174.6 176.3 144.9 203.6 154.9 173.2 225.3 100.0 140.8 151.8 182.0 178.2QIV 194.2 214.3 180.0 180.6 166.0 195.0 173.1 186.1 240.4 100.0 148.0 159.1 186.7 182.9
Source: Central Statistical Agency

Fourth Quarter 2020/21 | 125
National Bank of Ethiopia Quarterly Bulletin
Table 22 (E6): Regional States' Consumer Price Indices (Non-Food)December 2016 = 100
Perio
d
Gen
eral
In
dex
Food
&
Non
-alc
o-ho
lic In
dex
Non
-Foo
d In
dex
Alc
ohol
ic
beve
rage
s &
Toba
cco
Clo
thin
g &
Foot
-wea
r
Hous
ing,
Wa-
ter,E
lect
ric-
ity,G
as a
nd
Oth
er F
uels
Furn
ishin
gs,
Hous
ehol
d Eq
uipm
ent
and
Rout
ine
Mai
nte-
nanc
e of
the
Hous
e
Heal
th
Tran
spor
t
Com
mun
i-ca
tion
Recr
eatio
n an
d C
ultu
re
Educ
atio
n
Rest
aura
nts
and
Hote
ls
Misc
ella
ne-
ous
Goo
ds
HARARI2007/08
Q.I 24.6 19.2 31.8 21.0 24.9 54.7 31.0 33.5 56.6 60.6 27.1 51.4 23.4 27.4Q.II 25.2 19.7 32.4 21.3 27.2 54.0 32.1 34.0 56.6 60.6 27.3 51.7 23.8 27.9Q.III 27.0 21.5 34.3 21.1 28.6 58.2 33.7 33.3 64.6 69.1 27.1 51.3 25.8 28.2Q.IV 32.9 28.4 38.1 22.4 31.3 67.6 36.8 31.9 68.6 73.4 28.5 54.0 29.9 30.2
2008/09Q.I 38.8 35.7 40.7 28.0 35.0 70.2 38.7 32.8 73.8 79.0 29.5 56.0 35.4 32.2Q.II 39.1 35.2 42.2 29.3 36.6 72.9 40.2 35.7 73.9 79.1 31.0 58.8 37.6 33.6Q.III 38.7 34.1 42.5 35.2 39.1 69.8 42.1 35.7 67.2 71.9 32.0 60.6 37.6 33.7Q.IV 39.6 34.7 43.6 37.4 40.8 69.6 44.4 35.2 67.6 72.3 33.8 64.0 37.9 34.0
2009/10Q.I 40.6 35.0 46.0 37.9 42.7 73.1 46.5 67.2 72.5 77.6 35.7 67.7 38.8 34.8Q.II 41.1 35.1 46.9 38.8 43.8 71.5 49.7 83.6 74.1 79.3 37.9 71.8 39.2 35.1Q.III 42.2 36.4 47.6 39.4 43.7 74.2 50.9 84.5 72.4 77.5 38.1 72.3 40.5 35.6Q.IV 43.0 36.8 49.0 39.3 44.6 77.9 51.4 84.1 72.6 77.7 40.6 77.0 42.1 35.4
2010/11Q.I 44.4 38.2 50.3 41.2 46.5 79.8 51.9 85.0 72.4 77.5 42.0 79.5 43.9 35.8Q.II 47.6 40.8 54.3 45.3 50.2 87.1 54.3 87.5 80.4 86.0 44.5 84.3 45.2 37.6Q.III 51.3 44.8 56.9 47.1 51.1 95.4 52.7 96.5 80.6 86.3 46.4 88.0 46.0 45.1Q.IV 55.7 48.8 61.3 49.3 53.6 104.1 58.3 92.8 85.2 91.3 49.3 93.4 50.5 56.7
2011/12Q.I 58.7 52.4 62.4 52.9 56.2 100.7 60.2 95.2 92.6 99.1 50.6 95.9 60.9 62.0Q.II 61.0 54.8 65.6 52.9 59.8 100.5 61.5 95.2 93.0 99.6 52.2 99.0 62.3 70.3Q.III 65.8 61.2 70.8 55.3 63.4 100.3 64.2 102.6 93.4 100.0 49.8 100.0 65.0 74.4Q.IV 69.4 67.9 71.1 54.4 64.9 100.7 65.6 96.9 96.2 100.0 48.7 100.0 70.3 74.7
2012/13Q.I 70.1 70.1 70.0 50.8 66.9 100.2 65.2 96.2 98.3 100.0 50.6 100.0 75.0 78.2Q.II 71.3 71.1 71.7 52.4 71.2 100.3 68.9 106.3 103.8 100.0 51.4 100.0 74.9 78.0Q.III 72.9 69.1 76.9 63.0 74.4 100.2 71.0 115.4 103.8 100.0 52.9 100.0 76.8 79.0Q.IV 71.3 73.2 69.3 43.5 77.2 99.9 74.3 138.5 100.0 100.0 55.6 100.0 77.8 80.3
2013/14Q.I 76.2 78.7 73.5 51.4 77.8 102.0 76.4 105.3 100.0 100.0 60.1 100.0 83.7 81.7Q.II 77.9 78.4 77.3 55.7 80.1 109.0 77.8 100.0 100.0 100.0 61.9 100.0 84.4 83.5Q.III 81.2 76.9 85.8 71.9 82.1 113.3 78.7 100.0 102.1 100.0 61.9 100.0 86.3 87.0Q.IV 80.7 79.2 82.4 61.8 83.9 115.1 82.9 93.3 98.8 100.0 61.6 100.0 88.5 87.2
2014/15Q.I 82.8 84.8 80.6 56.9 83.7 116.1 84.1 100.0 100.0 100.0 59.7 100.0 87.6 87.6Q.II 83.3 85.8 80.6 57.4 84.8 114.4 83.4 86.6 100.0 100.0 59.9 100.0 90.6 89.2Q.III 87.4 86.2 88.6 77.4 88.5 109.7 82.6 80.0 100.0 100.0 60.1 100.0 93.2 90.0Q.IV 87.9 90.0 85.6 70.7 89.2 107.9 85.3 80.0 100.0 100.0 61.2 100.0 92.8 91.8
2015/16Q.I 87.6 90.6 84.5 65.3 91.0 107.9 90.3 80.0 100.0 100.0 80.9 100.0 97.1 93.8Q.II 89.4 92.1 86.4 68.7 91.6 107.8 94.4 106.0 100.0 100.0 61.1 100.0 97.6 98.0QIII 105.6 92.7 119.4 145.9 93.2 102.6 96.8 120.2 100.0 100.0 97.8 100.0 95.3 104.1QIV 96.1 97.3 94.8 90.0 94.3 100.1 98.5 100.0 100.0 100.0 99.6 100.0 96.8 99.1
2016/17QI 97.8 102.3 93.1 84.4 99.0 100.0 97.5 116.5 100.0 100.0 99.7 100.0 99.2 99.2QIII 97.4 100.7 93.9 85.8 102.3 99.9 98.8 104.3 100.0 100.0 99.5 100.0 97.6 100.6QII 103.6 100.0 106.1 119.7 98.3 105.1 99.3 101.8 100.0 100.0 99.5 101.0 102.9 101.7QIV 102.5 107.5 99.0 94.7 104.3 95.5 103.4 99.7 100.0 100.0 107.5 101.2 101.5 99.9
2017/18QI 103.5 110.8 98.4 86.3 107.9 96.4 102.9 106.7 100.0 100.0 111.6 102.2 104.4 100.5QII 105.1 110.6 101.3 91.6 111.3 94.0 110.1 106.4 102.3 100.0 111.3 115.5 108.1 104.4QIII 112.7 110.1 114.4 131.7 115.5 99.6 116.0 111.7 111.7 100.0 113.5 119.2 113.2 106.5QIV 114.6 116.0 113.6 120.1 115.3 101.4 122.2 111.3 111.7 100.0 114.6 120.3 117.6 113.3
2018/19QI 116.0 123.5 110.8 93.8 121.4 107.3 128.6 110.9 111.6 100.0 110.4 135.6 121.7 116.9QII 117.4 123.7 113.1 96.1 123.5 108.5 127.4 112.5 117.9 100.0 112.6 151.8 125.0 120.2QIII 122.4 125.9 119.9 115.8 128.4 114.4 129.2 110.1 135.1 100.0 111.2 152.3 121.2 127.6QIV 129.8 138.8 123.6 117.8 127.9 113.1 136.4 118.7 139.8 100.0 118.8 151.5 133.6 135.0
2019/20QI 142.3 153.9 134.3 133.3 136.8 129.3 133.4 123.9 150.0 100.0 121.8 149.3 147.7 133.5QII 145.9 160.0 136.0 106.0 136.3 155.8 132.2 139.7 150.0 100.0 138.3 137.6 161.6 133.6QIII 151.8 159.2 146.6 128.9 140.7 166.1 134.0 144.9 156.0 100.0 143.8 139.8 170.7 139.8QIV 162.0 173.0 154.4 140.7 141.6 156.6 142.3 150.3 320.1 100.0 142.9 130.3 171.6 144.7
2020/21QI 178.4 189.7 170.5 175.1 143.0 172.2 151.8 156.8 423.3 100.0 129.9 129.3 170.4 157.7QII 179.7 192.4 170.8 176.1 138.0 190.2 154.7 160.5 258.7 100.0 136.2 155.4 178.9 167.9QIII 182.2 193.2 174.6 176.3 144.9 203.6 154.9 173.2 225.3 100.0 140.8 151.8 182.0 178.2QIV 194.2 214.3 180.0 180.6 166.0 195.0 173.1 186.1 240.4 100.0 148.0 159.1 186.7 182.9
Source: Central Statistical Agency
Table 22 (E7): Regional States’ Consumer Price Indices (Non-Food)December 2016 = 100
Perio
d
Gen
eral
In
dex
Food
&
Non
-alc
o-ho
lic In
dex
Non
-Foo
d In
dex
Alc
ohol
ic
beve
rage
s &
Toba
cco
Clo
thin
g &
Foot
-wea
r
Hous
-in
g,W
a-te
r,Ele
ctric
-ity
,Gas
and
O
ther
Fue
ls
Furn
ishin
gs,
Hous
ehol
d Eq
uipm
ent
and
Rout
ine
Mai
nte-
nanc
e of
th
e Ho
use
Heal
th
Tran
spor
t
Com
mun
i-ca
tion
Recr
eatio
n an
d C
ultu
re
Educ
atio
n
Rest
aura
nts
and
Hote
ls
Misc
ella
ne-
ous
Goo
ds
OROMIA2007/08
Q.I 25.3 24.7 26.3 25.8 20.8 28.7 24.5 29.5 52.6 50.0 27.2 40.4 23.4 30.2Q.II 26.6 26.4 26.9 26.0 21.9 28.9 25.4 30.3 53.3 50.7 28.4 42.1 23.6 30.2Q.III 29.3 29.5 28.9 28.4 22.9 31.3 28.2 32.0 55.2 52.5 29.4 43.5 25.0 31.6Q.IV 35.3 37.5 31.7 31.8 24.4 34.9 30.5 33.9 57.0 54.1 30.3 44.9 27.3 34.6
2008/09Q.I 42.9 47.9 34.5 37.9 26.0 37.4 32.3 36.5 57.1 54.2 32.9 48.9 29.5 37.3Q.II 40.3 43.0 35.8 39.4 27.8 38.5 33.4 37.9 60.1 57.1 33.8 50.1 30.7 38.1Q.III 39.1 40.3 37.0 42.2 29.9 39.1 34.5 38.7 52.6 50.0 33.9 50.3 32.5 39.2Q.IV 39.8 40.8 38.2 43.2 31.5 40.2 35.6 41.6 54.9 52.2 35.1 52.1 33.8 41.8
2009/10Q.I 40.6 41.0 40.0 43.7 33.5 41.9 37.6 42.6 59.9 56.9 37.4 55.5 35.0 44.4Q.II 40.1 39.3 41.6 44.3 35.1 43.8 39.0 43.4 65.1 61.9 38.4 56.9 36.5 44.7Q.III 41.2 39.7 43.8 45.7 38.0 46.1 41.8 46.1 68.8 65.4 40.8 60.5 36.9 46.7Q.IV 41.9 39.9 45.3 47.0 39.4 47.5 43.8 47.5 69.9 66.4 42.0 62.3 38.5 48.5
2010/11Q.I 42.9 40.6 46.8 47.9 40.9 49.4 45.3 47.8 70.7 67.2 43.6 64.7 39.2 50.2Q.II 45.7 43.2 50.0 53.4 43.5 51.5 50.1 50.4 77.3 73.4 52.5 77.8 42.6 54.9Q.III 50.3 48.2 54.1 55.9 48.8 55.8 51.7 52.4 93.2 88.5 54.7 81.2 44.0 58.7Q.IV 57.4 57.4 57.4 61.0 51.8 58.0 55.5 53.3 108.0 102.6 56.2 83.4 48.6 61.5
2011/12Q.I 61.1 62.1 59.5 63.6 53.5 58.4 59.5 55.6 108.8 103.4 60.9 90.4 52.5 66.0Q.II 64.1 65.1 62.5 65.3 59.1 59.1 62.9 57.4 104.2 99.0 65.0 96.4 55.9 72.9Q.III 69.1 70.3 67.8 70.8 66.4 63.9 68.8 58.5 105.8 100.0 66.8 100.0 58.3 77.5Q.IV 73.5 76.1 70.6 67.5 71.3 67.0 72.5 59.5 106.4 100.0 67.3 100.0 64.3 78.9
2012/13Q.I 74.2 76.4 71.9 63.1 72.7 69.6 72.9 60.2 105.6 100.0 69.2 100.0 67.9 82.8Q.II 74.1 75.0 73.0 67.8 69.9 70.3 75.6 67.9 106.5 100.0 63.0 100.0 69.9 84.5Q.III 74.3 74.7 73.9 71.4 72.8 70.7 75.8 70.8 98.6 100.0 60.4 100.0 70.3 86.0Q.IV 75.4 75.7 75.1 68.4 74.2 72.8 77.9 73.5 98.9 100.0 60.3 100.0 72.6 86.3
2013/14Q.I 78.6 79.2 77.9 68.5 78.6 76.5 79.6 70.2 98.7 100.0 75.3 100.0 75.5 88.3Q.II 79.9 81.3 78.4 74.3 82.0 73.3 80.7 77.7 98.9 100.0 78.5 100.0 76.0 89.1Q.III 80.1 79.0 81.4 81.7 83.2 77.4 83.7 79.9 100.9 100.0 74.5 100.0 76.6 89.0Q.IV 83.0 82.4 83.6 79.6 85.0 82.2 84.9 83.3 101.6 100.0 67.9 100.0 78.9 89.6
2014/15Q.I 86.0 87.0 84.8 84.6 87.6 81.8 86.4 80.8 101.5 100.0 78.5 100.0 79.6 90.1Q.II 87.3 87.7 86.9 87.8 90.9 84.5 88.2 81.1 101.1 100.0 79.2 100.0 80.0 91.4Q.III 91.0 91.3 90.7 97.8 93.4 89.1 90.3 84.3 99.8 100.0 80.2 100.0 82.1 92.6Q.IV 96.0 98.3 93.4 99.0 95.0 94.3 91.9 84.0 98.9 100.0 81.0 100.0 84.5 93.9
2015/16Q.I 100.0 105.6 93.6 95.6 96.6 93.5 93.3 87.1 99.1 102.4 83.5 100.0 87.3 94.6Q.II 99.6 104.0 94.7 97.3 97.5 93.3 95.2 93.9 98.8 100.0 88.7 100.0 89.8 96.1QIII 98.8 100.5 96.9 102.7 98.9 95.0 98.7 93.9 99.1 100.0 92.0 100.0 91.7 97.2QIV 100.7 102.7 98.4 90.9 99.8 101.2 99.1 98.1 96.1 100.0 95.4 100.0 94.3 98.8
2016/17QI 101.9 104.9 98.5 85.5 99.0 102.5 99.8 94.7 98.8 100.0 96.1 100.0 96.7 99.9QII 100.8 101.8 99.7 95.9 100.0 101.2 99.8 99.1 99.6 100.0 100.2 100.0 98.5 99.4QIII 102.3 101.6 103.2 104.1 102.0 105.3 101.2 106.5 100.6 99.4 99.4 101.4 100.7 101.3QIV 105.6 108.8 101.4 93.4 104.0 99.7 108.5 112.8 102.8 99.0 109.5 105.1 101.3 101.6
2017/18QI 110.0 112.9 106.1 96.9 130.6 105.3 110.7 67.7 106.3 99.3 110.4 115.8 101.2 101.2QII 114.2 116.2 111.6 99.0 133.8 115.7 116.4 69.5 111.3 100.2 112.6 114.5 102.8 101.9QIII 116.4 116.6 116.2 106.6 143.8 117.3 122.8 70.6 115.1 102.5 115.5 119.1 108.0 105.8QIV 121.1 120.3 122.1 100.0 157.0 126.3 129.1 71.8 115.9 101.3 117.4 120.0 115.5 111.9
2018/19QI 125.1 123.7 126.9 103.4 164.8 130.4 135.8 75.0 119.4 102.6 119.2 130.2 122.6 114.9QII 125.8 124.5 127.6 106.6 164.8 128.9 137.2 75.3 126.0 102.8 120.9 132.6 125.2 115.9QIII 130.1 128.0 132.7 119.2 175.0 130.9 143.0 77.9 142.9 102.1 123.2 133.5 120.5 120.9QIV 138.4 143.1 132.5 117.1 171.8 127.6 147.6 81.4 146.0 103.6 123.7 137.1 124.0 130.1
2019/20QI 146.1 152.2 138.1 117.2 180.0 135.3 153.0 85.4 148.7 102.9 122.4 141.2 131.9 134.0QII 148.8 154.8 141.1 125.3 183.0 136.7 152.0 93.5 149.9 101.8 137.6 133.3 138.0 138.1QIII 154.6 160.7 146.7 127.6 178.9 149.4 153.0 95.6 159.0 100.7 134.0 136.4 142.4 144.6QIV 165.5 175.5 152.7 147.7 190.3 140.8 156.4 124.8 211.0 102.3 131.4 139.6 148.1 148.3
2020/21QI 173.8 187.6 156.2 145.1 190.6 144.4 159.0 121.8 244.2 101.3 137.4 147.8 151.6 152.5QII 175.2 189.3 157.0 149.8 201.0 144.1 158.2 141.8 190.4 100.6 151.6 144.5 159.5 159.0QIII 186.9 198.5 172.0 159.3 210.9 163.5 175.4 165.3 220.5 101.9 167.0 146.0 166.2 168.2QIV 202.6 221.1 178.9 164.2 226.9 152.7 204.8 184.2 255.0 104.1 180.3 157.8 174.2 195.0
Source: Central Statistical Agency
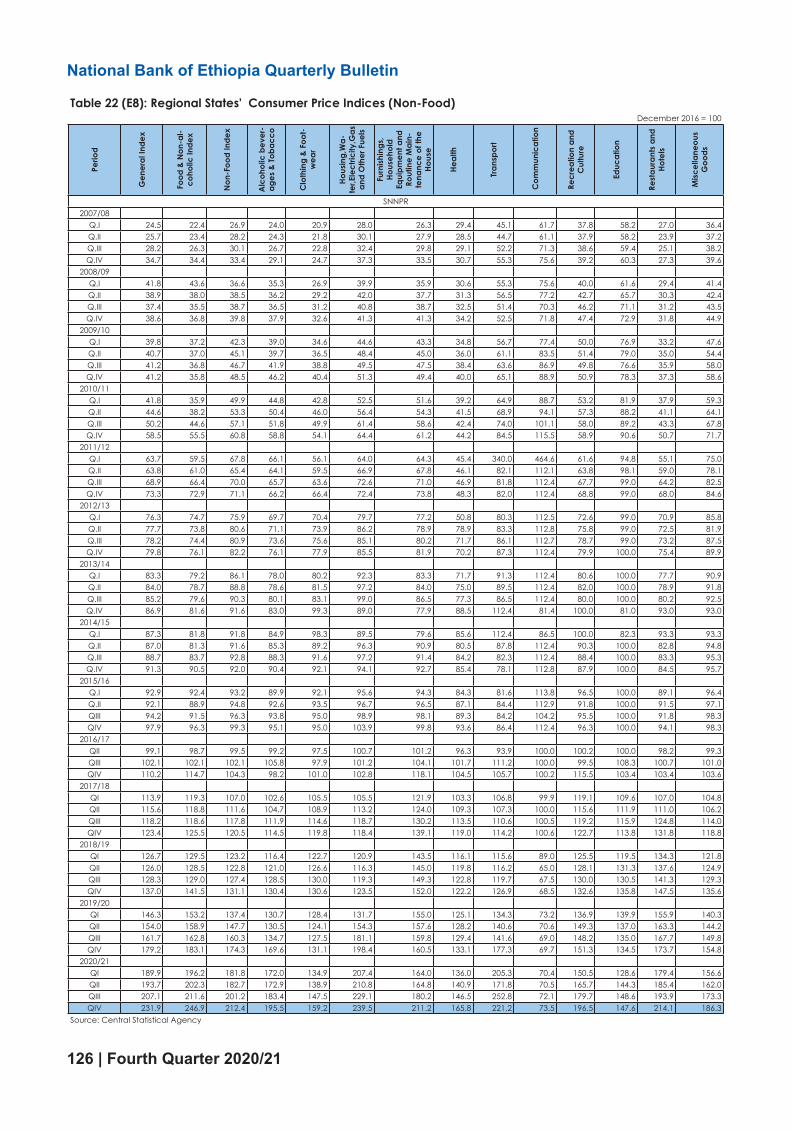
126 | Fourth Quarter 2020/21
National Bank of Ethiopia Quarterly Bulletin
Table 22 (E8): Regional States' Consumer Price Indices (Non-Food)December 2016 = 100
Perio
d
Gen
eral
Inde
x
Food
& N
on-a
l-co
holic
Inde
x
Non
-Foo
d In
dex
Alc
ohol
ic b
ever
-ag
es &
Toba
cco
Clo
thin
g &
Foot
-w
ear
Hous
ing,
Wa-
ter,E
lect
ricity
,Gas
an
d O
ther
Fue
ls
Furn
ishin
gs,
Hous
ehol
d Eq
uipm
ent a
nd
Rout
ine
Mai
n-te
nanc
e of
the
Hous
e
Heal
th
Tran
spor
t
Com
mun
icat
ion
Recr
eatio
n an
d C
ultu
re
Educ
atio
n
Rest
aura
nts
and
Hote
ls
Misc
ella
neou
s G
oods
SNNPR2007/08
Q.I 24.5 22.4 26.9 24.0 20.9 28.0 26.3 29.4 45.1 61.7 37.8 58.2 27.0 36.4Q.II 25.7 23.4 28.2 24.3 21.8 30.1 27.9 28.5 44.7 61.1 37.9 58.2 23.9 37.2Q.III 28.2 26.3 30.1 26.7 22.8 32.4 29.8 29.1 52.2 71.3 38.6 59.4 25.1 38.2Q.IV 34.7 34.4 33.4 29.1 24.7 37.3 33.5 30.7 55.3 75.6 39.2 60.3 27.3 39.6
2008/09Q.I 41.8 43.6 36.6 35.3 26.9 39.9 35.9 30.6 55.3 75.6 40.0 61.6 29.4 41.4Q.II 38.9 38.0 38.5 36.2 29.2 42.0 37.7 31.3 56.5 77.2 42.7 65.7 30.3 42.4Q.III 37.4 35.5 38.7 36.5 31.2 40.8 38.7 32.5 51.4 70.3 46.2 71.1 31.2 43.5Q.IV 38.6 36.8 39.8 37.9 32.6 41.3 41.3 34.2 52.5 71.8 47.4 72.9 31.8 44.9
2009/10Q.I 39.8 37.2 42.3 39.0 34.6 44.6 43.3 34.8 56.7 77.4 50.0 76.9 33.2 47.6Q.II 40.7 37.0 45.1 39.7 36.5 48.4 45.0 36.0 61.1 83.5 51.4 79.0 35.0 54.4Q.III 41.2 36.8 46.7 41.9 38.8 49.5 47.5 38.4 63.6 86.9 49.8 76.6 35.9 58.0Q.IV 41.2 35.8 48.5 46.2 40.4 51.3 49.4 40.0 65.1 88.9 50.9 78.3 37.3 58.6
2010/11Q.I 41.8 35.9 49.9 44.8 42.8 52.5 51.6 39.2 64.9 88.7 53.2 81.9 37.9 59.3Q.II 44.6 38.2 53.3 50.4 46.0 56.4 54.3 41.5 68.9 94.1 57.3 88.2 41.1 64.1Q.III 50.2 44.6 57.1 51.8 49.9 61.4 58.6 42.4 74.0 101.1 58.0 89.2 43.3 67.8Q.IV 58.5 55.5 60.8 58.8 54.1 64.4 61.2 44.2 84.5 115.5 58.9 90.6 50.7 71.7
2011/12Q.I 63.7 59.5 67.8 66.1 56.1 64.0 64.3 45.4 340.0 464.6 61.6 94.8 55.1 75.0Q.II 63.8 61.0 65.4 64.1 59.5 66.9 67.8 46.1 82.1 112.1 63.8 98.1 59.0 78.1Q.III 68.9 66.4 70.0 65.7 63.6 72.6 71.0 46.9 81.8 112.4 67.7 99.0 64.2 82.5Q.IV 73.3 72.9 71.1 66.2 66.4 72.4 73.8 48.3 82.0 112.4 68.8 99.0 68.0 84.6
2012/13Q.I 76.3 74.7 75.9 69.7 70.4 79.7 77.2 50.8 80.3 112.5 72.6 99.0 70.9 85.8Q.II 77.7 73.8 80.6 71.1 73.9 86.2 78.9 78.9 83.3 112.8 75.8 99.0 72.5 81.9Q.III 78.2 74.4 80.9 73.6 75.6 85.1 80.2 71.7 86.1 112.7 78.7 99.0 73.2 87.5Q.IV 79.8 76.1 82.2 76.1 77.9 85.5 81.9 70.2 87.3 112.4 79.9 100.0 75.4 89.9
2013/14Q.I 83.3 79.2 86.1 78.0 80.2 92.3 83.3 71.7 91.3 112.4 80.6 100.0 77.7 90.9Q.II 84.0 78.7 88.8 78.6 81.5 97.2 84.0 75.0 89.5 112.4 82.0 100.0 78.9 91.8Q.III 85.2 79.6 90.3 80.1 83.1 99.0 86.5 77.3 86.5 112.4 80.0 100.0 80.2 92.5Q.IV 86.9 81.6 91.6 83.0 99.3 89.0 77.9 88.5 112.4 81.4 100.0 81.0 93.0 93.0
2014/15Q.I 87.3 81.8 91.8 84.9 98.3 89.5 79.6 85.6 112.4 86.5 100.0 82.3 93.3 93.3Q.II 87.0 81.3 91.6 85.3 89.2 96.3 90.9 80.5 87.8 112.4 90.3 100.0 82.8 94.8Q.III 88.7 83.7 92.8 88.3 91.6 97.2 91.4 84.2 82.3 112.4 88.4 100.0 83.3 95.3Q.IV 91.3 90.5 92.0 90.4 92.1 94.1 92.7 85.4 78.1 112.8 87.9 100.0 84.5 95.7
2015/16Q.I 92.9 92.4 93.2 89.9 92.1 95.6 94.3 84.3 81.6 113.8 96.5 100.0 89.1 96.4Q.II 92.1 88.9 94.8 92.6 93.5 96.7 96.5 87.1 84.4 112.9 91.8 100.0 91.5 97.1QIII 94.2 91.5 96.3 93.8 95.0 98.9 98.1 89.3 84.2 104.2 95.5 100.0 91.8 98.3QIV 97.9 96.3 99.3 95.1 95.0 103.9 99.8 93.6 86.4 112.4 96.3 100.0 94.1 98.3
2016/17QII 99.1 98.7 99.5 99.2 97.5 100.7 101.2 96.3 93.9 100.0 100.2 100.0 98.2 99.3QIII 102.1 102.1 102.1 105.8 97.9 101.2 104.1 101.7 111.2 100.0 99.5 108.3 100.7 101.0QIV 110.2 114.7 104.3 98.2 101.0 102.8 118.1 104.5 105.7 100.2 115.5 103.4 103.4 103.6
2017/18QI 113.9 119.3 107.0 102.6 105.5 105.5 121.9 103.3 106.8 99.9 119.1 109.6 107.0 104.8QII 115.6 118.8 111.6 104.7 108.9 113.2 124.0 109.3 107.3 100.0 115.6 111.9 111.0 106.2QIII 118.2 118.6 117.8 111.9 114.6 118.7 130.2 113.5 110.6 100.5 119.2 115.9 124.8 114.0QIV 123.4 125.5 120.5 114.5 119.8 118.4 139.1 119.0 114.2 100.6 122.7 113.8 131.8 118.8
2018/19QI 126.7 129.5 123.2 116.4 122.7 120.9 143.5 116.1 115.6 89.0 125.5 119.5 134.3 121.8QII 126.0 128.5 122.8 121.0 126.6 116.3 145.0 119.8 116.2 65.0 128.1 131.3 137.6 124.9QIII 128.3 129.0 127.4 128.5 130.0 119.3 149.3 122.8 119.7 67.5 130.0 130.5 141.3 129.3QIV 137.0 141.5 131.1 130.4 130.6 123.5 152.0 122.2 126.9 68.5 132.6 135.8 147.5 135.6
2019/20QI 146.3 153.2 137.4 130.7 128.4 131.7 155.0 125.1 134.3 73.2 136.9 139.9 155.9 140.3QII 154.0 158.9 147.7 130.5 124.1 154.3 157.6 128.2 140.6 70.6 149.3 137.0 163.3 144.2QIII 161.7 162.8 160.3 134.7 127.5 181.1 159.8 129.4 141.6 69.0 148.2 135.0 167.7 149.8QIV 179.2 183.1 174.3 169.6 131.1 198.4 160.5 133.1 177.3 69.7 151.3 134.5 173.7 154.8
2020/21QI 189.9 196.2 181.8 172.0 134.9 207.4 164.0 136.0 205.3 70.4 150.5 128.6 179.4 156.6QII 193.7 202.3 182.7 172.9 138.9 210.8 164.8 140.9 171.8 70.5 165.7 144.3 185.4 162.0QIII 207.1 211.6 201.2 183.4 147.5 229.1 180.2 146.5 252.8 72.1 179.7 148.6 193.9 173.3QIV 231.9 246.9 212.4 195.5 159.2 239.5 211.2 165.8 221.2 73.5 196.5 147.6 214.1 186.3
Source: Central Statistical Agency

Fourth Quarter 2020/21 | 127
National Bank of Ethiopia Quarterly Bulletin
Table 22 (E8): Regional States' Consumer Price Indices (Non-Food)December 2016 = 100
Perio
d
Gen
eral
Inde
x
Food
& N
on-a
l-co
holic
Inde
x
Non
-Foo
d In
dex
Alc
ohol
ic b
ever
-ag
es &
Toba
cco
Clo
thin
g &
Foot
-w
ear
Hous
ing,
Wa-
ter,E
lect
ricity
,Gas
an
d O
ther
Fue
ls
Furn
ishin
gs,
Hous
ehol
d Eq
uipm
ent a
nd
Rout
ine
Mai
n-te
nanc
e of
the
Hous
e
Heal
th
Tran
spor
t
Com
mun
icat
ion
Recr
eatio
n an
d C
ultu
re
Educ
atio
n
Rest
aura
nts
and
Hote
ls
Misc
ella
neou
s G
oods
SNNPR2007/08
Q.I 24.5 22.4 26.9 24.0 20.9 28.0 26.3 29.4 45.1 61.7 37.8 58.2 27.0 36.4Q.II 25.7 23.4 28.2 24.3 21.8 30.1 27.9 28.5 44.7 61.1 37.9 58.2 23.9 37.2Q.III 28.2 26.3 30.1 26.7 22.8 32.4 29.8 29.1 52.2 71.3 38.6 59.4 25.1 38.2Q.IV 34.7 34.4 33.4 29.1 24.7 37.3 33.5 30.7 55.3 75.6 39.2 60.3 27.3 39.6
2008/09Q.I 41.8 43.6 36.6 35.3 26.9 39.9 35.9 30.6 55.3 75.6 40.0 61.6 29.4 41.4Q.II 38.9 38.0 38.5 36.2 29.2 42.0 37.7 31.3 56.5 77.2 42.7 65.7 30.3 42.4Q.III 37.4 35.5 38.7 36.5 31.2 40.8 38.7 32.5 51.4 70.3 46.2 71.1 31.2 43.5Q.IV 38.6 36.8 39.8 37.9 32.6 41.3 41.3 34.2 52.5 71.8 47.4 72.9 31.8 44.9
2009/10Q.I 39.8 37.2 42.3 39.0 34.6 44.6 43.3 34.8 56.7 77.4 50.0 76.9 33.2 47.6Q.II 40.7 37.0 45.1 39.7 36.5 48.4 45.0 36.0 61.1 83.5 51.4 79.0 35.0 54.4Q.III 41.2 36.8 46.7 41.9 38.8 49.5 47.5 38.4 63.6 86.9 49.8 76.6 35.9 58.0Q.IV 41.2 35.8 48.5 46.2 40.4 51.3 49.4 40.0 65.1 88.9 50.9 78.3 37.3 58.6
2010/11Q.I 41.8 35.9 49.9 44.8 42.8 52.5 51.6 39.2 64.9 88.7 53.2 81.9 37.9 59.3Q.II 44.6 38.2 53.3 50.4 46.0 56.4 54.3 41.5 68.9 94.1 57.3 88.2 41.1 64.1Q.III 50.2 44.6 57.1 51.8 49.9 61.4 58.6 42.4 74.0 101.1 58.0 89.2 43.3 67.8Q.IV 58.5 55.5 60.8 58.8 54.1 64.4 61.2 44.2 84.5 115.5 58.9 90.6 50.7 71.7
2011/12Q.I 63.7 59.5 67.8 66.1 56.1 64.0 64.3 45.4 340.0 464.6 61.6 94.8 55.1 75.0Q.II 63.8 61.0 65.4 64.1 59.5 66.9 67.8 46.1 82.1 112.1 63.8 98.1 59.0 78.1Q.III 68.9 66.4 70.0 65.7 63.6 72.6 71.0 46.9 81.8 112.4 67.7 99.0 64.2 82.5Q.IV 73.3 72.9 71.1 66.2 66.4 72.4 73.8 48.3 82.0 112.4 68.8 99.0 68.0 84.6
2012/13Q.I 76.3 74.7 75.9 69.7 70.4 79.7 77.2 50.8 80.3 112.5 72.6 99.0 70.9 85.8Q.II 77.7 73.8 80.6 71.1 73.9 86.2 78.9 78.9 83.3 112.8 75.8 99.0 72.5 81.9Q.III 78.2 74.4 80.9 73.6 75.6 85.1 80.2 71.7 86.1 112.7 78.7 99.0 73.2 87.5Q.IV 79.8 76.1 82.2 76.1 77.9 85.5 81.9 70.2 87.3 112.4 79.9 100.0 75.4 89.9
2013/14Q.I 83.3 79.2 86.1 78.0 80.2 92.3 83.3 71.7 91.3 112.4 80.6 100.0 77.7 90.9Q.II 84.0 78.7 88.8 78.6 81.5 97.2 84.0 75.0 89.5 112.4 82.0 100.0 78.9 91.8Q.III 85.2 79.6 90.3 80.1 83.1 99.0 86.5 77.3 86.5 112.4 80.0 100.0 80.2 92.5Q.IV 86.9 81.6 91.6 83.0 99.3 89.0 77.9 88.5 112.4 81.4 100.0 81.0 93.0 93.0
2014/15Q.I 87.3 81.8 91.8 84.9 98.3 89.5 79.6 85.6 112.4 86.5 100.0 82.3 93.3 93.3Q.II 87.0 81.3 91.6 85.3 89.2 96.3 90.9 80.5 87.8 112.4 90.3 100.0 82.8 94.8Q.III 88.7 83.7 92.8 88.3 91.6 97.2 91.4 84.2 82.3 112.4 88.4 100.0 83.3 95.3Q.IV 91.3 90.5 92.0 90.4 92.1 94.1 92.7 85.4 78.1 112.8 87.9 100.0 84.5 95.7
2015/16Q.I 92.9 92.4 93.2 89.9 92.1 95.6 94.3 84.3 81.6 113.8 96.5 100.0 89.1 96.4Q.II 92.1 88.9 94.8 92.6 93.5 96.7 96.5 87.1 84.4 112.9 91.8 100.0 91.5 97.1QIII 94.2 91.5 96.3 93.8 95.0 98.9 98.1 89.3 84.2 104.2 95.5 100.0 91.8 98.3QIV 97.9 96.3 99.3 95.1 95.0 103.9 99.8 93.6 86.4 112.4 96.3 100.0 94.1 98.3
2016/17QII 99.1 98.7 99.5 99.2 97.5 100.7 101.2 96.3 93.9 100.0 100.2 100.0 98.2 99.3QIII 102.1 102.1 102.1 105.8 97.9 101.2 104.1 101.7 111.2 100.0 99.5 108.3 100.7 101.0QIV 110.2 114.7 104.3 98.2 101.0 102.8 118.1 104.5 105.7 100.2 115.5 103.4 103.4 103.6
2017/18QI 113.9 119.3 107.0 102.6 105.5 105.5 121.9 103.3 106.8 99.9 119.1 109.6 107.0 104.8QII 115.6 118.8 111.6 104.7 108.9 113.2 124.0 109.3 107.3 100.0 115.6 111.9 111.0 106.2QIII 118.2 118.6 117.8 111.9 114.6 118.7 130.2 113.5 110.6 100.5 119.2 115.9 124.8 114.0QIV 123.4 125.5 120.5 114.5 119.8 118.4 139.1 119.0 114.2 100.6 122.7 113.8 131.8 118.8
2018/19QI 126.7 129.5 123.2 116.4 122.7 120.9 143.5 116.1 115.6 89.0 125.5 119.5 134.3 121.8QII 126.0 128.5 122.8 121.0 126.6 116.3 145.0 119.8 116.2 65.0 128.1 131.3 137.6 124.9QIII 128.3 129.0 127.4 128.5 130.0 119.3 149.3 122.8 119.7 67.5 130.0 130.5 141.3 129.3QIV 137.0 141.5 131.1 130.4 130.6 123.5 152.0 122.2 126.9 68.5 132.6 135.8 147.5 135.6
2019/20QI 146.3 153.2 137.4 130.7 128.4 131.7 155.0 125.1 134.3 73.2 136.9 139.9 155.9 140.3QII 154.0 158.9 147.7 130.5 124.1 154.3 157.6 128.2 140.6 70.6 149.3 137.0 163.3 144.2QIII 161.7 162.8 160.3 134.7 127.5 181.1 159.8 129.4 141.6 69.0 148.2 135.0 167.7 149.8QIV 179.2 183.1 174.3 169.6 131.1 198.4 160.5 133.1 177.3 69.7 151.3 134.5 173.7 154.8
2020/21QI 189.9 196.2 181.8 172.0 134.9 207.4 164.0 136.0 205.3 70.4 150.5 128.6 179.4 156.6QII 193.7 202.3 182.7 172.9 138.9 210.8 164.8 140.9 171.8 70.5 165.7 144.3 185.4 162.0QIII 207.1 211.6 201.2 183.4 147.5 229.1 180.2 146.5 252.8 72.1 179.7 148.6 193.9 173.3QIV 231.9 246.9 212.4 195.5 159.2 239.5 211.2 165.8 221.2 73.5 196.5 147.6 214.1 186.3
Source: Central Statistical Agency
Table 22 (E9): Regional States' Consumer Price Indices (Non-Food)December 2016 = 100
Perio
d
Gen
eral
Inde
x
Food
& N
on-
alco
holic
Inde
x
Non
-Foo
d In
dex
Alc
ohol
ic
beve
rage
s &
Toba
cco
Clo
thin
g &
Foot
-wea
r
Hous
ing,
Wat
er,
Elec
trici
ty,G
as
and
Oth
er F
uels
Furn
ishin
gs,
Hous
ehol
d Eq
uipm
ent a
nd
Rout
ine
Mai
nte-
nanc
e of
the
Hous
e
Heal
th
Tran
spor
t
Com
mun
ica-
tion
Recr
eatio
n an
d C
ultu
re
Educ
atio
n
Rest
aura
nts
and
Hote
ls
Misc
ella
neou
s G
oods
SOMALI2007/08
Q.I 21.9 22.8 22.5 21.78 28.4 17.2 26.4 29.4 39.6 49.9 25.9 50.9 25.1 29.4Q.II 22.7 23.6 23.1 22.54 29.7 17.6 26.9 31.2 39.2 49.4 26.0 51.2 24.3 30.1Q.III 24.7 26.4 24.1 22.50 31.1 18.6 28.1 31.3 41.6 52.4 27.5 54.0 25.3 30.6Q.IV 28.6 32.0 25.4 22.23 33.6 19.3 32.4 32.3 43.2 54.5 27.3 53.7 27.7 31.2
2008/09Q.I 35.9 43.4 26.4 24.92 33.6 19.7 35.7 35.2 44.6 56.2 26.9 52.9 32.4 35.4Q.II 34.5 39.7 28.6 26.66 34.9 22.3 37.7 37.3 46.0 58.0 28.5 56.1 32.9 37.6Q.III 34.7 40.0 28.8 26.84 36.2 21.9 41.1 30.4 46.1 58.1 28.3 55.7 33.2 38.6Q.IV 36.2 41.7 30.0 28.18 37.6 22.7 44.2 32.1 46.3 58.3 30.4 59.7 36.0 39.4
2009/10Q.I 36.9 42.3 31.2 30.95 38.8 23.1 44.6 35.8 47.1 59.4 33.6 66.1 37.5 39.5Q.II 37.9 42.7 33.2 31.31 42.5 24.7 46.2 41.9 49.0 61.8 35.0 68.8 41.2 41.6Q.III 39.0 43.1 35.6 32.02 44.2 27.7 48.2 48.4 52.0 65.5 35.9 70.5 42.2 44.9Q.IV 39.1 42.9 36.1 33.99 44.7 28.1 48.1 49.7 53.6 67.5 36.4 71.7 43.0 45.5
2010/11Q.I 39.7 43.3 37.2 34.80 46.5 29.2 49.3 49.1 54.6 68.8 36.9 72.7 44.0 46.2Q.II 44.8 50.2 39.6 35.80 50.8 30.6 52.9 50.6 56.8 71.6 43.3 85.2 46.2 52.4Q.III 47.6 54.0 41.3 36.11 53.5 31.5 56.5 54.1 62.5 78.7 48.2 94.8 48.8 54.8Q.IV 52.5 59.8 44.8 37.47 58.3 35.0 61.6 57.9 75.9 95.7 48.7 95.9 54.4 54.6
2011/12Q.I 55.0 62.5 47.4 44.58 61.0 36.3 62.5 60.4 77.9 98.1 50.8 99.9 56.3 56.5Q.II 57.3 64.5 50.4 46.46 64.4 39.5 69.2 56.5 77.7 97.9 49.0 96.3 63.2 57.8Q.III 62.4 70.3 54.6 52.88 71.2 42.0 72.6 58.6 79.3 100.0 51.7 100.0 68.0 67.5Q.IV 63.8 73.5 54.3 46.65 74.1 42.5 81.2 60.4 79.3 100.0 51.5 100.0 69.8 67.0
2012/13Q.I 65.8 74.5 57.2 44.01 78.7 48.2 87.2 61.4 79.3 100.0 56.8 100.0 71.4 71.3Q.II 69.7 78.0 61.6 45.37 82.4 54.7 91.6 70.7 87.5 100.0 69.5 100.0 75.9 73.3Q.III 69.3 77.5 61.2 46.37 82.8 52.8 91.0 74.0 87.3 100.0 72.3 100.0 76.0 77.4Q.IV 71.7 78.8 64.7 56.28 85.3 52.9 92.3 75.2 90.3 100.0 75.2 100.0 80.7 80.5
2013/14Q.I 72.6 80.3 65.1 54.09 83.8 55.3 91.6 77.2 89.3 100.0 77.8 100.0 81.8 85.3Q.II 76.2 82.2 70.4 62.01 84.4 60.7 98.7 77.5 100.0 100.0 75.8 100.0 82.5 84.0Q.III 78.9 83.5 74.4 72.32 83.0 64.6 94.4 81.6 103.2 100.0 73.1 100.0 82.5 83.5Q.IV 79.5 83.0 76.1 76.87 83.1 66.1 92.3 89.4 97.2 100.0 74.4 100.0 86.4 84.4
2014/15Q.I 81.1 85.8 76.5 77.58 83.0 66.5 92.0 86.1 100.0 100.0 75.3 100.0 86.4 84.8Q.II 81.3 86.3 76.5 74.99 86.1 67.0 92.7 93.5 100.0 100.0 79.8 100.0 87.8 84.5Q.III 84.6 87.0 82.2 86.71 89.2 72.4 90.3 94.7 100.0 100.0 81.3 100.0 88.1 87.9Q.IV 90.5 89.6 91.4 101.60 90.8 84.0 90.5 98.4 104.6 100.0 80.0 100.0 89.5 89.2
2015/16Q.I 90.7 89.3 92.0 96.54 94.6 86.7 96.4 111.6 95.4 100.0 83.3 100.0 89.6 93.1Q.II 88.4 91.3 85.5 91.42 96.6 73.5 93.4 107.2 100.0 100.0 81.4 100.0 90.1 98.1QIII 92.0 93.4 90.7 109.44 98.7 73.4 94.7 105.6 100.0 100.0 82.7 100.0 90.9 97.1QIV 91.5 93.2 89.9 101.42 100.8 74.6 100.4 107.8 100.0 100.0 87.3 100.0 92.3 100.1
2016/17QI 92.3 95.1 89.6 88.57 102.3 82.4 98.9 107.4 100.0 100.0 82.1 100.0 94.7 95.7QII 96.7 99.5 94.0 94.32 100.9 88.8 101.4 101.5 100.0 100.0 100.0 100.0 98.1 99.6QIII 102.7 102.8 102.5 109.02 100.1 100.1 101.4 99.5 104.3 100.1 100.0 97.1 100.2 94.5QIV 101.6 104.7 98.1 89.46 103.0 99.1 105.2 107.4 112.5 100.1 140.3 109.2 104.1 97.0
2017/18Qtr.I 104.8 106.9 102.5 101.79 109.4 97.5 110.1 114.0 113.2 100.0 129.6 107.4 114.2 98.2Qtr. II 111.8 113.9 109.5 123.39 113.2 98.5 108.3 120.4 113.4 100.6 137.8 125.4 104.2 105.6Qtr. III 112.5 114.4 110.5 124.6 112.1 98.5 112.4 118.3 113.3 100.6 153.0 133.0 116.4 109.2Qtr. IV 112.5 119.7 104.5 92.4 123.4 97.9 122.2 142.0 114.1 100.6 154.3 125.9 119.7 122.2
2018/19Qtr.I 120.6 129.0 111.4 105.4 128.1 101.6 130.9 145.6 112.7 102.3 154.6 129.3 129.0 128.4Qtr. II 119.9 128.6 110.2 95.6 149.4 98.6 125.4 155.1 122.6 101.9 156.9 133.0 132.8 124.2Qtr. III 123.3 131.9 113.8 103.7 149.1 100.8 126.9 143.8 142.0 103.1 157.3 134.2 131.2 126.2Qtr. IV 133.2 140.6 125.0 123.4 152.3 107.0 151.6 145.7 143.3 103.8 158.0 139.6 134.3 148.9
2019/20Qtr.I 145.3 155.1 134.4 133.3 161.4 122.2 137.5 133.2 177.3 103.2 162.6 158.6 144.1 152.4Qtr.II 150.4 162.3 137.1 131.3 168.5 127.9 133.2 146.3 178.6 103.0 187.6 191.6 155.7 151.3Qtr.III 148.6 158.7 137.5 119.2 176.8 134.7 132.3 133.1 184.2 102.8 200.5 201.3 158.5 154.7Qtr.IV 153.8 161.5 145.1 151.7 179.0 128.4 133.9 131.4 209.2 102.8 193.7 203.7 157.3 154.2
2020/21Qtr.I 157.1 166.3 146.9 132.9 196.9 133.6 135.7 137.3 281.7 103.1 197.6 187.6 166.7 168.0Qtr.II 161.3 167.5 154.4 161.3 184.2 135.8 143.4 141.7 243.6 103.0 213.1 210.9 181.3 176.8Qtr.III 172.0 183.3 159.5 158.4 182.4 146.6 163.1 156.2 245.9 103.5 227.0 212.2 178.1 182.1Qtr.IV 191.9 206.8 175.4 161.0 195.2 179.9 173.8 154.8 243.5 103.8 225.2 200.9 181.4 193.0
Source: Central Statistical Agency

128 | Fourth Quarter 2020/21
National Bank of Ethiopia Quarterly Bulletin
Table 22 (E10): Regional States' Consumer Price Indices (Non-Food)December 2016 = 100
Perio
d
Gen
eral
In
dex
Food
&
Non
-alc
o-ho
lic In
dex
Non
-Foo
d In
dex
Alc
ohol
ic
beve
rage
s &
Toba
cco
Clo
thin
g &
Foot
-wea
r
Hous
-in
g,W
a-te
r,Ele
c-tri
city
,Gas
an
d O
ther
Fu
els
Furn
ishin
gs,
Hous
ehol
d Eq
uipm
ent
and
Rou-
tine
Mai
n-te
nanc
e of
th
e Ho
use
Heal
th
Tran
spor
t
Com
mun
i-ca
tion
Recr
eatio
n an
d C
ultu
re
Educ
atio
n
Rest
aura
nts
and
Hote
ls
Misc
el-
lane
ous
Goo
ds
TIGRAY2007/08
Q.I 25.7 30.5 21.7 24.2 17.6 19.2 21.3 44.4 51.1 50.5 24.7 45.5 24.4 32.5Q.II 27.1 32.7 22.4 23.4 17.9 20.4 22.6 42.8 49.8 49.3 25.3 46.7 26.6 31.9Q.III 28.7 35.3 22.8 25.4 18.1 20.4 23.9 42.5 54.4 53.8 25.3 46.7 27.8 33.2Q.IV 34.0 43.9 24.7 28.9 19.9 21.8 26.7 43.3 56.4 55.8 26.0 47.9 30.2 34.5
2008/09Q.I 42.9 58.9 27.1 35.8 22.3 24.0 28.4 43.1 56.5 55.8 26.8 49.3 34.0 36.4Q.II 41.8 55.5 28.5 35.0 24.3 25.2 29.6 43.0 58.7 58.0 27.3 50.4 34.9 37.3Q.III 39.0 50.0 28.6 35.5 25.5 24.7 29.7 44.2 51.0 50.4 26.8 49.5 35.8 38.4Q.IV 39.0 48.8 30.1 39.5 26.9 25.5 31.6 45.6 51.0 50.3 28.5 52.5 36.2 43.3
2009/10Q.I 40.3 49.3 32.3 44.5 29.2 26.8 33.5 46.4 59.9 59.1 30.7 56.5 39.4 47.6Q.II 41.0 49.6 33.6 44.8 30.9 27.5 35.4 48.6 65.9 65.1 29.5 54.3 40.6 49.3Q.III 40.8 48.4 34.5 47.7 32.0 27.7 37.9 52.1 69.2 68.4 30.7 56.6 41.6 49.8Q.IV 42.1 49.9 35.5 47.5 33.7 28.3 38.6 54.3 71.7 70.9 32.0 59.0 42.7 50.1
2010/11Q.I 42.2 49.9 35.8 49.1 35.3 27.4 38.9 52.9 71.2 70.4 34.1 62.8 43.2 51.1Q.II 42.9 48.9 38.3 50.1 38.9 28.4 40.7 56.2 77.0 76.1 37.8 69.6 45.0 58.1Q.III 44.7 50.5 40.6 50.0 41.9 29.9 43.0 56.9 84.6 83.6 38.4 70.9 46.5 60.1Q.IV 50.4 58.5 44.0 55.0 47.0 31.6 45.8 60.3 98.3 97.2 41.6 76.7 53.7 63.7
2011/12Q.I 54.7 64.6 46.5 65.1 49.9 33.0 48.8 58.4 98.6 97.4 43.0 79.2 59.2 67.7Q.II 57.5 67.0 49.8 69.5 55.0 34.1 53.3 63.2 94.8 93.7 45.7 84.3 62.2 74.5Q.III 60.2 69.8 52.8 70.8 59.3 34.9 57.4 69.0 95.9 94.7 47.3 84.0 69.3 79.0Q.IV 63.9 76.2 54.6 72.2 63.0 35.7 60.0 66.7 98.5 94.7 47.8 84.0 71.8 82.2
2012/13Q.I 68.1 81.0 58.4 73.8 66.1 40.0 63.1 70.6 99.2 94.7 50.6 84.0 78.8 83.3Q.II 68.6 78.9 60.8 75.6 69.3 41.9 63.3 70.2 99.1 94.7 64.3 84.0 85.3 83.9Q.III 68.6 77.9 61.5 81.2 72.2 41.9 62.3 68.5 99.1 94.7 64.2 84.0 86.0 86.3Q.IV 72.1 81.9 64.6 83.1 76.3 44.8 70.5 73.5 94.5 94.7 65.9 84.0 86.7 87.6
2013/14Q.I 76.0 89.7 65.6 86.0 78.5 44.9 70.8 71.3 90.7 94.7 67.8 84.0 90.8 90.8Q.II 75.4 86.9 66.6 87.0 80.7 45.2 72.2 74.0 101.4 94.7 66.6 84.0 90.1 90.8Q.III 74.6 82.0 69.0 86.7 82.5 48.9 76.2 78.0 100.5 94.7 67.4 84.0 91.5 89.9Q.IV 74.9 84.4 67.7 91.7 83.0 46.0 72.8 81.3 103.4 94.7 66.2 86.8 92.9 86.9
2014/15Q.I 76.5 85.9 69.3 95.9 84.9 50.7 72.5 80.2 104.7 94.7 66.2 89.1 82.1 91.2Q.II 79.9 86.5 74.9 98.0 86.8 58.9 74.3 86.5 105.8 94.7 68.1 90.3 91.7 94.2Q.III 78.3 83.8 74.1 99.6 88.8 55.1 76.8 94.5 104.7 94.7 69.2 91.8 92.6 94.3Q.IV 80.6 85.1 77.2 98.1 88.4 61.5 80.1 86.3 102.3 94.7 70.3 93.4 93.4 95.5
2015/16Q.I 83.6 92.0 77.2 93.8 92.5 60.5 78.6 84.9 102.3 97.5 71.5 94.5 94.2 97.8Q.II 86.9 96.4 78.0 98.8 93.3 60.9 79.4 89.0 101.9 98.9 74.2 95.9 95.0 96.3QIII 89.7 96.4 84.6 102.6 94.0 74.8 81.8 87.6 101.3 100.9 76.9 97.1 95.0 95.4QIV 94.8 98.9 91.7 99.1 95.6 90.4 81.3 100.3 101.4 100.1 76.0 98.5 94.9 98.1
2016/17QI 97.5 105.3 91.6 100.1 98.5 89.4 82.6 98.2 100.4 100.0 77.3 99.5 92.7 97.6QII 100.1 103.3 97.7 98.9 99.3 99.8 90.3 101.4 99.7 100.1 91.3 100.0 93.8 98.9QIII 100.2 101.1 99.4 103.4 97.7 102.7 97.2 101.6 102.0 100.0 95.8 100.0 93.5 101.1QIV 102.5 104.8 100.5 94.6 92.8 103.1 102.5 106.5 102.8 100.0 84.0 83.3 99.8 105.1
2017/18QI 110.9 111.5 110.3 103.7 100.6 119.1 101.0 107.8 106.1 100.0 83.3 61.6 115.6 104.3QII 110.6 115.0 106.9 108.0 101.7 103.8 104.3 106.6 108.9 100.0 82.2 87.6 119.7 107.4QIII 113.8 119.2 109.2 104.9 105.5 107.6 111.5 105.8 109.6 100.0 82.8 86.9 119.5 108.3QIV 120.6 126.2 115.8 111.7 114.7 113.7 117.3 111.8 113.2 100.0 87.1 120.9 126.8 116.7
2018/19QI 127.8 135.7 121.1 122.0 115.0 122.3 120.5 132.8 112.9 100.0 87.6 73.4 132.1 119.2QII 134.4 144.7 125.6 119.9 120.7 127.5 126.3 130.1 110.7 100.0 92.6 117.2 139.9 120.2QIII 137.4 145.5 130.5 122.3 127.8 131.3 128.1 137.5 115.3 100.0 96.2 132.1 149.4 123.7QIV 146.4 155.9 138.3 132.3 130.3 147.1 132.2 131.9 110.0 100.0 96.6 115.4 154.9 131.0
2019/20QI 157.7 171.6 145.9 143.5 138.1 152.9 137.7 132.1 106.6 100.0 103.5 103.6 172.5 136.8QII 164.1 175.1 154.8 145.6 150.5 165.6 145.3 155.2 120.3 100.0 117.1 133.0 172.9 145.4QIII 170.3 181.4 160.9 166.0 149.8 175.8 152.2 161.6 115.6 100.0 117.1 127.2 174.3 156.1QIV 186.3 205.5 170.2 194.2 156.7 182.7 156.0 169.4 137.0 100.0 121.5 119.9 189.7 158.5
2020/21QI 200.4 228.2 176.8 200.5 152.7 186.7 156.9 169.7 141.0 100.0 122.5 127.8 212.5 167.9QII 213.8 239.2 192.3 264.6 179.3 194.6 154.0 168.3 116.2 100.0 122.7 160.6 248.4 183.2QIII 213.8 239.2 192.3 264.6 179.3 194.6 154.0 168.3 116.2 100.0 122.7 160.6 248.4 183.2QIV 213.8 239.2 192.3 264.6 179.3 194.6 154.0 168.3 116.2 100.0 122.7 160.6 248.4 183.2
Source: Central Statistical Agency

Fourth Quarter 2020/21 | 129
National Bank of Ethiopia Quarterly Bulletin
Table 22 (F1): Regional States' Consumer Price Index (Food)December 100 = 2016
Perio
d
Food
& N
on-
alco
holic
Be
vera
ges
Brea
d &
C
erea
ls
Mea
t
Fish
& S
ea
Food
Milk
, Che
ese
& E
gg
Oils
& F
ats
Fru
its
Veg
etab
les
Suga
r, ja
m,
hone
y,
choc
olat
e an
d
conf
ectio
nery
(N
D)
Food
pro
duc
ts
Non
-Alc
ohol
ic
Beve
rage
s
AFAR2007/08
Q.I 24.7 25.3 16.0 23.2 37.8 23.5 23.5 30.3 64.5 25.0Q.II 25.6 26.0 16.7 24.0 41.6 25.4 25.4 28.8 62.8 25.2Q.III 26.8 27.7 17.6 23.5 46.0 30.8 30.8 29.8 59.2 26.5Q.IV 32.4 38.6 19.6 28.7 52.4 31.5 31.5 33.9 67.4 29.1
2008/09Q.I 40.9 53.0 21.7 32.6 53.5 40.0 40.0 37.8 76.4 34.0Q.II 39.7 51.4 20.7 31.4 50.3 38.3 38.3 40.2 58.2 34.8Q.III 38.3 48.8 20.8 32.3 50.8 38.7 38.7 46.9 41.0 34.4Q.IV 39.7 50.3 25.7 31.6 49.6 46.1 46.2 52.7 29.6 39.9
2009/10Q.I 41.7 52.6 24.1 35.6 49.0 43.9 43.9 57.3 30.4 41.4Q.II 43.7 53.1 24.4 41.6 48.3 40.8 40.8 59.6 37.2 43.3Q.III 43.6 52.0 26.7 40.8 50.0 38.2 38.2 63.7 38.1 47.8Q.IV 43.9 50.9 28.1 40.8 54.4 44.1 44.2 65.4 53.6 47.5
2010/11Q.I 44.8 52.0 30.9 41.0 54.9 51.8 51.8 62.2 57.1 46.8Q.II 47.1 50.6 33.0 42.8 63.8 53.3 53.3 65.3 48.9 55.4Q.III 50.6 54.3 32.6 49.1 68.7 52.8 52.8 60.6 46.7 69.6Q.IV 54.4 62.6 36.3 44.8 70.5 57.3 57.3 63.5 76.2 74.5
2011/12Q.I 58.6 67.8 41.4 45.7 67.3 58.2 58.2 68.1 93.6 76.0Q.II 64.5 74.8 41.1 55.8 67.5 55.4 55.5 74.6 91.3 85.0Q.III 71.1 78.1 44.9 57.4 67.5 57.1 64.1 74.5 84.7 99.8Q.IV 75.6 81.4 56.7 61.4 68.6 56.9 76.6 80.0 95.2 93.5
2012/13Q.I 79.7 85.6 64.7 69.6 69.0 60.6 79.2 84.3 86.1 95.9Q.II 79.7 86.3 62.4 75.2 68.5 61.9 71.1 80.6 82.0 92.0Q.III 77.0 83.0 66.9 74.5 68.2 65.2 59.4 83.9 85.0 86.6Q.IV 78.4 85.2 75.9 74.8 71.1 72.4 66.1 85.4 72.9 83.7
2013/14Q.I 84.4 91.9 75.3 78.6 70.3 71.8 87.9 86.3 74.3 81.5Q.II 84.3 96.1 73.5 81.7 70.4 73.3 64.6 86.0 80.3 83.4Q.III 82.9 91.5 76.5 80.4 71.4 77.0 66.5 86.3 78.3 87.8Q.IV 85.8 90.5 79.7 81.2 75.7 78.1 76.0 84.4 96.6 97.4
2014/15Q.I 87.7 90.5 78.9 79.5 80.5 85.5 76.1 94.8 124.9 100.4Q.II 87.3 88.9 81.4 79.0 74.7 83.9 81.3 105.9 111.2 104.2Q.III 87.6 89.5 82.9 80.3 82.1 86.2 80.1 102.4 108.8 99.3Q.IV 94.0 88.0 83.6 87.2 92.1 88.6 87.6 95.9 185.9 98.8
2015/16Q.I 103.7 92.3 86.8 87.9 99.4 98.2 103.6 86.7 296.9 97.7Q.II 101.8 94.6 80.8 88.4 92.4 96.9 110.3 81.2 244.1 96.2Q.III 99.6 98.7 85.5 93.8 86.4 102.5 104.2 84.9 159.5 96.6Q.IV 101.6 95.6 96.3 101.0 88.9 100.9 118.8 86.3 142.8 96.3
2016/17QI 104.0 99.0 97.9 97.1 93.4 100.7 135.7 85.1 137.8 97.7QII 103.8 101.3 98.7 100.0 106.6 95.7 100.5 110.3 92.8 115.4 102.4QIII 102.3 100.4 99.6 102.6 102.5 103.3 101.6 105.5 100.8 112.0 103.0QIV 105.2 102.1 101.8 103.3 100.9 114.9 100.6 114.0 102.3 136.6 102.3
2017/18QI 109.8 111.3 103.7 109.6 101.4 115.8 102.8 120.5 102.9 137.9 104.6QII 115.8 119.6 118.4 116.3 103.4 107.1 105.8 126.4 115.2 139.3 112.7QIII 117.0 120.5 127.9 137.4 104.5 113.5 109.2 117.8 125.4 141.4 112.9QIV 116.2 121.3 139.0 157.3 105.5 98.1 113.8 116.3 97.3 141.0 116.5
2018/19QI 124.2 134.6 140.1 156.7 105.7 105.7 123.1 148.0 81.3 129.2 119.2QII 124.3 135.6 156.3 160.9 111.7 103.0 119.1 138.5 81.1 101.5 116.5QIII 126.1 138.6 163.2 163.4 114.0 101.6 116.4 137.8 92.0 92.5 112.5QIV 136.2 150.3 176.2 165.3 119.5 90.2 120.6 165.4 103.7 95.2 118.7
2019/20QI 151.7 167.5 192.0 171.2 121.3 164.1 128.5 188.5 117.4 101.4 123.6QII 159.8 179.7 197.0 183.7 129.1 168.3 128.4 199.1 113.3 100.3 127.6QIII 158.7 180.3 210.5 178.2 121.2 161.1 138.1 189.9 115.7 100.2 137.1QIV 174.6 200.4 209.9 188.5 127.9 172.6 140.5 214.7 144.4 140.6 146.7
2020/21QI 179.9 188.1 210.0 195.2 136.9 172.5 141.2 266.7 145.7 182.4 146.9QII 187.5 202.7 202.2 196.1 160.7 213.7 144.5 224.0 135.3 183.0 155.6QIII 195.6 216.0 205.3 206.9 180.8 203.4 145.4 205.4 137.6 200.7 160.4QIV 224.9 243.8 222.3 213.2 231.3 256.6 161.5 212.4 147.2 245.9 171.7
Source: Central Statistical Agency
Table 22 (E10): Regional States' Consumer Price Indices (Non-Food)December 2016 = 100
Perio
d
Gen
eral
In
dex
Food
&
Non
-alc
o-ho
lic In
dex
Non
-Foo
d In
dex
Alc
ohol
ic
beve
rage
s &
Toba
cco
Clo
thin
g &
Foot
-wea
r
Hous
-in
g,W
a-te
r,Ele
c-tri
city
,Gas
an
d O
ther
Fu
els
Furn
ishin
gs,
Hous
ehol
d Eq
uipm
ent
and
Rou-
tine
Mai
n-te
nanc
e of
th
e Ho
use
Heal
th
Tran
spor
t
Com
mun
i-ca
tion
Recr
eatio
n an
d C
ultu
re
Educ
atio
n
Rest
aura
nts
and
Hote
ls
Misc
el-
lane
ous
Goo
ds
TIGRAY2007/08
Q.I 25.7 30.5 21.7 24.2 17.6 19.2 21.3 44.4 51.1 50.5 24.7 45.5 24.4 32.5Q.II 27.1 32.7 22.4 23.4 17.9 20.4 22.6 42.8 49.8 49.3 25.3 46.7 26.6 31.9Q.III 28.7 35.3 22.8 25.4 18.1 20.4 23.9 42.5 54.4 53.8 25.3 46.7 27.8 33.2Q.IV 34.0 43.9 24.7 28.9 19.9 21.8 26.7 43.3 56.4 55.8 26.0 47.9 30.2 34.5
2008/09Q.I 42.9 58.9 27.1 35.8 22.3 24.0 28.4 43.1 56.5 55.8 26.8 49.3 34.0 36.4Q.II 41.8 55.5 28.5 35.0 24.3 25.2 29.6 43.0 58.7 58.0 27.3 50.4 34.9 37.3Q.III 39.0 50.0 28.6 35.5 25.5 24.7 29.7 44.2 51.0 50.4 26.8 49.5 35.8 38.4Q.IV 39.0 48.8 30.1 39.5 26.9 25.5 31.6 45.6 51.0 50.3 28.5 52.5 36.2 43.3
2009/10Q.I 40.3 49.3 32.3 44.5 29.2 26.8 33.5 46.4 59.9 59.1 30.7 56.5 39.4 47.6Q.II 41.0 49.6 33.6 44.8 30.9 27.5 35.4 48.6 65.9 65.1 29.5 54.3 40.6 49.3Q.III 40.8 48.4 34.5 47.7 32.0 27.7 37.9 52.1 69.2 68.4 30.7 56.6 41.6 49.8Q.IV 42.1 49.9 35.5 47.5 33.7 28.3 38.6 54.3 71.7 70.9 32.0 59.0 42.7 50.1
2010/11Q.I 42.2 49.9 35.8 49.1 35.3 27.4 38.9 52.9 71.2 70.4 34.1 62.8 43.2 51.1Q.II 42.9 48.9 38.3 50.1 38.9 28.4 40.7 56.2 77.0 76.1 37.8 69.6 45.0 58.1Q.III 44.7 50.5 40.6 50.0 41.9 29.9 43.0 56.9 84.6 83.6 38.4 70.9 46.5 60.1Q.IV 50.4 58.5 44.0 55.0 47.0 31.6 45.8 60.3 98.3 97.2 41.6 76.7 53.7 63.7
2011/12Q.I 54.7 64.6 46.5 65.1 49.9 33.0 48.8 58.4 98.6 97.4 43.0 79.2 59.2 67.7Q.II 57.5 67.0 49.8 69.5 55.0 34.1 53.3 63.2 94.8 93.7 45.7 84.3 62.2 74.5Q.III 60.2 69.8 52.8 70.8 59.3 34.9 57.4 69.0 95.9 94.7 47.3 84.0 69.3 79.0Q.IV 63.9 76.2 54.6 72.2 63.0 35.7 60.0 66.7 98.5 94.7 47.8 84.0 71.8 82.2
2012/13Q.I 68.1 81.0 58.4 73.8 66.1 40.0 63.1 70.6 99.2 94.7 50.6 84.0 78.8 83.3Q.II 68.6 78.9 60.8 75.6 69.3 41.9 63.3 70.2 99.1 94.7 64.3 84.0 85.3 83.9Q.III 68.6 77.9 61.5 81.2 72.2 41.9 62.3 68.5 99.1 94.7 64.2 84.0 86.0 86.3Q.IV 72.1 81.9 64.6 83.1 76.3 44.8 70.5 73.5 94.5 94.7 65.9 84.0 86.7 87.6
2013/14Q.I 76.0 89.7 65.6 86.0 78.5 44.9 70.8 71.3 90.7 94.7 67.8 84.0 90.8 90.8Q.II 75.4 86.9 66.6 87.0 80.7 45.2 72.2 74.0 101.4 94.7 66.6 84.0 90.1 90.8Q.III 74.6 82.0 69.0 86.7 82.5 48.9 76.2 78.0 100.5 94.7 67.4 84.0 91.5 89.9Q.IV 74.9 84.4 67.7 91.7 83.0 46.0 72.8 81.3 103.4 94.7 66.2 86.8 92.9 86.9
2014/15Q.I 76.5 85.9 69.3 95.9 84.9 50.7 72.5 80.2 104.7 94.7 66.2 89.1 82.1 91.2Q.II 79.9 86.5 74.9 98.0 86.8 58.9 74.3 86.5 105.8 94.7 68.1 90.3 91.7 94.2Q.III 78.3 83.8 74.1 99.6 88.8 55.1 76.8 94.5 104.7 94.7 69.2 91.8 92.6 94.3Q.IV 80.6 85.1 77.2 98.1 88.4 61.5 80.1 86.3 102.3 94.7 70.3 93.4 93.4 95.5
2015/16Q.I 83.6 92.0 77.2 93.8 92.5 60.5 78.6 84.9 102.3 97.5 71.5 94.5 94.2 97.8Q.II 86.9 96.4 78.0 98.8 93.3 60.9 79.4 89.0 101.9 98.9 74.2 95.9 95.0 96.3QIII 89.7 96.4 84.6 102.6 94.0 74.8 81.8 87.6 101.3 100.9 76.9 97.1 95.0 95.4QIV 94.8 98.9 91.7 99.1 95.6 90.4 81.3 100.3 101.4 100.1 76.0 98.5 94.9 98.1
2016/17QI 97.5 105.3 91.6 100.1 98.5 89.4 82.6 98.2 100.4 100.0 77.3 99.5 92.7 97.6QII 100.1 103.3 97.7 98.9 99.3 99.8 90.3 101.4 99.7 100.1 91.3 100.0 93.8 98.9QIII 100.2 101.1 99.4 103.4 97.7 102.7 97.2 101.6 102.0 100.0 95.8 100.0 93.5 101.1QIV 102.5 104.8 100.5 94.6 92.8 103.1 102.5 106.5 102.8 100.0 84.0 83.3 99.8 105.1
2017/18QI 110.9 111.5 110.3 103.7 100.6 119.1 101.0 107.8 106.1 100.0 83.3 61.6 115.6 104.3QII 110.6 115.0 106.9 108.0 101.7 103.8 104.3 106.6 108.9 100.0 82.2 87.6 119.7 107.4QIII 113.8 119.2 109.2 104.9 105.5 107.6 111.5 105.8 109.6 100.0 82.8 86.9 119.5 108.3QIV 120.6 126.2 115.8 111.7 114.7 113.7 117.3 111.8 113.2 100.0 87.1 120.9 126.8 116.7
2018/19QI 127.8 135.7 121.1 122.0 115.0 122.3 120.5 132.8 112.9 100.0 87.6 73.4 132.1 119.2QII 134.4 144.7 125.6 119.9 120.7 127.5 126.3 130.1 110.7 100.0 92.6 117.2 139.9 120.2QIII 137.4 145.5 130.5 122.3 127.8 131.3 128.1 137.5 115.3 100.0 96.2 132.1 149.4 123.7QIV 146.4 155.9 138.3 132.3 130.3 147.1 132.2 131.9 110.0 100.0 96.6 115.4 154.9 131.0
2019/20QI 157.7 171.6 145.9 143.5 138.1 152.9 137.7 132.1 106.6 100.0 103.5 103.6 172.5 136.8QII 164.1 175.1 154.8 145.6 150.5 165.6 145.3 155.2 120.3 100.0 117.1 133.0 172.9 145.4QIII 170.3 181.4 160.9 166.0 149.8 175.8 152.2 161.6 115.6 100.0 117.1 127.2 174.3 156.1QIV 186.3 205.5 170.2 194.2 156.7 182.7 156.0 169.4 137.0 100.0 121.5 119.9 189.7 158.5
2020/21QI 200.4 228.2 176.8 200.5 152.7 186.7 156.9 169.7 141.0 100.0 122.5 127.8 212.5 167.9QII 213.8 239.2 192.3 264.6 179.3 194.6 154.0 168.3 116.2 100.0 122.7 160.6 248.4 183.2QIII 213.8 239.2 192.3 264.6 179.3 194.6 154.0 168.3 116.2 100.0 122.7 160.6 248.4 183.2QIV 213.8 239.2 192.3 264.6 179.3 194.6 154.0 168.3 116.2 100.0 122.7 160.6 248.4 183.2
Source: Central Statistical Agency

130 | Fourth Quarter 2020/21
National Bank of Ethiopia Quarterly Bulletin
Table 22 (F2): Regional States' Consumer Price Index (Food)December 2016 = 100
Perio
d
Food
&
Non
-alc
ohol
-ic
Bev
erag
es
Brea
d an
d C
erea
ls
Mea
t
Fish
and
Sea
fo
od
Milk
, Che
ese
& Eg
g
Oils
& F
ats
Fru
its
Vege
tabl
es
Suga
r, ja
m,
hone
y, c
hoc-
olat
e an
d co
nfec
tione
ry
(ND)
Food
pro
d-uc
ts
Non
-Alc
ohol
-ic
Bev
erag
es
AMHARA2007/08
Q.I 28.7 30.4 20.9 20.6 29.9 17.4 28.6 36.6 36.6 23.4Q.II 30.5 32.7 22.2 21.4 33.2 20.0 32.8 35.2 37.0 27.6Q.III 31.7 34.7 23.5 21.6 36.5 21.7 35.6 38.7 34.2 30.4Q.IV 38.6 44.4 24.6 24.3 41.5 22.9 37.5 45.6 41.0 30.8
2008/09Q.I 50.7 62.3 26.2 29.8 41.4 26.9 44.2 57.1 46.3 30.6Q.II 48.2 61.5 27.3 30.4 40.2 25.0 41.0 63.4 36.6 31.7Q.III 43.1 56.9 28.0 31.7 38.9 28.8 47.3 74.1 23.5 31.4Q.IV 42.3 56.2 30.3 33.3 39.5 32.5 53.4 75.6 18.0 31.8
2009/10Q.I 43.8 57.6 29.9 34.8 39.1 31.1 51.1 76.2 20.1 34.3Q.II 42.9 56.3 30.9 36.1 36.8 29.2 47.9 77.9 22.4 42.2Q.III 42.2 53.4 32.7 36.7 37.5 31.4 51.6 78.5 24.7 45.0Q.IV 42.8 53.1 33.5 37.2 34.3 32.1 52.8 80.3 32.8 44.4
2010/11Q.I 43.6 52.5 33.9 37.8 42.8 35.5 58.2 79.3 37.3 45.3Q.II 44.8 51.5 34.5 41.2 51.3 40.2 66.0 80.6 35.9 50.9Q.III 47.0 53.2 32.4 42.1 55.7 42.8 70.2 78.0 36.9 67.4Q.IV 56.6 59.4 37.3 44.8 76.4 43.2 70.9 81.3 52.8 87.5
2011/12Q.I 63.0 65.1 45.2 47.3 78.8 42.4 69.5 80.5 61.9 90.2Q.II 66.7 70.6 49.9 50.1 72.9 44.0 72.2 81.6 62.6 95.6Q.III 68.6 74.9 54.8 53.1 71.8 49.7 80.5 82.0 50.4 99.1Q.IV 74.4 82.0 64.6 56.0 76.4 50.7 83.9 82.3 57.9 93.0
2012/13Q.I 79.1 87.7 70.1 57.5 76.1 53.3 87.0 81.8 66.4 87.7Q.II 78.5 88.4 70.6 66.5 74.3 63.0 81.8 81.7 67.8 84.5Q.III 78.1 87.2 72.0 70.1 74.0 64.6 80.3 81.6 68.3 81.3Q.IV 80.3 90.6 73.1 72.3 77.9 64.3 80.2 81.6 72.9 79.5
2013/14Q.I 83.6 96.6 75.2 73.0 77.6 67.3 83.8 81.5 75.0 79.6Q.II 83.0 98.4 75.0 74.5 77.2 70.9 79.0 81.5 74.1 80.7Q.III 81.5 88.3 76.4 74.9 77.0 70.7 86.0 82.1 73.4 80.5Q.IV 82.7 90.2 76.5 75.9 80.2 71.2 82.4 82.5 76.8 88.3
2014/15Q.I 83.8 93.9 77.9 78.6 84.6 74.7 80.9 81.8 74.6 95.7Q.II 84.0 92.2 77.4 79.0 86.2 71.1 84.2 82.0 73.5 99.3Q.III 84.7 88.9 79.8 82.1 93.4 76.7 88.5 82.5 73.1 99.6Q.IV 86.3 91.5 82.6 89.9 100.7 79.0 86.9 82.3 75.2 94.8
2015/16Q.I 91.5 96.3 84.7 88.7 107.6 84.6 99.5 82.3 77.6 92.5Q.II 92.7 99.0 85.7 88.9 104.3 89.1 101.6 82.2 77.9 89.6Q.III 93.0 99.6 87.4 94.0 98.0 92.5 100.7 95.8 79.2 88.2Q.IV 95.1 99.4 92.6 96.7 101.9 90.5 105.5 102.1 80.2 87.0
2016/17QI 101.3 104.5 98.7 100.3 100.6 99.0 111.2 98.9 91.2 92.0QII 102.3 102.3 99.6 100.6 98.9 98.5 102.6 97.0 105.6 99.5QIII 105.4 101.2 102.1 98.9 103.3 104.5 100.3 104.8 102.7 114.6 100.2QIV 110.1 108.2 108.9 100.4 112.1 103.0 107.6 102.0 102.6 125.6 98.8
2017/18QI 118.2 128.1 116.5 101.1 118.5 103.0 128.7 104.0 102.8 128.8 101.7QII 119.9 125.0 116.0 104.2 127.8 103.8 128.4 113.5 101.9 129.6 105.5QIII 122.0 133.3 132.0 72.2 128.4 106.1 134.9 103.2 102.7 130.1 106.0QIV 127.7 143.0 140.4 0.0 136.5 107.7 139.7 109.9 103.4 131.3 107.2
2018/19QI 133.9 150.4 145.6 0.0 139.5 107.9 135.1 129.0 103.3 128.4 109.2QII 132.9 149.6 144.4 0.0 143.8 143.8 107.0 135.7 121.2 103.9 132.6QIII 136.6 153.6 148.7 0.0 143.6 107.8 142.8 128.4 103.7 135.1 108.4QIV 149.3 169.1 170.1 0.0 152.7 111.3 155.2 144.0 115.3 144.6 108.8
2019/20 QI 161.4 190.2 178.9 0.0 164.5 115.1 179.7 159.9 120.5 149.0 110.4QII 161.0 199.0 179.9 0.0 166.1 115.2 187.3 142.1 120.8 151.5 110.3QIII 174.2 199.3 184.9 0.0 170.9 123.7 191.0 151.4 120.3 191.3 119.6QIV 187.5 213.7 194.7 0.0 181.3 136.8 188.7 158.9 121.2 210.7 133.3
2020/21QI 200.0 238.1 194.3 0.0 187.6 142.7 188.0 181.9 119.5 208.1 143.3QII 197.9 245.6 202.5 0.0 192.4 150.7 197.8 159.9 139.0 200.8 150.2QIII 199.2 252.1 204.8 0.0 198.3 165.8 211.8 157.3 151.8 192.2 158.8QIV 213.9 275.0 234.5 0.0 214.5 208.7 217.6 157.3 153.3 200.7 164.2
Source: Central Statistical Agency

Fourth Quarter 2020/21 | 131
National Bank of Ethiopia Quarterly Bulletin
Table 22 (F2): Regional States' Consumer Price Index (Food)December 2016 = 100
Perio
d
Food
&
Non
-alc
ohol
-ic
Bev
erag
es
Brea
d an
d C
erea
ls
Mea
t
Fish
and
Sea
fo
od
Milk
, Che
ese
& Eg
g
Oils
& F
ats
Fru
its
Vege
tabl
es
Suga
r, ja
m,
hone
y, c
hoc-
olat
e an
d co
nfec
tione
ry
(ND)
Food
pro
d-uc
ts
Non
-Alc
ohol
-ic
Bev
erag
es
AMHARA2007/08
Q.I 28.7 30.4 20.9 20.6 29.9 17.4 28.6 36.6 36.6 23.4Q.II 30.5 32.7 22.2 21.4 33.2 20.0 32.8 35.2 37.0 27.6Q.III 31.7 34.7 23.5 21.6 36.5 21.7 35.6 38.7 34.2 30.4Q.IV 38.6 44.4 24.6 24.3 41.5 22.9 37.5 45.6 41.0 30.8
2008/09Q.I 50.7 62.3 26.2 29.8 41.4 26.9 44.2 57.1 46.3 30.6Q.II 48.2 61.5 27.3 30.4 40.2 25.0 41.0 63.4 36.6 31.7Q.III 43.1 56.9 28.0 31.7 38.9 28.8 47.3 74.1 23.5 31.4Q.IV 42.3 56.2 30.3 33.3 39.5 32.5 53.4 75.6 18.0 31.8
2009/10Q.I 43.8 57.6 29.9 34.8 39.1 31.1 51.1 76.2 20.1 34.3Q.II 42.9 56.3 30.9 36.1 36.8 29.2 47.9 77.9 22.4 42.2Q.III 42.2 53.4 32.7 36.7 37.5 31.4 51.6 78.5 24.7 45.0Q.IV 42.8 53.1 33.5 37.2 34.3 32.1 52.8 80.3 32.8 44.4
2010/11Q.I 43.6 52.5 33.9 37.8 42.8 35.5 58.2 79.3 37.3 45.3Q.II 44.8 51.5 34.5 41.2 51.3 40.2 66.0 80.6 35.9 50.9Q.III 47.0 53.2 32.4 42.1 55.7 42.8 70.2 78.0 36.9 67.4Q.IV 56.6 59.4 37.3 44.8 76.4 43.2 70.9 81.3 52.8 87.5
2011/12Q.I 63.0 65.1 45.2 47.3 78.8 42.4 69.5 80.5 61.9 90.2Q.II 66.7 70.6 49.9 50.1 72.9 44.0 72.2 81.6 62.6 95.6Q.III 68.6 74.9 54.8 53.1 71.8 49.7 80.5 82.0 50.4 99.1Q.IV 74.4 82.0 64.6 56.0 76.4 50.7 83.9 82.3 57.9 93.0
2012/13Q.I 79.1 87.7 70.1 57.5 76.1 53.3 87.0 81.8 66.4 87.7Q.II 78.5 88.4 70.6 66.5 74.3 63.0 81.8 81.7 67.8 84.5Q.III 78.1 87.2 72.0 70.1 74.0 64.6 80.3 81.6 68.3 81.3Q.IV 80.3 90.6 73.1 72.3 77.9 64.3 80.2 81.6 72.9 79.5
2013/14Q.I 83.6 96.6 75.2 73.0 77.6 67.3 83.8 81.5 75.0 79.6Q.II 83.0 98.4 75.0 74.5 77.2 70.9 79.0 81.5 74.1 80.7Q.III 81.5 88.3 76.4 74.9 77.0 70.7 86.0 82.1 73.4 80.5Q.IV 82.7 90.2 76.5 75.9 80.2 71.2 82.4 82.5 76.8 88.3
2014/15Q.I 83.8 93.9 77.9 78.6 84.6 74.7 80.9 81.8 74.6 95.7Q.II 84.0 92.2 77.4 79.0 86.2 71.1 84.2 82.0 73.5 99.3Q.III 84.7 88.9 79.8 82.1 93.4 76.7 88.5 82.5 73.1 99.6Q.IV 86.3 91.5 82.6 89.9 100.7 79.0 86.9 82.3 75.2 94.8
2015/16Q.I 91.5 96.3 84.7 88.7 107.6 84.6 99.5 82.3 77.6 92.5Q.II 92.7 99.0 85.7 88.9 104.3 89.1 101.6 82.2 77.9 89.6Q.III 93.0 99.6 87.4 94.0 98.0 92.5 100.7 95.8 79.2 88.2Q.IV 95.1 99.4 92.6 96.7 101.9 90.5 105.5 102.1 80.2 87.0
2016/17QI 101.3 104.5 98.7 100.3 100.6 99.0 111.2 98.9 91.2 92.0QII 102.3 102.3 99.6 100.6 98.9 98.5 102.6 97.0 105.6 99.5QIII 105.4 101.2 102.1 98.9 103.3 104.5 100.3 104.8 102.7 114.6 100.2QIV 110.1 108.2 108.9 100.4 112.1 103.0 107.6 102.0 102.6 125.6 98.8
2017/18QI 118.2 128.1 116.5 101.1 118.5 103.0 128.7 104.0 102.8 128.8 101.7QII 119.9 125.0 116.0 104.2 127.8 103.8 128.4 113.5 101.9 129.6 105.5QIII 122.0 133.3 132.0 72.2 128.4 106.1 134.9 103.2 102.7 130.1 106.0QIV 127.7 143.0 140.4 0.0 136.5 107.7 139.7 109.9 103.4 131.3 107.2
2018/19QI 133.9 150.4 145.6 0.0 139.5 107.9 135.1 129.0 103.3 128.4 109.2QII 132.9 149.6 144.4 0.0 143.8 143.8 107.0 135.7 121.2 103.9 132.6QIII 136.6 153.6 148.7 0.0 143.6 107.8 142.8 128.4 103.7 135.1 108.4QIV 149.3 169.1 170.1 0.0 152.7 111.3 155.2 144.0 115.3 144.6 108.8
2019/20 QI 161.4 190.2 178.9 0.0 164.5 115.1 179.7 159.9 120.5 149.0 110.4QII 161.0 199.0 179.9 0.0 166.1 115.2 187.3 142.1 120.8 151.5 110.3QIII 174.2 199.3 184.9 0.0 170.9 123.7 191.0 151.4 120.3 191.3 119.6QIV 187.5 213.7 194.7 0.0 181.3 136.8 188.7 158.9 121.2 210.7 133.3
2020/21QI 200.0 238.1 194.3 0.0 187.6 142.7 188.0 181.9 119.5 208.1 143.3QII 197.9 245.6 202.5 0.0 192.4 150.7 197.8 159.9 139.0 200.8 150.2QIII 199.2 252.1 204.8 0.0 198.3 165.8 211.8 157.3 151.8 192.2 158.8QIV 213.9 275.0 234.5 0.0 214.5 208.7 217.6 157.3 153.3 200.7 164.2
Source: Central Statistical Agency
Table 22 (F3): Regional States' Consumer Price Index (Food)December 2016= 100
Perio
d
Food
&
Non
-alc
ohol
ic
Beve
rage
s
Brea
d an
d C
erea
ls
Mea
t
Fish
and
sea
fo
od
Milk
, Che
ese
& Eg
g
Oils
& F
ats
Fru
its
Vege
tabl
es
Suga
r, ja
m,
hone
y,
choc
olat
e an
d co
nfec
tione
ry
(ND)
Food
pro
duct
s
Non
-Alc
ohol
ic
Beve
rage
s
BENISHANGUL GUMUZ2007/08
Q.I 27.1 34.4 27.4 22.3 29.3 16.5 29.6 38.9 31.3 25.6Q.II 29.9 37.5 26.8 22.6 31.2 16.6 29.7 37.6 39.0 26.0Q.III 33.8 44.1 27.7 23.2 34.8 18.7 33.4 42.6 40.0 27.0Q.IV 39.1 53.4 31.3 25.0 38.8 19.2 34.3 44.6 39.7 28.3
2008/09Q.I 57.2 82.9 37.1 31.7 40.1 24.3 43.5 56.1 47.7 29.5Q.II 51.0 78.6 38.1 33.6 41.9 26.0 46.5 61.2 36.6 28.2Q.III 44.4 70.2 36.9 35.0 40.1 26.1 46.8 69.4 29.4 26.3Q.IV 45.4 71.4 36.6 35.9 44.6 25.4 45.4 72.4 22.6 27.8
2009/10Q.I 49.5 75.8 38.9 39.1 41.8 25.6 45.9 73.0 21.2 33.4Q.II 45.1 68.1 35.2 40.7 40.5 24.6 44.0 75.3 23.0 43.6Q.III 40.8 59.7 34.4 44.8 42.9 24.2 43.3 79.7 29.1 41.3Q.IV 39.5 53.6 37.7 43.3 45.7 25.8 46.2 81.7 39.0 41.0
2010/11Q.I 38.1 51.4 37.9 45.4 43.5 28.7 51.3 79.2 33.2 47.8Q.II 39.2 49.7 42.0 47.4 45.8 28.2 50.6 83.1 35.2 57.8Q.III 44.0 55.4 37.3 48.8 68.8 32.9 58.9 76.0 35.8 71.7Q.IV 60.5 72.3 42.3 51.7 86.9 37.5 67.2 86.8 51.6 100.7
2011/12Q.I 70.9 88.7 50.4 55.6 76.5 35.6 63.8 85.2 55.1 106.9Q.II 76.5 96.0 53.7 61.8 87.3 38.2 68.5 88.5 69.4 106.3Q.III 76.1 92.1 56.1 65.1 90.5 54.1 79.5 90.4 53.0 85.1Q.IV 81.1 98.9 65.2 68.0 90.1 70.7 80.6 95.7 61.8 80.6
2012/13Q.I 84.6 102.1 72.4 69.4 93.7 70.9 86.4 98.9 61.2 80.7Q.II 83.4 103.3 73.0 75.0 98.0 75.0 77.4 99.0 62.4 80.1Q.III 79.9 95.5 76.7 88.5 103.2 74.5 68.9 97.3 62.0 77.9Q.IV 79.6 96.7 73.6 93.8 96.9 70.8 69.5 94.9 61.9 77.1
2013/14Q.I 87.2 118.1 75.6 95.8 95.7 63.0 76.8 94.7 58.8 76.1Q.II 92.7 134.5 77.7 92.7 96.4 73.8 73.8 94.6 62.1 81.2Q.III 85.0 107.3 75.1 91.7 99.3 83.2 75.7 92.1 61.3 85.5Q.IV 85.4 103.0 77.4 96.1 97.3 68.8 77.9 95.8 63.9 94.8
2014/15Q.I 83.9 101.2 77.7 84.0 94.8 57.9 76.3 90.3 62.1 97.3Q.II 84.9 95.5 76.3 88.1 98.8 67.8 82.2 89.0 66.6 102.0Q.III 88.1 97.9 79.9 88.8 99.0 71.7 92.1 92.2 70.1 86.5Q.IV 90.6 92.3 85.5 91.9 104.6 70.5 94.0 89.9 85.4 84.0
2015/16Q.I 99.9 99.3 92.1 92.0 100.4 70.8 104.3 92.3 109.5 84.0Q.II 99.9 99.2 94.0 83.5 97.1 89.0 106.2 94.6 107.8 80.1Q.III 94.6 92.7 96.2 84.7 99.3 87.3 99.8 101.3 94.5 80.3Q.IV 95.9 87.6 99.2 99.6 102.3 83.6 104.8 108.3 98.9 80.1
2016/17QI 100.1 94.1 102.9 102.7 100.3 95.1 113.5 105.5 93.9 89.3QII 100.4 100.7 100.2 100.0 102.6 100.5 94.6 99.4 101.0 101.6 100.2QIII 103.0 100.7 100.8 98.9 103.8 102.3 103.2 107.4 96.1 109.2 97.3QIV 109.5 110.9 106.9 100.4 108.3 101.7 106.6 114.7 93.9 117.9 97.0
2017/18QI 117.8 142.8 119.5 106.7 107.4 106.6 90.1 117.7 109.2 87.4 92.1QII 121.5 148.1 118.9 120.8 106.1 106.9 101.7 116.7 110.6 112.8 95.9QIII 119.9 132.8 122.4 120.8 107.1 109.4 82.6 115.3 111.6 153.6 95.5QIV 121.2 139.7 132.8 120.8 108.8 111.8 115.9 105.5 109.5 148.9 98.8
2018/19QI 129.2 145.6 144.0 119.3 111.7 106.4 109.2 128.3 109.9 132.3 106.8QII 130.2 148.6 144.2 120.8 114.3 110.1 118.9 129.0 111.4 135.2 100.7QIII 132.8 150.3 148.0 120.8 115.4 117.4 168.2 126.9 109.4 154.2 99.3QIV 142.9 152.8 161.0 129.3 117.8 119.6 166.1 156.3 120.6 156.9 100.2
2019/20QI 164.5 186.6 179.5 138.0 120.3 124.8 126.0 194.2 125.8 160.1 101.3QII 166.7 201.4 179.2 135.0 123.1 122.9 129.7 183.9 126.2 161.4 104.1QIII 173.0 204.4 182.3 135.0 123.6 129.3 132.6 183.3 126.5 207.0 115.3QIV 190.9 216.0 187.0 149.5 127.3 144.7 161.1 208.5 123.0 271.6 127.6
2020/21QI 222.6 251.8 204.9 152.3 130.8 150.9 143.8 259.4 128.9 347.7 135.7QII 220.5 261.9 220.9 143.8 122.0 167.3 143.0 220.1 150.5 335.3 153.8QIII 217.6 248.2 213.4 155.3 113.6 174.3 203.4 214.4 160.3 367.4 153.1QIV 233.9 261.6 251.3 166.8 122.3 203.1 227.2 213.5 159.1 446.7 154.4
Source: Central Statistical Agency

132 | Fourth Quarter 2020/21
National Bank of Ethiopia Quarterly Bulletin
Table 22 (F4): Regional States' Consumer Price Index (Food)December 100 = 2016
Perio
d
Food
& N
on-
alco
holic
Be
vera
ges
Brea
d an
d C
erea
ls
Mea
t
Fish
and
sea
fo
od
Milk
, Che
ese
& Eg
g
Oils
& F
ats
Fru
its
Vege
tabl
es
Suga
r, ja
m,
hone
y,
choc
olat
e an
d co
nfec
tione
ry
(ND)
Food
pro
duct
s
Non
-Alc
ohol
ic
Beve
rage
s
DIRE DAWA2007/08
Q.I 28.0 30.3 20.1 17.5 41.3 23.2 20.6 53.0 47.8 23.9Q.II 28.7 30.9 20.5 18.2 48.1 24.4 21.6 53.3 44.1 24.9Q.III 32.3 36.7 21.0 19.8 55.1 37.0 32.8 58.7 44.8 25.9Q.IV 38.5 47.2 23.6 25.0 61.9 42.6 37.8 64.2 55.4 26.9
2008/09Q.I 47.2 62.7 25.5 27.5 65.5 42.0 37.3 67.1 58.6 28.6Q.II 47.4 66.3 25.5 29.9 61.5 38.7 34.3 67.8 46.1 31.0Q.III 46.6 64.4 25.5 30.6 61.5 45.7 40.6 68.9 34.5 32.1Q.IV 46.7 64.2 26.3 32.9 61.2 44.9 39.9 70.0 23.1 31.1
2009/10Q.I 47.5 64.6 28.1 34.3 60.0 46.1 40.9 70.0 24.9 32.4Q.II 46.6 62.8 26.2 36.7 59.3 35.0 31.0 70.2 26.8 36.5Q.III 47.5 62.2 27.5 36.7 61.1 41.2 36.6 70.4 28.7 38.6Q.IV 48.3 60.9 31.0 33.0 63.4 48.0 42.6 70.4 42.9 38.5
2010/11Q.I 48.3 60.5 31.9 33.7 65.5 55.8 49.5 70.4 43.7 34.3Q.II 50.9 61.4 32.3 36.8 77.8 62.5 55.5 71.3 38.2 35.0Q.III 53.5 62.8 28.1 40.4 84.7 67.2 59.7 71.2 36.8 43.8Q.IV 62.4 70.0 31.6 44.0 103.0 66.7 59.2 73.1 62.3 56.6
2011/12Q.I 68.0 74.2 41.1 48.3 103.0 65.9 58.5 72.5 75.9 63.7Q.II 69.6 77.3 44.6 47.8 95.3 61.9 54.9 74.7 68.5 67.8Q.III 71.4 76.8 45.3 55.6 96.0 63.1 62.0 74.9 55.2 73.9Q.IV 75.3 80.1 57.0 59.5 88.2 63.4 70.0 75.5 58.6 83.7
2012/13Q.I 77.8 83.6 66.4 64.9 82.9 69.0 69.6 76.4 63.8 89.8Q.II 77.7 85.1 65.7 65.2 84.8 75.5 63.6 75.6 64.6 92.8Q.III 76.0 84.2 67.0 65.5 88.9 79.0 54.8 75.3 66.4 92.3Q.IV 78.3 84.3 66.8 60.8 89.0 82.6 66.1 77.0 72.2 90.9
2013/14Q.I 84.6 89.6 67.3 65.8 85.3 80.1 82.2 77.8 75.6 95.3Q.II 84.4 94.4 66.6 63.9 88.3 78.4 68.1 79.6 75.7 98.3Q.III 81.4 89.8 66.3 65.4 84.0 82.2 66.0 79.5 75.8 94.6Q.IV 81.6 89.0 68.4 68.7 85.3 83.1 66.7 79.7 76.8 94.5
2014/15Q.I 88.0 93.5 67.6 74.9 113.0 79.3 76.7 79.7 75.2 97.0Q.II 89.7 95.3 72.8 75.2 113.1 86.7 78.3 84.6 75.8 96.7Q.III 89.7 94.1 77.5 75.7 113.2 93.6 81.7 80.0 77.0 92.5Q.IV 90.7 94.7 82.6 87.0 90.1 91.3 88.9 80.0 76.3 91.7
2015/16Q.I 90.4 95.1 89.0 91.9 89.9 94.9 83.7 80.9 76.9 90.4Q.II 91.2 94.5 88.9 85.1 89.9 97.8 91.2 84.6 77.0 89.5Q.III 92.4 98.1 91.6 89.7 89.9 103.3 84.9 89.4 78.1 88.6Q.IV 97.7 98.0 95.5 96.2 90.1 105.0 103.9 100.0 79.0 99.0
2016/17QI 100.8 102.1 100.2 100.3 96.6 107.3 104.4 100.0 79.7 101.3QII 101.5 100.4 101.5 100.0 100.7 100.0 99.8 106.2 99.9 99.7 99.7QIII 101.5 99.8 101.4 101.2 101.9 100.1 106.8 103.9 105.3 103.4 101.6QIV 103.3 101.9 101.9 104.6 102.6 100.3 108.7 106.8 107.7 103.7 102.9
2017/18QI 105.8 105.4 106.3 101.0 111.7 102.5 124.6 103.6 109.2 111.0 109.7QII 111.5 111.4 110.3 125.9 112.1 103.1 128.7 113.4 110.8 114.0 114.0QIII 112.3 112.6 113.1 134.3 115.0 105.2 143.1 113.6 109.1 105.3 115.3QIV 124.2 122.4 129.5 130.8 122.6 108.1 133.8 124.1 94.4 187.4 117.2
2018/19QI 133.8 130.5 135.7 133.3 131.4 109.6 129.5 139.4 95.0 220.2 118.7QII 129.1 136.0 138.2 131.8 131.0 109.0 140.7 117.4 95.0 188.5 109.4QIII 133.8 141.6 140.1 134.6 131.5 110.7 158.2 122.5 95.0 192.9 119.5QIV 150.3 150.5 162.8 150.0 142.4 113.8 162.9 162.9 110.0 198.6 116.4
2019/20QI 162.6 166.7 177.7 155.1 155.9 112.0 157.5 176.1 108.9 215.4 120.6QII 169.9 175.6 178.9 148.1 162.2 115.5 176.9 184.3 110.0 220.9 133.6QIII 167.3 177.1 190.2 154.8 155.7 114.7 192.8 162.5 109.7 236.2 139.4QIV 173.0 179.9 190.2 159.0 155.4 121.4 191.7 173.2 110.8 261.0 145.2
2020/21QI 216.5 202.8 208.1 159.5 168.3 133.6 177.9 267.6 120.0 433.4 152.0QII 204.1 210.4 210.1 160.0 171.3 150.7 190.9 205.5 126.1 367.7 153.7QIII 215.4 224.1 212.3 183.6 178.8 186.4 215.6 192.7 136.1 466.1 149.9QIV 233.7 241.3 236.6 182.0 207.8 185.3 205.8 196.9 135.0 605.4 153.7
Source: Central Statistical Agency

Fourth Quarter 2020/21 | 133
National Bank of Ethiopia Quarterly Bulletin
Table 22 (F4): Regional States' Consumer Price Index (Food)December 100 = 2016
Perio
d
Food
& N
on-
alco
holic
Be
vera
ges
Brea
d an
d C
erea
ls
Mea
t
Fish
and
sea
fo
od
Milk
, Che
ese
& Eg
g
Oils
& F
ats
Fru
its
Vege
tabl
es
Suga
r, ja
m,
hone
y,
choc
olat
e an
d co
nfec
tione
ry
(ND)
Food
pro
duct
s
Non
-Alc
ohol
ic
Beve
rage
s
DIRE DAWA2007/08
Q.I 28.0 30.3 20.1 17.5 41.3 23.2 20.6 53.0 47.8 23.9Q.II 28.7 30.9 20.5 18.2 48.1 24.4 21.6 53.3 44.1 24.9Q.III 32.3 36.7 21.0 19.8 55.1 37.0 32.8 58.7 44.8 25.9Q.IV 38.5 47.2 23.6 25.0 61.9 42.6 37.8 64.2 55.4 26.9
2008/09Q.I 47.2 62.7 25.5 27.5 65.5 42.0 37.3 67.1 58.6 28.6Q.II 47.4 66.3 25.5 29.9 61.5 38.7 34.3 67.8 46.1 31.0Q.III 46.6 64.4 25.5 30.6 61.5 45.7 40.6 68.9 34.5 32.1Q.IV 46.7 64.2 26.3 32.9 61.2 44.9 39.9 70.0 23.1 31.1
2009/10Q.I 47.5 64.6 28.1 34.3 60.0 46.1 40.9 70.0 24.9 32.4Q.II 46.6 62.8 26.2 36.7 59.3 35.0 31.0 70.2 26.8 36.5Q.III 47.5 62.2 27.5 36.7 61.1 41.2 36.6 70.4 28.7 38.6Q.IV 48.3 60.9 31.0 33.0 63.4 48.0 42.6 70.4 42.9 38.5
2010/11Q.I 48.3 60.5 31.9 33.7 65.5 55.8 49.5 70.4 43.7 34.3Q.II 50.9 61.4 32.3 36.8 77.8 62.5 55.5 71.3 38.2 35.0Q.III 53.5 62.8 28.1 40.4 84.7 67.2 59.7 71.2 36.8 43.8Q.IV 62.4 70.0 31.6 44.0 103.0 66.7 59.2 73.1 62.3 56.6
2011/12Q.I 68.0 74.2 41.1 48.3 103.0 65.9 58.5 72.5 75.9 63.7Q.II 69.6 77.3 44.6 47.8 95.3 61.9 54.9 74.7 68.5 67.8Q.III 71.4 76.8 45.3 55.6 96.0 63.1 62.0 74.9 55.2 73.9Q.IV 75.3 80.1 57.0 59.5 88.2 63.4 70.0 75.5 58.6 83.7
2012/13Q.I 77.8 83.6 66.4 64.9 82.9 69.0 69.6 76.4 63.8 89.8Q.II 77.7 85.1 65.7 65.2 84.8 75.5 63.6 75.6 64.6 92.8Q.III 76.0 84.2 67.0 65.5 88.9 79.0 54.8 75.3 66.4 92.3Q.IV 78.3 84.3 66.8 60.8 89.0 82.6 66.1 77.0 72.2 90.9
2013/14Q.I 84.6 89.6 67.3 65.8 85.3 80.1 82.2 77.8 75.6 95.3Q.II 84.4 94.4 66.6 63.9 88.3 78.4 68.1 79.6 75.7 98.3Q.III 81.4 89.8 66.3 65.4 84.0 82.2 66.0 79.5 75.8 94.6Q.IV 81.6 89.0 68.4 68.7 85.3 83.1 66.7 79.7 76.8 94.5
2014/15Q.I 88.0 93.5 67.6 74.9 113.0 79.3 76.7 79.7 75.2 97.0Q.II 89.7 95.3 72.8 75.2 113.1 86.7 78.3 84.6 75.8 96.7Q.III 89.7 94.1 77.5 75.7 113.2 93.6 81.7 80.0 77.0 92.5Q.IV 90.7 94.7 82.6 87.0 90.1 91.3 88.9 80.0 76.3 91.7
2015/16Q.I 90.4 95.1 89.0 91.9 89.9 94.9 83.7 80.9 76.9 90.4Q.II 91.2 94.5 88.9 85.1 89.9 97.8 91.2 84.6 77.0 89.5Q.III 92.4 98.1 91.6 89.7 89.9 103.3 84.9 89.4 78.1 88.6Q.IV 97.7 98.0 95.5 96.2 90.1 105.0 103.9 100.0 79.0 99.0
2016/17QI 100.8 102.1 100.2 100.3 96.6 107.3 104.4 100.0 79.7 101.3QII 101.5 100.4 101.5 100.0 100.7 100.0 99.8 106.2 99.9 99.7 99.7QIII 101.5 99.8 101.4 101.2 101.9 100.1 106.8 103.9 105.3 103.4 101.6QIV 103.3 101.9 101.9 104.6 102.6 100.3 108.7 106.8 107.7 103.7 102.9
2017/18QI 105.8 105.4 106.3 101.0 111.7 102.5 124.6 103.6 109.2 111.0 109.7QII 111.5 111.4 110.3 125.9 112.1 103.1 128.7 113.4 110.8 114.0 114.0QIII 112.3 112.6 113.1 134.3 115.0 105.2 143.1 113.6 109.1 105.3 115.3QIV 124.2 122.4 129.5 130.8 122.6 108.1 133.8 124.1 94.4 187.4 117.2
2018/19QI 133.8 130.5 135.7 133.3 131.4 109.6 129.5 139.4 95.0 220.2 118.7QII 129.1 136.0 138.2 131.8 131.0 109.0 140.7 117.4 95.0 188.5 109.4QIII 133.8 141.6 140.1 134.6 131.5 110.7 158.2 122.5 95.0 192.9 119.5QIV 150.3 150.5 162.8 150.0 142.4 113.8 162.9 162.9 110.0 198.6 116.4
2019/20QI 162.6 166.7 177.7 155.1 155.9 112.0 157.5 176.1 108.9 215.4 120.6QII 169.9 175.6 178.9 148.1 162.2 115.5 176.9 184.3 110.0 220.9 133.6QIII 167.3 177.1 190.2 154.8 155.7 114.7 192.8 162.5 109.7 236.2 139.4QIV 173.0 179.9 190.2 159.0 155.4 121.4 191.7 173.2 110.8 261.0 145.2
2020/21QI 216.5 202.8 208.1 159.5 168.3 133.6 177.9 267.6 120.0 433.4 152.0QII 204.1 210.4 210.1 160.0 171.3 150.7 190.9 205.5 126.1 367.7 153.7QIII 215.4 224.1 212.3 183.6 178.8 186.4 215.6 192.7 136.1 466.1 149.9QIV 233.7 241.3 236.6 182.0 207.8 185.3 205.8 196.9 135.0 605.4 153.7
Source: Central Statistical Agency
Table 22 (F5): Regional States' Consumer Price Index (Food)December 2016 = 100
Perio
d
Food
&
Non
-alc
ohol
ic
Beve
rage
s
Brea
d an
d C
erea
ls
Mea
t
Fish
and
Sea
fo
od
Milk
, Che
ese
& Eg
g
Oils
& F
ats
Fru
its
Vege
tabl
es
Suga
r, ja
m,
hone
y, c
hoc-
olat
e an
d co
nfec
tione
ry
(ND)
Food
pro
duct
s
Non
-Alc
ohol
-ic
Bev
erag
es
GAMBELLA2007/08
Q.I 23.8 28.0 24.2 14.3 142.0 19.7 16.9 24.7 51.7 27.4Q.II 25.1 29.1 24.0 14.4 151.7 21.0 18.0 25.3 60.3 31.5Q.III 26.3 29.6 24.3 14.4 162.5 27.8 23.9 29.2 60.3 32.6Q.IV 31.4 47.6 26.2 13.9 175.2 29.1 25.0 32.8 60.6 33.6
2008/09Q.I 52.7 79.5 26.8 16.6 178.2 37.4 32.2 39.0 61.4 33.8Q.II 46.2 71.8 29.2 23.7 176.3 40.4 34.7 40.7 55.3 32.8Q.III 39.5 63.8 29.8 23.4 178.1 37.8 32.5 42.3 31.0 29.1Q.IV 42.1 67.1 29.1 23.5 173.9 38.6 33.2 43.1 29.8 28.2
2009/10Q.I 45.4 71.3 30.7 24.8 167.7 38.3 32.9 45.4 24.0 35.2Q.II 40.6 65.1 31.1 25.9 173.7 40.3 34.6 46.8 24.7 42.0Q.III 39.2 62.8 31.3 28.1 174.8 39.5 33.9 47.4 27.5 37.7Q.IV 38.4 60.4 35.3 29.4 182.5 41.5 35.6 49.2 40.2 38.6
2010/11Q.I 39.4 57.9 35.5 31.7 184.8 43.0 37.0 47.9 49.9 48.0Q.II 41.6 57.7 35.9 30.5 206.0 49.0 42.1 50.0 51.6 66.5Q.III 43.4 59.5 35.3 31.5 231.1 48.0 41.3 50.1 51.8 83.6Q.IV 52.9 69.2 35.7 32.4 280.0 51.0 43.8 54.6 71.0 99.9
2011/2012Q.I 60.7 78.4 40.0 35.0 295.6 54.3 46.6 61.3 75.9 103.7Q.II 66.3 83.4 49.6 38.5 319.9 65.0 55.8 59.4 78.4 111.9Q.III 71.3 88.5 57.4 45.5 107.9 68.6 68.1 62.3 61.7 96.5Q.IV 76.9 95.2 62.6 48.4 111.8 73.8 79.6 65.8 64.3 89.7
2012/13Q.I 78.8 99.9 64.6 48.4 109.4 82.9 78.4 65.5 73.1 81.8Q.II 75.0 83.3 69.0 47.9 109.8 86.1 75.0 65.3 79.2 79.6Q.III 74.1 77.3 72.8 50.4 109.4 90.7 71.2 64.9 81.1 80.0Q.IV 78.1 87.1 73.9 56.9 109.1 97.9 72.8 65.0 81.5 79.0
2013/14Q.I 81.4 98.2 74.7 58.5 108.9 71.0 75.1 66.3 81.6 76.8Q.II 82.3 99.7 74.9 60.0 109.0 52.1 77.1 67.2 82.2 79.8Q.III 81.7 89.6 78.8 60.3 109.5 75.0 81.8 67.9 82.9 78.0Q.IV 85.9 95.6 80.8 60.3 111.0 96.4 82.6 69.8 82.0 103.7
2014/15Q.I 86.6 104.2 78.9 59.0 109.6 86.9 77.7 66.8 85.4 102.1Q.II 84.0 88.8 80.4 58.8 106.7 93.8 80.5 70.0 85.9 114.7Q.III 87.1 85.7 81.9 74.3 100.8 90.7 98.3 71.7 84.7 105.3Q.IV 88.8 92.3 87.9 74.2 103.0 89.1 92.7 73.0 84.2 87.3
2015/16Q.I 96.8 99.9 96.5 79.6 105.2 98.5 106.2 75.0 89.4 91.5Q.II 93.2 90.5 94.5 82.4 106.1 99.2 105.8 74.2 84.7 85.4QIII 93.1 95.8 93.7 84.2 105.1 99.6 99.1 78.0 86.2 74.4QIV 98.0 102.6 95.5 86.7 109.3 99.7 107.3 91.6 90.9 78.2
2016/17QI 101.1 104.6 97.1 92.2 104.3 99.6 110.4 101.7 99.2 88.8QII 99.5 99.9 100.8 100.0 91.8 98.0 100.0 100.7 98.3 99.0 100.6QIII 102.2 99.5 103.4 100.0 90.2 97.5 128.9 107.8 91.8 129.2 100.2QIV 106.5 113.6 105.9 100.0 89.8 106.0 65.1 104.0 92.2 140.1 98.5
2017/18QI 111.7 134.7 107.9 100.0 93.1 102.1 71.1 96.7 92.7 131.4 98.7QII 109.3 118.1 114.2 102.3 93.9 106.5 82.9 101.1 109.0 133.8 103.5QIII 110.1 119.6 118.1 96.4 96.5 113.5 94.2 99.0 97.6 137.6 103.4QIV 120.6 138.5 131.7 106.9 104.8 118.3 108.7 103.0 96.7 138.9 110.1
2018/19QI 127.8 148.3 137.7 109.4 120.8 119.1 121.8 107.1 95.8 135.5 122.5QII 125.0 130.8 152.1 111.8 111.8 125.9 119.6 78.8 111.2 95.8 147.8QIII 129.1 135.1 162.3 111.3 140.5 124.2 109.8 113.6 97.4 141.2 117.8QIV 137.3 151.6 161.6 108.0 138.9 126.9 157.7 125.5 98.3 147.4 114.6
2019/20QI 149.2 175.0 170.2 104.6 138.6 132.8 170.5 140.6 109.4 152.3 110.5QII 147.6 164.7 174.6 108.5 144.7 127.7 177.0 140.1 112.9 163.4 113.9QIII 159.3 183.6 193.0 116.6 163.3 124.0 168.5 146.8 112.4 183.6 109.3QIV 181.3 205.5 206.9 135.7 204.7 158.0 144.6 167.5 117.0 222.9 114.7
2020/21QI 192.1 223.9 210.0 140.4 216.0 155.9 122.2 177.5 119.2 229.5 127.7QII 190.6 216.1 208.0 140.4 210.4 172.2 127.6 169.6 134.4 237.1 145.1QIII 203.3 224.1 228.8 150.0 205.6 192.5 200.5 197.3 145.0 242.9 145.9QIV 217.9 247.5 246.0 154.7 221.2 248.9 184.2 196.9 159.9 231.2 154.7
Source: Central Statistical Agency

134 | Fourth Quarter 2020/21
National Bank of Ethiopia Quarterly Bulletin
Table 22 (F6): Regional States' Consumer Price Index (Food)December 2016 = 100
Perio
d
Food
&
Non
-al-
coho
lic
Beve
rage
s
Brea
d a
nd
Cer
eals
Mea
t
Fish
& se
a fo
od
Milk
, Che
ese
& E
gg
Oils
& F
ats
Fru
its
Veg
etab
les
Suga
r, ja
m,
hone
y,
choc
olat
e an
d c
onfe
c-tio
nery
(ND
)
Food
pro
d-
ucts
Non
-Al-
coho
lic
Beve
rage
s
HARARI2007/08
Q.I 19.2 26.3 16.9 21.6 53.1 34.4 24.6 62.4 52.9 10.7Q.II 19.7 27.1 16.5 21.5 58.2 35.5 25.4 63.1 49.7 11.2Q.III 21.5 30.5 17.1 22.0 67.0 52.2 37.4 66.3 54.2 11.9Q.IV 28.4 42.8 19.6 26.8 76.5 44.5 31.8 72.2 62.7 21.6
2008/09Q.I 35.7 60.9 22.4 33.0 81.2 52.3 37.4 75.8 69.8 23.5Q.II 35.2 61.1 22.4 30.2 75.6 47.5 34.0 78.2 56.8 23.9Q.III 34.1 58.3 21.3 25.3 75.6 49.2 35.2 79.5 43.1 25.0Q.IV 34.7 56.9 21.9 29.3 71.6 48.0 34.4 79.9 30.6 27.8
2009/10Q.I 35.0 56.6 22.9 30.3 69.3 44.8 32.0 80.4 28.8 28.3Q.II 35.1 54.4 23.0 30.3 70.6 43.6 31.2 79.5 28.7 31.2Q.III 36.4 53.6 23.5 29.9 75.1 46.5 33.3 79.9 33.3 35.9Q.IV 36.8 51.8 24.3 30.5 78.8 50.9 36.4 80.4 41.3 36.7
2010/11Q.I 38.2 52.0 26.8 33.2 80.0 62.5 44.7 80.1 41.7 37.2Q.II 40.8 51.9 28.6 34.2 92.7 70.0 50.1 80.8 38.8 42.4Q.III 44.8 52.1 25.4 36.4 107.1 78.4 56.1 81.7 42.3 56.3Q.IV 48.8 60.1 33.3 44.9 135.3 72.4 51.8 83.6 63.0 56.2
2011/12Q.I 52.4 62.4 39.0 49.6 102.0 69.8 50.0 83.8 78.3 61.1Q.II 54.8 66.4 40.1 49.7 104.0 64.3 46.0 84.1 79.5 66.4Q.III 61.2 67.5 40.7 49.6 104.7 69.7 51.3 84.6 58.9 85.8Q.IV 67.9 71.3 52.3 50.9 135.2 67.8 60.4 85.3 67.6 89.4
2012/13Q.I 70.1 76.5 57.6 52.3 103.5 73.9 58.7 85.7 71.7 97.1Q.II 71.1 78.5 58.8 56.0 102.4 68.4 57.1 85.3 65.8 97.7Q.III 69.1 76.8 58.4 58.2 97.5 73.4 49.2 84.7 67.5 91.7Q.IV 73.2 78.4 67.2 59.0 97.6 74.1 63.5 85.7 67.0 84.8
2013/14Q.I 78.7 83.3 71.8 63.5 98.2 76.0 76.5 85.6 67.7 93.3Q.II 78.4 88.3 68.5 59.2 98.3 67.5 65.7 84.9 66.6 88.1Q.III 76.9 84.4 69.1 63.5 98.1 75.6 64.0 84.8 68.5 85.2Q.IV 79.2 85.0 73.1 66.4 98.5 87.4 71.6 85.1 66.8 84.7
2014/15Q.I 84.8 91.7 79.0 71.0 99.6 82.3 79.3 84.7 65.0 87.9Q.II 85.8 94.5 76.4 67.7 99.7 80.4 81.9 85.5 67.9 85.2Q.III 86.2 93.9 76.4 70.4 100.2 111.7 82.6 85.1 77.6 77.5Q.IV 90.0 96.8 83.5 72.1 101.3 107.2 85.6 84.2 97.0 74.7
2015/16Q.I 90.6 95.9 83.9 76.4 100.4 89.1 83.1 83.4 123.8 72.1Q.II 92.1 95.1 84.7 80.1 102.1 83.0 91.2 84.5 128.3 73.4QIII 92.7 95.5 84.1 81.2 102.1 94.9 93.3 98.3 122.4 70.8QIV 97.3 93.0 94.4 87.8 100.1 110.4 110.2 105.7 136.2 83.7
2016/17QI 102.3 99.1 101.3 92.6 100.1 98.1 120.1 106.4 113.7 87.9QII 100.7 99.6 99.3 98.6 100.1 96.2 108.2 104.5 96.5 100.3QIII 100.0 95.3 102.9 0.0 99.5 101.7 103.3 107.7 102.8 102.1 102.4QIV 107.5 106.3 108.5 0.0 102.2 125.2 121.2 108.3 109.7 106.2 97.2
2017/18QI 110.8 112.9 105.2 0.0 108.4 135.9 143.1 101.6 114.7 110.2 99.5QII 110.6 116.6 103.5 0.0 107.2 110.4 152.7 103.5 110.1 110.0 97.4QIII 110.1 114.3 101.9 0.0 112.2 109.7 150.4 105.3 106.6 114.9 96.0QIV 116.0 122.3 114.9 0.0 117.5 110.6 138.8 103.7 107.9 126.9 99.7
2018/19QI 123.5 129.1 121.5 0.0 130.1 113.0 124.3 118.6 106.9 129.7 102.5QII 123.7 135.0 122.5 0.0 132.2 112.6 129.0 103.9 108.2 127.7 98.2QIII 125.9 136.6 119.5 0.0 135.8 113.7 137.6 110.9 109.1 130.8 99.6QIV 138.8 140.5 146.3 0.0 146.3 116.5 170.2 147.5 116.8 141.6 100.7
2019/20QI 153.9 161.0 157.2 0.0 160.0 118.9 170.5 164.9 121.9 148.7 106.4QII 160.0 175.5 158.2 0.0 162.7 117.4 181.3 158.3 142.3 147.7 107.1QIII 159.2 176.1 162.5 0.0 161.0 117.7 183.1 143.0 145.9 157.1 119.2QIV 173.0 191.5 166.4 0.0 165.0 117.9 187.4 178.9 129.4 170.6 127.4
2020/21QI 189.7 207.7 179.8 0.0 165.7 118.2 166.3 225.9 120.5 199.6 125.3QII 192.4 219.6 180.5 0.0 180.0 118.6 185.7 192.7 159.1 201.6 126.2QIII 193.2 223.3 183.8 0.0 187.2 118.5 217.7 174.3 159.9 208.2 134.0QIV 214.3 242.9 216.5 0.0 223.7 121.6 248.8 196.2 154.5 241.3 139.1
Source: Central Statistical Agency

Fourth Quarter 2020/21 | 135
National Bank of Ethiopia Quarterly Bulletin
Table 22 (F6): Regional States' Consumer Price Index (Food)December 2016 = 100
Perio
d
Food
&
Non
-al-
coho
lic
Beve
rage
s
Brea
d a
nd
Cer
eals
Mea
t
Fish
& se
a fo
od
Milk
, Che
ese
& E
gg
Oils
& F
ats
Fru
its
Veg
etab
les
Suga
r, ja
m,
hone
y,
choc
olat
e an
d c
onfe
c-tio
nery
(ND
)
Food
pro
d-
ucts
Non
-Al-
coho
lic
Beve
rage
s
HARARI2007/08
Q.I 19.2 26.3 16.9 21.6 53.1 34.4 24.6 62.4 52.9 10.7Q.II 19.7 27.1 16.5 21.5 58.2 35.5 25.4 63.1 49.7 11.2Q.III 21.5 30.5 17.1 22.0 67.0 52.2 37.4 66.3 54.2 11.9Q.IV 28.4 42.8 19.6 26.8 76.5 44.5 31.8 72.2 62.7 21.6
2008/09Q.I 35.7 60.9 22.4 33.0 81.2 52.3 37.4 75.8 69.8 23.5Q.II 35.2 61.1 22.4 30.2 75.6 47.5 34.0 78.2 56.8 23.9Q.III 34.1 58.3 21.3 25.3 75.6 49.2 35.2 79.5 43.1 25.0Q.IV 34.7 56.9 21.9 29.3 71.6 48.0 34.4 79.9 30.6 27.8
2009/10Q.I 35.0 56.6 22.9 30.3 69.3 44.8 32.0 80.4 28.8 28.3Q.II 35.1 54.4 23.0 30.3 70.6 43.6 31.2 79.5 28.7 31.2Q.III 36.4 53.6 23.5 29.9 75.1 46.5 33.3 79.9 33.3 35.9Q.IV 36.8 51.8 24.3 30.5 78.8 50.9 36.4 80.4 41.3 36.7
2010/11Q.I 38.2 52.0 26.8 33.2 80.0 62.5 44.7 80.1 41.7 37.2Q.II 40.8 51.9 28.6 34.2 92.7 70.0 50.1 80.8 38.8 42.4Q.III 44.8 52.1 25.4 36.4 107.1 78.4 56.1 81.7 42.3 56.3Q.IV 48.8 60.1 33.3 44.9 135.3 72.4 51.8 83.6 63.0 56.2
2011/12Q.I 52.4 62.4 39.0 49.6 102.0 69.8 50.0 83.8 78.3 61.1Q.II 54.8 66.4 40.1 49.7 104.0 64.3 46.0 84.1 79.5 66.4Q.III 61.2 67.5 40.7 49.6 104.7 69.7 51.3 84.6 58.9 85.8Q.IV 67.9 71.3 52.3 50.9 135.2 67.8 60.4 85.3 67.6 89.4
2012/13Q.I 70.1 76.5 57.6 52.3 103.5 73.9 58.7 85.7 71.7 97.1Q.II 71.1 78.5 58.8 56.0 102.4 68.4 57.1 85.3 65.8 97.7Q.III 69.1 76.8 58.4 58.2 97.5 73.4 49.2 84.7 67.5 91.7Q.IV 73.2 78.4 67.2 59.0 97.6 74.1 63.5 85.7 67.0 84.8
2013/14Q.I 78.7 83.3 71.8 63.5 98.2 76.0 76.5 85.6 67.7 93.3Q.II 78.4 88.3 68.5 59.2 98.3 67.5 65.7 84.9 66.6 88.1Q.III 76.9 84.4 69.1 63.5 98.1 75.6 64.0 84.8 68.5 85.2Q.IV 79.2 85.0 73.1 66.4 98.5 87.4 71.6 85.1 66.8 84.7
2014/15Q.I 84.8 91.7 79.0 71.0 99.6 82.3 79.3 84.7 65.0 87.9Q.II 85.8 94.5 76.4 67.7 99.7 80.4 81.9 85.5 67.9 85.2Q.III 86.2 93.9 76.4 70.4 100.2 111.7 82.6 85.1 77.6 77.5Q.IV 90.0 96.8 83.5 72.1 101.3 107.2 85.6 84.2 97.0 74.7
2015/16Q.I 90.6 95.9 83.9 76.4 100.4 89.1 83.1 83.4 123.8 72.1Q.II 92.1 95.1 84.7 80.1 102.1 83.0 91.2 84.5 128.3 73.4QIII 92.7 95.5 84.1 81.2 102.1 94.9 93.3 98.3 122.4 70.8QIV 97.3 93.0 94.4 87.8 100.1 110.4 110.2 105.7 136.2 83.7
2016/17QI 102.3 99.1 101.3 92.6 100.1 98.1 120.1 106.4 113.7 87.9QII 100.7 99.6 99.3 98.6 100.1 96.2 108.2 104.5 96.5 100.3QIII 100.0 95.3 102.9 0.0 99.5 101.7 103.3 107.7 102.8 102.1 102.4QIV 107.5 106.3 108.5 0.0 102.2 125.2 121.2 108.3 109.7 106.2 97.2
2017/18QI 110.8 112.9 105.2 0.0 108.4 135.9 143.1 101.6 114.7 110.2 99.5QII 110.6 116.6 103.5 0.0 107.2 110.4 152.7 103.5 110.1 110.0 97.4QIII 110.1 114.3 101.9 0.0 112.2 109.7 150.4 105.3 106.6 114.9 96.0QIV 116.0 122.3 114.9 0.0 117.5 110.6 138.8 103.7 107.9 126.9 99.7
2018/19QI 123.5 129.1 121.5 0.0 130.1 113.0 124.3 118.6 106.9 129.7 102.5QII 123.7 135.0 122.5 0.0 132.2 112.6 129.0 103.9 108.2 127.7 98.2QIII 125.9 136.6 119.5 0.0 135.8 113.7 137.6 110.9 109.1 130.8 99.6QIV 138.8 140.5 146.3 0.0 146.3 116.5 170.2 147.5 116.8 141.6 100.7
2019/20QI 153.9 161.0 157.2 0.0 160.0 118.9 170.5 164.9 121.9 148.7 106.4QII 160.0 175.5 158.2 0.0 162.7 117.4 181.3 158.3 142.3 147.7 107.1QIII 159.2 176.1 162.5 0.0 161.0 117.7 183.1 143.0 145.9 157.1 119.2QIV 173.0 191.5 166.4 0.0 165.0 117.9 187.4 178.9 129.4 170.6 127.4
2020/21QI 189.7 207.7 179.8 0.0 165.7 118.2 166.3 225.9 120.5 199.6 125.3QII 192.4 219.6 180.5 0.0 180.0 118.6 185.7 192.7 159.1 201.6 126.2QIII 193.2 223.3 183.8 0.0 187.2 118.5 217.7 174.3 159.9 208.2 134.0QIV 214.3 242.9 216.5 0.0 223.7 121.6 248.8 196.2 154.5 241.3 139.1
Source: Central Statistical Agency
Table 22 (F7): Regional States' Consumer Price Index (Food)December 2016 = 100
Perio
d
Food
&
Non
-alc
ohol
-ic
Bev
erag
es
Brea
d an
d C
erea
ls
Mea
t
Fish
and
sea
fo
od
Milk
, Che
ese
& Eg
g
Oils
& F
ats
Fru
its
Vege
tabl
es
Suga
r, ja
m,
hone
y, c
hoc-
olat
e an
d co
nfec
tione
ry
(ND)
Food
pro
d-uc
ts
Non
-Alc
ohol
-ic
Bev
erag
es
OROMIA2007/08
Q.I 24.7 26.3 21.1 19.5 24.4 22.0 22.3 23.2 62.8 26.9Q.II 26.4 28.3 21.1 20.0 27.5 24.7 24.9 22.8 64.4 28.2Q.III 29.5 32.3 22.9 22.7 30.0 31.1 31.4 25.4 65.9 29.0Q.IV 37.5 43.1 25.8 25.6 33.9 34.6 35.0 27.9 75.0 31.3
2008/09Q.I 47.9 60.7 28.5 27.6 33.9 34.1 34.5 34.3 83.7 31.7Q.II 43.0 56.1 28.6 28.4 32.0 33.5 33.9 35.8 62.9 32.6Q.III 40.3 51.6 28.6 29.3 29.7 40.2 40.6 41.9 41.6 34.6Q.IV 40.8 50.6 29.5 31.7 29.0 44.0 44.4 44.3 33.8 35.6
2009/10Q.I 41.0 52.2 30.1 32.1 29.8 37.5 37.9 45.3 34.8 37.4Q.II 39.3 50.0 29.8 32.2 30.0 37.1 37.5 45.4 39.1 41.0Q.III 39.7 50.0 30.6 33.6 30.2 40.5 41.0 49.6 45.8 42.0Q.IV 39.9 48.4 31.6 34.5 32.4 42.4 42.9 50.8 59.6 41.4
2010/11Q.I 40.6 47.9 33.1 36.4 35.3 44.1 44.6 49.4 67.4 47.3Q.II 43.2 47.5 33.0 38.4 43.3 52.5 53.0 51.5 60.1 58.4Q.III 48.2 49.8 29.8 42.6 47.2 62.1 62.8 49.6 62.3 76.6Q.IV 57.4 58.5 33.3 46.3 66.4 64.1 64.8 51.5 90.2 85.4
2011/12Q.I 62.1 64.9 42.0 48.2 69.0 56.8 57.4 52.6 100.3 84.6Q.II 65.1 69.7 45.0 48.7 65.7 59.7 60.3 56.3 99.6 93.5Q.III 70.3 74.2 51.7 55.5 68.5 65.2 71.5 58.2 89.8 92.4Q.IV 76.1 79.7 62.4 63.1 74.4 64.1 80.7 58.0 94.5 83.8
2012/13Q.I 76.4 84.0 66.6 62.2 72.0 75.8 79.3 60.0 85.1 84.3Q.II 75.0 83.8 67.6 62.9 68.8 87.2 72.9 62.7 79.0 80.9Q.III 74.7 81.5 70.2 66.3 68.8 81.4 73.0 67.9 73.4 77.1Q.IV 75.7 83.0 70.3 66.7 71.4 79.8 75.4 67.4 73.5 75.2
2013/14Q.I 79.2 90.0 73.7 68.5 70.6 83.7 77.5 72.2 74.5 74.7Q.II 81.3 95.3 75.1 68.8 69.9 82.3 75.3 71.5 76.1 75.6Q.III 79.0 83.1 76.2 72.0 73.1 86.1 79.0 70.4 73.3 76.7Q.IV 82.4 87.3 78.1 74.7 77.4 80.5 81.5 71.7 86.9 90.4
2014/15Q.I 87.0 92.2 80.5 76.4 85.8 86.5 80.6 70.9 111.2 93.1Q.II 87.7 90.6 81.1 77.5 87.8 85.1 85.6 73.8 102.3 95.0Q.III 91.3 86.9 83.2 82.9 91.7 88.4 96.4 71.9 111.6 87.7Q.IV 98.3 90.2 86.6 92.2 100.3 88.1 101.8 75.2 156.2 80.9
2015/16Q.I 105.6 95.4 91.7 92.8 101.0 94.2 101.6 73.4 238.9 78.3Q.II 104.0 95.0 94.0 94.8 96.5 99.1 105.0 74.7 202.7 78.8QIII 100.5 96.0 94.2 99.8 95.4 101.7 101.3 78.0 141.5 74.5QIV 102.7 97.8 96.4 104.9 98.5 102.4 112.3 77.4 134.9 78.8
2016/17QI 104.9 102.7 100.2 102.2 99.5 100.3 117.9 83.8 128.0 89.1QII 101.8 103.5 99.3 101.2 99.4 100.3 102.3 92.2 110.9 98.0QIII 101.6 99.1 98.9 0.0 104.6 100.8 104.5 107.8 89.1 107.1 95.3QIV 108.8 110.1 104.2 0.0 112.3 96.3 106.9 120.7 85.7 116.2 93.2
2017/18QI 112.9 123.9 108.0 0.0 112.6 94.5 124.6 113.4 86.7 124.1 97.7QII 116.2 129.8 112.0 0.0 113.7 88.7 135.5 114.4 82.9 128.8 106.3QIII 116.6 123.1 117.6 0.0 119.6 83.7 140.5 124.2 79.4 139.5 101.1QIV 120.3 132.4 124.6 0.0 130.7 80.8 142.7 119.4 80.0 143.5 105.9
2018/19QI 123.7 136.6 128.4 0.0 134.7 82.2 146.2 122.9 74.9 145.3 111.5QII 124.5 137.2 129.1 0.0 137.0 85.1 148.7 124.7 76.5 143.4 109.6QIII 128.0 138.6 135.0 0.0 143.0 83.8 153.0 136.0 79.6 152.7 102.3QIV 143.1 154.9 147.1 0.0 155.3 93.4 164.7 167.3 87.3 152.9 105.2
2019/20QI 152.2 173.8 158.5 0.0 152.9 92.6 181.5 172.9 92.3 159.1 111.5QII 154.5 181.7 162.7 0.0 151.7 87.9 188.7 172.0 83.8 159.8 115.0QIII 160.7 182.3 163.7 0.0 157.9 95.1 189.7 185.5 83.7 171.4 122.0QIV 175.5 203.1 172.6 0.0 164.9 97.5 187.0 209.9 86.7 178.9 128.5
2020/21QI 187.6 217.7 174.3 0.0 166.3 102.3 187.4 225.3 84.9 194.7 145.3QII 189.3 224.8 176.8 0.0 170.6 114.1 185.3 207.0 93.7 199.7 154.4QIII 198.5 233.2 183.1 0.0 188.2 127.1 188.6 217.9 99.6 213.6 153.9QIV 221.1 264.7 206.0 0.0 218.2 160.6 198.7 226.4 104.7 240.1 164.6
Source: Central Statistical Agency

136 | Fourth Quarter 2020/21
National Bank of Ethiopia Quarterly Bulletin
Table 22 (F8): Regional States' Consumer Price Index (Food)December 100 = 2016
Perio
d
Food
& N
on-
alco
holic
Be
vera
ges
Brea
d an
d C
erea
ls
Mea
t
Fish
and
sea
fo
od
Milk
, Che
ese
& Eg
g
Oils
& F
ats
Fru
its
Vege
tabl
es
Suga
r, ja
m,
hone
y,
choc
olat
e an
d co
nfec
tione
ry
(ND)
Food
pro
duct
s
Non
-Alc
ohol
ic
Beve
rage
s
SNNPR2007/08
Q.I 22.4 25.1 21.1 19.9 34.3 20.3 17.8 36.3 24.7 30.4Q.II 23.4 26.2 21.7 21.0 37.7 22.3 19.6 35.9 28.7 31.9Q.III 26.3 28.6 22.8 22.0 44.4 28.2 24.8 40.9 28.5 33.8Q.IV 34.4 41.3 26.0 24.8 48.8 33.9 29.8 47.1 32.7 37.0
2008/09Q.I 43.6 59.9 29.7 26.8 47.6 30.1 26.4 55.5 36.7 39.5Q.II 38.0 53.7 29.3 28.2 47.6 30.6 26.9 59.9 27.7 36.9Q.III 35.5 47.9 27.4 30.3 46.4 33.7 29.6 66.9 19.2 34.2Q.IV 36.8 49.2 28.8 31.6 50.8 36.7 32.2 68.2 15.1 35.4
2009/10Q.I 37.2 50.8 30.6 33.4 48.0 33.5 29.4 69.1 14.8 43.6Q.II 37.0 48.2 30.8 35.4 48.8 37.1 32.6 71.5 18.4 43.3QIII 36.8 47.3 31.0 36.9 48.7 37.8 33.2 74.3 21.9 40.5Q.IV 35.8 46.3 32.6 36.8 49.5 35.3 31.0 75.6 28.8 41.7
2010/11Q.I 35.9 44.1 33.2 37.3 50.4 39.3 34.6 75.7 36.7 50.1Q.II 38.2 44.6 33.9 40.7 59.4 45.3 39.8 80.2 29.0 61.0Q.III 44.6 50.5 29.4 43.6 67.5 56.4 49.6 80.7 32.4 92.1Q.IV 55.5 60.7 33.1 46.4 89.5 62.6 55.0 85.1 45.5 115.0
2011/12Q.I 59.5 69.9 43.1 48.1 77.6 48.9 43.0 88.0 49.0 121.7Q.II 61.0 70.6 47.8 50.5 74.7 59.3 52.1 90.7 50.7 115.0Q.III 66.4 73.3 54.3 56.5 81.1 63.4 62.0 94.1 51.6 112.6Q.IV 72.9 82.7 63.9 58.1 91.8 62.8 68.6 95.1 54.1 103.0
2012/13Q.I 74.7 89.9 68.9 58.8 82.7 69.2 68.7 91.2 53.8 98.7Q.II 73.8 78.8 69.4 61.1 81.0 81.2 73.1 92.6 52.2 93.7Q.III 74.4 77.4 71.2 63.9 82.3 73.7 75.6 94.9 51.1 84.4Q.IV 76.1 85.6 75.5 66.7 83.7 67.2 73.6 95.6 51.8 84.9
2013/14Q.I 79.2 91.1 76.8 67.7 82.0 65.9 76.8 93.4 51.7 88.6Q.II 78.7 87.5 80.9 69.3 83.0 73.3 76.5 93.2 53.7 83.7Q.III 79.6 81.7 81.6 72.6 85.8 70.0 81.3 93.5 54.7 79.3Q.IV 82.5 89.3 83.7 72.4 89.3 66.2 79.7 93.9 55.8 110.0
2014/15Q.I 81.8 91.9 84.6 76.8 86.9 68.7 75.9 94.8 52.0 120.6Q.II 81.3 81.5 85.8 78.6 91.3 78.6 78.5 97.9 57.8 122.0Q.III 83.7 80.0 86.9 82.5 98.1 83.0 83.3 97.2 64.2 112.9Q.IV 90.5 85.9 90.5 85.5 103.6 75.9 92.2 96.2 77.0 111.4
2015/16Q.I 92.4 91.1 95.4 86.4 101.4 84.5 90.8 97.0 94.5 104.9Q.II 88.9 86.2 95.6 87.9 100.2 91.7 86.2 97.1 98.2 93.4QIII 91.5 90.4 96.3 93.1 98.0 92.6 90.6 97.6 93.1 87.2QIV 96.3 97.8 100.0 95.8 102.6 83.9 92.8 104.7 110.5 92.1
2016/17QI 97.6 100.9 102.1 97.1 100.6 93.8 92.9 105.2 108.4 101.0QII 98.7 99.8 102.2 98.9 98.2 100.8 96.5 104.4 101.1 103.1QIII 102.1 102.4 104.2 0.0 102.0 105.0 102.7 110.6 106.2 103.9 97.9QIV 114.7 121.8 109.1 0.0 106.4 114.4 104.5 117.4 107.3 107.7 103.7
2017/18QI 119.3 134.0 114.0 0.0 107.9 111.8 113.4 106.9 107.4 109.9 110.4QII 118.8 125.3 118.2 0.0 116.3 110.2 135.8 112.5 102.5 111.1 117.9QIII 118.6 120.5 120.7 0.0 122.2 112.4 144.5 130.4 100.9 123.4 114.2QIV 125.5 133.8 131.9 0.0 128.7 118.3 133.6 121.8 100.9 132.1 122.6
2018/19QI 129.5 137.8 138.3 0.0 127.4 118.1 130.0 125.2 100.9 132.1 134.3QII 128.5 133.3 137.9 0.0 132.5 118.3 147.8 126.7 101.0 132.1 122.4QIII 129.0 135.9 141.5 0.0 138.6 120.4 151.5 138.6 101.6 129.9 113.3QIV 141.5 154.3 157.2 0.0 148.4 124.5 161.3 157.3 108.7 133.5 119.2
2019/20QI 153.2 169.6 171.3 0.0 153.8 131.2 165.0 161.2 118.2 137.1 131.6QII 158.9 163.7 174.3 0.0 160.7 134.9 198.3 160.7 120.7 138.4 139.8QIII 162.8 165.5 182.8 0.0 165.0 136.8 207.9 165.4 122.0 143.6 144.1QIV 183.1 191.6 194.8 0.0 166.8 147.0 215.6 176.5 127.7 154.7 163.0
2020/21QI 196.2 205.9 197.5 0.0 171.0 153.7 188.5 188.9 123.3 187.5 177.8QII 202.3 210.3 202.2 0.0 182.9 157.2 195.9 187.0 139.2 211.3 186.7QIII 211.6 226.9 206.7 0.0 197.5 177.1 211.0 206.2 150.1 219.0 178.2QIV 246.9 279.0 236.0 0.0 221.5 214.3 227.7 225.0 153.6 258.7 200.5
Source: Central Statistical Agency

Fourth Quarter 2020/21 | 137
National Bank of Ethiopia Quarterly Bulletin
Table 22 (F8): Regional States' Consumer Price Index (Food)December 100 = 2016
Perio
d
Food
& N
on-
alco
holic
Be
vera
ges
Brea
d an
d C
erea
ls
Mea
t
Fish
and
sea
fo
od
Milk
, Che
ese
& Eg
g
Oils
& F
ats
Fru
its
Vege
tabl
es
Suga
r, ja
m,
hone
y,
choc
olat
e an
d co
nfec
tione
ry
(ND)
Food
pro
duct
s
Non
-Alc
ohol
ic
Beve
rage
s
SNNPR2007/08
Q.I 22.4 25.1 21.1 19.9 34.3 20.3 17.8 36.3 24.7 30.4Q.II 23.4 26.2 21.7 21.0 37.7 22.3 19.6 35.9 28.7 31.9Q.III 26.3 28.6 22.8 22.0 44.4 28.2 24.8 40.9 28.5 33.8Q.IV 34.4 41.3 26.0 24.8 48.8 33.9 29.8 47.1 32.7 37.0
2008/09Q.I 43.6 59.9 29.7 26.8 47.6 30.1 26.4 55.5 36.7 39.5Q.II 38.0 53.7 29.3 28.2 47.6 30.6 26.9 59.9 27.7 36.9Q.III 35.5 47.9 27.4 30.3 46.4 33.7 29.6 66.9 19.2 34.2Q.IV 36.8 49.2 28.8 31.6 50.8 36.7 32.2 68.2 15.1 35.4
2009/10Q.I 37.2 50.8 30.6 33.4 48.0 33.5 29.4 69.1 14.8 43.6Q.II 37.0 48.2 30.8 35.4 48.8 37.1 32.6 71.5 18.4 43.3QIII 36.8 47.3 31.0 36.9 48.7 37.8 33.2 74.3 21.9 40.5Q.IV 35.8 46.3 32.6 36.8 49.5 35.3 31.0 75.6 28.8 41.7
2010/11Q.I 35.9 44.1 33.2 37.3 50.4 39.3 34.6 75.7 36.7 50.1Q.II 38.2 44.6 33.9 40.7 59.4 45.3 39.8 80.2 29.0 61.0Q.III 44.6 50.5 29.4 43.6 67.5 56.4 49.6 80.7 32.4 92.1Q.IV 55.5 60.7 33.1 46.4 89.5 62.6 55.0 85.1 45.5 115.0
2011/12Q.I 59.5 69.9 43.1 48.1 77.6 48.9 43.0 88.0 49.0 121.7Q.II 61.0 70.6 47.8 50.5 74.7 59.3 52.1 90.7 50.7 115.0Q.III 66.4 73.3 54.3 56.5 81.1 63.4 62.0 94.1 51.6 112.6Q.IV 72.9 82.7 63.9 58.1 91.8 62.8 68.6 95.1 54.1 103.0
2012/13Q.I 74.7 89.9 68.9 58.8 82.7 69.2 68.7 91.2 53.8 98.7Q.II 73.8 78.8 69.4 61.1 81.0 81.2 73.1 92.6 52.2 93.7Q.III 74.4 77.4 71.2 63.9 82.3 73.7 75.6 94.9 51.1 84.4Q.IV 76.1 85.6 75.5 66.7 83.7 67.2 73.6 95.6 51.8 84.9
2013/14Q.I 79.2 91.1 76.8 67.7 82.0 65.9 76.8 93.4 51.7 88.6Q.II 78.7 87.5 80.9 69.3 83.0 73.3 76.5 93.2 53.7 83.7Q.III 79.6 81.7 81.6 72.6 85.8 70.0 81.3 93.5 54.7 79.3Q.IV 82.5 89.3 83.7 72.4 89.3 66.2 79.7 93.9 55.8 110.0
2014/15Q.I 81.8 91.9 84.6 76.8 86.9 68.7 75.9 94.8 52.0 120.6Q.II 81.3 81.5 85.8 78.6 91.3 78.6 78.5 97.9 57.8 122.0Q.III 83.7 80.0 86.9 82.5 98.1 83.0 83.3 97.2 64.2 112.9Q.IV 90.5 85.9 90.5 85.5 103.6 75.9 92.2 96.2 77.0 111.4
2015/16Q.I 92.4 91.1 95.4 86.4 101.4 84.5 90.8 97.0 94.5 104.9Q.II 88.9 86.2 95.6 87.9 100.2 91.7 86.2 97.1 98.2 93.4QIII 91.5 90.4 96.3 93.1 98.0 92.6 90.6 97.6 93.1 87.2QIV 96.3 97.8 100.0 95.8 102.6 83.9 92.8 104.7 110.5 92.1
2016/17QI 97.6 100.9 102.1 97.1 100.6 93.8 92.9 105.2 108.4 101.0QII 98.7 99.8 102.2 98.9 98.2 100.8 96.5 104.4 101.1 103.1QIII 102.1 102.4 104.2 0.0 102.0 105.0 102.7 110.6 106.2 103.9 97.9QIV 114.7 121.8 109.1 0.0 106.4 114.4 104.5 117.4 107.3 107.7 103.7
2017/18QI 119.3 134.0 114.0 0.0 107.9 111.8 113.4 106.9 107.4 109.9 110.4QII 118.8 125.3 118.2 0.0 116.3 110.2 135.8 112.5 102.5 111.1 117.9QIII 118.6 120.5 120.7 0.0 122.2 112.4 144.5 130.4 100.9 123.4 114.2QIV 125.5 133.8 131.9 0.0 128.7 118.3 133.6 121.8 100.9 132.1 122.6
2018/19QI 129.5 137.8 138.3 0.0 127.4 118.1 130.0 125.2 100.9 132.1 134.3QII 128.5 133.3 137.9 0.0 132.5 118.3 147.8 126.7 101.0 132.1 122.4QIII 129.0 135.9 141.5 0.0 138.6 120.4 151.5 138.6 101.6 129.9 113.3QIV 141.5 154.3 157.2 0.0 148.4 124.5 161.3 157.3 108.7 133.5 119.2
2019/20QI 153.2 169.6 171.3 0.0 153.8 131.2 165.0 161.2 118.2 137.1 131.6QII 158.9 163.7 174.3 0.0 160.7 134.9 198.3 160.7 120.7 138.4 139.8QIII 162.8 165.5 182.8 0.0 165.0 136.8 207.9 165.4 122.0 143.6 144.1QIV 183.1 191.6 194.8 0.0 166.8 147.0 215.6 176.5 127.7 154.7 163.0
2020/21QI 196.2 205.9 197.5 0.0 171.0 153.7 188.5 188.9 123.3 187.5 177.8QII 202.3 210.3 202.2 0.0 182.9 157.2 195.9 187.0 139.2 211.3 186.7QIII 211.6 226.9 206.7 0.0 197.5 177.1 211.0 206.2 150.1 219.0 178.2QIV 246.9 279.0 236.0 0.0 221.5 214.3 227.7 225.0 153.6 258.7 200.5
Source: Central Statistical Agency
Table 22 (F9): Regional States' Consumer Price Index (Food)December 2016 = 100
Perio
d
Food
&
Non
-alc
ohol
-ic
Bev
erag
es
Brea
d an
d C
erea
ls
Mea
t
Fish
and
sea
fo
od
Milk
, Che
ese
& Eg
g
Oils
& F
ats
Fru
its
Vege
tabl
es
Suga
r, ja
m,
hone
y, c
hoc-
olat
e an
d co
nfec
tion-
ery
(ND)
Food
pro
d-uc
ts
Non
-Alc
ohol
-ic
Bev
erag
es
SOMALI2007/08
Q.I 22.8 26.5 17.4 16.9 32.6 18.9 24.2 19.0 40.6 17.8Q.II 23.6 27.9 19.8 17.3 39.5 18.9 24.2 18.2 37.2 17.3Q.III 26.4 30.8 20.1 20.0 43.3 26.2 33.6 20.5 31.8 20.4Q.IV 32.0 38.9 21.7 24.1 50.5 30.0 38.4 23.9 36.4 22.3
2008/09Q.I 43.4 59.9 25.3 29.2 55.1 33.3 42.7 27.3 44.3 20.4Q.II 39.7 54.4 24.7 29.9 52.5 31.1 39.9 31.1 33.5 21.3Q.III 40.0 52.7 26.2 33.5 51.1 32.8 42.0 31.1 30.0 27.8Q.IV 41.7 53.0 28.6 37.9 50.8 35.1 45.0 31.2 24.7 30.6
2009/10Q.I 42.3 53.9 29.2 37.1 49.3 33.6 43.1 31.3 20.3 29.7Q.II 42.7 54.8 31.4 37.1 50.6 31.8 40.8 31.2 22.3 29.9Q.III 43.1 56.1 31.4 39.8 51.9 29.7 38.0 31.4 22.7 33.9Q.IV 42.9 55.2 34.8 34.0 54.5 33.4 42.8 32.8 29.5 32.7
2010/11Q.I 43.3 51.5 38.7 36.6 56.6 39.0 50.0 37.6 39.9 33.0Q.II 50.2 52.6 41.9 44.6 66.7 46.0 59.0 45.2 32.6 50.7Q.III 54.0 57.0 36.3 48.6 77.8 46.3 59.4 48.6 34.0 53.3Q.IV 59.8 63.6 42.6 51.2 85.0 53.4 68.4 51.6 48.1 51.5
2011/12Q.I 62.5 71.4 53.2 51.2 91.4 49.8 63.9 58.9 63.9 38.6Q.II 64.5 74.3 53.8 52.2 85.1 47.4 60.8 61.5 61.2 43.1Q.III 70.3 79.0 62.8 60.6 87.4 59.3 67.5 63.9 61.4 56.6Q.IV 73.5 79.6 72.5 60.8 87.0 55.7 80.3 72.0 66.6 58.6
2012/13Q.I 74.5 79.9 78.0 62.0 88.3 59.6 81.7 71.5 66.5 76.8Q.II 78.0 84.8 77.5 69.3 87.0 65.2 75.5 71.7 70.5 87.3Q.III 77.5 83.8 82.5 70.8 87.7 68.2 63.3 71.9 71.1 86.3Q.IV 78.8 85.0 85.6 66.6 87.1 61.0 80.7 73.6 74.7 91.6
2013/14Q.I 80.3 87.3 89.9 67.5 83.6 72.5 94.7 70.5 77.8 95.4Q.II 82.2 92.9 86.0 71.9 84.8 75.0 79.0 69.5 81.1 91.1Q.III 83.5 93.5 80.6 76.1 84.6 83.4 83.4 68.6 86.7 97.1Q.IV 83.0 93.7 83.3 70.6 84.5 86.0 86.8 68.9 87.1 99.5
2014/15Q.I 85.8 97.1 86.5 75.0 90.8 105.1 91.8 68.9 86.0 97.1Q.II 86.3 98.7 86.7 73.6 92.2 85.7 91.0 68.9 88.0 99.7Q.III 87.0 96.5 89.2 77.3 91.8 98.8 95.0 71.2 87.5 102.2Q.IV 89.6 98.6 87.9 84.4 92.8 106.4 100.0 71.0 91.4 103.9
2015/16Q.I 89.3 98.2 94.1 81.1 94.8 94.8 91.9 73.2 91.9 106.5Q.II 91.3 100.8 86.1 89.7 92.8 118.0 93.6 73.1 86.5 101.7QIII 93.4 101.8 93.2 94.4 91.2 120.2 92.6 76.1 89.5 101.7QIV 93.2 100.2 99.7 88.5 87.7 114.6 117.2 78.3 85.6 99.7
2016/17QI 95.1 101.1 105.0 88.3 91.0 108.7 126.4 78.9 99.2 100.2QII 99.5 100.5 102.4 101.2 94.6 98.7 106.2 94.5 98.5 104.1QIII 102.8 104.2 94.7 0.0 105.3 100.3 99.2 102.8 99.3 103.2 101.9QIV 104.7 106.4 108.1 0.0 103.6 100.0 107.4 113.5 96.3 124.6 101.5
2017/18QI 106.9 106.5 112.9 0.0 98.2 100.1 113.2 159.1 95.5 126.6 100.4QII 113.9 119.4 117.9 0.0 103.6 99.9 117.9 139.6 103.2 132.0 102.9QIII 114.4 119.6 119.9 0.0 100.4 100.1 116.2 124.5 109.4 153.4 105.4QIV 119.7 131.9 121.6 0.0 96.8 101.0 126.1 122.6 113.3 145.2 104.3
2018/19QI 129.0 138.5 119.6 0.0 113.2 101.1 129.1 134.6 129.6 147.2 111.9QII 128.6 137.9 117.9 0.0 108.2 100.8 117.0 128.8 136.1 147.6 114.3QIII 131.9 137.5 132.7 0.0 116.5 112.6 121.6 131.3 136.1 175.8 108.7QIV 140.6 146.9 142.9 0.0 126.4 113.5 127.1 162.8 136.1 188.6 113.7
2019/20QI 155.1 166.0 159.1 0.0 141.5 125.8 148.2 185.2 136.1 199.5 124.8QII 162.3 185.6 156.0 0.0 129.0 122.6 144.3 196.7 136.1 200.8 128.4QIII 158.7 183.2 164.5 0.0 133.8 127.8 143.2 181.2 116.6 209.2 131.1QIV 155.7 172.9 160.9 0.0 133.0 122.4 141.6 189.6 128.3 202.0 126.1
2020/21QI 166.3 183.0 185.8 0.0 142.5 133.1 145.3 263.0 116.6 208.6 133.3QII 167.5 187.4 183.2 0.0 161.3 139.2 148.4 208.9 116.6 192.7 127.8QIII 181.0 207.3 185.1 0.0 201.8 108.9 151.6 212.6 116.6 189.7 133.0QIV 206.8 249.0 190.8 0.0 214.6 137.8 144.6 250.1 116.6 200.4 142.0
Source: Central Statistical Agency

138 | Fourth Quarter 2020/21
National Bank of Ethiopia Quarterly Bulletin
Table 22 (F10):: Regional States' Consumer Price Index (Food)December 2016= 100
Perio
d
Food
&
Non
-alc
ohol
-ic
Bev
erag
es
Brea
d an
d C
erea
ls
Mea
t
Fish
and
sea
fo
od
Milk
, Che
ese
& Eg
g
Oils
& F
ats
Fru
its
Vege
tabl
es
Suga
r, ja
m,
hone
y, c
hoc-
olat
e an
d co
nfec
tion-
ery
(ND)
Food
pro
d-uc
ts
Non
-Alc
ohol
-ic
Bev
erag
es
TIGRAY2007/08
Q.I 30.5 26.0 25.3 24.3 36.6 34.1 28.7 34.2 45.6 24.8Q.II 32.7 27.9 25.4 24.7 40.3 38.7 32.5 33.8 49.2 28.7Q.III 35.3 31.3 25.6 25.6 49.2 39.5 33.2 37.4 45.1 30.6Q.IV 43.9 40.4 27.7 28.3 55.2 44.4 37.3 41.0 50.0 33.4
2008/09Q.I 58.9 57.5 29.9 33.7 54.7 51.6 43.3 50.0 59.3 34.8Q.II 55.5 55.4 29.4 36.2 51.1 51.8 43.6 50.0 48.0 32.8Q.III 50.0 51.0 29.3 35.6 49.1 52.5 44.1 58.5 28.5 33.7Q.IV 48.8 51.9 30.5 36.8 48.1 58.3 49.1 61.3 22.2 34.9
2009/10QI 49.3 52.9 33.2 40.1 44.8 59.0 49.6 63.6 21.7 36.0QII 49.6 52.5 32.3 41.5 46.4 49.0 41.2 68.1 22.3 45.2QIII 48.4 51.7 31.9 39.8 48.5 50.4 42.4 70.8 25.8 46.9Q.IV 49.9 52.1 34.6 43.1 52.0 54.7 46.0 74.6 35.6 47.2
2010/11Q.I 49.9 52.2 36.7 44.6 54.3 62.1 52.2 70.1 37.0 46.8Q.II 48.9 49.5 37.6 49.9 67.0 66.0 55.5 72.0 34.5 52.9Q.III 50.5 49.9 37.5 49.3 71.5 65.8 55.3 69.7 34.4 75.3Q.IV 58.5 56.0 42.4 51.2 91.1 74.8 62.9 75.8 50.8 104.6
2011/12Q.I 64.6 60.1 54.2 60.0 86.3 82.4 69.3 71.3 61.4 105.8Q.II 67.0 65.0 58.3 62.8 84.5 79.6 66.9 73.0 58.8 110.6Q.III 69.8 72.9 61.5 64.5 90.0 74.9 71.6 75.4 48.2 117.2Q.IV 76.2 82.0 71.5 71.9 90.8 79.8 76.0 74.0 51.0 114.3
2012/13Q.I 81.0 87.6 77.9 77.2 93.1 89.9 79.6 75.0 60.5 97.4Q.II 78.9 90.4 79.0 83.4 89.3 96.3 65.6 74.5 55.8 90.3Q.III 77.9 91.2 79.0 81.9 90.5 96.3 58.5 76.9 54.9 88.3Q.IV 81.9 98.6 80.9 82.6 92.4 78.2 62.9 77.1 55.7 86.2
2013/14Q.I 89.7 107.0 87.9 88.8 92.0 54.1 82.3 74.4 57.5 87.4Q.II 86.9 106.1 87.6 90.2 90.2 59.0 69.1 74.9 56.7 84.1Q.III 82.0 94.5 87.1 86.5 94.4 59.0 68.3 74.5 55.8 85.9Q.IV 84.4 96.6 91.4 83.3 95.7 59.0 70.2 74.4 56.8 95.1
2014/15Q.I 85.9 97.8 88.0 92.3 98.4 66.5 73.4 75.1 58.5 103.0Q.II 86.5 94.5 87.2 97.2 96.0 76.4 84.8 73.7 58.4 106.8Q.III 83.8 88.0 87.7 89.8 99.2 81.7 82.5 74.7 60.0 104.8Q.IV 85.1 87.6 89.9 93.3 95.3 81.7 86.9 74.8 64.0 104.3
2015/16Q.I 92.0 95.1 90.0 100.4 101.8 74.3 98.2 74.8 75.6 99.3Q.II 96.4 98.7 89.3 101.5 102.1 100.0 104.8 77.5 88.7 95.6QIII 96.4 99.7 90.8 100.4 96.9 100.0 102.9 84.5 88.6 90.7QIV 98.9 102.0 94.8 95.3 97.8 100.0 110.6 92.8 86.0 89.6
2016/17QI 105.3 110.0 104.4 104.5 99.3 100.0 117.5 94.1 88.5 90.1QII 103.3 107.1 103.4 106.1 100.3 100.0 102.2 97.6 97.6 97.0QIII 101.1 102.8 100.9 0.0 104.2 101.9 99.1 97.0 94.3 100.0 105.0QIV 104.8 109.1 106.1 0.0 106.9 106.5 102.8 99.5 95.6 99.9 103.0
2017/18QI 111.5 116.7 123.7 0.0 111.9 108.0 108.6 107.2 102.4 95.7 101.7QII 115.0 122.9 120.7 0.0 117.7 100.3 107.6 115.6 95.2 98.4 106.5QIII 119.2 127.5 130.3 0.0 113.9 100.9 109.6 106.2 92.5 120.5 108.2QIV 126.2 138.3 137.6 0.0 132.7 105.3 109.8 102.0 93.5 137.5 109.3
2018/19QI 135.7 152.9 149.0 0.0 139.0 102.8 112.2 113.1 93.3 139.9 111.2QII 144.7 170.4 151.5 0.0 146.1 106.3 140.4 121.9 93.5 143.3 110.1QIII 145.5 170.1 152.1 0.0 144.6 106.7 145.7 118.6 93.9 153.6 111.6QIV 155.9 180.3 168.3 0.0 153.0 109.4 159.9 135.6 100.3 155.3 114.7
2019/20QI 169.6 196.7 183.7 0.0 179.9 109.7 161.5 160.4 104.0 157.3 114.5QII 175.1 204.4 197.7 0.0 189.0 121.8 158.6 164.4 104.3 146.4 117.4QIII 181.4 205.6 202.7 0.0 179.5 141.9 161.7 171.2 104.6 155.5 141.6QIV 205.5 232.0 219.6 0.0 184.2 150.5 156.5 196.6 106.2 208.8 149.8
2020/21QI 228.2 258.8 225.1 0.0 199.8 140.9 145.1 233.8 107.6 258.4 150.5QII 239.2 265.5 228.2 0.0 210.2 238.4 158.4 236.1 137.8 272.2 152.7QIII 239.2 265.5 228.2 0.0 210.2 238.4 158.4 236.1 137.8 272.2 152.7QIV 239.2 265.5 228.2 0.0 210.2 238.4 158.4 236.1 137.8 272.2 152.7
Source: Central Statistical Agency
Table 23 A: Ethiopia: Direction of External Trade: EXPORT(In Thousands of Birr)
Conti-nents
"Country of Destination" 2010 2011 2012 2013 2014 2015 2016 2017 2018 2019 2020
Djibouti 849,144.8 1,172,260.1 2,313,228.9 1,380,433.1 3,747,193.9 1,941,788.5 2,350,936.7 3,014,309.0 3,735,439.1 3,502,027.2 3,422,940.0 Egypt 585,058.5 764,013.2 768,260.3 818,229.2 1,012,133.0 684,520.9 315,108.1 202,450.4 379,596.1 602,884.5 222,763.9 Ghana 2,094.8 1,117.1 9,582.3 4,292.2 136.8 6,863.1 832.1 696.9 57,554.1 18,798.4 19,029.4 Kenya 54,434.1 176,485.4 190,932.3 269,555.1 431,754.9 656,490.8 625,147.6 1,190,543.3 693,204.5 662,786.4 273,969.7 Libia 1,834.5 2,297.5 68,040.2 - 4,163.4 - - - - - - Morocco 10,976.1 28,363.6 11,632.6 15,895.1 3,746.1 2,040.4 6,841.3 10,061.0 14,271.4 7,627.7 60,459.5 Nigeria 2,215.0 2,990.0 10,297.6 2,735.2 47,617.8 63,719.5 90,565.5 328,428.3 267,894.4 302,908.0 338,173.7 Ruwanda 569.9 1,114.0 993.9 9,793.9 28,670.2 42,368.3 57,909.1 94,341.6 134,233.8 4,579.0 43,122.8 Somali Land - - - - - - - - - - - Somalia 3,139,271.5 4,061,406.4 5,989,640.7 5,798,201.3 6,371,904.9 6,240,561.4 5,827,108.7 5,964,650.4 6,745,127.6 7,180,188.1 5,963,824.1 South Africa 1,030,363.9 89,326.4 194,964.0 218,061.1 257,504.8 226,770.4 260,057.5 426,332.0 283,532.1 213,168.8 216,105.1 Sudan 2,053,243.9 2,983,061.3 2,008,904.2 1,707,190.9 1,629,734.3 1,595,427.4 993,600.1 1,896,197.0 2,560,191.8 1,732,344.2 2,893,902.1 Tanzania 5,959.6 3,084.1 969.4 1,045.6 15,211.2 255.9 401.9 363.6 10,846.1 28,426.6 99,256.8 Uganda 24,333.6 14,963.0 7,044.1 2,765.9 10,051.8 4,295.5 5,913.3 4,864.9 11,353.5 10,099.0 23,442.4 Zambia 369.2 20.4 119.4 503.8 110.0 2,398.8 10,974.8 14,555.0 83,656.4 11,008.3 149,686.8 Zembabwe 1,147.8 3,549.5 788.6 3,632.8 4,272.4 6,716.0 4,025.0 2,602.9 7,178.9 2,997.1 18,027.9 Others 146,791.5 171,537.0 289,802.8 514,287.0 792,557.5 341,524.6 477,440.0 1,351,269.1 1,221,482.3 1,330,556.9 6,723,137.4 Total 7,907,808.6 9,475,589.2 11,865,201.5 10,746,622.1 14,328,992.6 11,815,745.3 11,026,861.7 14,501,665.3 16,205,562.1 15,610,400.08 20,467,841.6
Europe
%Share Of Continent 23.0 18.8 21.1 19.4 22.1 20.0 18.4 21.4 21.9 19.7 18.0 Austria 365.7 1,297.4 1,644.6 1,735.5 4,310.4 2,931.2 22,747.8 22,995.8 6,572.3 2,199.9 678.3 Belgium 766,865.8 1,129,952.5 1,206,977.6 1,025,131.4 1,087,850.9 1,182,982.5 1,436,499.1 1,965,237.5 1,815,142.9 1,885,848.0 2,803,691.9 Bulgaria 9,100.7 17,775.7 40,564.4 82,919.2 99,420.1 86,949.0 43,611.4 42,637.1 91,753.3 80,097.1 96,294.6 Cyprus 1,208.7 29.6 2,392.2 3,217.3 5,007.8 640.5 151.2 1,175.9 17,019.5 14,580.4 16,821.9 Czech Republic 5,564.4 3,925.4 7,320.4 5,569.1 13,779.0 21,577.7 22,939.8 18,599.1 4,910.2 4,466.6 2,337.2 Slovakia - - - 1,897.5 4,395.7 1,466.6 4,072.5 7,076.4 2,144.5 1,552.8 805.1 Denmark 18,362.4 14,816.2 35,758.1 32,455.9 17,723.0 20,802.4 30,025.0 28,201.3 25,631.4 32,806.9 32,645.8 Finland 38,401.9 157,776.1 87,678.9 51,661.1 80,304.0 90,939.5 90,178.8 123,908.3 110,724.0 91,036.7 118,222.5 France 505,675.0 823,513.2 812,971.3 530,534.4 877,613.3 682,717.6 807,422.0 827,504.6 717,334.7 751,487.7 789,673.0 Germany 3,676,129.0 5,412,655.7 5,190,387.9 3,730,991.2 3,754,508.5 4,271,155.2 3,486,254.3 3,943,246.8 4,217,307.3 4,135,208.4 4,523,931.9 Greece 104,335.8 161,358.8 136,034.9 260,072.5 235,797.7 214,131.5 209,499.8 235,931.1 186,258.5 230,314.9 146,873.3 Hungary 4,664.1 6,030.5 29,465.0 34,564.1 18,858.6 15,129.0 18,955.3 16,005.0 19,660.7 10,112.7 17,500.4 Ireland 225.2 4,981.1 1,335.4 4,968.8 4,393.8 11,865.0 10,363.8 15,763.6 13,537.1 17,485.0 4,780.1 Italy 767,672.2 1,830,342.8 1,265,069.2 1,127,453.5 1,244,816.9 1,071,373.1 1,101,650.8 1,347,709.3 1,442,089.8 1,359,779.2 1,494,410.9 Netherlands 2,325,158.7 3,589,200.5 3,513,356.8 3,160,616.3 3,899,530.0 3,910,613.0 3,911,035.2 4,177,990.4 5,256,676.3 7,828,660.8 11,179,122.0 Norway 83,421.5 114,266.4 152,810.3 141,325.7 202,256.0 193,648.3 190,592.2 184,970.7 162,162.0 312,830.2 374,409.1 Poland 20,903.7 10,005.3 2,097.0 17,660.3 23,192.2 18,930.3 9,048.4 13,435.8 18,237.2 23,765.7 24,019.7 Portugal 13,224.5 10,264.5 58,441.4 58,595.2 107,108.4 70,872.1 127,631.2 156,689.8 210,638.0 173,970.4 241,431.3 Rumania 26,297.6 64,555.6 79,944.9 62,136.7 63,661.9 35,255.4 12,665.6 23,638.2 20,038.6 11,055.3 19,221.3 Spain 82,768.8 202,110.6 278,937.8 188,107.6 157,484.0 312,381.6 266,256.9 262,739.3 406,304.2 513,868.4 521,805.4 Sweden 345,076.1 631,746.6 435,154.5 264,471.8 307,877.4 333,582.0 266,867.3 263,089.4 188,083.3 156,700.1 208,700.3 Switzerland 4,876,617.7 8,672,031.8 9,644,798.9 9,439,555.7 7,895,981.9 6,490,540.8 5,266,886.0 4,714,821.8 2,005,549.0 701,171.4 18,502,394.7 Turkey 448,459.6 793,508.0 918,743.3 1,460,875.2 1,267,997.9 854,569.2 463,675.1 659,682.4 1,163,249.4 1,066,064.8 1,163,636.0 Ukraine 1,647.3 549.2 3,605.7 1,288.6 1,569.6 9,366.3 14,853.7 24,420.6 27,800.3 42,717.8 56,395.9 United Kingdom 790,362.3 1,036,992.2 804,000.1 916,862.0 888,555.1 806,313.4 1,069,053.4 1,290,346.0 1,088,894.0 1,179,983.5 1,112,511.1 Russia 87,990.9 170,085.7 210,565.2 289,418.9 405,160.0 283,476.8 289,381.7 386,108.6 313,363.4 399,161.5 430,203.7 Yugoslavia - - - - - - - - - - - Others 32,888.7 129,769.9 228,751.3 106,316.3 121,332.5 270,792.0 639,646.5 1,181,451.6 466,267.8 1,105,005.9 1,255,152.2 Total 15,033,388.3 24,988,711.1 25,148,807.1 23,000,401.7 22,790,486.7 21,265,002.1 19,811,964.8 21,935,376.3 19,997,349.8 22,131,932.3 45,137,669.7 %Share Of Continent 43.8 49.7 44.7 41.4 35.2 36.0 33.1 32.4 27.0 28.0 39.8
America
America Brazil - - - 50.0 - 8,764.8 9,178.4 9,179.6 163.0 77.1 Canada 115,069.8 173,658.6 167,388.9 166,782.8 214,767.3 216,338.4 268,404.1 270,038.6 477,155.3 382,747.5 556,491.0 Cuba - - - 325.5 15,043.2 - - - - - - Mexico 15,924.2 41,359.7 21,189.4 15,661.3 12,529.3 37,776.3 40,458.2 63,779.1 103,708.1 120,383.8 74,524.9 United States 1,387,899.5 1,571,684.8 1,741,318.4 2,223,193.5 2,413,259.7 3,913,895.0 3,733,304.1 4,317,231.5 6,565,250.9 6,071,240.4 7,994,968.3 Others 40,185.0 165,850.0 147,274.5 66,745.5 886,388.5 189,789.5 231,818.7 458,804.3 682,316.7 2,744,376.7 1,374,096.1 Total 1,559,078.4 1,952,553.1 2,076,859.0 2,472,758.7 3,541,988.1 4,366,563.9 4,283,163.5 5,119,033.1 7,828,594.0 9,318,825.6 10,000,080.3 %Share Of Continent 4.5 3.9 3.7 4.5 5.5 7.4 7.2 7.6 10.6 11.8 8.8
Asia
China, Mainland 3,330,807.6 4,764,263.2 5,167,985.4 5,682,920.3 8,071,388.2 6,145,483.9 7,498,265.1 5,111,009.8 4,754,322.7 3,152,537.0 2,538,974.1
China, Taiwan 34,908.6 34,265.7 44,820.6 114,825.8 86,264.9 134,753.6 242,155.2 324,580.5 376,886.5 449,378.2 787,312.2 Hong Kong 98,715.7 378,664.7 523,566.5 655,428.0 342,188.3 434,907.0 390,835.7 419,795.4 394,923.7 254,788.1 552,168.0 India 401,662.3 553,031.3 667,923.1 659,101.4 947,722.2 1,323,550.6 1,440,185.8 1,168,606.9 1,743,919.5 2,978,534.4 1,511,613.3 Indonesia 131,343.7 219,306.2 260,365.2 442,638.8 579,643.5 419,364.5 581,396.8 575,381.8 990,066.8 750,329.4 931,170.3 Israel 752,915.3 1,079,551.0 1,112,383.2 1,822,061.3 2,016,939.4 1,697,745.0 1,366,387.4 1,487,480.1 2,801,566.2 3,184,293.1 2,919,321.9 Japan 535,178.4 596,903.3 1,260,749.0 1,423,109.6 1,884,123.0 1,388,756.3 1,541,929.9 2,233,317.5 2,711,869.3 3,564,930.5 3,350,803.2 N.Korea, Pdrk 16,724.9 54,732.0 24,451.6 40,602.6 223.3 10,146.1 31,494.6 17,897.9 12,521.0 2,846.0 464.9 S.Korea 132,137.3 235,899.3 336,747.5 428,910.5 660,360.4 902,688.1 1,114,526.1 1,224,971.5 1,242,317.8 1,440,765.2 2,190,959.0 Kuwait 9,424.2 45,894.4 38,566.8 53,491.8 54,954.6 59,591.3 28,418.5 36,687.4 94,016.2 123,712.4 141,617.2 Lebanon 10,467.2 79,992.5 41,232.7 104,309.0 90,398.2 15,787.8 16,460.4 30,659.0 61,491.5 65,805.5 37,592.1 Malaysia 9,871.6 5,929.0 12,398.4 57,837.7 45,580.5 5,556.5 107,335.2 78,417.2 29,316.4 64,445.6 230,619.0 Pakistan 333,743.0 192,626.5 768,074.1 896,279.3 678,817.2 855,052.2 1,441,769.4 1,084,808.0 304,739.1 61,784.5 688,547.0 Saudi Arabia 2,057,646.6 2,837,432.3 3,085,698.2 3,075,268.7 3,836,761.6 4,028,128.5 3,981,781.2 4,400,225.0 4,974,581.1 5,667,200.5 7,175,544.1 Singapore 90,801.2 46,255.1 27,476.5 14,236.7 22,061.2 204,215.6 128,152.6 93,295.4 227,603.6 955,530.0 1,608,022.8 Yemen 263,614.8 342,272.8 379,117.3 571,866.5 734,790.4 439,271.6 362,192.6 456,992.0 1,180,754.7 1,697,120.6 1,047,539.2 Thailand 35,140.8 155,088.6 140,299.9 147,971.0 111,444.1 105,215.7 94,324.3 87,940.9 152,740.6 121,436.1 28,623.0 UAE 1,119,157.4 1,284,684.7 1,340,649.8 1,395,130.2 1,931,357.2 1,791,062.6 1,982,406.3 2,694,755.9 3,093,574.6 3,695,524.5 5,430,018.1 Others 370,393.0 846,426.7 1,644,761.6 1,320,681.0 1,550,549.5 1,160,854.1 1,879,038.7 3,985,634.2 4,174,926.4 3,200,481.5 5,990,857.1 Total 9,737,177.2 13,654,330.2 16,785,231.9 18,906,670.1 23,645,567.4 21,122,130.8 24,229,055.8 25,512,456.4 29,322,137.8 31,431,443.1 37,161,766.5 %Share Of Continent 28.3 27.1 29.8 34.1 36.5 35.8 40.5 37.7 39.6 39.7 32.7
Oceania Australia 100,714.1 199,586.8 332,554.2 246,875.7 379,097.3 417,653.3 330,080.8 473,534.0 443,828.2 516,438.5 528,841.3 Others 15,655.1 55,913.1 67,670.3 127,756.1 77,090.7 84,325.8 157,422.4 112,992.7 181,580.2 122,034.7 197,213.0 Total 116,369.2 255,499.9 400,224.5 374,631.7 455,711.7 501,979.2 487,503.3 586,526.7 625,408.4 638,473.2 726,054.2 %Share Of Continent 0.3 0.5 0.7 0.7 0.7 0.8 0.8 0.9 0.8 0.8 0.6 Unspecified - - - - 0 0 0Grand Total 34,353,821.8 50,326,683.5 56,276,324.1 55,501,084.2 64,762,746.5 59,071,421.3 59,838,549.1 67,655,057.8 73,979,052.1 79,131,074.3 113,493,412.3
Source: Ethiopian Customs Authority. Note1: Data for the year 2013 and 2014 is based on updated data from Ethiopian Revenue and Customs Authority Note2: The data for Czechoslovakia before 2013 represents the sum of Czech republic and Slovakia

Fourth Quarter 2020/21 | 139
National Bank of Ethiopia Quarterly Bulletin
Table 22 (F10):: Regional States' Consumer Price Index (Food)December 2016= 100
Perio
d
Food
&
Non
-alc
ohol
-ic
Bev
erag
es
Brea
d an
d C
erea
ls
Mea
t
Fish
and
sea
fo
od
Milk
, Che
ese
& Eg
g
Oils
& F
ats
Fru
its
Vege
tabl
es
Suga
r, ja
m,
hone
y, c
hoc-
olat
e an
d co
nfec
tion-
ery
(ND)
Food
pro
d-uc
ts
Non
-Alc
ohol
-ic
Bev
erag
es
TIGRAY2007/08
Q.I 30.5 26.0 25.3 24.3 36.6 34.1 28.7 34.2 45.6 24.8Q.II 32.7 27.9 25.4 24.7 40.3 38.7 32.5 33.8 49.2 28.7Q.III 35.3 31.3 25.6 25.6 49.2 39.5 33.2 37.4 45.1 30.6Q.IV 43.9 40.4 27.7 28.3 55.2 44.4 37.3 41.0 50.0 33.4
2008/09Q.I 58.9 57.5 29.9 33.7 54.7 51.6 43.3 50.0 59.3 34.8Q.II 55.5 55.4 29.4 36.2 51.1 51.8 43.6 50.0 48.0 32.8Q.III 50.0 51.0 29.3 35.6 49.1 52.5 44.1 58.5 28.5 33.7Q.IV 48.8 51.9 30.5 36.8 48.1 58.3 49.1 61.3 22.2 34.9
2009/10QI 49.3 52.9 33.2 40.1 44.8 59.0 49.6 63.6 21.7 36.0QII 49.6 52.5 32.3 41.5 46.4 49.0 41.2 68.1 22.3 45.2QIII 48.4 51.7 31.9 39.8 48.5 50.4 42.4 70.8 25.8 46.9Q.IV 49.9 52.1 34.6 43.1 52.0 54.7 46.0 74.6 35.6 47.2
2010/11Q.I 49.9 52.2 36.7 44.6 54.3 62.1 52.2 70.1 37.0 46.8Q.II 48.9 49.5 37.6 49.9 67.0 66.0 55.5 72.0 34.5 52.9Q.III 50.5 49.9 37.5 49.3 71.5 65.8 55.3 69.7 34.4 75.3Q.IV 58.5 56.0 42.4 51.2 91.1 74.8 62.9 75.8 50.8 104.6
2011/12Q.I 64.6 60.1 54.2 60.0 86.3 82.4 69.3 71.3 61.4 105.8Q.II 67.0 65.0 58.3 62.8 84.5 79.6 66.9 73.0 58.8 110.6Q.III 69.8 72.9 61.5 64.5 90.0 74.9 71.6 75.4 48.2 117.2Q.IV 76.2 82.0 71.5 71.9 90.8 79.8 76.0 74.0 51.0 114.3
2012/13Q.I 81.0 87.6 77.9 77.2 93.1 89.9 79.6 75.0 60.5 97.4Q.II 78.9 90.4 79.0 83.4 89.3 96.3 65.6 74.5 55.8 90.3Q.III 77.9 91.2 79.0 81.9 90.5 96.3 58.5 76.9 54.9 88.3Q.IV 81.9 98.6 80.9 82.6 92.4 78.2 62.9 77.1 55.7 86.2
2013/14Q.I 89.7 107.0 87.9 88.8 92.0 54.1 82.3 74.4 57.5 87.4Q.II 86.9 106.1 87.6 90.2 90.2 59.0 69.1 74.9 56.7 84.1Q.III 82.0 94.5 87.1 86.5 94.4 59.0 68.3 74.5 55.8 85.9Q.IV 84.4 96.6 91.4 83.3 95.7 59.0 70.2 74.4 56.8 95.1
2014/15Q.I 85.9 97.8 88.0 92.3 98.4 66.5 73.4 75.1 58.5 103.0Q.II 86.5 94.5 87.2 97.2 96.0 76.4 84.8 73.7 58.4 106.8Q.III 83.8 88.0 87.7 89.8 99.2 81.7 82.5 74.7 60.0 104.8Q.IV 85.1 87.6 89.9 93.3 95.3 81.7 86.9 74.8 64.0 104.3
2015/16Q.I 92.0 95.1 90.0 100.4 101.8 74.3 98.2 74.8 75.6 99.3Q.II 96.4 98.7 89.3 101.5 102.1 100.0 104.8 77.5 88.7 95.6QIII 96.4 99.7 90.8 100.4 96.9 100.0 102.9 84.5 88.6 90.7QIV 98.9 102.0 94.8 95.3 97.8 100.0 110.6 92.8 86.0 89.6
2016/17QI 105.3 110.0 104.4 104.5 99.3 100.0 117.5 94.1 88.5 90.1QII 103.3 107.1 103.4 106.1 100.3 100.0 102.2 97.6 97.6 97.0QIII 101.1 102.8 100.9 0.0 104.2 101.9 99.1 97.0 94.3 100.0 105.0QIV 104.8 109.1 106.1 0.0 106.9 106.5 102.8 99.5 95.6 99.9 103.0
2017/18QI 111.5 116.7 123.7 0.0 111.9 108.0 108.6 107.2 102.4 95.7 101.7QII 115.0 122.9 120.7 0.0 117.7 100.3 107.6 115.6 95.2 98.4 106.5QIII 119.2 127.5 130.3 0.0 113.9 100.9 109.6 106.2 92.5 120.5 108.2QIV 126.2 138.3 137.6 0.0 132.7 105.3 109.8 102.0 93.5 137.5 109.3
2018/19QI 135.7 152.9 149.0 0.0 139.0 102.8 112.2 113.1 93.3 139.9 111.2QII 144.7 170.4 151.5 0.0 146.1 106.3 140.4 121.9 93.5 143.3 110.1QIII 145.5 170.1 152.1 0.0 144.6 106.7 145.7 118.6 93.9 153.6 111.6QIV 155.9 180.3 168.3 0.0 153.0 109.4 159.9 135.6 100.3 155.3 114.7
2019/20QI 169.6 196.7 183.7 0.0 179.9 109.7 161.5 160.4 104.0 157.3 114.5QII 175.1 204.4 197.7 0.0 189.0 121.8 158.6 164.4 104.3 146.4 117.4QIII 181.4 205.6 202.7 0.0 179.5 141.9 161.7 171.2 104.6 155.5 141.6QIV 205.5 232.0 219.6 0.0 184.2 150.5 156.5 196.6 106.2 208.8 149.8
2020/21QI 228.2 258.8 225.1 0.0 199.8 140.9 145.1 233.8 107.6 258.4 150.5QII 239.2 265.5 228.2 0.0 210.2 238.4 158.4 236.1 137.8 272.2 152.7QIII 239.2 265.5 228.2 0.0 210.2 238.4 158.4 236.1 137.8 272.2 152.7QIV 239.2 265.5 228.2 0.0 210.2 238.4 158.4 236.1 137.8 272.2 152.7
Source: Central Statistical Agency
Table 23 A: Ethiopia: Direction of External Trade: EXPORT(In Thousands of Birr)
Conti-nents
"Country of Destination" 2010 2011 2012 2013 2014 2015 2016 2017 2018 2019 2020
Djibouti 849,144.8 1,172,260.1 2,313,228.9 1,380,433.1 3,747,193.9 1,941,788.5 2,350,936.7 3,014,309.0 3,735,439.1 3,502,027.2 3,422,940.0 Egypt 585,058.5 764,013.2 768,260.3 818,229.2 1,012,133.0 684,520.9 315,108.1 202,450.4 379,596.1 602,884.5 222,763.9 Ghana 2,094.8 1,117.1 9,582.3 4,292.2 136.8 6,863.1 832.1 696.9 57,554.1 18,798.4 19,029.4 Kenya 54,434.1 176,485.4 190,932.3 269,555.1 431,754.9 656,490.8 625,147.6 1,190,543.3 693,204.5 662,786.4 273,969.7 Libia 1,834.5 2,297.5 68,040.2 - 4,163.4 - - - - - - Morocco 10,976.1 28,363.6 11,632.6 15,895.1 3,746.1 2,040.4 6,841.3 10,061.0 14,271.4 7,627.7 60,459.5 Nigeria 2,215.0 2,990.0 10,297.6 2,735.2 47,617.8 63,719.5 90,565.5 328,428.3 267,894.4 302,908.0 338,173.7 Ruwanda 569.9 1,114.0 993.9 9,793.9 28,670.2 42,368.3 57,909.1 94,341.6 134,233.8 4,579.0 43,122.8 Somali Land - - - - - - - - - - - Somalia 3,139,271.5 4,061,406.4 5,989,640.7 5,798,201.3 6,371,904.9 6,240,561.4 5,827,108.7 5,964,650.4 6,745,127.6 7,180,188.1 5,963,824.1 South Africa 1,030,363.9 89,326.4 194,964.0 218,061.1 257,504.8 226,770.4 260,057.5 426,332.0 283,532.1 213,168.8 216,105.1 Sudan 2,053,243.9 2,983,061.3 2,008,904.2 1,707,190.9 1,629,734.3 1,595,427.4 993,600.1 1,896,197.0 2,560,191.8 1,732,344.2 2,893,902.1 Tanzania 5,959.6 3,084.1 969.4 1,045.6 15,211.2 255.9 401.9 363.6 10,846.1 28,426.6 99,256.8 Uganda 24,333.6 14,963.0 7,044.1 2,765.9 10,051.8 4,295.5 5,913.3 4,864.9 11,353.5 10,099.0 23,442.4 Zambia 369.2 20.4 119.4 503.8 110.0 2,398.8 10,974.8 14,555.0 83,656.4 11,008.3 149,686.8 Zembabwe 1,147.8 3,549.5 788.6 3,632.8 4,272.4 6,716.0 4,025.0 2,602.9 7,178.9 2,997.1 18,027.9 Others 146,791.5 171,537.0 289,802.8 514,287.0 792,557.5 341,524.6 477,440.0 1,351,269.1 1,221,482.3 1,330,556.9 6,723,137.4 Total 7,907,808.6 9,475,589.2 11,865,201.5 10,746,622.1 14,328,992.6 11,815,745.3 11,026,861.7 14,501,665.3 16,205,562.1 15,610,400.08 20,467,841.6
Europe
%Share Of Continent 23.0 18.8 21.1 19.4 22.1 20.0 18.4 21.4 21.9 19.7 18.0 Austria 365.7 1,297.4 1,644.6 1,735.5 4,310.4 2,931.2 22,747.8 22,995.8 6,572.3 2,199.9 678.3 Belgium 766,865.8 1,129,952.5 1,206,977.6 1,025,131.4 1,087,850.9 1,182,982.5 1,436,499.1 1,965,237.5 1,815,142.9 1,885,848.0 2,803,691.9 Bulgaria 9,100.7 17,775.7 40,564.4 82,919.2 99,420.1 86,949.0 43,611.4 42,637.1 91,753.3 80,097.1 96,294.6 Cyprus 1,208.7 29.6 2,392.2 3,217.3 5,007.8 640.5 151.2 1,175.9 17,019.5 14,580.4 16,821.9 Czech Republic 5,564.4 3,925.4 7,320.4 5,569.1 13,779.0 21,577.7 22,939.8 18,599.1 4,910.2 4,466.6 2,337.2 Slovakia - - - 1,897.5 4,395.7 1,466.6 4,072.5 7,076.4 2,144.5 1,552.8 805.1 Denmark 18,362.4 14,816.2 35,758.1 32,455.9 17,723.0 20,802.4 30,025.0 28,201.3 25,631.4 32,806.9 32,645.8 Finland 38,401.9 157,776.1 87,678.9 51,661.1 80,304.0 90,939.5 90,178.8 123,908.3 110,724.0 91,036.7 118,222.5 France 505,675.0 823,513.2 812,971.3 530,534.4 877,613.3 682,717.6 807,422.0 827,504.6 717,334.7 751,487.7 789,673.0 Germany 3,676,129.0 5,412,655.7 5,190,387.9 3,730,991.2 3,754,508.5 4,271,155.2 3,486,254.3 3,943,246.8 4,217,307.3 4,135,208.4 4,523,931.9 Greece 104,335.8 161,358.8 136,034.9 260,072.5 235,797.7 214,131.5 209,499.8 235,931.1 186,258.5 230,314.9 146,873.3 Hungary 4,664.1 6,030.5 29,465.0 34,564.1 18,858.6 15,129.0 18,955.3 16,005.0 19,660.7 10,112.7 17,500.4 Ireland 225.2 4,981.1 1,335.4 4,968.8 4,393.8 11,865.0 10,363.8 15,763.6 13,537.1 17,485.0 4,780.1 Italy 767,672.2 1,830,342.8 1,265,069.2 1,127,453.5 1,244,816.9 1,071,373.1 1,101,650.8 1,347,709.3 1,442,089.8 1,359,779.2 1,494,410.9 Netherlands 2,325,158.7 3,589,200.5 3,513,356.8 3,160,616.3 3,899,530.0 3,910,613.0 3,911,035.2 4,177,990.4 5,256,676.3 7,828,660.8 11,179,122.0 Norway 83,421.5 114,266.4 152,810.3 141,325.7 202,256.0 193,648.3 190,592.2 184,970.7 162,162.0 312,830.2 374,409.1 Poland 20,903.7 10,005.3 2,097.0 17,660.3 23,192.2 18,930.3 9,048.4 13,435.8 18,237.2 23,765.7 24,019.7 Portugal 13,224.5 10,264.5 58,441.4 58,595.2 107,108.4 70,872.1 127,631.2 156,689.8 210,638.0 173,970.4 241,431.3 Rumania 26,297.6 64,555.6 79,944.9 62,136.7 63,661.9 35,255.4 12,665.6 23,638.2 20,038.6 11,055.3 19,221.3 Spain 82,768.8 202,110.6 278,937.8 188,107.6 157,484.0 312,381.6 266,256.9 262,739.3 406,304.2 513,868.4 521,805.4 Sweden 345,076.1 631,746.6 435,154.5 264,471.8 307,877.4 333,582.0 266,867.3 263,089.4 188,083.3 156,700.1 208,700.3 Switzerland 4,876,617.7 8,672,031.8 9,644,798.9 9,439,555.7 7,895,981.9 6,490,540.8 5,266,886.0 4,714,821.8 2,005,549.0 701,171.4 18,502,394.7 Turkey 448,459.6 793,508.0 918,743.3 1,460,875.2 1,267,997.9 854,569.2 463,675.1 659,682.4 1,163,249.4 1,066,064.8 1,163,636.0 Ukraine 1,647.3 549.2 3,605.7 1,288.6 1,569.6 9,366.3 14,853.7 24,420.6 27,800.3 42,717.8 56,395.9 United Kingdom 790,362.3 1,036,992.2 804,000.1 916,862.0 888,555.1 806,313.4 1,069,053.4 1,290,346.0 1,088,894.0 1,179,983.5 1,112,511.1 Russia 87,990.9 170,085.7 210,565.2 289,418.9 405,160.0 283,476.8 289,381.7 386,108.6 313,363.4 399,161.5 430,203.7 Yugoslavia - - - - - - - - - - - Others 32,888.7 129,769.9 228,751.3 106,316.3 121,332.5 270,792.0 639,646.5 1,181,451.6 466,267.8 1,105,005.9 1,255,152.2 Total 15,033,388.3 24,988,711.1 25,148,807.1 23,000,401.7 22,790,486.7 21,265,002.1 19,811,964.8 21,935,376.3 19,997,349.8 22,131,932.3 45,137,669.7 %Share Of Continent 43.8 49.7 44.7 41.4 35.2 36.0 33.1 32.4 27.0 28.0 39.8
America
America Brazil - - - 50.0 - 8,764.8 9,178.4 9,179.6 163.0 77.1 Canada 115,069.8 173,658.6 167,388.9 166,782.8 214,767.3 216,338.4 268,404.1 270,038.6 477,155.3 382,747.5 556,491.0 Cuba - - - 325.5 15,043.2 - - - - - - Mexico 15,924.2 41,359.7 21,189.4 15,661.3 12,529.3 37,776.3 40,458.2 63,779.1 103,708.1 120,383.8 74,524.9 United States 1,387,899.5 1,571,684.8 1,741,318.4 2,223,193.5 2,413,259.7 3,913,895.0 3,733,304.1 4,317,231.5 6,565,250.9 6,071,240.4 7,994,968.3 Others 40,185.0 165,850.0 147,274.5 66,745.5 886,388.5 189,789.5 231,818.7 458,804.3 682,316.7 2,744,376.7 1,374,096.1 Total 1,559,078.4 1,952,553.1 2,076,859.0 2,472,758.7 3,541,988.1 4,366,563.9 4,283,163.5 5,119,033.1 7,828,594.0 9,318,825.6 10,000,080.3 %Share Of Continent 4.5 3.9 3.7 4.5 5.5 7.4 7.2 7.6 10.6 11.8 8.8
Asia
China, Mainland 3,330,807.6 4,764,263.2 5,167,985.4 5,682,920.3 8,071,388.2 6,145,483.9 7,498,265.1 5,111,009.8 4,754,322.7 3,152,537.0 2,538,974.1
China, Taiwan 34,908.6 34,265.7 44,820.6 114,825.8 86,264.9 134,753.6 242,155.2 324,580.5 376,886.5 449,378.2 787,312.2 Hong Kong 98,715.7 378,664.7 523,566.5 655,428.0 342,188.3 434,907.0 390,835.7 419,795.4 394,923.7 254,788.1 552,168.0 India 401,662.3 553,031.3 667,923.1 659,101.4 947,722.2 1,323,550.6 1,440,185.8 1,168,606.9 1,743,919.5 2,978,534.4 1,511,613.3 Indonesia 131,343.7 219,306.2 260,365.2 442,638.8 579,643.5 419,364.5 581,396.8 575,381.8 990,066.8 750,329.4 931,170.3 Israel 752,915.3 1,079,551.0 1,112,383.2 1,822,061.3 2,016,939.4 1,697,745.0 1,366,387.4 1,487,480.1 2,801,566.2 3,184,293.1 2,919,321.9 Japan 535,178.4 596,903.3 1,260,749.0 1,423,109.6 1,884,123.0 1,388,756.3 1,541,929.9 2,233,317.5 2,711,869.3 3,564,930.5 3,350,803.2 N.Korea, Pdrk 16,724.9 54,732.0 24,451.6 40,602.6 223.3 10,146.1 31,494.6 17,897.9 12,521.0 2,846.0 464.9 S.Korea 132,137.3 235,899.3 336,747.5 428,910.5 660,360.4 902,688.1 1,114,526.1 1,224,971.5 1,242,317.8 1,440,765.2 2,190,959.0 Kuwait 9,424.2 45,894.4 38,566.8 53,491.8 54,954.6 59,591.3 28,418.5 36,687.4 94,016.2 123,712.4 141,617.2 Lebanon 10,467.2 79,992.5 41,232.7 104,309.0 90,398.2 15,787.8 16,460.4 30,659.0 61,491.5 65,805.5 37,592.1 Malaysia 9,871.6 5,929.0 12,398.4 57,837.7 45,580.5 5,556.5 107,335.2 78,417.2 29,316.4 64,445.6 230,619.0 Pakistan 333,743.0 192,626.5 768,074.1 896,279.3 678,817.2 855,052.2 1,441,769.4 1,084,808.0 304,739.1 61,784.5 688,547.0 Saudi Arabia 2,057,646.6 2,837,432.3 3,085,698.2 3,075,268.7 3,836,761.6 4,028,128.5 3,981,781.2 4,400,225.0 4,974,581.1 5,667,200.5 7,175,544.1 Singapore 90,801.2 46,255.1 27,476.5 14,236.7 22,061.2 204,215.6 128,152.6 93,295.4 227,603.6 955,530.0 1,608,022.8 Yemen 263,614.8 342,272.8 379,117.3 571,866.5 734,790.4 439,271.6 362,192.6 456,992.0 1,180,754.7 1,697,120.6 1,047,539.2 Thailand 35,140.8 155,088.6 140,299.9 147,971.0 111,444.1 105,215.7 94,324.3 87,940.9 152,740.6 121,436.1 28,623.0 UAE 1,119,157.4 1,284,684.7 1,340,649.8 1,395,130.2 1,931,357.2 1,791,062.6 1,982,406.3 2,694,755.9 3,093,574.6 3,695,524.5 5,430,018.1 Others 370,393.0 846,426.7 1,644,761.6 1,320,681.0 1,550,549.5 1,160,854.1 1,879,038.7 3,985,634.2 4,174,926.4 3,200,481.5 5,990,857.1 Total 9,737,177.2 13,654,330.2 16,785,231.9 18,906,670.1 23,645,567.4 21,122,130.8 24,229,055.8 25,512,456.4 29,322,137.8 31,431,443.1 37,161,766.5 %Share Of Continent 28.3 27.1 29.8 34.1 36.5 35.8 40.5 37.7 39.6 39.7 32.7
Oceania Australia 100,714.1 199,586.8 332,554.2 246,875.7 379,097.3 417,653.3 330,080.8 473,534.0 443,828.2 516,438.5 528,841.3 Others 15,655.1 55,913.1 67,670.3 127,756.1 77,090.7 84,325.8 157,422.4 112,992.7 181,580.2 122,034.7 197,213.0 Total 116,369.2 255,499.9 400,224.5 374,631.7 455,711.7 501,979.2 487,503.3 586,526.7 625,408.4 638,473.2 726,054.2 %Share Of Continent 0.3 0.5 0.7 0.7 0.7 0.8 0.8 0.9 0.8 0.8 0.6 Unspecified - - - - 0 0 0Grand Total 34,353,821.8 50,326,683.5 56,276,324.1 55,501,084.2 64,762,746.5 59,071,421.3 59,838,549.1 67,655,057.8 73,979,052.1 79,131,074.3 113,493,412.3
Source: Ethiopian Customs Authority. Note1: Data for the year 2013 and 2014 is based on updated data from Ethiopian Revenue and Customs Authority Note2: The data for Czechoslovakia before 2013 represents the sum of Czech republic and Slovakia

140 | Fourth Quarter 2020/21
National Bank of Ethiopia Quarterly Bulletin
Table 23 B: Ethiopia: Direction of External Trade: IMPORT(In thousands of Birr )
Continents Country 2011 2012 2013 2014 2015 2016 2017 2018 2019 2020
Africa:
Djibouti 152.1 4,634.1 1,880.1 19,785.9 7,252.7 4,050,783.9 13.9 1,374.8 14,392.9 642,854.3 2,266,288.6 Egypt 1,351,284.9 3,202.1 1,777,945.9 1,990,237.8 3,593,112.7 11,128.5 4,071,335.1 4,346,257.9 8,437,358.5 6,033,339.4 10,410,681.4 Ghana 3,387.4 546,341.8 2,384.4 5,687.9 1,666.1 738,056.4 2,514.6 9,412.4 3,362.3 5,384.8 24,816.0 Kenya 427,681.5 290,467.0 678,285.5 551,882.2 801,793.8 738,056.4 676,008.7 835,401.2 1,028,955.8 2,216,326.1 1,895,402.8 Libya 263,603.2 290,467.0 - 263,165.0 - - 2.3 0.7 - - - Nigeria 656.3 134.8 12,412.0 82,933.2 62,055.7 220,674.6 45,219.0 940,652.6 97,234.5 3,924.2 4,438.6 Ruanda 0.6 - 28.8 378.2 59.7 32.9 68,067.4 731.4 354.6 929.2 4,365.6 Sudan 1,562,899.0 2,452,191.1 1,161,127.1 136,245.1 4,366,290.2 2,192,155.2 1,549,332.4 2,467,773.4 2,411,817.5 2,512,810.8 2,313,690.9 Tanzania 14,984.1 7,469.7 30,576.6 2,930.4 127,120.4 132,600.2 103,133.2 44,692.5 67,959.8 141,184.8 137,235.5 Uganda 8,266.7 4,869.5 1,561.2 5,177.3 3,125.9 7,381.5 6,962.2 5,846.1 18,620.8 14,951.7 78,110.9 Zambia 395.8 378.6 56.6 1,028.0 89,519.4 482.3 11,160.1 9,857.4 8,308.6 14,692.0 9,814.4 Others 2,571,172.1 3,324,070.6 5,564,554.6 2,636,616.0 4,880,495.6 8,224,429.0 8,258,583.7 13,223,694.2 13,817,153.2 15,946,009.4 20,369,845.5 Total 6,204,483.8 6,924,226.3 9,230,813.0 5,696,067.2 13,932,492.0 15,584,248.5 14,792,332.6 21,885,694.7 25,905,518.3 27,532,406.5 37,514,690.3
Europe:
Austria 274,769.7 196,218.2 586,106.3 560,571.4 572,382.6 1,027,145.6 1,604,322.8 1,485,372.3 1,036,295.5 1,073,524.5 630,258.4 Belgium 1,237,381.5 1,446,630.4 2,645,543.2 1,798,980.7 4,218,543.5 5,435,019.7 5,044,164.5 4,151,772.7 5,753,624.6 8,634,959.5 5,848,999.6 Bulgaria 794,573.9 405,830.6 86,186.4 338,016.0 143,721.4 1,537,581.6 683,870.1 905,021.2 520,586.6 1,261,450.1 411,435.9 Cyprus 76,735.5 89,509.1 88,807.2 234,484.2 150,578.9 115,078.1 117,156.1 137,993.8 137,000.0 223,774.3 165,931.3 Czechoslovakia (former name) 50,204.8 191,298.4 90,640.3 118,980.3 1,130,726.8 276,843.1 531,941.0 561,777.1 725,051.0 595,259.1 481,128.9
Czech republic - - - - 1,012,206.1 236,047.0 441,959.6 531,412.2 591,755.2 521,779.0 448,591.6 Slovakia - - - - 118,520.7 40,796.1 89,981.4 30,364.9 133,295.8 73,480.1 32,537.3 Denmark 253,713.0 470,115.2 488,523.0 305,449.6 824,909.0 694,246.2 715,981.1 537,217.7 1,200,810.1 1,249,496.7 1,479,672.1 Finland 82,697.1 103,977.0 320,249.9 189,685.0 177,056.2 155,906.3 350,087.1 808,559.9 302,979.1 194,563.8 109,262.7 France 1,405,956.8 2,313,930.4 3,614,646.3 2,480,592.3 2,351,867.2 3,823,770.8 4,684,217.9 4,431,486.0 5,270,635.7 4,410,731.7 8,664,554.7 Germany 2,709,739.9 2,898,011.6 3,199,430.5 4,229,516.1 7,249,151.5 6,806,205.2 7,859,546.7 5,771,781.8 8,546,015.1 9,385,651.8 9,242,912.0 Greece 96,373.3 180,894.2 140,476.2 143,842.2 350,442.3 405,742.7 528,971.4 419,409.9 175,760.4 187,627.4 209,094.9 Hungary 47,255.7 86,698.4 212,739.3 154,821.1 294,461.0 490,887.6 530,673.3 325,514.2 426,822.1 378,765.9 513,225.0 Ireland 369,445.2 384,656.8 362,766.1 497,656.2 573,979.2 716,987.1 775,362.0 914,646.1 1,052,153.7 1,368,277.1 1,103,439.6 Italy 5,423,537.9 5,999,479.7 8,468,614.5 8,475,248.1 9,854,864.6 10,476,893.6 15,784,350.7 15,601,881.7 10,859,889.2 8,322,257.7 10,773,755.9 Netherlands 1,136,416.0 1,404,726.9 1,630,693.2 3,813,241.8 2,492,065.9 4,604,402.8 3,982,518.3 5,161,373.9 6,435,861.3 7,062,343.8 3,274,060.8 Norway 36,995.9 34,421.8 47,457.5 71,440.7 58,782.9 79,266.8 162,289.4 84,019.0 99,508.3 87,383.6 187,565.8 Poland 88,240.1 100,915.1 273,902.6 254,707.4 579,322.1 735,144.5 2,284,185.2 874,973.5 808,251.5 1,085,160.2 1,456,189.1 Portugal 107,604.0 39,090.7 77,822.2 136,508.8 215,656.2 318,933.8 243,435.8 332,054.0 267,455.3 379,815.9 243,893.1 Rumania 246,874.1 21,137.4 26,566.6 138,938.5 1,685,883.2 443,410.0 4,500,592.8 2,236,388.5 3,373,800.2 2,721,518.9 1,126,385.7 Spain 1,247,190.3 1,446,618.8 2,106,719.9 1,962,063.7 2,678,244.8 2,783,107.6 2,871,957.4 3,311,894.0 1,680,175.3 2,455,395.0 2,235,461.3 Sweden 921,184.7 1,265,562.3 1,139,661.0 1,323,169.7 844,072.1 13,232,214.3 9,427,026.6 1,154,426.4 938,218.8 1,884,142.5 1,169,306.1 Switzerland 480,341.9 474,076.0 621,634.5 783,765.0 904,299.4 1,194,286.5 1,223,807.0 1,465,077.7 1,215,947.3 2,087,148.6 2,463,804.1 Turkey 3,212,576.1 5,842,462.2 6,526,492.5 8,409,563.5 8,629,004.2 10,918,514.7 12,682,665.1 14,296,491.7 16,710,238.8 17,683,063.8 28,321,826.8 United kingdom 1,219,805.9 1,830,282.8 1,514,325.3 2,006,481.9 3,592,921.5 3,863,439.0 4,557,294.9 4,709,876.8 8,281,310.1 9,569,003.6 8,604,611.7
Russia 1,301,202.6 4,546,375.5 2,329,520.8 222,543.3 2,575,137.1 1,745,182.4 3,579,267.5 1,245,806.0 3,568,472.1 3,009,797.2 1,759,881.9 Yugoslavia 15,263.3 1,055.7 4.8 8.3 54.9 - 0.0 0.3 - - - Other 1,491,376.0 3,090,900.4 7,016,703.0 4,415,093.2 5,846,854.7 4,458,373.1 5,279,114.8 3,938,166.3 5,411,755.1 10,222,903.5 10,641,686.1 Total 24,327,455.4 34,864,875.6 43,616,233.1 43,065,369.1 57,994,983.5 76,615,426.4 90,536,740.4 74,862,982.4 84,798,617.1 95,534,016.3 101,118,343.6
America
Brazil 1,777,894.9 1,319,826.6 2,478,504.6 1,895,842.2 1,496,396.6 1,083,673.4 1,475,502.6 4,488,842.1 2,226,255.8 716,227.8 1,347,349.3 Canada 188,981.3 362,112.3 266,442.2 535,973.0 1,196,802.2 753,274.2 1,451,315.7 1,353,867.2 2,042,114.6 1,744,497.1 2,325,081.5 Cuba 4,401.7 927.4 306.3 3,419.1 1,558.3 3,976.4 1,294.5 15,130.0 1,851.3 2,641.6 2,031.7 Mexico 22,287.0 30,857.6 37,034.6 57,572.7 180,610.0 159,440.1 126,433.0 249,402.2 204,860.2 224,104.3 284,611.6 United states 6,307,462.0 6,964,847.9 6,741,540.1 9,427,071.5 15,380,630.1 18,383,911.5 28,006,664.4 30,200,872.0 43,410,573.0 25,735,703.1 28,278,445.3 Others 89,336.7 807,104.4 1,991,585.8 177,236.2 226,806.2 684,766.3 303,572.4 201,799.7 270,818.2 386,632.9 4,160,665.7 Total 8,390,363.6 9,485,676.2 11,515,413.5 12,097,114.8 18,482,803.4 21,069,041.8 31,364,782.7 36,509,913.2 48,156,473.2 28,809,806.7 36,398,185.0
Asia:
China, mainland 20,602,808.4 24,964,592.5 38,886,267.6 50,218,738.1 100,672,421.4 127,862,137.6 112,557,147.3 107,569,979.9 108,861,577.7 113,000,343.3 119,518,584.0
China, Taiwan 376,922.5 494,760.7 1,070,584.7 1,106,850.9 1,333,948.4 1,427,654.5 1,106,997.8 1,297,890.5 1,284,754.0 2,229,952.5 2,336,180.0
Hong Kong 54,097.6 24,128.9 58,718.2 54,377.6 80,091.6 276,928.2 1,370,238.4 2,768,923.7 842,521.2 182,565.5 1,165,685.5 India 8,485,196.5 12,394,362.3 17,878,819.6 21,273,934.9 21,787,752.1 24,344,942.9 28,557,164.8 24,233,274.2 30,907,887.7 36,796,683.5 51,369,798.5 Israel 157,777.6 273,165.9 567,716.2 298,154.8 507,607.3 614,145.1 548,689.5 1,792,675.0 616,386.7 711,291.6 592,680.2 Japan 6,609,442.1 7,450,651.8 8,341,760.9 9,462,530.3 12,180,142.5 15,185,118.0 14,472,925.3 14,722,312.6 11,330,510.1 9,260,462.8 3,990,031.8 N.korea, pdrk 57,079.2 216,777.9 268,093.4 185,433.0 103,493.8 107,552.8 91,536.9 531,235.1 48,542.2 529,388.8 116,388.0 S.korea 1,297,821.7 2,686,000.2 3,835,763.8 3,118,319.6 4,771,125.3 4,962,100.1 3,961,888.7 5,588,986.2 5,048,443.2 4,835,162.6 6,559,501.4 Kuwait 43,653.2 3,749,483.5 12,995,081.0 4,762,763.2 13,571,707.6 13,326,143.0 13,519,748.9 22,424,256.5 43,310,223.7 46,876,977.5 12,333,071.7 Lebanon 19,775.1 28,525.2 51,159.7 42,125.5 80,978.2 167,754.4 106,810.2 842,739.1 44,331.3 40,490.3 26,980.9 Malaysia 3,130,091.0 4,397,300.9 3,014,971.9 2,718,544.1 2,864,220.8 3,588,092.8 6,251,135.7 7,515,151.6 10,079,304.3 5,928,016.9 10,744,285.1 Pakistan 717,542.9 1,824,377.7 878,501.4 964,168.7 1,175,982.7 1,011,155.3 746,091.4 1,937,665.6 2,555,083.2 814,628.1 1,261,370.2 Saudi arabia 14,585,404.2 15,067,036.6 28,393,519.1 16,170,927.0 24,724,120.4 10,284,257.6 6,497,893.0 12,937,477.5 6,956,990.3 10,277,787.4 12,108,482.4 Singapore 73,829.9 68,565.3 93,538.1 88,852.5 236,105.2 323,455.3 516,905.1 446,466.6 420,391.9 1,526,703.7 9,665,483.2 Yemen 115,687.0 217,722.0 469,194.0 214,434.9 661,267.0 132,071.4 91,481.4 434,498.0 51,446.3 67,926.9 115,865.8 Thailand 1,695,555.9 2,157,711.7 2,455,430.1 3,140,867.6 4,079,354.5 3,079,839.3 2,977,140.6 4,782,068.8 4,745,788.4 3,287,134.1 5,217,010.0 Others 21,375,395.7 30,072,336.9 24,120,693.6 49,942,427.1 21,445,674.0 23,351,348.7 26,277,780.3 35,575,126.7 33,814,176.7 34,876,835.4 45,287,736.4 Total 79,398,080.7 106,087,500.1 143,379,813.3 163,763,449.8 210,275,992.7 230,044,697.0 219,651,575.4 245,400,727.6 260,918,358.8 271,242,350.8 282,409,134.9
Oceania:Australia 308,547.5 312,015.7 243,040.2 287,605.2 140,252.3 215,659.7 327,371.5 471,334.6 236,354.3 183,256.3 454,217.0 Others 57,613.8 47,482.6 116,775.0 58,518.3 220,646.7 120,412.3 136,368.6 - 125,049.3 134,316.0 156,031.4 Total 366,161.3 359,498.3 359,815.2 346,123.5 360,899.1 336,072.0 463,740.1 471,334.6 361,403.5 317,572.3 610,248.4
Grand Total 118,686,544.73 157,721,776.48 208,102,088.03 224,968,124.45 301,047,170.69 343,649,485.7 356,809,171.2 379,130,652.5 420,140,371.0 423,436,152.7 458,050,602.2
Source: Ethiopian Customs Authority

Fourth Quarter 2020/21 | 141
National Bank of Ethiopia Quarterly Bulletin
Table 23 B: Ethiopia: Direction of External Trade: IMPORT(In thousands of Birr )
Continents Country 2011 2012 2013 2014 2015 2016 2017 2018 2019 2020
Africa:
Djibouti 152.1 4,634.1 1,880.1 19,785.9 7,252.7 4,050,783.9 13.9 1,374.8 14,392.9 642,854.3 2,266,288.6 Egypt 1,351,284.9 3,202.1 1,777,945.9 1,990,237.8 3,593,112.7 11,128.5 4,071,335.1 4,346,257.9 8,437,358.5 6,033,339.4 10,410,681.4 Ghana 3,387.4 546,341.8 2,384.4 5,687.9 1,666.1 738,056.4 2,514.6 9,412.4 3,362.3 5,384.8 24,816.0 Kenya 427,681.5 290,467.0 678,285.5 551,882.2 801,793.8 738,056.4 676,008.7 835,401.2 1,028,955.8 2,216,326.1 1,895,402.8 Libya 263,603.2 290,467.0 - 263,165.0 - - 2.3 0.7 - - - Nigeria 656.3 134.8 12,412.0 82,933.2 62,055.7 220,674.6 45,219.0 940,652.6 97,234.5 3,924.2 4,438.6 Ruanda 0.6 - 28.8 378.2 59.7 32.9 68,067.4 731.4 354.6 929.2 4,365.6 Sudan 1,562,899.0 2,452,191.1 1,161,127.1 136,245.1 4,366,290.2 2,192,155.2 1,549,332.4 2,467,773.4 2,411,817.5 2,512,810.8 2,313,690.9 Tanzania 14,984.1 7,469.7 30,576.6 2,930.4 127,120.4 132,600.2 103,133.2 44,692.5 67,959.8 141,184.8 137,235.5 Uganda 8,266.7 4,869.5 1,561.2 5,177.3 3,125.9 7,381.5 6,962.2 5,846.1 18,620.8 14,951.7 78,110.9 Zambia 395.8 378.6 56.6 1,028.0 89,519.4 482.3 11,160.1 9,857.4 8,308.6 14,692.0 9,814.4 Others 2,571,172.1 3,324,070.6 5,564,554.6 2,636,616.0 4,880,495.6 8,224,429.0 8,258,583.7 13,223,694.2 13,817,153.2 15,946,009.4 20,369,845.5 Total 6,204,483.8 6,924,226.3 9,230,813.0 5,696,067.2 13,932,492.0 15,584,248.5 14,792,332.6 21,885,694.7 25,905,518.3 27,532,406.5 37,514,690.3
Europe:
Austria 274,769.7 196,218.2 586,106.3 560,571.4 572,382.6 1,027,145.6 1,604,322.8 1,485,372.3 1,036,295.5 1,073,524.5 630,258.4 Belgium 1,237,381.5 1,446,630.4 2,645,543.2 1,798,980.7 4,218,543.5 5,435,019.7 5,044,164.5 4,151,772.7 5,753,624.6 8,634,959.5 5,848,999.6 Bulgaria 794,573.9 405,830.6 86,186.4 338,016.0 143,721.4 1,537,581.6 683,870.1 905,021.2 520,586.6 1,261,450.1 411,435.9 Cyprus 76,735.5 89,509.1 88,807.2 234,484.2 150,578.9 115,078.1 117,156.1 137,993.8 137,000.0 223,774.3 165,931.3 Czechoslovakia (former name) 50,204.8 191,298.4 90,640.3 118,980.3 1,130,726.8 276,843.1 531,941.0 561,777.1 725,051.0 595,259.1 481,128.9
Czech republic - - - - 1,012,206.1 236,047.0 441,959.6 531,412.2 591,755.2 521,779.0 448,591.6 Slovakia - - - - 118,520.7 40,796.1 89,981.4 30,364.9 133,295.8 73,480.1 32,537.3 Denmark 253,713.0 470,115.2 488,523.0 305,449.6 824,909.0 694,246.2 715,981.1 537,217.7 1,200,810.1 1,249,496.7 1,479,672.1 Finland 82,697.1 103,977.0 320,249.9 189,685.0 177,056.2 155,906.3 350,087.1 808,559.9 302,979.1 194,563.8 109,262.7 France 1,405,956.8 2,313,930.4 3,614,646.3 2,480,592.3 2,351,867.2 3,823,770.8 4,684,217.9 4,431,486.0 5,270,635.7 4,410,731.7 8,664,554.7 Germany 2,709,739.9 2,898,011.6 3,199,430.5 4,229,516.1 7,249,151.5 6,806,205.2 7,859,546.7 5,771,781.8 8,546,015.1 9,385,651.8 9,242,912.0 Greece 96,373.3 180,894.2 140,476.2 143,842.2 350,442.3 405,742.7 528,971.4 419,409.9 175,760.4 187,627.4 209,094.9 Hungary 47,255.7 86,698.4 212,739.3 154,821.1 294,461.0 490,887.6 530,673.3 325,514.2 426,822.1 378,765.9 513,225.0 Ireland 369,445.2 384,656.8 362,766.1 497,656.2 573,979.2 716,987.1 775,362.0 914,646.1 1,052,153.7 1,368,277.1 1,103,439.6 Italy 5,423,537.9 5,999,479.7 8,468,614.5 8,475,248.1 9,854,864.6 10,476,893.6 15,784,350.7 15,601,881.7 10,859,889.2 8,322,257.7 10,773,755.9 Netherlands 1,136,416.0 1,404,726.9 1,630,693.2 3,813,241.8 2,492,065.9 4,604,402.8 3,982,518.3 5,161,373.9 6,435,861.3 7,062,343.8 3,274,060.8 Norway 36,995.9 34,421.8 47,457.5 71,440.7 58,782.9 79,266.8 162,289.4 84,019.0 99,508.3 87,383.6 187,565.8 Poland 88,240.1 100,915.1 273,902.6 254,707.4 579,322.1 735,144.5 2,284,185.2 874,973.5 808,251.5 1,085,160.2 1,456,189.1 Portugal 107,604.0 39,090.7 77,822.2 136,508.8 215,656.2 318,933.8 243,435.8 332,054.0 267,455.3 379,815.9 243,893.1 Rumania 246,874.1 21,137.4 26,566.6 138,938.5 1,685,883.2 443,410.0 4,500,592.8 2,236,388.5 3,373,800.2 2,721,518.9 1,126,385.7 Spain 1,247,190.3 1,446,618.8 2,106,719.9 1,962,063.7 2,678,244.8 2,783,107.6 2,871,957.4 3,311,894.0 1,680,175.3 2,455,395.0 2,235,461.3 Sweden 921,184.7 1,265,562.3 1,139,661.0 1,323,169.7 844,072.1 13,232,214.3 9,427,026.6 1,154,426.4 938,218.8 1,884,142.5 1,169,306.1 Switzerland 480,341.9 474,076.0 621,634.5 783,765.0 904,299.4 1,194,286.5 1,223,807.0 1,465,077.7 1,215,947.3 2,087,148.6 2,463,804.1 Turkey 3,212,576.1 5,842,462.2 6,526,492.5 8,409,563.5 8,629,004.2 10,918,514.7 12,682,665.1 14,296,491.7 16,710,238.8 17,683,063.8 28,321,826.8 United kingdom 1,219,805.9 1,830,282.8 1,514,325.3 2,006,481.9 3,592,921.5 3,863,439.0 4,557,294.9 4,709,876.8 8,281,310.1 9,569,003.6 8,604,611.7
Russia 1,301,202.6 4,546,375.5 2,329,520.8 222,543.3 2,575,137.1 1,745,182.4 3,579,267.5 1,245,806.0 3,568,472.1 3,009,797.2 1,759,881.9 Yugoslavia 15,263.3 1,055.7 4.8 8.3 54.9 - 0.0 0.3 - - - Other 1,491,376.0 3,090,900.4 7,016,703.0 4,415,093.2 5,846,854.7 4,458,373.1 5,279,114.8 3,938,166.3 5,411,755.1 10,222,903.5 10,641,686.1 Total 24,327,455.4 34,864,875.6 43,616,233.1 43,065,369.1 57,994,983.5 76,615,426.4 90,536,740.4 74,862,982.4 84,798,617.1 95,534,016.3 101,118,343.6
America
Brazil 1,777,894.9 1,319,826.6 2,478,504.6 1,895,842.2 1,496,396.6 1,083,673.4 1,475,502.6 4,488,842.1 2,226,255.8 716,227.8 1,347,349.3 Canada 188,981.3 362,112.3 266,442.2 535,973.0 1,196,802.2 753,274.2 1,451,315.7 1,353,867.2 2,042,114.6 1,744,497.1 2,325,081.5 Cuba 4,401.7 927.4 306.3 3,419.1 1,558.3 3,976.4 1,294.5 15,130.0 1,851.3 2,641.6 2,031.7 Mexico 22,287.0 30,857.6 37,034.6 57,572.7 180,610.0 159,440.1 126,433.0 249,402.2 204,860.2 224,104.3 284,611.6 United states 6,307,462.0 6,964,847.9 6,741,540.1 9,427,071.5 15,380,630.1 18,383,911.5 28,006,664.4 30,200,872.0 43,410,573.0 25,735,703.1 28,278,445.3 Others 89,336.7 807,104.4 1,991,585.8 177,236.2 226,806.2 684,766.3 303,572.4 201,799.7 270,818.2 386,632.9 4,160,665.7 Total 8,390,363.6 9,485,676.2 11,515,413.5 12,097,114.8 18,482,803.4 21,069,041.8 31,364,782.7 36,509,913.2 48,156,473.2 28,809,806.7 36,398,185.0
Asia:
China, mainland 20,602,808.4 24,964,592.5 38,886,267.6 50,218,738.1 100,672,421.4 127,862,137.6 112,557,147.3 107,569,979.9 108,861,577.7 113,000,343.3 119,518,584.0
China, Taiwan 376,922.5 494,760.7 1,070,584.7 1,106,850.9 1,333,948.4 1,427,654.5 1,106,997.8 1,297,890.5 1,284,754.0 2,229,952.5 2,336,180.0
Hong Kong 54,097.6 24,128.9 58,718.2 54,377.6 80,091.6 276,928.2 1,370,238.4 2,768,923.7 842,521.2 182,565.5 1,165,685.5 India 8,485,196.5 12,394,362.3 17,878,819.6 21,273,934.9 21,787,752.1 24,344,942.9 28,557,164.8 24,233,274.2 30,907,887.7 36,796,683.5 51,369,798.5 Israel 157,777.6 273,165.9 567,716.2 298,154.8 507,607.3 614,145.1 548,689.5 1,792,675.0 616,386.7 711,291.6 592,680.2 Japan 6,609,442.1 7,450,651.8 8,341,760.9 9,462,530.3 12,180,142.5 15,185,118.0 14,472,925.3 14,722,312.6 11,330,510.1 9,260,462.8 3,990,031.8 N.korea, pdrk 57,079.2 216,777.9 268,093.4 185,433.0 103,493.8 107,552.8 91,536.9 531,235.1 48,542.2 529,388.8 116,388.0 S.korea 1,297,821.7 2,686,000.2 3,835,763.8 3,118,319.6 4,771,125.3 4,962,100.1 3,961,888.7 5,588,986.2 5,048,443.2 4,835,162.6 6,559,501.4 Kuwait 43,653.2 3,749,483.5 12,995,081.0 4,762,763.2 13,571,707.6 13,326,143.0 13,519,748.9 22,424,256.5 43,310,223.7 46,876,977.5 12,333,071.7 Lebanon 19,775.1 28,525.2 51,159.7 42,125.5 80,978.2 167,754.4 106,810.2 842,739.1 44,331.3 40,490.3 26,980.9 Malaysia 3,130,091.0 4,397,300.9 3,014,971.9 2,718,544.1 2,864,220.8 3,588,092.8 6,251,135.7 7,515,151.6 10,079,304.3 5,928,016.9 10,744,285.1 Pakistan 717,542.9 1,824,377.7 878,501.4 964,168.7 1,175,982.7 1,011,155.3 746,091.4 1,937,665.6 2,555,083.2 814,628.1 1,261,370.2 Saudi arabia 14,585,404.2 15,067,036.6 28,393,519.1 16,170,927.0 24,724,120.4 10,284,257.6 6,497,893.0 12,937,477.5 6,956,990.3 10,277,787.4 12,108,482.4 Singapore 73,829.9 68,565.3 93,538.1 88,852.5 236,105.2 323,455.3 516,905.1 446,466.6 420,391.9 1,526,703.7 9,665,483.2 Yemen 115,687.0 217,722.0 469,194.0 214,434.9 661,267.0 132,071.4 91,481.4 434,498.0 51,446.3 67,926.9 115,865.8 Thailand 1,695,555.9 2,157,711.7 2,455,430.1 3,140,867.6 4,079,354.5 3,079,839.3 2,977,140.6 4,782,068.8 4,745,788.4 3,287,134.1 5,217,010.0 Others 21,375,395.7 30,072,336.9 24,120,693.6 49,942,427.1 21,445,674.0 23,351,348.7 26,277,780.3 35,575,126.7 33,814,176.7 34,876,835.4 45,287,736.4 Total 79,398,080.7 106,087,500.1 143,379,813.3 163,763,449.8 210,275,992.7 230,044,697.0 219,651,575.4 245,400,727.6 260,918,358.8 271,242,350.8 282,409,134.9
Oceania:Australia 308,547.5 312,015.7 243,040.2 287,605.2 140,252.3 215,659.7 327,371.5 471,334.6 236,354.3 183,256.3 454,217.0 Others 57,613.8 47,482.6 116,775.0 58,518.3 220,646.7 120,412.3 136,368.6 - 125,049.3 134,316.0 156,031.4 Total 366,161.3 359,498.3 359,815.2 346,123.5 360,899.1 336,072.0 463,740.1 471,334.6 361,403.5 317,572.3 610,248.4
Grand Total 118,686,544.73 157,721,776.48 208,102,088.03 224,968,124.45 301,047,170.69 343,649,485.7 356,809,171.2 379,130,652.5 420,140,371.0 423,436,152.7 458,050,602.2
Source: Ethiopian Customs Authority
Tabl
e 24
: Dire
ctio
n of
Trad
e**
(in m
illion
s of U
SD)
Cou
ntry
of O
rigin
2018
/19
2019
/20
2020
/21
Perc
enta
ge C
hang
eQ
IQ
IIQ
IIIQ
IVQ
IQ
IIQ
IIIQ
IVQ
IQ
IIQ
IIIQ
IV
Expo
rt Im
port
Expo
rt Im
port
Expo
rt Im
port
Expo
rt Im
port
Expo
rt Im
port
Expo
rt Im
port
Expo
rt Im
port
Expo
rt Im
port
Expo
rt Im
port
Expo
rt Im
port
Expo
rt Im
port
Expo
rt Im
port
Expo
rt Im
port
YZ
AB
CD
E F
GH
IJ
KL
MN
OP
QR
ST
UV
W=U
/MX=
V/N
Afri
ca:
Djib
outi
36.
9 0
.2
34.
0 0
.1
31.
4 2
.0
26.
2 7
.1
35.
2 7
.7
25.
9 5
.3
27.
5 4
.7
29.
4 2
0.5
21.
0 2
2.8
20.
8 1
6.0
27.
9 1
8.6
26.
8 8
1.8
(8.9
) 2
98.9
Eg
ypt
1.7
5
3.5
4.3
5
7.1
17.
0 6
3.8
2.4
4
9.8
0.8
4
3.3
1.0
5
1.4
2.8
9
5.3
0.7
1
02.3
1
.4
42.
4 1
.6
61.
9 1
.5
97.
0 1
.1
83.
1 5
7.4
(18.
8)G
hana
1.2
0
.0
0.3
0
.1
0.1
0
.1
0.0
0
.0
0.4
0
.1
0.1
0
.0
0.1
0
.3
0.0
0
.1
0.4
0
.1
0.1
0
.2
0.1
0
.2
0.4
2
3,20
5.1
459
.1
Keny
a 6
.2
10.
8 2
.2
10.
3 4
.3
9.3
7
.7
10.
3 6
.0
13.
0 4
.8
41.
3 2
.3
17.
4 1
.4
13.
7 1
.9
12.
0 2
.2
11.
6 2
.0
16.
4 2
.9
16.
8 1
11.9
2
2.4
Libia
- -
- -
- -
- -
- -
- -
- -
- -
- -
- -
- -
- -
Mor
occo
0.0
0
.7
0.4
0
.8
0.1
1
30.2
0
.0
182
.0
0.0
0
.0
0.1
0
.4
- 2
84.7
0
.3
140
.1
0.5
1
.4
0.9
0
.3
0.4
3
47.4
0
.5
236
.4
96.
5 6
8.8
Nig
eria
2.5
1
.4
3.8
0
.1
3.3
0
.0
2.2
0
.0
3.3
0
.1
1.7
0
.1
5.4
0
.1
0.9
0
.0
3.2
0
.0
0.5
0
.0
1.1
0
.0
1.6
0
.0
71.
0 (3
8.2)
Ruw
anda
1.1
0
.0
0.2
0
.0
0.1
-
0.0
-
0.1
0
.0
0.0
0
.0
0.1
0
.0
- 0
.1
0.5
-
0.6
-
0.1
9
.5
0.0
1
5.9
12,
290.
0 So
mal
i Lan
d -
0.1
-
0.1
-
0.4
-
0.0
-
0.3
-
0.1
-
0.1
-
0.0
-
0.1
-
0.0
-
0.0
-
0.3
8
72.1
So
mal
ia 7
0.0
- 6
6.7
- 5
9.4
- 6
1.1
- 7
8.7
- 4
8.1
- 4
7.3
- 5
6.6
- 3
4.5
- 3
3.5
- 8
1.6
- 7
4.7
- 3
1.8
#D
IV/0
!So
uth
Afri
ca 2
.0
46.
9 2
.3
53.
6 2
.5
106
.1
1.7
3
7.7
2.0
3
5.2
1.6
5
4.7
2.2
6
4.0
1.6
2
9.9
1.6
4
0.3
0.9
2
8.2
1.4
3
1.7
2.5
4
4.5
62.
7 4
8.6
Suda
n 1
4.6
9.9
2
2.2
16.
6 2
1.0
30.
6 1
0.4
24.
8 9
.8
26.
3 1
7.9
5.8
2
0.4
19.
1 2
0.0
22.
2 2
3.2
19.
4 1
9.3
6.6
1
9.1
1.2
2
3.5
2.4
1
7.4
(89.
1)Ta
nzan
ia 0
.2
0.8
0
.1
0.9
0
.2
1.0
0
.5
1.0
0
.3
1.0
0
.0
1.8
1
.1
0.9
1
.0
2.3
0
.9
0.4
0
.0
0.4
0
.0
0.2
0
.0
0.1
(9
6.7)
(95.
5)Ug
anda
0.1
0
.2
0.1
0
.4
0.1
0
.2
0.1
0
.1
0.1
0
.1
0.1
0
.1
0.1
0
.2
0.1
0
.1
0.3
0
.7
0.2
1
.1
0.1
0
.4
0.2
0
.8
310
.5
714
.5
Zam
bia
0.9
0
.0
0.3
0
.3
0.1
-
0.0
0
.5
0.3
0
.0
- 0
.0
1.8
0
.0
0.0
0
.0
2.2
0
.2
0.4
-
0.0
0
.0
0.0
0
.0
198
,637
.7
(61.
8)Ze
mba
bwe
0.1
0
.0
0.1
0
.0
0.0
0
.0
0.1
-
0.0
0
.0
0.0
-
0.0
0
.2
0.0
0
.3
0.0
-
0.4
0
.1
0.0
0
.0
0.9
0
.0
15,
770.
6 (9
8.8)
Oth
ers
5.4
3
.2
7.3
6
.7
5.7
1
.8
9.9
4
.7
10.
5 1
.2
30.
2 1
.3
43.
8 1
9.7
17.
8 1
.0
61.
8 3
.1
66.
6 1
.2
15.
9 1
.6
53.
6 1
.2
201
.0
17.
1 To
tal
142
.9
127
.7
144
.3
147
.0
145
.2
345
.5
122
.4
318
.1
147
.5
128
.2
131
.4
162
.4
154
.8
506
.9
129
.7
332
.8
153
.2
143
.0
148
.0
127
.5
151
.5
524
.3
188
.7
483
.7
45.
5 4
5.3
%Sh
are
Of C
ontin
ent
22.
75
0.0
0 2
4.68
3
.31
21.
13
9.6
9 1
6.01
9
.28
20.
40
3.4
2 2
3.28
4
.25
20.
43
13.
98
13.
76
12.
38
18.
36
4.1
1 2
0.49
3
.84
17.
15
14.
67
16.
04
12.
36
16.
55
(0.1
1)
Euro
pe:
Aus
tria
0.0
9
.3
0.0
4
.5
0.0
1
1.3
0.0
1
1.7
0.0
6
.8
0.0
7
.3
0.0
6
.3
0.0
3
.0
0.0
6
.0
0.0
2
.9
0.1
4
.5
0.0
6
.1
274
.4
104
.2
Belg
ium
19.
7 3
8.9
11.
5 1
30.2
1
0.6
48.
8 1
9.3
124
.6
22.
4 4
3.6
12.
5 7
9.8
21.
2 9
0.9
24.
4 2
7.2
20.
7 2
0.3
14.
7 3
3.7
27.
2 4
8.5
28.
9 8
7.4
18.
4 2
21.1
Bu
lgar
ia 0
.9
16.
2 0
.5
1.4
1
.2
14.
0 0
.8
13.
2 0
.5
7.0
0
.3
8.9
1
.3
0.3
0
.5
0.5
0
.6
10.
2 0
.5
0.7
0
.6
11.
2 0
.6
1.2
2
1.5
146
.1
Cyp
rus
0.2
1
.1
- 1
.0
0.1
1
.9
0.2
1
.2
0.1
1
.5
- 3
.1
0.3
1
.4
0.3
0
.7
- 1
.6
- 1
.1
- 5
.2
- 3
.0
(100
.0)
343
.4
Cze
ch R
epub
lic 0
.0
7.2
0
.1
5.5
0
.0
4.0
0
.1
9.4
0
.0
2.9
-
1.9
0
.0
9.5
0
.0
1.1
0
.0
1.4
0
.0
1.4
-
2.7
0
.1
1.8
3
,957
.8
70.
2 Sl
ovak
ia 0
.0
0.3
0
.0
0.3
-
0.5
0
.0
0.8
0
.0
0.4
0
.0
0.9
-
0.4
-
0.4
0
.0
0.1
0
.0
0.1
-
0.2
0
.0
1.1
1
78.4
D
enm
ark
0.1
7
.6
0.2
2
5.6
0.3
1
2.4
0.5
1
0.6
0.2
7
.0
0.2
1
3.2
0.2
1
3.4
0.2
7
.1
0.3
1
8.7
0.2
3
.9
0.2
7
.1
0.4
9
.2
84.
7 2
8.6
Finla
nd 1
.6
4.8
0
.1
1.9
1
.5
2.3
1
.6
0.4
0
.1
3.7
0
.0
0.3
1
.1
0.6
2
.4
1.2
0
.0
0.5
0
.0
0.8
1
.7
2.7
1
.7
3.5
(3
2.2)
189
.2
Fran
ce 6
.0
43.
2 4
.0
56.
1 3
.4
28.
6 6
.7
28.
1 6
.2
37.
0 9
.3
56.
9 5
.4
31.
0 7
.5
133
.5
5.5
5
0.8
4.4
3
6.3
5.7
4
7.6
8.0
5
5.5
7.6
(5
8.4)
Ger
man
y 3
5.5
79.
6 1
8.0
82.
9 2
2.0
79.
9 3
7.0
79.
3 4
9.2
68.
1 3
3.2
95.
5 3
6.7
75.
7 4
1.6
57.
1 2
9.8
74.
5 2
2.9
58.
1 3
9.1
45.
1 4
3.7
39.
3 4
.9
(31.
1)G
reec
e 0
.8
1.9
0
.7
1.2
2
.8
2.4
3
.4
1.1
1
.0
1.1
0
.8
1.8
1
.1
2.5
1
.2
0.9
0
.8
1.6
1
.1
1.1
1
.3
0.4
2
.7
2.8
1
30.7
2
13.2
Hu
ngar
y 0
.4
3.9
0
.2
3.8
0
.1
1.6
0
.1
3.9
0
.2
3.4
0
.0
4.1
0
.1
1.7
0
.1
4.3
0
.3
3.0
-
5.4
0
.0
2.1
0
.1
1.9
(1
4.9)
(54.
9)Ire
land
0.2
1
4.9
0.2
8
.5
0.2
1
2.6
0.2
1
0.5
0.1
1
1.0
0.1
1
2.9
0.1
8
.4
0.0
6
.6
0.0
1
0.2
0.0
6
.6
0.1
8
.7
0.0
7
.7
1,9
12.6
1
5.6
Italy
12.
6 9
1.8
5.0
9
9.0
8.0
8
5.5
17.
5 6
6.1
11.
1 7
1.9
9.2
6
3.5
7.2
7
6.9
16.
7 5
0.9
10.
8 8
3.3
8.1
9
4.0
12.
1 1
06.7
1
4.0
58.
6 (1
6.0)
15.
0 N
ethe
rland
s 4
5.1
30.
3 4
3.0
27.
6 5
3.2
20.
7 6
9.3
105
.2
81.
2 9
5.4
65.
5 2
2.3
82.
5 2
3.7
79.
2 1
3.5
78.
7 3
1.8
79.
9 2
3.8
93.
4 1
8.9
58.
6 2
3.0
(26.
0) 7
0.5
Nor
way
1.5
0
.7
1.4
1
.3
1.7
0
.8
2.6
0
.2
3.6
1
.3
2.9
0
.7
2.8
3
.0
3.0
0
.3
2.2
1
.9
2.8
0
.4
2.7
0
.8
1.7
1
.9
(42.
8) 6
21.3
Po
land
0.3
1
0.3
0.0
6
.2
0.1
1
1.5
0.1
5
.9
0.3
7
.0
0.3
1
2.8
0.1
5
.0
0.2
4
.2
0.2
8
.8
0.1
2
2.2
0.1
7
.3
0.1
1
0.8
(58.
7) 1
56.0
Po
rtuga
l 1
.2
2.6
1
.9
1.7
2
.0
3.0
2
.3
7.4
0
.6
2.0
1
.2
0.8
1
.7
2.6
1
.0
1.1
1
.2
2.7
2
.9
0.7
0
.9
1.8
0
.0
7.6
(9
9.9)
593
.4
Rum
ania
0.0
7
3.3
0.4
1
5.0
0.0
9
.9
- 3
3.1
0.1
3
8.6
0.3
1
2.2
0.3
0
.5
0.1
0
.2
0.0
3
0.9
0.2
0
.3
0.4
0
.3
0.1
7
8.8
(13.
2) 4
7,04
1.6
Spai
n 5
.2
15.
8 2
.9
22.
4 4
.8
21.
7 4
.6
15.
9 4
.2
17.
8 3
.7
28.
6 3
.7
17.
5 3
.4
17.
1 4
.6
15.
7 3
.2
13.
9 3
.0
15.
1 3
.7
19.
6 8
.0
14.
5 Sw
eden
1.5
6
.8
1.5
1
1.7
1.3
3
.1
1.6
2
4.4
1.5
2
8.3
1.0
9
.1
1.8
3
.7
1.5
1
4.9
1.4
3
.1
1.3
1
1.4
2.3
4
.3
1.5
3
.2
0.1
(7
8.8)
Switz
erla
nd 1
5.8
19.
5 4
.4
9.3
3
.8
6.8
5
.3
27.
8 7
.0
32.
3 7
.8
5.1
1
4.4
6.7
1
69.6
2
8.4
204
.4
5.8
1
32.7
2
9.4
115
.1
4.0
2
23.5
3
5.4
31.
8 2
4.7
Turk
ey 2
.6
160
.9
13.
7 1
66.4
1
9.6
137
.7
4.7
1
42.1
3
.8
151
.0
8.2
1
76.0
1
3.5
158
.0
8.5
1
26.6
4
.9
375
.5
7.0
1
47.2
8
.4
83.
8 4
.3
149
.0
(49.
3) 1
7.6
Ukra
ine
0.3
3
8.3
0.1
7
1.3
0.4
3
6.7
0.5
3
2.1
0.4
1
40.6
0
.2
106
.0
0.3
4
0.0
0.3
5
2.0
0.4
2
9.1
0.6
1
46.9
0
.6
63.
7 0
.8
163
.7
208
.6
214
.6
Unite
d Ki
ngdo
m 1
0.5
116
.5
7.6
6
9.2
11.
1 8
4.2
12.
6 5
6.6
10.
4 5
2.1
6.5
1
33.6
8
.8
30.
0 8
.0
80.
6 9
.1
53.
3 6
.2
79.
8 7
.4
51.
1 8
.9
97.
2 1
1.9
20.
7 Ru
ssia
1.7
5
6.1
2.8
1
7.9
3.9
4
1.0
4.0
8
.1
3.6
4
5.7
2.2
9
.8
3.5
5
.5
2.5
9
.5
3.3
4
.0
3.0
2
9.7
5.0
7
4.8
3.1
1
0.6
23.
8 1
1.7
Yugo
slavi
a -
- -
- -
- -
- -
- -
- -
- -
- -
- -
- -
- -
- O
ther
s 8
.1
7.7
1
1.3
12.
2 1
2.2
21.
1 1
4.4
3.4
1
0.7
7.0
6
.2
3.6
1
5.4
10.
0 1
7.7
2.5
2
.9
4.9
1
.7
10.
5 1
.3
29.
2 9
0.9
3.7
4
14.5
4
6.4
Tota
l 1
71.4
8
59.3
1
31.6
8
54.1
1
64.5
7
04.0
2
09.4
8
23.2
2
18.3
8
84.6
1
71.5
8
70.8
2
23.5
6
25.4
3
89.7
6
45.5
3
82.2
8
49.5
2
93.4
7
62.2
3
28.7
6
47.8
4
97.3
8
83.7
2
7.6
36.
9 %
Shar
e O
f Con
tinen
t 2
7.30
0
.00
22.
51
19.
25
23.
93
19.
75
27.
38
24.
01
30.
19
23.
61
30.
40
22.
80
29.
50
17.
25
41.
33
24.
01
45.
79
24.
41
40.
63
22.
95
0.0
0 1
8.13
4
2.26
2
2.59
2
.25
(5.9
1)

142 | Fourth Quarter 2020/21
National Bank of Ethiopia Quarterly BulletinTa
ble
24: C
ontin
ued.
......
......
Cou
ntry
of O
rigin
2018
/19
2019
/20
2020
/21
Perc
enta
ge C
hang
eQ
IQ
IIQ
IIIQ
IVQ
IQ
IIQ
IIIQ
IVQ
IQ
IIQ
IIIQ
IV
Expo
rt Im
port
Expo
rt Im
port
Expo
rt Im
port
Expo
rt Im
port
Expo
rt Im
port
Expo
rt Im
port
Expo
rt Im
port
Expo
rt Im
port
Expo
rt Im
port
Expo
rt Im
port
Expo
rt Im
port
Expo
rt Im
port
Expo
rt Im
port
YZ
AB
CD
E F
GH
IJ
KL
MN
OP
QR
ST
UV
W=U
/MX=
V/N
Am
eric
a
Braz
il 0
.0
41.
8 0
.0
11.
2 0
.0
7.7
0
.0
9.4
-
3.8
-
3.9
-
5.1
-
4.2
-
21.
2 -
7.7
-
7.9
0
.0
7.8
8
7.8
Can
ada
4.4
1
2.1
2.9
2
1.3
2.4
5
.6
4.4
1
1.2
2.8
4
.8
3.3
3
7.8
4.2
2
6.6
4.2
7
.6
3.6
4
.3
3.9
2
8.1
4.0
1
0.2
4.7
4
.5
10.
8 (4
0.9)
Cub
a -
0.0
-
0.0
-
0.0
-
0.1
-
0.0
-
- -
0.1
-
- -
- -
0.0
-
- -
-
Mex
ico
1.0
3
.7
0.2
1
.1
2.2
0
.6
1.3
3
.4
0.5
1
.6
0.2
2
.1
0.3
3
.1
1.3
1
.0
0.6
0
.8
0.0
3
.2
0.0
2
.1
0.8
1
.4
(36.
0) 3
8.3
Unite
d St
ates
50.
6 1
66.1
2
5.5
949
.8
47.
7 1
80.9
6
9.5
73.
0 4
2.6
307
.3
39.
1 3
16.7
4
6.3
299
.8
84.
5 1
47.2
5
9.0
157
.5
40.
6 2
11.6
7
0.0
262
.7
84.
3 3
28.8
(0
.2)
123
.4
Oth
ers
13.
0 2
.3
15.
7 2
.0
25.
7 1
.5
33.
7 7
.3
34.
4 1
.9
12.
0 2
.6
30.
7 1
02.9
9
.2
15.
7 1
.5
4.9
0
.7
3.3
1
.1
16.
6 4
1.2
8,3
38,0
23.4
3
48.9
5
3,14
8,52
5.0
Tota
l 6
9.0
226
.0
44.
2 9
85.4
7
8.0
196
.3
109
.0
104
.4
80.
3 3
19.4
5
4.5
363
.1
81.
4 4
37.6
9
9.2
175
.6
64.
7 1
88.7
4
5.3
253
.9
75.
1 2
99.5
1
31.1
3
44.8
3
2.1
96.
4 %
Shar
e O
f C
ontin
ent
10.
98
0.0
0 7
.56
22.
21
11.
34
5.5
1 1
4.25
3
.05
11.
10
8.5
3 0
.00
9.5
1 1
0.74
1
2.07
1
0.52
6
.53
7.7
5 5
.42
0.0
0 7
.64
0.0
0 8
.38
11.
14
8.8
1 5
.86
34.
95
Asia
:
Chi
na, M
ain-
land
40.
6 1
,083
.1
35.
4 9
59.8
3
4.5
1,0
01.0
3
5.3
876
.1
19.
4 9
33.9
2
0.0
1,0
72.7
2
3.3
894
.5
21.
2 7
10.4
1
3.1
918
.0
15.
9 8
90.0
2
2.3
837
.7
18.
5 6
22.6
(1
2.9)
(12.
4)
Chi
na, T
aiw
an 5
.2
12.
5 2
.1
16.
5 2
.6
12.
7 5
.6
10.
9 4
.9
25.
5 2
.4
26.
9 3
.3
13.
5 1
1.7
23.
8 5
.2
17.
8 2
.7
12.
1 4
.5
12.
6 4
.6
8.8
(6
0.7)
(63.
1)Ho
ng K
ong
3.1
2
.8
3.0
2
.4
2.9
2
.7
2.8
1
.8
1.5
1
.2
1.6
0
.7
5.2
1
.4
3.7
0
.6
3.7
1
8.2
3.4
1
2.4
6.7
1
.3
4.6
0
.2
25.
2 (5
9.6)
Indi
a 7
.5
266
.2
14.
0 3
67.8
2
5.2
335
.3
39.
4 2
60.3
2
2.3
329
.1
16.
3 3
41.2
1
1.1
286
.6
6.7
1
31.9
9
.6
569
.7
15.
1 4
57.9
2
9.4
330
.0
20.
5 4
07.8
2
05.7
2
09.2
In
done
sia 7
.9
71.
5 1
1.4
84.
6 5
.9
69.
0 3
.8
55.
8 1
0.5
72.
0 5
.6
59.
4 7
.4
80.
9 6
.1
70.
6 6
.6
111
.0
6.5
8
5.4
11.
9 8
0.1
7.0
4
8.9
15.
4 (3
0.8)
Israe
l 1
8.6
7.3
2
9.5
7.7
3
1.6
8.3
2
6.1
2.3
2
7.2
5.2
2
4.8
8.6
3
6.3
6.0
1
3.6
3.4
1
8.0
3.1
1
6.9
4.4
2
4.2
4.6
1
5.5
4.5
1
4.4
31.
3 Ja
pan
26.
6 8
0.5
24.
6 9
9.7
29.
9 9
3.2
40.
9 1
01.5
3
2.8
80.
7 1
9.6
45.
4 2
5.2
32.
4 3
5.7
21.
8 2
0.9
32.
2 1
5.6
27.
8 1
4.4
18.
4 2
0.6
28.
2 (4
2.4)
29.
3 N
.Kor
ea, P
drk
0.2
0
.3
0.1
0
.5
0.0
0
.7
0.1
1
5.9
0.0
0
.5
- 1
.4
0.0
0
.0
0.0
0
.9
0.0
0
.3
0.0
1
.9
0.2
0
.2
0.0
0
.7
9,7
77.8
(1
6.7)
S.Ko
rea
12.
5 4
6.2
8.5
5
0.7
10.
9 4
0.5
14.
4 4
3.0
16.
7 3
9.5
7.8
4
3.6
15.
9 4
4.3
23.
7 5
8.9
15.
2 4
1.0
8.8
4
4.1
18.
8 6
9.8
20.
2 6
2.2
(14.
6) 5
.6
Kuw
ait
0.6
5
14.6
0
.6
381
.3
0.8
2
02.6
1
.5
560
.9
1.2
4
21.1
0
.8
417
.3
0.8
1
41.0
0
.8
107
.5
1.4
1
16.0
1
.0
0.3
2
.8
0.0
2
.8
349
.2
262
.1
224
.8
Leba
non
0.8
0
.4
0.5
0
.4
0.3
0
.2
0.5
0
.3
0.4
0
.4
1.0
0
.5
0.7
0
.1
0.1
0
.0
0.2
0
.2
0.1
0
.5
1.0
0
.3
0.3
0
.0
198
.0
1,5
99.1
M
alay
sia 0
.0
84.
3 0
.0
115
.1
0.1
6
5.5
0.6
5
6.4
1.3
3
7.4
0.2
4
5.4
0.3
3
6.4
1.9
3
2.2
1.9
1
25.5
2
.3
105
.7
4.4
1
06.9
1
.8
276
.8
(5.2
) 7
59.9
Pa
kist
an 2
.7
24.
7 2
.1
14.
5 1
.0
4.4
0
.5
6.2
0
.2
5.8
0
.4
11.
3 5
.5
5.9
5
.8
8.3
5
.4
8.2
3
.1
13.
1 2
.8
12.
8 1
.2
9.5
(7
8.5)
15.
1 Sa
udi A
rabi
a 4
2.2
41.
4 4
5.5
89.
8 4
7.8
85.
2 4
7.5
28.
2 5
5.3
56.
5 4
4.7
181
.7
55.
5 1
21.7
5
1.5
97.
6 5
3.3
60.
2 4
5.9
72.
2 5
8.4
300
.6
45.
7 5
9.8
(11.
2) (3
8.8)
Sing
apor
e 1
.2
4.0
1
.8
4.3
8
.0
28.
5 1
0.9
4.9
7
.5
9.6
6
.6
10.
0 1
6.4
113
.4
8.3
6
4.0
6.2
1
04.2
1
5.2
2.4
1
5.7
2.1
6
.1
33.
8 (2
5.8)
(47.
1)Ye
men
11.
3 0
.6
10.
3 0
.7
17.
5 0
.7
16.
4 0
.6
18.
5 0
.7
6.3
0
.4
6.7
0
.6
6.8
0
.7
9.5
1
.3
6.9
0
.7
5.1
0
.0
7.6
1
.1
12.
4 5
9.1
Thai
land
1.1
7
2.0
1.3
4
8.2
1.2
3
2.0
1.2
2
8.5
0.9
2
7.3
1.0
2
5.7
0.3
3
0.1
0.1
1
8.7
0.4
2
5.1
0.0
7
1.9
0.3
1
7.2
0.2
1
3.1
138
.6
(29.
8)UA
E 2
8.2
102
.4
26.
9 1
35.7
3
9.2
221
.4
37.
7 9
0.8
23.
5 9
8.3
26.
6 9
9.3
47.
5 1
93.7
2
6.9
155
.4
32.
0 1
15.1
4
8.3
348
.8
57.
4 2
66.9
3
6.9
209
.7
37.
6 3
4.9
Oth
ers
25.
0 5
1.5
43.
7 6
3.7
37.
2 1
13.4
3
0.2
35.
4 2
5.7
265
.6
18.
2 3
0.3
33.
3 5
0.4
93.
7 2
2.4
24.
5 2
5.9
24.
1 2
4.1
40.
3 3
8.6
131
.6
56.
0 4
0.5
150
.6
Tota
l 2
35.1
2,4
66.2
2
61.3
2
,443
.4
295
.9 2
,317
.3
315
.2
2,17
9.9
269
.8
2,41
0.2
204
.0
2,4
21.6
2
94.8
2
,052
.8
318
.0
1,52
9.1
227
.1
2,29
2.8
231
.7
2,1
75.8
3
20.7
2
,100
.1
345
.9
2,1
93.0
8
.8
43.
4 %
Shar
e O
f C
ontin
ent
37.
44
0.0
0 4
4.69
5
5.08
4
3.04
6
5.00
4
1.21
6
3.58
3
7.32
6
4.33
3
6.15
6
3.39
3
8.91
5
6.61
3
3.72
5
6.87
2
7.21
6
5.88
3
2.08
6
5.50
0
.00
58.
76
29.
39
56.
06
(12.
84)
(1.4
3)
Oce
ania
:
Aus
tralia
7.3
2
.2
3.0
4
.4
2.7
1
.3
7.6
1
.7
5.0
2
.2
2.5
1
.1
2.5
2
.1
4.9
4
.3
6.2
5
.5
1.5
1
.2
6.0
1
.4
7.4
5
.9
49.
6 3
6.2
Oth
ers
2.4
0
.7
0.2
2
.0
0.6
0
.7
1.2
1
.3
2.1
1
.7
0.3
0
.9
0.7
1
.5
1.3
1
.3
1.2
0
.9
2.3
0
.9
1.2
0
.7
6.4
0
.9
379
.0
(32.
9)To
tal
9.7
2
.9
3.3
6
.4
3.9
2
.0
8.8
3
.0
7.1
4
.0
2.9
2
.0
3.2
3
.6
6.3
5
.7
7.5
6
.3
3.8
2
.0
7.2
2
.1
13.
7 6
.8
119
.3
20.
2 %
Sha
re O
f C
ontin
ent
1.5
4 0
.00
0.5
6 0
.14
0.5
6 0
.06
1.1
5 0
.09
0.9
9 0
.11
0.5
1 0
.05
0.4
2 0
.10
0.6
6 0
.21
0.8
9 0
.18
0.5
3 0
.06
0.0
0 0
.06
1.1
7 0
.17
75.
72
(17.
36)
Unspec
ified
Unspec
ified
- -
- -
- -
- -
- -
- -
- -
- -
- -
- -
Gra
nd T
otal
628
.0 3
,682
.1
584
.6
4,4
36.3
6
87.5
3,5
65.0
7
64.9
3,
428.
6 7
23.0
3,
746.
4 5
64.2
3
,820
.0
757
.6
3,6
26.3
9
42.9
2,
688.
6 8
34.7
3,
480.
3 7
22.3
3
,321
.5
883
.1
3,5
73.9
1,
176.
7 3
,911
.9
24.
8 4
5.5
Sour
ce: E
thio
pian
Cus
tom
s Com
miss
ion
* D
ata
on im
port
of p
etro
leum
pro
duct
s are
obt
aine
d fro
m E
thio
pian
Pet
role
um E
nter
prise
**
All i
mpo
rt da
ta a
re u
pdat
ed b
ased
on
revi
sed
data
from
the
Ethi
opia
n C
usto
ms C
omm
issio
n

Fourth Quarter 2020/21 | 143
National Bank of Ethiopia Quarterly Bulletin
Tabl
e 24
: Con
tinue
d....
......
...
Cou
ntry
of O
rigin
2018
/19
2019
/20
2020
/21
Perc
enta
ge C
hang
eQ
IQ
IIQ
IIIQ
IVQ
IQ
IIQ
IIIQ
IVQ
IQ
IIQ
IIIQ
IV
Expo
rt Im
port
Expo
rt Im
port
Expo
rt Im
port
Expo
rt Im
port
Expo
rt Im
port
Expo
rt Im
port
Expo
rt Im
port
Expo
rt Im
port
Expo
rt Im
port
Expo
rt Im
port
Expo
rt Im
port
Expo
rt Im
port
Expo
rt Im
port
YZ
AB
CD
E F
GH
IJ
KL
MN
OP
QR
ST
UV
W=U
/MX=
V/N
Am
eric
a
Braz
il 0
.0
41.
8 0
.0
11.
2 0
.0
7.7
0
.0
9.4
-
3.8
-
3.9
-
5.1
-
4.2
-
21.
2 -
7.7
-
7.9
0
.0
7.8
8
7.8
Can
ada
4.4
1
2.1
2.9
2
1.3
2.4
5
.6
4.4
1
1.2
2.8
4
.8
3.3
3
7.8
4.2
2
6.6
4.2
7
.6
3.6
4
.3
3.9
2
8.1
4.0
1
0.2
4.7
4
.5
10.
8 (4
0.9)
Cub
a -
0.0
-
0.0
-
0.0
-
0.1
-
0.0
-
- -
0.1
-
- -
- -
0.0
-
- -
-
Mex
ico
1.0
3
.7
0.2
1
.1
2.2
0
.6
1.3
3
.4
0.5
1
.6
0.2
2
.1
0.3
3
.1
1.3
1
.0
0.6
0
.8
0.0
3
.2
0.0
2
.1
0.8
1
.4
(36.
0) 3
8.3
Unite
d St
ates
50.
6 1
66.1
2
5.5
949
.8
47.
7 1
80.9
6
9.5
73.
0 4
2.6
307
.3
39.
1 3
16.7
4
6.3
299
.8
84.
5 1
47.2
5
9.0
157
.5
40.
6 2
11.6
7
0.0
262
.7
84.
3 3
28.8
(0
.2)
123
.4
Oth
ers
13.
0 2
.3
15.
7 2
.0
25.
7 1
.5
33.
7 7
.3
34.
4 1
.9
12.
0 2
.6
30.
7 1
02.9
9
.2
15.
7 1
.5
4.9
0
.7
3.3
1
.1
16.
6 4
1.2
8,3
38,0
23.4
3
48.9
5
3,14
8,52
5.0
Tota
l 6
9.0
226
.0
44.
2 9
85.4
7
8.0
196
.3
109
.0
104
.4
80.
3 3
19.4
5
4.5
363
.1
81.
4 4
37.6
9
9.2
175
.6
64.
7 1
88.7
4
5.3
253
.9
75.
1 2
99.5
1
31.1
3
44.8
3
2.1
96.
4 %
Shar
e O
f C
ontin
ent
10.
98
0.0
0 7
.56
22.
21
11.
34
5.5
1 1
4.25
3
.05
11.
10
8.5
3 0
.00
9.5
1 1
0.74
1
2.07
1
0.52
6
.53
7.7
5 5
.42
0.0
0 7
.64
0.0
0 8
.38
11.
14
8.8
1 5
.86
34.
95
Asia
:
Chi
na, M
ain-
land
40.
6 1
,083
.1
35.
4 9
59.8
3
4.5
1,0
01.0
3
5.3
876
.1
19.
4 9
33.9
2
0.0
1,0
72.7
2
3.3
894
.5
21.
2 7
10.4
1
3.1
918
.0
15.
9 8
90.0
2
2.3
837
.7
18.
5 6
22.6
(1
2.9)
(12.
4)
Chi
na, T
aiw
an 5
.2
12.
5 2
.1
16.
5 2
.6
12.
7 5
.6
10.
9 4
.9
25.
5 2
.4
26.
9 3
.3
13.
5 1
1.7
23.
8 5
.2
17.
8 2
.7
12.
1 4
.5
12.
6 4
.6
8.8
(6
0.7)
(63.
1)Ho
ng K
ong
3.1
2
.8
3.0
2
.4
2.9
2
.7
2.8
1
.8
1.5
1
.2
1.6
0
.7
5.2
1
.4
3.7
0
.6
3.7
1
8.2
3.4
1
2.4
6.7
1
.3
4.6
0
.2
25.
2 (5
9.6)
Indi
a 7
.5
266
.2
14.
0 3
67.8
2
5.2
335
.3
39.
4 2
60.3
2
2.3
329
.1
16.
3 3
41.2
1
1.1
286
.6
6.7
1
31.9
9
.6
569
.7
15.
1 4
57.9
2
9.4
330
.0
20.
5 4
07.8
2
05.7
2
09.2
In
done
sia 7
.9
71.
5 1
1.4
84.
6 5
.9
69.
0 3
.8
55.
8 1
0.5
72.
0 5
.6
59.
4 7
.4
80.
9 6
.1
70.
6 6
.6
111
.0
6.5
8
5.4
11.
9 8
0.1
7.0
4
8.9
15.
4 (3
0.8)
Israe
l 1
8.6
7.3
2
9.5
7.7
3
1.6
8.3
2
6.1
2.3
2
7.2
5.2
2
4.8
8.6
3
6.3
6.0
1
3.6
3.4
1
8.0
3.1
1
6.9
4.4
2
4.2
4.6
1
5.5
4.5
1
4.4
31.
3 Ja
pan
26.
6 8
0.5
24.
6 9
9.7
29.
9 9
3.2
40.
9 1
01.5
3
2.8
80.
7 1
9.6
45.
4 2
5.2
32.
4 3
5.7
21.
8 2
0.9
32.
2 1
5.6
27.
8 1
4.4
18.
4 2
0.6
28.
2 (4
2.4)
29.
3 N
.Kor
ea, P
drk
0.2
0
.3
0.1
0
.5
0.0
0
.7
0.1
1
5.9
0.0
0
.5
- 1
.4
0.0
0
.0
0.0
0
.9
0.0
0
.3
0.0
1
.9
0.2
0
.2
0.0
0
.7
9,7
77.8
(1
6.7)
S.Ko
rea
12.
5 4
6.2
8.5
5
0.7
10.
9 4
0.5
14.
4 4
3.0
16.
7 3
9.5
7.8
4
3.6
15.
9 4
4.3
23.
7 5
8.9
15.
2 4
1.0
8.8
4
4.1
18.
8 6
9.8
20.
2 6
2.2
(14.
6) 5
.6
Kuw
ait
0.6
5
14.6
0
.6
381
.3
0.8
2
02.6
1
.5
560
.9
1.2
4
21.1
0
.8
417
.3
0.8
1
41.0
0
.8
107
.5
1.4
1
16.0
1
.0
0.3
2
.8
0.0
2
.8
349
.2
262
.1
224
.8
Leba
non
0.8
0
.4
0.5
0
.4
0.3
0
.2
0.5
0
.3
0.4
0
.4
1.0
0
.5
0.7
0
.1
0.1
0
.0
0.2
0
.2
0.1
0
.5
1.0
0
.3
0.3
0
.0
198
.0
1,5
99.1
M
alay
sia 0
.0
84.
3 0
.0
115
.1
0.1
6
5.5
0.6
5
6.4
1.3
3
7.4
0.2
4
5.4
0.3
3
6.4
1.9
3
2.2
1.9
1
25.5
2
.3
105
.7
4.4
1
06.9
1
.8
276
.8
(5.2
) 7
59.9
Pa
kist
an 2
.7
24.
7 2
.1
14.
5 1
.0
4.4
0
.5
6.2
0
.2
5.8
0
.4
11.
3 5
.5
5.9
5
.8
8.3
5
.4
8.2
3
.1
13.
1 2
.8
12.
8 1
.2
9.5
(7
8.5)
15.
1 Sa
udi A
rabi
a 4
2.2
41.
4 4
5.5
89.
8 4
7.8
85.
2 4
7.5
28.
2 5
5.3
56.
5 4
4.7
181
.7
55.
5 1
21.7
5
1.5
97.
6 5
3.3
60.
2 4
5.9
72.
2 5
8.4
300
.6
45.
7 5
9.8
(11.
2) (3
8.8)
Sing
apor
e 1
.2
4.0
1
.8
4.3
8
.0
28.
5 1
0.9
4.9
7
.5
9.6
6
.6
10.
0 1
6.4
113
.4
8.3
6
4.0
6.2
1
04.2
1
5.2
2.4
1
5.7
2.1
6
.1
33.
8 (2
5.8)
(47.
1)Ye
men
11.
3 0
.6
10.
3 0
.7
17.
5 0
.7
16.
4 0
.6
18.
5 0
.7
6.3
0
.4
6.7
0
.6
6.8
0
.7
9.5
1
.3
6.9
0
.7
5.1
0
.0
7.6
1
.1
12.
4 5
9.1
Thai
land
1.1
7
2.0
1.3
4
8.2
1.2
3
2.0
1.2
2
8.5
0.9
2
7.3
1.0
2
5.7
0.3
3
0.1
0.1
1
8.7
0.4
2
5.1
0.0
7
1.9
0.3
1
7.2
0.2
1
3.1
138
.6
(29.
8)UA
E 2
8.2
102
.4
26.
9 1
35.7
3
9.2
221
.4
37.
7 9
0.8
23.
5 9
8.3
26.
6 9
9.3
47.
5 1
93.7
2
6.9
155
.4
32.
0 1
15.1
4
8.3
348
.8
57.
4 2
66.9
3
6.9
209
.7
37.
6 3
4.9
Oth
ers
25.
0 5
1.5
43.
7 6
3.7
37.
2 1
13.4
3
0.2
35.
4 2
5.7
265
.6
18.
2 3
0.3
33.
3 5
0.4
93.
7 2
2.4
24.
5 2
5.9
24.
1 2
4.1
40.
3 3
8.6
131
.6
56.
0 4
0.5
150
.6
Tota
l 2
35.1
2,4
66.2
2
61.3
2
,443
.4
295
.9 2
,317
.3
315
.2
2,17
9.9
269
.8
2,41
0.2
204
.0
2,4
21.6
2
94.8
2
,052
.8
318
.0
1,52
9.1
227
.1
2,29
2.8
231
.7
2,1
75.8
3
20.7
2
,100
.1
345
.9
2,1
93.0
8
.8
43.
4 %
Shar
e O
f C
ontin
ent
37.
44
0.0
0 4
4.69
5
5.08
4
3.04
6
5.00
4
1.21
6
3.58
3
7.32
6
4.33
3
6.15
6
3.39
3
8.91
5
6.61
3
3.72
5
6.87
2
7.21
6
5.88
3
2.08
6
5.50
0
.00
58.
76
29.
39
56.
06
(12.
84)
(1.4
3)
Oce
ania
:
Aus
tralia
7.3
2
.2
3.0
4
.4
2.7
1
.3
7.6
1
.7
5.0
2
.2
2.5
1
.1
2.5
2
.1
4.9
4
.3
6.2
5
.5
1.5
1
.2
6.0
1
.4
7.4
5
.9
49.
6 3
6.2
Oth
ers
2.4
0
.7
0.2
2
.0
0.6
0
.7
1.2
1
.3
2.1
1
.7
0.3
0
.9
0.7
1
.5
1.3
1
.3
1.2
0
.9
2.3
0
.9
1.2
0
.7
6.4
0
.9
379
.0
(32.
9)To
tal
9.7
2
.9
3.3
6
.4
3.9
2
.0
8.8
3
.0
7.1
4
.0
2.9
2
.0
3.2
3
.6
6.3
5
.7
7.5
6
.3
3.8
2
.0
7.2
2
.1
13.
7 6
.8
119
.3
20.
2 %
Sha
re O
f C
ontin
ent
1.5
4 0
.00
0.5
6 0
.14
0.5
6 0
.06
1.1
5 0
.09
0.9
9 0
.11
0.5
1 0
.05
0.4
2 0
.10
0.6
6 0
.21
0.8
9 0
.18
0.5
3 0
.06
0.0
0 0
.06
1.1
7 0
.17
75.
72
(17.
36)
Unspec
ified
Unspec
ified
- -
- -
- -
- -
- -
- -
- -
- -
- -
- -
Gra
nd T
otal
628
.0 3
,682
.1
584
.6
4,4
36.3
6
87.5
3,5
65.0
7
64.9
3,
428.
6 7
23.0
3,
746.
4 5
64.2
3
,820
.0
757
.6
3,6
26.3
9
42.9
2,
688.
6 8
34.7
3,
480.
3 7
22.3
3
,321
.5
883
.1
3,5
73.9
1,
176.
7 3
,911
.9
24.
8 4
5.5
Sour
ce: E
thio
pian
Cus
tom
s Com
miss
ion
* D
ata
on im
port
of p
etro
leum
pro
duct
s are
obt
aine
d fro
m E
thio
pian
Pet
role
um E
nter
prise
**
All i
mpo
rt da
ta a
re u
pdat
ed b
ased
on
revi
sed
data
from
the
Ethi
opia
n C
usto
ms C
omm
issio
n
Tabl
e 25
: Vo
lum
e of
Exp
orts
, by
Maj
or C
omm
odity
Gro
ups
( In
met
ric to
ne)
Perio
dC
offe
eO
il Se
eds
Leat
her a
nd
Leat
her
prod
ucts
Pulse
sM
eat &
M
eat
Prod
ts.
Frui
ts &
Ve
get.
Suga
rG
old
Oil
Cak
esLiv
e A
nim
als
Cha
tPe
trol.
& Pe
t. Pr
dts
Bees
Wax
Tant
alem
Cot
ton
Text
. & Te
xt.
Prdt
s
2019
/20
Qtr
I 8
0,53
0.9
35,
026.
1 1
,122
.7
87,
604.
0 3
,654
.0
48,
805.
8 7
,500
.2
0.2
-
12,
498.
8 1
6,28
2.2
- 6
6.0
16.
7 -
6,9
34.0
Qtr
II 5
2,52
8.2
35,
569.
5 1
,131
.4
81,
773.
1 3
,071
.7
43,
455.
2 2
,507
.1
0.2
-
4,7
73.8
1
4,17
1.1
- 4
4.0
17.
2 -
5,7
89.9
Qtr
III 6
1,11
8.6
88,
514.
3 7
85.3
8
7,63
5.3
3,2
11.9
4
7,24
6.0
5,0
07.3
0
.3
- 4
,781
.0
14,
474.
7 -
40.
5 1
6.4
- 5
,918
.7
Qtr
IV 7
6,93
3.9
77,
394.
6 5
11.9
9
6,99
8.1
2,8
82.3
5
1,67
6.1
2,5
00.4
2
.6
- 7
,342
.0
12,
208.
2 -
107
.5
25.
8 8
0.0
4,1
55.8
2020
/21
Qtr
I 7
8,13
5.6
55,
732.
8 7
96.8
8
8,47
5.2
4,3
81.9
5
2,74
1.5
5,0
00.0
2
.7
- 9
,802
.0
21,
141.
0 -
99.
0 1
7.9
- 8
,930
.8
Qtr
II 3
8,45
2.0
68,
413.
0 5
22.0
5
0,45
8.8
3,1
74.7
4
6,30
4.1
5.3
1
.9
- 5
,068
.9
16,
802.
9 -
52.
0 1
5.3
- 5
,405
.2
Qtr
III 5
4,99
9.9
76,
231.
3 6
26.4
9
2,27
6.5
3,9
55.2
6
4,66
9.9
4.6
1
.6
- 6
,593
.1
17,
173.
5 -
54.
0 1
9.0
- 5
,743
.3
QIV
101
,669
.8
54,
639.
5 5
90.5
7
4,09
9.9
4,2
97.4
7
1,85
7.5
0.4
3
.3
- 7
,687
.1
20,
568.
0 -
73.
5 1
7.5
- 6
,804
.4
Tabl
e 25
con
tinue
d:
Perio
dC
erea
ls an
d F
lour
Nat
ural
Gum
Civ
etHo
pA
nim
al
Fod
der
Nat
ural
Ho
ney
Mar
ble
Flow
erBe
vera
geSp
ices
Oth
ers
Elec
trici
ty (i
n '1
000'
kw
h)O
ther
s*Re
-Exp
orts
Gra
nd
Tota
l*
2019
/20
Qtr
I 6
69.8
7
09.6
-
- -
12.
5 -
8,0
11.1
3
50.6
1
,261
.9
11,
911.
6 1
67,0
43.2
7
0,12
5.9
- 3
63,2
16.7
Qtr
II 1
64.6
3
11.6
-
- -
38.
7 -
9,8
81.9
2
38.4
5
00.3
1
7,00
5.0
262
,447
.5
70,
757.
5 -
309
,782
.8
Qtr
III 1
,053
.1
196
.6
- -
- 9
4.9
- 6
,829
.6
1,2
04.9
6
63.5
6
,720
.1
307
,742
.7
81,
171.
5 -
393
,986
.7
Qtr
IV 2
,782
.6
166
.8
- -
- 6
.1
- 2
9,88
9.8
1,1
91.2
3
,865
.1
22,
443.
4 4
08,0
20.5
5
3,47
1.9
- 3
82,0
29.4
2020
/21
Qtr
I 4
,116
.3
249
.0
- -
- 1
.7
- 2
4,01
4.4
2,6
17.1
2
,822
.9
32,
050.
7 4
3,01
1.4
70,
705.
3 3
87,0
13.7
Qtr
II 4
,615
.6
217
.3
- -
- 2
.3
024
493.
7096
681
4.33
6618
27.0
9246
756.
6402
1 3
42,2
79.0
5
,420
.5
234
,676
.1
Qtr
III10
53.0
7819
6.59
30
00
94.8
99 -
27,
465.
3 1
,021
.9
4,4
02.8
2
0,05
5.6
3077
42.7
014
8117
1.45
786
039
3986
.692
5
Qtr
IV 1
2,18
2.6
205
.3
- -
- 6
.2
- 2
7,46
5.3
1,0
21.9
4
,402
.8
20,
055.
6 5
05,2
27.1
7
2,16
1.6
407
,648
.5
Sour
ce: E
thio
pian
Min
istry
of R
even
ues,
Ethi
opia
n El
ectri
c Po
wer
(EEP
) and
Eth
iopi
an E
lect
ric U
tility
(EEU
)

144 | Fourth Quarter 2020/21
National Bank of Ethiopia Quarterly BulletinTa
ble
26: V
alue
of E
xpor
ts, b
y M
ajor
Com
mod
ity G
roup
s (I
n Th
ousa
nds
of B
irr)
Perio
dC
offe
eO
il Se
eds
Leat
her a
nd
Leat
her p
ro-
duct
sPu
lses
Mea
t &
Mea
t Pro
dts.
Frui
ts &
Ve
geta
-bl
esSu
gar
Gol
dO
il C
akes
Live
Ani
-m
als
Cha
tPe
trol.
& Pe
t. Pr
dts
Bees
Wax
Tant
alem
Cot
ton
Text
. &
Text
. Prd
ts
2019
/20
July
2,3
35,7
35.5
5
56,3
73.9
2
31,2
68.1
4
54,9
74.7
1
93,0
22.0
1
87,9
02.6
-
76,
269.
0 4
44,2
40.5
8
23,6
78.8
-
2,8
07.9
2
,926
.3
- 4
74,5
13.6
A
ugus
t 2
,537
,404
.9
606
,226
.6
251
,681
.2
529
,494
.9
212
,785
.3
169
,236
.9
11,
749.
7 7
9,22
3.3
89,
063.
3 1
,066
,955
.7
- 8
,580
.5
15,
472.
7 -
631
,180
.0
Sept
embe
r 1
,877
,299
.0
405
,470
.7
203
,359
.7
432
,024
.0
132
,265
.3
119
,042
.3
5,8
65.2
2
3,10
6.2
168
,755
.1
800
,509
.5
- 4
,420
.3
5,3
09.5
-
402
,291
.8
Qtr
I 6
,750
,439
.4
1,5
68,0
71.1
6
86,3
09.1
1
,416
,493
.6
538
,072
.5
476
,181
.9
17,
614.
9 1
78,5
98.5
-
702
,058
.9
2,6
91,1
44.0
-
15,
808.
7 2
3,70
8.4
- 1
,507
,985
.5
Oct
ober
1,5
36,8
81.0
3
08,4
21.5
3
08,8
98.0
5
40,4
47.6
1
37,0
64.6
1
33,6
43.7
1
8.7
20,
352.
1 8
2,58
4.1
799
,630
.7
- 1
1,75
1.1
18,
920.
6 -
439
,185
.5
Nov
eber
1
,400
,917
.9
530
,130
.2
224
,787
.2
449
,756
.1
157
,964
.5
155
,129
.6
37.
6 4
7,05
7.7
96,
476.
7 7
92,1
87.3
-
- 1
0,78
1.5
- 4
64,8
77.8
D
ecem
ber
1,0
68,2
76.9
7
85,1
80.7
2
17,4
54.5
5
16,7
76.3
1
93,4
09.9
1
68,8
21.5
6
,286
.9
160
,776
.9
76,
638.
0 8
62,6
99.7
-
- 1
,135
.6
- 4
68,9
99.1
Q
tr II
4,0
06,0
75.8
1
,623
,732
.5
751
,139
.6
1,5
06,9
80.0
4
88,4
39.0
4
57,5
94.8
6
,343
.2
228
,186
.8
- 2
55,6
98.8
2
,454
,517
.7
- 1
1,75
1.1
30,
837.
7 -
1,3
73,0
62.4
Ja
nuar
y 1
,373
,638
.4
1,3
57,0
89.8
1
74,9
65.1
5
61,8
81.1
1
98,4
12.1
1
37,6
77.5
6
,914
.0
103
,554
.6
99,
351.
2 8
85,0
16.0
-
5,7
92.1
4
,411
.0
- 4
79,2
60.2
Fe
brua
ry 1
,846
,511
.5
1,1
35,9
73.5
1
42,0
44.5
7
89,6
43.7
2
11,8
93.2
1
58,7
32.6
6
,945
.9
27,
587.
6 1
21,1
31.8
9
37,8
55.4
-
- 1
8,00
5.4
- 4
58,0
32.3
M
arch
3,1
56,1
64.0
1
,653
,160
.3
157
,325
.1
778
,644
.3
155
,102
.0
166
,604
.1
26.
8 3
07,3
54.9
5
3,52
1.8
824
,781
.2
- 3
,988
.2
16,
792.
7 -
417
,705
.0
Qtr
III 6
,376
,313
.9
4,1
46,2
23.6
4
74,3
34.7
2
,130
,169
.1
565
,407
.2
463
,014
.2
13,
886.
7 4
38,4
97.1
-
274
,004
.9
2,6
47,6
52.6
-
9,7
80.3
3
9,20
9.0
- 1
,354
,997
.5
Apr
il 3
,454
,803
.1
1,7
13,0
03.3
6
5,31
7.2
848
,381
.1
180
,612
.4
160
,079
.2
6.0
2
,099
,738
.1
120
,772
.2
603
,998
.8
- 5
,071
.7
25,
977.
0 4
,073
.7
294
,165
.3
May
3,3
12,9
47.4
1
,296
,788
.7
104
,917
.8
928
,481
.5
199
,556
.3
179
,499
.9
7,2
38.7
1
,852
,305
.0
148
,926
.5
868
,150
.6
- 1
9,05
0.1
2,1
84.4
4
,145
.1
353
,987
.0
June
3,1
43,7
30.9
6
65,1
63.7
1
26,3
72.8
5
92,3
90.3
1
34,9
46.5
9
8,42
5.4
- 1
,775
,313
.9
169
,615
.4
850
,707
.2
- 4
,193
.7
33,
574.
1 -
351
,138
.4
Qtr
IV 9
,911
,481
.4
3,6
74,9
55.8
2
96,6
07.9
2
,369
,253
.0
515
,115
.2
438
,004
.5
7,2
44.7
5
,727
,357
.0
- 4
39,3
14.1
2
,322
,856
.6
- 2
8,31
5.5
61,
735.
4 8
,218
.7
999
,290
.6
2020
/21
Qtr
I 6
,618
,332
.1
2,0
81,3
31.0
3
31,4
97.9
1
,672
,517
.6
570
,893
.0
473
,697
.0
7,5
46.7
7
,265
,027
.5
- 4
42,4
65.2
3
,394
,106
.0
- 1
3,34
3.0
37,
868.
3 -
1,4
79,2
75.5
Q
tr II
4,5
41,3
78.8
3
,638
,713
.3
324
,201
.3
1,4
52,7
23.6
6
20,8
05.6
5
58,4
97.3
2
06.0
4
,990
,717
.8
- 3
26,6
60.1
3
,518
,806
.6
- 1
3,75
4.8
30,
708.
3 -
1,2
84,6
13.2
Q
tr III
8,3
61,3
52.4
4
,243
,240
.8
362
,988
.2
3,2
36,9
08.5
8
07,0
11.2
8
85,5
04.0
7
2.9
4,5
94,8
02.2
-
432
,900
.4
3,9
16,5
33.0
-
16,
856.
2 5
1,07
0.8
- 1
,373
,218
.5
Qtr
IV 1
6,84
6,76
4.8
3,2
16,9
47.8
4
06,6
48.8
2
,881
,129
.5
965
,720
.3
813
,283
.8
7.3
9
,411
,597
.7
- 5
56,8
13.7
4
,979
,436
.0
- 2
5,27
2.7
60,
154.
2 -
1,5
87,9
93.4
Tabl
e 26
(con
tinue
d):
Perio
dC
erea
ls an
d Fl
our
Nat
ural
G
umC
ivet
Hop
Ani
mal
Fo
dder
Nat
ural
Ho
ney
Mar
ble
Flow
erBe
vera
geSp
ices
Oth
ers
Elec
trici
tyOthers*
Re-E
x-po
rtsG
rand
To
tal
2019
/20
July
3,0
70.9
2
,536
.5
- -
- 1
50.4
-
1,0
40,5
59.7
7
,738
.0
45,
868.
2 3
27,5
99.5
9
6,77
8.7
2,0
01,7
41.7
7
,308
,014
.8
Aug
ust
8,4
31.1
2
5,45
6.6
- -
- 8
08.6
-
1,2
76,6
29.9
9
,388
.0
39,
421.
6 1
30,7
77.6
9
7,12
2.5
2,2
34,6
88.6
7
,797
,090
.8
Sept
embe
r 7
,873
.3
37,
298.
2 -
- -
52.
1 -
1,0
40,8
02.3
3
,156
.2
40,
966.
6 1
11,9
47.3
1
03,6
29.0
1
,753
,326
.5
5,9
25,4
43.8
Q
tr I
19,
375.
3 6
5,29
1.3
- -
- 1
,011
.1
- 3
,357
,992
.0
20,
282.
2 1
26,2
56.4
5
70,3
24.4
2
97,5
30.2
5
,989
,756
.8
21,
030,
549.
4 O
ctob
er 2
,922
.7
15,
959.
5 -
- -
2,7
48.8
-
1,0
58,0
03.6
1
1,83
3.9
33,
452.
2 1
03,9
56.4
1
04,0
82.7
1
,791
,065
.8
5,6
70,7
58.9
N
oveb
er
3,4
27.1
1
2,45
9.4
- -
- 5
11.9
-
1,0
11,3
05.7
7
,097
.6
35,
068.
4 1
16,0
24.9
1
70,8
47.2
1
,832
,401
.3
5,6
86,8
46.2
D
ecem
ber
2,6
26.5
9
,051
.9
- -
- 4
96.4
-
682
,464
.3
10,
853.
5 3
9,66
8.5
212
,955
.5
186
,940
.8
1,6
15,1
92.2
5
,671
,513
.4
Qtr
II 8
,976
.3
37,
470.
7 -
- -
3,7
57.1
-
2,7
51,7
73.7
2
9,78
5.0
108
,189
.0
432
,936
.8
461
,870
.7
5,2
38,6
59.3
1
7,02
9,11
8.6
Janu
ary
5,2
08.4
1
7,94
2.7
- -
- 5
80.9
-
1,5
03,7
17.8
5
,444
.7
24,
520.
9 5
36,3
68.6
1
75,2
70.2
2
,752
,725
.4
7,6
57,0
17.2
Fe
brua
ry 1
6,42
3.6
3,4
79.8
-
- -
7,7
17.4
-
1,3
30,6
36.5
1
0,31
4.4
26,
985.
2 1
99,0
08.0
1
82,0
57.2
2
,252
,659
.7
7,6
30,9
79.4
M
arch
7,7
56.2
4
,825
.3
- -
- 2
,807
.6
- 8
06,7
62.4
1
2,08
9.9
39,
193.
5 3
57,9
47.2
2
08,2
86.1
1
,874
,165
.8
9,1
30,8
38.5
Q
tr III
29,
388.
3 2
6,24
7.9
- -
- 1
1,10
5.9
- 3
,641
,116
.6
27,
848.
9 9
0,69
9.6
1,0
93,3
23.7
5
65,6
13.4
6
,879
,550
.9
24,
418,
835.
1 A
pril
11,
796.
4 1
5,54
1.9
- -
- -
- 9
65,3
33.8
8
,500
.9
26,
648.
4 2
23,0
45.3
2
16,6
80.3
1
,791
,762
.9
11,
043,
546.
1 M
ay 2
4,34
7.0
10,
896.
7 -
- -
- -
1,2
07,1
75.9
1
2,31
5.8
23,
706.
3 1
64,6
53.2
2
47,6
19.8
2
,051
,031
.2
10,
968,
893.
8 Ju
ne 2
3,55
8.3
2,3
90.2
-
- -
565
.2
- 1
,285
,087
.4
12,
665.
7 5
7,20
8.2
215
,409
.7
331
,738
.3
2,3
13,3
35.4
9
,874
,195
.2
Qtr
IV 5
9,70
1.8
28,
828.
8 -
- -
565
.2
- 3
,457
,597
.0
33,
482.
3 1
07,5
63.0
6
03,1
08.1
7
96,0
38.4
6
,156
,129
.5
31,
886,
635.
1 Q
tr I
85,
865.
7 2
8,32
9.5
- -
- 5
14.2
-
3,6
67,1
67.9
5
3,41
3.4
115
,928
.7
678
,998
.9
828
,830
.0
6,9
76,1
92.0
2
9,84
6,94
9.0
Qtr
II 1
42,8
16.5
4
1,89
9.7
- -
- 4
24.7
-
4,2
03,1
47.1
5
8,30
9.1
130
,510
.0
733
,902
.2
722
,280
.4
7,3
48,6
11.2
2
7,33
5,07
6.3
Qtr
III15
5207
.290
122
818.
6473
90
00
641.
3074
710
5241
673.
689
2838
6.58
856
1402
40.8
459
6304
82.1
789
8025
50.4
329
7643
739.
774
3450
1909
.61
Qtr
IV 3
74,3
23.2
4
4,19
8.7
- -
- 1
,456
.4
- 5
,349
,642
.7
51,
815.
5 2
33,9
50.0
1
,095
,614
.1
1,1
95,8
79.7
8
,799
,148
.3
- 4
8,90
2,77
0.7
Sour
ce: E
thio
pian
Min
istry
of R
even
ues,
Ethi
opia
n El
ectri
c Po
wer
(EEP
) and
Eth
iopi
an E
lect
ric U
tility
(EEU
)

Fourth Quarter 2020/21 | 145
National Bank of Ethiopia Quarterly BulletinTa
ble
27: V
alue
of I
mpo
rt, b
y M
ajor
Com
mod
ity G
roup
s
(In
Thou
sand
s o
f Birr
)
Perio
dFo
od &
Liv
e A
nim
als
Beve
rage
sTo
bacc
oPe
trole
um C
rud
ePe
trole
um P
rod
.***
*C
hem
ical
sFe
rtiliz
ers
Med
ical
&
Phar
m. P
rod
Soap
& P
olish
Rubb
er P
rod
.Pa
per &
Pap
er
Man
fc.
2019
/20
Qtr
I 9
,086
,741
2
04,2
61
29,
042
- 1
6,69
9,93
3 1
,479
,065
3
,582
,154
2
67,7
72
1,2
74,3
55
2,0
38,4
89
1,0
42,8
51
Qtr
II 7
,072
,204
2
59,3
26
32,
121
257
1
8,61
6,35
4 1
,791
,221
3
,766
,270
9
73,4
66
1,2
83,9
65
2,1
85,3
93
1,2
78,8
13
Qtr
III 8
,528
,815
2
32,6
40
36,
685
1,7
07
16,
751,
624
1,4
03,4
44
3,5
12,8
64
1,3
76,2
55
1,2
51,5
60
2,8
62,7
53
1,1
07,8
19
Qtr
IV 5
,847
,596
2
25,6
95
15,
969
- 9
,988
,980
1
,141
,449
5
,962
,065
4
74,7
84
729
,417
2
,349
,124
8
33,7
58
2020
/21
Qtr
I 9
,000
,887
2
55,7
51
39,
437
- 1
2,80
0,02
6 1
,741
,461
2
,712
,421
1
,017
,625
1
,351
,925
3
,020
,602
7
38,3
83
Qtr
II 1
3,95
1,12
8 2
69,9
82
64,
714
77
14,
735,
939
1,4
59,5
62
6,6
24,5
46
808
,232
1
,188
,595
2
,443
,553
8
12,9
60
Qtr
III 1
3,02
7,26
0 1
81,1
07
31,
994
- 2
0,80
3,19
2 1
,412
,460
6
,252
,913
1
,292
,075
1
,530
,636
2
,373
,813
8
03,6
51
Qtr
IV 2
3,89
8,11
9 2
37,4
00
65,
907
9,9
82
24,
258,
306
1,4
91,7
34
5,4
10,9
48
1,2
89,5
27
1,3
54,5
08
2,1
21,7
95
1,0
04,7
79
Tabl
e 27
(con
tinue
d):
Perio
dTe
xtile
sC
loth
ings
Gla
ss &
Gla
ss W
are
Met
al &
Met
al M
anfc
.M
achi
nery
& A
ircra
ftRo
ad M
otor
Veh
icle
sEl
ectri
cal M
ater
ials
Gra
in*
Tele
com
m. A
ppar
a.O
ther
sG
RAN
D T
OTA
L
2019
/20
Qtr
I 3
4,49
4.7
7,4
09.0
5
2,44
7.9
477
,106
.2
53,
216.
1 4
9,59
5.4
33,
469.
8 1
44,2
03.0
9
4.1
891
,187
.1
3,7
02,2
82.2
Qtr
II 2
,523
,927
1
,803
,900
9
26,8
66
14,
424,
435
23,
253,
811
2,6
47,1
75
8,3
84,7
97
1,0
99,9
58
169
,506
2
4,02
9,48
9 1
15,4
23,2
97
Qtr
III 2
,669
,745
1
,233
,333
8
76,2
60
15,
104,
311
17,
937,
973
1,8
09,6
72
6,3
33,9
41
1,3
04,9
39
139
,474
3
3,59
3,22
7 1
16,7
64,1
01
Qtr
IV 1
,909
,521
1
,410
,207
5
92,7
81
11,
029,
726
12,
457,
371
560
,232
4
,381
,015
1
,477
,931
5
3,41
6 3
1,04
5,74
4 9
1,00
8,84
9
Qtr
I 2
,943
,227
2
,160
,325
8
57,8
48
14,
336,
983
16,
215,
322
2,0
63,3
47
7,3
29,2
28
3,5
23,5
44
132
,138
4
5,71
1,18
4 1
24,4
28,1
21
2020
/21
Qtr
II 4
,070
,828
2
,435
,175
6
72,6
27
13,
510,
588
16,
781,
444
1,1
10,3
50
9,4
20,2
39
3,4
42,5
85
274
,624
3
5,21
4,36
8 1
25,8
49,5
31
Qtr
III 3
,306
,311
1
,791
,807
7
07,4
19
12,
113,
084
19,
832,
946
885
,948
9
,264
,607
4
,393
,345
1
68,9
59
46,
839,
292
142
,619
,472
Qtr
IV 2
,784
,054
1
,490
,176
7
88,6
20
13,
156,
617
25,
176,
007
799
,634
6
,939
,096
8
,601
,105
2
33,8
65
53,
932,
947
166
,444
,021
Sour
ce: E
thio
pian
Cus
tom
s Com
miss
ion
*
** D
ata
on im
port
of p
etro
leum
pro
duc
ts a
re o
btai
ned
from
Eth
iopi
an P
etro
leum
Ent
erpr
ise
** A
ll the
dat
a ar
e up
dat
ed b
ased
on
revi
sed
dat
a fro
m th
e Et
hiop
ian
Cus
tom
s Com
miss
ion

146 | Fourth Quarter 2020/21
National Bank of Ethiopia Quarterly BulletinTa
ble
28: V
olum
e of
Impo
rts, b
y M
ajor
Com
mod
ity G
roup
s**
(In M
etric
Ton
s)Pe
riod
Food
& L
ive
Ani
mal
sBe
vera
ges
Toba
cco
Petro
leum
Cru
dePe
trole
um P
rod.
****
Che
mic
als
Ferti
lizer
sM
edic
al &
Pha
rm. P
rod
Soap
& P
olish
Rubb
er P
rod.
Pape
r & P
aper
Man
fc.
2019
/20
July
68,
497.
0 2
,399
.8
204
.4
- 3
30,0
84.4
1
7,27
0.5
2,3
04.3
1
01.7
9
,759
.5
8,7
73.2
1
1,46
3.6
Aug
ust
389
,998
.9
1,2
78.0
4
4.6
- 4
16,9
68.0
2
5,69
2.6
2,0
15.7
1
28.9
7
,395
.8
9,5
62.0
1
0,57
2.5
Sept
embe
r 4
69,1
70.9
1
,187
.1
45.
0 -
263
,239
.4
17,
795.
9 1
,934
.8
16.
0 1
2,14
1.7
7,8
26.4
1
5,38
9.5
Qtr
I 9
27,6
66.8
4
,864
.8
294
.0
- 1
,010
,291
.7
60,
758.
9 6
,254
.8
246
.6
29,
296.
9 2
6,16
1.5
37,
425.
6 O
ctob
er 2
44,6
95.2
1
,360
.9
100
.0
16.
0 3
25,9
43.9
2
3,84
7.3
2,4
61.5
3
0,09
3.9
5,2
74.7
1
4,13
2.1
15,
042.
5 N
ovem
ber
281
,455
.5
1,3
67.6
6
7.0
0.2
2
86,7
16.0
1
6,18
8.4
2,7
77.8
3
59.6
9
,092
.3
9,2
39.2
1
1,62
5.9
Dec
embe
r 1
34,2
17.0
2
,200
.0
133
.9
- 4
01,0
31.4
5
31,0
88.3
1
,356
.0
75.
6 9
,700
.6
8,2
95.5
1
6,06
7.5
Qtr
II 6
60,3
67.6
4
,928
.5
300
.9
16.
2 1
,013
,691
.3
571
,124
.0
6,5
95.3
3
0,52
9.1
24,
067.
6 3
1,66
6.9
42,
735.
8 Ja
nuar
y 1
89,8
33.4
1
,647
.7
61.
3 -
324
,441
.9
19,
311.
0 2
,061
.2
129
.5
7,9
58.6
1
1,60
5.3
11,
491.
0 Fe
brua
ry 1
82,6
71.1
9
86.8
1
45.5
3
7.7
346
,615
.1
12,
449.
5 2
,043
.3
531
.5
6,2
94.7
1
0,52
4.9
10,
221.
8 M
arch
285
,691
.5
1,2
28.9
7
4.2
- 2
84,1
72.4
1
4,28
8.7
1,5
22.6
1
25.2
6
,882
.3
7,6
22.8
1
0,35
9.6
Qtr
III 6
58,1
95.9
3
,863
.4
281
.0
37.
7 9
55,2
29.4
4
6,04
9.3
5,6
27.1
7
86.2
2
1,13
5.6
29,
753.
0 3
2,07
2.4
Apr
il 1
94,5
86.6
7
44.6
2
8.2
- 3
34,9
35.9
1
1,25
1.3
2,9
86.2
1
08.9
3
,814
.3
5,6
71.3
1
0,22
7.1
May
187
,968
.5
753
.1
60.
9 -
227
,020
.2
15,
491.
7 9
74.1
3
2.6
3,7
27.1
8
,097
.0
7,3
90.5
Ju
ne 1
44,7
67.8
1
,671
.5
45.
0 -
326
,027
.5
14,
257.
1 1
,634
.3
63.
0 3
,643
.2
10,
219.
8 8
,359
.1
Qtr
IV 5
27,3
22.9
3
,169
.1
134
.1
- 8
87,9
83.6
4
1,00
0.1
5,5
94.6
2
04.5
1
1,18
4.6
23,
988.
1 2
5,97
6.7
2020
/21
July
608
,995
.1
1,4
09.9
1
09.1
-
272
,666
.7
20,
117.
3 1
,184
.6
77.
4 6
,735
.6
14,
090.
3 7
7,67
8.8
Aug
ust
324
,306
.1
1,1
70.3
8
0.1
- 3
57,7
00.9
1
7,37
0.6
1,6
09.2
1
08.1
9
,710
.4
8,6
78.1
7
,025
.8
Sept
embe
r 2
50,2
96.1
1
,304
.2
70.
4 -
248
,319
.6
16,
695.
3 1
,370
.5
56.
4 9
,305
.8
10,
397.
5 7
,767
.0
Qtr
I 1
,183
,597
.3
3,8
84.4
2
59.6
-
878
,687
.3
54,
183.
2 4
,164
.3
242
.0
25,
751.
8 3
3,16
6.0
92,
471.
6 O
ctob
er 2
88,2
96.6
1
,244
.4
241
.8
- 3
44,4
25.7
1
3,68
1.1
1,4
09.9
1
10.6
5
,177
.9
8,4
28.9
9
,944
.8
Nov
embe
r 3
11,4
44.4
1
,413
.9
31.
1 0
.1
265
,051
.8
16,
107.
7 2
,792
.1
41.
6 6
,721
.3
6,5
94.1
6
,365
.2
Dec
embe
r 5
51,3
10.0
2
,162
.2
175
.3
- 3
28,4
18.3
9
,866
.6
2,2
78.0
6
7.2
7,8
70.3
7
,648
.6
6,9
84.3
Q
tr II
1,1
51,0
51.0
4
,820
.5
448
.2
0.1
9
37,8
95.8
3
9,65
5.5
6,4
80.0
2
19.4
1
9,76
9.5
22,
671.
6 2
3,29
4.3
Janu
ary
232
,013
.7
1,0
89.9
6
6.6
- 3
26,9
32.1
1
4,44
5.7
1,6
00.4
2
2.9
4,4
94.9
5
,602
.3
5,4
86.7
Fe
brua
ry 2
18,2
95.7
1
,063
.2
139
.9
- 3
07,5
46.3
1
1,11
1.0
3,3
02.0
1
29.1
9
,078
.3
6,8
56.9
6
,475
.6
Mar
ch 2
16,7
07.2
7
72.7
2
6.9
- 3
25,5
01.0
1
6,32
8.1
2,1
12.6
6
6.2
5,5
57.3
7
,610
.9
6,6
01.7
Q
tr III
667
,016
.6
2,9
25.7
2
33.4
-
959
,979
.4
41,
884.
8 7
,015
.0
218
.2
19,
130.
5 2
0,07
0.1
18,
564.
0 Q
tr IV
1,1
51,6
72.7
4
,678
.3
361
.8
146
.8
943
,060
.7
40,
642.
6 4
,692
.9
129
.2
18,
759.
1 1
7,00
1.4
19,
183.
1
Tabl
e 28
(con
tinue
d):
Perio
dTe
xtile
sC
loth
ings
Gla
ss &
Gla
ss W
are
Met
al &
Met
al
Man
fc.
Mac
hine
ry &
Airc
raft
Road
Mot
or
Veh
icle
sEl
ectri
cal M
ater
ials
Gra
in*
Tele
com
m. A
ppar
a.O
ther
sG
RAN
D T
OTA
L
2019
/20
July
11,
062.
2 3
,199
.1
26,
698.
2 1
51,3
21.5
2
1,02
5.0
27,
363.
3 1
6,57
2.3
50,
710.
2 3
4.8
269
,904
.9
978
,039
.7
Aug
ust
13,
207.
5 2
,269
.9
15,
207.
7 2
13,4
42.2
1
6,06
0.5
16,
440.
0 9
,355
.9
60,
409.
6 2
2.4
318
,861
.6
1,4
68,5
24.5
Se
ptem
ber
10,
225.
0 1
,940
.0
10,
542.
0 1
12,3
42.5
1
6,13
0.6
5,7
92.1
7
,541
.6
33,
083.
3 3
7.0
302
,420
.5
1,2
55,7
18.0
Q
tr I
34,
494.
7 7
,409
.0
52,
447.
9 4
77,1
06.2
5
3,21
6.1
49,
595.
4 3
3,46
9.8
144
,203
.0
94.
1 8
91,1
87.1
3
,702
,282
.2
Oct
ober
11,
241.
9 2
,720
.1
15,
573.
9 2
20,2
58.2
1
7,85
1.2
5,9
32.4
1
2,46
9.4
47,
599.
1 2
7.2
776
,008
.6
1,7
25,0
51.0
N
ovem
ber
10,
400.
9 2
,728
.9
16,
106.
4 1
42,4
40.3
3
3,54
0.0
7,8
85.8
2
1,81
1.7
71,
596.
0 7
4.0
249
,668
.5
1,1
03,5
46.1
D
ecem
ber
12,
727.
2 3
,109
.8
15,
719.
5 1
70,3
21.3
2
2,44
8.1
4,6
35.7
9
,538
.9
54,
787.
5 4
1.1
230
,033
.1
1,5
72,7
40.3
Q
tr II
34,
370.
0 8
,558
.8
47,
399.
8 5
33,0
19.9
7
3,83
9.3
18,
454.
0 4
3,82
0.0
173
,982
.6
142
.3
1,2
55,7
10.3
4
,401
,337
.5
Janu
ary
11,
668.
7 2
,780
.1
16,
338.
1 1
21,0
88.0
1
7,52
0.5
3,8
90.5
1
1,30
0.3
30,
576.
8 5
6.6
602
,680
.3
1,3
55,8
63.9
Fe
brua
ry 1
1,00
8.8
2,1
79.8
1
2,69
9.3
139
,102
.0
23,
621.
4 5
,190
.5
10,
672.
4 6
5,19
1.0
99.
7 5
23,0
73.9
1
,300
,169
.7
Mar
ch 8
,814
.0
1,2
11.4
1
2,25
2.4
145
,953
.0
18,
020.
6 2
,859
.8
7,5
37.7
4
3,24
0.3
10.
2 4
33,0
45.1
1
,241
,672
.3
Qtr
III 3
1,49
1.6
6,1
71.2
4
1,28
9.8
406
,143
.0
59,
162.
4 1
1,94
0.7
29,
510.
5 1
39,0
08.2
1
66.6
1
,558
,799
.3
3,8
97,7
05.9
A
pril
5,7
16.4
1
,676
.1
5,5
73.9
1
53,1
76.9
8
,996
.9
632
.4
3,9
92.7
1
49,4
14.3
8
.0
490
,376
.5
1,2
34,5
04.1
M
ay 7
,080
.1
1,7
98.9
8
,064
.9
82,
767.
5 1
2,19
3.9
1,3
34.3
6
,148
.5
71,
727.
0 1
2.6
326
,640
.7
897
,557
.1
June
7,1
02.3
1
,681
.2
6,9
17.1
9
0,91
1.3
16,
518.
4 1
,205
.8
5,7
47.7
5
9,70
1.8
7.0
1
,283
,200
.9
1,9
23,9
79.9
Q
tr IV
19,
898.
7 5
,156
.2
20,
556.
0 3
26,8
55.6
3
7,70
9.1
3,1
72.5
1
5,88
8.9
280
,843
.1
27.
6 2
,100
,218
.1
4,0
56,0
41.1
2020
/21
July
10,
826.
4 2
,621
.8
9,1
60.8
1
18,5
33.0
1
4,24
3.5
2,2
60.5
1
0,53
3.1
495
,349
.9
24.
8 9
97,4
04.4
2
,168
,673
.0
Aug
ust
10,
057.
2 2
,371
.8
10,
823.
7 1
42,6
60.4
1
5,88
8.1
7,4
58.3
7
,812
.3
181
,365
.4
21.
5 9
19,4
17.6
1
,844
,270
.5
Sept
embe
r 1
0,99
8.0
2,7
78.4
1
0,69
0.6
142
,615
.2
20,
432.
0 4
,336
.0
7,0
67.4
1
53,8
22.8
3
.0
396
,748
.6
1,1
41,2
52.2
Q
tr I
31,
881.
6 7
,771
.9
30,
675.
1 4
03,8
08.6
5
0,56
3.6
14,
054.
8 2
5,41
2.9
830
,538
.1
49.
2 2
,313
,570
.6
5,1
54,1
95.6
O
ctob
er 1
1,17
9.1
2,5
22.9
6
,904
.5
130
,587
.7
18,
378.
7 2
,711
.2
8,1
44.6
7
2,86
8.2
26.
1 4
51,0
48.6
1
,304
,465
.2
Nov
embe
r 1
1,73
1.6
2,8
36.5
8
,004
.6
99,
658.
9 1
5,72
4.1
1,4
43.4
6
,384
.4
149
,472
.4
15.
4 3
07,5
93.5
1
,069
,955
.7
Dec
embe
r 1
1,65
1.3
2,8
69.4
8
,673
.6
99,
293.
7 1
7,13
8.3
2,6
01.0
1
4,05
4.4
310
,814
.8
17.
0 3
91,2
82.9
1
,464
,362
.4
Qtr
II 3
4,56
2.0
8,2
28.8
2
3,58
2.7
329
,540
.2
51,
241.
1 6
,755
.7
28,
583.
4 5
33,1
55.4
5
8.6
1,1
49,9
24.9
3
,838
,783
.3
Janu
ary
12,
790.
2 1
,949
.4
6,1
93.1
2
68,4
30.5
1
6,09
4.5
1,1
63.2
6
,618
.2
79,
320.
3 2
4.6
673
,243
.4
1,5
78,2
62.1
Fe
brua
ry 1
1,61
6.1
2,3
46.8
8
,365
.6
80,
401.
3 1
1,54
8.2
2,1
39.3
8
,408
.4
73,
810.
5 8
.6
285
,835
.5
974
,667
.5
Mar
ch 1
0,10
5.7
1,5
61.9
8
,375
.4
84,
986.
4 1
5,40
6.5
1,2
23.3
6
,982
.5
95,
557.
4 2
4.5
736
,359
.8
1,4
46,3
10.7
Q
tr III
34,
512.
0 5
,858
.2
22,
934.
1 4
33,8
18.1
4
3,04
9.2
4,5
25.7
2
2,00
9.0
248
,688
.3
57.
7 1
,695
,438
.7
3,9
99,2
40.4
Q
tr IV
26,
523.
13
5,0
16.8
6 2
1,89
5.87
2
34,9
78.3
1 3
9,11
5.40
3
,525
.83
18,
214.
63
399
,896
.62
66.
88
1,5
55,1
50.2
6 4
,104
,815
.89
Sour
ce: E
thio
pian
Cus
tom
s Com
miss
ion
*
** D
ata
on im
port
of p
etro
leum
pro
duc
ts a
re o
btai
ned
from
Eth
iopi
an P
etro
leum
Ent
erpr
ise
** A
ll the
dat
a ar
e up
dat
ed b
ased
on
revi
sed
dat
a fro
m th
e Et
hiop
ian
Cus
tom
s Com
miss
ion

Fourth Quarter 2020/21 | 147
National Bank of Ethiopia Quarterly Bulletin
Tabl
e 28
: Vol
ume
of Im
ports
, by
Maj
or C
omm
odity
Gro
ups*
*(In
Met
ric T
ons)
Perio
dFo
od &
Liv
e A
nim
als
Beve
rage
sTo
bacc
oPe
trole
um C
rude
Petro
leum
Pro
d.**
**C
hem
ical
sFe
rtiliz
ers
Med
ical
& P
harm
. Pro
dSo
ap &
Pol
ishRu
bber
Pro
d.Pa
per &
Pap
er M
anfc
.
2019
/20
July
68,
497.
0 2
,399
.8
204
.4
- 3
30,0
84.4
1
7,27
0.5
2,3
04.3
1
01.7
9
,759
.5
8,7
73.2
1
1,46
3.6
Aug
ust
389
,998
.9
1,2
78.0
4
4.6
- 4
16,9
68.0
2
5,69
2.6
2,0
15.7
1
28.9
7
,395
.8
9,5
62.0
1
0,57
2.5
Sept
embe
r 4
69,1
70.9
1
,187
.1
45.
0 -
263
,239
.4
17,
795.
9 1
,934
.8
16.
0 1
2,14
1.7
7,8
26.4
1
5,38
9.5
Qtr
I 9
27,6
66.8
4
,864
.8
294
.0
- 1
,010
,291
.7
60,
758.
9 6
,254
.8
246
.6
29,
296.
9 2
6,16
1.5
37,
425.
6 O
ctob
er 2
44,6
95.2
1
,360
.9
100
.0
16.
0 3
25,9
43.9
2
3,84
7.3
2,4
61.5
3
0,09
3.9
5,2
74.7
1
4,13
2.1
15,
042.
5 N
ovem
ber
281
,455
.5
1,3
67.6
6
7.0
0.2
2
86,7
16.0
1
6,18
8.4
2,7
77.8
3
59.6
9
,092
.3
9,2
39.2
1
1,62
5.9
Dec
embe
r 1
34,2
17.0
2
,200
.0
133
.9
- 4
01,0
31.4
5
31,0
88.3
1
,356
.0
75.
6 9
,700
.6
8,2
95.5
1
6,06
7.5
Qtr
II 6
60,3
67.6
4
,928
.5
300
.9
16.
2 1
,013
,691
.3
571
,124
.0
6,5
95.3
3
0,52
9.1
24,
067.
6 3
1,66
6.9
42,
735.
8 Ja
nuar
y 1
89,8
33.4
1
,647
.7
61.
3 -
324
,441
.9
19,
311.
0 2
,061
.2
129
.5
7,9
58.6
1
1,60
5.3
11,
491.
0 Fe
brua
ry 1
82,6
71.1
9
86.8
1
45.5
3
7.7
346
,615
.1
12,
449.
5 2
,043
.3
531
.5
6,2
94.7
1
0,52
4.9
10,
221.
8 M
arch
285
,691
.5
1,2
28.9
7
4.2
- 2
84,1
72.4
1
4,28
8.7
1,5
22.6
1
25.2
6
,882
.3
7,6
22.8
1
0,35
9.6
Qtr
III 6
58,1
95.9
3
,863
.4
281
.0
37.
7 9
55,2
29.4
4
6,04
9.3
5,6
27.1
7
86.2
2
1,13
5.6
29,
753.
0 3
2,07
2.4
Apr
il 1
94,5
86.6
7
44.6
2
8.2
- 3
34,9
35.9
1
1,25
1.3
2,9
86.2
1
08.9
3
,814
.3
5,6
71.3
1
0,22
7.1
May
187
,968
.5
753
.1
60.
9 -
227
,020
.2
15,
491.
7 9
74.1
3
2.6
3,7
27.1
8
,097
.0
7,3
90.5
Ju
ne 1
44,7
67.8
1
,671
.5
45.
0 -
326
,027
.5
14,
257.
1 1
,634
.3
63.
0 3
,643
.2
10,
219.
8 8
,359
.1
Qtr
IV 5
27,3
22.9
3
,169
.1
134
.1
- 8
87,9
83.6
4
1,00
0.1
5,5
94.6
2
04.5
1
1,18
4.6
23,
988.
1 2
5,97
6.7
2020
/21
July
608
,995
.1
1,4
09.9
1
09.1
-
272
,666
.7
20,
117.
3 1
,184
.6
77.
4 6
,735
.6
14,
090.
3 7
7,67
8.8
Aug
ust
324
,306
.1
1,1
70.3
8
0.1
- 3
57,7
00.9
1
7,37
0.6
1,6
09.2
1
08.1
9
,710
.4
8,6
78.1
7
,025
.8
Sept
embe
r 2
50,2
96.1
1
,304
.2
70.
4 -
248
,319
.6
16,
695.
3 1
,370
.5
56.
4 9
,305
.8
10,
397.
5 7
,767
.0
Qtr
I 1
,183
,597
.3
3,8
84.4
2
59.6
-
878
,687
.3
54,
183.
2 4
,164
.3
242
.0
25,
751.
8 3
3,16
6.0
92,
471.
6 O
ctob
er 2
88,2
96.6
1
,244
.4
241
.8
- 3
44,4
25.7
1
3,68
1.1
1,4
09.9
1
10.6
5
,177
.9
8,4
28.9
9
,944
.8
Nov
embe
r 3
11,4
44.4
1
,413
.9
31.
1 0
.1
265
,051
.8
16,
107.
7 2
,792
.1
41.
6 6
,721
.3
6,5
94.1
6
,365
.2
Dec
embe
r 5
51,3
10.0
2
,162
.2
175
.3
- 3
28,4
18.3
9
,866
.6
2,2
78.0
6
7.2
7,8
70.3
7
,648
.6
6,9
84.3
Q
tr II
1,1
51,0
51.0
4
,820
.5
448
.2
0.1
9
37,8
95.8
3
9,65
5.5
6,4
80.0
2
19.4
1
9,76
9.5
22,
671.
6 2
3,29
4.3
Janu
ary
232
,013
.7
1,0
89.9
6
6.6
- 3
26,9
32.1
1
4,44
5.7
1,6
00.4
2
2.9
4,4
94.9
5
,602
.3
5,4
86.7
Fe
brua
ry 2
18,2
95.7
1
,063
.2
139
.9
- 3
07,5
46.3
1
1,11
1.0
3,3
02.0
1
29.1
9
,078
.3
6,8
56.9
6
,475
.6
Mar
ch 2
16,7
07.2
7
72.7
2
6.9
- 3
25,5
01.0
1
6,32
8.1
2,1
12.6
6
6.2
5,5
57.3
7
,610
.9
6,6
01.7
Q
tr III
667
,016
.6
2,9
25.7
2
33.4
-
959
,979
.4
41,
884.
8 7
,015
.0
218
.2
19,
130.
5 2
0,07
0.1
18,
564.
0 Q
tr IV
1,1
51,6
72.7
4
,678
.3
361
.8
146
.8
943
,060
.7
40,
642.
6 4
,692
.9
129
.2
18,
759.
1 1
7,00
1.4
19,
183.
1
Tabl
e 28
(con
tinue
d):
Perio
dTe
xtile
sC
loth
ings
Gla
ss &
Gla
ss W
are
Met
al &
Met
al
Man
fc.
Mac
hine
ry &
Airc
raft
Road
Mot
or
Veh
icle
sEl
ectri
cal M
ater
ials
Gra
in*
Tele
com
m. A
ppar
a.O
ther
sG
RAN
D T
OTA
L
2019
/20
July
11,
062.
2 3
,199
.1
26,
698.
2 1
51,3
21.5
2
1,02
5.0
27,
363.
3 1
6,57
2.3
50,
710.
2 3
4.8
269
,904
.9
978
,039
.7
Aug
ust
13,
207.
5 2
,269
.9
15,
207.
7 2
13,4
42.2
1
6,06
0.5
16,
440.
0 9
,355
.9
60,
409.
6 2
2.4
318
,861
.6
1,4
68,5
24.5
Se
ptem
ber
10,
225.
0 1
,940
.0
10,
542.
0 1
12,3
42.5
1
6,13
0.6
5,7
92.1
7
,541
.6
33,
083.
3 3
7.0
302
,420
.5
1,2
55,7
18.0
Q
tr I
34,
494.
7 7
,409
.0
52,
447.
9 4
77,1
06.2
5
3,21
6.1
49,
595.
4 3
3,46
9.8
144
,203
.0
94.
1 8
91,1
87.1
3
,702
,282
.2
Oct
ober
11,
241.
9 2
,720
.1
15,
573.
9 2
20,2
58.2
1
7,85
1.2
5,9
32.4
1
2,46
9.4
47,
599.
1 2
7.2
776
,008
.6
1,7
25,0
51.0
N
ovem
ber
10,
400.
9 2
,728
.9
16,
106.
4 1
42,4
40.3
3
3,54
0.0
7,8
85.8
2
1,81
1.7
71,
596.
0 7
4.0
249
,668
.5
1,1
03,5
46.1
D
ecem
ber
12,
727.
2 3
,109
.8
15,
719.
5 1
70,3
21.3
2
2,44
8.1
4,6
35.7
9
,538
.9
54,
787.
5 4
1.1
230
,033
.1
1,5
72,7
40.3
Q
tr II
34,
370.
0 8
,558
.8
47,
399.
8 5
33,0
19.9
7
3,83
9.3
18,
454.
0 4
3,82
0.0
173
,982
.6
142
.3
1,2
55,7
10.3
4
,401
,337
.5
Janu
ary
11,
668.
7 2
,780
.1
16,
338.
1 1
21,0
88.0
1
7,52
0.5
3,8
90.5
1
1,30
0.3
30,
576.
8 5
6.6
602
,680
.3
1,3
55,8
63.9
Fe
brua
ry 1
1,00
8.8
2,1
79.8
1
2,69
9.3
139
,102
.0
23,
621.
4 5
,190
.5
10,
672.
4 6
5,19
1.0
99.
7 5
23,0
73.9
1
,300
,169
.7
Mar
ch 8
,814
.0
1,2
11.4
1
2,25
2.4
145
,953
.0
18,
020.
6 2
,859
.8
7,5
37.7
4
3,24
0.3
10.
2 4
33,0
45.1
1
,241
,672
.3
Qtr
III 3
1,49
1.6
6,1
71.2
4
1,28
9.8
406
,143
.0
59,
162.
4 1
1,94
0.7
29,
510.
5 1
39,0
08.2
1
66.6
1
,558
,799
.3
3,8
97,7
05.9
A
pril
5,7
16.4
1
,676
.1
5,5
73.9
1
53,1
76.9
8
,996
.9
632
.4
3,9
92.7
1
49,4
14.3
8
.0
490
,376
.5
1,2
34,5
04.1
M
ay 7
,080
.1
1,7
98.9
8
,064
.9
82,
767.
5 1
2,19
3.9
1,3
34.3
6
,148
.5
71,
727.
0 1
2.6
326
,640
.7
897
,557
.1
June
7,1
02.3
1
,681
.2
6,9
17.1
9
0,91
1.3
16,
518.
4 1
,205
.8
5,7
47.7
5
9,70
1.8
7.0
1
,283
,200
.9
1,9
23,9
79.9
Q
tr IV
19,
898.
7 5
,156
.2
20,
556.
0 3
26,8
55.6
3
7,70
9.1
3,1
72.5
1
5,88
8.9
280
,843
.1
27.
6 2
,100
,218
.1
4,0
56,0
41.1
2020
/21
July
10,
826.
4 2
,621
.8
9,1
60.8
1
18,5
33.0
1
4,24
3.5
2,2
60.5
1
0,53
3.1
495
,349
.9
24.
8 9
97,4
04.4
2
,168
,673
.0
Aug
ust
10,
057.
2 2
,371
.8
10,
823.
7 1
42,6
60.4
1
5,88
8.1
7,4
58.3
7
,812
.3
181
,365
.4
21.
5 9
19,4
17.6
1
,844
,270
.5
Sept
embe
r 1
0,99
8.0
2,7
78.4
1
0,69
0.6
142
,615
.2
20,
432.
0 4
,336
.0
7,0
67.4
1
53,8
22.8
3
.0
396
,748
.6
1,1
41,2
52.2
Q
tr I
31,
881.
6 7
,771
.9
30,
675.
1 4
03,8
08.6
5
0,56
3.6
14,
054.
8 2
5,41
2.9
830
,538
.1
49.
2 2
,313
,570
.6
5,1
54,1
95.6
O
ctob
er 1
1,17
9.1
2,5
22.9
6
,904
.5
130
,587
.7
18,
378.
7 2
,711
.2
8,1
44.6
7
2,86
8.2
26.
1 4
51,0
48.6
1
,304
,465
.2
Nov
embe
r 1
1,73
1.6
2,8
36.5
8
,004
.6
99,
658.
9 1
5,72
4.1
1,4
43.4
6
,384
.4
149
,472
.4
15.
4 3
07,5
93.5
1
,069
,955
.7
Dec
embe
r 1
1,65
1.3
2,8
69.4
8
,673
.6
99,
293.
7 1
7,13
8.3
2,6
01.0
1
4,05
4.4
310
,814
.8
17.
0 3
91,2
82.9
1
,464
,362
.4
Qtr
II 3
4,56
2.0
8,2
28.8
2
3,58
2.7
329
,540
.2
51,
241.
1 6
,755
.7
28,
583.
4 5
33,1
55.4
5
8.6
1,1
49,9
24.9
3
,838
,783
.3
Janu
ary
12,
790.
2 1
,949
.4
6,1
93.1
2
68,4
30.5
1
6,09
4.5
1,1
63.2
6
,618
.2
79,
320.
3 2
4.6
673
,243
.4
1,5
78,2
62.1
Fe
brua
ry 1
1,61
6.1
2,3
46.8
8
,365
.6
80,
401.
3 1
1,54
8.2
2,1
39.3
8
,408
.4
73,
810.
5 8
.6
285
,835
.5
974
,667
.5
Mar
ch 1
0,10
5.7
1,5
61.9
8
,375
.4
84,
986.
4 1
5,40
6.5
1,2
23.3
6
,982
.5
95,
557.
4 2
4.5
736
,359
.8
1,4
46,3
10.7
Q
tr III
34,
512.
0 5
,858
.2
22,
934.
1 4
33,8
18.1
4
3,04
9.2
4,5
25.7
2
2,00
9.0
248
,688
.3
57.
7 1
,695
,438
.7
3,9
99,2
40.4
Q
tr IV
26,
523.
13
5,0
16.8
6 2
1,89
5.87
2
34,9
78.3
1 3
9,11
5.40
3
,525
.83
18,
214.
63
399
,896
.62
66.
88
1,5
55,1
50.2
6 4
,104
,815
.89
Sour
ce: E
thio
pian
Cus
tom
s Com
miss
ion
*
** D
ata
on im
port
of p
etro
leum
pro
duc
ts a
re o
btai
ned
from
Eth
iopi
an P
etro
leum
Ent
erpr
ise
** A
ll the
dat
a ar
e up
dat
ed b
ased
on
revi
sed
dat
a fro
m th
e Et
hiop
ian
Cus
tom
s Com
miss
ion
Tabl
e 29
: Vol
ume
of Im
ports
, by
endu
se
(In M
etric
Ton
s)
Perio
d
2019
/20
2020
/21
Qtr
IQ
tr II
Qtr
IIIQ
tr IV
Ann
ual
Qtr
IQ
tr II
Qtr
IIIQ
tr IV
Ann
ual
Raw
Mat
eria
ls 1
,246
.52
1,3
28.6
0 1
,258
.09
1,2
37.6
7 5
,070
.88
1,2
47.8
7 1
,503
.14
1,2
42.8
4 1
,407
.07
5,4
00.9
1 Se
mi-fi
nish
ed G
ood
s 2
0,57
6.67
2
1,28
5.22
3
0,48
1.29
2
5,45
2.87
9
7,79
6.04
2
0,47
6.47
1
9,41
9.26
3
4,58
2.42
3
0,92
8.54
1
05,4
06.6
9
Che
mic
als
5,8
79.4
0 3
,564
.76
3,3
04.8
1 3
,994
.34
16,
743.
30
4,7
49.2
3 4
,010
.89
4,8
94.2
5 5
,236
.39
18,
890.
76
F
ertil
izers
657
.48
269
.57
10,
787.
89
7,8
02.0
5 1
9,51
7.00
3
42.9
0 9
57.8
9 1
5,53
1.95
1
1,19
8.44
2
8,03
1.17
Tex
tile
Mat
eria
ls 8
16.4
1 7
55.3
0 1
,090
.54
823
.25
3,4
85.5
1 1
,060
.09
1,4
20.7
3 1
,438
.48
1,4
40.4
3 5
,359
.73
Oth
ers
13,
223.
37
16,
695.
59
15,
298.
05
12,
833.
23
58,
050.
24
14,
324.
26
13,
029.
75
12,
717.
74
13,
053.
29
53,
125.
03
Fu
el 1
7,26
8.47
1
9,36
5.31
1
7,59
0.10
1
0,46
1.60
6
4,68
5.48
1
3,50
3.83
1
5,33
2.03
2
2,30
3.40
2
5,48
6.53
7
6,62
5.78
Cru
de
petro
leum
- 0
.26
1.7
1 -
1.9
6 -
0.0
8 -
10.
25
10.
32
Pe
trole
um P
rod
ucts
* 1
6,69
9.93
1
8,61
6.35
1
6,75
1.62
9
,988
.98
62,
056.
89
12,
800.
03
14,
735.
94
20,
803.
19
24,
258.
31
72,
597.
46
Oth
ers
568
.54
748
.69
836
.77
472
.62
2,6
26.6
2 7
03.8
0 5
96.0
1 1
,500
.20
1,2
17.9
7 4
,017
.99
Cap
ital G
ood
s 2
9,66
8.84
3
9,59
2.26
3
3,22
0.65
2
5,74
8.05
1
28,2
29.8
0 3
4,62
7.81
3
6,50
5.93
3
7,84
4.53
4
2,69
1.36
1
51,6
69.6
3
T
rans
port
4,0
17.7
9 3
,279
.03
3,1
69.6
4 1
,782
.96
12,
249.
42
3,8
18.0
0 2
,556
.70
2,7
56.1
9 4
,559
.26
13,
690.
16
Ty
res f
or H
eavy
Veh
icle
s 8
33.1
8 9
39.2
9 1
,218
.87
1,2
00.0
0 4
,191
.33
1,4
86.7
8 1
,093
.71
904
.29
815
.06
4,2
99.8
3
Heav
y Ro
ad M
otor
Veh
. 2
,632
.86
1,3
34.5
5 1
,278
.05
406
.69
5,6
52.1
4 9
98.7
0 8
71.0
5 5
48.8
2 5
35.5
7 2
,954
.13
A
ircra
ft 4
60.6
5 8
84.8
8 5
37.3
6 1
50.8
3 2
,033
.72
528
.70
465
.70
1,2
37.7
3 3
,096
.18
5,3
28.3
2
Oth
ers
91.
10
120
.30
135
.37
25.
45
372
.22
803
.82
126
.25
65.
35
112
.45
1,1
07.8
8 A
gric
ultu
ral
484
.19
933
.41
645
.06
682
.99
2,7
45.6
5 7
48.3
4 1
,671
.41
476
.75
525
.96
3,4
22.4
6 I
ndus
trial
25,
166.
87
35,
379.
83
29,
405.
95
23,
282.
09
113
,234
.74
30,
061.
47
32,
277.
81
34,
611.
59
37,
606.
14
134
,557
.01
Con
sum
er G
ood
s 3
3,45
6.83
3
1,70
8.67
3
2,69
3.08
2
6,85
6.10
1
24,7
14.6
9 5
3,23
3.28
5
1,40
9.44
4
4,68
8.26
6
4,04
9.91
2
13,3
80.8
9
D
urab
les
8,1
85.5
0 7
,433
.48
7,9
44.0
2 4
,962
.80
28,
525.
81
7,4
29.5
7 7
,687
.61
7,4
19.9
4 8
,776
.69
31,
313.
80
Rad
io &
T.V
. 6
82.6
8 7
68.9
6 3
09.5
4 1
86.3
1 1
,947
.48
336
.84
575
.63
632
.63
516
.37
2,0
61.4
7
Tyre
s for
car
s & O
ther
Veh
. 3
43.2
9 4
38.9
3 5
08.4
7 3
06.0
7 1
,596
.76
381
.78
395
.90
341
.91
357
.84
1,4
77.4
2
Car
s & O
ther
Veh
. 1
,931
.12
1,1
51.7
7 3
13.5
4 5
9.14
3
,455
.56
169
.43
224
.02
278
.41
140
.46
812
.32
O
ther
s 5
,228
.42
5,0
73.8
3 6
,812
.48
4,4
11.2
8 2
1,52
6.01
6
,541
.53
6,4
92.0
6 6
,166
.99
7,7
62.0
1 2
6,96
2.59
N
on-d
urab
les
25,
271.
33
24,
275.
19
24,
749.
06
21,
893.
30
96,
188.
88
45,
803.
71
43,
721.
83
37,
268.
32
55,
273.
23
182
,067
.09
C
erea
ls 8
,375
.00
6,0
79.6
4 7
,056
.97
4,5
43.4
1 2
6,05
5.01
6
,965
.06
12,
425.
55
12,
210.
79
21,
652.
09
53,
253.
48
O
ther
Foo
d 4
,341
.13
4,8
72.3
0 4
,136
.69
3,3
88.3
7 1
6,73
8.49
1
3,37
5.35
8
,159
.74
4,3
73.4
5 6
,103
.75
32,
012.
30
M
edic
al &
Pha
rmac
eutic
als
4,3
63.8
4 4
,985
.29
5,3
15.4
3 6
,692
.12
21,
356.
68
3,9
33.5
8 7
,757
.37
7,7
70.9
1 7
,180
.66
26,
642.
51
Te
xtile
Fab
rics
3,1
73.0
8 3
,406
.18
2,9
25.2
0 2
,795
.98
12,
300.
45
4,5
46.5
7 6
,022
.63
4,4
66.8
9 3
,563
.19
18,
599.
28
O
ther
s 5
,018
.28
4,9
31.7
7 5
,314
.78
4,4
73.4
2 1
9,73
8.25
1
6,98
3.15
9
,356
.55
8,4
46.2
8 1
6,77
3.54
5
1,55
9.52
M
iscel
lane
ous
6,7
75.7
7 2
,143
.24
1,5
20.9
0 1
,252
.56
11,
692.
47
1,3
38.8
6 1
,679
.74
1,9
58.0
3 1
,880
.60
6,8
57.2
4 To
tal I
mpo
rts 1
08,9
93.1
0 1
15,4
23.3
0 1
16,7
64.1
0 9
1,00
8.85
4
32,1
89.3
5 1
24,4
28.1
2 1
25,8
49.5
3 1
42,6
19.4
7 1
66,4
44.0
2 5
59,3
41.1
5 So
urce
: Eth
iopi
an C
usto
ms C
omm
issio
n
* D
ata
on im
port
of p
etro
leum
pro
duc
ts a
re o
btai
ned
from
Eth
iopi
an P
etro
leum
Ent
erpr
ise
** A
ll the
dat
a ar
e up
dat
ed b
ased
on
revi
sed
dat
a fro
m th
e Et
hiop
ian
Cus
tom
s Com
miss
ion

148 | Fourth Quarter 2020/21
National Bank of Ethiopia Quarterly Bulletin Ta
ble
30:
Num
ber a
nd In
vest
men
t Cap
ital o
f Dom
etic
and
For
eign
Pro
ject
s A
ppro
ved
by S
ecto
r
Sect
or/S
ub-s
ecto
r
2012
(201
9/20
)20
13(2
020/
21)
QI
QII
QIII
QIV
QI
QII
QIII
QIV
"No
of
proj
ects
"In
vest
men
t C
apita
l"N
o of
pr
ojec
ts"
Inve
stm
ent
Cap
ital
"No
of
proj
ects
""In
vest
men
t C
apita
l""N
o of
pr
ojec
ts"
"Inve
stm
ent
Cap
ital"
"No
of
proj
ects
"
"Inve
st-
men
t C
apita
l"
"No
of
proj
ects
"
"Inve
st-
men
t C
apita
l"
"No
of
proj
ects
"
"Inve
st-
men
t C
apita
l"
"No
of
proj
ects
""In
vest
men
t C
apita
l"
Man
ufac
turin
g5.
040
.32
19.9
1117
3.9
14.
51
133
418
418
8.53
5
Agr
icul
ture
, hun
ting
and
fore
stry
110
.5
Real
est
ate,
rent
ing
and
bus
ines
s act
iviti
es2
162
23.9
233
.91
1.6
320
314
.92
3.5
835
.4
Hote
ls an
d re
stau
rant
s1
500
Educ
atio
n 1
2.5
Heal
th a
nd so
cial
wor
k2
302
318
Con
stru
ctio
n2
4.4
549
.91
3.6
513
.49
41.1
79
26.5
716
.445
Who
lesa
le, r
etai
l tra
de
and
repa
ir se
rvic
e
Tran
spor
t, st
orag
e an
d
com
mun
icat
ion
16.
01
11.9
220
.76
416
.11
4
Min
ing
and
Qua
rryin
g
Elec
trici
ty, g
as, s
team
and
wat
er su
pply
Con
stru
ctio
n m
achi
nery
leas
ing
Fish
ing
"Oth
er c
omm
unity
, soc
ial
and
per
sona
l ser
vice
act
iviti
es"
19.
61
1759
.74
113
.615
117
.21
8.31
6
Oth
ers
9.6
117
59.7
41
13.6
151
17.2
18.
316
Gra
nd T
otal
9.0
60.7
1099
.77
361.
022
219.
916
1846
.169
516
1.51
920
81.3
2275
2.69
6
Sour
ce: E
thio
pia
Inve
stm
ent A
genc
y
Tabl
e 31
: Ex
pect
ed E
mpl
oym
ent C
reat
ion
of A
ppro
ved
Dom
estic
$ F
orei
gn In
vest
men
t Pro
ject
s by
Sec
tor[P
ERM
AN
ENT &
TEM
PORA
RY]
(C
apita
l in M
illion
s of B
irr)
Sect
or/S
ub-s
ecto
r
2011
(201
8/19
)20
12(2
019/
20)
2013
(202
0/21
)
QI
QII
QIII
QIV
QI
QII
QIII
QIV
QI
QII
QIII
QIV
Perm
. E
mp.
Tem
po.
Em
p.Pe
rm.
Em
p.Te
mpo
. E
mp.
Perm
. E
mp.
Tem
po.
Em
p.Pe
rm.
Em
p.Te
mpo
. E
mp.
Perm
. E
mp.
Tem
po.
Em
p.Pe
rm.
Em
p.Te
mpo
. E
mp.
Perm
. E
mp.
Tem
po.
Em
p.Pe
rm.
Em
p.Te
mpo
. E
mp.
Perm
. E
mp.
Tem
po.
Em
p.Pe
rm.
Em
p.Te
mpo
. E
mp.
Perm
. E
mp.
Tem
po.
Em
p.Pe
rm.
Em
p.Te
mpo
. E
mp.
Man
ufac
turin
g83
7735
5614
1617
277
316
939
2017
4939
4135
950
025
2152
-22
8537
Agr
icul
ture
, hun
ting
and
fo
rest
ry 5
0 2
25
48.0
710.
042
560
630
03
5-
-
Real
est
ate,
rent
ing
and
bu
sines
s act
iviti
es 1
,036
4
08
537
710
405
2013
589
.012
2012
200
470
-3
132
290
Hote
ls an
d re
stau
rant
s 1
8 -
--
-15
0.0
150
Educ
atio
n 1
8 2
0 13
2.0
130.
050
42
2-
--
-
Heal
th a
nd so
cial
wor
k 2
5 8
86
6-
--
Con
stru
ctio
n 2
,940
9
65
57.0
60.0
8529
613
321
2.0
1216
02
18
2-
-18
472
28
Who
lesa
le, r
etai
l tra
de
and
repa
ir se
rvic
e-
--
-
Tran
spor
t, st
orag
e an
d
com
mun
icat
ion
30
411
733
--
552
Min
ing
and
Qua
rryin
g25
6210
30-
--
-
Elec
trici
ty, g
as, s
team
an
d w
ater
supp
ly
--
--
Con
stru
ctio
n m
achi
nery
le
asin
g-
--
-
Fish
ing
--
--
"Oth
er c
omm
unity
, soc
ial
and
per
sona
l ser
vice
ac
tiviti
es"
12
--
--
Oth
ers
12.0
105.
027
53
23
5-
17
Gra
nd T
otal
1250
651
7422
0218
8713
3011
0742
6223
9251
6138
766
014
66
4436
362
255
470
244
9938
6.0
485.
0
Sour
ce: E
thio
pia
Inve
stm
ent A
genc
y
*Pro
ject
s with
Initi
al In
vest
men
t Cap
ital b
elow
Birr
250
,000
are
not
incl
uded
.

Fourth Quarter 2020/21 | 149
National Bank of Ethiopia Quarterly Bulletin
Tabl
e 30
: N
umbe
r and
Inve
stm
ent C
apita
l of D
omet
ic a
nd F
orei
gn P
roje
cts
App
rove
d by
Sec
tor
Sect
or/S
ub-s
ecto
r
2012
(201
9/20
)20
13(2
020/
21)
QI
QII
QIII
QIV
QI
QII
QIII
QIV
"No
of
proj
ects
"In
vest
men
t C
apita
l"N
o of
pr
ojec
ts"
Inve
stm
ent
Cap
ital
"No
of
proj
ects
""In
vest
men
t C
apita
l""N
o of
pr
ojec
ts"
"Inve
stm
ent
Cap
ital"
"No
of
proj
ects
"
"Inve
st-
men
t C
apita
l"
"No
of
proj
ects
"
"Inve
st-
men
t C
apita
l"
"No
of
proj
ects
"
"Inve
st-
men
t C
apita
l"
"No
of
proj
ects
""In
vest
men
t C
apita
l"
Man
ufac
turin
g5.
040
.32
19.9
1117
3.9
14.
51
133
418
418
8.53
5
Agr
icul
ture
, hun
ting
and
fore
stry
110
.5
Real
est
ate,
rent
ing
and
bus
ines
s act
iviti
es2
162
23.9
233
.91
1.6
320
314
.92
3.5
835
.4
Hote
ls an
d re
stau
rant
s1
500
Educ
atio
n 1
2.5
Heal
th a
nd so
cial
wor
k2
302
318
Con
stru
ctio
n2
4.4
549
.91
3.6
513
.49
41.1
79
26.5
716
.445
Who
lesa
le, r
etai
l tra
de
and
repa
ir se
rvic
e
Tran
spor
t, st
orag
e an
d
com
mun
icat
ion
16.
01
11.9
220
.76
416
.11
4
Min
ing
and
Qua
rryin
g
Elec
trici
ty, g
as, s
team
and
wat
er su
pply
Con
stru
ctio
n m
achi
nery
leas
ing
Fish
ing
"Oth
er c
omm
unity
, soc
ial
and
per
sona
l ser
vice
act
iviti
es"
19.
61
1759
.74
113
.615
117
.21
8.31
6
Oth
ers
9.6
117
59.7
41
13.6
151
17.2
18.
316
Gra
nd T
otal
9.0
60.7
1099
.77
361.
022
219.
916
1846
.169
516
1.51
920
81.3
2275
2.69
6
Sour
ce: E
thio
pia
Inve
stm
ent A
genc
y
Tabl
e 31
: Ex
pect
ed E
mpl
oym
ent C
reat
ion
of A
ppro
ved
Dom
estic
$ F
orei
gn In
vest
men
t Pro
ject
s by
Sec
tor[P
ERM
AN
ENT &
TEM
PORA
RY]
(C
apita
l in M
illion
s of B
irr)
Sect
or/S
ub-s
ecto
r
2011
(201
8/19
)20
12(2
019/
20)
2013
(202
0/21
)
QI
QII
QIII
QIV
QI
QII
QIII
QIV
QI
QII
QIII
QIV
Perm
. E
mp.
Tem
po.
Em
p.Pe
rm.
Em
p.Te
mpo
. E
mp.
Perm
. E
mp.
Tem
po.
Em
p.Pe
rm.
Em
p.Te
mpo
. E
mp.
Perm
. E
mp.
Tem
po.
Em
p.Pe
rm.
Em
p.Te
mpo
. E
mp.
Perm
. E
mp.
Tem
po.
Em
p.Pe
rm.
Em
p.Te
mpo
. E
mp.
Perm
. E
mp.
Tem
po.
Em
p.Pe
rm.
Em
p.Te
mpo
. E
mp.
Perm
. E
mp.
Tem
po.
Em
p.Pe
rm.
Em
p.Te
mpo
. E
mp.
Man
ufac
turin
g83
7735
5614
1617
277
316
939
2017
4939
4135
950
025
2152
-22
8537
Agr
icul
ture
, hun
ting
and
fo
rest
ry 5
0 2
25
48.0
710.
042
560
630
03
5-
-
Real
est
ate,
rent
ing
and
bu
sines
s act
iviti
es 1
,036
4
08
537
710
405
2013
589
.012
2012
200
470
-3
132
290
Hote
ls an
d re
stau
rant
s 1
8 -
--
-15
0.0
150
Educ
atio
n 1
8 2
0 13
2.0
130.
050
42
2-
--
-
Heal
th a
nd so
cial
wor
k 2
5 8
86
6-
--
Con
stru
ctio
n 2
,940
9
65
57.0
60.0
8529
613
321
2.0
1216
02
18
2-
-18
472
28
Who
lesa
le, r
etai
l tra
de
and
repa
ir se
rvic
e-
--
-
Tran
spor
t, st
orag
e an
d
com
mun
icat
ion
30
411
733
--
552
Min
ing
and
Qua
rryin
g25
6210
30-
--
-
Elec
trici
ty, g
as, s
team
an
d w
ater
supp
ly
--
--
Con
stru
ctio
n m
achi
nery
le
asin
g-
--
-
Fish
ing
--
--
"Oth
er c
omm
unity
, soc
ial
and
per
sona
l ser
vice
ac
tiviti
es"
12
--
--
Oth
ers
12.0
105.
027
53
23
5-
17
Gra
nd T
otal
1250
651
7422
0218
8713
3011
0742
6223
9251
6138
766
014
66
4436
362
255
470
244
9938
6.0
485.
0
Sour
ce: E
thio
pia
Inve
stm
ent A
genc
y
*Pro
ject
s with
Initi
al In
vest
men
t Cap
ital b
elow
Birr
250
,000
are
not
incl
uded
.
150 | Fourth Quarter 2020/21
National Bank of Ethiopia Quarterly Bulletin

Fourth Quarter 2020/21 | 151
National Bank of Ethiopia Quarterly Bulletin

152 | Fourth Quarter 2020/21
National Bank of Ethiopia Quarterly Bulletin

Currency and Time
Currency Currency Unit: Birr (Br) Exchange Rate: Look at Page 62
Time
** There is a difference of about 73/4 Years between Gregorian and Ethiopian Calendar
Fisical Year: July 8th to July 7th
Coffee Year: October to SeptemberCalendar Year: September 11 to September 10

4


