8. �3�"F 1. Federal Highway Administration [FHWA] and
Federal Transit Administration [FTA](2003) "Highway and rail transit tunnel inspection manual".
2. The Highways Agency (1995) "Inspection and
records for road tunnels", BD53/95. 3. World Road Association (PIARC) (2005)"Good
practice for the operation and maintenance of road tunnels., Piarc.
4. Botelho, Frank V.(2001) "A light at the end of
tunnel", Public Roads.
Research Note
Road Tunnel Management System in Iran (RTMS)
M. Gharouni Nik, Assistant Professor, Department of Railway Engineering, Iran University of Science and Technology (IUST)
Email: [email protected] ABSTRACT Existence of vast mountainous areas in Iran has caused construction of many tunnels for connection of the provinces and regions of the country. Maintenance of road tunnels in Iran has been performed in the past with traditional method and only based on observational and occasional inspections. The most important factors in determining the appropriate method of maintenance has been experiences of the operators and the life cycle and prioritization of tunnels based on their present situation in road network have not been paid attention. In order to achieve the goals established for the administration, operation and maintenance of a tunnel it is necessary to have one or more systems to collect the relevant information and make it available at all times. Such a system is termed a Road Tunnel Management System (RTMS). Nowadays, with regard to increasing age of tunnels, maintenance is not solely sufficient and establishment of a system for management and systematic maintenance of tunnels is necessary. Tunnel Management System is a valuable tool which helps the directors in performing optimum maintenance in tunnels, allocating appropriate financial support and alarms tunnel owners in critical conditions. In some countries, national regulations refer to tunnel operations. This requires the production and delivery of documents and reports to various authorities on the condition and maintenance undertaken on the tunnel structures and safety equipment. This may include all the maintenance work and inspections done by the operator. The inspection and maintenance records must be easily retrieved for examination by these authorities. Such systems may be manual, but it is more efficient if they are computer based. This paper has been prepared based on the results of a research programme to establish a system for road management in Iran. In this paper after defining the concept of Road Tunnel Management System (RTMS) and main goals of its establishment, the main stages in this regard have been defined and considered separately. The methods of gradation of tunnel components after inspections in conjunction with structural, electrical and mechanical systems gradation tables have been presented. Finally, the method of RTMS software operation has been explained. Keywords: Road Tunnel management system, Tunnel inspection, maintenance
هاي آبياري و زهكشي ملي مسائل ژئوتكنيكي شبكه سمينارومين د
1389ارديبهشت
يعيطب افيشده با ال تيتثبي ها خاكتراكم يبررسIRGID2-70
راني، دانشگاه علم و صنعت ااستاديار، كين يقارون يمرتض •)[email protected](
راني، دانشگاه علم و صنعت ادانشجوي كارشناسي ارشد، جليل كاظمي •
چكيدهبـا يگـاه ، يو زهكشـ ياريـ آب يجملـه كانالهـا مختلـف از هاي سازه يكيمطالعات ژئوتكن انيدر جر
را ينامتعـارف طيبوده و شـرا يخواص مسئله دار يكه دارا شود مي برخورد يخاصشناسي نيزم التيتشكرا با كانالها نيسازنده ا، خاك بستر دهيچيپ طيشرا نيا. آورند مي وجود بهانتقال آب يكانالها ياجرا يبرا
اثـرات نيا ليتقل يبرا ييراهكار يستيسازد كه با مي مواجه ها آنو پس از ساخت نيح يمشكالت فراوانـ مي است كه يياز راهها يكيكانالها نيدار در بستر ا مسئله يها خاك تياصالح و تثب. شود ارايه بـه دتوان
هـا خـاك يكيو مكـان يكـ يزيخواص فبهبود كه به منظور ها خاك تيتثب .ديبنما يانيمهم كمك شا نيا، روشها با توجه به نـوع پـروژه و عمـر آن نيكه ا گردد مي اجرا يمتفاوت اريبس يبه روشها، شود مي انجام
عمـل . رديـ گ مي مورد استفاده قرار، وارده بر سازه ساخته شده يبارها زانيزمان استفاده و م، تيهدف تثبرا آنپـذيري خاك شده و نفوذ يباربر تيو ظرف يمقاومت برش شيهمراه با تراكم خاك باعث افزا تيتثب
، كـاه ، بـامبو : يعـ يطب افيشده با چهار ال تيي تثبها خاكتراكم يمطالعه به بررس نيا در .دهد مي كاهشمختلـف افيـ چـون ال . نشده پرداخته شـده اسـت تيبا خاك تثب ها آناز كيهر سهيمقا و ساليس خرما و
نـد بـه توان مي، وجود دارند عتيدر طب ياديبه مقدار ز نيو كاربرانشان سازگارترند وهمچن طيبا مح يعيطب يمثـل كانالهـا ( نـد ينما را تحمل مـي يكه بار كمتر يهاي خاك در سازهبه ويژه خاك كننده تيعنوان تثب
.رنديمورد استفاده قرار گ) يو زهكش ياريآب ساليس، خرما، كاه، بامبو، يعيطب افيال، تيتثب، تراكم، ياريآب يكانالها: هاي كليدي واژه
مقدمهوزن طبقات قيوارده از طر يتحمل فشارها يبرا يمقاومت كاف يداراراه كه خاك بستر يدر صورت
و بـاال بـردن مقـدار مقاومـت آن تـا حـد تيـ تثب يبرا. حمل و نقل و بار را نداشته باشد ليوسا، يروساز
داريـ مقاوم و پا يبرا شهيهمتقريباً . مناسب اصالح كرد تيتثب يآن را با استفاده از روشها يستيمطلوب با... و يو زهكش ياريآب يكانالها، حايل يوارهايد، ها ساختمان يپ، راهها، آهن راهدر يخاك يكردن بسترها
را بـه همـراه ياديـ زهـاي نهيهز نكهيعالوه براها روش نيا. شود مي استفاده تيتثب شيميايي ياز روشها ياند از همـان ابتـدا كه در آن به كار رفته يطيمح يبرا رشانيپذ بيقابل تخر ريغ ماهيت به علت، دارند
بودنشان شيمياييبه علت نيهمچن. را به همراه دارند يطيمح ستيدوره استفاده مشكالت ز انيكار تا پا .آورند مي را به وجود يبدنهاي بيشان آس كاربران يبرا
، سازگار هسـتند عتيبا طبكامالً از نظر اجرايي، نييهاي پا نهيعالوه بر هز يعيهاي طب كننده تيتثب اماهاي موجـود در آن منطقـه اسـتفاده افياست از همان ال ازيخاك مورد ن تيتثب كهيياغلب در جا نيهمچناسـتفاده شـده شـود مي افتيخرما كه به وفور در بم افيشهر بم از ال يخاك يبسترها تيدر تثب. كنند مي
مقاوم كردن خاك استفاده يبرا لينارگ افياز ال، شود مي افتي لينارگ ياديدر هند كه به مقدار ز اي. است .خاك دارد تيكاربرد را در تثب نيشتريبامبو ب افيدر حال حاضر ال نيدر چ نيهمچن. كنند مي
نـوع ، هـاي اجـرا نـه يبه هز ياستفاده شود بستگبايستي تيپروژه كدام روش تثب كيدر نكهيا نييتعشـود و در يبه دقت بررسـ جزييات نيا يتمام ديدارد كه با... استفاده و طول دوره، تيهدف از تثب، خاك .ردياز چند روش مختلف مورد استفاده قرار بگ يقيتلف اياز روشها يكي تينها
نـه يمقـدار درصـد به نيـي با هـدف تع يعيطب افيبا استفاده از ال ها خاك تيامكان تثب يبررس نيا درن منطقـه آموجـود در يعيطب افيمورد مطالعه قرار گرفته است و بسته به منطقه مورد مطالعه از ال، افيال
، هـم فـرق دارد بـا انـد شده تيثبت افيال نييي كه با اها خاكنوع نكهياستفاده شده است كه با توجه به ا .شده است سهيبا خاك تنها مقا افيال-مخلوط خاك
مواد و روشهابـراي هـر شيآزمـا ينمونه خاك مورد نظر برا، منطقه يعيطب افيحاضر با توجه به نوع ال مطالعهدر
افيـ الهـاي صـه مشخو ) 1( در جدول ها خاك نيامهندسي هاي مشخصهكه باشد مينوع الياف متفاوت .آورده شده است) 2( در جدول شيمورد آزما
ها نمونه يساز آمادهبسته بـه هـدف از تثبيـت به صورت خشك مخلوط كرده و سپس يعيطب افيمورد نظر را با الخاك
ها در اين مطالعه نتايج آزمايش تراكم بر روي نمونه. شود ميانجام ها نمونه يروگوناگون بر هاي شيآزمامورد نظر جدا شـده يجهت اختالط با درصد وزن ازيمورد ن اليافمقدار خاك و . گيرد مورد بررسي قرار مي
طدر حالت خشك و با دست مخلـو كنواختيهمگن و نسبتاًمخلوط كيآوردن دست بهدو جهت نيو ا .شود مي
آزمايش تراكمو درصـد مميخشـك مـاكز يتراكم انجام شده است و مقدار چگال شيها آزما هر كدام از نمونه يبرا
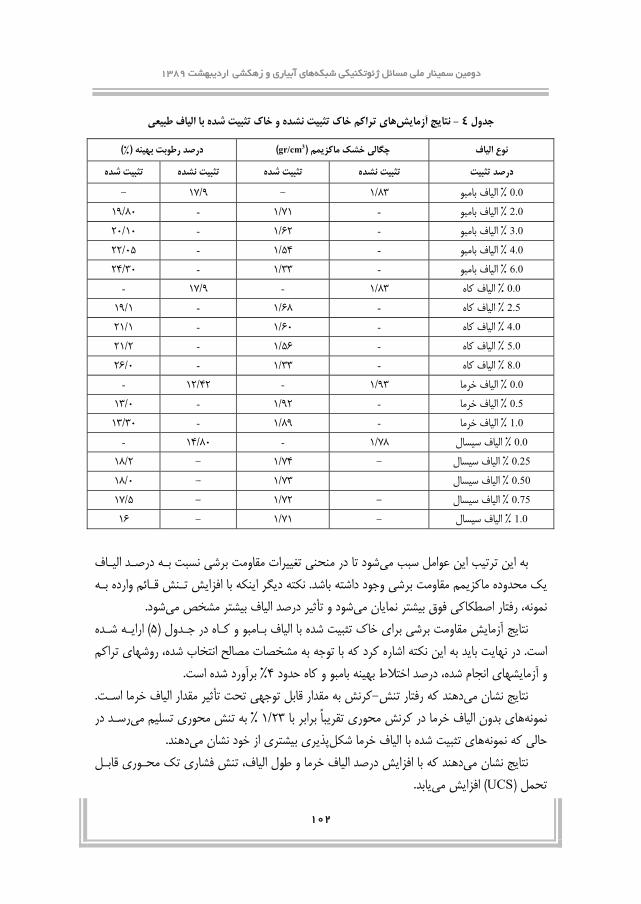
) 3( طبـق جـدول افيتراكم انجام شده بسته به نوع ال شياستاندارد آزما .گردد ميمشخص نهيرطوبت بهبر مشخصات يعيطب افيال تأثيرتا شود مينشده هم انجام تيهاي خاك تثب نمونه يبرا شيآزما. باشد ميهـاي نمونـه هيشـب ، به خاك افيتراكم در اثر اضافه كردن ال يمنحن شكل .خاك مشخص شود يكيمكان
خشك يچگال، نهيمقدار رطوبت تا نقطه رطوبت به شيها با افزا همه نمونه يبرا. نشده است تيخاك تثب .دهد خشك را كاهش مي يچگال، در مقدار رطوبت شيافزا، بعد از آن نقطه ابدي مي شيافزا
استاندارد آزمايش تراكم انجام شده - 3جدول
سيسال خرما كاه بامبو نوع الياف IS-2720روش تراكم زيرتراكم تراكم اصالح شده شدهتراكم اصالح استاندارد آزمايش
برشيمقاومت شيآزما يشـها يهدف از انجام آزما. قبل است يشمانند آزما طبيعي افياختالط خاك و ال زين شيآزما نيدر ا
در تـراكم ينمونـه و مقاومـت برشـ پذيري بر شكل طبيعي افيال تأثير يدر قدم اول بررس يمقاومت برش ديـ تـراكم مـورد نظـر با نـه يدرصـد رطوبـت به ، در هر درصد اختالط مورد نظر نينابراب. باشد مي حداكثر
خشـك شـده اسـت و C˚100 در گرم خانه در درجـه حـرارت خاك قبالً نكهيبا توجه به ا. مشخص شودبـه يها در قالب ساخت نمونه. مشخص شده است نهيدرصد رطوبت به نيا، باشد مين يدرصد رطوبت يدارا
است كـه قبـل از انجـام نيكرد ا شارهبه آن ا ديكه با يگرينكته د. گيرد ميصورت متر سانتي 6×6ابعاد درصد تراكم ، با كنترل نمونه خشك شيبا كنترل نمونه مرطوب و بعد از انجام آزما ميبرش مستق شيآزما
شيحاصله از آزمـا حداكثرنسبت به وزن خشك % 95كه تراكم باالتر از ييها نمونه يكنترل شده و تمام% 5، %4، % 5/2، %0هايي بـا از نمونه شهايآزما نيا يبرا. اند گرفته قرارمورد استفاده اند تراكم را دارا بوده
.و براي الياف خرما و سيسال اين آزمايش انجام نشده استاستفاده شده است و كاه بامبو% 8و
يتك محور يمقاومت فشار شيآزماآزمـايش فشـاري تـك .اين آزمايش براي نمونه خاك تثبيت شده با الياف خرمـا انجـام شـده اسـت
با چگالي خشك ماكزيمم و مقدار رطوبت بهينه كه با تراكم استاتيكي اي هاي استوانه محوري روي نمونهمتـر و بـا دو ميلـي 103متـر و ارتفـاع ميلي 50داخلي قالبي با قطر . صورت گرفته است، آماده شده بودند
طبـق ، اليـه 5هـا در نمونـه ، براي اطمينان از تراكم يكنواخـت . انتهاي جدا شونده به كار برده شده استهاي مخلوط شده با دستگاه تست فشاري تـك محـوري مـورد نمونه. اند تراكمي كوبيده شده -روش زير
) آزمايش با كنترل كـرنش ( كرنش محوري در هر دقيقه% 1رعت بارگذاري با س. آزمايش قرار گرفته است .معادل بوده است
نشده يزهكش يسه محور يمقاومت فشار شيآزما
يمرسـوم فشـار شيآزمااين آزمايش براي نمونه خاك تثبيت شده با الياف سيسال انجام شده است ، 69( همـه جانبـه يتحت فشـارها قهيمتر بر دق يليم 27/1نشده با سرعت كرنش يزهكش يسه محور
.ه استانجام شدبر روي خاك تثبيت شده با الياف سيسال ) بر متر مربع وتنين لويك 207و 138خشـك يو چگـال % 8/14 نـه ينشده با درصد رطوبت به تيشده و تثب تيشده تثب يهاي بازساز نمونه
انـد هدر قالب اسـتاندارد قـرار داده شـد ) IS( رد تراكممكعب طبق استاندا متر سانتيگرم بر 78/1 مميماكزسـه شيآزمـا لشك يا هاي استوانه نمونه. ه استتراكم بود شيآزما هياضافه شده شب ساليس افيمقدار الـ يم 38داراي قطـر هـا نمونه ييابعاد نها .اند هآورده و سپس مرتب شد رونيب يمحور 76 طـول متـر و يل
شيمورد آزما يسه محور شينشده در دستگاه آزما يزهكش طيها در شرا نمونه نياو است بوده متر يليم .اند هقرار گرفت
نتايج و بحث مميخشك مـاكز يچگال، افيال اين به علت وزن مخصوص كم، طبيعي افيشده با ال تدر خاك تثبي
كـه طبيعـي افيـ هـاي ال خودشان را به تـار يهستند جاتر نيهاي خاك كه سنگ دانه رايز ابدي كاهش مي نـه يمقـدار رطوبـت به شيدر خـاك باعـث افـزا افيـ ال هياول شيافزاهمچنين . دهند مي، هستندتر سبك
.ابدي مي شيافزا% 2/26به حدود % 9/17از نهيو رطوبت به افتهيكاهش ـ 94/1 از مميمـاكز كخشـ چگـالي ،به خاك مورد نظـر خرما% 1حدود شيبا افزا - ) gr/cm3( 89/1ه ب
.ابدي مي شيافزا% 3/13به حدود % 42/12از نهيو رطوبت به افتهيكاهش ـ 78/1 از مميمـاكز كخشـ چگالي ،به خاك مورد نظر سيسال% 1حدود شيبا افزا - ) gr/cm3( 70/1ه ب
.ابدي مي شيافزا% 16به حدود % 80/14از نهيو رطوبت به افتهيكاهش .نمايش داده شده است) 4( خاك تثبيت شده با الياف در جدول نتايج آزمايش تراكم
نمونـه مـورد اليـاف دو پـارامتر تـنش قـائم وارده و درصـد ، انجام شده ميبرش مستق يشهايآزما درتـنش شيبا افزا، و كاهدرصد ثابت بامبو كي يبه ازا .اند شده يمعرف ياصل يبه عنوان پارامترها شيآزما .محسوس اسـت شترياختالط ب يباال يدر درصدها شيافزا نيو ا شود مي شترينمونه ب يريپذ شكل، قائم
گـذارد امـا در نمونـه نمـي پـذيري بـر شـكل يچنـدان تأثير اليافدرصد شيافزا، نييهاي قائم پا در تنشآن را يختگيداده و كرنش گس شيرا افزا يريپذ به وضوح شكل اليافدرصد شيافزا، هاي قائم باال تنش
در رفتار برش نمونـه در الياف شتريمشاركت ب توان ميرا پذيري در شكل تأثيرگونه نيعلت ا. برد باال مي يريـ دو حالـت درگ نيـ قلمداد كرد چرا كـه در ا الياف شترياختالط ب يدرصدها ايهاي قائم باالتر و تنشپـذيري بر مقاومت و شـكل اليافپذيري و شكل يمقاومت كشش تأثير، بوده شتريهاي خاك ب با دانه الياف
خـارج ، آن را از حالت چسـبنده صـرف ، هاي خاك دانه نيدر ب افيوجود ال .خواهد بود انينما شترينمونه بواضـح اسـت كـه بـا نيبنـابرا . شـود مي يقطع و سبب كاهش چسبندگ گريكديها را با تماس دانه، كرده شياصـطكاك افـزا هيـ شـده و زاو شتريو خاك ب افيال نيب يريدرگ، هيدر مراحل اول افيدرصد ال شيافزاقـرار نگرفتـه تـأثير چندان تحت يهنوز چسبندگ افيبودن درصد ال نييبا توجه به پا كه حاليدر ابدي مي
كه اي به گونه شود ميرا در بر گرفته كم فهيكه هر ل يرفته رفته حجم خاك، افيدرصد ال شيبا افزا. استـ بيـ ترت نيـ به ا. شود ميممكن گريكدي ياز رو اياز درون خاك و افيلغزش ال خـاك و نياصـطكاك ب
، افيـ درصـد ال شيبـا افـزا گـر يو از طـرف د شود مي كينزد افيال نيرفته و به اصطكاك ب نياز ب افيال .)يكاهش مقاومت برش( شود مي انينما گريكديها از دانه شتريب يجدائ ليبه دل يكاهش چسبندگ
افيـ نسبت بـه درصـد ال يشمقاومت بر راتييتغ يتا در منحن شود ميعوامل سبب نيا بيترت نيبه اتـنش قـائم وارده بـه شيبا افزا نكهيا گرينكته د. وجود داشته باشد يمقاومت برش مميمحدوده ماكز كي
. شود ميمشخص شتريب افيدرصد ال تأثيرو شود مي انينما شتريفوق ب يرفتار اصطكاك، نمونهشـده ارايـه ) 5( بـامبو و كـاه در جـدول افيشده با ال تيخاك تثب يبرا يمقاومت برش شيآزما جينتاتراكم يروشها، نكته اشاره كرد كه با توجه به مشخصات مصالح انتخاب شده نيبه ا ديبا تيدر نها. است .برآورد شده است% 4حدود و كاه بامبو نهيدرصد اختالط به، انجام شده يشهايو آزما
. مقدار الياف خرما اسـت تأثيربه مقدار قابل توجهي تحت كرنش -دهند كه رفتار تنش نتايج نشان ميرسـد در به تنش محوري تسليم مي% 23/1برابر با تقريباً هاي بدون الياف خرما در كرنش محوري نمونه
. دهند بيشتري از خود نشان ميپذيري هاي تثبيت شده با الياف خرما شكل حالي كه نمونهتنش فشاري تك محـوري قابـل ، افزايش درصد الياف خرما و طول الياف دهند كه با نتايج نشان مي
خـواص ) تعداد تارها بـر واحـد حجـم ( افيدرصد ال شيكه افزا شود مي يرفتار از آن جا ناش نيا ليدل. شـود مي اختكنوي شتريخاك ب يعنيبه همراه دارد يخاك معمول يرا برا يشتريب يو همگن كيزوتروپيا
.نشان داده شده است) 6( در جدول UCSنتايج آزمايشات هاي خاك تثبيت شده با الياف بامبو و كاه نتايج آزمايش برش مستقيم بر روي نمونه -5جدول
در بهبـود ينقـش مهمـ افيـ و هم درصـد ال افيهم طول البراي خاك تثبيت شده با الياف سيسال بيمقـدار ضـر ) 7( جـدول . كننـد مـي فايا افيشده با ال تيتثب خاك) Фو C( يهاي مقاومت برش پارامتر
بـا توجـه بـه جـدول . دهـد شده را نشـان مـي تيخاك تثب) Ф( ياصطكاك داخل هيو زاو) C( يچسبندگ يچسـبندگ بيضـر ، %75/0تـا افيدرصد ال شيبا افزا، صورت ثابت نگهداشتن اليافدر شود ميمشاهده
هيـ زاو راتييتغ. ابدي كاهش مي ياديبه مقدار ز يچسبندگ بيضر، افيال% 75/0اما بعد از ابدي مي شيافزا هيـ زاو، %75/0تا افيدرصد ال شيبا افزا يدر حالت كلو است يخط ريغ افيبا درصد ال ياصطكاك داخل .ابدي اما بعد از آن كاهش مي ابدي مي شيهم افزا ياصطكاك داخل
مقاومت برشي خاك تثبيت شده با الياف سيسالپارامترهاي - 7جدول
) %( درصد الياف ) C ()kpa( چسبندگي )درجه()Ф( اصطكاك داخلي زاويه )mm( افيطول ال
گيري نتيجهفهميد كه با توجه به نـوع اليـاف توان مي، در اين تحقيقها آمده از آزمايش دست بهبا توجه به نتايج
اليـاف بيشـترين ، آيد كه در آن درصـد اخـتالط مي دست بهاي طبيعي مورد استفاده درصد اختالط بهينهكه خاك تثبيت شده بـا اليـاف شود ميگذارد و اين نكته فهميده مقاومتي را بر روي تثبيت خاك مي تأثير
.طبيعي نسبت به خاك تثبيت نشده مقاومت بيشتري دارد تـأثير بـا افيـ ال نيـ ا. باشـد مـي نمونه يدر مقاومت برش تأثير، در خاك اليافاختالط تأثيرترين مهم
و يچسبندگ زانيم يها بر رو دانه مؤثرفشار جهيهاي خاك و در نت با دانه افيال يرياز درگ يناش ميمستقبـا توجـه بـه شـود مـي نمونـه يرفتـار برشـ يبر رو يراتييسبب بروز تغ، مخلوط ياصطكاك داخل هيزاوپذيري شكل شيبا خاك سبب افزا افياختالط الفهميد كه توان ميانجام شده يمقاومت برش يشهايآزما
.كند مي كينزد يرياز حالت شكننده به حالت خم، ينمونه شده و رفتار خاك را با وجود كاهش چسبندگ
و يعيطب افيو آهك و ال مانيبه كمك س زدانهير يها خاك يا سهيمقا مطالعه". 1375 ض. ت، ياسد بگ .1 رانيدانشگاه علم وصنعت ا- عمران يدانشكده مهندس، »يمصنوع
دانشگاه علم -عمران يدانشكده مهندس، "يومصنوع يعيطب افيخاك مسلح توسط ال". 1374. ا، يخالد .2 رانيوصنعت ا
3. Marandi S. M, Bagheripour M. H, Rahgozar R and Zare H “Strength and Ductility of Randomly Distributed Palm Fibers Reinforced Silty-Sand Soils”, Department of civil Engineering, University of Kerman, Kerman, Iran
4. Prabakar J, Sridhar R. S, ”Effect of Random Inclusion of Sisal Fibre on Strength Behaviour of Soil”, Regional Research Laboratory (CSIR) -Bhopal India, Coimbatore Institute of Technology-Coimbatore-India
5. Tenax company, ”Reinforced soil slopes and walls ”Tenax International B.V- Geosynthetics Division, www. tenax. net, www. polyfabrics. com. au
1
ISRM International Symposium 2010 and 6th Asian Rock Mechanics Symposium - Advances in Rock Engineering,
23-27 October, 2010, New Delhi, India
EVALUATING ROCK MASS BEHAVIOUR IN
DILATOMETER TESTS
MORTEZA GHAROUNI-NIK School of Railway Eng., Iran University of Science and Technology (IUST)
SIAMAK HASHEMI Geotechnical Engineer, Moshanir Power Engineering Consultants
ABSTRACT : The rock mass deformation modulus can be measured by different methods including field and
laboratory testing and considering the relation between the applied load and resulting deformation. The
dilatometer is one of the most versatile instruments used for this purpose. Defining an absolute value for the
deformation modulus based on this test may be difficult or inaccurate and the aim should rather be the
definition of a magnitude for the modulus. However, interpreting the results of dilatometer tests is a matter of
engineering judgment that requires an understanding of the rock mass behavioural pattern during the test which
is discussed in this paper. Examples of dilatometer test results from Roudbar-Lorestan dam site in Iran are also
presented.
KEYWORDS: Dilatometer, Deformation, Elasticity, Rock behaviour.
1- INTRODUCTION
The deformability is one of the most important properties that represent the mechanical behavior of rock masses
and is used in various rock engineering projects including underground and surface structures. It is characterized
by a modulus which describes the relation between the applied load and the resulting strain. The commission of
terminology, symbols and graphic representation of the International Society of Rock Mechanics has given the
following definitions [1]:
Modulus of deformation of a rock mass is the ratio of stress to corresponding strain during loading of a rock
mass, which includes both elastic and inelastic behavior.
Modulus of elasticity of a rock mass is the ratio of stress to corresponding strain during loading of a rock
mass which only includes the elastic behavior.
The rock mass deformation modulus can be measured by different methods including field testing and
laboratory testing. It is known however that the measured or estimated values in virtually all methods of field
modulus measurement vary from laboratory results. Since rock masses usually contain discontinuities, their
mechanical behavior is different to that of small rock specimens tested in the laboratory. The variation in
blockiness or degree of jointing in rock masses may often be the cause of such variation. Part of it may also
occur from changes in test boundary conditions, from poor test design or incorrect analysis. For instance,
Farmer and Kemeny [2] have found that the deformation modulus of intact rock samples is in the order of 5 to
20 times higher than in-situ values and Pinto de Cunha and Muralha [3] showed the effect of the volume
involved in the test of the deformation modulus measured. Hence large scale techniques offer advantages by
testing at a more reasonable scale. However, few projects feature a sufficient number of different tests to allow a
meaningful comparison of in situ test data and very different in-situ results may be obtained depending on the
test method. Even in an extensive in-situ test program in fairly uniform and good quality rock mass conditions,
deformability data may feature a deviation of 25% or as much as 10 GPa for an average in-situ modulus of 40
GPa [4]. Therefore the use of more than one indirect procedure has also been proposed by many other authors,
so that the results obtained can be compared and their reliability checked. In this regards the Borehole
Expansion Tests, mostly Flexible dilatometers, were found to be one of the most suitable in-situ tests for the
determination of the rock mass deformation modulus [5].
2- THE DILATOMETER TEST
The dilatometer test is a conventional method among in-situ tests and is based on the theory of elasticity which
considers the rock mass as an elastic, isotropic and homogeneous medium. The dilatometer is one of the most
2
versatile instruments used for determining the in-situ modulus of deformation. These devices are capable of
applying hydraulic pressure on the rock mass in boreholes through a flexible membrane. During the test it is
possible to define the deformational characteristics of rock mass with regard to the relationship between the
pressure and deformation by imposing pressure on the wall of borehole. Using the test results allows one to
anticipate the behavior of rock masses when exposed to changes under loading and unloading conditions. The
testing method has been described in detail in the suggested methods of the International Society of Rock
Mechanics [6].
Dilatometer tests have been used in various projects and the results are widely reported [7, 8, 9, 10, 11 and 12].
However, analyzing and interpreting the behavior of rock masses based on pressure-displacement curves
resulting from this test are still not being evaluated in a suitable manner and most reports suffice by presenting a
numeric value as the modulus of deformation. In order to arrive at the best possible results one must know the
limits and problems involved in the tests. It is generally known that in-situ tests are subjected to measurement
errors, both from equipment and test location preparation. The type of dilatometer used for testing, its calibration
and the measurement accuracy may largely affect the results [13]. Drilling procedures may cause some damages
to the borehole walls or cause stress release due to core recovery. In addition to the above, it has been pointed
out by several investigations that the in-situ deformation modulus is not constant, but depends on the stress
conditions, being generally higher in areas subjected to high rock stresses. However, this may also be due to
better rock mass quality where the higher stress occurs [14]. Thus it has been suggested that the aim cannot be to
define an absolute value, but rather to define a magnitude for the modulus, even if the modulus of deformation is
determined by direct measurement [15]. This is a matter of engineering judgment which requires an
understanding of the behavior of the rock mass during a test.
2.1- ROCK MASS BEHAVIOUR DURING TESTING
The interpretation of the dilatometer tests is rather difficult due to the variation of rock mass behavior during
testing. Generally the modulus value increases with the increase in applied pressure during the measurement.
This is due to the closure of cracks or joints in the rock mass under stress, making the material stiffer at higher
stresses. During the application of pressure in a dilatometer test, several stages may occur in the bahaviour of the
rock mass [16]. In the first stage, if the initial stress of the rock mass is not null, the application of pressure will
first decompress the rock mass in a peripheral direction. In the second stage and with the increase of pressure,
the peripheral compressive stress will decrease until tensile stresses occur. With further pressure increase a third
stage is obtained. During this stage a failure process will start once the rock mass has reached its tensile strength
limit, producing a first cracked zone where there is a radial stress of compression with a null peripheral stress,
and producing a second zone in which the peripheral stress zone is a tensile one and varies between the tensile
strength and zero, and finally producing a third zone in which the stresses are all compressive. If the initial stress
of the rock mass is null the test will start from second stage, and if the tensile strength of the rock mass is null a
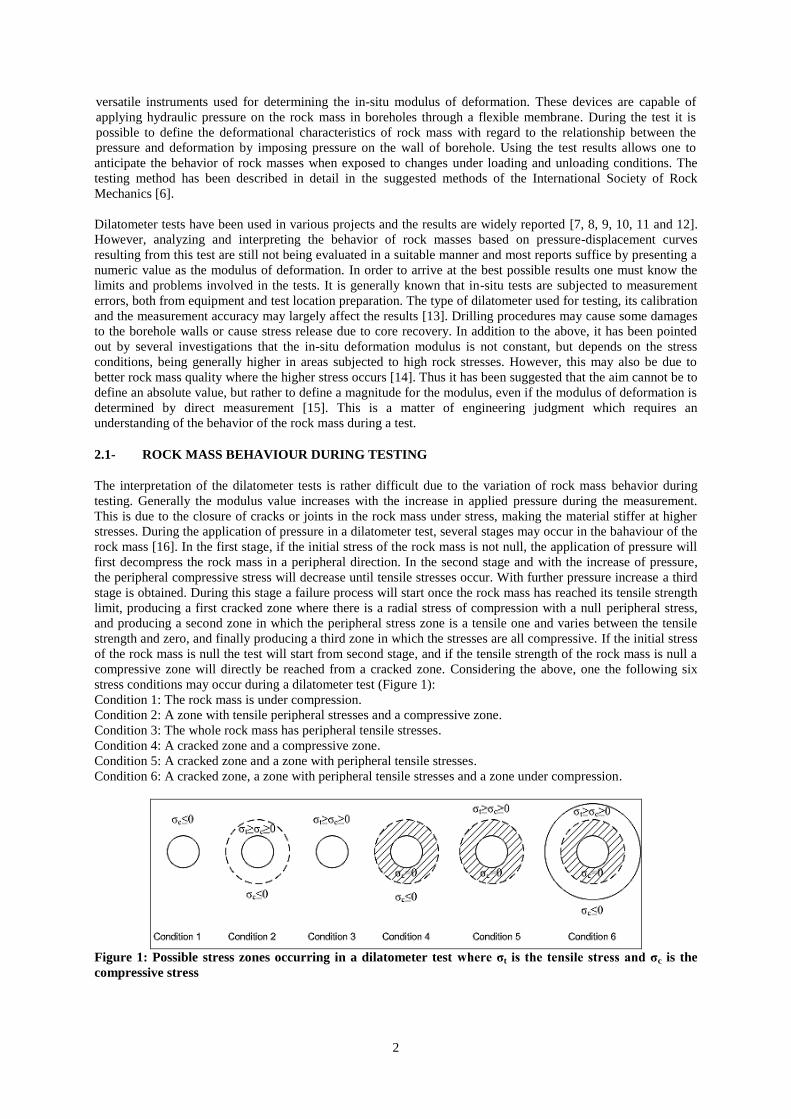
compressive zone will directly be reached from a cracked zone. Considering the above, one the following six
stress conditions may occur during a dilatometer test (Figure 1):
Condition 1: The rock mass is under compression.
Condition 2: A zone with tensile peripheral stresses and a compressive zone.
Condition 3: The whole rock mass has peripheral tensile stresses.
Condition 4: A cracked zone and a compressive zone.
Condition 5: A cracked zone and a zone with peripheral tensile stresses.
Condition 6: A cracked zone, a zone with peripheral tensile stresses and a zone under compression.
Figure 1: Possible stress zones occurring in a dilatometer test where σt is the tensile stress and σc is the
compressive stress
3
However, the behavioural pattern of a rock mass may change depending on the rock and testing conditions. In
this regard various models of rock behaviour have been observed [17]. To be able to interpret the results of a
dilatometer test correctly, it is important that the different behavioural patterns of a rock mass are understood.
In a homogeneous elastic rock mass the loading and unloading path is the same which means that the pressure-
expansion curve is linear (Figure 2, Type 1).
In case there is a limit to the shear stress that the rock can sustain, the rock behaves as an elastic material prior to
failing in shear (Figure 2, Type 2). Once the testing pressure exceeds the pressure required to initiate shear
failure, the strain rate will show a substantial increase. The form of the non-linear portion of the pressure-
expansion curve will be a function of the shear strength of the rock. On unloading, the rock will behave
elastically until the failure strength is reached. At this point the circumferential stress becomes the major
principal stress. It should be noted however that the true behavior of the rock is often masked by the disturbance
caused by the forming of the borehole or by soft cuttings lodged between the dilatometer and the borehole wall.
In this model it is assumed though that the rock only fails in shear and not in tension. In case the tensile strength
of the rock is low then the lateral stress must be high enough to ensure that the rock does not fail in tension and
crack.
Most rocks do not have isotropic strength properties and are usually weak in tension and much stronger in
compression or shear. If the in-situ lateral stress is low and the shear strength high then tensile stresses may
develop during the test. Once the pressure increases the circumferential stress will go into tension and at some
stress the rock will crack (theoretically in a radial direction). This is shown in the pressure-expansion curve in
form of a distinct step at the initiation of the cracks (Figure 2, Type 3). With further increase in pressure the
cracks will grow and the slope of the pressure-expansion curve flattens. On unloading the stress path will follow
down the same curve until the cracks close completely from where the curve will follow the initial elastic path.
If the pressure continues to increase the mechanism of failure at the boundary will change to one of a shear
failure mode (Figure 2, Type 4). In such case three distinct zones can be seen in the material around the
dilatometer: the outer zone in which the rock is un-cracked and behaves elastically, the middle zone in which the
rock will have radial cracks and a low circumferential stress, and the inner zone adjacent to the borehole wall
where the rock will fail in shear and the voids will be closed.
If radial cracks exist prior to the test, then no tension can develop. If the shear strength of the rock is too high to
fail under the maximum pressure of the instrument then the pressure-expansion curve will show a distinct change
of curvature when the cracks start to open (Figure 2, Type 5). If the pressure is reduced the curve will retrace
itself because the rock behaves elastically at all times. If existing cracks did not dominate, then as soon as a
crack forms a sudden increase in expansion can be seen on the pressure-strain curve. This behavior is frequently
observed in hard rocks near the surface. In view of the erratic nature of the tensile strength several abrupt steps
are often seen in the pressure-expansion curve as the pressure increases (Figure 2, Type 6). Generally the curve
will be a straight line containing small steps but with no significant increase in strain (unless the rock begins to
fail in shear). On unloading, the curve will follow a similar path to the loading except that it will be smooth and
without steps. However, if on loading, the cracks do not remain open and become filled with rock cuttings then
the unloading curve will be much stiffer than the loading curve (Figure 2, Type 7). In addition both tension and
shear failure could occur with the cracks being filled before unloading. A similar behavior may be observed if
the rock fails in tension followed by failure in shear, and the cracks become filled with rock cuttings (Figure 2,
Type 8).
4
Figure 2: Different behavioural patterns of rock masses in dilatometer tests
It should be noted that in the above descriptions, dry testing conditions were assumed. However, water may be
present due to the drilling process or from hydrostatic water pressure. If the hydrostatic water table is near the
surface then pressure will exist throughout the formation. In such situation the above discussion will still apply
with the provision that the stresses considered must be effective rather than total stresses.
In the following section few examples are presented of tests carried out in a site investigation program in order to
show the behavioural patterns of a rock mass based on the above descriptions.
3- CASE STUDY
Several dilatometer tests were carried out as part of a site investigation program for the Roudbar-Lorestan Dam
Project in the South-West of Iran in order to determine the deformation characteristics of the rock masses in that
area. The site under survey is in the Zagros Mountain range in the Lorestan province of Iran and the rocks in this
area consist mainly of grey to brownish grey, well bedded limestone and dolomitic limestone, with alternation of
marly limestone, shale, and marl. The testing procedure and calculation of results followed the suggested method
of the International Society of Rock Mechanics [6]. The device used, a High Pressure Dilatometer HPD73, can
apply a pressure of up to 20 MPa to the ground, and can expand from an initial diameter of 73 mm to nearly 100
mm [17]. The expansion of the instrument is measured by means of six circumferentially fixed strain gauged leaf
springs that follow the movement of the inside of the membrane and the internal pressure is measured by a
transducer within the body of the HPD. The instrument is capable of resolving movements of less than 1 micron
and pressure changes less than 1 kPa, however it requires proper calibration and corrections for membrane
thinning since the strain arms are covered by the membrane.
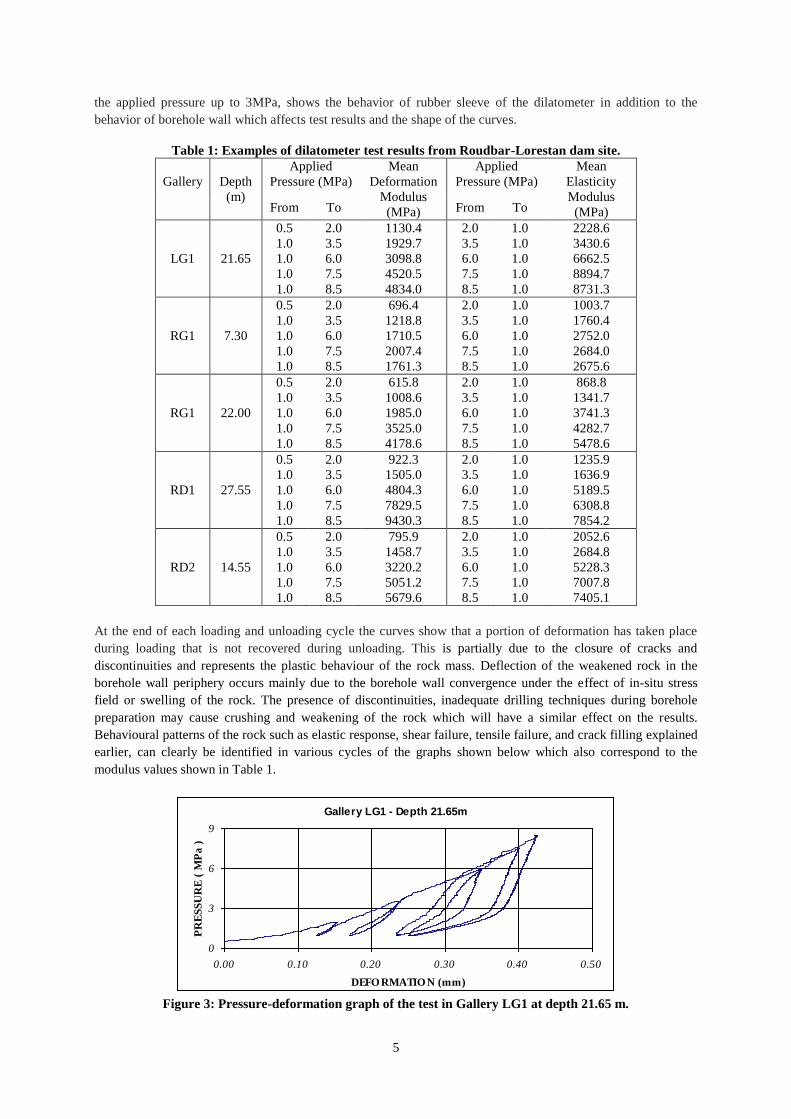
Examples of achieved results from these tests are presented in Table 1 together with the corresponding Pressure-
Deformation graphs shown in Figures 3 to 7. As suggested by Clerici [15], instead of defining an absolute value,
a range for the deformation and elasticity modulus of each test is presented corresponding to different applied
pressures.
It can be seen that in the first cycle of the tests a very low modulus values have been observed. This was mainly
due to inadequate pressure applied for testing. Since the displacement transducers are covered by a membrane, it
is important to not only calibrate the system for membrane compression and membrane thinning, but also to use
adequate initial pressure for the full expansion of the membrane before the behavior of the rock can be measured.
Hence the low modulus values in the first cycles do not represent the real behavior of the rock mass. In all cycles
5
the applied pressure up to 3MPa, shows the behavior of rubber sleeve of the dilatometer in addition to the
behavior of borehole wall which affects test results and the shape of the curves.
Table 1: Examples of dilatometer test results from Roudbar-Lorestan dam site.
Gallery
Depth
(m)
Applied
Pressure (MPa)
Mean
Deformation
Modulus
(MPa)
Applied
Pressure (MPa)
Mean
Elasticity
Modulus
(MPa) From To From To
LG1
21.65
0.5
1.0
1.0
1.0
1.0
2.0
3.5
6.0
7.5
8.5
1130.4
1929.7
3098.8
4520.5
4834.0
2.0
3.5
6.0
7.5
8.5
1.0
1.0
1.0
1.0
1.0
2228.6
3430.6
6662.5
8894.7
8731.3
RG1
7.30
0.5
1.0
1.0
1.0
1.0
2.0
3.5
6.0
7.5
8.5
696.4
1218.8
1710.5
2007.4
1761.3
2.0
3.5
6.0
7.5
8.5
1.0
1.0
1.0
1.0
1.0
1003.7
1760.4
2752.0
2684.0
2675.6
RG1
22.00
0.5
1.0
1.0
1.0
1.0
2.0
3.5
6.0
7.5
8.5
615.8
1008.6
1985.0
3525.0
4178.6
2.0
3.5
6.0
7.5
8.5
1.0
1.0
1.0
1.0
1.0
868.8
1341.7
3741.3
4282.7
5478.6
RD1
27.55
0.5
1.0
1.0
1.0
1.0
2.0
3.5
6.0
7.5
8.5
922.3
1505.0
4804.3
7829.5
9430.3
2.0
3.5
6.0
7.5
8.5
1.0
1.0
1.0
1.0
1.0
1235.9
1636.9
5189.5
6308.8
7854.2
RD2
14.55
0.5
1.0
1.0
1.0
1.0
2.0
3.5
6.0
7.5
8.5
795.9
1458.7
3220.2
5051.2
5679.6
2.0
3.5
6.0
7.5
8.5
1.0
1.0
1.0
1.0
1.0
2052.6
2684.8
5228.3
7007.8
7405.1
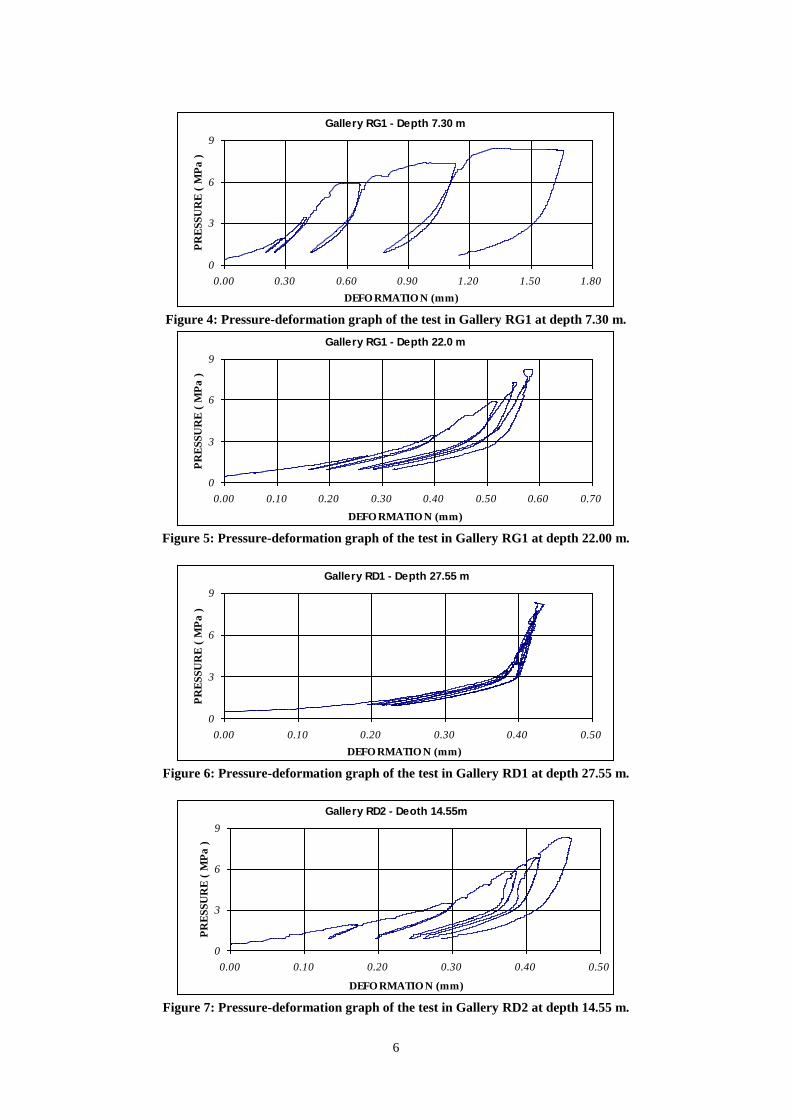
At the end of each loading and unloading cycle the curves show that a portion of deformation has taken place
during loading that is not recovered during unloading. This is partially due to the closure of cracks and
discontinuities and represents the plastic behaviour of the rock mass. Deflection of the weakened rock in the
borehole wall periphery occurs mainly due to the borehole wall convergence under the effect of in-situ stress
field or swelling of the rock. The presence of discontinuities, inadequate drilling techniques during borehole
preparation may cause crushing and weakening of the rock which will have a similar effect on the results.
Behavioural patterns of the rock such as elastic response, shear failure, tensile failure, and crack filling explained
earlier, can clearly be identified in various cycles of the graphs shown below which also correspond to the
modulus values shown in Table 1.
Gallery LG1 - Depth 21.65m
0
3
6
9
0.00 0.10 0.20 0.30 0.40 0.50
DEFO RMATIO N (mm)
PR
ES
SU
RE
( M
Pa
)
Figure 3: Pressure-deformation graph of the test in Gallery LG1 at depth 21.65 m.
6
Gallery RG1 - Depth 7.30 m
0
3
6
9
0.00 0.30 0.60 0.90 1.20 1.50 1.80
DEFO RMATIO N (mm)
PR
ES
SU
RE
( M
Pa
)
Figure 4: Pressure-deformation graph of the test in Gallery RG1 at depth 7.30 m.
Gallery RG1 - Depth 22.0 m
0
3
6
9
0.00 0.10 0.20 0.30 0.40 0.50 0.60 0.70
DEFO RMATIO N (mm)
PR
ES
SU
RE
( M
Pa
)
Figure 5: Pressure-deformation graph of the test in Gallery RG1 at depth 22.00 m.
Gallery RD1 - Depth 27.55 m
0
3
6
9
0.00 0.10 0.20 0.30 0.40 0.50
DEFO RMATIO N (mm)
PR
ES
SU
RE
( M
Pa
)
Figure 6: Pressure-deformation graph of the test in Gallery RD1 at depth 27.55 m.
Gallery RD2 - Deoth 14.55m
0
3
6
9
0.00 0.10 0.20 0.30 0.40 0.50
DEFO RMATIO N (mm)
PR
ES
SU
RE
( M
Pa
)
Figure 7: Pressure-deformation graph of the test in Gallery RD2 at depth 14.55 m.
7
4- CONCLUSION
The dilatometer test is a conventional method among in-situ tests and has widely been used in various projects
for measuring the deformation modulus of rock masses. The interpretation of dilatometer tests is rather difficult
due to the variation of devices used and inaccuracies during preparation and testing, and also different rock mass
conditions. The choice of a design value for the in-situ modulus of deformation is a matter of engineering
judgment and it has also been suggested that the aim in such a test should not be to define an absolute value, but
rather to define a magnitude for the modulus. This requires an understanding of the rock mass behavior during
testing.
The purpose of this paper is to give some useful indications for the interpretation of such tests. Various
behavioural patterns of rock masses in a dilatometer test have been reviewed and discussed, along with examples
of dilatometer tests carried out at the Roudbar-Lorestan dam site in Iran. Once the bahaviour of a rock mass is
better understood, the prediction of in-situ parameters becomes closer to actual values and conditions. The test
results presented in this paper together with the corresponding pressure-deformation graphs show the effects of
rock mass behaviour on the deformation modulus of the rock. The above review and examples could be used as a
guide for evaluating rock mass behaviour in dilatometer tests.
5- REFERENCES
[1] ISRM, 1975, “Commission on Terminology, Symbols and Graphic Representation”, International Society for
Rock Mechanics (ISRM).
[2] Farmer, I.W. and Kemeny, J.M., 1992, “Deficiencies in rock test data”, Proc. Int. Conf. Eurock '92, Thomas
Telford, London, pp. 298-303.
[3] Pinto de Cunha A., and Muralha J., 1990, “About LNEC experience on scale effects in the deformability of
rock masses”, International workshop on scale effects in rock masses, Balkema, pp. 219-229.
[4] Bieniawski, Z.T., 1989, Engineering rock mass classifications. John Wiley & Sons, New York.
[5] Galera, J., Alvarez, M., and Bieniawski, Z.T., 2005, “Evaluation of the deformation modulus of rock masses:
Comparison of Pressuremeter and Dilatometer tests with RMR prediction”, ISP5-PRESSIO 2005 International
Symposium.
[6] ISRM, 1987, “Suggested methods for deformability determination using a flexible dilatometer”, Int. J. Rock
Mech. Min. Sci., Vol. 24, No. 2: 123-134.
[7] Gharouni-Nik, M., and Faramarzi, L., 1999, "Application of Flexible Dilatometer Test (FDT) in determining
the moduli of rock mass at Karun-4 Dam Project", 9th International Congress on Rock Mechanics – ISRM,
Paris, pp.1373-1375.
[8] Labrie, C., Conlon, B., Anderson, T., and Boyle, R.F., 2004, “Measurement of in situ deformability in hard
rock”, Proceedings ISC-2 on Geotechnical and Geophysical Site Characterisation, pp. 963-970.
[9] Agharazi, A., and Moradi, M., 2004, “Comparison between plate load test results and dilatometer test results
– Case study, Saymareh dam and Sazbon Dam projects”, Proceedings ISC-2 on Geotechnical and Geophysical
Site Characterisation, pp. 265-269.
[10] Hashemi, S., and M. Gharouni-Nik, 2006, “A case study of Deformation Measurements of Slates at Javeh
Dam Site in Iran”, Proceedings of 4th
Asian Rock Mechanics Symposium (ARMS4), Singapore.
[11] Hashemi, S., Gharouni-Nik, M., and Moradi, M., 2007, “Comparing the functionality of two Dilatometers
in the rock masses of Dalan Formation” Proceedings of the 3rd
Iranian Rock Mechanics Conference, Tehran, pp.
235-240 (In Farsi).
[12] Dadi Givshad, A., Memarian, H., and Rezaei, F., 2008, “Investigation on deformability modulus of Asmary
Formation rock mass by dilatometer tests”, Proceedings of 5th
Asian Rock Mechanics Symposium (ARMS5),
Tehran, pp. 239-246.
[13] Hashemi, S., and Gharouni-Nik, M., 2008, "Comparing different in-situ methods for measuring
deformability characteristics of rock masses in Roudbar Lorestan (Iran)", Proceedings of 5th
Asian Rock
Mechanics Symposium (ARMS5), Tehran, pp. 293-298.
[14] Palmström, A., and Singh, R., 2001, “The Deformation Modulus of Rock Masses - comparisons between in
situ tests and indirect estimates”, Tunnelling and Underground Space Technology, Vol. 16, No. 3, 2001, pp. 115-
131.
[15] Clerici, A., 1993, “Indirect determination of the modulus of deformation of rock masses - Case histories”,
Proc. Conf. Eurock '93, pp. 509 - 517.
[16] Loureiro Pinto, J., 1993, “Determination of the deformability and state of stress in rock masses”, Proc.
Conf. Eurock ’93, pp. 669-673.
[17] Cambridge-Insitu, 2004, Working Instructions for 73mm High Pressure Dilatometer, Cambridge, UK.
8
6- BIODATA
Dr. Morteza Gharouni Nik graduated and obtained a Ph.D in Geotechnical Engineering (Rock Mechanics) from
the University of Newcastle Upon Tyne, England, in 1993. From 1993 to 2002 he worked for a Rock Mechanics
company, specialising in Geotechnical laboratory and in-situ tests and performed these tests for design and
construction of at least 15 concrete dams in Iran. From 2001 he has been Professor of Tunneling and Rock
Mechanics and Rock Engineering at the Iran University of Science and Technology (IUST), where he specialises
in Rock Mechanics, Soil Mechanics and Tunnelling.
Dr. Siamak Hashemi has obtained a BSc in Mining Engineering, an MSc in Rock Mechanics, an MSc in
Computing and completed his PhD in Soil Mechanics at the University of Newcastle upon Tyne in 2002. He was
technical manager of Khak & Sang Geotechnical Consultants until 2006 and works at present for Moshanir
Power Engineering Consultants as project manager. He is currently vice president of the Iranian Tunnelling
Association and is specialized in site investigations and rock mechanics in-situ testing. He has carried out
various tests including dilatometer, plate load and direct shear tests in more than 10 large dam projects in Iran.
425
1 INTRODUCTION
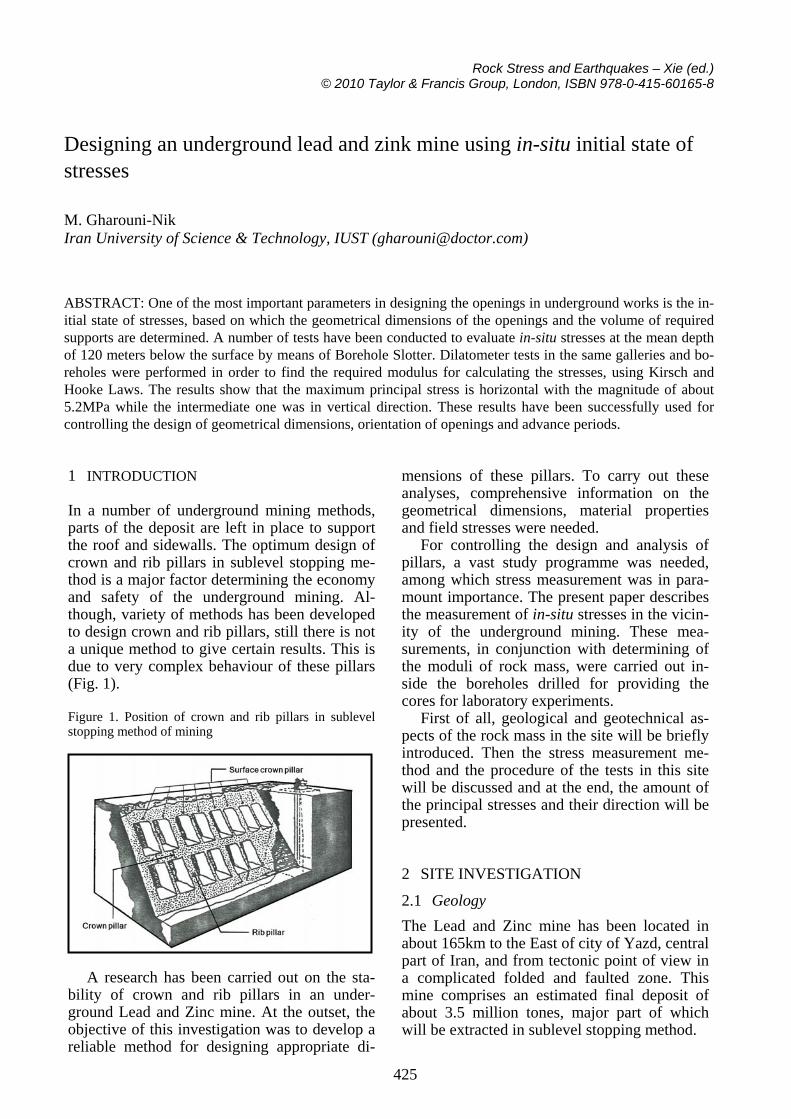
In a number of underground mining methods, parts of the deposit are left in place to support the roof and sidewalls. The optimum design of crown and rib pillars in sublevel stopping me-thod is a major factor determining the economy and safety of the underground mining. Al-though, variety of methods has been developed to design crown and rib pillars, still there is not a unique method to give certain results. This is due to very complex behaviour of these pillars (Fig. 1). Figure 1. Position of crown and rib pillars in sublevel stopping method of mining
A research has been carried out on the sta-
bility of crown and rib pillars in an under-ground Lead and Zinc mine. At the outset, the objective of this investigation was to develop a reliable method for designing appropriate di-
mensions of these pillars. To carry out these analyses, comprehensive information on the geometrical dimensions, material properties and field stresses were needed.
For controlling the design and analysis of pillars, a vast study programme was needed, among which stress measurement was in para-mount importance. The present paper describes the measurement of in-situ stresses in the vicin-ity of the underground mining. These mea-surements, in conjunction with determining of the moduli of rock mass, were carried out in-side the boreholes drilled for providing the cores for laboratory experiments.
First of all, geological and geotechnical as-pects of the rock mass in the site will be briefly introduced. Then the stress measurement me-thod and the procedure of the tests in this site will be discussed and at the end, the amount of the principal stresses and their direction will be presented.
2 SITE INVESTIGATION
2.1 Geology The Lead and Zinc mine has been located in about 165km to the East of city of Yazd, central part of Iran, and from tectonic point of view in a complicated folded and faulted zone. This mine comprises an estimated final deposit of about 3.5 million tones, major part of which will be extracted in sublevel stopping method.
Designing an underground lead and zink mine using in-situ initial state of stresses
M. Gharouni-Nik Iran University of Science & Technology, IUST ([email protected])
ABSTRACT: One of the most important parameters in designing the openings in underground works is the in-itial state of stresses, based on which the geometrical dimensions of the openings and the volume of required supports are determined. A number of tests have been conducted to evaluate in-situ stresses at the mean depth of 120 meters below the surface by means of Borehole Slotter. Dilatometer tests in the same galleries and bo-reholes were performed in order to find the required modulus for calculating the stresses, using Kirsch and Hooke Laws. The results show that the maximum principal stress is horizontal with the magnitude of about 5.2MPa while the intermediate one was in vertical direction. These results have been successfully used for controlling the design of geometrical dimensions, orientation of openings and advance periods.
426
The main rock mass is igneous rock contain-ing black Shale, intergrowth of Dolomite with disseminated Pyrite.
2.2 Geomechanical properties of rock mass After geological and tectonic investigations, it was found that the major faults of the region divide the deposit into four main parts, one of which is more important from the deposit amount of view. Thus, it has been concentrated on this part in this research.
In order to determine the properties of dis-continuities such as: strike, dip and dip direc-tion, spacing, extension, consistency, opening, infilling materials, roughness and weathering conditions, the Scan Line method was used in different direction in order to have three dimen-sional information about the discontinuities. 25 scan lines were used in this regard and three major joint sets, including bedding plane, were recognized using DIPS software. UNWEDGE software was also used for controlling probable instability of the wedges in the underground spaces.
It should be noted that the young’s modulus and the modulus of deformation measured by means of a flexible dilatometer is maximum along and parallel to the beddings and reduces considerably across them. These results in addi-tion with the results of stress measurement and the following rock properties have been used for controlling three dimensional comprehen-sive analyses of the underground mine spaces:
A number of in-situ stress measurements by means of Borehole Slotter technique have been
performed and reported by He (1996), Yuen (1989), Azzam and Bock (1987), Foruria (1987), Bock (1986) and Bock and Foruria (1984).
Borehole Slotter is a 2D stress measuring technique. It aims at determining in-situ rock stress by locally releasing tangential stress at a borehole surface. For a linear elastic material, these tangential stresses have a unique relation-ship with the in-situ state of stress in the far field of the tested borehole (Kirsch’s solution of a circular hole in a stressed plate).
The borehole slotting system is made up of six principal components:
a) Borehole probe (slotter), containing the small diamond saw for cutting a radial slot into the borehole wall for producing local stress re-lief. The recoverable tangential strain sensor for measuring the stress relief effects during and after slotting, and also some sensors for mea-suring the temperature and orientation of the probe;
b) Electrical control and read out unit, which monitors the signals of four sensors of the slot-ter and shows the records by LCD display and strip chart recorder;
c) Pneumatic and hydraulic control unit, which allows the activation and control of all pneumatic and hydraulic operations of the probe;
d) Pressure vessel for cooling water with a capacity of about 25 litres;
e) Cables, hoses and accessories including transportation boxes; and
f) Software. The measuring principles and full description of the borehole slotting system could be found in a paper by Bock (1986).
3.1 Preparatory works Three test sites were prepared in three HQ ap-proximately orthogonal boreholes (96 mm φ) drilled at the end of an access gallery in the vi-cinity of the deposit. A total of 18 individual tests were completed for measuring the in-situ stress. Some dilatometer tests were performed in the same boreholes to measure the rock mass modulus of deformability which was used in calculating the in-situ stress. As mentioned be-fore, the rock mass modulus of deformability had various amounts with the mean value of 20 GPa.
427
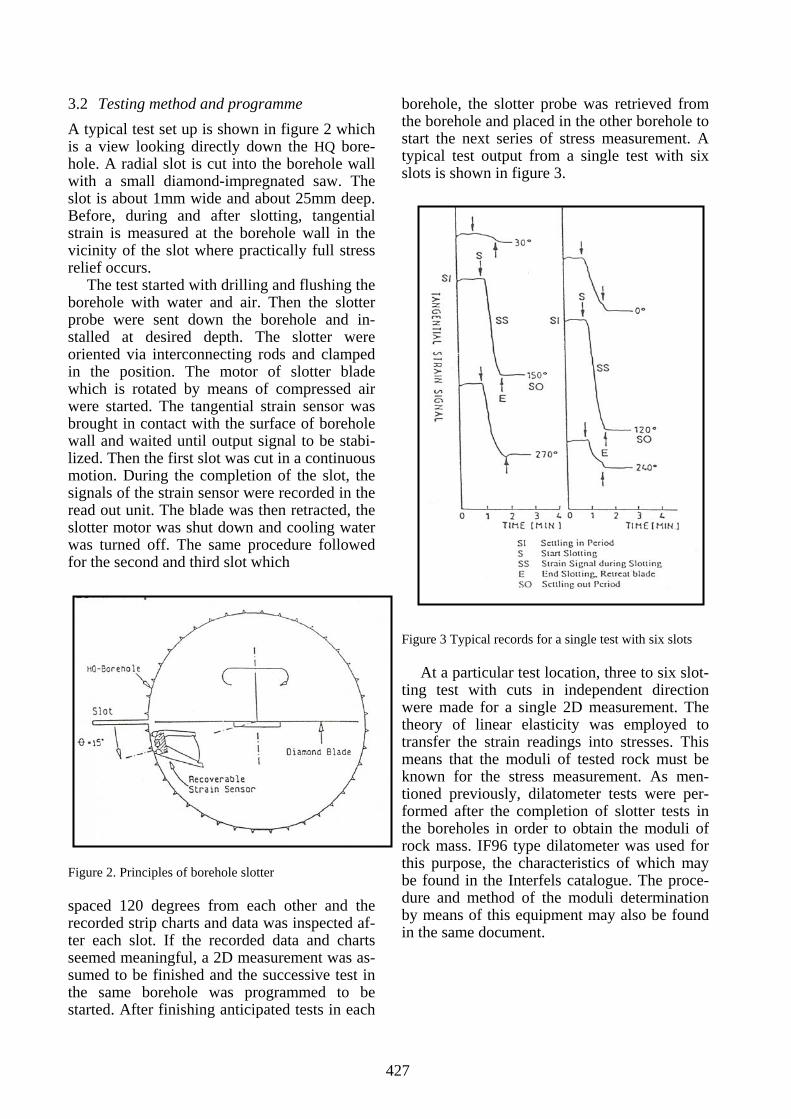
3.2 Testing method and programme A typical test set up is shown in figure 2 which is a view looking directly down the HQ bore-hole. A radial slot is cut into the borehole wall with a small diamond-impregnated saw. The slot is about 1mm wide and about 25mm deep. Before, during and after slotting, tangential strain is measured at the borehole wall in the vicinity of the slot where practically full stress relief occurs.
The test started with drilling and flushing the borehole with water and air. Then the slotter probe were sent down the borehole and in-stalled at desired depth. The slotter were oriented via interconnecting rods and clamped in the position. The motor of slotter blade which is rotated by means of compressed air were started. The tangential strain sensor was brought in contact with the surface of borehole wall and waited until output signal to be stabi-lized. Then the first slot was cut in a continuous motion. During the completion of the slot, the signals of the strain sensor were recorded in the read out unit. The blade was then retracted, the slotter motor was shut down and cooling water was turned off. The same procedure followed for the second and third slot which
Figure 2. Principles of borehole slotter
spaced 120 degrees from each other and the recorded strip charts and data was inspected af-ter each slot. If the recorded data and charts seemed meaningful, a 2D measurement was as-sumed to be finished and the successive test in the same borehole was programmed to be started. After finishing anticipated tests in each
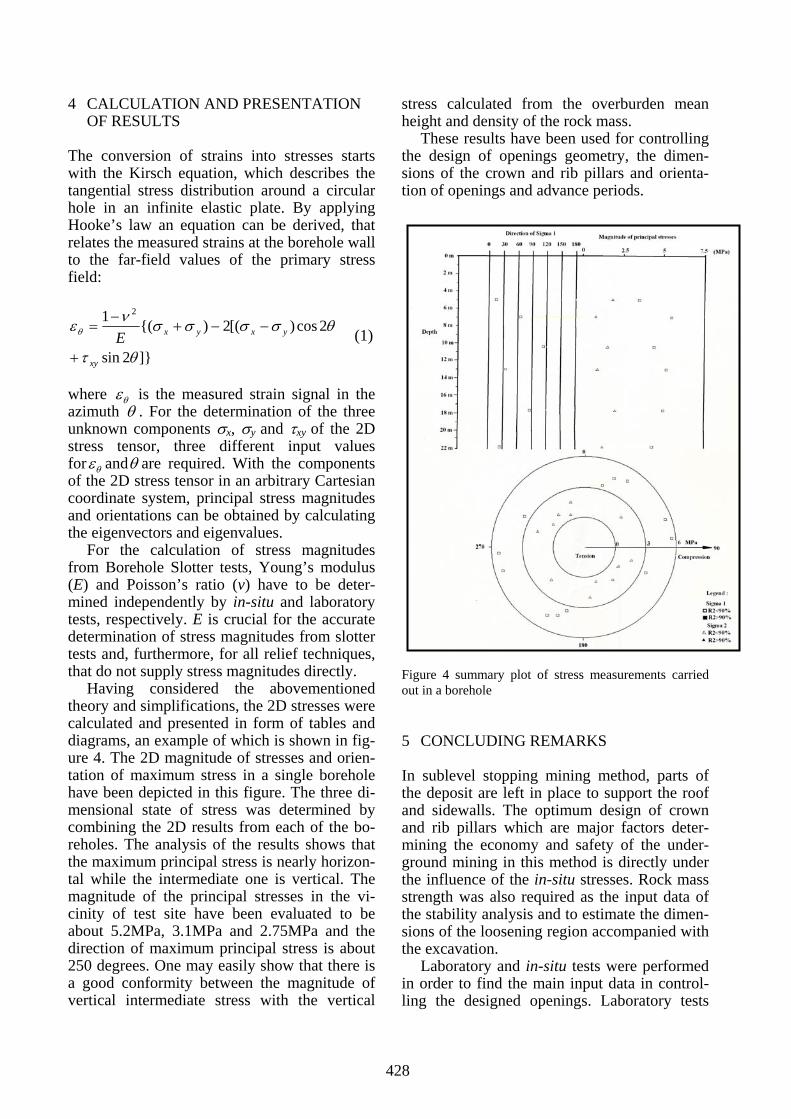
borehole, the slotter probe was retrieved from the borehole and placed in the other borehole to start the next series of stress measurement. A typical test output from a single test with six slots is shown in figure 3.
Figure 3 Typical records for a single test with six slots
At a particular test location, three to six slot-
ting test with cuts in independent direction were made for a single 2D measurement. The theory of linear elasticity was employed to transfer the strain readings into stresses. This means that the moduli of tested rock must be known for the stress measurement. As men-tioned previously, dilatometer tests were per-formed after the completion of slotter tests in the boreholes in order to obtain the moduli of rock mass. IF96 type dilatometer was used for this purpose, the characteristics of which may be found in the Interfels catalogue. The proce-dure and method of the moduli determination by means of this equipment may also be found in the same document.
428
4 CALCULATION AND PRESENTATION OF RESULTS
The conversion of strains into stresses starts with the Kirsch equation, which describes the tangential stress distribution around a circular hole in an infinite elastic plate. By applying Hooke’s law an equation can be derived, that relates the measured strains at the borehole wall to the far-field values of the primary stress field:
]}2sin
2cos)[(2){(1 2
θτ
θσσσσνεθ
xy
yxyxE+
−−+−
= (1)
where θε is the measured strain signal in the azimuth θ . For the determination of the three unknown components σx, σy and τxy of the 2D stress tensor, three different input values for θε andθ are required. With the components of the 2D stress tensor in an arbitrary Cartesian coordinate system, principal stress magnitudes and orientations can be obtained by calculating the eigenvectors and eigenvalues.
For the calculation of stress magnitudes from Borehole Slotter tests, Young’s modulus (E) and Poisson’s ratio (v) have to be deter-mined independently by in-situ and laboratory tests, respectively. E is crucial for the accurate determination of stress magnitudes from slotter tests and, furthermore, for all relief techniques, that do not supply stress magnitudes directly.
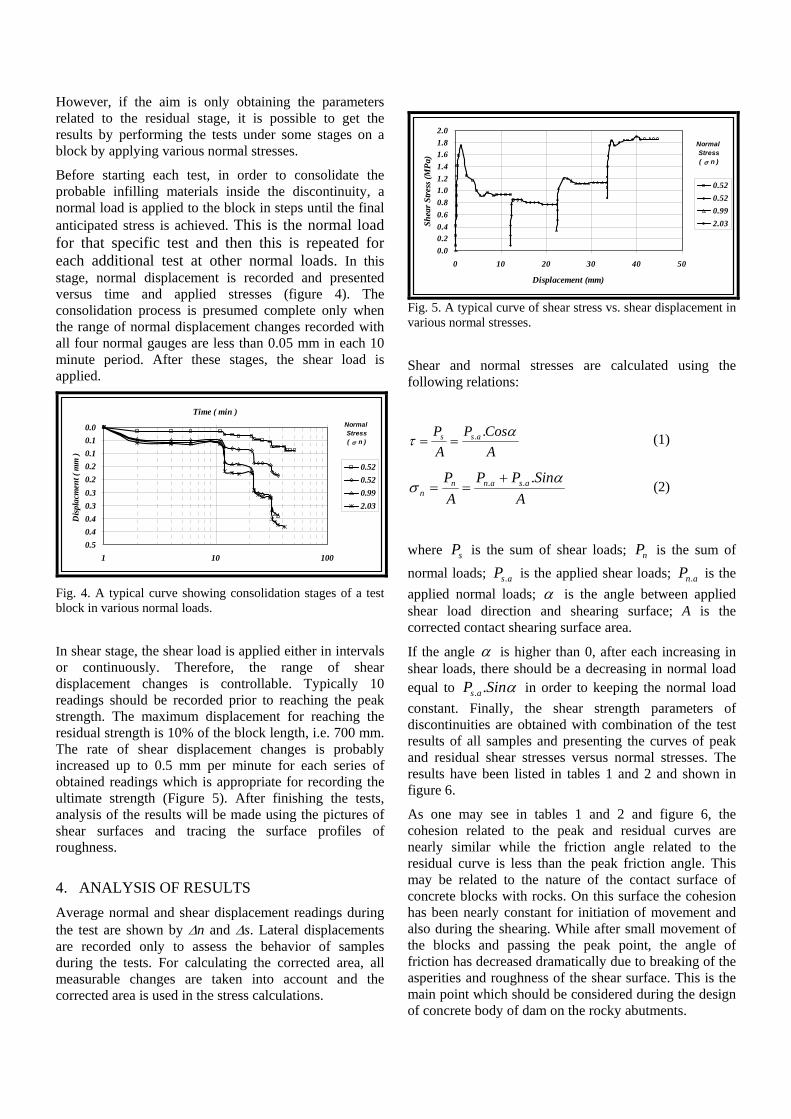
Having considered the abovementioned theory and simplifications, the 2D stresses were calculated and presented in form of tables and diagrams, an example of which is shown in fig-ure 4. The 2D magnitude of stresses and orien-tation of maximum stress in a single borehole have been depicted in this figure. The three di-mensional state of stress was determined by combining the 2D results from each of the bo-reholes. The analysis of the results shows that the maximum principal stress is nearly horizon-tal while the intermediate one is vertical. The magnitude of the principal stresses in the vi-cinity of test site have been evaluated to be about 5.2MPa, 3.1MPa and 2.75MPa and the direction of maximum principal stress is about 250 degrees. One may easily show that there is a good conformity between the magnitude of vertical intermediate stress with the vertical
stress calculated from the overburden mean height and density of the rock mass.
These results have been used for controlling the design of openings geometry, the dimen-sions of the crown and rib pillars and orienta-tion of openings and advance periods.
Figure 4 summary plot of stress measurements carried out in a borehole
5 CONCLUDING REMARKS
In sublevel stopping mining method, parts of the deposit are left in place to support the roof and sidewalls. The optimum design of crown and rib pillars which are major factors deter-mining the economy and safety of the under-ground mining in this method is directly under the influence of the in-situ stresses. Rock mass strength was also required as the input data of the stability analysis and to estimate the dimen-sions of the loosening region accompanied with the excavation.
Laboratory and in-situ tests were performed in order to find the main input data in control-ling the designed openings. Laboratory tests
429
were conducted for finding geomechanical properties of the host and the deposit rock masses, while in-situ stress measurement was performed by means of Borehole Slotter to de-termine the state of stresses. Laboratory data indicated that the rock masses were in good quality and fairly strong and in-situ measure-ment showed low level of principal stresses. With these results the crown and rib pillars in this mine were apparently, from the stability point of view, under very favorable condition. Therefore, their dimensions could be reduced by 15 to 20 percent. This may be very appreci-able in increasing the deposit recovery and, therefore, benefitting the client.
6 REFERENCES
He, G. 1996. Development of an interpretation model for the 3D borehole slotter in-situ stress measurement device, Phd thesis, Ecole Polytechnique, pp. 291.
Yuen, C.S. 1989. Analytical and experimental studies of a recoverable 3D stressmeter for rock. Phd Thesis, James Cook Univ. North Queensland, p. 240.
Azzam, R. & Bock, H. 1987. Recoverable sensor for measurement of tangential strain at borehole walls, a key component in some innovative borehole instru-mentation. 2nd Int. Sympos. Field Measurements in Geomech. Kobe (1) 98-111, Rotterdam: Balkema.
Foruria, V. 1987. Borehole slotting, a new in-situ method for measuring stress in hard rock. MEngSc Thesis, James Cook Univ. North Queensland, p. 174.
Bock, H. 1986. In-situ validation of the borehole slotting stressmeter. Proc. Int. Sympos. On Rock Stresses etc. Centec, Lulea 261-270. Stockholm.
Bock, H. & Foruria, V. 1984. A recoverable borehole slotting instrument for in-situ stress measurements in rock not requiring overcoring. Proc. Int. Sympos Field Measurements in Geomech. Zurich (1) 15-29, Rotterdam: Balkema.
1. INTRODUCTION
The aim of performing in-situ direct shear tests is measurement of peak and residual shear strength parameters of a discontinuity in rock as a function of normal load. The discontinuity is generally a main and important joint which may be filled with soft materials. Shear strength parameters, C and φ, in design of rocky structures, particularly stability analysis of rock slopes and also stability of dam foundation are of paramount importance. An in-situ direct shear test is the simplest method in determining the shear parameters, C and φ, and due to large dimensions of test blocks in comparison to laboratory samples, in-situ tests lead to more precise and accurate results. For determining shear strength of concrete to rock contact surface of the abutments of a concrete dam, six series of in-situ direct shear tests have been conducted inside the left and right galleries which have been excavated nearly at the same level in the abutments of a concrete dam.
2. GENERAL DESCRIPTION OF TEST SYSTEM The required equipment for cutting and preparing of test blocks includes an electrical saw, handy cutting tools such as hammer and chisel, solid casts in suitable dimensions and concrete additives. The equipment used for conducting the tests includes a 200 tones hydraulic jack and two 100 tones jacks for applying normal and shear loads, respectively. These jacks are fed with handy and/or electrical pumps. In order to prevent rotation of blocks under the tests, the shear load is applied with an angle of 15 degrees to the shear surface so that the load effect line is passing through the center of test block (figure 1 and 2). Normal load is also applied regularly and kept exactly normal to shear surface throughout the tests using rollers with low friction.
Shear and normal loads are controlled using hydraulic gauges with the accuracy of 0.5 bars. In order to measure normal displacement, four mechanical or electrical gauges are used with the accuracy of 0.01 mm or 1 micron, respectively. For measuring lateral and shear deformation, 4 gauges of the same type are used. General
ARMA 10-266 In-Situ Shear Strength of Rock-Concrete Contact Surface at the Abutments of a Concrete Dam Gharouni Nik, M. Iran University of Science and Technology (IUST), Tehran, Iran
Copyright 2010 ARMA, American Rock Mechanics Association This paper was prepared for presentation at the 44th US Rock Mechanics Symposium and 5th U.S.-Canada Rock Mechanics Symposium, held in Salt Lake City, UT June 27–30, 2010. This paper was selected for presentation at the symposium by an ARMA Technical Program Committee based on a technical and critical review of the paper by a minimum of two technical reviewers. The material, as presented, does not necessarily reflect any position of ARMA, its officers, or members. Electronic reproduction, distribution, or storage of any part of this paper for commercial purposes without the written consent of ARMA is prohibited. Permission to reproduce in print is restricted to an abstract of not more than 300 words; illustrations may not be copied. The abstract must contain conspicuous acknowledgement of where and by whom the paper was presented.
ABSTRACT: In double curvature concrete dams in which the pressure resulted from impounding is imposed to the abutments, choosing the dam site (from a rock mechanics point of view) and recognizing rock properties at the abutments are of paramount importance. One of the most important parameters which have to be considered is the shear strength of the contact surface between rocks and concrete in the abutments. In this paper that is resulted from a series of in-situ direct shear tests on six concrete blocks prepared on the rocks inside the excavated nearly same-leveled galleries at the left and right abutments, the shear strength parameters and peak and residual strengths of the contact surface of rock- concrete at different applied normal stresses have been measured and reported.
lay out of the test may be seen in figure 2. Figure 3 demonstrates the set up of test equipment.
Fig. 1. General view of a shear block.
Fig. 2. In-situ direct shear test set up.
3. DESCRIPTION OF PERFORMING IN-SITU DIRECT SHEAR TEST Six series of in-situ direct shear tests of concrete-rock type have been performed on six concrete blocks prepared inside the gallery of the left and right abutments of the concrete dam. In these tests, the blocks of rock or concrete are prepared in the galleries after which all the surfaces except the shear surfaces are cast with reinforced concrete. Also it is possible to use a metallic reinforced frame instead of cast concrete.
Care should be taken to prevent any disturbance on the prepared block and that the lower surface of the block is exactly coincided with the shear surface (Figure 2).
The goal of the tests in this project is to determine the geotechnical parameters and qualitative and quantitative recognition of rock mass characteristics, particularly the shear strength of the contact surface of rock mass to the concrete dam body. The resulting strain-stress and
shear stress-normal stress curves are used to evaluate the validity of the test. Also with regard to similarity of type and conditions of rock mass and type of the test (concrete-rock contact) the results obtained from each series of the tests are condensed in diagram. Generally, there are five essential parameters that should be measured: shear and normal stresses, and shear, normal and lateral displacements. During the tests, roof, sidewalls and floor of the galleries are used for bearing the reaction of normal and shear loads. In rock-rock shear test, during preparation of samples, the water content of the block body and especially the shear surface must be similar to natural conditions. For concrete–rock type tests, the condition of the shear surface should also be simulated with the real condition.
Fig. 3. In-situ direct shear test set up in the test gallery.
At least three or four tests are conducted under various normal stresses so that the necessary curves for determining shear strength parameters may be illustrated.
Rock or concrete blocks with the dimensions of 700×700×350 mm are prepared in a manner that minimizes sample disturbance. This is possible with using hand tools for shaping the rock blocks with clean and smooth lateral surfaces (ISRM,1981 (1) and ASTM,1999 (2)). For the cases of concrete blocks after preparation of rock surfaces, care should also be made to have a complete block with standard dimensions on the rock.
In both cases, after preparation of the block, they should be cast with reinforced concrete or metallic frames. The position on which the normal and shear loads will be applied should be prepared on the roof and sidewalls of the galleries with regard to the direction of shearing.
The condition of the prepared block should be such that the pore water pressure is distributed on the shear surface when applying the normal stresses during the consolidation stage. It is possible to obtain the peak and residual shear strength parameters by conducting several tests on a certain surface under various normal loads.
However, if the aim is only obtaining the parameters related to the residual stage, it is possible to get the results by performing the tests under some stages on a block by applying various normal stresses.
Before starting each test, in order to consolidate the probable infilling materials inside the discontinuity, a normal load is applied to the block in steps until the final anticipated stress is achieved. This is the normal load for that specific test and then this is repeated for each additional test at other normal loads. In this stage, normal displacement is recorded and presented versus time and applied stresses (figure 4). The consolidation process is presumed complete only when the range of normal displacement changes recorded with all four normal gauges are less than 0.05 mm in each 10 minute period. After these stages, the shear load is applied.
0.00.10.10.20.20.30.30.40.40.5
1 10 100
Time ( min )
Disp
lacm
ent (
mm
)
0.520.520.992.03
Normal Stress( σ n )
Fig. 4. A typical curve showing consolidation stages of a test block in various normal loads.
In shear stage, the shear load is applied either in intervals or continuously. Therefore, the range of shear displacement changes is controllable. Typically 10 readings should be recorded prior to reaching the peak strength. The maximum displacement for reaching the residual strength is 10% of the block length, i.e. 700 mm. The rate of shear displacement changes is probably increased up to 0.5 mm per minute for each series of obtained readings which is appropriate for recording the ultimate strength (Figure 5). After finishing the tests, analysis of the results will be made using the pictures of shear surfaces and tracing the surface profiles of roughness.
4. ANALYSIS OF RESULTS Average normal and shear displacement readings during the test are shown by Δn and Δs. Lateral displacements are recorded only to assess the behavior of samples during the tests. For calculating the corrected area, all measurable changes are taken into account and the corrected area is used in the stress calculations.
0.00.20.40.60.81.01.21.41.61.82.0
0 10 20 30 40 50
Displacement (mm)
Shea
r Stre
ss (M
Pa)
0.520.520.992.03
Normal Stress( σ n )
Fig. 5. A typical curve of shear stress vs. shear displacement in various normal stresses.
Shear and normal stresses are calculated using the following relations:
ACosP
AP ass α
τ..== (1)
ASinPP
AP asann
nα
σ... +
== (2)
where sP is the sum of shear loads; nP is the sum of
normal loads; asP . is the applied shear loads; anP . is the applied normal loads; α is the angle between applied shear load direction and shearing surface; A is the corrected contact shearing surface area.
If the angle α is higher than 0, after each increasing in shear loads, there should be a decreasing in normal load equal to αSinP as .. in order to keeping the normal load constant. Finally, the shear strength parameters of discontinuities are obtained with combination of the test results of all samples and presenting the curves of peak and residual shear stresses versus normal stresses. The results have been listed in tables 1 and 2 and shown in figure 6.
As one may see in tables 1 and 2 and figure 6, the cohesion related to the peak and residual curves are nearly similar while the friction angle related to the residual curve is less than the peak friction angle. This may be related to the nature of the contact surface of concrete blocks with rocks. On this surface the cohesion has been nearly constant for initiation of movement and also during the shearing. While after small movement of the blocks and passing the peak point, the angle of friction has decreased dramatically due to breaking of the asperities and roughness of the shear surface. This is the main point which should be considered during the design of concrete body of dam on the rocky abutments.
REFERENCES 1. ISRM, Rock characterization, testing and monitoring,
suggested methods for determining in-situ shear strength (.1981).
2. ASTM, American Standard for testing and materials, In-situ determination of shear strength of discontinuities, Vol. 04.08, D4554 (1999).
Table 1. Obtained results from in-situ direct shear tests (Left Bank Gallery)