203

ANNUAL REPORT 2015

PennyMac Mortgage Investment Trust (NYSE: PMT) is a specialty finance company that invests in a variety of mortgage loans and mortgage-related assets. As a real estate investment trust (REIT), our objective is to provide attractive risk-adjusted returns to our shareholders over the long-term, primarily through dividends and secondarily through capital appreciation.
PMT’s targeted investments are in the U.S. mortgage market. Our investments are primarily distressed mortgage loans acquired from financial institutions, mortgage servicing rights (MSRs) created through our correspondent production activities, excess servicing spread (ESS) from MSRs acquired by PennyMac Financial Services, Inc. (NYSE: PFSI) (“PennyMac Financial”), mortgage-backed securities including retained interests from the securitization of prime jumbo loans, and credit risk transfer from the government-sponsored enterprises resulting from our correspondent production activities.
PMT is managed by PNMAC Capital Management, LLC, an indirect wholly-owned subsidiary of PennyMac Financial, and an investment adviser registered with the Securities and Exchange Commission that specializes in, and focuses on, mortgage assets. The conventional conforming and jumbo loans we acquire through our correspondent production operations are purchased, pooled for sale, sold and/or securitized on a fee-for-service basis by another PennyMac Financial subsidiary, PennyMac Loan Services, LLC, which also services most of the loans we hold in our investment portfolio and the loans for which we retain the obligation to service as a result of our correspondent production operations.

Dear Fellow Shareholders,
PMT is a unique residential mortgage real estate investment trust (REIT) because of its ability to source and
create attractive investments resulting from the operational capabilities of its manager and service provider,
PennyMac Financial. 2015 was a challenging year for PMT, with market volatility that impacted our financial
results and the transition in our capital deployment from lower-returning distressed residential mortgage
investments to other strategies with more attractive risk-adjusted returns. PMT earned $90 million in net
income and $1.16 per diluted share, representing a return on average equity of 6 percent. PMT declared
dividends in 2015 totaling $2.16 per share, and book value at year end was $20.28.
While disappointed by last year’s financial performance, we are excited by the attractive investment
opportunities available to PMT that result from our unique business model and the years we have spent
developing each of them. Many of these opportunities come from our industry-leading correspondent
production business, in which we are the largest non-bank aggregator in the U.S., and third largest overall. In
2015, PMT produced $14 billion in unpaid principal balance (UPB) of newly originated conventional conforming
and non-Agency prime jumbo loans for securitization or sale. Our aggregation, securitization, and sale activities
generate high returns on equity, but they also result in ongoing long-term investments with attractive yields for
PMT in mortgage servicing rights (MSRs) and credit risk transfer (CRT) securities. MSRs represent a stream of
fee income for servicing a pool of mortgage loans over their lifetime. In 2015, we deployed $154 million into
new MSR investments; at year end, PMT’s MSRs and similar investments in excess servicing spread totaled $872
million1.
CRT is a new investment strategy we began last year that invests in the credit risk on newly originated
mortgages we produce and securitize with Fannie Mae. Until recently, the government-sponsored enterprises
(GSEs) Fannie Mae and Freddie Mac bore all the credit risk on loans they purchased and securitized, and
captured as revenue guarantee fees derived from the mortgage interest paid by borrowers. We have worked
constructively with Fannie Mae to develop a structure in which PMT invests in a security that assumes the “first
loss” credit risk for loans we aggregate, with Fannie Mae retaining the credit risk for excess or catastrophic
losses. We believe that these CRT investments will generate attractive risk-adjusted returns across a range of
default scenarios for the underlying loans, particularly given the due diligence we perform to assess the quality
of our correspondent production. Through February 2016, PMT delivered over $5 billion in UPB of loans into
CRT transactions, creating nearly $190 million of CRT securities. We recently announced a new CRT
commitment with Fannie Mae for $5 billion in UPB of loan deliveries, which would create an additional $175
million in CRT securities.
Our CRT strategy is indicative of a major shift in the U.S. mortgage industry, as policymakers and regulators such
as the Federal Housing Finance Agency (FHFA) seek to attract private capital to bear a portion of the credit risk 1 MSR and ESS assets at December 31, 2015. PMT sold $59 million in ESS related to conventional loans in February 2016.

in the largest segment of the mortgage market – conventional conforming loans. In its 2016 scorecard for the
GSEs, FHFA requires Fannie Mae and Freddie Mac to transfer credit risk to private investors on a substantial
portion of the new loans they securitize and calls for additional analysis and assessment of “front-end”
transactions like PMT’s CRT investments. We view this as a significant development and a positive step toward a
healthy, sustainable mortgage market. Furthermore, our tax-advantaged status as a REIT combined with our
access to unique operational capabilities make PMT well suited to invest in GSE credit risk on its own loan
production and capitalize on this important opportunity.
While still in the initial phases, we have worked to develop an investment program in small balance multifamily
mortgage loans. PMT was recently approved by Freddie Mac to produce and service these types of mortgages
under its Small Balance Loan (SBL) program. Newly originated multifamily loans are delivered to Freddie Mac for
securitization, with PMT retaining as an investment a security that bears a portion of the credit risk. This reflects
a shift in the focus of PMT’s small balance commercial real estate finance business away from non-Agency loans
to Freddie Mac and government-insured multifamily programs.
PMT’s largest investments remain in distressed mortgage loans which we continue to manage to maximize
returns. Our distressed loan portfolio continues to generate substantial cash flows primarily through
liquidation; cash flows from the liquidation of the loans and the sale of real estate acquired in the settlement of
the loans totaled $458 million in 2015. We also seek to optimize investment returns through loan resolution
strategies including a greater focus on implementing new loan modification strategies, which has helped to
sustain an increase in our modification pipeline and has resulted in more completed modifications. Successful
modifications have also created a growing performing loan portfolio, and we will continue to pursue sales of
lower-yielding performing loans over time.
Finally, we have implemented a common share repurchase program to enhance shareholder value. Last year,
PMT’s Board of Trustees authorized a $150 million share repurchase program that was recently increased to
$200 million. At the current price of our common shares, the repurchase of our stock is a highly attractive use of
capital and as of February 24, 2016, we had repurchased approximately $47 million of PMT’s common shares,
which we estimate had an underlying book value of $75 million, under the program.
Looking forward, we are confident in the outlook for PMT and our ability to deliver outstanding returns over
time through investments in innovative and distinctive mortgage strategies. The ability to generate these
investments organically distinguishes PMT from other mortgage REITs and gives us confidence in PMT’s future
and our ability to grow long-term shareholder value. Thank you for your continued confidence and support.
Sincerely,
Stanford L. Kurland David Spector
Chairman and Chief Executive Officer Executive Managing Director, President and Chief Operating Officer
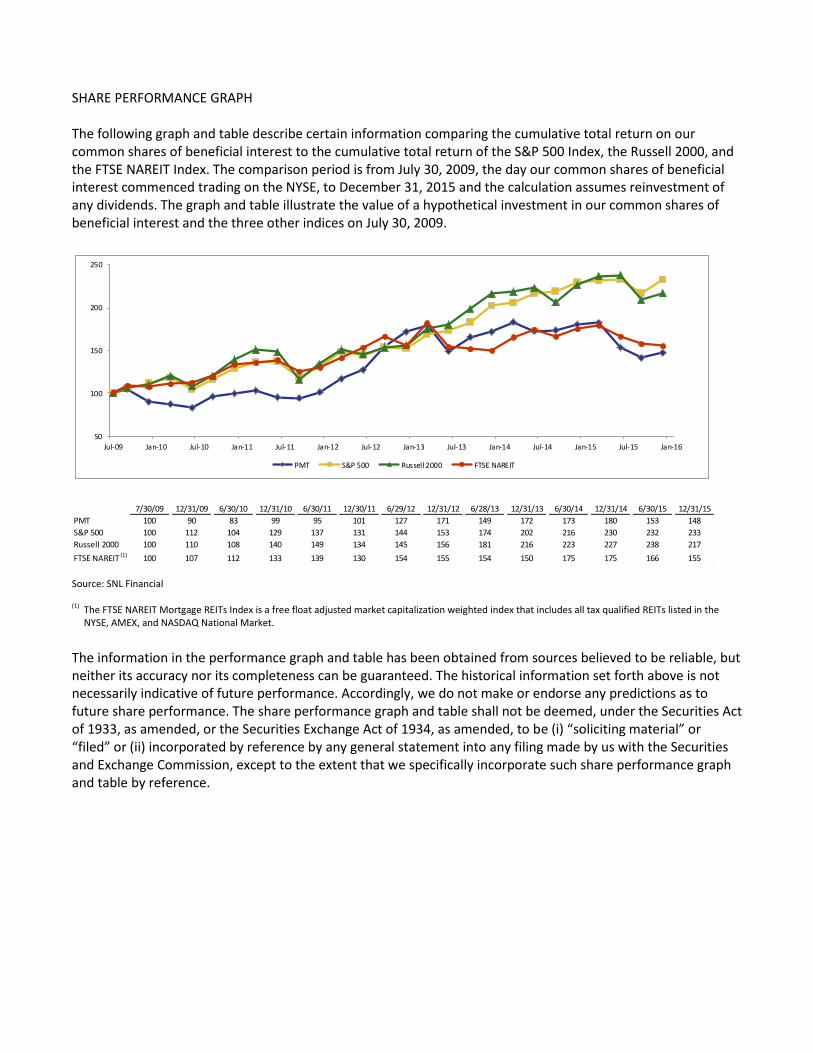
SHARE PERFORMANCE GRAPH The following graph and table describe certain information comparing the cumulative total return on our common shares of beneficial interest to the cumulative total return of the S&P 500 Index, the Russell 2000, and the FTSE NAREIT Index. The comparison period is from July 30, 2009, the day our common shares of beneficial interest commenced trading on the NYSE, to December 31, 2015 and the calculation assumes reinvestment of any dividends. The graph and table illustrate the value of a hypothetical investment in our common shares of beneficial interest and the three other indices on July 30, 2009.
50
100
150
200
250
Jul-09 Jan-10 Jul-10 Jan-11 Jul-11 Jan-12 Jul-12 Jan-13 Jul-13 Jan-14 Jul-14 Jan-15 Jul-15 Jan-16
PMT S&P 500 Russell 2000 FTSE NAREIT
7/30/09 12/31/09 6/30/10 12/31/10 6/30/11 12/30/11 6/29/12 12/31/12 6/28/13 12/31/13 6/30/14 12/31/14 6/30/15 12/31/15
PMT 100 90 83 99 95 101 127 171 149 172 173 180 153 148
S&P 500 100 112 104 129 137 131 144 153 174 202 216 230 232 233
Russell 2000 100 110 108 140 149 134 145 156 181 216 223 227 238 217
FTSE NAREIT (1) 100 107 112 133 139 130 154 155 154 150 175 175 166 155 Source: SNL Financial (1)
The FTSE NAREIT Mortgage REITs Index is a free float adjusted market capitalization weighted index that includes all tax qualified REITs listed in the NYSE, AMEX, and NASDAQ National Market.
The information in the performance graph and table has been obtained from sources believed to be reliable, but neither its accuracy nor its completeness can be guaranteed. The historical information set forth above is not necessarily indicative of future performance. Accordingly, we do not make or endorse any predictions as to future share performance. The share performance graph and table shall not be deemed, under the Securities Act of 1933, as amended, or the Securities Exchange Act of 1934, as amended, to be (i) “soliciting material” or “filed” or (ii) incorporated by reference by any general statement into any filing made by us with the Securities and Exchange Commission, except to the extent that we specifically incorporate such share performance graph and table by reference.
ADDITIONAL INFORMATION Corporate Offices PennyMac Mortgage Investment Trust 3043 Townsgate Road Westlake Village, CA 91361 (818) 224-7028 www.ir.pennymacmortgageinvestmenttrust.com Transfer Agent Computershare Shareowner Services LLC 480 Washington Boulevard 27th Floor Jersey City, NJ 07310-1900 (866) 271-9980 www.computershare.com Independent Registered Public Accounting Firm Deloitte & Touche LLP Los Angeles, CA Investor Information PMT’s common shares are traded on the New York Stock Exchange under the symbol “PMT.” For more information on PMT, you may visit the Investor Relations section of the Company’s Web site at www.ir.pennymacmortgageinvestmenttrust.com for current news, investor conference calls and presentations, and Company filings with the Securities and Exchange Commission, among other information. Investor inquiries may be submitted to PMT’s Investor Relations department via mail addressed to the Company’s corporate offices, or by telephone at (818) 224-7028. Pursuant to Rule 303A.12 of the New York Stock Exchange Listed Companies Manual, each listed company CEO must certify to the NYSE each year that he or she is not aware of any violation by the company of NYSE corporate governance listing standards. Stanford L. Kurland’s annual CEO certification regarding the NYSE’s corporate governance listing standards was submitted to the NYSE on July 2, 2015.

UNITED STATES
SECURITIES AND EXCHANGE COMMISSION Washington, DC 20549
Form 10-K
(Mark One)
For the fiscal year ended December 31, 2015
Or
For the transition period from to
Commission file number: 001-34416
PennyMac Mortgage Investment Trust (Exact name of registrant as specified in its charter)
(818) 224-7442 (Registrant’s telephone number, including area code)
Securities registered pursuant to Section 12(b) of the Act:
Securities registered pursuant to Section 12(g) of the Act: None
Indicate by check mark if the registrant is a well-known seasoned issuer, as defined in Rule 405 of the Securities Act. Yes ⌧ No
⌧ ANNUAL REPORT PURSUANT TO SECTION 13 OR 15(d) OF THE SECURITIES EXCHANGE ACT OF 1934
TRANSITION REPORT PURSUANT TO SECTION 13 OR 15(d) OF THE SECURITIES EXCHANGE ACT OF 1934
Maryland 27-0186273(State or other jurisdiction of
incorporation or organization) (IRS Employer
Identification No.)
6101 Condor Drive, Moorpark, California 93021(Address of principal executive offices) (Zip Code)
Title of Each Class Name of Each Exchange on Which RegisteredCommon Shares of Beneficial Interest, $0.01
Par ValueNew York Stock Exchange

Indicate by check mark if the registrant is not required to file reports pursuant to Section 13 or Section 15(d) of the Act. Yes No ⌧
Indicate by check mark whether the registrant (1) has filed all reports required to be filed by Section 13 or 15(d) of the Securities Exchange Act of 1934 during the preceding 12 months (or for such shorter period that the registrant was required to file such reports) and (2) has been subject to such filing requirements for the past 90 days. Yes ⌧ No
Indicate by check mark whether the registrant has submitted electronically and posted on its corporate Web site, if any, every Interactive Data File required to be submitted and posted pursuant to Rule 405 of Regulation S-T (§ 232.405 of this chapter) during the preceding 12 months (or for such shorter period that the registrant was required to submit and post such files). Yes ⌧ No
Indicate by check mark if disclosure of delinquent filers pursuant to Item 405 of Regulation S-K is not contained herein, and will not be contained, to the best of registrant’s knowledge, in definitive proxy or information statements incorporated by reference in Part III of this Form 10-K or any amendment to this Form 10-K.
Indicate by check mark whether the registrant is a large accelerated filer, an accelerated filer, a non-accelerated filer, or a smaller reporting company. See the definitions of “large accelerated filer”, “accelerated filer” and “smaller reporting company” in Rule 12b-2 of the Exchange Act (check one):
Indicate by check mark whether the registrant is a shell company (as defined in Rule 12b-2 of the Exchange Act). Yes No ⌧
As of June 30, 2015 the aggregate market value of the registrant’s common shares of beneficial interest, $0.01 par value (“common shares”), held by nonaffiliates was $1,283,938,438 based on the closing price as reported on the New York Stock Exchange on that date.
As of February 19, 2016, there were 72,246,828 common shares of the registrant outstanding.
Documents Incorporated By Reference
Large accelerated filer ⌧ Accelerated filer
Non-accelerated filer (Do not check if a smaller reporting company) Smaller reporting company
Document Parts Into Which IncorporatedDefinitive Proxy Statement for 2016 Annual Meeting of
ShareholdersPart III

PENNYMAC MORTGAGE INVESTMENT TRUST FORM 10-K
December 31, 2015 TABLE OF CONTENTS
1
PageSpecial Note Regarding Forward-Looking Statements 2 PART I 4 Item 1 Business 4 Item 1A Risk Factors 11 Item 1B Unresolved Staff Comments 39 Item 2 Properties 39 Item 3 Legal Proceedings 39 Item 4 Mine Safety Disclosures 39 PART II 40 Item 5 Market for Registrant’s Common Equity, Related Stockholder Matters and Issuer Purchases of Equity Securities 40 Item 6 Selected Financial Data 42 Item 7 Management’s Discussion and Analysis of Financial Condition and Results of Operations 43 Item 7A Quantitative and Qualitative Disclosures About Market Risk 93 Item 8 Financial Statements and Supplementary Data 93 Item 9 Changes in and Disagreements With Accountants on Accounting and Financial Disclosure 93 Item 9A Controls and Procedures 93 Item 9B Other Information 95 PART III 95 Item 10 Directors, Executive Officers and Corporate Governance 95 Item 11 Executive Compensation 95 Item 12 Security Ownership of Certain Beneficial Owners and Management and Related Stockholder Matters 95 Item 13 Certain Relationships and Related Transactions, and Director Independence 95 Item 14 Principal Accounting Fees and Services 95 PART IV 96 Item 15 Exhibits and Financial Statement Schedules 96
Signatures
SPECIAL NOTE REGARDING FORWARD-LOOKING STATEMENTS
This Annual Report on Form 10-K (“Report”) contains certain forward-looking statements that are subject to various risks and uncertainties. Forward-looking statements are generally identifiable by use of forward-looking terminology such as “may,” “will,” “should,” “potential,” “intend,” “expect,” “seek,” “anticipate,” “estimate,” “approximately,” “believe,” “could,” “project,” “predict,” “continue,” “plan” or other similar words or expressions.
Forward-looking statements are based on certain assumptions, discuss future expectations, describe future plans and strategies, contain financial and operating projections or state other forward-looking information. Examples of forward-looking statements include the following:
Our ability to predict results or the actual effect of future events, actions, plans or strategies is inherently uncertain. Although we believe that the expectations reflected in such forward-looking statements are based on reasonable assumptions, our actual results and performance could differ materially from those set forth in the forward-looking statements. There are a number of factors, many of which are beyond our control that could cause actual results to differ significantly from management’s expectations. Some of these factors are discussed below.
You should not place undue reliance on any forward-looking statement and should consider the following uncertainties and risk factors, as well as the risks, risk factors and uncertainties discussed elsewhere in this Report and any subsequent Quarterly Reports on Form 10-Q.
Factors that could cause actual results to differ materially from historical results or those anticipated include, but are not limited to:
2
• projections of our revenues, income, earnings per share, capital structure or other financial items;
• descriptions of our plans or objectives for future operations, products or services;
• forecasts of our future economic performance, interest rates, profit margins and our share of future markets; and
• descriptions of assumptions underlying or relating to any of the foregoing expectations regarding the timing of generating any revenues.
• changes in our investment objectives or investment or operational strategies, including any new lines of business or new products and services that may subject us to additional risks;
• volatility in our industry, the debt or equity markets, the general economy or the real estate finance and real estate markets specifically, whether the result of market events or otherwise;
• events or circumstances which undermine confidence in the financial markets or otherwise have a broad impact on
financial markets, such as the sudden instability or collapse of large depository institutions or other significant corporations, terrorist attacks, natural or man-made disasters, or threatened or actual armed conflicts;
• changes in general business, economic, market, employment and political conditions, or in consumer confidence and spending habits from those expected;
• declines in real estate or significant changes in U.S. housing prices or activity in the U.S. housing market;
• the availability of, and level of competition for, attractive risk-adjusted investment opportunities in mortgage loans and mortgage-related assets that satisfy our investment objectives;
• the inherent difficulty in winning bids to acquire mortgage loans, and our success in doing so;
• the concentration of credit risks to which we are exposed;
• the degree and nature of our competition;
• our dependence on our manager and servicer, potential conflicts of interest with such entities and their affiliates, and the performance of such entities;
• changes in personnel and lack of availability of qualified personnel at our manager, servicer or their affiliates;
• the availability, terms and deployment of short-term and long-term capital;
• the adequacy of our cash reserves and working capital;
• our ability to maintain the desired relationship between our financing and the interest rates and maturities of our assets;

3
• the timing and amount of cash flows, if any, from our investments;
• unanticipated increases or volatility in financing and other costs, including a rise in interest rates;
• the performance, financial condition and liquidity of borrowers;
• the ability of our servicer, which also provides us with fulfillment services, to approve and monitor correspondent sellers and underwrite loans to investor standards;
• incomplete or inaccurate information or documentation provided by customers or counterparties, or adverse changes in the financial condition of our customers and counterparties;
• our indemnification and repurchase obligations in connection with mortgage loans we purchase and later sell or securitize:
• the quality and enforceability of the collateral documentation evidencing our ownership and rights in the assets in which we invest;
• increased rates of delinquency, default and/or decreased recovery rates on our investments;
• our ability to foreclose on our investments in a timely manner or at all;
• increased prepayments of the mortgages and other loans underlying our mortgage-backed securities (“MBS”) or relating to our mortgage servicing rights (“MSRs”), excess servicing spread (“ESS”) and other investments;
• the degree to which our hedging strategies may or may not protect us from interest rate volatility;
• the effect of the accuracy of or changes in the estimates we make about uncertainties, contingencies and asset and liability valuations when measuring and reporting upon our financial condition and results of operations;
• our failure to maintain appropriate internal controls over financial reporting;
• technologies for loans and our ability to mitigate security risks and cyber intrusions;
• our ability to obtain and/or maintain licenses and other approvals in those jurisdictions where required to conduct our business;
• our ability to detect misconduct and fraud;
• our ability to comply with various federal, state and local laws and regulations that govern our business;
• developments in the secondary markets for our mortgage loan products;
• legislative and regulatory changes that impact the mortgage loan industry or housing market;
• changes in regulations or the occurrence of other events that impact the business, operations or prospects of government agencies such as the Government National Mortgage Association (“Ginnie Mae”), the Federal Housing Administration (the “FHA”) or the Veterans Administration (the “VA”), the U.S. Department of Agriculture (“USDA”), or government-sponsored entities such as the Federal National Mortgage Association (“Fannie Mae”) or the Federal Home Loan Mortgage Corporation (“Freddie Mac”) (Fannie Mae, Freddie Mac and Ginnie Mae are each referred to as an “Agency” and, collectively, as the “Agencies”), or such changes that increase the cost of doing business with such entities;
• the Dodd-Frank Wall Street Reform and Consumer Protection Act (the “Dodd-Frank Act”) and its implementing
regulations and regulatory agencies, and any other legislative and regulatory changes that impact the business, operations or governance of mortgage lenders and/or publicly-traded companies;
• the Consumer Financial Protection Bureau (“CFPB”) and its issued and future rules and the enforcement thereof;
• changes in government support of homeownership;
• changes in government or government-sponsored home affordability programs;
• limitations imposed on our business and our ability to satisfy complex rules for us to qualify as a real estate investment trust (“REIT”) for U.S. federal income tax purposes and qualify for an exclusion from the Investment Company Act of 1940 (the “Investment Company Act”) and the ability of certain of our subsidiaries to qualify as REITs or as taxable REIT subsidiaries (“TRSs”) for U.S. federal income tax purposes, as applicable, and our ability and the ability of our subsidiaries to operate effectively within the limitations imposed by these rules;
• changes in governmental regulations, accounting treatment, tax rates and similar matters (including changes to laws governing the taxation of REITs, or the exclusions from registration as an investment company);

Other factors that could also cause results to differ from our expectations may not be described in this Report or any other document. Each of these factors could by itself, or together with one or more other factors, adversely affect our business, results of operations and/or financial condition.
Forward-looking statements speak only as of the date they are made, and we undertake no obligation to update any forward-looking statement to reflect the impact of circumstances or events that arise after the date the forward-looking statement was made.
PART I
The following description of our business should be read in conjunction with the information included elsewhere in this Report. This description contains forward-looking statements that involve risks and uncertainties. Actual results could differ significantly from the projections and results discussed in the forward-looking statements due to the factors described under the caption “Risk Factors” and elsewhere in this Report. References in this Report to “we,” “our,” “us,” “PMT,” or the “Company” refer to PennyMac Mortgage Investment Trust and its consolidated subsidiaries, unless otherwise indicated.
Our Company
We are a specialty finance company that invests primarily in residential mortgage loans and mortgage-related assets. We were organized in Maryland on May 18, 2009, and began operations on August 4, 2009. We conduct our operations through two segments: correspondent production and investment activities. For financial information concerning our reportable segments see Note 33, Segments and Related Information, in the Consolidated Financial Statements. We conduct substantially all of our operations, and make substantially all of our investments, through PennyMac Operating Partnership, L.P. (our “Operating Partnership”) and its subsidiaries. A wholly-owned subsidiary of ours is the sole general partner, and we are the sole limited partner, of our Operating Partnership.
The management of our business and execution of our operations is performed on our behalf by subsidiaries of PennyMac Financial Services, Inc. (“PFSI” or “PennyMac”). PFSI is a specialty financial services firm with a comprehensive mortgage platform and integrated business focused on the production and servicing of U.S. residential mortgage loans and the management of investments related to the U.S. residential mortgage market. Specifically:
Our objective is to provide attractive risk-adjusted returns to our investors over the long-term, primarily through dividends and secondarily through capital appreciation. Our targeted investments are in the U.S. mortgage market, including credit sensitive assets such as distressed mortgage loans, credit risk transfer (“CRT”) securities related to our correspondent production, non-Agency subordinate bonds, small-balance commercial real estate (including multifamily) loans and subordinate interests; and interest rate sensitive assets such as MSRs, ESS, MBS, and non-Agency senior MBS.
In addition to our investment activities, we are engaged in correspondent production, which is the acquisition of newly originated, prime credit quality, first-lien residential mortgage loans that have been underwritten to investor guidelines, pooling such loans into MBS and selling the resulting securities into the secondary markets. We purchase Agency-eligible loans and jumbo loans. A jumbo loan is a loan in an amount that exceeds the maximum loan amount for eligible loans under Agency guidelines. We then sell or securitize Agency-eligible loans meeting the guidelines of Fannie Mae and Freddie Mac on a servicing-retained basis whereby we retain the related MSRs; government loans (insured by the FHA or guaranteed by the VA), which we sell to PLS, a Ginnie Mae approved issuer and servicer; and jumbo mortgage loans, which, generally on a servicing-retained basis, we securitize or sell to third parties.
4
• our ability to make distributions to our shareholders in the future;
• the effect of public opinion on our reputation;
• the occurrence of natural disasters or other events or circumstances that could impact our operations; and
• our organizational structure and certain requirements in our charter documents.
Item 1. Business
• We are managed by PNMAC Capital Management, LLC (“PCM” or our “Manager”), an indirect wholly-owned subsidiary
of PennyMac and an investment adviser registered with the Securities and Exchange Commission (“SEC”) that specializes in, and focuses on, U.S. residential mortgage assets.
• All of the loans we acquire in our correspondent production operations (as described below) are fulfilled on our behalf by another indirect wholly-owned PennyMac subsidiary, PennyMac Loan Services, LLC (“PLS” or our “Servicer”), which also services the loans we hold in our residential mortgage investment portfolio and the loans for which we retain the obligation to service as a result of our correspondent production.
Our correspondent production business has grown through purchases from approved mortgage originators that meet specific criteria related to management experience, financial strength, risk management controls and loan quality. The management team at PLS has prior experience with the majority of these mortgage originators. As of December 31, 2015, 432 sellers have been approved, primarily independent mortgage originators and small banks located across the United States. We purchased approximately $46.4 billion at fair value of loans in 2015, including $14.4 billion of conventional loans and $31.9 billion of government-insured loans. In the third quarter of 2015, we were the third largest correspondent lender in the United States as ranked by Inside Mortgage Finance.
We have elected to be taxed as a REIT for U.S. federal income tax purposes and we intend to maintain our exclusion from regulation under the Investment Company Act. Therefore, we are required to invest a substantial majority of our assets in loans secured by real estate and in real estate-related assets. Subject to maintaining our REIT qualification and our Investment Company Act exclusion, we do not have any limitations on the amounts we may invest in any of our targeted asset classes.
Our Manager and Our Servicers
We are externally managed and advised by PCM pursuant to a management agreement. PCM specializes in and focuses on residential mortgage loans. PCM also serves as the investment manager to two private investment funds, which we refer to as the PennyMac funds, with investment objectives and policies relating to distressed mortgage loans that are substantially similar to ours. The combined net assets of the entities managed by PCM, including our shareholders’ equity, amounted to approximately $1.7 billion as of December 31, 2015.
PCM is responsible for administering our business activities and day-to-day operations, including developing our investment strategies, sourcing and acquiring mortgage loans and mortgage-related assets for our investment portfolio, and developing the appropriate approach to be taken by PLS for each loan as it performs its specialty servicing. Pursuant to the terms of the management agreement, PCM provides us with our senior management team, including our officers and support personnel. PCM is subject to the supervision and oversight of our board of trustees and has the functions and authority specified in the management agreement.
Our Manager’s senior management team has extensive experience in the residential mortgage industry and expertise across each of the critical capabilities that we believe are required to successfully acquire and manage both performing and nonperforming mortgage loans, including sourcing, valuation, due diligence, portfolio strategy, servicing (including modification and refinance fulfillment of outstanding loans and acquisition and liquidation of properties securing settled mortgage loans) and secondary marketing.
We also have a loan servicing agreement with PLS, pursuant to which PLS provides primary and special servicing for our portfolio of residential mortgage loans. PLS’s loan servicing activities include collecting principal, interest and escrow account payments, if any, with respect to mortgage loans, as well as managing loss mitigation, which may include, among other things, collection activities, loan workouts, modifications and refinancings, foreclosures, short sales and sales of real estate owned properties (“REO”). Servicing fee rates are based on the delinquency status and other characteristics of the mortgage loans serviced and total servicing compensation is established at levels that our Manager believes are competitive with those charged by other primary servicers and specialty servicers. PLS also provides special servicing to the PennyMac funds and the entities in which the PennyMac funds have invested. PLS acted as the servicer for mortgage loans with an aggregate unpaid principal balance (“UPB”) of approximately $160.3 billion as of December 31, 2015.
We have a commercial mortgage loan servicing agreement with Midland Loan Services, a Division of PNC Bank, National Association (“Midland”), pursuant to which Midland provides the master servicing for commercial mortgage loans that we acquire and may also provide special servicing, as necessary. We also have a commercial mortgage loan servicing oversight agreement with PLS, pursuant to which PLS provides oversight of Midland, including vendor management, review of reports and procedures for accuracy and timeliness, and monitoring Midland’s activities and performance.
5

Investment Strategy and Targeted Asset Classes
Our Manager continually evaluates the markets for investment opportunities on our behalf. To date, we have invested in mortgage loans, a substantial portion of which are distressed and acquired at discounts to their unpaid principal balances; MSRs; ESS; mortgage-related securities; small balance (typically under $10 million) commercial real estate loans; and other mortgage-related, real estate and financial assets. We also expect to invest in newly originated multifamily loans. A substantial portion of our investments are not rated by any rating agency.
Our targeted asset classes and the principal investments we make and/or expect to make in each class are as follows:
Over time, our targeted asset classes may change as a result of changes in the opportunities that are available in the market, among other factors. We may not invest in certain of the investments described above if we believe those types of investments will not provide us with attractive opportunities or if we believe other types of our targeted assets provide us with better opportunities.
Our Portfolios
Investment Activities
Our portfolio of mortgage investments was comprised of the following:
6
Asset class Principal investments
Credit Sensitive Assets • Distressed loan investments (including REO)
• GSE credit risk transfer
• Non-Agency subordinate bonds
• Small balance (typically under $10 million) commercial real estate loans that finance
multifamily and other commercial real estate or securities backed by such loans
Interest Rate Sensitive Assets • MSRs
• ESS arising from MSRs (including recapture)
• Agency MBS
• Non-Agency senior MBS
• Mortgage-related derivatives, including, but not limited to, options, futures and
derivatives on MBS
• United States Treasury securities
December 31, 2015 2014 2013 2012 2011 (in thousands)Credit Sensitive Assets
Distressed mortgage loans at fair value Performing $ 877,438 $ 664,266 $ 647,266 $ 404,016 $ 209,599 Nonperforming 1,222,956 1,535,317 1,647,527 785,955 615,977
REO 350,642 303,228 148,080 88,078 103,549 Credit risk transfer agreements 147,593 — — — — Agency debt — — 12,000 — — Small balance commercial mortgage loans 14,590 — — — —
2,613,219 2,502,811 2,454,873 1,278,049 929,125
Interest Rate Sensitive Assets MSRs 459,741 357,780 290,572 126,776 6,031 ESS 412,425 191,166 138,723 — — Agency MBS 225,150 195,518 197,401 — 72,813 Non-Agency senior MBS 97,323 111,845 — — — Interest rate hedges(1) 2,282 3,016 4,766 3,260 (3,834)
1,196,921 859,325 631,462 130,036 75,010
$3,810,140 $3,362,136 $3,086,335 $1,408,085 $1,004,135
(1) Total derivative assets, excluding interest rate lock commitments (“IRLC”) and net of derivative liabilities.

Correspondent Production
In our correspondent production activities, we acquire newly originated loans from mortgage lenders, sell the loans to an Agency or other third party, sell the loans to PLS in the case of government loans, or otherwise pool loans into MBS, sell the resulting securities into the MBS markets and retain the MSRs. During 2015, we purchased $46.4 billion at fair value of newly originated mortgage loans, compared to $28.4 billion during 2014.
Following is a summary of our correspondent production activities:
PCM has worked to expand our sources of assets to position us to take advantage of market opportunities and market changes. Examples of such investments, which are in various stages of analysis, planning or implementation, include:
Our Financing Strategy
We have pursued growth of our investment portfolio by using a combination of equity and borrowings, generally in the form of borrowings under agreements to repurchase. We use borrowings to finance our investments and not to speculate on changes in interest rates.
During 2014, we issued 3.8 million common shares under an ATM Equity Offering Sales Agreementsm and received net proceeds totaling $89.6 million. During 2015 and 2013, we did not issue our common shares under this or any other agreement. We used the proceeds of the 2014 offerings to fund a portion of the purchase price of our mortgage-related investments, to fund the continued growth of our correspondent production business and for general corporate purposes.
7
Year ended December 31, 2015 2014 2013 2012 2011 (in thousands)Correspondent mortgage loan purchases:
Government-insured or guaranteed $31,945,396 $16,523,216 $16,068,253 $ 8,969,220 $ 623,540 Agency-eligible 14,360,888 11,474,345 15,358,372 13,463,121 660,862 Jumbo 117,714 383,854 582,996 10,795 34,361 Commercial mortgage loans 14,811 — — — —
$46,438,809 $28,381,415 $32,009,621 $22,443,136 $1,318,763
UPB of correspondent mortgage loan purchases $44,357,875 $27,147,444 $30,949,758 $21,480,593 $1,273,314 Gain on mortgage loans acquired for sale(1) $ 51,016 $ 35,647 $ 98,669 $ 147,675 $ 7,633 Fair value of correspondent loans in
inventory at year end pending sale to: PFSI $ 669,288 $ 209,325 $ 112,360 $ 153,326 $ 46,266 Nonaffiliates 614,507 428,397 345,777 821,858 185,750
$ 1,283,795 $ 637,722 $ 458,137 $ 975,184 $ 232,016
(1) Gain on mortgage loans acquired for sale includes the initial MSR capitalization, recognition of initial and changes in the fair value of commitments to purchase loans (“IRLCs”), changes in the fair value of mortgage loans purchased during the period from purchase through the date of sale and changes in the fair value of derivative financial instruments acquired to manage the risk of changes in fair value of our inventory of mortgage loans and IRLCs.
• Creation and acquisition of MSRs and ESS related to MSRs. We believe that MSR and ESS investments may allow us to earn attractive current returns and to leverage the mortgage loan servicing and origination capabilities of PLS to enhance the assets’ value. We intend to continue to retain the MSRs that we receive as a portion of the proceeds from our sale or securitization of mortgage loans through our correspondent production operation.
• Recapture of MSRs. Pursuant to the terms of the MSR recapture agreement entered into with PFSI effective February 1, 2013, if PFSI refinances mortgage loans for which we previously created and held the MSRs through our correspondent production activities, PFSI is generally required to transfer and convey to us, at no cost to us, the MSRs with respect to new mortgage loans originated in those refinancings (or, under certain circumstances, other mortgage loans) that have an aggregate unpaid principal balance that is not less than 30% of the aggregate unpaid principal balance of all the mortgage loans so originated.
• Acquisition of small balance (typically under $10 million) commercial real estate loans that finance multifamily and other commercial real estate or securities backed by such mortgage loans.
• To the extent that we transfer correspondent production mortgage loans into private label securitizations, we may retain
a portion of the securities and residual interests created in such securitization transactions. We expect our future securitizations will be accounted for as secured borrowings.
Our board of trustees has authorized a common share repurchase program under which we may repurchase up to $200 million of our outstanding common shares. During the year ended December 31, 2015, we repurchased 1.0 million common shares at a cost of $16.3 million. The repurchased common shares were canceled upon settlement of the repurchase transactions and returned to the authorized but unissued share pool.
Since 2010, we have maintained multiple master repurchase agreements with money center banks to finance our investments in distressed assets. Our objective is to use these facilities to finance nonperforming mortgage loan and real estate investments pending liquidation, sale, securitization or other structured financing. The aggregate principal amount outstanding under the facilities in existence as of December 31, 2015 was $1.6 billion.
Since 2010, we have also maintained multiple master repurchase agreements with money center banks to fund newly originated prime mortgage loans purchased from correspondent lenders. The aggregate principal balance outstanding under the facilities in existence as of December 31, 2015 was $1.1 billion.
In 2013, our wholly-owned subsidiary, PennyMac Corp. (“PMC”), issued in a private offering $250 million aggregate principal amount of 5.375% Exchangeable Senior Notes due 2020 (the “Exchangeable Notes”). The net proceeds were used to fund our business and investment activities, including the acquisition of distressed mortgage loans or other investments; the funding of the continued growth of our correspondent production business, including the purchase of jumbo loans; the repayment of other indebtedness; and general corporate purposes.
In 2015, our wholly-owned subsidiary, PennyMac Holdings, LLC (“PMH”) entered into a loan and security agreement with PLS, pursuant to which PMH may borrow up to $150 million from PLS for the purpose of financing ESS. The principal amount of the borrowings under the loan and security agreement is based upon a percentage of the market value of the ESS pledged by PMH, subject to the maximum loan amount described above. Pursuant to the loan and security agreement, PMH grants to PLS a security interest in all of its right, title and interest in, to and under the ESS pledged to secure loans and PLS, in turn, re-pledges such ESS under a repurchase agreement with Credit Suisse First Boston Mortgage Capital LLC (“CSFB”) (the “MSR Repo”). Under the MSR Repo and subject to a separate acknowledgement agreement by and among Ginnie Mae, CSFB and PLS, PLS finances Ginnie Mae MSRs and servicing advance receivables and pledges to CSFB all of its rights and interests in any Ginnie Mae MSRs it owns or acquires (inclusive of our ESS relating to a portion of such pledged Ginnie Mae MSRs).
Our borrowings are made under agreements that include various covenants, including profitability, the maintenance of specified levels of cash, adjusted tangible net worth and overall leverage limits. Our ability to borrow under these facilities is limited by the amount of qualifying assets that we hold and that are eligible to be pledged to secure such borrowings. We are not otherwise required to maintain any specific debt-to-equity ratio, and we believe the appropriate leverage for the particular assets we finance depends on, among other things, the credit quality and risk of such assets. Our declaration of trust and bylaws do not limit the amount of indebtedness we can incur, and our board of trustees has discretion to deviate from or change our financing strategy at any time.
Subject to maintaining our qualification as a REIT and exclusion from registration under the Investment Company Act, we may hedge the interest rate risk associated with the financing of our portfolio.
Investment Policies
Our board of trustees has adopted the policies set forth below for our investments and borrowings. PCM reviews our compliance with the investment policies regularly and reports periodically to our board of trustees regarding such compliance.
These investment policies may be changed by a majority of our board of trustees without the approval of, or prior notice to, our shareholders.
8
• No investment shall be made that would cause us to fail to qualify as a REIT for U.S. federal income tax purposes;
• No investment shall be made that would cause us to be regulated as an investment company under the Investment Company Act; and
• With the exception of real estate and housing, no single industry shall represent greater than 20% of the investments or aggregate risk exposure in our portfolio.

Investment Allocation Policy
Investment opportunities in pools of mortgage loans that are consistent with our investment objectives, on the one hand and the investment objectives of the PennyMac funds and other future entities or accounts managed by PCM, on the other hand, have been and will be allocated among us and the PennyMac funds and the other entities or accounts generally on a pro rata basis. This is and has been based upon relative amounts of investment capital (including undrawn capital commitments) available for new investments by us, the PennyMac funds and any other relevant entities or accounts, or by assigning opportunities among the relevant entities such that investments assigned among us, such funds, entities or accounts are fair and equitable over time; provided that PCM, in its sole discretion, may allocate investment opportunities in any other manner that it deems to be fair and equitable. As of December 31, 2011, the commitment periods for the PennyMac funds had ended and the ability of the PennyMac funds to make new investments has therefore been significantly reduced.
As the investment programs of the various entities and accounts managed by PCM change and develop over time, additional issues and considerations may affect PCM’s and our allocation policy and PCM’s and our expectations with respect to the allocation of investment opportunities among the various entities and accounts managed by PCM. Notwithstanding PCM’s intention to effect fair and equitable allocations of investment opportunities, we expect that our performance will differ from the performance of the PennyMac funds and any other PennyMac-managed entity or account for many reasons, including differences in the legal or regulatory characteristics, or tax classification, of the entities or accounts or due to differing fee structures or the idiosyncratic differences in the outcome of individual mortgage loans.
We have not adopted a policy that expressly prohibits our trustees, officers, shareholders or affiliates from having a direct or indirect financial interest in any investment to be acquired or disposed of by us or in any transaction to which we are a party or have an interest. We do not have a policy that expressly prohibits any such persons from engaging for their own account in business activities of the types conducted by us. However, our code of business conduct and ethics contains a conflicts of interest policy that prohibits our trustees and officers, as well as employees of PennyMac and its subsidiaries who provide services to us, from engaging in any transaction that involves an actual or apparent conflict of interest with us without the appropriate approval. We also have written policies and procedures for the review and approval of related party transactions, including oversight by designated committees of our board of trustees and PFSI’s board of directors.
Operating and Regulatory Structure
REIT Qualification
We have elected to be treated as a REIT under Sections 856 through 860 of the Internal Revenue Code of 1986 (the “Internal Revenue Code”) beginning with our taxable year ended December 31, 2009. Our qualification as a REIT depends upon our ability to meet on a continuing basis, through actual investment and operating results, various complex requirements under the Internal Revenue Code relating to, among other things, the sources of our gross income, the composition and values of our assets, our distribution levels and the diversity of ownership of our common shares. We believe that we are organized in conformity with the requirements for qualification and taxation as a REIT under the Internal Revenue Code, and that our manner of operation enables us to meet the requirements for qualification and taxation as a REIT.
As a REIT, we generally are not subject to U.S. federal income tax on our REIT taxable income we distribute to our shareholders. If we fail to qualify as a REIT in any taxable year and do not qualify for certain statutory relief provisions, we will be subject to U.S. federal income tax at regular corporate rates and may be precluded from qualifying as a REIT for the subsequent four taxable years following the year during which we lost our REIT qualification. Accordingly, our failure to qualify as a REIT could have a material adverse impact on our results of operations and amounts available for distribution to our shareholders.
Even though we have elected to be taxed as a REIT, we are subject to some U.S. federal, state and local taxes on our income or property. A portion of our business is conducted through, and a portion of our income is earned in, our TRS that is subject to corporate income taxation. In general, a TRS of ours may hold assets and engage in activities that we cannot hold or engage in directly and may engage in any real estate or non-real estate related business. A TRS is subject to U.S. federal, state and local corporate income taxes. To maintain our REIT election, at the end of each quarter no more than 25% (20% for years beginning after December 31, 2017) of the value of a REIT’s assets may consist of stock or securities of one or more TRSs.
If our TRS generates net income, our TRS can declare dividends to us, which will be included in our taxable income and necessitate a distribution to our shareholders. Conversely, if we retain earnings at the TRS level, no distribution is required and we can increase shareholders’ equity of the consolidated entity. As discussed in Section 1A of this Report entitled Risk Factors, the combination of the requirement to maintain no more than 25% (20% for years beginning after December 31, 2017) of our assets in the TRS coupled with the effect of TRS dividends on our income tests creates compliance complexities for us in the maintenance of our qualified REIT status.
9

The dividends paid deduction of a REIT for qualifying dividends to its shareholders is computed using our taxable income as opposed to net income reported on our financial statements. Taxable income generally differs from net income reported on our financial statements because the determination of taxable income is based on tax laws and regulations and not financial accounting principles.
Licensing
We and PLS are required to be licensed to conduct business in certain jurisdictions. PLS is, or is taking steps to become, licensed in those jurisdictions and for those activities where it believes it is cost effective and appropriate to become licensed. Through our wholly owned subsidiaries, we are also licensed, or are taking steps to become licensed, in those jurisdictions and for those activities where we believe it is cost effective and appropriate to become licensed. In jurisdictions in which neither we nor PLS is licensed, we do not conduct activity for which a license is required. Our failure or the failure by PLS to obtain any necessary licenses promptly, comply with applicable licensing laws or satisfy the various requirements or to maintain them over time could materially and adversely impact our business.
Competition
In our correspondent production activities, we compete with large financial institutions and with other independent residential mortgage loan producers and servicers. We compete on the basis of product offerings, technical knowledge, manufacturing quality, speed of execution, rate and fees.
In acquiring mortgage assets, we compete with specialty finance companies, private funds, other mortgage REITs, thrifts, banks, mortgage bankers, insurance companies, mutual funds, institutional investors, investment banking firms, governmental bodies and other entities, which may also be focused on acquiring mortgage related assets, and therefore may increase competition for the available supply of mortgage assets suitable for purchase. Many of our competitors are significantly larger than we are and have stronger financial positions and greater access to capital and other resources than we have and may have other advantages over us. Such advantages include the ability to obtain lower-cost financing, such as deposits, and operational efficiencies arising from their larger size. Some of our competitors may have higher risk tolerances or different risk assessments and may not be subject to the operating restraints associated with REIT tax compliance or maintenance of an exclusion from the Investment Company Act, any of which could allow them to consider a wider variety of investments and funding strategies and to establish more relationships with sellers of mortgage assets than we can.
Because the availability of pools of mortgage assets may fluctuate, the competition for assets and sources of financing may increase. Increased competition for assets may result in our accepting lower returns for acquisitions of residential mortgage loans and other assets or adversely influence our ability to “win” our bids for such assets. An increase in the competition for sources of funding could adversely affect the availability and terms of financing, and thereby adversely affect the market price of our common shares.
In the face of this competition, we have access to PCM’s professionals and their industry expertise, which we believe provides us with a competitive advantage and helps us assess investment risks and determine appropriate pricing for certain potential investments. We expect these relationships to enable us to compete more effectively for attractive investment opportunities. Furthermore, we believe that our access to PFSI’s special servicing expertise helps us to maximize the fair value of our distressed residential mortgage loans and provides us with a competitive advantage over other companies with a similar focus. We believe that current market and regulatory conditions may have adversely affected the financial condition and operations of certain owners of mortgage assets. Further, regulatory and capital issues have contributed to the decision by certain financial institutions to exit or curtail their correspondent production business and to reduce their portfolios of MSRs. Not having a legacy portfolio or the same regulatory or capital issues may enable us to compete more effectively for attractive business or investment opportunities. However, we can provide no assurance that we will be able to achieve our business goals or expectations due to the competitive and other risks that we face.
Staffing
We have no employees, and we do not pay our officers any cash compensation. All of our officers are employees of PennyMac or its affiliates. Under the terms of our management agreement, we pay PCM management fees quarterly in arrears, which include a “base” component and an “incentive” component. In addition, we pay PLS fees for servicing our loans and providing mortgage banking services in support of our correspondent production activities, and we reimburse PCM and its affiliates for certain direct costs incurred on our behalf and for certain overhead expenses.

Available Information
Our annual reports on Form 10-K, quarterly reports on Form 10-Q, current reports on Form 8-K, proxy statements and amendments to those reports filed with or furnished to United States Securities and Exchange Commission (the “SEC”) pursuant to Section 13(a) or 15(d) of the Securities Exchange Act of 1934, as amended, are available free of charge at www.pennymacmortgageinvestmenttrust.com through the investor relations section of our website as soon as reasonably practicable after electronically filing such material with the SEC. The SEC maintains an Internet site that contains reports, proxy and information statements and other information regarding our filings at www.sec.gov. In addition, the public may read and copy the materials we file with the SEC at the SEC’s Public Reference Room at 100 F. Street, NE, Washington, D.C. 20549. Information regarding the operation of the Public Reference Room may be obtained by calling the SEC at 1-800-SEC-0330. The above references to our website and the SEC’s website do not constitute incorporation by reference of the information contained on those websites and should not be considered part of this document.
10

In addition to the other information set forth in this Report, you should carefully consider the following factors, which could materially affect our business, financial condition or results of operations in future periods. The risks described below are not the only risks that we face. Additional risks not currently known to us or that we currently deem to be immaterial also may materially adversely affect our business, financial condition or results of operations in future periods.
Risks Related to Our Management and Relationship with Our Manager and Its Affiliates
We are dependent upon PCM and PLS and their resources and may not find suitable replacements if any of our service agreements with PCM or PLS are terminated.
In accordance with our management agreement, we are externally advised and managed by PCM, which makes all or substantially all of our investment, financing and risk management decisions, and has significant discretion as to the implementation of our operating policies and strategies. Under our loan servicing agreement with PLS, PLS provides primary servicing and special servicing for our portfolios of mortgage loans and MSRs, and under our mortgage banking and warehouse services agreement with PLS, PLS provides fulfillment and disposition-related services in connection with our correspondent production business. The costs of these services increase our operating costs and may adversely affect our net income, but we rely on PCM and PLS to provide these services under these agreements because we have no employees or in-house capability to handle the services independently.
No assurance can be given that the strategies of PCM, PLS or their affiliates under any of these agreements will be successful, that any of them will conduct complete and accurate due diligence or provide sound advice, or that any of them will act in our best interests with respect to the allocation of their resources to our business. The failure of any of them to do any of the above, conduct the business in accordance with applicable laws and regulations or hold all licenses or registrations necessary to conduct the business as currently operated would materially and adversely affect our ability to continue to execute our business plan.
In addition, the terms of these agreements extend until February 1, 2017 (subject to automatic renewals for 18-month terms), but any of the agreements may be terminated earlier under certain circumstances or otherwise non-renewed. If any agreement is terminated or non-renewed and a suitable replacement is not secured in a timely manner, it would materially and adversely affect our ability to continue to execute our business plan.
If our management agreement or loan servicing agreement is terminated or not renewed, we will have to obtain the services from another service provider. We may not be able to replace these services in a timely manner or on favorable terms, or at all. With respect to our mortgage banking and warehouse services agreement, the services provided by PLS are inherently unique and not widely available, if at all. This is particularly true because we are not a Ginnie Mae licensed issuer or servicer, yet we are able to acquire government mortgage loans from our correspondent sellers that we know will ultimately be purchased from us by PLS. While we generally have exclusive rights to these services from PLS during the term of our mortgage banking and warehouse services agreement, in the event of a termination we may not be able to replace these services in a timely manner or on favorable terms, or at all, and we ultimately would be required to compete against PLS for the correspondent business we currently enjoy.
PFSI, the parent company of PCM and PLS, is undergoing significant growth and its development and integration of new operations may not be effective.
PFSI’s growth since it commenced operations has caused significant demands on its operational, accounting and legal infrastructure, and increased expenses. The ability of PCM and PLS to provide us with the services we require to be successful depends, among other things, on the ability of PFSI, including PCM and PLS, to maintain an operating platform and management system sufficient to address its growth. This may require PFSI to incur significant additional expenses and to commit additional senior management and operational resources to support its growth. There can be no assurance that PFSI will be able to effectively develop its expanding operations or that PFSI will continue to grow successfully. PFSI’s failure to do so could adversely affect the ability of PCM and PLS to manage us and service our portfolios of assets, respectively, which could materially and adversely affect our business, liquidity, financial position, and results of operations and our ability to pay dividends.
The management fee structure could cause disincentive and/or create greater investment risk.
Pursuant to our management agreement, PCM is entitled to receive a base management fee that is based on our shareholders’ equity (as defined in our management agreement) at the end of each quarter. As a result, significant base management fees would be payable to PCM for a given quarter even if we experience a net loss during that quarter. PCM’s right to non-performance-based compensation may not provide sufficient incentive to PCM to devote its time and effort to source and maximize risk-adjusted returns on our investment portfolio, which could, in turn, materially and adversely affect the market price of our common shares and/or our ability to make distributions to our shareholders.
11
Item 1A. Risk Factors

Conversely, PCM is also entitled to receive incentive compensation under our management agreement based on our performance in each quarter. In evaluating investments and other management strategies, the opportunity to earn incentive compensation based on our net income may lead PCM to place undue emphasis on higher yielding investments and the maximization of short-term income at the expense of other criteria, such as preservation of capital, maintenance of sufficient liquidity and/or management of market risk, in order to achieve higher incentive compensation. Investments with higher yield potential are generally riskier and more speculative.
The servicing fee structure could create a conflict of interest.
For its services under our loan servicing agreement, PLS is entitled to servicing fees that we believe are competitive with those charged by primary servicers and specialty servicers and include fixed per-loan monthly amounts based on the delinquency, bankruptcy and/or foreclosure status of the serviced loan or the REO, as well as activity fees that generally are calculated as a percentage of unpaid principal balance or proceeds realized. PLS is also entitled to certain customary market-based fees and charges, including boarding and deboarding fees, assumption and modification fees and late charges. In addition, to the extent we participate in Home Affordable Modification Program (“HAMP”) (or other similar mortgage loan modification programs), PLS may be entitled to retain any incentive payments made to it in connection with our participation therein. Because certain of these fees are earned upon reaching a specific milestone, this fee structure may provide PLS with an incentive to foreclose more aggressively or liquidate assets for less than their fair value.
On our behalf, PLS also refinances performing and nonperforming loans and originates new loans to facilitate the disposition of real estate that we acquire through foreclosure. In order to provide PLS with an incentive to produce such loans, we have agreed to pay PLS origination fees and other compensation based on market-based pricing and terms that are consistent with the pricing and terms offered by PLS to unaffiliated third parties on a retail basis. This may provide PLS with an incentive to refinance a greater proportion of our loans than it otherwise would and/or to refinance loans on our behalf instead of arranging the refinancings with a third party lender, either of which might give rise to a potential or perceived conflict of interest.
Termination of our management agreement is difficult and costly.
It is difficult and costly to terminate, without cause, our management agreement. Our management agreement provides that it may be terminated by us without cause under limited circumstances and the payment to PCM of a significant termination fee. The cost to us of terminating our management agreement may adversely affect our desire or ability to terminate our management agreement with PCM without cause. PCM may also terminate our management agreement upon at least 60 days’ prior written notice if we default in the performance of any material term of our management agreement and the default continues for a period of 30 days after written notice to us, or where we terminate our loan servicing agreement, our mortgage banking and warehouse services agreement or certain other agreements with PCM or PLS without cause (at any time other than at the end of the current term or any automatic renewal term), whereupon in any case we would be required to pay to PCM a significant termination fee.
PCM and PLS both have limited liability and indemnity rights.
Our agreements with PCM and PLS provide that PCM and PLS will not assume any responsibility other than to provide the services specified in the applicable agreements. Our management agreement further provides that PCM will not be responsible for any action of our board of trustees in following or declining to follow its advice or recommendations. In addition, each of PCM and PLS and their respective affiliates, including each such entity’s managers, officers, trustees, directors, employees and members, will be held harmless from, and indemnified by us against, certain liabilities on customary terms. As a result, to the extent we are damaged through certain actions or inactions of PCM or PLS, our recourse is limited and we may not be able to recover our losses.
Existing or future entities or accounts managed by PCM may compete with us for, or may participate in, investments, any of which could result in conflicts of interest. BlackRock and HC Partners, PFSI’s strategic investors, could compete with us or transact business with us.
Although our agreements with PCM and PLS provide us with certain exclusivity and other rights and we and PCM have adopted an allocation policy to specifically address some of the conflicts relating to our investment opportunities, there is no assurance that these measures will be adequate to address all of the conflicts that may arise or will address such conflicts in a manner that is favorable to us. Certain of the funds that PCM currently advises have, and certain of the funds that PCM may in the future advise may have, investment objectives that overlap with ours, including funds which have different fee structures, and potential conflicts may arise with respect to decisions regarding how to allocate investment opportunities among those funds and us. We are also limited in our ability to acquire assets that are not qualifying real estate assets and/or real estate related assets, whereas the PennyMac funds and other entities or accounts that PCM manages now or may manage in the future are not, or may not be, as applicable, so limited. In addition, PCM and/or the PennyMac funds and the other entities or accounts managed by PCM now or in the future may participate in some of our investments, which may not be the result of arm’s length negotiations and may involve or later result in potential conflicts between our interests in the investments and those of PCM or such other entities.
12
In addition, PFSI’s strategic investors, BlackRock and HC Partners, each own significant investments in PFSI. Affiliates of each of BlackRock and HC Partners currently manage investment vehicles and separate accounts that may compete directly or indirectly with us. BlackRock and HC Partners are under no obligation to provide us with any financial or operational assistance, or to present opportunities to us for matters in which they may become involved. We may enter into transactions with BlackRock or HC Partners or with market participants with which BlackRock or HC Partners has business relationships, and such transactions and/or relationships could influence the decisions made by PCM with respect to the purchase or sale of assets and the terms of such purchase or sale. Such activities could have an adverse effect on the value of the positions held by us, or may result in BlackRock and/or HC Partners having interests adverse to ours.
We may encounter conflicts of interest in our Manager’s efforts to appropriately allocate its time and services between its own activities, the management of the PennyMac funds and the management of us, and the loss of the services of our Manager’s management team could adversely affect us.
Pursuant to our management agreement, PCM is obligated to provide us with the services of its senior management team, and the members of that team are required to devote such time to us as is necessary and appropriate, commensurate with our level of activity. The members of PCM’s senior management team may have conflicts in allocating their time and services between the operations of PFSI and our activities, the PennyMac funds and other entities or accounts that they manage now or in the future.
The experience of PFSI’s senior managers is valuable to us. PFSI’s management team has significant experience in the mortgage loan production and servicing industry. The loss of the services of PFSI’s senior managers for any reason could adversely affect our business.
Our failure to deal appropriately with conflicts of interest could damage our reputation and adversely affect our business.
As we expand the scope of our businesses, we confront potential conflicts of interest relating to our investment activities that are managed by PCM. The SEC and certain other regulators have increased their scrutiny of potential conflicts of interest, and as we expand the scope of our business, we must continue to monitor and address any conflicts between our interests and those of PFSI. We have implemented procedures and controls to be followed when real or potential conflicts of interest arise, but it is possible that potential or perceived conflicts could give rise to the dissatisfaction of, or litigation by, our investors or regulatory enforcement actions. Appropriately dealing with conflicts of interest is complex and difficult, and our reputation could be damaged if we fail, or appear to fail, to deal appropriately with one or more potential or actual conflicts of interest. Regulatory scrutiny, litigation or reputational risk incurred in connection with conflicts of interest would adversely affect our business in a number of ways and may adversely affect our results of operations.
Negative publicity and media attention involving Countrywide Financial Corporation and certain of its former officers and other negative publicity could have an adverse impact on PFSI and us.
Certain of our and PFSI’s officers are former employees of Countrywide Financial Corporation, or Countrywide, which has been the subject of various investigations and lawsuits and ongoing negative publicity. In addition, negative publicity associated with other legal claims against us, whether or not such complaints are valid, could harm our reputation. We cannot provide you any assurance regarding whether any existing or future investigations, litigation or complaints will generate negative publicity or media attention for us or adversely impact us or PFSI’s or its affiliates’ ability to conduct their businesses.
Risks Related to Our Business
We operate in a highly regulated industry and the continually changing federal, state and local laws and regulations could materially adversely affect our business, financial condition and results of operations.
Due to the highly regulated nature of the mortgage industry, we are required to comply with a wide array of federal, state and local laws and regulations that regulate, among other things, the manner in which we conduct our loan production and servicing businesses and the fees that we may charge. These regulations directly impact our business and require constant compliance, monitoring and internal and external audits. Federal, state and local governments have proposed or enacted numerous new laws, regulations and rules related to mortgage loans. Laws, regulations, rules and judicial and administrative decisions relating to mortgage loans include those pertaining to real estate settlement procedures, equal credit opportunity, fair lending, fair credit reporting, truth in lending, fair debt collection practices,service members protections, compliance with net worth and financial statement delivery requirements, compliance with federal and state disclosure and licensing requirements, the establishment of maximum interest rates, finance charges and other charges, qualified mortgages, licensing of loan officers, loan officer compensation, secured transactions, property valuations, servicing transfers, payment processing, escrow, communications with consumers, loss mitigation, collection, foreclosure, bankruptcies, repossession and claims-handling procedures, and other trade practices and privacy regulations providing for the use and safeguarding of non-public personal financial information of borrowers. PLS and service providers it uses, including outside counsel retained to process foreclosures and bank ruptcies, must also comply with these legal requirements.
13

In particular, the Dodd-Frank Wall Street Reform and Consumer Protection Act of 2010, or Dodd Frank Act, represents a comprehensive overhaul of the financial services industry in the United States and includes, among other things (i) the creation of a Financial Stability Oversight Council to identify emerging systemic risks posed by financial firms, activities and practices, and to improve cooperation among federal agencies, (ii) the creation of the CFPB authorized to promulgate and enforce consumer protection regulations relating to financial products and services, including residential mortgage lending and servicing, (iii) enhanced regulation of financial markets, including the derivatives and securitization markets, and (iv) amendments to the Truth in Lending Act, or TILA, and the Real Estate Settlement Procedures Act, or RESPA, aimed at improving consumer protections with respect to residential mortgage originations, including disclosures, originator compensation, minimum repayment standards, prepayment considerations, appraisals and servicing requirements.
Our failure or the failure of PLS to comply with these laws, regulations and rules may result in increased costs of doing business, reduced payments by borrowers, modification of the original terms of mortgage loans, permanent forgiveness of debt, delays in the foreclosure process, increased servicing advances, litigation, reputational damage, enforcement actions, and repurchase and indemnification obligations.
The failure of the mortgage lenders from whom loans were acquired through our correspondent production activities to otherwise comply with these laws, regulations and rules may also result in these adverse consequences. PLS has in place a due diligence program designed to assess areas of risk with respect to these acquired loans, including, without limitation, compliance with underwriting guidelines and applicable law. However, PLS may not detect every violation of law by these mortgage lenders. While we have contractual rights to seek indemnity or repurchase from these correspondent lenders, if any of these lenders is unable to fulfill its indemnity or repurchase obligations to us to a material extent, our business, financial condition and results of operations could be materially and adversely affected.
In addition, there continue to be changes in legislation, rulemaking and licensing in an effort to simplify the consumer mortgage experience, which requires technology changes and additional implementation costs for loan originators and servicers. We expect that legislative and regulatory changes will continue in the foreseeable future, which may increase our operating expenses
Any changes in laws or regulations applicable to our business could adversely affect our business, financial condition, results of operations and our ability to make distributions to our shareholders.
We may be subject to liability for potential violations of various lending laws, which could adversely impact our results of operations, financial condition and business.
Mortgage loan originators and servicers operate in a highly regulated industry and are required to comply with various federal, state and local laws and regulations, including anti-predatory lending laws and laws and regulations imposing certain restrictions and requirements on “high cost” loans. To the extent these originators or servicers fail to comply with applicable law and any of their loans become part of our assets, it could subject us, as an assignee or purchaser of the related mortgage loans, to monetary penalties or other losses and could result in the borrowers rescinding the affected mortgage loans. Further, if any of our loans are found to have been originated, acquired or serviced by us or a third party in violation of applicable law, we could be subject to lawsuits or governmental actions, or we could be fined or incur losses, any of which could adversely impact our business, financial condition, liquidity, results of operations and our ability to make distributions to our shareholders.
The risk management efforts of our Manager may not be effective.
We could incur substantial losses and our business operations could be disrupted if our Manager is unable to effectively identify, manage, monitor, and mitigate financial risks, such as credit risk, interest rate risk, prepayment risk, liquidity risk, and other market-related risks, as well as operational risks related to our business, assets, and liabilities. Our Manager’s risk management policies, procedures, and techniques may not be sufficient to identify all of the risks to which we are exposed, mitigate the risks we have identified, or identify additional risks to which we may become subject in the future. Expansion of our business activities may also result in our being exposed to risks to which we have not previously been exposed or may increase our exposure to certain types of risks, and our Manager may not effectively identify, manage, monitor, and mitigate these risks as our business activity changes or increases.
Initiating new business activities or significantly expanding existing business activities may expose us to new risks and will increase our cost of doing business.
Initiating new business activities or significantly expanding existing business activities are two ways to grow our business and respond to changing circumstances in our industry; however, they may expose us to new risks and regulatory compliance requirements. We cannot be certain that we will be able to manage these risks and compliance requirements effectively. Furthermore, our efforts may not succeed and any revenues we earn from any new or expanded business initiative may not be sufficient to offset the
14

initial and ongoing costs of that initiative, which would result in a loss with respect to that initiative. For example, we are expanding our business activities to include the acquisition of small balance commercial real estate loans, which may expose us to new risks, may not succeed, and may not generate sufficient revenue to offset our related costs.
We may not be able to successfully operate our business or generate sufficient operating cash flows to make or sustain distributions to our shareholders.
There can be no assurance that we will be able to generate sufficient cash to pay our operating expenses and make distributions to our shareholders. The results of our operations and our ability to make or sustain distributions to our shareholders depends on many factors, including the availability of attractive risk-adjusted investment opportunities that satisfy our investment strategies and our success in identifying and consummating them on favorable terms, the level and expected movement of home prices, the level and volatility of interest rates, readily accessible short-term and long-term financing on favorable terms, and conditions in the financial markets, real estate market and the economy, as to which no assurance can be given.
We also face substantial competition in acquiring attractive investments, both in our investment activities and correspondent production activities. While we try to diversify our investments among various types of mortgages and mortgage-related assets, the competition for such assets may compress margins and reduce yields, making it difficult for us to make investments with attractive risk-adjusted returns. There can be no assurance that we will be able to successfully transition out of investments producing lower returns into investments that produce better returns, or that we will not seek investments with greater risk to obtain the same level of returns. Any or all of these factors could cause the value of our investments to decline substantially and have a material adverse effect on our business, financial position, results of operations and cash flows.
Difficult conditions in the mortgage, real estate and financial markets and the economy generally may adversely affect the performance and market value of our investments.
The success of our business strategies and our results of operations are materially affected by current conditions in the mortgage markets, the financial markets and the economy generally. Concerns over factors including inflation, deflation, unemployment, personal and business income taxes, healthcare, energy costs, geopolitical issues, the availability and cost of credit, the mortgage markets and the real estate markets have contributed to increased volatility and unclear expectations for the economy and markets going forward. The mortgage markets have been and continue to be affected by changes in the lending landscape, defaults, credit losses and significant liquidity concerns. A continuation or increase in the volatility and deterioration in the mortgage markets may adversely affect the performance and fair value of our investments, and a deterioration in home prices or the value of our investments could require us to take charges that may be material.
The actions of the U.S. government, the Federal Reserve Bank and the U.S. Treasury may materially and adversely affect our business.
The U.S. government, the Federal Reserve Bank, the U.S. Treasury and other governmental and regulatory bodies have taken and continue to take or modify various actions to address the recent financial crisis. There can be no assurances that such actions will have a beneficial impact on the financial markets. In addition to the foregoing, the U.S. Congress and/or various states and local legislatures may enact additional legislation or regulatory action designed to address the current economic climate or for other purposes that could have a material adverse effect on our ability to continue to execute our business strategies.
To the extent the financial markets do not respond favorably to these initiatives or they do not function as intended, they may not have a positive impact on our business. We can provide no assurance that we will be eligible to use any government programs or, if eligible, that we will be able to utilize them successfully. Further, the incentives provided by such programs may increase competition for, and the pricing of, our targeted assets.
Mortgage loan modification and refinance programs, future legislative action, and other actions and changes may materially and adversely affect the value of, and the returns on, the assets in which we intend to invest.
From time to time, the U.S. government, through the FHA, the Federal Deposit Insurance Corporation and the U.S. Treasury, will establish loan modification and refinance programs designed to provide homeowners with assistance in avoiding residential mortgage loan foreclosures. These programs, future U.S. federal, state and/or local legislative or regulatory actions that result in the modification of outstanding mortgage loans, as well as changes in the requirements necessary to qualify for modifications or refinancing mortgage loans with Fannie Mae, Freddie Mac or Ginnie Mae may adversely affect the value of, and the returns on, residential mortgage loans, residential mortgage-backed securities (“RMBS”), real estate-related securities and various other asset classes in which we invest. In addition to the foregoing, the U.S. Congress and/or various states and local legislators may enact additional legislation or regulatory action designed to address the current economic climate or for other purposes that could have a material adverse effect on our ability to continue to execute our business strategies.
15

We are highly dependent on the Agencies and the Federal Housing Finance Agency (“FHFA”), as the conservator of Fannie Mae and Freddie Mac, and any changes in these entities or their current roles could materially and adversely affect our business, liquidity, financial position and results of operations.
Our ability to generate revenues through mortgage loan sales depends to a significant degree on programs administered by the Agencies and others that facilitate the issuance of MBS in the secondary market. These Agencies play a critical role in the mortgage industry and we have significant business relationships with them. Presently, almost all of the newly originated conforming loans that we acquire from mortgage lenders through our correspondent production activities qualify under existing standards for inclusion in mortgage securities backed by the Agencies. We also derive other material financial benefits from these relationships, including the assumption of credit risk by these Agencies on loans included in such mortgage securities in exchange for our payment of guarantee fees, our retention of such credit risk through structured transactions that lower our guarantee fees, and the ability to avoid certain loan inventory finance costs through streamlined loan funding and sale procedures.
Our ability to generate revenues from newly originated loans that we acquire through our correspondent production activities is highly dependent on the fact that the Agencies have not historically acquired such loans directly from mortgage lenders, but have instead relied on banks and non-bank aggregators such as us to acquire, aggregate and securitize or otherwise sell such loans to investors in the secondary market. Certain of the Agencies have begun approving new and smaller lenders that traditionally may not have qualified for such approvals. To the extent that these lenders choose to sell directly to the Agencies rather than through loan aggregators like us, this reduces the number of loans available for purchase, and it could materially and adversely affect our business and results of operations. Similarly, to the extent the Agencies increase the number of purchases and sales for their own accounts, our business and results of operations could be materially and adversely affected.
The conservatorship of Fannie Mae and Freddie Mac and related efforts, along with any changes in laws and regulations affecting the relationship between Fannie Mae and Freddie Mac and the U.S. federal government, could adversely affect our business and prospects. Their roles could be significantly reduced or eliminated and the nature of the guarantees could be considerably limited relative to those issued in the past. Elimination of the traditional roles of Fannie Mae and Freddie Mac, or any changes to the nature or extent of the guarantees provided by Fannie Mae and Freddie Mac or the fees, terms and guidelines that govern our selling and servicing relationships with them, such as continued increases in the guarantee fees we are required to pay, initiatives that increase the number of repurchase demands and/or the manner in which they are pursued, or possible limits on delivery volumes imposed upon us and other sellers/servicers, could also materially and adversely affect our business, including our ability to sell and securitize loans in our correspondent production activities, and the performance, liquidity and market value of our investments.
Although the U.S. Treasury has committed capital to Fannie Mae and Freddie Mac, these actions may not be adequate for their needs. If Fannie Mae and Freddie Mac are adversely affected by events such as ratings downgrades, their inability to obtain any necessary government funding, their lack of success in resolving repurchase demands to their lenders, foreclosure problems and delays and problems with mortgage insurers, Fannie Mae and Freddie Mac could suffer losses and could fail to honor their guarantees and other obligations. Any discontinuation of, or significant reduction in, the operation of Fannie Mae or Freddie Mac or any significant adverse change in their financial condition, the level of their activity in the primary or secondary mortgage markets or in their underwriting criteria could materially and adversely affect our business, liquidity, financial position, results of operations and our ability to make distributions to our shareholders.
Our or our Servicer’s inability to meet certain net worth and liquidity requirements imposed by the Agencies could have a material adverse effect on our business, financial condition and results of operation.
Effective December 31, 2015, each of the Agencies has implemented new minimum financial eligibility requirements for Agency mortgage sellers/servicers and MBS issuers, as applicable. These eligibility requirements align the minimum financial requirements for mortgage sellers/servicers and MBS issuers to do business with the Agencies. These minimum financial requirements include net worth, capital ratio and/or liquidity criteria in order to set a minimum level of capital needed to adequately absorb potential losses and a minimum amount of liquidity needed to service Agency mortgage loans and MBS and cover the associated financial obligations and risks.
In order to meet these minimum financial requirements, we and our Servicer are required to maintain cash and cash equivalents in amounts that may adversely affect our or its business, financial condition and results of operations, and this may impede our or our Servicer’s ability to grow our respective businesses and MSR portfolios. To the extent that such requirements are not met, the Agencies may suspend or terminate Agency approval or certain agreements with us or our Servicer, which could cause us or our Servicer to cross default under other financing arrangements and/or have a material adverse effect on our business, financial position, results of operations and cash flows.
16

The CFPB continues to be more active in its monitoring of the residential mortgage origination and servicing sectors. New rules and regulations, such as the TILA-RESPA Integrated Disclosure rules, and/or more stringent enforcement of existing rules and regulations by the CFPB could result in enforcement actions, fines, penalties and the inherent reputational risk that results from such actions.
The CFPB is charged, in part, with enforcing laws involving consumer financial products and services and is empowered with examination, enforcement and rulemaking authority. The CFPB has taken a very active role. For example, the CFPB sends examiners to banks and non-banks that service and/or originate mortgages to assess whether consumers’ interests are protected, and they have brought numerous enforcement actions against lenders and servicers and collected millions of dollars in penalties and compensation for consumers.
Final regulations regarding such “ability to repay” and other standards and practices were adopted by the CFPB and became effective in January 2014. Before originating a mortgage loan, a lender must determine, on the basis of certain information and according to specified criteria, that the prospective borrower has the ability to repay the loan. Lenders that issue loans meeting certain heightened underwriting requirements will be presumed to comply with the new rule with respect to these loans. In addition, our ability to enter into asset-backed securities transactions in the future may be impacted by the Dodd-Frank Act and other proposed reforms related thereto, the effect of which is currently uncertain as it relates to the asset-backed securities market.
The CFPB’s TILA-RESPA Integrated Disclosure (“TRID”) rule, which is intended to improve the way consumers receive information about home loans both when they apply and when they are getting ready to close, became effective on October 3, 2015. TRID represents a comprehensive overhaul of not only the existing home loan disclosure rules, but the entire home loan origination process, and has required industry wide changes to the way in which home loan brokers, lenders, settlement agents and service providers must work with each other. The rule has required, and will continue to require, substantial expense and effort in order to comply. We relied on several third party vendors, in addition to our internal resources, to implement all of the home loan disclosure changes required by TRID prior to the October 3, 2015 deadline. There can be no assurances that we or PLS have properly implemented the requirements of the TRID rule.
In addition, the CFPB issued final rules that took effect on January 10, 2014 amending Regulation X, which implements RESPA, and Regulation Z, which implements TILA. These final rules implement provisions of the Dodd-Frank Act regarding mortgage loan servicing including periodic billing statements, certain notices and acknowledgements, prompt crediting of borrowers’ accounts for payments received, additional notice, review and timing requirements with respect to delinquent borrowers, prompt investigation of complaints by borrowers, and additional steps to be taken before purchasing insurance to protect the lender’s interest in the property. On December 15, 2014, the CFPB proposed amendments to the servicing rules involving lender-placed insurance notices, delinquency and early intervention, loss mitigation, periodic statement requirements, and successors-in-interest to borrowers. Comments to the proposed rules were due by March 16, 2015, and revised rules are anticipated some time in 2016.
On August 19, 2014, the CFPB issued guidance to mortgage servicers to address potential risks to customers that may arise in connection with transfers of servicing. According to the CFPB, if a servicer is determined to have engaged in any acts or practices that are unfair, deceptive, or abusive, or that otherwise violate federal consumer financial laws and regulations, the CFPB will take appropriate supervisory and enforcement actions to address violations and seek all appropriate corrective measures, including remediation of harm to consumers. In light of the significant amount of servicing transfers that we have undertaken and seek to undertake, we may receive additional scrutiny from the CFPB.
The CFPB is expected to issue new or amended rules addressing collection of consumer debts under the federal Fair Debt Collection Practices Act (“FDCPA”) in the latter half of 2016. As part of their review of these rules, they issued a bulletin on December 16, 2015 describing the risks associated with in-person collection of consumer debts under the FDCPA, including remediation of harm to consumers and civil money penalties. Again, we may be subject to additional scrutiny from the CFPB with respect to our debt collection activities.
The TRID rule, servicing rules and other regulations promulgated under the Dodd-Frank Act or by the CFPB and actions by the CFPB could materially and adversely affect the manner in which we conduct our business, result in heightened federal and state regulation and oversight of our business activities, and in increased costs and potential litigation associated with our business activities. Our or PLS’ failure to comply with the laws, rules or regulations to which we are subject, whether actual or alleged, would expose us or PLS to fines, penalties or potential litigation liabilities, including costs, settlements and judgments, any of which could have a material adverse effect on our or PLS’ business, financial position, results of operations or cash flows and our ability to make distributions to our shareholders.
We finance our investments with borrowings, which may materially and adversely affect our return on our investments and may reduce cash available for distribution to our shareholders.
We currently leverage and, to the extent available, we intend to continue to leverage our investments through borrowings, the level of which may vary based on the particular characteristics of our investment portfolio and on market conditions. We have leveraged certain of our investments through repurchase agreements. When we enter into repurchase agreements, we sell securities or
17
mortgage loans to lenders (i.e., repurchase agreement counterparties) and receive cash from the lenders. The lenders are obligated to resell the same assets back to us at the end of the term of the transaction. Because the cash we receive from the lender when we initially sell the assets to the lender is less than the fair value of those assets (this difference is referred to as the haircut), if the lender defaults on its obligation to resell the same assets back to us we could incur a loss on the transaction equal to the amount of the haircut (assuming there was no change in the fair value of the assets). In addition, repurchase agreements generally allow the counterparties, to varying degrees, to determine a new fair value of the collateral to reflect current market conditions. If a counterparty lender determines that the fair value of the collateral has decreased, it may initiate a margin call and require us to either post additional collateral to cover such decrease or repay a portion of the outstanding borrowing. Should this occur, in order to obtain cash to satisfy a margin call, we may be required to liquidate assets at a disadvantageous time, which could cause us to incur further losses. In the event we are unable to satisfy a margin call, our counterparty may sell the collateral, which may result in significant losses to us.
Although our governing documents contain no limitation on the amount of debt we may incur, the lenders under our repurchase agreements require us and/or our subsidiaries to comply with various financial covenants, including those relating to tangible net worth, profitability and our ratio of total liabilities to tangible net worth. Our lenders also require us to maintain minimum amounts of cash or cash equivalents sufficient to maintain a specified liquidity position. If we are unable to maintain these liquidity levels, we could be forced to sell additional investments at a loss and our financial condition could deteriorate rapidly.
As the servicer of the assets subject to our repurchase agreements, PLS is also subject to various financial covenants, including those relating to tangible net worth, liquidity, profitability and its ratio of total liabilities to tangible net worth. PLS’ failure to comply with any of these covenants would generally result in a servicer termination event or event of default under one or more of our repurchase agreements. Thus, in addition to relying upon PCM to manage our financial covenants, we rely upon PLS to manage its own financial covenants in order to ensure our compliance with our repurchase agreements and our continued access to liquidity and capital. A servicer termination event or event of default resulting from PLS’ breach of its financial or other covenants could materially and adversely impact our business, financial condition, liquidity, results of operations and our ability to make distributions to shareholders.
Our repurchase agreements to finance nonperforming loans and other distressed mortgage assets are complex and difficult to manage. This is due in part to the nature of the underlying assets securing such financings, which do not produce consistent cash flows and which require specific activities to be performed at specific points in time in order to preserve value. Our inability to comply with the terms and conditions of these facilities could materially and adversely impact us.
In addition, the repurchase agreements contain events of default (subject to certain materiality thresholds and grace periods), including payment defaults, breaches of financial and other covenants and/or certain representations and warranties, cross-defaults, servicer termination events, guarantor defaults, bankruptcy or insolvency proceedings and other events of default customary for these types of facilities. The remedies for such events of default are also customary for these types of facilities and include the acceleration of the principal amount outstanding and the liquidation by the lender of the assets then subject to the respective facilities. If we default on one of our obligations under a repurchase agreement or breach our representations, warrants or covenants and are unable to cure, the lender may be able to terminate the transaction or its commitments, accelerate any amounts outstanding, require us to post additional collateral or repurchase the loans, and/or cease entering into any other repurchase transactions with us. Because our repurchase agreements typically contain cross-default provisions, a default that occurs under any one agreement could allow the lenders under our other agreements to also declare a default. Our other secured borrowings are subject to similar risks as those that apply to our repurchase agreements. Any significant losses we incur on our repurchase agreements and other secured borrowings could materially and adversely affect our earnings, financial condition and our cash available for distribution to our shareholders.
We may in the future utilize other sources of borrowings, including term loans, bank credit facilities and structured financing arrangements, among others. The amount of leverage we employ varies depending on the asset class being financed, our available capital, our ability to obtain and access financing arrangements with lenders and the lenders’ and rating agencies’ estimate of, among other things, the stability of our investment portfolio’s cash flow.
Our return on our investments and cash available for distribution to our shareholders may be reduced to the extent that changes in market conditions increase the cost of our financing relative to the income that can be derived from the investments acquired. Our debt service payments also reduce cash flow available for distribution to shareholders. In the event we are unable to meet our debt service obligations, we risk the loss of some or all of our assets to foreclosure or sale to satisfy the obligations.
Until non-recourse long-term financing structures become available to us and we attempt to utilize them or do utilize them, we rely heavily on short-term repurchase and loan and security agreements with maturities that do not match the assets being financed and are thus exposed to risks which could result in losses to us.
We have used and, in the future, may use securitization and other non-recourse long-term financing for our investments. In such structures, our lenders typically have only a claim against the assets included in the securitizations rather than a general claim against us as an entity. Such long-term financing has been limited and, in certain instances, unavailable for certain of our investments. Prior to
18

any such future financing, we would seek to finance our investments with relatively short-term facilities until a sufficient portfolio is accumulated or such financing becomes available. As a result, we would be subject to the risks that we would not be able to obtain suitable non-recourse long-term financing or otherwise acquire, during the period that any short-term facilities are available, sufficient eligible assets or securities to maximize the efficiency of a securitization.
We also bear the risk that we would not be able to obtain new short-term facilities or would not be able to renew any short-term facilities after they expire should we need more time to obtain long-term financing or seek and acquire sufficient eligible assets or securities for a future securitization. If we are unable to obtain and renew short-term facilities or to consummate securitizations to finance our investments on a long-term basis, we may be required to seek other forms of potentially less attractive financing or to liquidate assets at an inopportune time or unfavorable price. In addition, conditions in the capital markets may make the issuance of any securitization less attractive to us even when we do have sufficient eligible assets or securities. While we would intend to retain the unrated equity component of securitizations and, therefore, still have exposure to any investments included in such securitizations, our inability to enter into such securitizations may increase our overall exposure to risks associated with direct ownership of such investments, including the risk of default.
We may not be able to raise the debt or equity capital required to finance our assets and grow our businesses.
The growth of our businesses requires continued access to debt and equity capital that may or may not be available on favorable terms or at the desired times, or at all. In addition, we invest in certain assets, including distressed loans and REO, as well as MSRs and ESS, for which financing has historically been difficult to obtain. Our inability to continue to maintain debt financing for distressed loans and REO, or MSRs and ESS, could require us to seek equity capital that may be more costly or unavailable to us.
In addition, our ability to finance ESS relating to Ginnie Mae MSRs is currently dependent on pass through financing we obtain through our Servicer, which retains the MSRs associated with the ESS we acquire. After our initial acquisition of ESS, we then finance the acquired ESS with our Servicer under an underlying loan and security agreement, and our Servicer, in turn, re-pledges the ESS (along with the related MSRs it retains) to a third party lender under a master repurchase agreement. There can be no assurance that our Servicer will continue to make this pass through financing available to us or that the third party lender will continue to either permit our Servicer to provide such pass through financing to us or otherwise provide financing to our Servicer for MSRs and ESS.
This financing arrangement also subjects us to the credit risk of PLS. To the extent PLS does not apply our payments of principal and interest under the loan and security agreement to the allocable portion of its borrowings under the master repurchase agreement, or to the extent PLS otherwise defaults under the master repurchase agreement, our ESS would be at a risk of total loss. In addition, we provide a guarantee to the third party lender for the amount of borrowings under the master repurchase agreement that are allocable to the pass through financing of our ESS. In the event we are unable to satisfy our obligations under the guaranty following a default by PLS, this could cause us to default under other financing arrangements and/or have a material adverse effect on our business, financial position, results of operations and cash flows.
We cannot assure you that we will have access to any debt or equity capital on favorable terms or at the desired times, or at all. Our inability to raise such capital or obtain financing on favorable terms could materially adversely impact our business, financial condition, liquidity, results of operations and our ability to make distributions to shareholders.
In addition, we have been authorized to repurchase up to $200 million of our common shares pursuant to a share repurchase program approved by our board of trustees. Increased activity in our share repurchase program will have the effect of reducing our common shares outstanding, market value and shareholders’ equity, any or all of which could adversely affect the assessment by our lenders, credit providers or other counterparties regarding our net worth and, therefore, negatively impact our ability to raise new capital.
Future issuances of debt securities, which would rank senior to our common shares, and future issuances of equity securities, which would dilute the holdings of our existing shareholders and may be senior to our common shares, may materially and adversely affect the market price of our common shares.
In order to grow our business, we may rely on additional equity issuances, which may rank senior and/or be dilutive to our shareholders, or on less efficient forms of debt financing that rank senior to our shareholders and require a larger portion of our cash flow from operations, thereby reducing funds available for our operations, future business opportunities, cash distributions to our shareholders and other purposes. In 2013, our wholly-owned subsidiary, PMC, issued $250 million of Exchangeable Notes that are exchangeable under certain circumstances for our common shares.
Upon liquidation, holders of our debt securities and other loans and preferred shares would receive a distribution of our available assets before holders of our common shares and holders of the Exchangeable Notes could receive a distribution of PMC’s available assets before holders of our common shares. Subject to applicable law, our board of trustees has the authority, without further shareholder approval, to issue additional debt, common shares and preferred shares on the terms and for the consideration it deems appropriate. We have issued, and/or intend to issue, additional common shares and securities convertible into, or exchangeable or exercisable for, common shares under our equity incentive plan. We have also filed a shelf registration statement, from which we have issued and may in the future issue additional common shares, including, without limitation, through our “at-the-market” equity program.
19

We also may issue from time to time additional common shares in connection with property, portfolio or business acquisitions and may grant demand or piggyback registration rights in connection with such issuances. Because our decision to issue securities in any future offering will depend on market conditions and other factors beyond our control, we cannot predict the effect, if any, of future issuances of our common shares, preferred shares or other equity-based securities or the prospect of such issuances on the market price of our common shares. Issuances of a substantial amount of such securities, or the perception that such issuances might occur, could depress the market price of our common shares. Our preferred shares, if issued, would likely have a preference on distribution payments, including liquidating distributions, which could limit our ability to make distributions, including liquidating distributions, to holders of our common shares.
Thus, holders of our common shares bear the risk that our future issuances of debt or equity securities or other borrowings will reduce the market price of our common shares and dilute their ownership in us.
Interest rate fluctuations could significantly decrease our results of operations and cash flows and the market value of our investments.
Interest rates are highly sensitive to many factors, including governmental monetary and tax policies, domestic and international economic and political considerations and other factors beyond our control. Interest rate fluctuations present a variety of risks to our operations. Our primary interest rate exposures relate to the yield on our investments, their market value and the financing cost of our debt, as well as any interest rate swaps or other derivatives that we utilize for hedging purposes. Changes in interest rates affect our net interest income, which is the difference between the interest income we earn on our interest earning investments and the interest expense we incur in financing these investments. Interest rate fluctuations resulting in our interest expense exceeding interest income may result in operating losses for us. An increase in prevailing interest rates could adversely affect the volume of newly originated mortgages available for purchase in our correspondent production activities. Changes in the level of interest rates also may affect our ability to make investments, the value of our investments (including our pipeline of mortgage loan commitments) and any related hedging instruments, the value of newly originated loans acquired through our correspondent production segment, and our ability to realize gains from the disposition of assets. Changes in interest rates may also affect borrower default rates and may impact our ability to refinance or modify loans and/or to sell REO. In addition, with respect to the MSRs and ESS we own, decreasing interest rates may cause a large number of borrowers to refinance, which may result in the loss of any such mortgage servicing business and associated write-downs of such MSRs and ESS. Any such scenario could materially and adversely affect us.
Hedging against interest rate exposure may materially and adversely affect our results of operations and cash flows.
We pursue hedging strategies to reduce our exposure to changes in interest rates. Our hedging activity varies in scope based on the level of interest rates, the type of investments held, and changing market conditions. However, while we enter into such transactions seeking to reduce interest rate risk, unanticipated changes in interest rates may result in poorer overall investment performance than if we had not engaged in any such hedging transactions. Interest rate hedging may fail to protect or could adversely affect us because, among other things, it may not fully eliminate interest rate risk, it could expose us to counterparty and default risk that may result in greater losses or the loss of unrealized profits, and it will create additional expense, while any income it generates to offset losses may be limited by federal tax provisions applicable to REITs. Thus hedging activity, while intended to limit losses, may materially and adversely affect our results of operations and cash flows.
We utilize derivative instruments, which could subject us to risk of loss.
We utilize derivative instruments for hedging purposes, which may include swaps, options and futures. However, the prices of derivative instruments, including futures and options, are highly volatile, as are payments made pursuant to swap agreements. As a result, the cost of utilizing derivatives may reduce our income that would otherwise be available for distribution to shareholders or for other purposes, and the derivative instruments that we utilize may fail to effectively hedge our positions. We are also subject to credit risk with regard to the counterparties involved in the derivative transactions.
The use of derivative instruments is also subject to an increasing number of laws and regulations, including the Dodd-Frank Act and its implementing regulations. These laws and regulations are extremely complex, compliance with them is costly and time consuming, and our failure to comply with any of these laws and regulations could subject us to lawsuits or government actions and damage our reputation, which could materially and adversely affect our business, financial condition, results of operations and our ability to make distributions to our shareholders.
Competition for mortgage assets may limit the availability of desirable investments and result in reduced risk-adjusted returns.
Our profitability depends, in part, on our ability to continue to acquire our targeted investments at favorable prices. As described in greater detail elsewhere in this Report, we compete in our investment activities with other mortgage REITs, specialty finance companies, private funds, thrifts, banks, mortgage bankers, insurance companies, mutual funds, institutional investors, investment
20

banking firms, depository institutions, governmental bodies and other entities, many of which focus on acquiring mortgage assets. Many of our competitors also have competitive advantages over us, including size, financial strength, access to capital, cost of funds, federal pre-emption and higher risk tolerance. Competition may result in fewer investments, higher prices, acceptance of greater risk, lower yields and a narrower spread of yields over our financing costs.
We may change our investment strategies and policies without shareholder consent, and this may materially and adversely affect the market value of our common shares and our ability to make distributions to our shareholders.
PCM is authorized by our board of trustees to follow very broad investment policies and, therefore, it has great latitude in determining the types of assets that are proper investments for us, as well as the individual investment decisions. In the future, PCM may make investments with lower rates of return than those anticipated under current market conditions and/or may make investments with greater risks to achieve those anticipated returns. Our board of trustees will periodically review our investment policies and our investment portfolio but will not review or approve each proposed investment by PCM unless it falls outside our investment policies or constitutes a related party transaction.
In addition, in conducting periodic reviews, our board of trustees will rely primarily on information provided to it by PCM. Furthermore, PCM may use complex strategies, and transactions entered into by PCM may be costly, difficult or impossible to unwind by the time they are reviewed by our board of trustees. We also may change our investment strategies and policies and targeted asset classes at any time without the consent of our shareholders, and this could result in our making investments that are different in type from, and possibly riskier than our current investments or the investments currently contemplated. Changes in our investment strategies and policies and targeted asset classes may expose us to new risks or increase our exposure to interest rate risk, counterparty risk, default risk and real estate market fluctuations, and this could materially and adversely affect the market value of our common shares and our ability to make distributions to our shareholders.
We are not an approved Ginnie Mae issuer and servicer, and an increase in the percentage or amount of government loans we acquire could be detrimental to us.
We are not approved as a Ginnie Mae issuer and servicer. As a result, we are unable to produce or acquire Ginnie Mae MSRs and we earn significantly less income in connection with our acquisition of government loans as opposed to conventional loans. Further, market demand for government loans over conventional loans may increase or PLS may offer pricing to our approved correspondent sellers for government loans that is more competitive in the market than pricing for conventional loans, the result of which may be our acquisition of a greater proportion or amount of government loans. Any significant increase in the percentage or amount of government loans we acquire could adversely impact our business, financial condition, liquidity and results of operations, and our ability to make distributions to shareholders.
Our correspondent production activities could subject us to increased risk of loss.
In our correspondent production activities, we acquire newly originated loans, including jumbo loans, from mortgage lenders and sell or securitize those loans to or through the Agencies or other third party investors. We also sell the resulting securities into the MBS markets. However, there can be no assurance that PLS will continue to be successful in operating this business on our behalf or that we will continue to be able to capitalize on these opportunities on favorable terms or at all. In particular, we have committed, and expect to continue to commit, capital and other resources to this operation; however, PLS may not be able to continue to source sufficient asset acquisition opportunities to justify the expenditure of such capital and other resources. In the event that PLS is unable to continue to source sufficient opportunities for this operation, there can be no assurance that we would be able to acquire such assets on favorable terms or at all, or that such assets, if acquired, would be profitable to us. In addition, we may be unable to finance the acquisition of these assets and/or may be unable to sell the resulting MBS in the secondary mortgage market on favorable terms or at all. We are also subject to the risk that the value of the acquired loans may decrease prior to their disposition. The occurrence of any one or more of these risks could adversely impact our business, financial condition, liquidity and results of operations and our ability to make distributions to our shareholders.
We and/or PLS are required to have various Agency approvals and state licenses in order to conduct our business and there is no assurance we and/or PLS will be able to obtain or maintain those Agency approvals or state licenses.
Because we and PLS are not federally chartered depository institutions, neither we nor PLS benefits from exemptions to state mortgage lending, loan servicing or debt collection licensing and regulatory requirements. Accordingly, we and PLS are required to be licensed to conduct business in certain jurisdictions. PLS is licensed, or is taking steps to become licensed, in those jurisdictions, and for those activities, where it believes it is cost effective and appropriate to become licensed. Through our wholly owned subsidiaries, we are licensed or are taking steps to become licensed, in those jurisdictions, and for those activities, where we believe it is cost effective and appropriate to become licensed.
21

Our failure or the failure by PLS to obtain any necessary licenses, comply with applicable licensing laws or satisfy the various requirements to maintain them over time could restrict our direct business activities, result in litigation or civil and other monetary penalties, or cause us to default under certain of our lending arrangements, any of which could materially and adversely impact our business.
We and PLS are also required to hold the Agency approvals in order to sell mortgage loans to the Agencies and service such mortgage loans on their behalf. Our failure, or the failure of PLS, to satisfy the various requirements necessary to maintain such Agency approvals over time would also restrict our direct business activities and could adversely impact our business.
In addition, we and PLS are subject to periodic examinations by federal and state regulators, which can result in increases in our administrative costs, and we or PLS may be required to pay substantial penalties imposed by these regulators due to compliance errors, or we or PLS may lose our licenses. Negative publicity or fines and penalties incurred in one jurisdiction may cause investigations or other actions by regulators in other jurisdictions.
A disruption in the MBS market could materially adversely affect our business, financial condition and results of operations.
In our correspondent production activities, we deliver newly originated Agency-eligible mortgage loans that we acquire to Fannie Mae or Freddie Mac to be pooled into Agency MBS securities or transfer government loans that we acquire to PLS, which pools them into Ginnie Mae MBS securities. Disruptions in the general MBS market have occurred in the past. Any significant disruption or period of illiquidity in the general MBS market would directly affect our liquidity because no existing alternative secondary market would likely be able to accommodate on a timely basis the volume of loans that we typically acquire and sell in any given period. Accordingly, if the MBS market experiences a period of illiquidity, we might be prevented from selling the loans that we acquire into the secondary market in a timely manner or at favorable prices, which could materially and adversely affect our business, financial condition, results of operations and our ability to make distributions to our shareholders.
The industry in which we operate is highly competitive, and is likely to become more competitive, and our inability to compete successfully or decreased margins resulting from increased competition could adversely affect our business, financial condition, results of operations and our ability to make distributions to our shareholders.
We operate in a highly competitive industry that could become even more competitive as a result of economic, legislative, regulatory and technological changes. Competition in acquiring newly originated mortgage loans comes from large commercial banks and savings institutions and other independent mortgage lenders and servicers. Many of these institutions have significantly greater resources and access to capital than we do, which may give them the benefit of a lower cost of funds. Additionally, our existing and potential competitors may decide to modify their business models to compete more directly with our correspondent production business. For example, non-bank loan servicers may try to leverage their servicing operations to develop or expand a correspondent production business. Since the withdrawal of a number of large participants from these markets following the financial crisis in 2008, there have been relatively few large non-bank participants. As more non-bank entities enter these markets, our correspondent production activities may generate lower margins in order to effectively compete.
Compliance with changing regulation of corporate governance and public disclosure has resulted, and will continue to result, in increased compliance costs and pose challenges for our management team.
Changing federal and state laws, regulations and standards relating to corporate governance and public disclosure, including the Dodd-Frank Act and the rules, regulations and agencies promulgated thereunder, the Sarbanes-Oxley Act of 2002, or the Sarbanes-Oxley Act, and SEC regulations, have created uncertainty for public companies and significantly increased the compliance requirements, costs and risks associated with accessing the U.S. public markets. Our management and PCM’s team has and will continue to devote significant time and financial resources to comply with both existing and evolving standards for public companies; however, this will continue to lead to increased general and administrative expenses and a diversion of management time and attention from revenue generating activities to compliance activities.
Many aspects of the Dodd-Frank Act are subject to rulemaking and will take effect over several years, making it difficult to anticipate the overall financial impact on us and, more generally, the financial services and mortgage industries. Additionally, we cannot predict whether there will be additional proposed laws or reforms that would affect us, whether or when such changes may be adopted, how such changes may be interpreted and enforced or how such changes may affect us. However, the costs of complying with any additional laws or regulations could have a material adverse effect on our financial condition and results of operations.
22

Technology failures could damage our business operations and increase our costs, which could adversely affect our business, financial condition and results of operations.
The financial services industry as a whole is characterized by rapidly changing technologies, and system disruptions and failures caused by fire, power loss, telecommunications failures, unauthorized intrusion, computer viruses and disabling devices, natural disasters and other similar events may interrupt or delay the ability of PCM or PLS to provide services to our customers on our behalf. Security breaches, acts of vandalism and developments in computer capabilities could result in a compromise or breach of the technology used to protect our customers’ personal information and transaction data. Despite efforts by PCM or PLS to ensure the integrity of their systems, it is possible that they may not be able to anticipate or implement effective preventive measures against all security breaches, especially because the methods of attack change frequently or are not recognized until launched, and because security attacks can originate from a wide variety of sources, including third parties such as persons involved with organized crime or associated with external service providers. Those parties may also attempt to fraudulently induce employees, customers or other users of these systems to disclose sensitive information in order to gain access to our data or that of our customers or clients. These risks may increase in the future along with the industry’s increase in its reliance on the Internet and use of web-based product offerings.
A successful penetration or circumvention of the security of our systems or a defect in the integrity of PCM’s or PLS’ systems or cybersecurity could cause serious negative consequences for our business, including significant disruption of our operations, misappropriation of our confidential information or that of our customers, or damage to PCM’s or PLS’ computers or operating systems and to those of our customers and counterparties. Any of the foregoing events could result in violations of applicable privacy and other laws, financial loss to us, to PCM or PLS, or to our customers, loss of confidence in us, customer dissatisfaction, significant litigation exposure and harm to our reputation, all of which could have a material adverse effect on our business, financial condition, results of operations and our ability to make distributions to our shareholders.
Cybersecurity risks and cyber incidents may adversely affect our business by causing a disruption to our operations, a compromise or corruption of our confidential information, and/or damage to our business relationships, all of which could negatively impact our financial results.
A cyber incident is considered to be any adverse event that threatens the confidentiality, integrity or availability of our information resources. These incidents may be an intentional attack or an unintentional event and could involve gaining unauthorized access to our information systems for purposes of misappropriating assets, stealing confidential information, corrupting data or causing operational disruption. The result of these incidents may include disrupted operations, misstated or unreliable financial data, liability for stolen assets or information, increased cybersecurity protection and insurance costs, litigation and damage to our investor relationships. As our reliance on technology has increased, so have the risks posed by information systems, both internal and those provided to us by third-party service providers. While we have implemented policies and procedures designed to help mitigate cybersecurity risks and cyber intrusions, there can be no assurance that any such cyber intrusions will not occur or, if they do occur, that they will be adequately addressed. The occurrence of any cyber intrusions or failures, interruptions and security breaches of our information systems could damage our reputation, result in a loss of customer business, subject us to additional regulatory scrutiny, or expose us to civil litigation and possible financial liability, any of which could have a material adverse effect on our business, financial condition and results of operations.
The success and growth of our correspondent production activities will depend upon PLS’ ability to adapt to and implement technological changes.
Our correspondent production activities are currently dependent upon the ability of PLS to effectively interface with our mortgage lenders and other third parties and to efficiently process loan fundings and closings. The correspondent production process is becoming more dependent upon technological advancement. Maintaining and improving new technology and becoming proficient with it may also require significant capital expenditures by PLS. As these requirements increase in the future, PLS will have to fully develop these technological capabilities to remain competitive and its failure to do so could adversely affect our business, financial condition, results of operations and our ability to make distributions to our shareholders.
Our entry into the warehouse lending business could subject us to increased risk of loss.
We may enter into the warehouse lending business through one or more of our subsidiaries. In connection with such activity, we will generally finance a mortgage loan originated by a correspondent lender under a master repurchase agreement, pursuant to which we will purchase the loan at a discount to its unpaid principal balance. Upon its sale of the loan to us or a third party, the correspondent lender would then repurchase the loan from us in an amount equal to our purchase price plus accrued interest through the date of repurchase.
The ability of the correspondent lender to repurchase a loan from us may be contingent on its ability to sell such loan in an amount sufficient to pay us the full repurchase price. There can be no assurance that the correspondent lender will be able to sell the loan for an amount sufficient to repay its borrowings from us, or at all. As a result, we are subject to the credit risk of our
23

correspondent lenders. If the correspondent lender is unable to sell the loan and unable to repay its borrowings from us, there can be no assurance that any value we are able to realize through a sale or liquidation of the underlying loan will be sufficient to avoid a loss of all or a portion of the amount of the borrowing. Such losses could harm our business, financial condition, liquidity, results of operations and our ability to make distributions to our shareholders.
We could be harmed by misconduct or fraud that is difficult to detect.
We are exposed to risks relating to misconduct by employees of PennyMac and its subsidiaries, contractors we use, or other third parties with whom we have relationships. For example, such employees could execute unauthorized transactions, use our assets improperly or without authorization, perform improper activities, use confidential information for improper purposes, or misrecord or otherwise try to hide improper activities from us. This type of misconduct could also relate to our assets managed by PCM. This type of misconduct can be difficult to detect and if not prevented or detected could result in claims or enforcement actions against us or losses. Accordingly, misconduct by the employees of PennyMac and its subsidiaries, contractors, or others could subject us to losses or regulatory sanctions and seriously harm our reputation. Our controls may not be effective in detecting this type of activity.
If we fail to maintain an effective system of internal controls, we may not be able to accurately determine our financial results or prevent fraud.
Effective internal controls are necessary for us to provide reliable financial reports and effectively prevent fraud. We may in the future discover areas of our internal controls that need improvement. Section 404 of the Sarbanes-Oxley Act requires us to evaluate and report on our internal controls over financial reporting and have our independent auditors annually attest to our evaluation, as well as issue their own opinion on our internal control over financial reporting. While we have undertaken substantial work to comply with Section 404, we cannot be certain that we will be successful in maintaining adequate control over our financial reporting and financial processes. Furthermore, as we continue to grow our business, our internal controls will become more complex, and we will require significantly more resources to ensure our internal controls remain effective. If we or our independent auditors discover a material weakness, the disclosure of that fact, even if quickly remedied, could result in a breach under one of our lending arrangements and/or reduce the market value of our common shares. Additionally, the existence of any material weakness could result in a default under certain of our lending agreements and, along with the existence of a significant deficiency, would require management to devote significant time and incur significant expense to remediate any such material weakness or significant deficiency, and management may not be able to remediate any such material weakness or significant deficiency in a timely manner, or at all.
Terrorist attacks and other acts of violence or war may materially and adversely affect the real estate industry generally and our business, financial condition, liquidity and results of operations.
Terrorist attacks and other acts of violence or war may cause disruptions in the U.S. financial markets, including the real estate capital markets, and negatively impact the U.S. economy in general. Any future terrorist attacks, the anticipation of any such attacks, the consequences of any military or other response by the United States and its allies, and other armed conflicts could cause consumer confidence and spending to decrease or result in increased volatility in the United States and worldwide financial markets and economy. The economic impact of these events could also materially and adversely affect the collectability of some of our loans and the credit quality of our loans and investments and the properties underlying our interests. We may suffer losses as a result of the adverse impact of any future attacks and these losses may adversely impact our performance and may cause the market value of our common shares to decline or be more volatile. We cannot predict the severity of the effect that potential future armed conflicts and terrorist attacks would have on us. Losses resulting from these types of events may not be fully insurable.
Risks Related to Our Investments
A significant portion of our investments is and will continue to be in the form of whole loan mortgages, which are subject to increased risks.
A significant portion of our investments is and will continue to be in the form of whole loan mortgages, which are directly exposed to losses resulting from default and foreclosure. In the event of a foreclosure, we may assume direct ownership of the underlying real estate. The liquidation proceeds upon sale of such real estate may not be sufficient to recover our investment in the loan, resulting in a loss to us. In addition, the foreclosure process may be lengthy and expensive, and any delays or costs involved in the effectuation of a foreclosure of the loan or a liquidation of the underlying property may further reduce the proceeds and thus increase the loss.
24

The mortgage loans in which we invest and the mortgage loans underlying the MBS in which we invest subject us to delinquency, foreclosure and loss, as well as the risks associated with residential real estate and residential real estate-related investments, any of which could result in losses to us.
We invest in performing and nonperforming residential mortgage loans and, through our correspondent production business, newly originated prime credit quality residential mortgage loans. Residential mortgage loans are typically secured by single-family residential property and are subject to risks of delinquency and foreclosure and risks of loss. These risks are greater for nonperforming loans. In addition, we invest in RMBS that are not guaranteed by federally chartered entities such as Fannie Mae and Freddie Mac or, in the case of Ginnie Mae, the U.S. government. The ability of borrowers to repay residential mortgage loans that we own, or underlying RMBS that we own, is dependent upon the income or assets of these borrowers.
Our investments in mortgage loans and MBS also subject us to the risks of residential real estate and residential real estate-related investments, including, among others: (i) declines in the value of residential real estate; (ii) risks related to general and local economic conditions; (iii) lack of available mortgage funding for borrowers to refinance or sell their homes; (iv) overbuilding; (v) the general deterioration of the borrower’s ability to keep a rehabilitated nonperforming mortgage loan current; (vi) increases in property taxes and operating expenses; (vii) changes in zoning laws; (viii) costs resulting from the clean-up of, and liability to third parties for damages resulting from, environmental problems, such as indoor mold; (ix) casualty or condemnation losses; (x) uninsured damages from floods, earthquakes or other natural disasters; (xi) limitations on and variations in rents; (xii) fluctuations in interest rates; (xiii) fraud by borrowers, originators and/or sellers of mortgage loans; (xiv) undetected deficiencies and/or inaccuracies in underlying mortgage loan documentation and calculations; and (xv) failure of the borrower to adequately maintain the property, particularly during times of financial difficulty. To the extent that assets underlying our investments are concentrated geographically, by property type or in certain other respects, we may be subject to certain of the foregoing risks to a greater extent. Additionally, we may be required to foreclose on a mortgage loan and such actions would subject us to greater concentration of the risks of the residential real estate markets and risks related to the ownership and management of real property.
We also invest in commercial mortgage loans and expect to invest in CMBS. Commercial mortgage loans are secured by multifamily or commercial property and are also subject to risks of delinquency and foreclosure, and risks of loss that are greater than similar risks associated with loans made on the security of single-family residential property. The ability of a borrower to repay a loan secured by an income-producing property typically is dependent primarily upon the successful operation of such property rather than upon the existence of independent income or assets of the borrower. Net operating income of an income producing property can be affected by a variety of factors, and if the net operating income of the property is reduced, the borrower’s ability to repay the loan may be impaired. In the event of any default under a mortgage loan held directly by us, we will bear a risk of loss of principal to the extent of any deficiency between the value of the collateral and the price we paid for the loan plus any accrued and unpaid interest on the mortgage loan and any unreimbursed advances, which could have a material adverse effect on our cash flow from operations.
In the event of the bankruptcy of a mortgage loan borrower, the mortgage loan to such borrower will be deemed to be secured only to the extent of the value of the underlying collateral at the time of bankruptcy (as determined by the bankruptcy court), and the lien securing the mortgage loan will be subject to the avoidance powers of the bankruptcy trustee or debtor-in-possession to the extent the lien is unenforceable under state law.
A significant portion of the residential mortgage loans that we acquire are or may become nonperforming loans, which increases our risk of loss of our investment.
We acquire distressed residential mortgage loans and mortgage-related assets where the borrower has failed to make timely payments of principal and/or interest. We also acquire performing loans that subsequently become nonperforming. Under current market conditions, it is likely that a portion of these loans will have current loan-to-value ratios in excess of 100%, meaning the amount owed on the loan exceeds the value of the underlying real estate. Further, the borrowers on such loans may be in economic distress and/or may have become unemployed, bankrupt or otherwise unable or unwilling to make payments when due. If PLS as our primary and special servicer is not able to adequately address or mitigate the issues concerning these loans, we may incur significant losses. There are no limits on the percentage of nonperforming assets we may hold. Any loss we incur may be significant and may reduce distributions to our shareholders and materially and adversely affect the market value of our common shares.
Our retention of credit risk underlying mortgage loans we sell to Fannie Mae is inherently uncertain and exposes us to significant risk of loss.
In conjunction with our correspondent business, we have entered into credit risk transfer agreements (“CRT Agreements”) with Fannie Mae, whereby we sell pools of mortgage loans into Fannie Mae-guaranteed securitizations while retaining a portion of the credit risk underlying such mortgage loans by issuing a credit guarantee to Fannie Mae in exchange for a portion of the guarantee fee it normally charges. Our retention of credit risk subjects us to risks associated with delinquency and foreclosure similar to the risks associated with owning the underlying mortgage loans as described above, and exposes us to risk of loss greater than the risks associated with selling the mortgage loans to Fannie Mae without the retention of such credit risk. Any loss we incur may be significant and may reduce distributions to our shareholders and materially and adversely affect the market value of our common shares.
25
CRT Agreements also represent a type of investment that is new to the market and, as such, inherently uncertain. There can be no assurance that this investment type will continue to be offered by Fannie Mae or supported by the FHFA or that it will produce the desired returns. Further, our projected returns are highly dependent on certain internal models, and it is uncertain whether such models are sufficiently accurate to support our projected returns and/or avoid potentially significant losses.
In addition, although our CRT Agreements have been structured to produce qualifying assets for the purposes of satisfying our REIT qualification requirements, the REIT eligibility of the assets subject to the CRT Agreements is uncertain. If the Internal Revenue Service (“IRS”) were to take a position adverse to our interpretation, the consequences of such action could materially and adversely affect our business, financial condition, liquidity, results of operations, and our ability to make distributions to our shareholders.
Our acquisition of mortgage servicing rights exposes us to significant risks.
MSRs arise from contractual agreements between us and the investors (or their agents) in mortgage securities and mortgage loans. We generally acquire MSRs in connection with our sale of mortgage loans to the Agencies where we assume the obligation to service such loans on their behalf. We may also purchase MSRs from third-party sellers. Any MSRs we acquire are initially recorded at fair value on our balance sheet. The determination of the fair value of MSRs requires our management to make numerous estimates and assumptions. Such estimates and assumptions include, without limitation, estimates of future cash flows associated with MSRs based upon assumptions involving interest rates as well as the prepayment rates, delinquencies and foreclosure rates of the underlying serviced mortgage loans. The ultimate realization of the value of MSRs may be materially different than the values of such MSRs as may be reflected in our consolidated balance sheet as of any particular date. The use of different estimates or assumptions in connection with the valuation of these assets could produce materially different fair values for such assets, which could have a material adverse effect on our business, financial condition, results of operations and cash flows. Accordingly, there may be material uncertainty about the fair value of any MSRs we acquire.
Changes in interest rates are a key driver of the performance of MSRs. Historically, the value of MSRs has increased when interest rates rise and decreased when interest rates decline due to the effect those changes in interest rates have on prepayment estimates. We may pursue various hedging strategies to seek to reduce our exposure to adverse changes in fair value resulting from changes in interest rates. Our hedging activity will vary in scope based on the level and volatility of interest rates, the type of assets held and other changing market conditions. Interest rate hedging may fail to protect or could adversely affect us. To the extent we do not utilize derivatives to hedge against changes in fair value of MSRs, our balance sheet, financial condition, liquidity and results of operations would be more susceptible to volatility due to changes in the fair value of, or cash flows from, MSRs as interest rates change.
Prepayment speeds significantly affect MSRs. Prepayment speed is the measurement of how quickly borrowers pay down the unpaid principal balance of their loans or how quickly loans are otherwise brought current, modified, liquidated or charged off. We base the price we pay for MSRs and the rate of amortization of those assets on, among other things, our projection of the cash flows from the related pool of mortgage loans. Our expectation of prepayment speeds is a significant assumption underlying those cash flow projections. If prepayment speed expectations increase significantly, the fair value of the MSRs could decline and we may be required to record a non-cash charge, which would have a negative impact on our financial results. Furthermore, a significant increase in prepayment speeds could materially reduce the ultimate cash flows we receive from MSRs, and we could ultimately receive substantially less than what we paid for such assets. Moreover, delinquency rates have a significant impact on the valuation of any MSRs. An increase in delinquencies generally results in lower revenue because typically we only collect servicing fees from Agencies or mortgage owners for performing loans. Our expectation of delinquencies is also a significant assumption underlying our cash flow projections. If delinquencies are significantly greater than we expect, the estimated fair value of the MSRs could be diminished. When the estimated fair value of MSRs is reduced, we could suffer a loss, which could have a negative impact on our financial results.
Furthermore, MSRs and the related servicing activities are subject to numerous federal, state and local laws and regulations and may be subject to various judicial and administrative decisions imposing various requirements and restrictions on our business. Our failure to comply, or the failure of the servicer to comply, with the laws, rules or regulations to which we or they are subject by virtue of ownership of MSRs, whether actual or alleged, could expose us to fines, penalties or potential litigation liabilities, including costs, settlements and judgments, any of which could have a material adverse effect on our business, financial condition and results of operations and our ability to make distributions to our shareholders.
Our acquisition of excess servicing spread exposes us to significant risks.
We also acquire from PLS, from time to time, the right to receive certain ESS arising from MSRs owned or acquired by PLS. The ESS represents the difference between PLS’ contractual servicing fee with the applicable Agency and a base servicing fee that PLS retains as compensation for servicing or subservicing the related mortgage loans pursuant to the applicable servicing contract.
26

Because the ESS is a component of the related MSR, the risks of owning the ESS are substantially similar to the risks of owning an MSR. We also record our ESS assets at fair value, which is based on many of the same estimates and assumptions used to value our MSR assets, thereby creating the same potential for material differences between the recorded fair value of the ESS and the actual value that is ultimately realized. Also, the performance of our ESS assets are impacted by the same drivers as our MSR assets, namely interest rates, prepayment speeds and delinquency rates. Because of the inherent uncertainty in the estimates and assumptions and the potential for significant change in the impact of the drivers, there may be material uncertainty about the fair value of any ESS we acquire, and this could ultimately have a material adverse effect on our business, financial condition, results of operations and cash flows.
Further, as a condition to our purchase of the ESS, we were required to subordinate our interests to those of the applicable Agency. To the extent PLS fails to maintain its Agency approvals, such failure could result in PLS’ loss of the applicable MSR in its entirety, thereby extinguishing our interest in the related ESS. With respect to our ESS relating to PLS’ Ginnie Mae MSRs, our interest is also subordinated to the rights of CSFB First Boston Mortgage Capital LLC (“CSFB”) under a repurchase agreement with PLS, pursuant to which CSFB has a blanket lien on all of PLS’ Ginnie Mae MSRs (including the ESS we acquired), and under a security and subordination agreement with us, pursuant to which we acknowledge CSFB’s blanket lien. The security and subordination agreement permits CSFB to liquidate the ESS along with the related MSRs to the extent there exists an event of default under the repurchase agreement, and it contains certain trigger events, including breaches of representations, warranties or covenants and defaults under other of our credit facilities, that would require PLS to either (i) repay in full the outstanding loan amount under its repurchase agreement or (ii) repurchase the ESS from us at fair value. To the extent PLS is unable to repay the loan under its repurchase agreement or repurchase the ESS, an event of default would exist under the repurchase agreement, thereby entitling CSFB to liquidate the ESS and the related MSRs. In the event our ESS is liquidated as a result of certain actions or inactions of PLS, we generally would be entitled to seek indemnity under the applicable spread acquisition agreement; however, this would be an unsecured claim and, as a result, our loss of the ESS to an Agency or CSFB under any of these scenarios could have a material adverse effect on our business, financial condition, results of operations and our ability to make distributions to our shareholders.
We cannot independently protect our MSR or ESS assets from borrower refinancing and are dependent upon PLS to do so for our benefit.
While PLS has agreed pursuant to the terms of an MSR recapture agreement to transfer to us a portion of the MSRs relating to mortgage loans it refinances, we are not independently capable of protecting our MSR asset from borrower refinancing through targeted solicitations to, and origination of, refinance loans for borrowers in our servicing portfolio. Accordingly, unlike traditional mortgage originators and many servicers, we must rely upon PLS to refinance mortgage loans in our servicing portfolio that would otherwise be targeted by third-party lenders. Historically, PLS has had limited success soliciting loans in our servicing portfolio, and there can be no assurance that PLS will either have or allocate the time and resources required to effectively and efficiently protect our MSR assets. Its failure to do so, or the termination of our MSR recapture agreement, could result in accelerated runoff of our MSR assets, decreasing its value and adversely impacting our business, financial condition, results of operations and our ability to make distributions to our shareholders.
Similarly, while PLS has agreed pursuant to the terms of our spread acquisition agreements to transfer to us a portion of the ESS relating to mortgage loans it refinances, we are not independently capable of protecting our ESS asset from borrower refinancing through targeted solicitations to, and origination of, refinance loans for borrowers in our portfolio of ESS. Accordingly, we must also rely upon PLS to refinance these mortgage loans that would otherwise be targeted by third-party lenders. There can be no assurance that PLS will either have or allocate the time and resources required to effectively and efficiently solicit these mortgage loans. Its failure to do so, or the termination of our spread acquisition agreements, could result in accelerated runoff of our ESS assets, decreasing their value and adversely impacting our business, financial condition, results of operations and our ability to make distributions to our shareholders.
27

Investments in subordinated loans and subordinated MBS could subject us to increased risk of losses.
We invest in subordinated loans and may invest in subordinated MBS. In the event a borrower defaults on a subordinated loan and lacks sufficient assets to satisfy such loan, we may lose all or a significant part of our investment. In the event a borrower becomes subject to bankruptcy proceedings, we will not have any recourse to the assets, if any, of the borrower that are not pledged to secure our loan, and the unpledged assets of the borrower may not be sufficient to satisfy our loan. If a borrower defaults on our subordinated loan or on its senior debt (i.e., a first-lien loan, in the case of a residential mortgage loan, or a contractually or structurally senior loan, in the case of a commercial mortgage loan), or in the event of a borrower bankruptcy, our subordinated loan will be satisfied only after all senior debt is paid in full. As a result, we may not recover all or even a significant part of our investment, which could result in losses. In the case of commercial mortgage loans where senior debt exists, the presence of intercreditor arrangements may also limit our ability to amend our loan documents, assign our loan, accept prepayments, exercise our remedies and control decisions made in bankruptcy proceedings relating to borrowers.
In general, losses on an asset securing a mortgage loan included in a securitization will be borne first by the equity holder of the property, then by a cash reserve fund or letter of credit provided by the borrower, if any, and then by the “first loss” subordinated security holder and then by the “second loss” subordinated security holder. In the event of default and the exhaustion of any equity support, reserve fund, letter of credit and any classes of securities junior to those in which we invest, we may not recover all or even a significant part of our investment, which could result in losses.
In addition, if the underlying mortgage portfolio has been serviced ineffectively by the loan servicer or overvalued by the originator, or if the values of the assets subsequently decline and, as a result, less collateral is available to satisfy interest and principal payments due on the related MBS, the securities in which we invest may suffer significant losses. The prices of these types of lower credit quality investments are generally more sensitive to adverse actual or perceived economic downturns or individual issuer developments than more highly rated investments. An economic downturn or a projection of an economic downturn, for example, could cause a decline in the price of lower credit quality investments because the ability of obligors to make principal and interest payments or to refinance may be impaired.
Our investments in loans to and debt securities of real estate companies will be subject to the specific risks relating to the particular borrower or issuer of the securities and to the general risks of investing in real estate-related loans and securities, which could result in significant losses.
We may invest in loans to and debt securities of real estate companies, including REITs. These investments involve special risks relating to the particular borrower or issuer of the securities, including the financial condition, liquidity, results of operations, business and prospects of the borrower or issuer. Investments in REIT debt securities may also be subject to risks relating to transfer restrictions, substantial market price volatility resulting from changes to prevailing interest rates, and, in the case of subordinated investments, the seniority of claims of banks and other senior lenders to the issuer. In addition, real estate companies often invest, and REITs generally are required to invest substantially, in real estate or real estate-related assets and are subject to some or all of the risks inherent with real estate and real estate-related investments referred to in this Report. These risks may adversely affect the value of our debt securities of real estate companies and the ability of the issuers thereof to make principal and interest payments in a timely manner, or at all, which could result in significant losses for us.
Our investments in commercial mortgage loans and other commercial real estate-related loans are dependent upon the success of the multifamily and commercial real estate sectors and may be affected by conditions that could materially adversely affect our business and results of operations.
We acquire mortgage loans secured by multifamily and commercial real estate properties. The profitability of these investments will be closely tied to the overall success of the multifamily and commercial real estate market. Various changes in real estate conditions may impact the multifamily and commercial real estate sectors. Any negative trends in such real estate conditions may reduce the availability of attractive acquisition opportunities and, as a result, adversely affect our results of operations. These conditions include:
28
• oversupply of, or a reduction in demand for, multifamily housing and commercial properties;
• a favorable single-family real estate or interest rate environment that may result in a significant number of potential residents of multifamily properties deciding to purchase homes instead of renting;
• rent control or stabilization laws, or other laws regulating multifamily housing, which could affect the profitability of multifamily developments;
• the inability of residents and tenants to pay rent;
• increased competition in the multifamily and commercial real estate sectors based on considerations such as the attractiveness, location, rental rates, amenities and safety record of various properties; and
• increased operating costs, including increased real property taxes, maintenance, insurance and utilities costs.

Moreover, other factors may adversely affect the multifamily and commercial real estate sectors, including changes in government regulations and other laws, rules and regulations governing real estate, zoning or taxes, changes in the economy and interest rate levels, the potential liability under environmental and other laws, increases in delinquency and foreclosure rates, and other unforeseen events. Any or all of these factors could negatively impact the multifamily sector and, as a result, reduce the availability of attractive acquisition opportunities. Any such reduction could materially and adversely affect us.
The failure of PLS or any other servicer to effectively service our portfolio of mortgage loans would materially and adversely affect us.
Pursuant to our loan servicing agreement, PLS provides us with primary and special servicing. PLS’ loan servicing activities include collecting principal, interest and escrow account payments, if any, with respect to mortgage loans, as well as managing loss mitigation, which may include, among other things, collection activities, loan workouts, modifications, foreclosures, short sales and sales of REO. The ability of PLS or any other servicer or subservicer to effectively service our portfolio of mortgage loans is critical to our success, particularly given our strategy of maximizing the value of the distressed mortgage loans that we acquire through proprietary loan modification programs, special servicing and other initiatives focused on keeping borrowers in their homes; or in the case of nonperforming loans, effecting property resolutions in a timely, orderly and economically efficient manner. The failure of PLS or any other servicer or subservicer to effectively service our portfolio of mortgage loans would adversely impact our business, financial condition, liquidity, results of operations and our ability to make distributions to our shareholders.
The increasing number of proposed U.S. federal, state and local laws may affect certain mortgage-related assets in which we intend to invest and could increase our cost of doing business.
Legislation has been enacted and proposed which, among other provisions, could hinder the ability of a servicer to foreclose promptly on defaulted mortgage loans or would permit limited assignee liability for certain violations in the mortgage loan origination process, which could result in us being held responsible for such violations. We cannot predict whether or in what form the U.S. Congress or the various state and local legislatures may enact legislation affecting our business. We will evaluate the potential impact of any initiatives which, if enacted, could materially and adversely affect our practices and results of operations. We are unable to predict whether U.S. federal, state or local authorities will enact laws, rules or regulations that will require changes in our practices in the future, and any such changes could materially and adversely affect our cost of doing business and profitability.
Our inability to promptly foreclose upon defaulted mortgage loans could increase our cost of doing business and/or diminish our expected return on investments.
Our ability to promptly foreclose upon defaulted mortgage loans and liquidate the underlying real property plays a critical role in our valuation of the assets in which we invest and our expected return on those investments. There are a variety of factors that may inhibit our ability, through PLS, to foreclose upon a mortgage loan and liquidate the real property within the time frames we model as part of our valuation process. These factors include, without limitation: extended foreclosure timelines in states that require judicial foreclosure, including states where we hold high concentrations of mortgage loans; significant collateral documentation deficiencies; federal, state or local laws that are borrower friendly, including legislative action or initiatives designed to provide homeowners with assistance in avoiding residential mortgage loan foreclosures and that serve to delay the foreclosure process; HAMP and similar programs that require specific procedures to be followed to explore the refinancing of a mortgage loan prior to the commencement of a foreclosure proceeding; and declines in real estate values and sustained high levels of unemployment that increase the number of foreclosures and place additional pressure on the already overburdened judicial and administrative systems.
In addition, certain issues, including “robo-signing,” have been identified throughout the mortgage industry that relate to affidavits used in connection with the mortgage loan foreclosure process. A substantial portion of our investments are nonperforming mortgage loans, many of which are already subject to foreclosure proceedings at the time of purchase. While we have obtained assurances from PLS about its own practices relative to foreclosure proceedings and its proper use of affidavits, there can be no assurance that similar practices have been followed in connection with mortgage loans that are already subject to foreclosure proceedings at the time of purchase. To the extent we determine that any of these loans are impacted by these issues, we may be required to re-commence the foreclosure proceedings relating to such loans, thereby resulting in additional delay that could have the effect of increasing our cost of doing business and/or diminishing our expected return on our investments. The uncertainty surrounding these issues could also result in legal, regulatory or industry changes to the foreclosure process as a whole, any or all of which could lengthen the foreclosure process and negatively impact our business.
A decline in the value of the real estate underlying our mortgage loans or that we acquire, whether through foreclosure or otherwise, may result in reduced risk-adjusted returns or losses, and our ownership of real estate may subject us to risks and losses not adequately covered by insurance.
The value of the real estate that we own or that underlies mortgage loans that we own is subject to market conditions. Changes in the real estate market may adversely affect the value of the collateral and thereby lower the value to be derived from its liquidation. In addition, adverse changes in the real estate market increase the probability of default, as the incentive of the borrower to retain and protect equity in the property declines.
29

There are certain types of losses, generally of a catastrophic nature, that result from events such as earthquakes, floods, hurricanes, terrorism or acts of war, and that may be uninsurable or not economically insurable. Inflation, changes in building codes and ordinances, environmental considerations and other factors, including terrorism or acts of war, also might make the insurance proceeds insufficient to repair or replace a property if it is damaged or destroyed. Under these circumstances, the insurance proceeds received might not be adequate to restore our economic position with respect to the affected real property. Any uninsured loss could result in the loss of cash flow from, and the asset value of, the affected property.
We have also implemented an REO rental program, whereby we are the lessor of real estate, generally REO acquired upon foreclosure of defaulted loans, to the extent we determine that renting the property would produce a better return on investment than liquidation. There can be no assurance that this investment strategy will prove to be either profitable or more successful than liquidation. Further, our ongoing investment in the real estate will be subject to the market risk described above, as well as other risks associated with the rental business, including, without limitation, extended periods of vacancy, unfavorable landlord-tenant laws, and contractual disputes with our property managers. Any or all of these risks could subject us to loss, materially and adversely affect the value of our real estate investments and reduce or eliminate the returns we might have otherwise realized upon liquidation of the real estate.
Many of our investments are unrated or, where any credit ratings are assigned to our investments, they will be subject to ongoing evaluations and revisions and we cannot assure you that those ratings will not be downgraded.
Many of our current investments are not, and many of our future investments will not be, rated by any rating agency. Therefore, PCM’s assessment of the value and pricing of our investments may be difficult and the accuracy of such assessment is inherently uncertain. However, certain of our investments may be rated. If rating agencies assign a lower-than expected rating or reduce or withdraw, or indicate that they may reduce or withdraw, their ratings of our investments in the future, the value of these investments could significantly decline, which would materially and adversely affect the value of our investment portfolio and could result in losses upon disposition or the failure of borrowers to satisfy their debt service obligations to us.
We may be materially and adversely affected by risks affecting borrowers or the asset or property types in which our investments may be concentrated at any given time, as well as from unfavorable changes in the related geographic regions.
Our assets are not subject to any geographic, diversification or concentration limitations except that we will be concentrated in mortgage-related investments. Accordingly, our investment portfolio may be concentrated by geography, asset, property type and/or borrower, increasing the risk of loss to us if the particular concentration in our portfolio is subject to greater risks or is undergoing adverse developments. In addition, adverse conditions in the areas where the properties securing or otherwise underlying our investments are located (including business layoffs or downsizing, industry slowdowns, changing demographics and other factors) and local real estate conditions (such as oversupply or reduced demand) may have an adverse effect on the value of our investments. A material decline in the demand for real estate in these areas may materially and adversely affect us. Concentration or a lack of diversification can increase the correlation of non-performance and foreclosure risks among our investments.
A prolonged economic slowdown, recession or declining real estate values could materially and adversely affect us.
The risks associated with our investments are more acute during periods of economic slowdown or recession, especially if these periods are accompanied by high unemployment and declining real estate values. A weakening economy, high unemployment and declining real estate values significantly increase the likelihood that borrowers will default on their debt service obligations to us and that we will incur losses on our investments with them in the event of a default on a particular investment because the value of any collateral we foreclose upon may be insufficient to cover the full amount of such investment or may require a significant amount of time to realize. These factors may also increase the likelihood of re-default rates even after we have completed loan modifications. Any period of increased payment delinquencies, foreclosures or losses could adversely affect the net interest income generated from our portfolio and our ability to make and finance future investments, which would materially and adversely affect our business, financial condition, liquidity, results of operations and our ability to make distributions to our shareholders.
Many of our investments are illiquid and we may not be able to adjust our portfolio in response to changes in economic and other conditions.
Our investments in distressed mortgage loans, MSRs, ESS, commercial mortgage loans, securities and mortgage loans held in a consolidated variable interest entity may be illiquid. As a result, it may be difficult or impossible to obtain or validate third-party pricing on the investments we purchase. Illiquid investments typically experience greater price volatility, as a ready market does not exist, and can be more difficult to value. The illiquidity of our investments may make it difficult for us to sell such investments if the need or desire arises. In addition, if we are required to liquidate all or a portion of our portfolio quickly, we may realize significantly less than the recorded value.
30
Fair values of many of our investments are estimates and their ultimately reduced values may materially and adversely affect periodic reported results and credit availability, which may reduce earnings and, in turn, cash available for distribution to our shareholders.
The fair values of some of our investments are not readily determinable. We measure the fair value of these investments monthly, but the fair value at which our assets are recorded may differ from their realizable value. Ultimate realization of the value of an asset depends to a great extent on economic and other conditions that change during the time period over which the investment is held and are beyond the control of PCM, us or our board of trustees. Further, fair value is only an estimate based on good faith judgment of the price at which an investment can be sold since market prices of investments can only be determined by negotiation between a willing buyer and seller. In certain cases, PCM’s estimation of the fair value of our investments includes inputs provided by third-party dealers and pricing services, and valuations of certain securities or other assets in which we invest are often difficult to obtain and are subject to judgments that may vary among market participants. Changes in the estimated fair values of those assets are directly charged or credited to earnings for the period. If we were to liquidate a particular asset, the realized value may be more than or less than the amount at which such asset was recorded. Accordingly, in either event, the value of our common shares could be materially and adversely affected by our determinations regarding the fair value of our investments, and such valuations may fluctuate over short periods of time.
PCM utilizes analytical models and data in connection with the valuation of our investments, and any incorrect, misleading or incomplete information used in connection therewith would subject us to potential risks.
Given the illiquidity and complexity of our investments and strategies, PCM must rely heavily on models and data, including analytical models (both proprietary models developed by PCM and those supplied by third parties) and information and data supplied by third parties. Models and data are used to value investments or potential investments and also in connection with hedging our investments. In the event models and data prove to be incorrect, misleading or incomplete, any decisions made in reliance thereon expose us to potential risks. For example, by relying on incorrect models and data, especially valuation models, PCM may be induced to buy certain investments at prices that are too high, to sell certain other investments at prices that are too low or to miss favorable opportunities altogether. Similarly, any hedging based on faulty models and data may prove to be unsuccessful.
Liability relating to environmental matters may impact the value of properties that we may acquire or the properties underlying our investments.
Under various U.S. federal, state and local laws, an owner or operator of real property may become liable for the costs of removal of certain hazardous substances released on its property. These laws often impose liability without regard to whether the owner or operator was responsible for, or aware of, the release of such hazardous substances. The presence of hazardous substances may also adversely affect an owner’s ability to sell real estate, borrow using real estate as collateral or make debt payments to us. In addition, if we take title to a property, the presence of hazardous substances may adversely affect our ability to sell the property, and we may become liable to a governmental entity or to third parties for various fines, damages or remediation costs. Any of these liabilities or events may materially and adversely affect the value of the relevant asset and/or our business, financial condition, liquidity, results of operations and our ability to make distributions to our shareholders.
We depend on the accuracy and completeness of information about borrowers and counterparties and any misrepresented information could adversely affect our business, financial condition and results of operations.
In connection with our correspondent production activities, we may rely on information furnished by or on behalf of borrowers and counterparties, including financial statements and other financial information. We also may rely on representations of borrowers and counterparties as to the accuracy and completeness of that information and, with respect to financial statements, on reports of independent auditors. If any of this information is intentionally or negligently misrepresented and such misrepresentation is not detected prior to loan funding, the value of the loan may be significantly lower than expected. Our controls and processes may not have detected or may not detect all misrepresented information in our loan acquisitions or from our business clients. Any such misrepresented information could materially and adversely affect our business, financial condition, results of operations and our ability to make distributions to our shareholders.
We are subject to counterparty risk and may be unable to seek indemnity or require our counterparties to repurchase mortgage loans if they breach representations and warranties, which could cause us to suffer losses.
When we purchase nonperforming assets or newly originated loans through our correspondent production activities, our counterparty typically makes customary representations and warranties to us about such assets or loans. Our residential mortgage loan purchase agreements may entitle us to seek indemnity or demand repurchase or substitution of the loans in the event our counterparty breaches a representation or warranty given to us. However, there can be no assurance that our mortgage loan purchase agreements will contain appropriate representations and warranties, that we will be able to enforce our contractual right to demand repurchase or
31
substitution, or that our counterparty will remain solvent or otherwise be able to honor its obligations under our mortgage loan purchase agreements. Further, a significant portion of our nonperforming assets was purchased from or through a small number of sellers who generally also provide us with financing, creating a concentration of risk and a potential conflict of interest with key sources of financing. Our inability to obtain indemnity or require repurchase of a significant number of loans could materially and adversely affect our business, financial condition, liquidity, results of operations and our ability to make distributions to our shareholders.
We may be required to repurchase mortgage loans or indemnify investors if we breach representations and warranties, which could materially and adversely affect our earnings.
When we sell loans, we are required to make customary representations and warranties about such loans to the loan purchaser. As part of our correspondent production activities, PLS re-underwrites a percentage of the loans that we acquire, and we rely upon PLS to ensure quality underwriting by our correspondent sellers, accurate third-party appraisals, and strict compliance with the representations and warranties that we require from our correspondent sellers and that are required from us by our investors. Our residential mortgage loan sale agreements may require us to repurchase or substitute loans or indemnify the purchaser against future losses in the event we breach a representation or warranty given to the loan purchaser. In addition, we may be required to repurchase loans as a result of borrower fraud or in the event of early payment default on a mortgage loan. Likewise, we may be required to repurchase or substitute loans if we breach a representation or warranty in connection with our securitizations. The remedies available to the Agencies and other purchasers of mortgage loans may be broader than those available to us against the originator or correspondent lender, and if a purchaser enforces its remedies against us, we may not be able to enforce the remedies we have against the sellers. The repurchased loans typically can only be financed at a steep discount to their repurchase price, if at all. They are also typically sold at a discount to the unpaid principal balance, which in some cases can be significant. Significant repurchase activity could materially and adversely affect our business, financial condition, liquidity, results of operations and our ability to make distributions to our shareholders.
We believe that, as a result of the current market environment, many purchasers of mortgage loans, including the Agencies, are particularly aware of the conditions under which loan sellers must indemnify them against losses related to purchased loans, or repurchase those loans, and would benefit from enforcing any repurchase remedies they may have.
Risks Related to Our Organization and Structure
Certain provisions of Maryland law, our staggered board of trustees and certain provisions in our declaration of trust could each inhibit a change in our control.
Certain provisions of the Maryland General Corporation Law (the “MGCL”) applicable to a Maryland real estate investment trust may have the effect of inhibiting a third party from making a proposal to acquire us or of impeding a change in our control under circumstances that otherwise could provide the holders of our common shares with the opportunity to realize a premium over the then prevailing market price of such common shares.
In addition, our board of trustees is divided into three classes of trustees. Trustees of each class will be elected for three-year terms upon the expiration of their current terms, and each year one class of trustees will be elected by our shareholders. The staggered terms of our trustees may reduce the possibility of a tender offer or an attempt at a change in control, even though a tender offer or change in control might be in the best interests of our shareholders.
Further, our declaration of trust authorizes us to issue additional authorized but unissued common shares and preferred shares. Our board of trustees may, without shareholder approval, increase the aggregate number of our authorized common shares or the number of shares of any class or series that we have authority to issue and classify or reclassify any unissued common shares or preferred shares and may set the preferences, rights and other terms of the classified or reclassified shares. As a result, our board may establish a class or series of common shares or preferred shares or take other actions that could delay or prevent a transaction or a change in our control that might involve a premium price for our common shares or otherwise be in the best interests of our shareholders.
Our bylaws include an exclusive forum provision that could limit our shareholders’ ability to obtain a judicial forum viewed by the shareholders as more favorable for disputes with us or our trustees or officers.
Our bylaws provide that the Circuit Court for Baltimore City, Maryland, or, if that Court does not have jurisdiction, the United States District Court for the District of Maryland, Baltimore Division, is the exclusive forum for any derivative action or proceeding brought on our behalf; any action asserting a claim of breach of fiduciary duty; any action asserting a claim against us arising pursuant to any provision of the Maryland REIT Law; or any action asserting a claim against us that is governed by the internal affairs doctrine. This exclusive forum provision may limit a shareholder’s ability to bring a claim in a judicial forum that it finds favorable for disputes with us or our trustees or officers, which may discourage such lawsuits against us and our trustees and officers. Alternatively, if a
32
court were to find the choice of forum provision contained in our bylaws to be inapplicable or unenforceable in an action, we may incur additional costs associated with resolving such action in other jurisdictions, which could adversely affect our business and financial condition.
Compliance with our Investment Company Act exclusion imposes limits on our operations.
We intend to conduct our operations so that we are not required to register as an investment company under the Investment Company Act. However, our qualification for exclusion from registration under the Investment Company Act will limit our ability to make certain investments, as discussed below.
Failure to maintain our exclusion from registration under the Investment Company Act could materially and adversely affect us.
Because we are organized as a holding company that conducts business primarily through our Operating Partnership and its wholly-owned subsidiaries, our status under the Investment Company Act is dependent upon the status of our Operating Partnership which, as a holding company, in turn, will have its status determined by the status of its subsidiaries. If our Operating Partnership or one or more of its subsidiaries fail to maintain their exceptions or exclusions from the Investment Company Act and we do not have available to us another basis on which we may avoid registration, we may have to register under the Investment Company Act. This could subject us to substantial regulation with respect to our capital structure (including our ability to use leverage), management, operations, transactions with affiliated persons (as defined in the Investment Company Act), portfolio composition, including restrictions with respect to diversification and industry concentration, and other matters. It could also cause the breach of covenants we or our subsidiaries have made under certain of our financing arrangements, which could result in an event of default, acceleration of debt and/or termination.
In August 2011, the SEC solicited public comment through a concept release on a wide range of issues relating to the Section 3(c)(5)(C) exemption from the Investment Company Act, including the nature of the assets that qualify for purposes of the exemption and whether mortgage-related REITs should be regulated in a manner similar to investment companies. There can be no assurance that the laws and regulations governing the Investment Company Act status of REITs, including guidance and interpretations from the Division of Investment Management of the SEC regarding the exceptions and exclusions therefrom, will not change in a manner that adversely affects our operations. If the SEC takes action that could result in our or our subsidiaries’ failure to maintain an exception or exclusion from the Investment Company Act, we could, among other things, be required to (a) restructure our operations to avoid being required to register as an investment company, (b) effect sales of our assets in a manner that, or at a time when, we would not otherwise choose to do so or (c) register as an investment company (which, among other things, would require us to comply with the leverage constraints applicable to investment companies), any of which could negatively affect the value of our common shares, the sustainability of our business model, and our ability to make distributions to our shareholders, which could, in turn, materially and adversely affect our business and the market price of our common shares.
Further, a loss of our Investment Company Act exception or exclusion would allow PCM to terminate our management agreement with us, and our loan servicing agreement with PLS is subject to early termination in the event our management agreement is terminated for any reason. If either of these agreements is terminated, we will have to obtain the services on our own, and we may not be able to replace these services in a timely manner or on favorable terms, or at all. This would have a material adverse effect on our ability to continue to execute our business strategy.
Rapid changes in the values of our investments may make it more difficult for us to maintain our REIT qualification or exclusion from the Investment Company Act.
If the market value or income potential of our residential mortgage loans and other real estate-related assets declines as a result of increased interest rates, prepayment rates or other factors, we may need to increase certain real estate investments and income and/or liquidate our non-qualifying assets in order to maintain our REIT qualification or exclusion from the Investment Company Act. If the decline in real estate asset values and/or income occurs quickly, this may be especially difficult to accomplish, particularly given the illiquid nature of our investments. We may have to make investment decisions, including the liquidation of investments at a disadvantageous time or on unfavorable terms, that we otherwise would not make absent our REIT and Investment Company Act considerations.
Our rights and the rights of our shareholders to take action against our trustees and officers are limited, which could limit shareholder recourse in the event of actions not in the best interest of our shareholders.
Our declaration of trust limits the liability of our present and former trustees and officers to us and our shareholders for money damages to the maximum extent permitted under Maryland law. Under current Maryland law, our present and former trustees and officers will not have any liability to us or our shareholders for money damages other than liability resulting from either (a) actual receipt of an improper benefit or profit in money, property or services or (b) active and deliberate dishonesty by the trustee or officer that was established by a final judgment and is material to the cause of action.
33

Our declaration of trust authorizes us to indemnify our present and former trustees and officers for actions taken by them in those capacities to the maximum extent permitted by Maryland law. Our bylaws require us to indemnify each present and former trustee or officer, to the maximum extent permitted by Maryland law, in the defense of any proceeding to which he or she is made, or threatened to be made, a party by reason of his or her service to us. In addition, we may be obligated to pay or reimburse the expenses incurred by our present and former trustees and officers without requiring a preliminary determination of their ultimate entitlement to indemnification. As a result, we and our shareholders may have more limited rights against our present and former trustees and officers than might otherwise exist absent the current provisions in our declaration of trust and bylaws or that might exist with other companies, which could limit shareholder recourse in the event of actions not in the best interest of our shareholders.
Our declaration of trust contains provisions that make removal of our trustees difficult, which could make it difficult for our shareholders to effect changes to our management.
Our declaration of trust provides that, subject to the rights of holders of any series of preferred shares, a trustee may be removed only for “cause” (as defined in our declaration of trust), and then only by the affirmative vote of at least two-thirds of the votes entitled to be cast generally in the election of trustees. Vacancies generally may be filled only by a majority of the remaining trustees in office, even if less than a quorum, for the full term of the class of trustees in which the vacancy occurred. These requirements make it more difficult to change our management by removing and replacing trustees and may prevent a change in our control that is in the best interests of our shareholders.
Risks Related to Taxation
Our failure to qualify as a REIT would result in higher taxes and reduced cash available for distribution to our shareholders.
We are organized and operate in a manner so as to qualify as a REIT for U.S. federal income tax purposes. Our qualification as a REIT depends on our satisfaction of certain asset, income, organizational, distribution, shareholder ownership and other requirements on a continuing basis. If we were to lose our REIT status in any taxable year, corporate-level income taxes, including alternative minimum taxes, would apply to all of our taxable income at federal and state tax rates, and distributions to our shareholders would not be deductible by us in computing our taxable income. Any such corporate tax liability could be substantial and would reduce the amount of cash available for distribution to our shareholders, which in turn would have an adverse impact on the value of our common shares. Unless we were entitled to relief under certain Internal Revenue Code provisions, we also would be disqualified from taxation as a REIT for the four taxable years following the year during which we ceased to qualify as a REIT.
Even if we qualify as a REIT, we face tax liabilities that reduce our cash flow, and a significant portion of our income may be earned through TRSs that are subject to U.S. federal income taxation.
Even if we qualify for taxation as a REIT, we may be subject to certain U.S. federal, state and local taxes on our income and assets, including taxes on any undistributed income, tax on income from some activities conducted as a result of a foreclosure, and state or local income, property and transfer taxes, such as mortgage recording taxes. Any of these taxes would decrease cash available for distribution to our shareholders.
We also engage in business activities that are required to be conducted in a TRS. In order to meet the REIT qualification requirements, or to avert the imposition of a 100% tax that applies to certain gains derived by a REIT from dealer property or inventory, we hold a significant portion of our assets through, and derive a significant portion of our taxable income and gains in, a TRS, subject to the limitation that securities in TRSs may not represent more than 25% (20% for years beginning after December 31, 2017) of our assets in order for us to remain qualified as a REIT. All taxable income and gains derived from the assets held from time to time in our TRS are subject to regular corporate income taxation.
The percentage of our assets represented by a TRS and the amount of our income that we can receive in the form of TRS dividends are subject to statutory limitations that could jeopardize our REIT status.
Currently, no more than 25% of the value of a REIT’s assets may consist of stock or securities of one or more TRSs (at the end of each quarter). For taxable years beginning after December 31, 2017, no more than 20% of the value of a REIT’s assets may consist of stock or securities of one or more TRSs. We expect to continue to have one or more TRSs when this change to the TRS rule becomes effective, and may potentially have to modify our activities or the capital structure of those TRSs in order to comply with the new limitation and maintain our qualification as a REIT. While we intend to manage our affairs so as to satisfy this requirement, there can be no assurance that we will be able to do so in all market circumstances and even if we are able to do so, compliance with this rule may reduce our flexibility in operating our business. Although a TRS is subject to U.S. federal, state and local income tax on its taxable income, we may from time to time need to make distributions of such after-tax income in order to keep the value of our TRS below 25% (or 20% for taxable years beginning after December 31, 2017) of our total assets. However, for purposes of one of the tests we must satisfy to qualify as a REIT, at least 75% of our gross income must in each taxable year generally be from real estate assets. While we monitor our compliance with both this income test and the limitation on the percentage of our assets
34

represented by TRS securities, the two may at times be in conflict with one another. That is, it is possible that we may wish to distribute a dividend from a TRS in order to reduce the value of our TRS below 25% (20% for years beginning after December 31, 2017) of the required percentage of our assets, but be unable to do so without violating the requirement that 75% of our gross income in the taxable year be derived from real estate assets. There can be no assurance that we will be able to comply with both of these tests in all market conditions.
Dividends payable by REITs do not generally qualify for the reduced tax rates applicable to certain corporate dividends.
The Internal Revenue Code provides for a 20% maximum federal income tax rate for dividends paid by corporations to eligible domestic shareholders that are individuals, trusts or estates. Dividends paid by REITs, however, are generally not eligible for the reduced rates. The more favorable rates applicable to regular corporate dividends could cause investors who are individuals, trusts and estates to perceive investments in REITs to be relatively less attractive than investments in the stocks of non-REIT corporations that pay dividends, which could materially and adversely affect the value of the stock of REITs, including our common shares.
We have not established a minimum distribution payment level and no assurance can be given that we will be able to make distributions to our shareholders in the future at current levels or at all.
We are generally required to distribute to our shareholders at least 90% of our taxable income each year for us to qualify as a REIT under the Internal Revenue Code, which requirement we currently intend to satisfy. To the extent we satisfy the 90% distribution requirement but distribute less than 100% of our taxable income, we will be subject to U.S. federal corporate income tax on our undistributed taxable income. We have not established a minimum distribution payment level, and our ability to make distributions to our shareholders may be materially and adversely affected by the risk factors discussed in this Report and any subsequent Quarterly Reports on Form 10-Q. Although we have made, and anticipate continuing to make, quarterly distributions to our shareholders, our board of trustees has the sole discretion to determine the timing, form and amount of any future distributions to our shareholders, and such determination will depend upon, among other factors, our historical and projected results of operations, financial condition, cash flows and liquidity, maintenance of our REIT qualification and other tax considerations, capital expenditure and other expense obligations, debt covenants, contractual prohibitions or other limitations and applicable law and such other matters as our board of trustees may deem relevant from time to time. Among the factors that could impair our ability to continue to make distributions to our shareholders are:
As a result, no assurance can be given that we will be able to continue to make distributions to our shareholders in the future or that the level of any future distributions will achieve a market yield or increase or even be maintained over time, any of which could materially and adversely affect the market price of our common shares.
The REIT distribution requirements could materially and adversely affect our ability to execute our business strategies.
We intend to continue to make distributions to our shareholders to comply with the requirements of the Internal Revenue Code and to avoid paying corporate income tax on undistributed income. However, differences in timing between the recognition of taxable income and the actual receipt of cash could require us to sell assets, borrow funds on a short-term or long-term basis, or issue equity to meet the distribution requirements of the Internal Revenue Code. We may find it difficult or impossible to meet distribution requirements in certain circumstances. Due to the nature of the assets in which we invest and may invest and to our accounting elections for such assets, we may be required to recognize taxable income from those assets in advance of our receipt of cash flow on or proceeds from disposition of such assets. As a result, to the extent such income is not realized within a TRS, the requirement to distribute a substantial portion of our net taxable income could cause us to: (i) sell assets in adverse market conditions, (ii) borrow on unfavorable terms, (iii) distribute amounts that would otherwise be invested in future acquisitions, capital expenditures or repayment of debt or (iv) make a taxable distribution of our shares as part of a distribution in which shareholders may elect to receive shares or (subject to a limit measured as a percentage of the total distribution) cash, in order to comply with REIT requirements.
35
• our inability to invest the net proceeds from our equity offerings;
• our inability to make attractive risk-adjusted returns on our current and future investments;
• non-cash earnings or unanticipated expenses that reduce our cash flow;
• defaults in our investment portfolio or decreases in its value; and
• the fact that anticipated operating expense levels may not prove accurate, as actual results may vary from estimates.

We may be required to report taxable income early in our holding period for certain investments in excess of the economic income we ultimately realize from them.
We acquire and/or expect to acquire in the secondary market debt instruments that we may significantly modify for less than their face amount, MBS issued with original issue discount, or debt instruments or MBS that are delinquent as to mandatory principal and interest payments. In each case, we may be required to report income regardless of whether corresponding cash payments are received or are ultimately collectible. If we eventually collect less than we had previously reported as income, there may be a bad debt deduction available to us at that time or we may record a capital loss in a disposition of such asset, but our ability to benefit from that bad debt deduction would depend on our having taxable income or capital gains, respectively, in that later taxable year. This possible “income early, losses later” phenomenon could materially and adversely affect us and our shareholders if it were persistent and in significant amounts.
The share ownership limits applicable to us that are imposed by the Internal Revenue Code for REITs and our declaration of trust may restrict our business combination opportunities.
In order for us to maintain our qualification as a REIT under the Internal Revenue Code, not more than 50% in value of our outstanding shares may be owned, directly or indirectly, by five or fewer individuals (as defined in the Internal Revenue Code to include certain entities) at any time during the last half of each taxable year following our first year. Our declaration of trust, with certain exceptions, authorizes our board of trustees to take the actions that are necessary and desirable to preserve our qualification as a REIT. Under our declaration of trust, no person may own more than 9.8% by vote or value, whichever is more restrictive, of our outstanding common shares or more than 9.8% by vote or value, whichever is more restrictive, of our outstanding shares of beneficial interest. Our board may grant an exemption to the share ownership limits in its sole discretion, subject to certain conditions and the receipt of certain representations and undertakings. These share ownership limits are based upon direct or indirect ownership by “individuals,” which term includes certain entities.
Ownership limitations are common in the organizational documents of REITs and are intended, among other purposes, to provide added assurance of compliance with the tax law requirements and to minimize administrative burdens. However, our share ownership limits might also delay or prevent a transaction or a change in our control that might involve a premium price for our common shares or otherwise be in the best interests of our shareholders.
Complying with the REIT requirements can be difficult and may cause us to forego otherwise attractive opportunities or liquidate otherwise attractive investments.
To qualify as a REIT for U.S. federal income tax purposes, we must continually satisfy tests concerning, among other things, the sources of our income, the nature and diversification of our assets, the amounts we distribute to our shareholders and the ownership of our shares. We may be required to make distributions to our shareholders at disadvantageous times or when we do not have funds readily available for distribution. Thus, compliance with the REIT requirements may hinder our ability to make certain attractive investments or require us to liquidate from our portfolio otherwise attractive investments. If we are compelled to liquidate our investments, we may be unable to comply with these requirements, ultimately jeopardizing our qualification as a REIT, or we may be subject to a 100% tax on any resultant gain if we sell assets that are treated as dealer property or inventory. These actions could have the effect of reducing our income and amounts available for distribution to our shareholders.
Complying with the REIT requirements may limit our ability to hedge effectively.
The REIT provisions of the Internal Revenue Code may limit our ability to hedge our assets and operations. Under current law, any income that we generate from transactions intended to hedge our interest rate or currency risks associated with our related liabilities will be excluded from gross income for purposes of the REIT gross income tests in certain instances. Generally, income derived from other types of hedging transactions will not be treated as qualifying income for purposes of the REIT gross income tests. As a result of these rules, we may have to limit our use of hedging techniques that might otherwise be advantageous, which could result in greater risks associated with interest rate or other changes than we would otherwise be subject to.
If our Operating Partnership failed to qualify as a disregarded entity for U.S. federal income tax purposes, we could fail to qualify as a REIT and suffer other adverse consequences.
We believe that our Operating Partnership is organized and operated in a manner so as to be treated as a disregarded entity, and not an association or publicly traded partnership taxable as a corporation, for U.S. federal income tax purposes. As a disregarded entity, it is not subject to U.S. federal income tax on its income. Instead, its income is included in the calculation of our income. No assurance can be provided, however, that the IRS will not challenge its status as a partnership or disregarded entity for U.S. federal income tax purposes, or that a court would not sustain such a challenge. If the IRS were successful in treating our Operating Partnership as an association or publicly-traded partnership taxable as a corporation for U.S. federal income tax purposes, we could fail to meet the gross income tests and certain of the asset tests applicable to REITs and, accordingly, could cease to qualify as a REIT. Also, the failure of our Operating Partnership to qualify as a partnership or a disregarded entity would cause it to become subject to U.S. federal corporate income tax, which would reduce significantly the amount of its cash available for debt service and for distribution.
36

The tax on prohibited transactions limits our ability to engage in transactions, including certain methods of securitizing mortgage loans, that would be treated as sales for U.S. federal income tax purposes.
A REIT’s net income from prohibited transactions is subject to a 100% tax. In general, prohibited transactions are sales or other dispositions of property, other than foreclosure property, but including mortgage loans, held primarily for sale to customers in the ordinary course of business. We might be subject to this tax if we were to dispose of or securitize loans in a manner that was treated as a sale of the loans for U.S. federal income tax purposes. Therefore, in order to avoid the prohibited transactions tax, we may choose to engage in certain sales of loans through a TRS and not at the REIT level, and may limit the structures we utilize for our securitization transactions, even though the sales or structures might otherwise be beneficial to us. We may hold a substantial amount of assets in one or more TRSs that are subject to corporate income tax on its earnings, which may reduce the cash flow generated by us and our subsidiaries in the aggregate, and our ability to make distributions to our shareholders.
The taxable mortgage pool (“TMP”) rules may increase the taxes that we or our shareholders may incur, and may limit the manner in which we effect future securitizations.
Certain of our securitizations may likely be considered to result in the creation of TMPs for U.S. federal income tax purposes. A TMP is always classified as a corporation for U.S. federal income tax purposes. However, as long as a REIT owns 100% of a TMP, such classification generally does not result in the imposition of corporate income tax, because the TMP is a “qualified REIT subsidiary.” Prior to September 1, 2012, the requirement that a TMP be wholly-owned by a REIT to be a qualified REIT subsidiary means that we would be precluded from holding equity interests in such a TMP through our Operating Partnership if the TMP were a U.S. entity that would be subject to taxation as a domestic corporation, unless our Operating Partnership itself formed another subsidiary REIT to own the TMP. Effective August 31, 2012, the general partner of the Operating Partnership and the REIT jointly elected to revoke the general partner’s TRS election. As a result, the general partner is no longer an entity that is regarded for income tax purposes and all of the interests in the Operating Partnership are treated as being owned by the REIT. The Operating Partnership continues to be treated as a disregarded entity for income tax purposes and any assets that it owns are treated as if they are directly owned by the REIT.
In the case of such wholly-REIT owned TMPs, certain categories of our shareholders, such as foreign shareholders otherwise eligible for treaty benefits, shareholders with net operating losses, and tax exempt shareholders that are subject to unrelated business income tax, could be subject to increased taxes on a portion of their dividend income received from us that is attributable to the TMP or “excess inclusion income.” In addition, to the extent that our shares are owned in record name by tax exempt “disqualified organizations,” such as certain government-related entities that are not subject to tax on unrelated business income, we may incur a corporate level tax on our allocable portion of excess inclusion income from such a wholly-REIT owned TMP. In that case and to the extent feasible, we may reduce the amount of our distributions to any disqualified organization whose share ownership gave rise to the tax, or we may bear such tax as a general corporate expense. To the extent that our shares owned by disqualified organizations are held in record name by a broker/dealer or other nominee, the broker/dealer or other nominee would be liable for the corporate level tax on the portion of our excess inclusion income allocable to the shares held by the broker/dealer or other nominee on behalf of disqualified organizations. While we intend to attempt to minimize the portion of our distributions that is subject to these rules, the law is unclear concerning computation of excess inclusion income, and its amount could be significant.
In the case of any TMP that would be taxable as a domestic corporation if it were not wholly-REIT owned, we would be precluded from selling equity interests in these securitizations to outside investors, or selling any debt securities issued in connection with these securitizations that might be considered to be equity interests for tax purposes. This marketing limitation may prevent us from selling more junior or non-investment grade debt securities in such securitizations and maximizing our proceeds realized in those offerings.
New legislation or administrative or judicial action, in each instance potentially with retroactive effect, could make it more difficult or impossible for us to qualify as a REIT.
The present U.S. federal income tax treatment of REITs may be modified, possibly with retroactive effect, by legislative, judicial or administrative action at any time, which could affect the U.S. federal income tax treatment of an investment in our common shares. The U.S. federal tax rules that affect REITs constantly are under review by persons involved in the legislative process, the IRS and the U.S. Treasury, which results in statutory changes as well as frequent revisions to Treasury Regulations and interpretations. Revisions in U.S. federal tax laws and interpretations thereof could cause us to change our investments and commitments, which could also affect the tax considerations of an investment in our common shares.
37

We also may enter into certain transactions where the REIT eligibility of the assets subject to such transactions is uncertain. In circumstances where the application of these rules and regulations affecting our investments is not clear, we may have to interpret them and their application to us. If the IRS were to take a position adverse to our interpretation, the consequences of such action could materially and adversely affect our business, financial condition, liquidity, results of operations, and our ability to make distributions to our shareholders.
An IRS administrative pronouncement with respect to investments by REITs in distressed debt secured by both real and personal property, if interpreted adversely to us, could cause us to pay penalty taxes or potentially to lose our REIT status.
Most of the mortgage loans that we acquire are acquired by us at a discount from their outstanding principal amount, because our pricing is generally based on the value of the underlying real estate that secures those mortgage loans.
Treasury Regulation Section 1.856-5(c) (the “interest apportionment regulation”) provides rules for determining what portion of the interest income from mortgage loans that are secured by both real and personal property is treated as “interest on obligations secured by mortgages on real property or on interests in real property.” Under the interest apportionment regulation, if a mortgage covers both real property and other property, a REIT is required to apportion its annual interest income to the real property security based on a fraction, the numerator of which is the value of the real property securing the loan, determined when the REIT commits to acquire the loan, and the denominator of which is the highest “principal amount” of the loan during the year. The IRS issued a revenue procedure, Revenue Procedure 2011-16, that contains an example regarding the application of the interest apportionment regulation. The example interprets the “principal amount” of the loan to be the face amount of the loan, despite the Internal Revenue Code requiring taxpayers to treat any market discount, that is the difference between the purchase price of the loan and its face amount, for all purposes (other than certain withholding and information reporting purposes) as interest rather than principal.
The interest apportionment regulation applies only if the debt in question is secured both by real property and personal property. We believe that all of the mortgage loans that we acquire are secured only by real property and no other property value is taken into account in our underwriting and pricing. Accordingly, we believe that the interest apportionment regulation does not apply to our portfolio.
Nevertheless, if the IRS were to assert successfully that our mortgage loans were secured by property other than real estate, that the interest apportionment regulation applied for purposes of our REIT testing, and that the position taken in Revenue Procedure 2011-16 should be applied to our portfolio, then depending upon the value of the real property securing our loans and their face amount, and the sources of our gross income generally, we might not be able to meet the 75% REIT gross income test, and possibly the asset tests applicable to REITs. If we did not meet this test, we could potentially either lose our REIT status or be required to pay a tax penalty to the IRS.
With respect to the 75% REIT asset test, Revenue Procedure 2011-16 provides a safe harbor under which the IRS will not challenge a REIT’s treatment of a loan as being a real estate asset in an amount equal to the lesser of (1) the fair market value of the real property securing the loan determined as of the date the REIT committed to acquire the loan or (2) the fair market value of the loan on the date of the relevant quarterly REIT asset testing date. This safe harbor, if it applied to us, would help us comply with the REIT asset tests following the acquisition of distressed debt if the value of the real property securing the loan were to subsequently decline. However, if the value of the real property securing the loan were to increase, the safe harbor rule of Revenue Procedure 2011-16, read literally, could have the peculiar effect of causing the corresponding increase in the value of the loan to not be treated as a real estate asset. We do not believe, however, that this was the intended result in situations in which the value of a loan has increased because the value of the real property securing the loan has increased, or that this safe harbor rule applies to debt that is secured solely by real property. However, for taxable years beginning after December 31, 2015, Internal Revenue Code Section 856(c)(9) was added and clarifies Revenue Procedure 2011-16. Subparagraph (B) of Section 856(c)(9) allows a REIT to treat personal property that is secured by a mortgage on both real property and personal property as a real estate asset, and the interest income as derived from a mortgage secured by real property, if the fair value of the personal property does not exceed fifteen percent 15% of the total fair value of all property secured by the mortgage. Nevertheless, if the IRS took the position that the safe harbor rule applied in these scenarios, then we might not be able to meet the various quarterly REIT asset tests if the value of the real estate securing our loans increased, and thus the value of our loans increased by a corresponding amount. If we did not meet one or more of these tests, then we could potentially either lose our REIT status or be required to pay a tax penalty to the IRS.
38

None.
We do not own or lease any property. Our operations are carried out on our behalf at the principal executive offices of PennyMac, at 6101 Condor Drive, Moorpark, California, 93021.
From time to time, we may be involved in various claims and legal actions arising in the ordinary course of business. As of December 31, 2015, we were not involved in any material legal proceedings.
Not applicable.
39
Item 1B. Unresolved Staff Comments
Item 2. Properties
Item 3. Legal Proceedings
Item 4. Mine Safety Disclosures

PART II
Our common shares are listed on the New York Stock Exchange (Symbol: PMT). As of February 23, 2016, our common shares were held by 30,330 beneficial holders. The following table sets forth the high and low sales prices (as reported by the New York Stock Exchange) for our common shares and the amount of cash dividends declared during the last two years:
For the year ended December 31, 2015
For the year ended December 31, 2014
We intend to pay quarterly dividends and to distribute to our shareholders at least 90% of our taxable income in each year (subject to certain adjustments). This is one requirement to qualify for the tax benefits accorded to a REIT under the Internal Revenue Code. We have not established a minimum dividend payment level and our ability to pay dividends may be adversely affected for the reasons described in Item 1A of this Report in the section entitled Risk Factors. All distributions are made at the discretion of our board of trustees and depend on our earnings, our financial condition, maintenance of our REIT status and such other factors as our board of trustees may deem relevant from time to time.
Unregistered Sales of Equity Securities and Use of Proceeds
There were no sales of unregistered equity securities during the year ended December 31, 2015.
The following table provides information about our common share repurchases at the year ended December 31, 2015:
40
Item 5. Market for the Registrant’s Common Equity, Related Stockholder Matters and Issuer Purchases of Equity Securities
Stock Cash dividendsdeclaredPeriod ended High Low
March 31, 2015 $22.99 $20.57 $ 0.61 June 30, 2015 $21.76 $17.43 $ 0.61 September 30, 2015 $18.30 $14.69 $ 0.47 December 31, 2015 $16.67 $14.42 $ 0.47
Stock Cash dividendsdeclaredPeriod ended High Low
March 31, 2014 $24.44 $22.86 $ 0.59 June 30, 2014 $24.15 $20.78 $ 0.59 September 30, 2014 $22.35 $21.10 $ 0.61 December 31, 2014 $22.32 $20.40 $ 0.61
Period
Totalnumber of
shares purchased
Averageprice paidper share
Total number of shares
purchased as part of publicly
announced plansor programs (a)
Amountavailable forfuture sharerepurchases
under the plans or
programs (a) (in thousands)August 1, 2015 – August 31, 2015 50,000 $ 15.20 50,000 $ 149,240 September 1, 2015 – September 30, 2015 969,487 $ 15.67 969,487 $ 134,045 October 1, 2015 – October 31, 2015 25,000 $ 15.33 25,000 $ 135,182 November 1, 2015 – November 30, 2015 — $ — — $ 135,182 December 1, 2015 – December 31, 2015 — $ — — $ 135,182
1,044,487 $ 15.65 1,044,487 $ 135,182
(a) In August 2015, our board of trustees approved a share repurchase program pursuant to which we are authorized to repurchase up to $150 million of our common shares. In February 2016, our board of trustees approved an increase to our share repurchase program pursuant to which we are now authorized to repurchase up to $200 million of our common shares. Under the program, we have discretion to determine the dollar amount of common shares to be repurchased and the timing of any repurchases in compliance with applicable law and regulation. The program does not have an expiration date. Amounts presented reflect balances as of the end of the applicable period.

Equity Compensation Plan Information
We have adopted an equity incentive plan which provides for the issuance of equity based awards, including share options, restricted shares, restricted share units, unrestricted common share awards, LTIP units (a special class of partnership interests in our Operating Partnership) and other awards based on our shares that may be awarded by us directly to our officers and trustees, and the members, officers, trustees, directors and employees of PFSI and its subsidiaries or other entities that provide services to us and the employees of such other entities. The equity incentive plan is administered by our compensation committee, pursuant to authority delegated by our board of trustees, which has the authority to make awards to the eligible participants referenced above, and to determine what form the awards will take, and the terms and conditions of the awards. Our equity incentive plan allows for grants of equity-based awards up to an aggregate of 8% of our issued and outstanding common shares on a diluted basis at the time of the award. However, the total number of shares available for issuance under the plan cannot exceed 40 million.
The following table provides information as of December 31, 2015 concerning our common shares authorized for issuance under our equity incentive plan:
41
(a) (b) (c)
Plan category
Number of securities tobe issued upon exerciseof outstanding options,
warrants and rights
Weighted-averageexercise price of
outstanding options,warrants and rights
Number of securities remaining available forfuture issuance under equity compensation
plans excluding securities reflected
in column(a))Equity compensation plans
approved by security holders(1) 733,785
$ — 5,226,312
Equity compensation plans not approved by security holders(2) — — —
Total 733,785 — 5,226,312
(1) Represents our 2009 equity incentive plan. (2) We do not have any equity plans that have not been approved by our shareholders.

42
Item 6. Selected Financial Data
Year ended December 31, 2015 2014 2013 2012 2011 (in thousands, except per share data)Condensed Consolidated Statements of Income: Net investment income:
Net interest income $ 76,637 $ 86,759 $ 57,640 $ 40,799 $ 19,202 Net gain on mortgage loans acquired for sale 51,016 35,647 98,669 147,675 7,633 Net gain on investments 53,985 201,809 207,758 103,649 82,643 Other 67,127 32,526 41,451 11,403 2,190
248,765 356,741 405,518 303,526 111,668
Expenses: Expenses payable to PennyMac Financial Services, Inc. 129,224 136,276 151,535 93,950 21,691 Other 46,237 41,001 39,348 22,754 17,482
175,461 177,277 190,883 116,704 39,173
Income before (benefit from) provision for income taxes 73,304 179,464 214,635 186,822 72,495 (Benefit from) provision for income taxes (16,796) (15,080) 14,445 48,573 8,056
Net income $ 90,100 $ 194,544 $ 200,190 $ 138,249 $ 64,439
Condensed Consolidated Balance Sheets: Investments:
Short-term investments $ 41,865 $ 139,900 $ 92,398 $ 39,017 $ 30,319 United States Treasury security — — — — 50,000 Mortgage-backed securities at fair value 322,473 307,363 197,401 — 72,813 Mortgage loans acquired for sale at fair value 1,283,795 637,722 458,137 975,184 232,016 Mortgage loans at fair value (1) 2,555,788 2,726,952 2,818,445 1,189,971 825,576 Excess servicing spread purchased from PFSI 412,425 191,166 138,723 — — Real estate acquired in settlement of loans (2) 341,846 303,228 148,080 88,078 103,549 Real estate held for investment 8,796 — — — — Mortgage servicing rights 459,741 357,780 290,572 126,776 6,031
5,426,729 4,664,111 4,143,756 2,419,026 1,320,304 Other assets 400,195 233,147 159,718 140,637 65,758
Total assets $5,826,924 $4,897,258 $4,303,474 $2,559,663 $1,386,062
Borrowings: Assets sold under agreements to repurchase and mortgage loan participation and sale
agreement $3,128,780 $2,749,249 $2,039,003 $1,256,102 $ 631,313 Federal Home Loan Bank advances 183,000 — — — — Notes payable 236,015 — — — — Note payable secured by mortgage loans at fair value — — — — 28,617 Borrowings under forward purchase agreements — — 226,580 — 152,427 Asset-backed financing of a VIE at fair value 247,690 165,920 165,415 — — Exchangeable senior notes 245,054 244,079 243,159 — —
4,040,539 3,159,248 2,674,157 1,256,102 812,357 Other liabilities 290,272 159,838 162,203 102,225 27,688
Total liabilities 4,330,811 3,319,086 2,836,360 1,358,327 840,045 Shareholders’ equity 1,496,113 1,578,172 1,467,114 1,201,336 546,017
Total liabilities and shareholders’ equity $5,826,924 $4,897,258 $4,303,474 $2,559,663 $1,386,062
Per Share Data: Earnings:
Basic $ 1.19 $ 2.62 $ 3.13 $ 3.14 $ 2.41 Diluted $ 1.16 $ 2.47 $ 2.96 $ 3.14 $ 2.41
Cash dividends: Declared $ 2.16 $ 2.40 $ 2.87 $ 2.22 $ 1.42 Paid $ 2.30 $ 2.38 $ 2.28 $ 2.22 $ 1.84
Year-end: Share price $ 15.26 $ 21.09 $ 23.42 $ 25.29 $ 16.62 Book value $ 20.28 $ 21.18 $ 20.82 $ 20.39 $ 19.22
(1) Includes mortgage loans at fair value, mortgage loans under forward purchase agreements at fair value and mortgage loans at fair value held by variable interest entity.
(2) Includes real estate acquired in settlement of loans and real estate acquired in settlement of loans under forward purchase agreements.
We are a specialty finance company that invests primarily in residential mortgage loans and mortgage-related assets. Our objective is to provide attractive risk-adjusted returns to our investors over the long-term, primarily through dividends and secondarily through capital appreciation. We have achieved this objective largely by investing in distressed mortgage assets and acquiring, pooling and selling newly originated prime credit quality residential mortgage loans (“correspondent production”) and retaining the MSRs. We have also invested in ESS on MSRs acquired by PLS. In 2015, we began investing in credit risk transfer agreements (“CRT Agreements”) on certain of the mortgage loans acquired through our correspondent production activity.
We are externally managed by PCM, an investment adviser that specializes in and focuses on, residential mortgage loans. Most of our mortgage loan portfolio is serviced by PLS.
We invest in distressed mortgage loans through direct acquisitions of mortgage loan portfolios from institutions such as banks and mortgage companies. A substantial portion of the nonperforming mortgage loans we have purchased has been acquired from or through one or more subsidiaries of Citigroup Inc.
We seek to maximize the value of the distressed mortgage loans that we acquire using means that are appropriate for the particular loan, including both proprietary and nonproprietary loan modification programs, special servicing and other initiatives focused on avoiding foreclosure, when possible. When we are unable to effect a cure for a mortgage delinquency, our objective is timely acquisition and/or liquidation of the property securing the loan through the use, in part, of short sales and deed-in-lieu of foreclosure programs. During the years ended December 31, 2015, 2014 and 2013, we acquired distressed mortgage loans with fair values totaling $242.0 million, $577.4 million and $1.3 billion, respectively, and we received proceeds from liquidation, payoffs and sales from our portfolio of distressed mortgage loans and REO totaling $520.5 million, $788.0 million and $392.0 million, respectively.
During the years ended December 31, 2015, 2014 and 2013, we purchased newly originated prime credit quality loans with fair values totaling $46.4 billion, $28.4 billion and $32.0 billion, respectively, in furtherance of our correspondent production business. To the extent that we purchase mortgage loans that are insured by the U.S. Department of Housing and Urban Development (“HUD”) through the FHA or insured or guaranteed by the VA, or U.S. Department of Agriculture (“USDA”), we and PLS have agreed that PLS will fulfill and purchase such mortgage loans, as PLS is a Ginnie Mae-approved issuer and servicer and we are not. This arrangement has enabled us to compete with other correspondent lenders that purchase both government and conventional mortgage loans. We receive a sourcing fee from PLS of three basis points on the unpaid principal balance of each mortgage loan that we sell to PLS under such arrangement, and earn interest income on the mortgage loan for the time period we hold the mortgage loan prior to the sale to PLS. We received sourcing fees totaling $9.0 million relating to $29.9 billion in UPB of mortgage loans at fair value that we sold to PLS for the year ended December 31, 2015, compared to $4.7 million relating to $15.6 billion in UPB of loans that we sold to PLS for the year ended December 31, 2014, and $4.6 million relating to $15.4 billion in UPB of mortgage loans that we sold to PLS for the year ended December 31, 2013.
We also intend to continue to retain the MSRs that we receive as a portion of the proceeds from our sale of mortgage loans through our correspondent production operation. During the year ended December 31, 2015, we received MSRs with fair values at initial recognition totaling $154.5 million, compared to $121.3 million during the year ended December 31, 2014 and $183.0 million during the year ended December 31, 2013.
We believe that ESS is an attractive long-term investment that allows us to leverage the mortgage loan servicing and origination capabilities of PLS and ESS can act as a hedge for us against the interest-rate sensitivity of other assets, such as MBS or the inventory of our correspondent production business. During the year ended December 31, 2015, we purchased ESS with fair values totaling $271.6 million and received $6.7 million pursuant to a recapture agreement with PFSI, compared to purchases of $95.9 million and receipt of $7.3 million of ESS pursuant to a recapture agreement during the year ended December 31, 2014 and purchases of ESS totaling $139.0 million during the year ended December 31, 2013.
We believe that CRT Agreements are an attractive long-term investment as we believe they can produce attractive risk-adjusted returns through our own mortgage production and, at the same time, align with Fannie Mae’s strategic goals, namely to attract private capital investment in GSE credit risk. We see significant potential for deploying additional capital into front-end credit risk transfer and MSRs that result from our correspondent production activities as we redeploy capital from the liquidation of distressed whole loans. During the year ended December 31, 2015, we made investments in CRT Agreements totaling $147.4 million.
We supplement these activities through participation in other mortgage-related activities, including:
Item 7. Management’s Discussion and Analysis of Financial Condition and Results of Operations
• Acquisition of REIT-eligible mortgage-backed or mortgage-related securities. We purchased MBS and Agency
debt securities with fair values totaling $84.8 million, $186.0 million, and $199.6 million during the years ended December 31, 2015, 2014, and 2013, respectively.

Our Board of trustees has authorized a common share repurchase program under which we may repurchase up to $200 million of our outstanding common shares. During the year ended December 31, 2015, we repurchased 1.0 million common shares at a cost of $16.3 million. The repurchased common shares were canceled upon settlement of the repurchase transactions and returned to the authorized but unissued share pool.
43
• Acquisition of small balance (typically under $10 million) commercial real estate loans. During the year ended December 31, 2015, we acquired $14.8 million in fair value of small balance commercial real estate loans.
• To the extent that we transfer correspondent production loans into private label securitizations, retention of an
interest in mortgage loans transferred through the retention of a portion of the securities created in the securitization transaction.
We believe that we qualify to be taxed as a REIT. We believe that we will not be subject to federal income tax on that portion of our income that is distributed to shareholders as long as we meet certain asset, income and share ownership tests. If we fail to qualify as a REIT, and do not qualify for certain statutory relief provisions, our profits will be subject to income taxes and we may be precluded from qualifying as a REIT for the four tax years following the year we lose our REIT qualification. A portion of our activities, including our correspondent production business, is conducted in our TRS, which is subject to corporate federal and state income taxes. Accordingly, we have made a provision for income taxes with respect to the operations of our TRS. We expect that the effective rate for the provision for income taxes may be volatile in future periods. Our goal is to manage the business to take full advantage of the tax benefits afforded to us as a REIT.
Observations on Current Market Opportunities
Our business is affected by macroeconomic conditions in the United States, including economic growth, unemployment rates, the residential housing market and interest rate levels and expectations. The U.S. economy continues to grow, as reflected in recent economic data. During 2015, real U.S. gross domestic product expanded at an annual rate of 2.4%, the same rate as in 2014. The national seasonally adjusted unemployment rate was 5.0% at December 31, 2015 and compares to 5.6% at December 31, 2014 and 6.7% at December 31, 2013. Delinquency rates on residential real estate loans remain elevated compared to historical rates, but have been steadily declining. As reported by the Federal Reserve Bank, during the third quarter of 2015, the delinquency rate on residential real estate loans held by commercial banks was 5.5%, a reduction from 6.6% during the fourth quarter of 2014.
Residential real estate activity appears to be improving. The seasonally adjusted annual rate of existing home sales for December 2015 was 7.7% higher than for December 2014, and the national median existing home price for all housing types was $222,400, a 6.8% increase from December 2014. On a national level, foreclosure filings during 2015 decreased by 2.9% as compared to 2014. However, foreclosure activity is expected to remain above historical average levels through 2016 and beyond.
Changes in fixed-rate residential mortgage loan interest rates generally follow changes in long-term U.S. Treasury yields. Thirty-year fixed mortgage interest rates ranged from a low of 3.59% to a high of 4.09% during 2015 while during 2014, thirty-year fixed mortgage interest rates ranged from a low of 3.80% to a high of 4.53% (Source: Freddie Mac’s Weekly Primary Mortgage Market Survey).
Mortgage lenders originated an estimated $1.7 trillion of home loans during 2015, up 33% from 2014. Mortgage originations are forecast to decrease, with current industry estimates for 2016 totaling $1.5 trillion (Source: Average of Fannie Mae, Freddie Mac and Mortgage Bankers Association forecasts).
We believe that there is significant long-term market opportunity to invest in GSE CRT on certain of the loans acquired through our correspondent production activity. CRT Agreements align with the FHFA’s desire to reduce taxpayer risk by transferring some of the credit risk from Fannie Mae and Freddie Mac to private sector participants. FHFA, in its capacity as conservator of Fannie Mae and Freddie Mac, has included in its 2016 scorecard for both GSEs a target to transfer credit risk on at least 90% of the UPB of newly acquired single-family mortgages in certain loan categories. Those loan categories include non-HARP, fixed-rate terms greater than 20 years, and loan-to-value ratios above 60%. This continues the trend of increasing the volume of loans subject to CRT Agreements. For example, the FHFA required each GSE to share the risk on at least $30 billion in UPB in 2013, $90 billion in 2014, and $120 billion for Freddie Mac and $150 million for Fannie Mae in 2015. In addition, under the 2016 scorecard, the GSEs have been directed to work with FHFA to conduct an analysis and assessment of front-end CRT Agreements, such as our CRT Agreements, and to take appropriate steps to continue them. In front-end CRT Agreements, a lender or aggregator retains a portion of the credit risk associated with the loans they sell to Fannie Mae or Freddie Mac through an arrangement entered into prior to the delivery of the loans to the GSE.
We believe there is significant long-term market opportunity in non-agency jumbo mortgage loans, however current investor demand from institutional investors and large banks is limited, as evidenced by weak and inconsistent pricing for securitizations issued during 2015. Prime jumbo securitizations totaled $11.2 billion in UPB in 2015, an increase from $8.3 billion in 2014 but substantially reduced from pre-2007 volumes. During the year ended December 31, 2015, we produced approximately $125 million in UPB of jumbo loans compared to $378 million in UPB of jumbo loans produced during the year ended December 31, 2014.
Our Manager continues to see a robust market for distressed residential mortgage loans (sales of loan pools that consist of either nonperforming mortgage loans, troubled but performing mortgage loans or a combination thereof) offered for sale. During 2015, the pool of sellers expanded to include programmatic sellers, such as HUD and Freddie Mac. During 2015, our Manager reviewed 117 mortgage loan pools with UPB totaling approximately $31.9 billion. This compares to our Manager’s review of 128 mortgage loan pools with UPB totaling approximately $34.0 billion during 2014. We acquired distressed mortgage loans with fair values totaling $242.0 million, $559.0 million, and $1.3 billion during the years ended December 31, 2015, 2014 and 2013, respectively. While we expect to see a continued supply of distressed mortgage loans, we believe the pricing for transactions in recent periods has generally been less attractive for buyers. We remain patient and selective in making new investments in distressed mortgage loans and we continue to monitor the market to assess best execution opportunities for our existing distressed portfolio investments.
44

Critical Accounting Policies
Preparation of financial statements in compliance with accounting principles generally accepted in the United States (“GAAP”) requires us to make estimates and judgments that affect the reported amounts of assets and liabilities and the disclosure of contingent assets and liabilities at the date of the financial statements, and revenues and expenses during the reporting period. Certain of these estimates significantly influence the portrayal of our financial condition and results, and they require our Manager to make difficult, subjective or complex judgments. Our critical accounting policies primarily relate to our fair value estimates.
We group financial statement items measured at or based on fair value in three levels based on the markets in which the assets are traded and the observability of the inputs used to determine fair value. These levels are:
Our consolidated balance sheet is substantially comprised of assets that are measured at or based on their fair values. At December 31, 2015, $4.7 billion or 81% of our total assets were carried at fair value and $735.0 million or 12% were carried based on their fair values (primarily REO and certain of our MSRs – both of which are carried at the lower of cost or fair value). Of these assets carried at or based on fair value, $3.3 billion or 57% of total assets are measured using “Level 3” inputs – significant inputs that are difficult to observe due to illiquidity of the markets in which the assets are traded. Changes in inputs to measurement of these financial statement items can have a significant effect on the amounts reported for these items including their reported balances and their effects on our net income.
As a result of the difficulty in observing certain significant valuation inputs affecting “Level 3” financial statement items, our Manager is required to make judgments regarding these items’ fair values. Different persons in possession of the same facts may reasonably arrive at different conclusions as to the inputs to be applied in estimating the fair value of these financial statement items and their fair values. Likewise, due to the general illiquidity of some of these financial statement items, subsequent transactions may be at values significantly different from those reported.
Because the fair value of “Level 3” financial statement items is difficult to estimate, our Manager’s valuation process includes performance of these items’ valuation by specialized staffs and significant executive management oversight. Our Manager has assigned the responsibility for estimating the fair values of our non-IRLC “Level 3” financial statement items to its Financial Analysis and Valuation group (the “FAV group”), which is responsible for valuing our investment portfolios and maintenance of our valuation policies and procedures. Our Manager’s FAV group submits the results of its valuations to PCM’s valuation committee, which oversees and approves the fair values that are included in our periodic financial statements. PCM’s valuation committee includes the chief executive, financial, operating, risk, and asset/liability management officers of PFSI.
45
At December 31, 2015
Level/Description Carrying value of assets measured(1)
%total assets
(in thousands)Level 1: Prices determined using quoted prices in active markets foridentical assets or liabilities. $ 44,533 1% Level 2: Prices determined using other significant observable inputs.Observable inputs are inputs that other market participants would use in pricing an asset or liability and are developed based on market data obtained from sources independent of us. These may include quoted prices for similar assets or liabilities, interest rates, prepayment speeds, credit risk and others. 2,066,803 35% Level 3: Prices determined using significant unobservable inputs.In situations where quoted prices or observable inputs are unavailable (for example, when there is little or no market activity for an investment at the end of the period), unobservable inputs may be used. Unobservable inputs reflect our Manager’s judgments about the factors that market participants use in pricing an asset or liability, and are based on the best information available in the circumstances. 3,319,982 57%
Total assets measured at or based on fair value $ 5,431,318 93%
Total assets $ 5,826,924
(1) Includes assets measured on both a recurring and nonrecurring basis based on the accounting principles applicable to the specific asset and whether we have elected to carry the item at its fair value.

The fair value of our IRLCs is developed by our Manager’s Capital Markets Risk Management staff and is reviewed by our Manager’s Capital Markets Operations group in the exercise of their internal control activities.
Following is a discussion relating to our Manager’s approach to measuring the balance sheet items that are most affected by “Level 3” fair value estimates.
Interest Rate Lock Commitments
Our net gain on mortgage loans acquired for sale includes our estimates of gains or losses we expect to realize upon the sale of mortgage loans we have committed to purchase but have not yet purchased or sold. Therefore, we recognize a substantial portion of our net gain on mortgage loans acquired for sale at fair value before we purchase the mortgage loan. In the course of our correspondent production activities, we make contractual commitments to correspondent lenders to purchase mortgage loans at specified terms. We call these commitments interest rate lock commitments, or IRLCs. We recognize the fair value of IRLCs at the time we make the commitment to the correspondent lender and adjust the fair value of such IRLCs as the mortgage loan approaches the point of purchase or the transaction is canceled.
We carry IRLCs as either derivative assets or derivative liabilities on our consolidated balance sheet. The fair value of IRLCs is transferred to the fair value of mortgage loans acquired for sale at fair value when the mortgage loan is funded.
An active, observable market for IRLCs does not exist. Therefore, we measure the fair value of IRLCs using methods and inputs we believe that market participants use in pricing IRLCs. We estimate the fair value of an IRLC based on quoted Agency MBS prices, our estimates of the fair value of the MSRs we expect to receive in the sale of the mortgage loans and the probability that the mortgage loan will be purchased as a percentage of the commitment we have made (the “pull-through rate”).
Pull-through rates and MSR fair values are based on our estimates as these inputs are difficult to observe in the mortgage marketplace. Changes in our estimate of the probability that a mortgage loan will fund and changes in interest rates are recognized as the IRLCs move through the purchase process and may result in significant changes in the estimates of the fair value of the IRLCs. Such changes are reflected in the change in fair value of IRLCs which is a component of our Net gain on mortgage loans acquired for sale in the period of the change. The financial effects of changes in the pull-through rates and MSR fair values are generally inversely correlated. Increasing interest rates have a positive effect on the fair value of the MSR component of IRLC value but increase the pull-through rate for the principal and interest payment portion of the mortgage loans that decrease in fair value.
A shift in the market for IRLCs or a change in our Manager’s assessment of an input to the valuation of IRLCs can have a significant effect on the amount of gain on sale of mortgage loans acquired for sale for the period. Our Manager believes that the fair value of IRLCs is most sensitive to changes in pull-through rate inputs. Following is a quantitative summary of the effect of changes in pull-through inputs on the fair value of IRLCs:
Mortgage Loans
We carry mortgage loans at their fair values. We recognize changes in the fair value of mortgage loans in current period income as a component of Net investment income. Our Manager estimates fair value of mortgage loans based on whether the mortgage loans are saleable into active markets with transparent pricing.
46
Effect on fair value of a change in pull-through rate
Shift in input Effect on fair value (in thousands)
5% $14010% $26720% $484 (5%) $(259)(10%) $(518)(20%) $(1,036)
• Our Manager categorizes mortgage loans that are saleable into active markets as “Level 2” fair value financial statement items.
Such mortgage loans include substantially all of our mortgage loans acquired for sale. Our Manager estimates such loans’ fair values using their quoted market price or market price equivalent.
• Our Manager categorizes mortgage loans that are not saleable into active markets as “Level 3” fair value financial statement items. Such mortgage loans include substantially all of our investments in distressed mortgage loans and certain of the mortgage loans acquired for sale which we subsequently repurchased pursuant to representations and warranties or that were identified as non-salable to the Agencies.
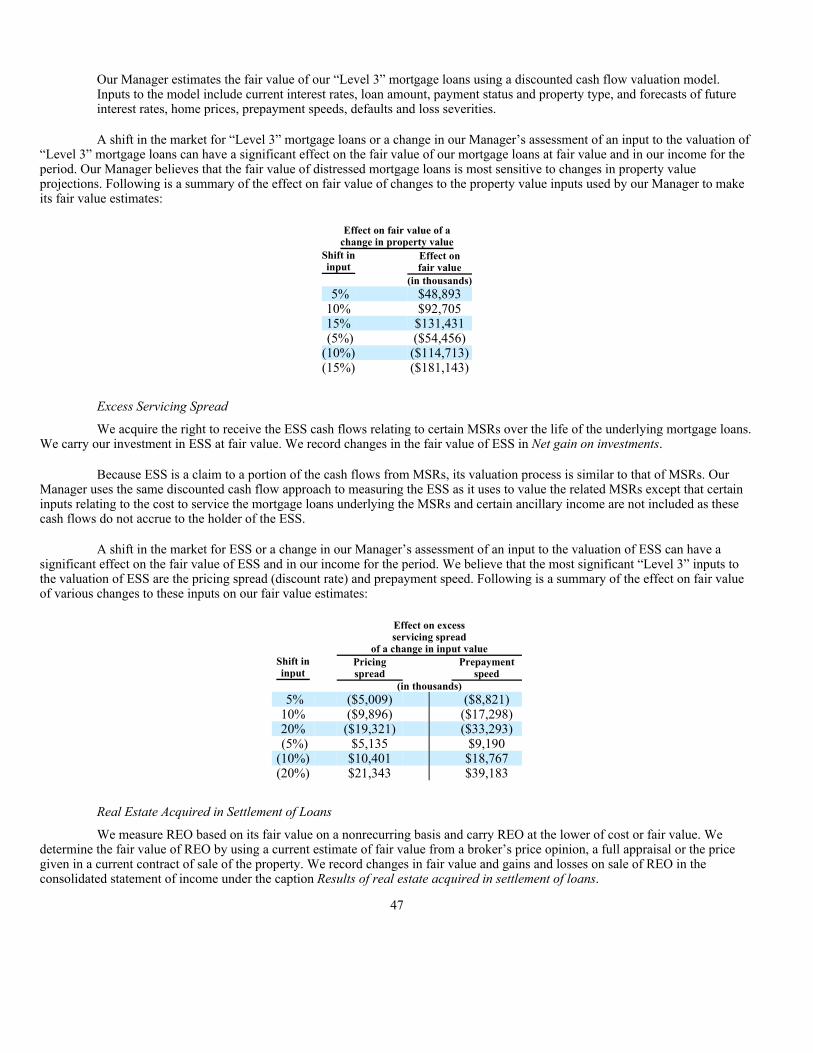
Our Manager estimates the fair value of our “Level 3” mortgage loans using a discounted cash flow valuation model. Inputs to the model include current interest rates, loan amount, payment status and property type, and forecasts of future interest rates, home prices, prepayment speeds, defaults and loss severities.
A shift in the market for “Level 3” mortgage loans or a change in our Manager’s assessment of an input to the valuation of “Level 3” mortgage loans can have a significant effect on the fair value of our mortgage loans at fair value and in our income for the period. Our Manager believes that the fair value of distressed mortgage loans is most sensitive to changes in property value projections. Following is a summary of the effect on fair value of changes to the property value inputs used by our Manager to make its fair value estimates:
Excess Servicing Spread
We acquire the right to receive the ESS cash flows relating to certain MSRs over the life of the underlying mortgage loans. We carry our investment in ESS at fair value. We record changes in the fair value of ESS in Net gain on investments.
Because ESS is a claim to a portion of the cash flows from MSRs, its valuation process is similar to that of MSRs. Our Manager uses the same discounted cash flow approach to measuring the ESS as it uses to value the related MSRs except that certain inputs relating to the cost to service the mortgage loans underlying the MSRs and certain ancillary income are not included as these cash flows do not accrue to the holder of the ESS.
A shift in the market for ESS or a change in our Manager’s assessment of an input to the valuation of ESS can have a significant effect on the fair value of ESS and in our income for the period. We believe that the most significant “Level 3” inputs to the valuation of ESS are the pricing spread (discount rate) and prepayment speed. Following is a summary of the effect on fair value of various changes to these inputs on our fair value estimates:
Real Estate Acquired in Settlement of Loans
We measure REO based on its fair value on a nonrecurring basis and carry REO at the lower of cost or fair value. We determine the fair value of REO by using a current estimate of fair value from a broker’s price opinion, a full appraisal or the price given in a current contract of sale of the property. We record changes in fair value and gains and losses on sale of REO in the consolidated statement of income under the caption Results of real estate acquired in settlement of loans.
47
Effect on fair value of a change in property value
Shift ininput
Effect onfair value
(in thousands) 5% $48,89310% $92,70515% $131,431 (5%) ($54,456)(10%) ($114,713)(15%) ($181,143)
Effect on excess servicing spread
of a change in input valueShift ininput
Pricingspread
Prepaymentspeed
(in thousands) 5% ($5,009) ($8,821)10% ($9,896) ($17,298)20% ($19,321) ($33,293)(5%) $5,135 $9,190
(10%) $10,401 $18,767(20%) $21,343 $39,183
Amortization, Impairment and Change in Fair value of MSRs
MSRs represent the value of a contract that obligates us to service the mortgage loans on behalf of the owner of the loan in exchange for servicing fees and the right to collect certain ancillary income from the borrower. We recognize MSRs at our estimate of the fair value of the contract to service the loans.
As economic fundamentals influencing the underlying mortgage loans change, our estimate of the fair value of the related MSR we retain will also change. As a result, we will record changes in fair value as a component of Net servicing fees for the MSRs we carry at fair value, and we may recognize changes in fair value relating to our MSRs carried at the lower of amortized cost or fair value depending on the relationship of the asset’s fair value to its carrying value at the measurement date.
After the initial recognition of MSRs, we account for such assets based on the class of MSRs: originated MSRs backed by mortgage loans with initial interest rates of less than or equal to 4.5%; and originated MSRs backed by mortgage loans with initial interest rates of more than 4.5%. Originated MSRs backed by mortgage loans with initial interest rates of less than or equal to 4.5% are accounted for using the amortization method. Originated MSRs backed by loans with initial interest rates of more than 4.5% are accounted for at fair value with changes in fair value recorded in current period income.
MSRs Accounted for Using the Amortization Method
We amortize MSRs accounted for using the amortization method. MSR amortization is determined by applying the ratio of the net MSR cash flows projected for the current period to the estimated total remaining net MSR cash flows. The estimated total net MSR cash flows are determined at the beginning of each month using prepayment inputs applicable at that time.
We also evaluate MSRs accounted for using the amortization method for impairment with reference to the assets’ fair value at the measurement date. Impairment occurs when the current fair value of the MSR falls below the asset’s amortized cost. If MSRs are impaired, the impairment is recognized in current period income and the carrying value of the MSRs is adjusted through a valuation allowance. If the value of impaired MSRs subsequently increases, we recognize the increase in value in current period income and, through a reduction in the valuation allowance, adjust the carrying value of the MSRs to a level not in excess of amortized cost.
When evaluating MSRs for impairment, we stratify the assets by predominant risk characteristic including loan type (fixed-rate or adjustable-rate) and note interest rate. We stratify fixed-rate loans into note interest rate pools of 50 basis points for note interest rates between 3.0% and 4.5% and a single pool for note interest rates below 3%. We evaluate adjustable-rate mortgage loans with initial interest rates of 4.5% or less in a single pool.
We periodically review the various impairment strata to determine whether the fair value of the impaired MSRs in a given stratum is likely to recover. When we conclude that recovery of the value is unlikely in the foreseeable future, a write-down of the cost of the MSRs for that stratum to its estimated recoverable value is charged to the valuation allowance.
Amortization and impairment of MSRs accounted for using the amortization method are included in current period income as a component of Net servicing fees.
MSRs Accounted for at Fair Value
We include changes in fair value of MSRs accounted for at fair value in current period income as a component of Net servicing fees.
A shift in the market for MSRs or a change in our Manager’s assessment of an input to the valuation of MSRs can have a significant effect on the fair value of MSRs and in our income for the period. We believe the most significant “Level 3” inputs to the valuation of MSRs are the pricing spread (discount rate), prepayment speed and annual per-loan cost of servicing. Following is a summary of the effect on fair value of various changes to these key inputs that our Manager uses in making its fair value estimates:
48

The preceding analyses hold constant all of the inputs other than the input that is being changed to show an estimate of the effect on fair value of a change in a specific input. We expect that in a market shock event, multiple inputs would be affected and the effects of these changes may compound or counteract each other. Furthermore, certain of our MSRs are accounted for using the amortization method and are carried at the lower of amortized cost or fair value. Such assets’ carrying value may not be immediately affected as a result of a change in input values depending on the carrying value of the MSR asset before the change in input occurs and whether the input change causes our estimate of fair value to change to a level below the amortized cost of those MSRs. Therefore the preceding analyses are not projections of the effects of a shock event or a change in our Manager’s estimate of an input and should not be relied upon as earnings projections.
Liability for Representations and Warranties
We record a provision for losses relating to our representations and warranties as part of our loan sale transactions. The method we use to estimate the liability for representations and warranties is a function of the representations and warranties given and considers a combination of factors, including, but not limited to, estimated future default and mortgage loan repurchase rates, the potential severity of loss in the event of default and the probability of reimbursement by the correspondent loan seller. We establish a liability at the time loans are sold and periodically update our liability estimate.
The level of the liability for representations and warranties is difficult to estimate and requires considerable management judgment. The level of mortgage loan repurchase losses is dependent on economic factors, investor demand strategies, and other external conditions that may change over the lives of the underlying loans. Our estimate of the liability for representations and warranties is developed by our Manager’s credit administration staff. The liability estimate is reviewed and approved by our Manager’s senior management credit committee which includes its chief operating, credit, portfolio risk, mortgage operations, correspondent production and shared services officers.
As economic fundamentals change, as investor and Agency evaluations of their loss mitigation strategies (including claims under representations and warranties) change and as the mortgage market and general economic conditions affect our correspondent lenders, the level of repurchase activity and ensuing losses will change and such changes may be material to us. As a result of these changes, we may be required to adjust the estimate of our liability for representations and warranties. Such adjustments may be material to our financial condition and net income.
Critical Accounting Policies Not Tied to Fair Value
Securitizations
We enter into various types of on- and off-balance sheet transactions with special purpose entities (“SPEs”), which are trusts that are established for a limited purpose. Generally, SPEs are formed in connection with securitization transactions. In a securitization transaction, we transfer mortgage loans on our balance sheet to an SPE, which then issues to investors various forms of interests in those assets. In a securitization transaction, we typically receive cash and/or interests in an SPE in exchange for the assets we transfer.
SPEs are generally considered variable interest entities (“VIEs”). A VIE is an entity having either a total equity investment that is insufficient to finance its activities without additional subordinated financial support or whose equity investors lack the ability to control the entity’s activities. Variable interests are investments or other interests that will absorb portions of a VIE’s expected losses or receive portions of the VIE’s expected residual returns. The primary beneficiary of a VIE is the party that has both the power to direct the activities that most significantly impact the VIE and a variable interest that could potentially be significant to the VIE.
49
Effect on fair value of MSRs of a change in input valueShift ininput
Pricing spread
Prepaymentspeed
Servicingcost
(in thousands)5% ($ 7,355) ($ 9,952) ($ 3,212)
10% ($14,497) ($ 19,526) ($ 6,424) 20% ($28,174) ($ 37,630) ($12,848) (5%) $ 7,577 $ 10,351 $ 3,212
(10%) $ 15,387 $ 21,126 $ 6,424 (20%) $ 31,741 $ 44,053 $ 12,848

When an SPE is a VIE, holders of variable interests in that entity must evaluate whether they are the VIE’s primary beneficiary. The primary beneficiary of a VIE must consolidate the assets and liabilities of the VIE onto its consolidated balance sheet. Therefore, the evaluation of a securitization as a VIE and our status as the VIE’s primary beneficiary can have a significant effect on our balance sheet.
We evaluate the securitization trust into which mortgage loans are sold to determine whether the entity is a VIE. To determine whether a variable interest we hold could potentially be significant to the VIE, we consider both qualitative and quantitative factors regarding the nature, size and form of our involvement with the VIE. We assess whether we are the primary beneficiary of a VIE on an ongoing basis.
For financial reporting purposes, the underlying mortgage loans and securities owned by the consolidated VIE are shown under Mortgage loans at fair value on our consolidated balance sheets. The securities issued to third parties by the consolidated VIE are classified as secured borrowings and shown as Asset-backed financing of a variable interest entity at fair value on our consolidated balance sheets. We include the interest earned on the loans held by the VIE in Interest income and interest attributable to the asset-backed securities issued by the VIE in Interest expense in our consolidated income statements.
Forward Purchase Agreements
We have entered into transactions where we agree to purchase identified pools of mortgage loans and REO at a later date while assuming all of the responsibilities for servicing the mortgage loans and the risks and rewards relating to holding such mortgageloans as of a cutoff date that is before the mortgage loans and REO are purchased. Such transactions are referred to as forward purchase agreements. Under forward purchase agreements, the assets are held by the seller of the assets within a separate trust entity deemed a VIE.
Our interests in the assets subject to the forward purchase agreement are deemed to be contractually segregated from all other interests in the trust. When assets are contractually segregated, they are often referred to as a “silo.” For these transactions, the silo consists of the assets subject to the forward purchase agreement and our obligation to purchase the mortgage loans and REO. We direct all of the activities that drive the economic results of the assets subject to the forward purchase agreement. All of the changes in the fair value and cash flows of the assets subject to the forward purchase agreement are attributable solely to us, and such cash flows can only be used to settle the obligation to purchase the assets until the obligation has been settled.
The assets subject to forward purchase agreements are included in our notes to the consolidated financial statements as Real estate acquired in settlement of loans under forward purchase agreements and the related liabilities are included as Borrowings under forward purchase agreements.
Income Taxes
We have elected to be taxed as a REIT and we believe that we comply with the provisions of the Internal Revenue Code applicable to REITs. Accordingly, we believe that we will not be subject to federal income tax on that portion of our REIT taxable income that is distributed to shareholders as long as certain asset, income and share ownership tests are met. If we fail to qualify as a REIT, and do not qualify for certain statutory relief provisions, we will be subject to income taxes and may be precluded from qualifying as a REIT for the four tax years following the year of loss of our REIT qualification.
Our TRS is subject to federal and state income taxes. Income taxes are provided for using the asset and liability method. Deferred tax assets and liabilities are recognized for the future tax consequences attributable to differences between the financial statement carrying amounts of existing assets and liabilities and their respective tax bases. Deferred tax assets and liabilities are measured using enacted rates expected to apply to taxable income in the years in which we expect those temporary differences to be recovered or settled.
The effect on deferred taxes of a change in tax rates is recognized in income in the period in which the change occurs. A valuation allowance is established if, in our judgment, realization of deferred tax assets is not more likely than not.
We recognize tax benefits relating to tax positions we take only if it is more likely than not that the position will be sustained upon examination by the appropriate taxing authority. A tax position that meets this standard is recognized as the largest amount that exceeds 50 percent likelihood of being realized upon settlement. We will classify any penalties and interest as a component of income tax expense.
50
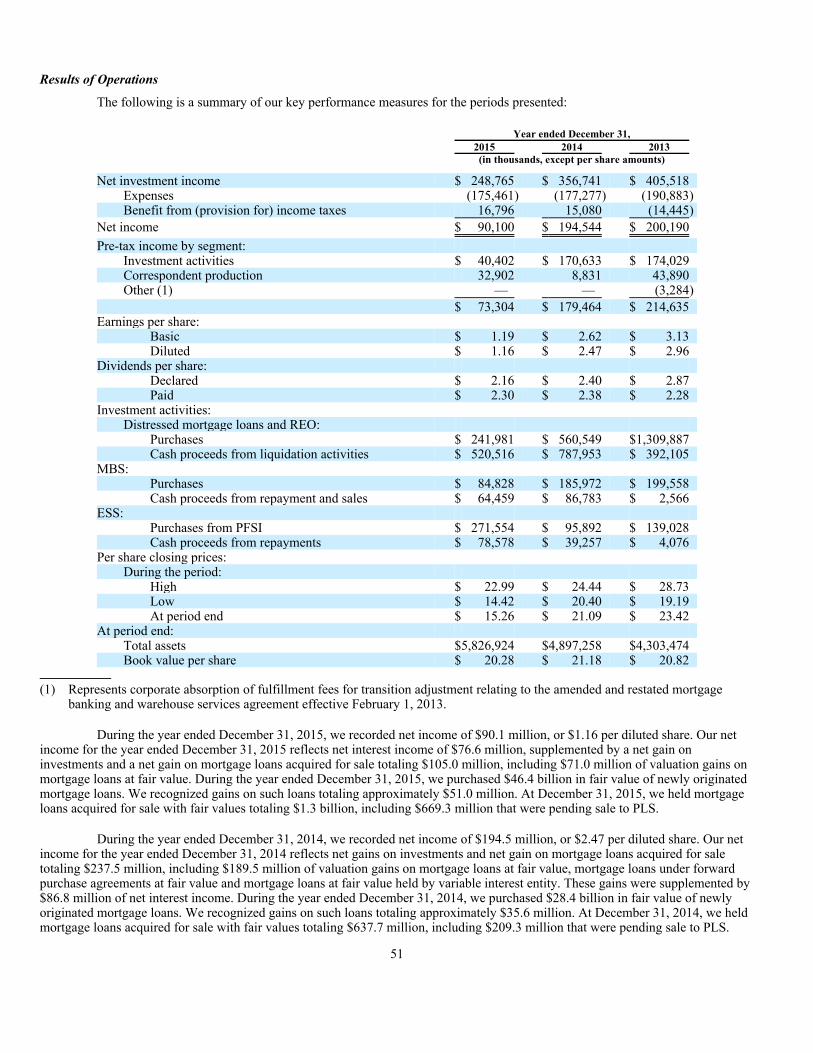
Results of Operations
The following is a summary of our key performance measures for the periods presented:
During the year ended December 31, 2015, we recorded net income of $90.1 million, or $1.16 per diluted share. Our net income for the year ended December 31, 2015 reflects net interest income of $76.6 million, supplemented by a net gain on investments and a net gain on mortgage loans acquired for sale totaling $105.0 million, including $71.0 million of valuation gains on mortgage loans at fair value. During the year ended December 31, 2015, we purchased $46.4 billion in fair value of newly originated mortgage loans. We recognized gains on such loans totaling approximately $51.0 million. At December 31, 2015, we held mortgage loans acquired for sale with fair values totaling $1.3 billion, including $669.3 million that were pending sale to PLS.
During the year ended December 31, 2014, we recorded net income of $194.5 million, or $2.47 per diluted share. Our net income for the year ended December 31, 2014 reflects net gains on investments and net gain on mortgage loans acquired for sale totaling $237.5 million, including $189.5 million of valuation gains on mortgage loans at fair value, mortgage loans under forward purchase agreements at fair value and mortgage loans at fair value held by variable interest entity. These gains were supplemented by $86.8 million of net interest income. During the year ended December 31, 2014, we purchased $28.4 billion in fair value of newly originated mortgage loans. We recognized gains on such loans totaling approximately $35.6 million. At December 31, 2014, we held mortgage loans acquired for sale with fair values totaling $637.7 million, including $209.3 million that were pending sale to PLS.
51
Year ended December 31, 2015 2014 2013 (in thousands, except per share amounts)
Net investment income $ 248,765 $ 356,741 $ 405,518 Expenses (175,461) (177,277) (190,883) Benefit from (provision for) income taxes 16,796 15,080 (14,445)
Net income $ 90,100 $ 194,544 $ 200,190
Pre-tax income by segment: Investment activities $ 40,402 $ 170,633 $ 174,029 Correspondent production 32,902 8,831 43,890 Other (1) — — (3,284)
$ 73,304 $ 179,464 $ 214,635 Earnings per share:
Basic $ 1.19 $ 2.62 $ 3.13 Diluted $ 1.16 $ 2.47 $ 2.96
Dividends per share: Declared $ 2.16 $ 2.40 $ 2.87 Paid $ 2.30 $ 2.38 $ 2.28
Investment activities: Distressed mortgage loans and REO:
Purchases $ 241,981 $ 560,549 $1,309,887 Cash proceeds from liquidation activities $ 520,516 $ 787,953 $ 392,105
MBS: Purchases $ 84,828 $ 185,972 $ 199,558 Cash proceeds from repayment and sales $ 64,459 $ 86,783 $ 2,566
ESS: Purchases from PFSI $ 271,554 $ 95,892 $ 139,028 Cash proceeds from repayments $ 78,578 $ 39,257 $ 4,076
Per share closing prices: During the period:
High $ 22.99 $ 24.44 $ 28.73 Low $ 14.42 $ 20.40 $ 19.19 At period end $ 15.26 $ 21.09 $ 23.42
At period end: Total assets $5,826,924 $4,897,258 $4,303,474 Book value per share $ 20.28 $ 21.18 $ 20.82
(1) Represents corporate absorption of fulfillment fees for transition adjustment relating to the amended and restated mortgage
banking and warehouse services agreement effective February 1, 2013.

During the year ended December 31, 2013, we recorded net income of $200.2 million or $2.96 per diluted share. Our net income for the year ended December 31, 2013 reflects net gains on investments and net gain on mortgage loans acquired for sale totaling $306.4 million, including $181.0 million of valuation gains on mortgage loans at fair value, mortgage loans under forward purchase agreements at fair value and mortgage loans at fair value held by variable interest entity. These gains were supplemented by $57.6 million of net interest income. During the year ended December 31, 2013, we purchased $32.0 billion in fair value of newly originated mortgage loans. We recognized gains on such loans totaling approximately $98.7 million. At December 31, 2013, we held mortgage loans acquired for sale with fair values totaling $458.1 million, including $112.4 million that were pending sale to PLS.
Our net income decreased during 2015 as compared to 2014 primarily due to a decrease in pretax income in our investment activities segment of $130.2 million, or 76%, from $170.6 million to $40.4 million. During 2015, we recognized net investment income totaling $148.8 million from our investment activities, a decrease of $145.9 million, or 50%, from $294.7 million during 2014. Our average investment portfolio was approximately $3.4 billion during 2015, an increase of $258.5 million, or 8%, over 2014.
In our correspondent production activities, our net investment income increased during 2015 compared to 2014 by $37.9 million, or 61%, from $62.1 million to $100.0 million. We received proceeds of $14.2 billion from the sale of mortgage loans to nonaffiliates and issued $15.7 billion of IRLCs relating to Agency and jumbo mortgage loans during 2015, an increase of $3.6 billion, or 30%, from 2014. We sold approximately 21% more loans to nonaffiliates, as measured by UPB, during the year ended December 30, 2015 as compared to the same period in 2014. Our net gain on mortgage loans acquired for sale increased due to both the increase in mortgage loan volume and higher margins partially driven by optimization of outlets and delivery methods.
Our net income decreased during 2014 as compared to 2013 due to decreased profitability in both our correspondent production and investment activities segments. Our correspondent production segment’s pre-tax income decreased by $35.1 million or 80%. We purchased $11.9 billion at fair value of mortgage loans for sale to nonaffiliates, a 26% decrease from $15.9 billion during 2013. The decrease in fair value of loans we purchased was compounded by reduced gain on sale margins in 2014 as compared to 2013, owing to increased competition resulting from a smaller mortgage market in 2014 as compared to 2013.
In our investment activities segment, our pre-tax income decreased by $3.4 million from $174.0 million to $170.6 million during 2014 as compared to 2013. Our average investment portfolio was approximately $2.9 billion during 2014, an increase of $1.1 billion, or 63%, over 2013 and during 2014, we recognized net investment income totaling approximately $294.7 million, an increase of $12.5 million, or 4%, over 2013. The increase in net investment income was offset by increased loan servicing expenses to accommodate the growth in our investment portfolio and activity-based fees relating to the increase in loan resolution activities.
Net Investment Income
During 2015, we recorded net investment income of $248.8 million, comprised primarily of $76.6 million of net interest income, $54.0 million of net gain on investments, $51.0 million of net gain on mortgage loans acquired for sale, $49.3 million of net loan servicing fees, and $28.7 million of loan origination fees, partially offset by $19.2 million of losses from results of REO. During 2014, we recorded net investment income of $356.7 million, comprised primarily of net gain on investments of $201.8 million, supplemented by $86.8 million of net interest income, $37.9 million of net loan servicing fees, net gain on mortgage loans acquired for sale of $35.6 million, and $18.2 million of loan origination fees, partially offset by $32.5 million of losses from results of REO. During 2013, we recorded net investment income of $405.5 million, comprised primarily of net gain on investments of $207.8 million, supplemented by net gain on mortgage loans acquired for sale of $98.7 million, $57.6 million of net interest income, $32.8 million of net loan servicing fees, and $17.8 million of loan origination fees, partially offset by $13.5 million of losses from results of REO.
Net investment income includes non-cash fair value adjustments. Because we have elected to record our financial assets (comprised of mortgage loans at fair value, mortgage loans acquired for sale at fair value, MBS and ESS), a portion of our MSRs and our asset-backed financing at fair value, a substantial portion of the income we record with respect to such assets and liabilities results from non-cash changes in fair value. Net investment income also includes non-cash fair value adjustments related to IRLCs and the related derivatives we use to hedge our investments and liabilities and non-cash interest income arising from capitalization of delinquent interest on mortgage loans upon completion of the modification of such loans and accrual of unearned discounts relating to mortgage loans held in a VIE.
52

The amounts of non-cash fair value and interest income are as follows:
Cash is generated when mortgage loan investments are monetized through payoffs or sales, when payments of principal and interest occur on such loans, generally after they are modified, or when the property securing a mortgage loan that has been settled through acquisition of the property securing the mortgage loan has been sold. We receive proceeds on the sale of mortgage loans acquired for sale that include both cash and our estimate of the fair value of MSRs and we recognize a liability for potential losses relating to representations and warranties created in the loan sales transactions. Cash flows relating to hedging instruments are generally produced when the instruments mature or when we effectively cancel the transactions through an offsetting trade.
The following table illustrates the net gain in value that we accumulated over the period during which we owned the liquidated mortgage loan investments and REO, as compared to the proceeds actually received and the additional net gain realized upon liquidation of such assets:
53
Year ended December 31, 2015 2014 2013 (in thousands)
Net interest income Capitalization of interest pursuant to mortgage loan
modifications $ 57,754 $ 66,850 $ 43,481 Accrual of unearned discounts and amortization of premiums on
MBS, mortgage loans and asset-backed financing 719 1,588 186
58,473 68,438 43,667
Net gain on mortgage loans acquired for sale Mortgage loans acquired for sale (2,977) 3,825 (9,265) IRLCs (1,015) 4,412 (18,230) Hedging derivatives 961 (11,518) 9,552
(3,031) (3,281) (17,943)
Net gain (loss) on investments Mortgage-backed securities:
Agency (3,431) 9,118 365 Non Agency (1,793) 1,298 —
Mortgage loans: at fair value 70,988 189,073 173,178 at fair value held in a variable interest entity (10,663) 27,768 (6,301) at fair value under forward purchase agreements — 463 10,093
Excess servicing spread 3,239 (20,834) 2,423 CRT Agreements (1,238) — — Asset-backed financing of VIEs 4,260 (8,459) 2,279
61,362 198,427 182,037 Net loan servicing fees - MSR valuation adjustments (2,917) (16,546) 6,308
$113,887 $247,038 $214,069
Net investment income $248,765 $356,741 $405,518 Non-cash items as a percentage of net investment income 46% 69% 53%
Year ended December 31, 2015 2014 2013
Proceeds Accumulated
gains (2)Gain on
liquidation (3) ProceedsAccumulated
gains (2)Gain on
liquidation (3) Proceeds Accumulated
gains (2) Gain on
liquidation (3) (in thousands)Mortgage
loans (1) $216,904 $ 22,953 $ 10,176 $598,121 $ 108,576 $ 25,948 $270,529 $ 34,855 $ 28,387 REO 240,833 3,026 21,254 189,832 11,936 13,804 121,576 7,653 10,526
$457,737 $ 25,979 $ 31,430 $787,953 $ 120,512 $ 39,752 $392,105 $ 42,508 $ 38,913
(1) For the year ended December 31, 2014, the amounts include sales of reperforming loans with loan sale proceeds of $330.8 million, accumulated gains of $77.3 million, and gain on liquidation of $4.7 million, respectively.
(2) Represents valuation gains and losses recognized during the period we held the respective asset but excludes the gain or loss recorded upon sale or repayment of the respective asset.
(3) Represents the gain or loss recognized upon sale or repayment of the respective asset.

The amounts included in accumulated gains and gains on liquidation do not include the cost of managing the liquidated assets which may be substantial depending on the collection status of the mortgage loan at acquisition and on our success in working with the borrower to resolve the distress in the loan. Accumulated gains include the amount of accumulated valuation gains and losses recognized throughout the holding period and, in the case of REO, include estimated direct transaction costs to be incurred in the sale of the property. Accordingly, the preceding amounts do not represent periodic earnings on a cash basis and the amount of gain will have accumulated over varying periods depending on the holding periods and liquidation speed for individual assets.
The primary expenses incurred at a loan level in managing our portfolio of distressed assets are servicing and activity fees. From the time of acquisition of the distressed assets through their deboarding dates, we incurred servicing and activity fees of $17.3 million, $17.6 million and $11.4 million for assets liquidated during the years ended December 31, 2015, 2014 and 2013, respectively.
The reduction in net investment income during 2015, as compared to 2014, was caused primarily by reduced gains on mortgage loans at fair value due to continuing moderation in the appreciation in real estate values during 2015 compared to 2014 as well as reduced loan modification activity owing to reduced levels of portfolio acquisitions during 2015 as compared to 2014, partially offset by an increased net gain on the sale of mortgage loans acquired for sale, net mortgage loan servicing fees and an increase in net gain on ESS and asset-backed financing which reflects the effects of increasing mortgage interest rates throughout 2015.
The reduction in net investment income during 2014 as compared to 2013 was caused primarily by reduced gains on mortgage loans acquired for sale as a result of the increased competition for a smaller mortgage loan market in 2014 as compared to 2013, along with losses recognized on our investment in ESS and asset-backed financing which reflects the effects of decreasing mortgage interest rates throughout 2014. These reductions were partially offset by an increase in gain on mortgage loans at fair value resulting from a 49% increase in the average balance of mortgage loans at fair value accompanied by slower appreciation in the fair value of such mortgage loans during 2014 as compared to 2013.
54
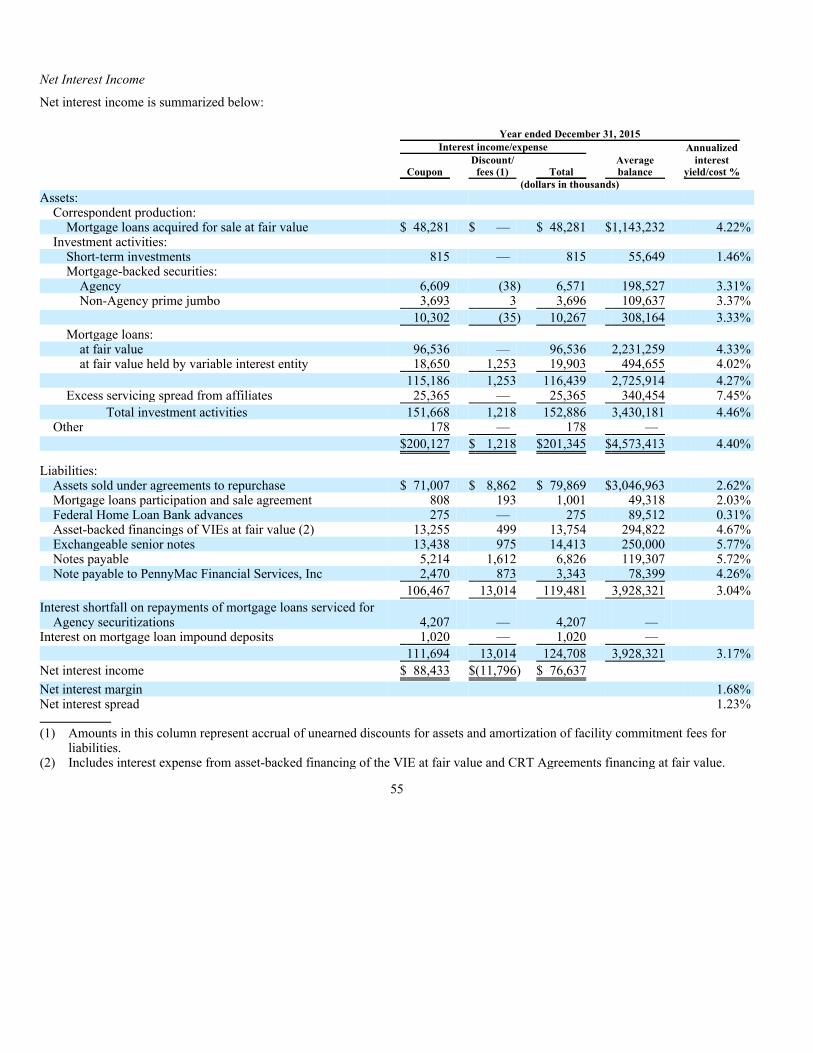
Net Interest Income
Net interest income is summarized below:
55
Year ended December 31, 2015 Interest income/expense Annualized
Coupon Discount/
Total Average interest
fees (1) balance yield/cost % (dollars in thousands)Assets:
Correspondent production: Mortgage loans acquired for sale at fair value $ 48,281 $ — $ 48,281 $1,143,232 4.22%
Investment activities: Short-term investments 815 — 815 55,649 1.46% Mortgage-backed securities:
Agency 6,609 (38) 6,571 198,527 3.31% Non-Agency prime jumbo 3,693 3 3,696 109,637 3.37%
10,302 (35) 10,267 308,164 3.33%
Mortgage loans: at fair value 96,536 — 96,536 2,231,259 4.33% at fair value held by variable interest entity 18,650 1,253 19,903 494,655 4.02%
115,186 1,253 116,439 2,725,914 4.27% Excess servicing spread from affiliates 25,365 — 25,365 340,454 7.45%
Total investment activities 151,668 1,218 152,886 3,430,181 4.46% Other 178 — 178 —
$200,127 $ 1,218 $201,345 $4,573,413 4.40%
Liabilities: Assets sold under agreements to repurchase $ 71,007 $ 8,862 $ 79,869 $3,046,963 2.62% Mortgage loans participation and sale agreement 808 193 1,001 49,318 2.03% Federal Home Loan Bank advances 275 — 275 89,512 0.31% Asset-backed financings of VIEs at fair value (2) 13,255 499 13,754 294,822 4.67% Exchangeable senior notes 13,438 975 14,413 250,000 5.77% Notes payable 5,214 1,612 6,826 119,307 5.72% Note payable to PennyMac Financial Services, Inc 2,470 873 3,343 78,399 4.26%
106,467 13,014 119,481 3,928,321 3.04%
Interest shortfall on repayments of mortgage loans serviced for Agency securitizations 4,207 — 4,207 —
Interest on mortgage loan impound deposits 1,020 — 1,020 —
111,694 13,014 124,708 3,928,321 3.17%
Net interest income $ 88,433 $(11,796) $ 76,637
Net interest margin 1.68% Net interest spread 1.23%
(1) Amounts in this column represent accrual of unearned discounts for assets and amortization of facility commitment fees for liabilities.
(2) Includes interest expense from asset-backed financing of the VIE at fair value and CRT Agreements financing at fair value.
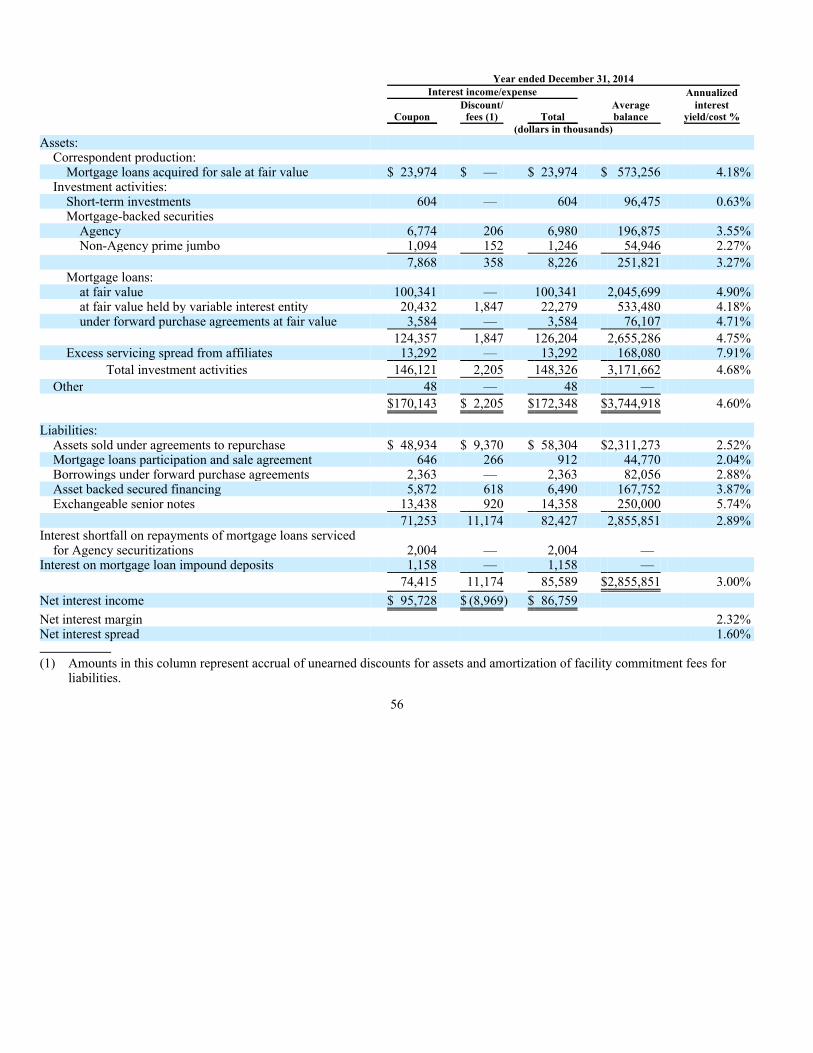
56
Year ended December 31, 2014 Interest income/expense Annualized
Coupon Discount/
Total Average interest
fees (1) balance yield/cost % (dollars in thousands)Assets:
Correspondent production: Mortgage loans acquired for sale at fair value $ 23,974 $ — $ 23,974 $ 573,256 4.18%
Investment activities: Short-term investments 604 — 604 96,475 0.63% Mortgage-backed securities
Agency 6,774 206 6,980 196,875 3.55% Non-Agency prime jumbo 1,094 152 1,246 54,946 2.27%
7,868 358 8,226 251,821 3.27% Mortgage loans:
at fair value 100,341 — 100,341 2,045,699 4.90% at fair value held by variable interest entity 20,432 1,847 22,279 533,480 4.18% under forward purchase agreements at fair value 3,584 — 3,584 76,107 4.71%
124,357 1,847 126,204 2,655,286 4.75% Excess servicing spread from affiliates 13,292 — 13,292 168,080 7.91%
Total investment activities 146,121 2,205 148,326 3,171,662 4.68%
Other 48 — 48 —
$170,143 $ 2,205 $172,348 $3,744,918 4.60%
Liabilities: Assets sold under agreements to repurchase $ 48,934 $ 9,370 $ 58,304 $2,311,273 2.52% Mortgage loans participation and sale agreement 646 266 912 44,770 2.04% Borrowings under forward purchase agreements 2,363 — 2,363 82,056 2.88% Asset backed secured financing 5,872 618 6,490 167,752 3.87% Exchangeable senior notes 13,438 920 14,358 250,000 5.74%
71,253 11,174 82,427 2,855,851 2.89% Interest shortfall on repayments of mortgage loans serviced
for Agency securitizations 2,004 — 2,004 — Interest on mortgage loan impound deposits 1,158 — 1,158 —
74,415 11,174 85,589 $2,855,851 3.00%
Net interest income $ 95,728 $ (8,969) $ 86,759
Net interest margin 2.32% Net interest spread 1.60% (1) Amounts in this column represent accrual of unearned discounts for assets and amortization of facility commitment fees for
liabilities.

57
Year ended December 31, 2013 Interest income/expense Annualized
Discount/
Total Average interest
Coupon fees (1) balance yield/cost % (dollars in thousands)Assets:
Correspondent production: Mortgage loans acquired for sale at fair value $ 33,726 $ — $ 33,726 $ 899,971 3.75%
Investment activities: Short-term investments 542 — 542 92,148 0.59% Agency mortgage-backed securities 2,092 46 2,138 63,280 3.38% Agency debt security 222 — 222 2,992 7.42% Mortgage loans:
at fair value 75,759 — 75,759 1,537,644 4.93% at fair value held by variable interest entity 5,284 232 5,516 135,667 4.07% under forward purchase agreements at fair value 3,659 — 3,659 123,222 2.97%
84,702 232 84,934 1,796,533 4.73% Excess servicing spread from affiliates 1,091 — 1,091 16,070 6.79%
Total investment activities 88,649 278 88,927 1,971,023 4.51%
Other 209 — 209 —
$122,584 $ 278 $122,862 $2,870,994 4.28%
Liabilities: Assets sold under agreements to repurchase $ 37,781 $ 10,009 $ 47,790 $1,552,912 3.08% Borrowings under forward purchase agreements 3,707 — 3,707 124,394 2.98% Asset backed secured financing 1,612 — 1,612 43,108 3.74% Exchangeable senior notes 8,996 584 9,580 168,493 5.69%
52,096 10,593 62,689 1,888,907 3.32% Interest shortfall on repayments of mortgage loans serviced for
Agency securitizations 1,694 — 1,694 — Interest on mortgage loan impound deposits 839 — 839 —
54,629 10,593 65,222 $1,888,907 3.45%
Net interest income $ 67,955 $(10,315) $ 57,640
Net interest margin 2.01% Net interest spread 0.83%
(1) Amounts in this column represent accrual of unearned discounts for assets and amortization of facility commitment fees for liabilities.

The effects of changes in the composition of our investments on our interest income are summarized below:
In the year ended December 31, 2015, we earned net interest income of $76.6 million compared to $86.8 million for the year ended December 31, 2014 and $57.6 million for the year ended December 31, 2013. The decrease in net interest income between the years was primarily due to a reduction in interest capitalized pursuant to mortgage loan modifications compounded by the addition of higher-cost borrowings in the form of ESS financing obtained through a note payable to Penny Mac Financial Services, Inc.
We earned interest income on our portfolio of MBS totaling $10.3 million for a yield of 3.33% for the year ended December 31, 2015 as compared to interest income of $8.2 million and a yield of 3.27% for the year ended December 31, 2014. We accumulated this portfolio of securities beginning late in the third quarter of 2013 and earned a yield of 3.37% during the portion of the year in which we held the securities.
During the year ended December 31, 2015, we recognized interest income on mortgage loans at fair value and mortgage loans at fair value held by VIEs totaling $116.4 million, including $57.8 million of interest capitalized pursuant to loan modifications, which compares to $126.2 million, including $66.9 million of interest capitalized pursuant to loan modifications in the year ended December 31, 2014. The decrease in interest income was due primarily to reductions in yields on our investments from 4.75% during 2014 to 4.27% during 2015 primarily due to a reduction in interest capitalized as a result of mortgage loan modifications. Capitalized interest contributed 2.12% to our interest yield during 2015 compared to 2.22% during 2014. The decrease in interest income, along with a decrease in the average mortgage note interest rate of our performing mortgage loans from 3.68% during 2014 to 3.43% during 2015, resulted in a decrease in the yield on our mortgage loans at fair value.
58
Year ended December 31, 2015vs.
Year ended December 31, 2014
Year ended December 31, 2014vs.
Year ended December 31, 2013
Increase (decrease)due to changes in
Increase (decrease)due to changes in
Total Total Rate Volume change Rate Volume change (in thousands)Assets: Correspondent production:
Mortgage loans acquired for sale at fair value $ 238 $24,069 $ 24,307 $ 3,318 $(13,070) $ (9,752) Investment activities:
Short-term investments 549 (338) 211 36 26 62 Agency debt security — — — — (222) (222) Mortgage-backed securities:
Agency (467) 58 (409) 111 4,731 4,842 Non-Agency prime jumbo 804 1,646 2,450 — 1,246 1,246
337 1,704 2,041 111 5,977 6,088 Mortgage loans:
at fair value (12,440) 8,635 (3,805) (339) 24,921 24,582 at fair value held by variable interest entity (2,215) (161) (2,376) 154 16,609 16,763 under forward purchase agreements at fair value — (3,584) (3,584) 1,648 (1,723) (75)
Total mortgage loans (14,655) 4,890 (9,765) 1,463 39,807 41,270 ESS - affiliates (812) 12,885 12,073 209 11,992 12,201
Total investment activities (14,581) 19,141 4,560 1,819 57,580 59,399 Other interest — 130 130 — (161) (161)
(14,343) 43,340 28,997 5,137 44,349 49,486
Liabilities: Assets sold under agreements to repurchase 4,528 17,037 21,565 (5,655) 16,169 10,514 Mortgage loan participation and sale agreement (3) 92 89 — 912 912 Federal Home Loan Bank advances — 275 275 — — — Asset backed secured financing of VIEs at fair value 1,552 5,712 7,264 58 4,820 4,878 Borrowings under forward purchase agreement — (2,363) (2,363) (121) (1,223) (1,344) Exchangeable senior notes 55 — 55 98 4,680 4,778 Notes payable — 6,826 6,826 — — — Note payable to Penny Mac Financial Services, Inc. — 3,343 3,343 — — — Interest shortfall on repayments of mortgage loans serviced for Agency
securitizations — 2,203 2,203 — 310 310 Interest on mortgage loan impound deposits — (138) (138) — 319 319
6,132 32,987 39,119 (5,620) 25,987 20,367
Net interest income $(20,475) $10,353 $(10,122) $10,757 $ 18,362 $29,119

At December 31, 2015, approximately 58% of the fair value of our distressed mortgage loan portfolio was nonperforming, as compared to 70% at December 31, 2014. We do not accrue interest on nonperforming mortgage loans and generally do not recognize revenues during the period we hold REO. We calculate the yield on our mortgage loan portfolio based on the portfolio’s average fair value, which most closely reflects our investment in the mortgage loans. Accordingly, the yield we realize is substantially higher than would be recorded based on the mortgage loans’ UPBs as we typically purchase our mortgage loans at substantial discounts to their UPB.
Nonperforming mortgage loans and REO generally take longer to generate cash flow than performing mortgage loans due to the time required to work with borrowers to resolve payment issues through our modification programs and to acquire and liquidatethe property securing the mortgage loans. The value and returns we realize from these assets are determined by our ability to assist borrowers in curing defaults, or when curing of borrower defaults is not a viable solution, by our ability to effectively manage the liquidation process. As a participant in HAMP, we are required to comply with the process specified by the HAMP program before liquidating a mortgage loan, and this may extend the resolution process. At December 31, 2015, we held $1.2 billion in fair value of nonperforming mortgage loans and $341.8 million in carrying value of REO compared to $1.5 billion in fair value of nonperforming mortgage loans and $303.2 million in carrying value of REO at December 31, 2014.
During the year ended December 31, 2015, we incurred interest expense totaling $124.7 million as compared to $85.6 million and $65.2 million during the years ended December 31, 2014 and 2013, respectively. Our interest cost on interest bearing liabilities was 3.04% for the year ended December 31, 2015 and 2.89% and 3.32% for the years ended December 31, 2014 and 2013, respectively. The increase in interest expense reflects our increased use of borrowings in support of growth of our balance sheet as well as higher cost borrowings used to fund our investment in MSRs and ESS.
59

Net Gains on Mortgage Loans Acquired for Sale
Our gains on mortgage loans acquired for sale are summarized below:
Our net gain on mortgage loans acquired for sale includes both cash and non-cash elements. We receive proceeds on sale that include both cash and our estimate of the fair value of MSRs. We also recognize a liability for potential losses relating to representations and warranties created in the loan sales transactions.
The increase in gain on mortgage loans acquired for sale during 2015 as compared to 2014 is due to an increase in the volume of mortgage loans sold to nonaffiliates compounded by higher margins partially driven by optimization of outlets and delivery methods.
The decrease in gain on mortgage loans acquired for sale during 2014 as compared to 2013 reflects the continuing shrinkage of the mortgage market that began in the second half of 2013 and continued throughout most of 2014. As a result of the smaller mortgage market, we purchased fewer mortgage loans and realized reduced gain on sale margins owing to the increased competition for such loans during 2014 as compared to 2013.
Provision for Losses on Representations and Warranties
We provide for our estimate of the future losses that we may be required to incur as a result of our breach of representations and warranties to the purchasers of the mortgage loans we sell. Our agreements with the Agencies include representations and warranties related to the mortgage loans we sell to the Agencies. The representations and warranties require adherence to Agency origination and underwriting guidelines, including but not limited to the validity of the lien securing the mortgage loan, property eligibility, borrower credit, income and asset requirements, and compliance with applicable federal, state and local law.
60
Year ended December 31, 2015 2014 2013 (in thousands)Cash (loss) gain:
Mortgage loans $ (76,914) $ (20,989) $ (197,580) Hedging activities (17,742) (57,161) 136,829
(94,656) (78,150) (60,751)
Non cash gain: Receipt of MSRs in loan sale transactions 154,474 121,333 183,032 Provision for losses relating to representations and warranties
provided in loan sales (5,771) (4,255) (5,669) Change in fair value during the year of financial instruments
held at year end: IRLCs (1,015) 4,412 (18,230) Mortgage loans (2,977) 3,825 (9,265) Hedging derivatives 961 (11,518) 9,552
(3,031) (3,281) (17,943)
$ 51,016 $ 35,647 $ 98,669
Interest rate lock commitments issued during the year: Loans acquired for sale to nonaffiliates:
Conventional mortgage loans $15,550,788 $11,610,381 $13,998,344 Jumbo loans 156,895 512,853 238,096
15,707,683 12,123,234 14,236,440 Mortgage loans sold to PFSI:
Government-insured or guaranteed mortgage loans 32,430,379 15,692,230 14,731,463
$48,138,062 $27,815,464 $28,967,903
Purchases of mortgage loans acquired for sale to nonaffiliates: At fair value $14,478,602 $11,858,198 $15,941,369 UPB $14,014,603 $11,476,448 $15,616,687
Fair value of mortgage loans acquired for sale held at year end: Conventional mortgage loans $ 596,673 $ 428,397 $ 345,777 Government-insured or guaranteed mortgage loans acquired
for sale to PFSI 672,532 209,325 112,360 Commercial mortgage loans 14,590 — —
$ 1,283,795 $ 637,722 $ 458,137
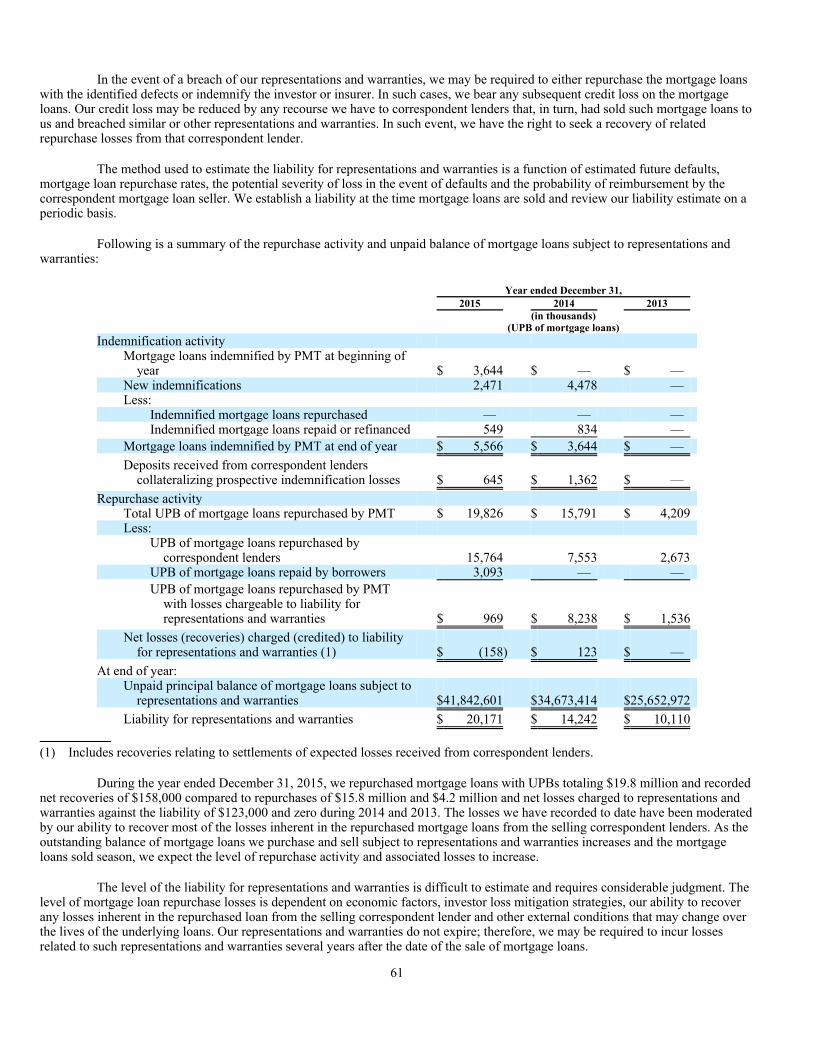
In the event of a breach of our representations and warranties, we may be required to either repurchase the mortgage loans with the identified defects or indemnify the investor or insurer. In such cases, we bear any subsequent credit loss on the mortgage loans. Our credit loss may be reduced by any recourse we have to correspondent lenders that, in turn, had sold such mortgage loans to us and breached similar or other representations and warranties. In such event, we have the right to seek a recovery of related repurchase losses from that correspondent lender.
The method used to estimate the liability for representations and warranties is a function of estimated future defaults, mortgage loan repurchase rates, the potential severity of loss in the event of defaults and the probability of reimbursement by the correspondent mortgage loan seller. We establish a liability at the time mortgage loans are sold and review our liability estimate on a periodic basis.
Following is a summary of the repurchase activity and unpaid balance of mortgage loans subject to representations and warranties:
During the year ended December 31, 2015, we repurchased mortgage loans with UPBs totaling $19.8 million and recorded net recoveries of $158,000 compared to repurchases of $15.8 million and $4.2 million and net losses charged to representations and warranties against the liability of $123,000 and zero during 2014 and 2013. The losses we have recorded to date have been moderated by our ability to recover most of the losses inherent in the repurchased mortgage loans from the selling correspondent lenders. As the outstanding balance of mortgage loans we purchase and sell subject to representations and warranties increases and the mortgage loans sold season, we expect the level of repurchase activity and associated losses to increase.
The level of the liability for representations and warranties is difficult to estimate and requires considerable judgment. The level of mortgage loan repurchase losses is dependent on economic factors, investor loss mitigation strategies, our ability to recover any losses inherent in the repurchased loan from the selling correspondent lender and other external conditions that may change over the lives of the underlying loans. Our representations and warranties do not expire; therefore, we may be required to incur losses related to such representations and warranties several years after the date of the sale of mortgage loans.
61
Year ended December 31, 2015 2014 2013 (in thousands) (UPB of mortgage loans)Indemnification activity
Mortgage loans indemnified by PMT at beginning of year $ 3,644 $ — $ —
New indemnifications 2,471 4,478 — Less:
Indemnified mortgage loans repurchased — — — Indemnified mortgage loans repaid or refinanced 549 834 —
Mortgage loans indemnified by PMT at end of year $ 5,566 $ 3,644 $ —
Deposits received from correspondent lenders collateralizing prospective indemnification losses $ 645 $ 1,362 $ —
Repurchase activity Total UPB of mortgage loans repurchased by PMT $ 19,826 $ 15,791 $ 4,209 Less:
UPB of mortgage loans repurchased by correspondent lenders 15,764 7,553 2,673
UPB of mortgage loans repaid by borrowers 3,093 — —
UPB of mortgage loans repurchased by PMT with losses chargeable to liability for representations and warranties $ 969 $ 8,238 $ 1,536
Net losses (recoveries) charged (credited) to liability for representations and warranties (1) $ (158) $ 123 $ —
At end of year: Unpaid principal balance of mortgage loans subject to
representations and warranties $41,842,601 $34,673,414 $25,652,972
Liability for representations and warranties $ 20,171 $ 14,242 $ 10,110
(1) Includes recoveries relating to settlements of expected losses received from correspondent lenders.
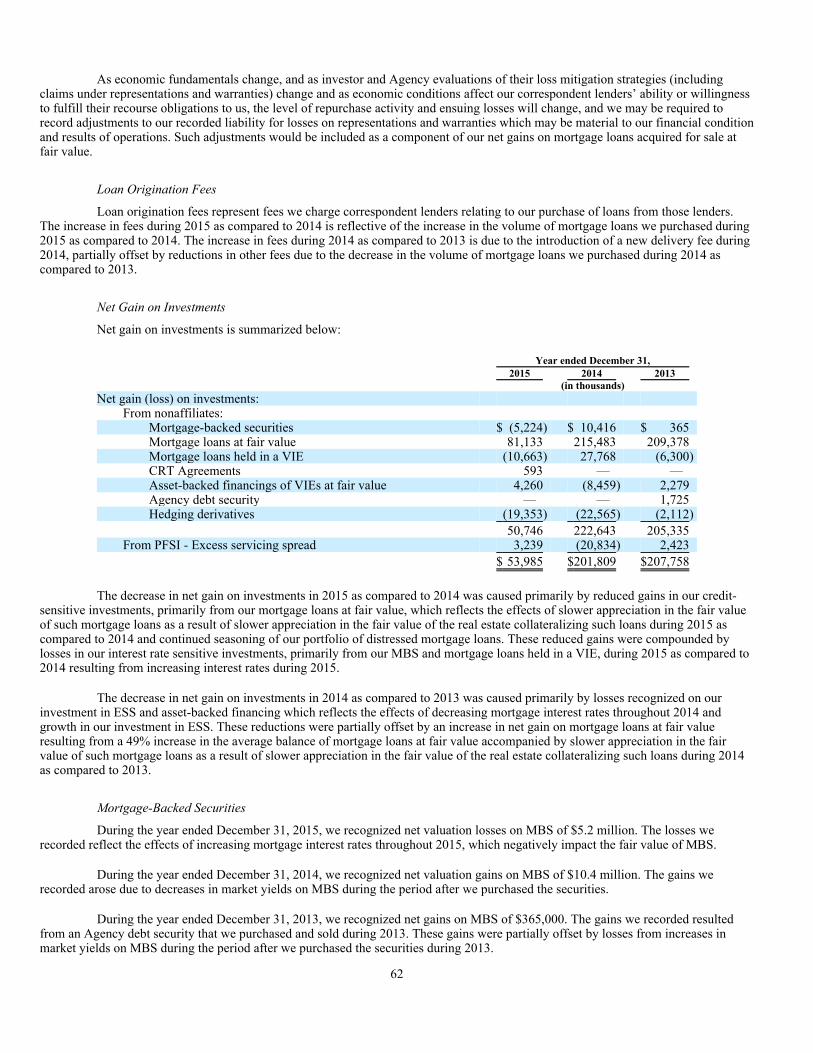
As economic fundamentals change, and as investor and Agency evaluations of their loss mitigation strategies (including claims under representations and warranties) change and as economic conditions affect our correspondent lenders’ ability or willingness to fulfill their recourse obligations to us, the level of repurchase activity and ensuing losses will change, and we may be required to record adjustments to our recorded liability for losses on representations and warranties which may be material to our financial condition and results of operations. Such adjustments would be included as a component of our net gains on mortgage loans acquired for sale at fair value.
Loan Origination Fees
Loan origination fees represent fees we charge correspondent lenders relating to our purchase of loans from those lenders. The increase in fees during 2015 as compared to 2014 is reflective of the increase in the volume of mortgage loans we purchased during 2015 as compared to 2014. The increase in fees during 2014 as compared to 2013 is due to the introduction of a new delivery fee during 2014, partially offset by reductions in other fees due to the decrease in the volume of mortgage loans we purchased during 2014 as compared to 2013.
Net Gain on Investments
Net gain on investments is summarized below:
The decrease in net gain on investments in 2015 as compared to 2014 was caused primarily by reduced gains in our credit-sensitive investments, primarily from our mortgage loans at fair value, which reflects the effects of slower appreciation in the fair value of such mortgage loans as a result of slower appreciation in the fair value of the real estate collateralizing such loans during 2015 as compared to 2014 and continued seasoning of our portfolio of distressed mortgage loans. These reduced gains were compounded by losses in our interest rate sensitive investments, primarily from our MBS and mortgage loans held in a VIE, during 2015 as compared to 2014 resulting from increasing interest rates during 2015.
The decrease in net gain on investments in 2014 as compared to 2013 was caused primarily by losses recognized on our investment in ESS and asset-backed financing which reflects the effects of decreasing mortgage interest rates throughout 2014 and growth in our investment in ESS. These reductions were partially offset by an increase in net gain on mortgage loans at fair value resulting from a 49% increase in the average balance of mortgage loans at fair value accompanied by slower appreciation in the fair value of such mortgage loans as a result of slower appreciation in the fair value of the real estate collateralizing such loans during 2014 as compared to 2013.
Mortgage-Backed Securities
During the year ended December 31, 2015, we recognized net valuation losses on MBS of $5.2 million. The losses we recorded reflect the effects of increasing mortgage interest rates throughout 2015, which negatively impact the fair value of MBS.
During the year ended December 31, 2014, we recognized net valuation gains on MBS of $10.4 million. The gains we recorded arose due to decreases in market yields on MBS during the period after we purchased the securities.
During the year ended December 31, 2013, we recognized net gains on MBS of $365,000. The gains we recorded resulted from an Agency debt security that we purchased and sold during 2013. These gains were partially offset by losses from increases in market yields on MBS during the period after we purchased the securities during 2013.
62
Year ended December 31, 2015 2014 2013 (in thousands) Net gain (loss) on investments:
From nonaffiliates: Mortgage-backed securities $ (5,224) $ 10,416 $ 365 Mortgage loans at fair value 81,133 215,483 209,378 Mortgage loans held in a VIE (10,663) 27,768 (6,300) CRT Agreements 593 — — Asset-backed financings of VIEs at fair value 4,260 (8,459) 2,279 Agency debt security — — 1,725 Hedging derivatives (19,353) (22,565) (2,112)
50,746 222,643 205,335 From PFSI - Excess servicing spread 3,239 (20,834) 2,423
$ 53,985 $201,809 $207,758

ESS Purchased from PFSI
We recognized fair value gains relating to our investment in ESS totaling $3.2 million for the year ended December 31, 2015 compared to valuation losses of $20.8 million for the year ended December 31, 2014. Mortgage interest rates increased throughout 2015 causing our estimate of future prepayments to decrease as compared to 2014, resulting in an increase in fair value. The effect of this increase in fair value was compounded by growth in our investment in ESS. Our average investment in ESS increased from $168.1 million for the year ended December 31, 2014 to $340.5 million for the year ended December 31, 2015.
Mortgage Loans at Fair Value
Net gains on mortgage loans at fair value and mortgage loans under forward purchase agreements at fair value are summarized below:
Because we have elected to record our mortgage loans and mortgage loans under forward purchase agreements at fair value, a substantial portion of the income we record with respect to such loans results from changes in fair value. Valuation changes amounted to $71.0 million, $189.5 million and $181.0 million in the years ended December 31, 2015, 2014 and 2013, respectively. Cash is generated when mortgage loans and mortgage loans under forward purchase agreements are monetized through payoffs or sales, when payments of principal and interest occur on such loans, generally after they are modified, or when the property securing a mortgage loan that has been settled through acquisition of the property has been sold.
The valuation changes on performing loans reflect the effects of capitalization of delinquent interest on loans we modify. When we capitalize interest in a loan modification, we increase the carrying value of the loan. However, the modification generally may not result in an immediate increase in the loan’s fair value. As a result, the interest income we recognize is generally offset by a valuation loss. Valuation gains on mortgage loans with capitalized interest generally accrue as the borrower demonstrates performance in the periods following the capitalization. During the year ended December 31, 2015, we capitalized interest totaling $57.8 million compared to $66.9 million for the year ended December 31, 2014 and $43.5 million for the year ended December 31, 2013.
During 2015, our gains from performing mortgage loans decreased. Fewer of our nonperforming loans were modified, resulting in reduced gains on such mortgage loans. Implementing long-term, sustainable loan modification is one means by which we endeavor to increase the fair value of the distressed mortgage loans which we have typically purchased at discounts to their UPB.
Gains on nonperforming mortgage loans decreased during 2015 as compared to 2014. During 2015, the rate of appreciation in the residential real estate market was similar to 2014. However, as our investment in such assets season, an increasing portion of the mortgage loans remaining in our investment portfolio are progressing to resolution at a slower rate than was experienced in 2014.
During the years ended December 31, 2015, 2014 and 2013, we recognized gains on mortgage loan payoffs as summarized below:
63
Year ended December 31, 2015 2014 2013 (in thousands)Valuation changes:
Performing loans $ 19,850 $ 67,035 $ 37,566 Nonperforming loans 51,138 122,500 143,425
70,988 189,535 180,991 Gain on payoffs 10,224 22,166 28,387 Gain (loss) on sales (79) 3,782 —
$ 81,133 $ 215,483 $ 209,378
Average portfolio balance $2,231,259 $2,121,806 $1,660,866
Year ended December 31, 2015 2014 2013 (dollars in thousands)Number of loans 871 1,135 1,343 Unpaid principal balance $219,754 $310,422 $355,766 Gain recognized at payoff $ 10,224 $ 22,166 $ 28,387

Gains on sales of distressed mortgage loans are summarized below:
We recognize valuation gains to reflect the commitment price of the mortgage loans subject to the mortgage loan sale at the time we enter into the commitment to sell such loans. Therefore, the gain recognized on sale of mortgage loans reflects the difference between proceeds from sale of the mortgage loans and the commitment price of sale.
During the year ended December 31, 2014, we received proceeds of $330.8 million from the sale of $393.6 million in unpaid principal balance of mortgage loans. There can be no assurance that this form of monetization will continue to be a reliable means of liquidating reperforming mortgage assets in the future. We continue to monitor and explore the market for mortgage loan sales or securitizations backed by reperforming and modified mortgage loans as a means of recovering our investment in such mortgage loans in the future.
Absent sale or securitization of reperforming and modified mortgage loans, and unlike liquidation of a defaulted mortgage loan, we expect that recovery of our investment in a performing modified mortgage loan will take place generally over a period of several years, during which we earn and collect interest income on such loan. Our current expectation is that we will receive cash on modified mortgage loans through monthly borrower payments, incentive payments earned pursuant to HAMP, payoffs or acquisition of the property securing the loans and liquidation of the property in the event the borrower subsequently defaults. Due to the recent addition of new modification programs, both through HAMP and proprietary programs, trends in default performance are difficult to discern.
Large-scale refinancing of modified mortgage loans is not expected to occur for an extended period. Borrowers who have recently modified their mortgage loans typically have credit profiles that do not qualify them for refinancing or have loans on properties whose loan-to-value ratios exceed current underwriting guidelines for new mortgage loans. Further, modified mortgage loans require a period of acceptable borrower performance, generally 12 months of timely mortgage payments, for consideration in most Agency refinance programs.
Certain programs such as the FHA’s Negative Equity Refinance Program allow homeowners whose modified mortgage amount exceeds the value of the property securing the loan to refinance immediately following a modification. We continue to explore methods of accelerating recovery of our investment of modified mortgage loans through solicitations of refinancings of such loans into Agency-eligible loans which result in a full or partial repayment of our investment.
64
Year ended December 31, 2015 2014 2013 (dollars in thousands)Number of loans 37 1,682 — Unpaid principal balance $5,843 $393,609 $— (Loss) gain recognized at sale $ (79) $ 3,782 $—
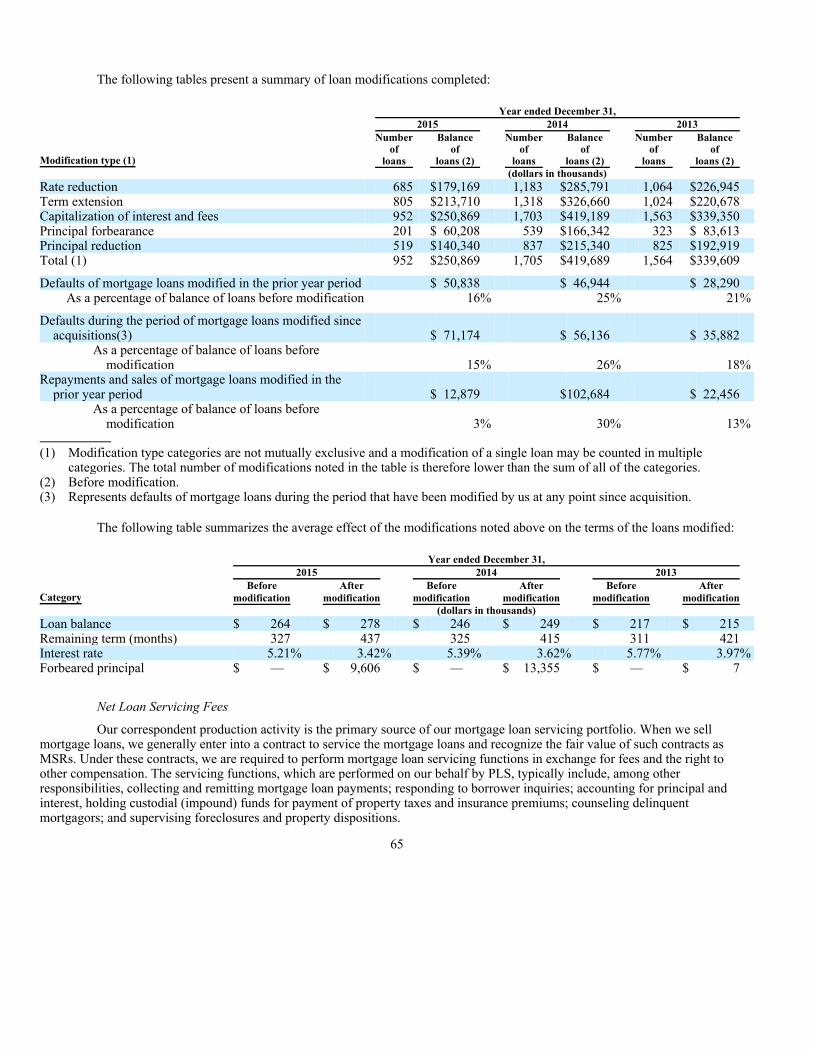
The following tables present a summary of loan modifications completed:
The following table summarizes the average effect of the modifications noted above on the terms of the loans modified:
Net Loan Servicing Fees
Our correspondent production activity is the primary source of our mortgage loan servicing portfolio. When we sell mortgage loans, we generally enter into a contract to service the mortgage loans and recognize the fair value of such contracts as MSRs. Under these contracts, we are required to perform mortgage loan servicing functions in exchange for fees and the right to other compensation. The servicing functions, which are performed on our behalf by PLS, typically include, among other responsibilities, collecting and remitting mortgage loan payments; responding to borrower inquiries; accounting for principal and interest, holding custodial (impound) funds for payment of property taxes and insurance premiums; counseling delinquent mortgagors; and supervising foreclosures and property dispositions.
65
Year ended December 31, 2015 2014 2013
Modification type (1)
Numberof
loans
Balanceof
loans (2)
Numberof
loans
Balance of
loans (2)
Numberof
loans
Balanceof
loans (2) (dollars in thousands)Rate reduction 685 $179,169 1,183 $285,791 1,064 $226,945 Term extension 805 $213,710 1,318 $326,660 1,024 $220,678 Capitalization of interest and fees 952 $250,869 1,703 $419,189 1,563 $339,350 Principal forbearance 201 $ 60,208 539 $166,342 323 $ 83,613 Principal reduction 519 $140,340 837 $215,340 825 $192,919 Total (1) 952 $250,869 1,705 $419,689 1,564 $339,609
Defaults of mortgage loans modified in the prior year period $ 50,838 $ 46,944 $ 28,290 As a percentage of balance of loans before modification 16% 25% 21%
Defaults during the period of mortgage loans modified since acquisitions(3) $ 71,174 $ 56,136 $ 35,882
As a percentage of balance of loans before modification 15% 26% 18%
Repayments and sales of mortgage loans modified in the prior year period $ 12,879 $102,684 $ 22,456
As a percentage of balance of loans before modification 3% 30% 13%
(1) Modification type categories are not mutually exclusive and a modification of a single loan may be counted in multiple categories. The total number of modifications noted in the table is therefore lower than the sum of all of the categories.
(2) Before modification. (3) Represents defaults of mortgage loans during the period that have been modified by us at any point since acquisition.
Year ended December 31, 2015 2014 2013 Before After Before After Before AfterCategory modification modification modification modification modification modification (dollars in thousands)Loan balance $ 264 $ 278 $ 246 $ 249 $ 217 $ 215 Remaining term (months) 327 437 325 415 311 421 Interest rate 5.21% 3.42% 5.39% 3.62% 5.77% 3.97% Forbeared principal $ — $ 9,606 $ — $ 13,355 $ — $ 7

Net loan servicing fees are summarized below:
Net loan servicing fees increased $11.4 million, or 30%, during 2015, as compared to 2014. The increase was primarily due to a $22.1 million, or 28%, increase in servicing fees, offset by an $11.5 million increase in the effect of MSRs on net loan servicing fees. The increase in servicing fees is attributable to a 25% increase in our average servicing portfolio. The increase in the effect of MSRs on net loan servicing fees was primarily a result of amortization and change in fair value from the realization of cash flows resulting from growth in our average servicing portfolios, partially offset by a reduction in the provision for impairment as a result of the effect of increasing interest rates on the expected life of the mortgage loans subject to MSRs.
Net loan servicing fees increased $5.1 million during 2014, as compared to 2013. The increase was primarily due to a $25.3 million, or 46%, increase in servicing fees, offset by a $19.5 million increase in the effect of MSRs on net loan servicing fees. The increase in servicing fees is attributable to a 44% increase in our average servicing portfolio. The increase in provision for impairment and change in fair value net of hedging gains during 2014 as compared to 2013 reflects the different interest rate environments between the years. During 2014, interest rates were generally decreasing, whereas during most of 2013, interest rates were increasing. Decreasing interest rates generally encourage increased refinancing activity which negatively affects the life and therefore value of MSRs, while increasing interest rates generally discourage refinancing activity.
We have entered into an MSR recapture agreement that requires PLS to transfer to us the MSRs with respect to new mortgage loans originated in refinancing transactions where PLS refinances a mortgage loan for which we previously held the MSRs. PLS is generally required to transfer MSRs relating to such mortgage loans (or, under certain circumstances, other mortgage loans) that have an aggregate unpaid principal balance that is not less than 30% of the aggregate unpaid principal balance of all the loans so originated. Where the fair value of the aggregate MSRs to be transferred for the applicable month is less than $200,000, PLS may, at its option, settle in cash with us in an amount equal to such fair market value in place of transferring such MSRs. We recognized MSR recapture income during 2015 of $787,000 compared to $9,000 during 2014 and $709,000 during 2013.
Amortization, impairment and changes in fair value of MSRs have a significant effect on net loan servicing fees, driven primarily by our monthly re-estimation of the fair value of MSRs. As our investment in MSRs grows, we expect that the effect of amortization, impairment and changes in fair value will have an increasing influence on our net income.
We account for MSRs at either our estimate of the asset’s fair value with changes in fair value recorded in current period earnings or using the amortization method with the MSRs carried at the lower of estimated amortized cost or fair value based on the class of MSR. We have identified two classes of MSRs: originated MSRs backed by mortgage loans with initial interest rates of less than or equal to 4.5%; and MSRs backed by mortgage loans with initial interest rates of more than 4.5%. Our subsequent accounting for MSRs is based on the class of MSRs. Originated MSRs backed by mortgage loans with initial interest rates of less than or equal to 4.5% are accounted for using the amortization method. Originated MSRs backed by mortgage loans with initial interest rates of more than 4.5% are accounted for at fair value with changes in fair value recorded in current period income.
66
Year ended December 31, 2015 2014 2013 (in thousands) Servicing fees (1) $ 102,147 $ 80,008 $ 54,724 MSR recapture fee receivable from PFSI 787 9 709 Effect of MSRs:
Carried at lower of amortized cost or fair value Amortization (43,982) (31,911) (26,241) (Provision for) reversal of impairment (3,229) (5,138) 4,970 Gain on sale 187 46 —
Carried at fair value – change in fair value (7,072) (16,648) 616 Gains (losses) on hedging derivatives 481 11,527 (1,987)
(53,615) (42,124) (22,642)
Net loan servicing fees $ 49,319 $ 37,893 $ 32,791
Average servicing portfolio $38,450,379 $30,720,168 $19,634,411
(1) Includes contractually specified servicing and ancillary fees.

Our MSRs are summarized by the basis on which we account for the assets below:
Results of Real Estate Acquired in Settlement of Loans
Results of REO includes the gains or losses we record upon sale of the properties as well as valuation adjustments we record during the period we hold those properties. During the years ended December 31, 2015, 2014 and 2013, we recorded net losses of $19.2 million, $32.5 million and $13.5 million, respectively, in Results of real estate acquired in settlement of loans.
Results of REO are summarized below:
The decrease in losses from REOs during 2015 as compared to 2014 was due to the recognition of a larger gain realized on the sale of the properties and lower downward valuation adjustments due to better execution of REO property sales versus original estimates and less unfavorable estimates of home values during the REO holding period. The increase in valuation adjustments in 2014 as compared to 2013 reflects the growth in our average investment in REO. We recognize valuation losses on properties where decreases in fair value are indicated but are generally unable to record fair value increases until the date of sale of properties.
67
December 31,
2015December 31,
2014 (in thousands) MSRs carried at fair value $ 66,584 $ 57,358
MSR carried at lower of amortized cost or fair value: Amortized cost $ 404,101 $ 308,137 Valuation allowance (10,944) (7,715)
Carrying value $ 393,157 $ 300,422
Fair value $ 424,154 $ 322,230
Total MSR: Carrying value $ 459,741 $ 357,780
Fair value $ 490,738 $ 379,588
Unpaid principal balance of mortgage loans underlying MSRs $42,300,338 $34,285,473
Average servicing fee rate (in basis points) MSRs carried at lower of amortized cost or fair value 26 26 MSRs carried at fair value 25 25
Average note interest rate MSRs carried at lower of amortized cost or fair value 3.90% 3.80% MSRs carried at fair value 4.73% 4.78%
Year ended December 31 2015 2014 2013 (dollars in thousands) During the year:
Proceeds from sales of REO $240,833 $189,832 $121,576 Results of real estate acquired in settlement of loans: Valuation adjustments, net (40,432) (46,255) (24,114) Gain on sale, net 21,255 13,804 10,623
$ (19,177) $ (32,451) $ (13,491)
Number of properties sold 1,773 1,837 1,105 Average carrying value of REO $329,342 $232,691 $ 99,972
Year end: Carrying value $341,846 $303,228 $148,080 Number of properties in inventory 1,618 1,706 1,069
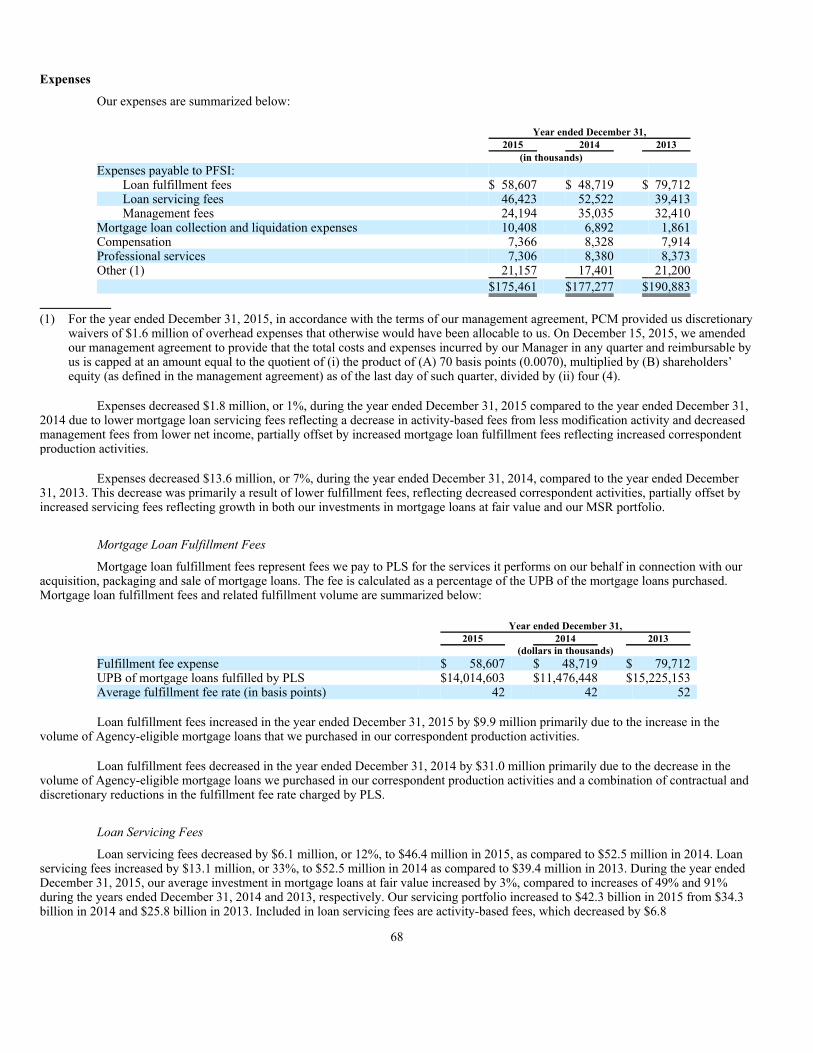
Expenses
Our expenses are summarized below:
Expenses decreased $1.8 million, or 1%, during the year ended December 31, 2015 compared to the year ended December 31, 2014 due to lower mortgage loan servicing fees reflecting a decrease in activity-based fees from less modification activity and decreased management fees from lower net income, partially offset by increased mortgage loan fulfillment fees reflecting increased correspondent production activities.
Expenses decreased $13.6 million, or 7%, during the year ended December 31, 2014, compared to the year ended December 31, 2013. This decrease was primarily a result of lower fulfillment fees, reflecting decreased correspondent activities, partially offset by increased servicing fees reflecting growth in both our investments in mortgage loans at fair value and our MSR portfolio.
Mortgage Loan Fulfillment Fees
Mortgage loan fulfillment fees represent fees we pay to PLS for the services it performs on our behalf in connection with our acquisition, packaging and sale of mortgage loans. The fee is calculated as a percentage of the UPB of the mortgage loans purchased. Mortgage loan fulfillment fees and related fulfillment volume are summarized below:
Loan fulfillment fees increased in the year ended December 31, 2015 by $9.9 million primarily due to the increase in the volume of Agency-eligible mortgage loans that we purchased in our correspondent production activities.
Loan fulfillment fees decreased in the year ended December 31, 2014 by $31.0 million primarily due to the decrease in the volume of Agency-eligible mortgage loans we purchased in our correspondent production activities and a combination of contractual and discretionary reductions in the fulfillment fee rate charged by PLS.
Loan Servicing Fees
Loan servicing fees decreased by $6.1 million, or 12%, to $46.4 million in 2015, as compared to $52.5 million in 2014. Loan servicing fees increased by $13.1 million, or 33%, to $52.5 million in 2014 as compared to $39.4 million in 2013. During the year ended December 31, 2015, our average investment in mortgage loans at fair value increased by 3%, compared to increases of 49% and 91% during the years ended December 31, 2014 and 2013, respectively. Our servicing portfolio increased to $42.3 billion in 2015 from $34.3 billion in 2014 and $25.8 billion in 2013. Included in loan servicing fees are activity-based fees, which decreased by $6.8
68
Year ended December 31, 2015 2014 2013 (in thousands) Expenses payable to PFSI:
Loan fulfillment fees $ 58,607 $ 48,719 $ 79,712 Loan servicing fees 46,423 52,522 39,413 Management fees 24,194 35,035 32,410
Mortgage loan collection and liquidation expenses 10,408 6,892 1,861 Compensation 7,366 8,328 7,914 Professional services 7,306 8,380 8,373 Other (1) 21,157 17,401 21,200
$175,461 $177,277 $190,883
(1) For the year ended December 31, 2015, in accordance with the terms of our management agreement, PCM provided us discretionary waivers of $1.6 million of overhead expenses that otherwise would have been allocable to us. On December 15, 2015, we amended our management agreement to provide that the total costs and expenses incurred by our Manager in any quarter and reimbursable by us is capped at an amount equal to the quotient of (i) the product of (A) 70 basis points (0.0070), multiplied by (B) shareholders’ equity (as defined in the management agreement) as of the last day of such quarter, divided by (ii) four (4).
Year ended December 31, 2015 2014 2013 (dollars in thousands)Fulfillment fee expense $ 58,607 $ 48,719 $ 79,712 UPB of mortgage loans fulfilled by PLS $14,014,603 $11,476,448 $15,225,153 Average fulfillment fee rate (in basis points) 42 42 52
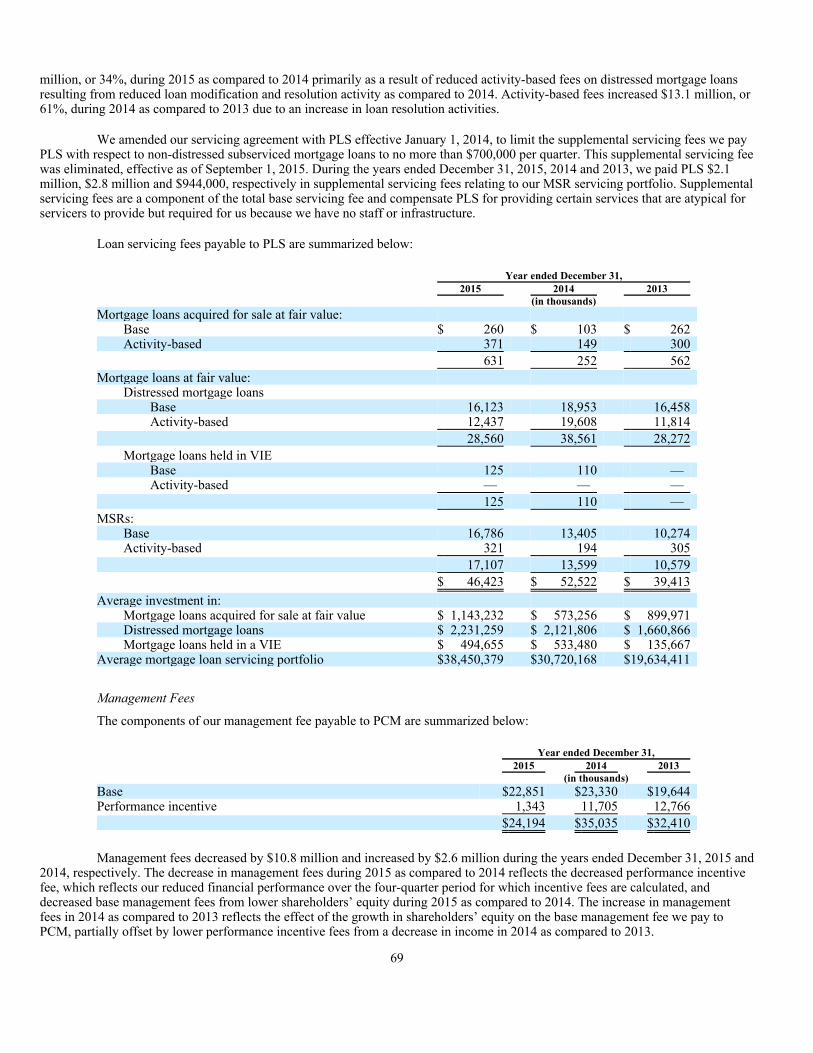
million, or 34%, during 2015 as compared to 2014 primarily as a result of reduced activity-based fees on distressed mortgage loans resulting from reduced loan modification and resolution activity as compared to 2014. Activity-based fees increased $13.1 million, or 61%, during 2014 as compared to 2013 due to an increase in loan resolution activities.
We amended our servicing agreement with PLS effective January 1, 2014, to limit the supplemental servicing fees we pay PLS with respect to non-distressed subserviced mortgage loans to no more than $700,000 per quarter. This supplemental servicing fee was eliminated, effective as of September 1, 2015. During the years ended December 31, 2015, 2014 and 2013, we paid PLS $2.1 million, $2.8 million and $944,000, respectively in supplemental servicing fees relating to our MSR servicing portfolio. Supplemental servicing fees are a component of the total base servicing fee and compensate PLS for providing certain services that are atypical for servicers to provide but required for us because we have no staff or infrastructure.
Loan servicing fees payable to PLS are summarized below:
Management Fees
The components of our management fee payable to PCM are summarized below:
Management fees decreased by $10.8 million and increased by $2.6 million during the years ended December 31, 2015 and 2014, respectively. The decrease in management fees during 2015 as compared to 2014 reflects the decreased performance incentive fee, which reflects our reduced financial performance over the four-quarter period for which incentive fees are calculated, and decreased base management fees from lower shareholders’ equity during 2015 as compared to 2014. The increase in management fees in 2014 as compared to 2013 reflects the effect of the growth in shareholders’ equity on the base management fee we pay to PCM, partially offset by lower performance incentive fees from a decrease in income in 2014 as compared to 2013.
69
Year ended December 31, 2015 2014 2013 (in thousands)Mortgage loans acquired for sale at fair value:
Base $ 260 $ 103 $ 262 Activity-based 371 149 300
631 252 562
Mortgage loans at fair value: Distressed mortgage loans
Base 16,123 18,953 16,458 Activity-based 12,437 19,608 11,814
28,560 38,561 28,272
Mortgage loans held in VIE Base 125 110 — Activity-based — — —
125 110 —
MSRs: Base 16,786 13,405 10,274 Activity-based 321 194 305
17,107 13,599 10,579
$ 46,423 $ 52,522 $ 39,413
Average investment in: Mortgage loans acquired for sale at fair value $ 1,143,232 $ 573,256 $ 899,971 Distressed mortgage loans $ 2,231,259 $ 2,121,806 $ 1,660,866 Mortgage loans held in a VIE $ 494,655 $ 533,480 $ 135,667
Average mortgage loan servicing portfolio $38,450,379 $30,720,168 $19,634,411
Year ended December 31, 2015 2014 2013 (in thousands)Base $22,851 $23,330 $19,644 Performance incentive 1,343 11,705 12,766
$24,194 $35,035 $32,410
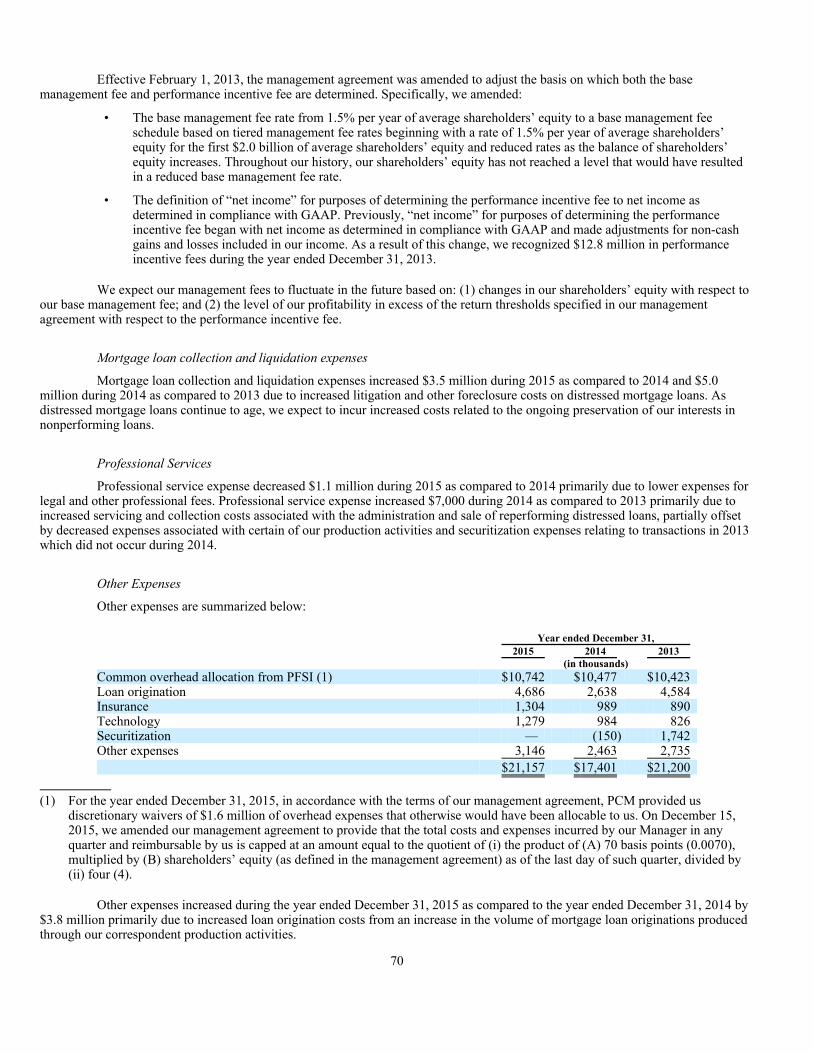
Effective February 1, 2013, the management agreement was amended to adjust the basis on which both the base management fee and performance incentive fee are determined. Specifically, we amended:
We expect our management fees to fluctuate in the future based on: (1) changes in our shareholders’ equity with respect to our base management fee; and (2) the level of our profitability in excess of the return thresholds specified in our management agreement with respect to the performance incentive fee.
Mortgage loan collection and liquidation expenses
Mortgage loan collection and liquidation expenses increased $3.5 million during 2015 as compared to 2014 and $5.0 million during 2014 as compared to 2013 due to increased litigation and other foreclosure costs on distressed mortgage loans. As distressed mortgage loans continue to age, we expect to incur increased costs related to the ongoing preservation of our interests in nonperforming loans.
Professional Services
Professional service expense decreased $1.1 million during 2015 as compared to 2014 primarily due to lower expenses for legal and other professional fees. Professional service expense increased $7,000 during 2014 as compared to 2013 primarily due to increased servicing and collection costs associated with the administration and sale of reperforming distressed loans, partially offset by decreased expenses associated with certain of our production activities and securitization expenses relating to transactions in 2013 which did not occur during 2014.
Other Expenses
Other expenses are summarized below:
Other expenses increased during the year ended December 31, 2015 as compared to the year ended December 31, 2014 by $3.8 million primarily due to increased loan origination costs from an increase in the volume of mortgage loan originations produced through our correspondent production activities.
70
• The base management fee rate from 1.5% per year of average shareholders’ equity to a base management fee schedule based on tiered management fee rates beginning with a rate of 1.5% per year of average shareholders’ equity for the first $2.0 billion of average shareholders’ equity and reduced rates as the balance of shareholders’ equity increases. Throughout our history, our shareholders’ equity has not reached a level that would have resulted in a reduced base management fee rate.
• The definition of “net income” for purposes of determining the performance incentive fee to net income as determined in compliance with GAAP. Previously, “net income” for purposes of determining the performance incentive fee began with net income as determined in compliance with GAAP and made adjustments for non-cash gains and losses included in our income. As a result of this change, we recognized $12.8 million in performance incentive fees during the year ended December 31, 2013.
Year ended December 31, 2015 2014 2013 (in thousands)Common overhead allocation from PFSI (1) $10,742 $10,477 $10,423 Loan origination 4,686 2,638 4,584 Insurance 1,304 989 890 Technology 1,279 984 826 Securitization — (150) 1,742 Other expenses 3,146 2,463 2,735
$21,157 $17,401 $21,200
(1) For the year ended December 31, 2015, in accordance with the terms of our management agreement, PCM provided us
discretionary waivers of $1.6 million of overhead expenses that otherwise would have been allocable to us. On December 15, 2015, we amended our management agreement to provide that the total costs and expenses incurred by our Manager in any quarter and reimbursable by us is capped at an amount equal to the quotient of (i) the product of (A) 70 basis points (0.0070), multiplied by (B) shareholders’ equity (as defined in the management agreement) as of the last day of such quarter, divided by (ii) four (4).
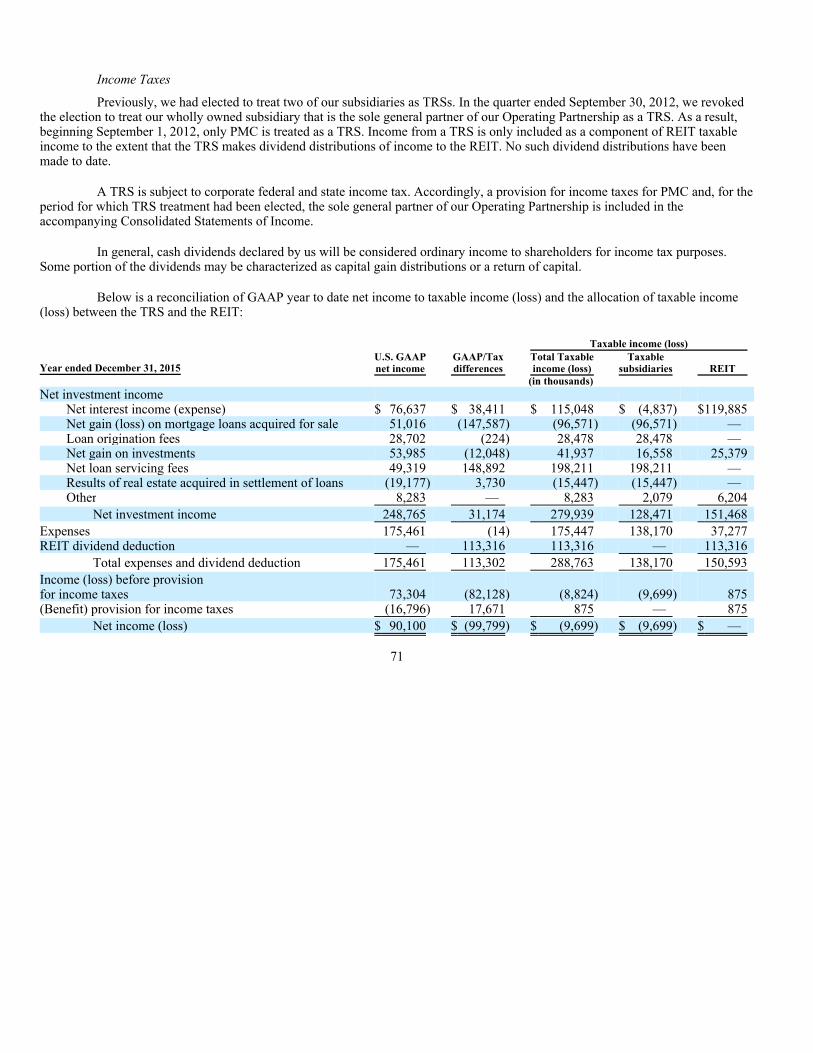
Income Taxes
Previously, we had elected to treat two of our subsidiaries as TRSs. In the quarter ended September 30, 2012, we revoked the election to treat our wholly owned subsidiary that is the sole general partner of our Operating Partnership as a TRS. As a result, beginning September 1, 2012, only PMC is treated as a TRS. Income from a TRS is only included as a component of REIT taxable income to the extent that the TRS makes dividend distributions of income to the REIT. No such dividend distributions have been made to date.
A TRS is subject to corporate federal and state income tax. Accordingly, a provision for income taxes for PMC and, for the period for which TRS treatment had been elected, the sole general partner of our Operating Partnership is included in the accompanying Consolidated Statements of Income.
In general, cash dividends declared by us will be considered ordinary income to shareholders for income tax purposes. Some portion of the dividends may be characterized as capital gain distributions or a return of capital.
Below is a reconciliation of GAAP year to date net income to taxable income (loss) and the allocation of taxable income (loss) between the TRS and the REIT:
71
Taxable income (loss)
Year ended December 31, 2015 U.S. GAAPnet income
GAAP/Taxdifferences
Total Taxableincome (loss)
Taxable subsidiaries REIT
(in thousands)Net investment income
Net interest income (expense) $ 76,637 $ 38,411 $ 115,048 $ (4,837) $119,885 Net gain (loss) on mortgage loans acquired for sale 51,016 (147,587) (96,571) (96,571) — Loan origination fees 28,702 (224) 28,478 28,478 — Net gain on investments 53,985 (12,048) 41,937 16,558 25,379 Net loan servicing fees 49,319 148,892 198,211 198,211 — Results of real estate acquired in settlement of loans (19,177) 3,730 (15,447) (15,447) — Other 8,283 — 8,283 2,079 6,204
Net investment income 248,765 31,174 279,939 128,471 151,468
Expenses 175,461 (14) 175,447 138,170 37,277 REIT dividend deduction — 113,316 113,316 — 113,316
Total expenses and dividend deduction 175,461 113,302 288,763 138,170 150,593
Income (loss) before provision for income taxes 73,304 (82,128) (8,824) (9,699) 875 (Benefit) provision for income taxes (16,796) 17,671 875 — 875
Net income (loss) $ 90,100 $ (99,799) $ (9,699) $ (9,699) $ —
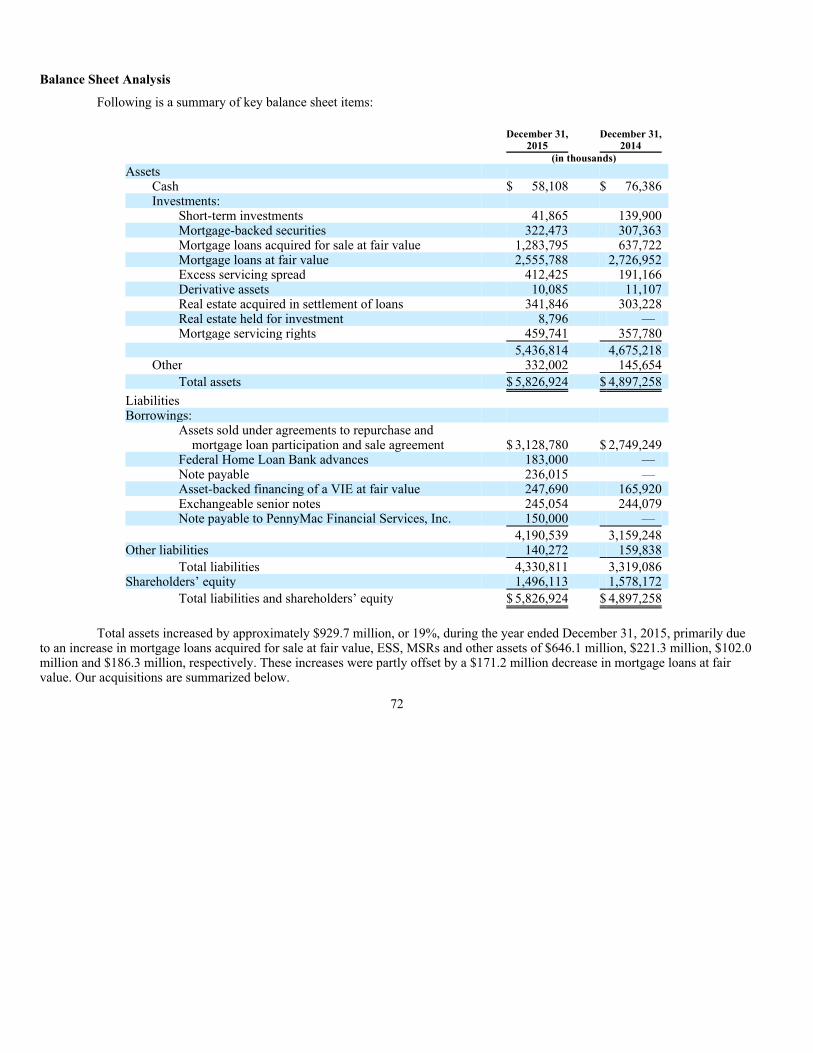
Balance Sheet Analysis
Following is a summary of key balance sheet items:
Total assets increased by approximately $929.7 million, or 19%, during the year ended December 31, 2015, primarily due to an increase in mortgage loans acquired for sale at fair value, ESS, MSRs and other assets of $646.1 million, $221.3 million, $102.0 million and $186.3 million, respectively. These increases were partly offset by a $171.2 million decrease in mortgage loans at fair value. Our acquisitions are summarized below.
72
December 31,
2015 December 31,
2014 (in thousands) Assets
Cash $ 58,108 $ 76,386 Investments:
Short-term investments 41,865 139,900 Mortgage-backed securities 322,473 307,363 Mortgage loans acquired for sale at fair value 1,283,795 637,722 Mortgage loans at fair value 2,555,788 2,726,952 Excess servicing spread 412,425 191,166 Derivative assets 10,085 11,107 Real estate acquired in settlement of loans 341,846 303,228 Real estate held for investment 8,796 — Mortgage servicing rights 459,741 357,780
5,436,814 4,675,218 Other 332,002 145,654
Total assets $ 5,826,924 $ 4,897,258
Liabilities Borrowings:
Assets sold under agreements to repurchase and mortgage loan participation and sale agreement $ 3,128,780 $ 2,749,249
Federal Home Loan Bank advances 183,000 — Note payable 236,015 — Asset-backed financing of a VIE at fair value 247,690 165,920 Exchangeable senior notes 245,054 244,079 Note payable to PennyMac Financial Services, Inc. 150,000 —
4,190,539 3,159,248 Other liabilities 140,272 159,838
Total liabilities 4,330,811 3,319,086 Shareholders’ equity 1,496,113 1,578,172
Total liabilities and shareholders’ equity $ 5,826,924 $ 4,897,258

Asset Acquisitions
Correspondent Production
Following is a summary of our correspondent lending acquisitions:
During 2015, we purchased for sale $46.4 billion in fair value of correspondent production loans compared to $28.4 billion in fair value of correspondent production loans during 2014 and $32.0 billion during 2013. The increase in correspondent purchases during 2015 as compared to 2014 is a result of an increase in our overall mortgage loan origination market share from the continued growth of our correspondent network. The decrease in correspondent purchases during 2014 as compared to 2013 is a result of the effect of the rising interest rate environment through most of 2013 on the demand for mortgage loans during 2014, partly offset by the impact of the continued growth of our correspondent network.
Our ability to continue the expansion of our correspondent production business is subject to, among other factors, our ability to source additional mortgage loan volume, our ability to obtain additional inventory financing and our ability to fund the portion of the loans not financed, either through cash flows from business activities or the raising of additional equity capital. There can be no assurance that we will be successful in increasing our borrowing capacity or in obtaining the additional equity capital necessary or that we will be able to identify additional sources of mortgage loans.
Investment Portfolio
Following is a summary of our acquisitions of mortgage investments other than correspondent production acquisitions as shown in the preceding table:
73
Year ended December 31, 2015 2014 2013 (in thousands)Correspondent mortgage loan purchases:
Government-insured or guaranteed $31,945,396 $16,523,216 $16,068,253 Agency-eligible 14,360,888 11,474,345 15,358,372 Jumbo 117,714 383,854 582,996 Commercial loans 14,811 — —
$46,438,809 $28,381,415 $32,009,621
UPB of correspondent mortgage loan purchases $44,357,875 $27,147,444 $30,949,758 Gain on mortgage loans acquired for sale $ 51,016 $ 35,647 $ 98,669 Fair value of correspondent loans in inventory at year end pending sale to:
PFSI $ 669,288 $ 209,325 $ 112,360 Nonaffiliates 614,507 428,397 345,777
$ 1,283,795 $ 637,722 $ 458,137
Year ended December 31, 2015 2014 2013 (in thousands)MBS $ 84,828 $185,972 $ 199,558 Agency debt security — — 12,000 Distressed mortgage loans(1)(2)
Performing — 735 63,783 Nonperforming 241,981 553,869 1,242,778
241,981 554,604 1,306,561 REO(2) — 3,117 120 Restricted cash relating to CRT Agreements 147,000 — — MSRs purchased and received in mortgage loan sales 156,809 121,333 184,451 ESS purchased from PFSI 271,554 99,728 139,028
$902,172 $964,754 $1,841,718
(1) Performance status as of the date of acquisition. (2) $26.8 million and $443.2 million of our distressed asset purchases during the years ended December 31, 2014 and 2013,
respectively, were acquired from or through one or more subsidiaries of Citigroup Inc.

Our acquisitions during the years ended December 31, 2015, 2014 and 2013 were financed through the use of a combination of equity and borrowings. We continue to identify additional means of increasing our investment portfolio through cash flow from our business activities, existing investments, borrowings, and transactions that minimize current cash outlays. However, we expect that, over time, our ability to continue our investment activities portfolio growth will depend on our ability to raise additional equity capital.
Investment Portfolio Composition
Mortgage-Backed Securities
The securities we hold as investments consist of Fannie Mae and Freddie Mac MBS backed by 30-year fixed-rate mortgage loans and non-Agency prime jumbo MBS.
Mortgage Loans
The relationship of the fair value of our mortgage loans at fair value (excluding mortgage loans acquired for sale at fair value) and of the real estate collateral underlying the loans is summarized below:
The collateral values presented above do not represent our assessment of the amount of future cash flows to be realized from the mortgage loans and/or underlying collateral. Future cash flows will be influenced by, among other considerations, our asset disposition strategies with respect to individual loans, the costs and expenses we incur in the disposition process, changes in borrower performance and the underlying collateral values.
The collateral values summarized above are estimated and may change over time due to various factors including our level of access to the properties securing the loans, changes in the real estate market or the condition of individual properties. The collateral values presented do not include any costs that would typically be incurred in obtaining the property in settlement of the loan, readying the property for sale or in the sale of a property.
74
December 31, 2015 December 31, 2014 Average Average
Fair value Principal
Life (in years) Coupon
Marketyield
Fair value Principal
Life (in years) Coupon
Marketyield
(dollars in thousands)Agency:
Freddie Mac $154,697 $150,099 7.37 3.50% 3.00% $139,577 $133,964 6.46 3.50% 2.70% Fannie Mae 70,453 68,215 7.43 3.50% 2.95% 55,941 53,559 7.13 3.50% 2.73%
225,150 218,314 195,518 187,523 Non-Agency prime
jumbo 97,323 98,337 4.90 3.45% 3.60% 111,845 111,270 4.77 3.49% 3.31%
$322,473 $316,651 $307,363 $298,793
December 31, 2015 December 31, 2014 Loan Collateral Loan Collateral (in thousands)Fair values:
Performing loans $ 877,438 $1,134,560 $ 664,266 $ 938,774 Nonperforming loans 1,222,956 1,702,548 1,535,317 2,139,590
$2,100,394 $2,837,108 $2,199,583 $3,078,364

Following is a sum
mary of the distribution of our m
ortgage loans at fair value (excluding mortgage loans acquired for sale at fair value):
75
Decem
ber 31, 2015D
ecember 31, 2014
Performing loans
Nonperform
ing loansPerform
ing loansN
onperforming loans
Loan type
Fair value
%
total
Averagenote rate
Fair value
%total
Averagenote rate
Fair value
%total
Averagenote rate
Fair value
%total
Averagenote rate
(dollars in thousands)Fixed
$417,658 48%
4.35%
$481,325
39%
5.62%
$322,704 49%
4.81%
$653,313
43%
5.88%
A
RM
/Hybrid
160,051 18%
3.33%
696,802
57%
4.80%
127,405 19%
3.28%
846,282
55%
5.01%
Interest rate step-up
299,569 34%
2.28%
44,829
4%
2.25%
213,999 32%
2.29%
34,854
2%
2.30%
B
alloon
160 0%
1.97%
—
0%
0.00%
158
0%
1.97%
868
0%
5.16%
$877,438 100%
3.43% $1,222,956
100%
5.01% $664,266 100%
3.68%
$1,535,317 100%
5.31%
Decem
ber 31, 2015D
ecember 31, 2014
Performing loans
Nonperform
ing loansPerform
ing loansN
onperforming loans
Lien position
Fair value
%
total
Averagenote rate
Fair value
%total
Averagenote rate
Fair value
%total
Averagenote rate
Fair value
%total
Averagenote rate
(dollars in thousands)1st lien
$876,748 100%
3.43% $1,222,816
100%
5.01% $663,686 100%
3.67%
$1,535,139 100%
5.30%
2nd lien
690
0%
4.28%
140
0%
8.47%
580 0%
4.53%
178
0%
8.72%
U
nsecured
—
0%
0.00%
—
0%
0.00%
—
0%
0.00%
—
0%
0.00%
$877,438 100%
3.43% $1,222,956
100%
5.01% $664,266 100%
3.68%
$1,535,317 100%
5.31%
Decem
ber 31, 2015D
ecember 31, 2014
Performing loans
Nonperform
ing loansPerform
ing loansN
onperforming loans
Occupancy
Fair value
%
total
Averagenote rate
Fair value
%total
Averagenote rate
Fair value
%total
Averagenote rate
Fair value
%total
Averagenote rate
(dollars in thousands)O
wner occupied
$685,801 78%
3.49%
$666,257
55%
4.99%
$524,833 79%
3.78%
$926,637
60%
5.21%
Investm
ent propert y 188,659
22%
3.20%
555,531
45%
5.03% 137,347
21%
3.27%
607,086
40%
5.45%
Other
2,978
0%
4.17%
1,168
0%
5.69%
2,086 0%
4.22%
1,594
0%
5.44%
$877,438 100%
3.43% $1,222,956
100%
5.01% $664,266 100%
3.68%
$1,535,317 100%
5.31%
Decem
ber 31, 2015D
ecember 31, 2014
Performing loans
Nonperform
ing loansPerform
ing loansN
onperforming loans
Loan age
Fair value
%
total
Averagenote rate
Fairvalue
%total
Averagenote rate
Fair value
%total
Averagenote rate
Fairvalue
%total
Averagenote rate
(dollars in thousands)Less than 12 m
onths $
55 0%
3.18%
$—
0%
0.00%
$167
0%
4.51% $
—
0%
4.63%
12 - 35 months
24,331
3%
4.24%
—
0%
0.00%
401 0%
4.01%
38
0%
3.86%
36 - 59 m
onths
4,131 0%
3.22%
2,083
0%
3.43%
18,061
3%
3.67%
22,136
1%
3.31%
60 months or m
ore 848,921
97%
3.41%
1,220,873 100%
5.01%
645,637 97%
3.67%
1,513,143
99%
5.34%
$877,438 100%
3.43% $1,222,956
100%
5.01% $664,266 100%
3.68%
$1,535,317 100%
5.31%

Decem
ber 31, 2015D
ecember 31, 2014
Performing loans
Nonperform
ing loansPerform
ing loansN
onperforming loans
Origination FIC
O score
Fair value
%
total
Averagenote rate
Fairvalue
%total
Averagenote rate
Fair value
%total
Averagenote rate
Fairvalue
%total
Averagenote rate
(dollars in thousands)Less than 600
$200,856 23%
3.77%
$203,493
17%
5.01%
$166,135 25%
4.14%
$249,049
16%
5.52%
600-649
158,654 18%
3.58%
237,879
19%
4.88%
133,681 20%
3.90%
263,560
17%
5.33%
650-699
216,648 25%
3.33%
370,178
30%
5.03%
167,970 25%
3.61%
455,709
30%
5.32%
700-749
210,329 24%
3.15%
301,417
25%
5.09%
143,759 22%
3.14%
408,162
27%
5.22%
750 or greater
90,951
10%
3.24%
109,989
9%
5.06%
52,721 8%
3.17%
158,837
10%
5.06%
$877,438 100%
3.43% $1,222,956
100%
5.01% $664,266 100%
3.68%
$1,535,317 100%
5.31%
Decem
ber 31, 2015D
ecember 31, 2014
Performing loans
Nonperform
ing loansPerform
ing loansN
onperforming loans
Current loan-to-value (1)
Fair value
%
total
Averagenote rate
Fairvalue
%total
Averagenote rate
Fair value
%total
Averagenote rate
Fairvalue
%total
Averagenote rate
(dollars in thousands)Less than 80%
$250,154
29%
4.09% $
309,945
25%
5.07% $143,964
22%
4.37% $
297,061
19%
5.30%
80% - 99.99%
225,574
26%
3.53%
317,076
26%
4.91% 168,140
25%
3.73%
389,938
25%
5.36%
100% - 119.99%
190,336
22%
3.26%
291,866
24%
5.07% 204,820
31%
3.53%
382,264
26%
5.23%
120% or greater
211,374 23%
2.97%
304,069
25%
5.00%
147,342 22%
3.37%
466,054
30%
5.33%
$877,438 100%
3.43% $1,222,956
100%
5.01% $664,266 100%
3.68%
$1,535,317 100%
5.31%
(1)C
urrent loan-to-value is calculated based on the unpaid principal balance of the mortgage loan and our estim
ate of the value of the mortgaged property.
Decem
ber 31, 2015D
ecember 31, 2014
Performing loans
Nonperform
ing loansPerform
ing loansN
onperforming loans
Geographic distribution
Fair value
%
total
Averagenote rate
Fairvalue
%total
Averagenote rate
Fair value
%total
Averagenote rate
Fairvalue
%total
Averagenote rate
(dollars in thousands)C
alifornia $260,103
30%
3.20% $
201,717
16%
4.06% $188,307
28%
3.06% $
293,219
19%
4.50%
New
York
99,081
11%
3.07%
293,277
24%
5.58%
61,785 9%
3.48%
321,176
21%
5.76%
Florida
61,999
7%
3.15%
126,705
10%
5.43%
47,890 7%
3.54%
167,722
11%
5.79%
N
ew Jersey
47,939
5%
2.84%
167,020
14%
5.25%
31,698 5%
3.03%
195,648
13%
5.54%
O
ther 408,316
47%
4.08%
434,237
36%
4.86% 334,586
51%
4.14%
557,552
36%
5.20%
$877,438 100%
3.43% $1,222,956
100%
5.01% $664,266 100%
3.68%
$1,535,317 100%
5.31%
Decem
ber 31, 2015D
ecember 31, 2014
Performing loans
Nonperform
ing loansPerform
ing loansN
onperforming loans
Payment status
Fair value
%
total
Averagenote rate
Fair value
%total
Averagenote rate
Fair value
%total
Averagenote rate
Fair value
%total
Averagenote rate
(dollars in thousands)C
urrent $691,925
79%
3.34% $
—
0%
0.00% $477,773
72%
3.53% $
—
0%
0.00%
30 da ys delinquent 131,098
15%
3.73%
—
0%
0.00% 114,179
17%
4.16%
—
0%
0.00%
60 days delinquent
54,415 6%
3.78%
—
0%
0.00%
72,314
11%
3.88%
—
0%
0.00%
90 da ys or more
—
0%
0.00%
—
0%
0.00%
0%
0.00%
—
0%
0.00%
delinquent
—
0%
0.00%
459,060
38%
4.48%
—
0%
0.00%
608,144
40%
4.76%

We believe that our current fair value estim
ates are representative of fair value at the reporting date. How
ever, the market for distressed m
ortgage assets is illiquid w
ith a limited num
ber of participants. Furthermore, our business strategy is to enhance value during the period in w
hich the loans are held. Therefore, any resulting appreciation or depreciation in the fair value of the loans is recorded during such holding period and ultim
ately realized at the end of the holding period.
76
In foreclosure
—
0%
0.00%
763,896
62%
5.33%
—
0%
0.00%
927,173
60%
5.66%
$877,438 100%
3.43% $1,222,956
100%
5.01% $664,266 100%
3.68%
$1,535,317 100%
5.31%

Following is a summary of the key inputs we use in the valuation of our mortgage loans using “Level 3” inputs:
We monitor and value our investments in pools of distressed mortgage loans by payment status of the loans. Most of the measures we use to value and monitor the loan portfolio, such as projected prepayment and default speeds and discount rates, are applied or output at the pool level. The characteristics of the individual loans, such as loan size, loan-to-value ratio and current delinquency status, can vary widely within a pool.
The weighted average discount rate used in the valuation of mortgage loans at fair value decreased from 7.7% at December 31, 2014 to 7.1% at December 31, 2015 because the proportion of performing loans, valued at lower discount rates, increased throughout 2015.
The weighted average twelve-month projected housing price index (“HPI”) change used in the valuation of our portfolio of mortgage loans at fair value decreased from 4.8% at December 31, 2014 to 3.6% at December 31, 2015 due to moderating forecasts for real estate price appreciation.
The weighted average total prepayment speed used in the valuation of our portfolio of mortgage loans at fair value decreased from 21.6% at December 31, 2014 to 19.6% at December 31, 2015, due to lower expectations of prepayment speeds on certain mortgage loans that have seasoned in our portfolio and a greater proportion of performing loans with lower expected total prepayment speeds.
Real Estate Acquired in Settlement of Loans
Following is a summary of our REO by attribute as of the dates presented:
77
Range
(Weighted average)Key inputs December 31, 2015 December 31, 2014Discount rate
Range 2.5% – 15.0% 2.3% – 15.0%Weighted average 7.1% 7.7%
Twelve-month projected housing price index change Range 1.5% – 5.1% 4.0% – 5.3%Weighted average 3.6% 4.8%
Prepayment speed (1) Range 0.1% – 9.6% 0.0% – 6.5%Weighted average 3.7% 3.1%
Total prepayment speed (2) Range 0.5% – 27.2% 0.0% – 27.9%Weighted average 19.6% 21.6%
(1) Prepayment speed is measured using Life Voluntary CPR. (2) Total prepayment speed is measured using Life Total CPR.
December 31, 2015 December 31, 2014Property type Carrying Value % total Carrying Value % total (dollars in thousands)1 - 4 dwelling units $ 249,340 73% $ 212,728 70% Planned unit development 54,404 16% 51,124 17% Condominium/Co-op 35,593 10% 31,948 11% 5+ dwelling units 2,509 1% 7,428 2%
$ 341,846 100% $ 303,228 100%

Following is a summary of the status of our portfolio of acquisitions by quarter acquired:
78
December 31, 2015 December 31, 2014Geographic distribution Carrying Value % total Carrying Value % total (dollars in thousands)California $ 76,222 22% $ 85,213 28% Florida 58,924 17% 47,421 16% New Jersey 36,394 11% * * Maryland 30,763 9% 34,427 11% New York 27,300 8% * * Illinois 21,029 6% 14,963 5% Other 91,214 27% 121,204 40%
$ 341,846 100% $ 303,228 100%
* Not included in the states representing the largest percentages as of the date presented.
Acquisitions for the quarter ended September 30, 2015 June 30, 2015 March 31, 2015 At December 31 At December 31 At December 31 purchase 2015 purchase 2015 purchase 2015 (dollars in millions)Unpaid principal balance $ 0.0 $ 0.0 $ 0.0 $ 0.0 $ 310.2 $ 277.7 Pool factor (1) — — — — 1.00 0.90 Collection status:
Delinquency Current 0.0% 0.0% 0.0% 0.0% 1.8% 12.8% 30 days 0.0% 0.0% 0.0% 0.0% 0.3% 1.1% 60 days 0.0% 0.0% 0.0% 0.0% 0.1% 0.9% over 90 days 0.0% 0.0% 0.0% 0.0% 66.7% 26.9%
In foreclosure 0.0% 0.0% 0.0% 0.0% 31.1% 44.9% REO 0.0% 0.0% 0.0% 0.0% 0.0% 13.3%
Acquisitions for the quarter ended December 31, 2014 September 30, 2014 June 30, 2014 March 31, 2014 At December 31 At December 31 At December 31 At December 31 purchase 2015 purchase 2015 purchase 2015 purchase 2015 (dollars in millions)Unpaid principal balance $ 330.8 $ 296.4 $ 0.0 $ 0.0 $ 37.9 $ 31.2 $ 439.0 $ 338.8 Pool factor (1) 1.00 0.90 — — 1.00 0.82 1.00 0.77 Collection status:
Delinquency Current 1.6% 23.1% 0.0% 0.0% 0.7% 31.9% 6.2% 18.2% 30 days 1.6% 4.5% 0.0% 0.0% 0.6% 5.3% 0.7% 2.5% 60 days 7.1% 3.2% 0.0% 0.0% 1.4% 1.1% 0.7% 1.1% over 90 days 52.7% 30.4% 0.0% 0.0% 59.0% 33.7% 37.5% 16.0%
In foreclosure 36.9% 31.2% 0.0% 0.0% 38.2% 20.0% 53.8% 46.7% REO 0.0% 7.5% 0.0% 0.0% 0.0% 8.0% 1.1% 15.5%

Cash Flows
Our cash flows for the year ended December 31, 2015, 2014 and 2013 are summarized below:
Our cash flows resulted in a net decrease in cash of $18.3 million during the year ended December 31, 2015 as compared to a net increase in cash of $49.0 million during the year ended December 31, 2014. The decrease in net cash flows was due to cash used by our operating activities exceeding our cash provided by investing and financing activities.
79
Acquisitions for the quarter ended December 31, 2013 September 30, 2013 June 30, 2013 March 31, 2013
At December 31 At December 31 At December 31 At December 31 purchase 2015 purchase 2015 purchase 2015 purchase 2015
(dollars in millions)Unpaid principal balance $ 507.3 $ 383.6 $ 929.5 $ 596.5 $ 397.3 $ 262.0 $ 366.2 $ 189.2 Pool factor (1) 1.00 0.76 1.00 0.64 1.00 0.66 1.00 0.52 Collection status:
Delinquency Current 1.4% 16.9% 0.8% 23.9% 4.8% 32.4% 1.6% 46.8% 30 days 0.2% 1.5% 0.3% 3.4% 7.4% 7.7% 1.5% 8.9% 60 days 0.0% 0.8% 0.7% 2.0% 7.6% 3.9% 3.5% 5.4% over 90 days 38.3% 16.0% 58.6% 17.7% 45.3% 17.1% 82.2% 16.0%
In foreclosure 60.0% 46.6% 39.6% 33.0% 34.9% 24.4% 11.2% 13.6% REO 0.0% 18.2% 0.0% 19.9% 0.0% 14.6% 0.0% 9.2%
Acquisitions for the quarter ended December 31, 2012 September 30, 2012 June 30, 2012 March 31, 2012
At December 31 At December 31 At December 31 At December 31 purchase 2015 purchase 2015 purchase 2015 purchase 2015
(dollars in millions)Unpaid principal balance $ 290.3 $ 141.0 $ 357.2 $ 149.9 $ 402.5 $ 129.8 $ 0.0 $ 0.0 Pool factor (1) 1.00 0.49 1.00 0.42 1.00 0.32 — — Collection status:
Delinquency Current 3.1% 35.6% 0.0% 27.9% 45.0% 40.5% 0.0% 0.0% 30 days 1.3% 9.4% 0.0% 4.1% 4.0% 11.3% 0.0% 0.0% 60 days 5.4% 5.8% 0.1% 0.9% 4.3% 4.3% 0.0% 0.0% over 90 days 57.8% 14.3% 49.1% 18.5% 31.3% 19.2% 0.0% 0.0%
In foreclosure 32.4% 19.5% 50.8% 27.6% 15.3% 18.3% 0.0% 0.0% REO 0.0% 15.4% 0.0% 21.0% 0.1% 6.4% 0.0% 0.0%
Acquisitions for the quarter ended December 31, 2011 September 30, 2011 June 30, 2011 March 31, 2011
At December 31, At December 31, At December 31, At December 31, purchase 2015 purchase 2015 purchase 2015 purchase 2015
(dollars in millions)Unpaid principal balance $ 49.0 $ 23.5 $ 542.6 $ 133.4 $ 259.8 $ 77.7 $ 515.1 $ 136.2 Pool factor (1) 1.00 0.48 1.00 0.25 1.00 0.30 1.00 0.26 Collection status:
Delinquency Current 0.2% 34.6% 0.6% 33.3% 11.5% 27.9% 2.0% 28.0% 30 days 0.1% 6.0% 1.3% 8.3% 6.5% 10.7% 1.9% 4.3% 60 days 0.2% 2.8% 2.0% 1.8% 5.2% 4.1% 3.9% 2.4% over 90 days 70.4% 22.3% 22.6% 18.3% 31.2% 20.9% 25.9% 21.2%
In foreclosure 29.0% 22.9% 73.0% 21.3% 43.9% 23.0% 66.3% 30.6% REO 0.0% 11.4% 0.4% 17.0% 1.7% 13.5% 0.0% 13.4%
(1) Ratio of unpaid principal balance remaining to unpaid principal balance at acquisition.
Year ended December 31, 2015 2014 2013 (in thousands) Operating $(863,188) $(366,036) $ (242,832) Investing 11,502 27,972 (1,028,996) Financing 833,408 387,039 1,265,483
Net cash flows $ (18,278) $ 48,975 $ (6,345)

Operating activities
Cash used by operating activities totaled $863.2 million, $366.0 million and $242.8 million during the years ended December 31, 2015, 2014 and 2013, respectively. The increases in cash flows used by operating activities are primarily due to continued growth in our inventory of mortgage loans acquired for sale from our correspondent production activities and the receipt of MSRs as a portion of the proceeds on sale of mortgage loans acquired for sale.
Investing activities
Net cash provided by investing activities was $11.5 million for the year ended December 31, 2015. This source of cash reflects sales and repayments of our investments in mortgage loans at fair value, MBS, ESS and REO of $663.6 million and a decrease in short-term investments of $98.0 million during 2015. Offsetting these cash inflows during 2015 were purchases of investments in mortgage loans at fair value, MBS and ESS of $598.4 million and deposits of cash collateral securing CRT Agreements of $147.4 million.
Net cash provided by investing activities was $28.0 million for the year ended December 31, 2014. This source of cash reflects repayments in excess of new investments in our portfolio during the year. During 2014, repayments and sales of our investments totaled $921.1 million while purchases totaled $839.5 million. The change in cash flows from investing activities reflects a decrease in the availability of mortgage investments that meet our return targets.
Net cash used by investing activities was $1.0 billion for the year ended December 31, 2013. This use of cash reflects the growth of our investment portfolio. We used cash to purchase MBS and an Agency debt security totaling $211.6 million, mortgage loans with fair values of $1.1 billion and ESS of $139.0 million during the year ended December 31, 2013. Offsetting these uses of cash were cash inflows from repayments of mortgage loans and sales of REO totaling $270.5 million and $121.5 million, respectively. We accomplished the 2013 acquisitions primarily through secondary equity offerings and the issuance of our Exchangeable Notes during the year.
As discussed above, our investing activities include the purchase of long-term assets which are not presently cash flowing or are at risk of interruption of cash flows in the near future. Furthermore, much of the investment income we recognize is in the form of valuation adjustments we record recognizing our estimates of the net appreciation in value of the assets as we work with borrowers to either modify their loans or acquire the property securing their loans in settlement thereof. Accordingly, the cash associated with a substantial portion of our revenues is often realized as part of the proceeds of the liquidation of the assets, either through payoff or sale of the mortgage loan or through acquisition and subsequent sale of the property securing the loans, many months after we record the revenues.
Financing activities
Net cash provided by financing activities was $833.4 million for the year ended December 31, 2015, during which we (i) increased our borrowing capacities under assets sold under agreements to repurchase; (ii) entered into a new debt agreement with the Federal Home Loan Bank; and (iii) executed new financing agreements secured by our investments in MSRs and ESS. We increased our borrowings primarily for the purpose of financing growth in our inventory of mortgage loans acquired for sale. As discussed below in Liquidity and Capital Resources, our Manager continues to evaluate and pursue additional sources of financing to provide us with future investing capacity.
Net cash provided by financing activities was $387.0 million for the year ended December 31, 2014. We increased borrowings primarily for the purpose of financing growth in our inventory of mortgage loans acquired for sale. As discussed below in Liquidity and Capital Resources, our Manager continues to evaluate and pursue additional sources of financing to provide us with future investing capacity.
Net cash provided by financing activities was $1.3 billion for the year ended December 31, 2013, during which we completed an underwritten offering of our common shares, increased borrowings through the issuance of the Exchangeable Notes with a maturity date of May 1, 2020, sold a portion of our securities backed by our investment in jumbo mortgage loans and increased borrowings in the form of sales of assets under agreements to repurchase. We increased borrowings primarily for the purpose of financing growth in our mortgage loans at fair value, inventory of mortgage loans acquired for sale and acquisition of MSRs through our loan sale activity. We also obtained non-cash financing through the use of forward purchase agreements to purchase pools of nonperforming loans amounting to $246.6 million in fair value. As discussed below in Liquidity and Capital Resources, our Manager continues to evaluate and pursue additional sources of financing to provide us with future investing capacity.
We do not raise equity or enter into borrowings for the purpose of financing the payment of dividends. We believe that our cash flows from the liquidation of our investments, which include accumulated gains recorded during the periods we hold those investments, along with our cash earnings, are adequate to fund our operating expenses and dividend payment requirements. However, as our business continues to grow, we manage our liquidity in the aggregate and are reinvesting our cash flows in new investments as well as using such cash to fund our dividend requirements.
80
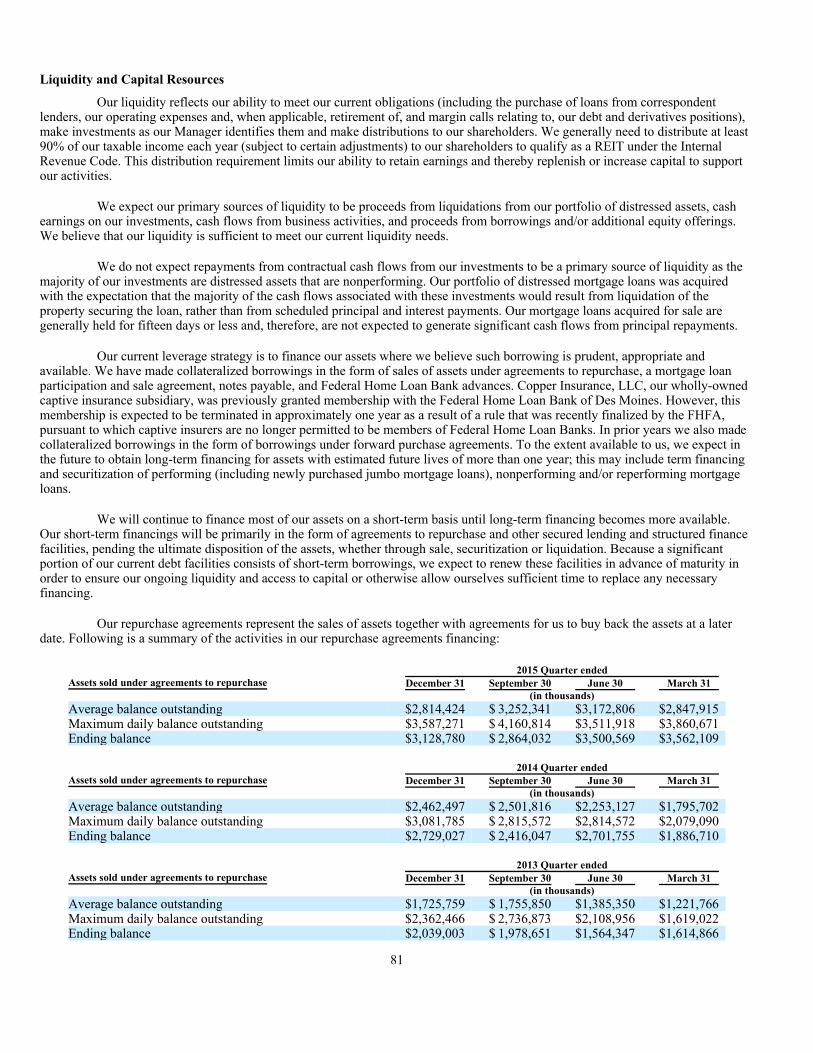
Liquidity and Capital Resources
Our liquidity reflects our ability to meet our current obligations (including the purchase of loans from correspondent lenders, our operating expenses and, when applicable, retirement of, and margin calls relating to, our debt and derivatives positions), make investments as our Manager identifies them and make distributions to our shareholders. We generally need to distribute at least 90% of our taxable income each year (subject to certain adjustments) to our shareholders to qualify as a REIT under the Internal Revenue Code. This distribution requirement limits our ability to retain earnings and thereby replenish or increase capital to support our activities.
We expect our primary sources of liquidity to be proceeds from liquidations from our portfolio of distressed assets, cash earnings on our investments, cash flows from business activities, and proceeds from borrowings and/or additional equity offerings. We believe that our liquidity is sufficient to meet our current liquidity needs.
We do not expect repayments from contractual cash flows from our investments to be a primary source of liquidity as the majority of our investments are distressed assets that are nonperforming. Our portfolio of distressed mortgage loans was acquired with the expectation that the majority of the cash flows associated with these investments would result from liquidation of the property securing the loan, rather than from scheduled principal and interest payments. Our mortgage loans acquired for sale are generally held for fifteen days or less and, therefore, are not expected to generate significant cash flows from principal repayments.
Our current leverage strategy is to finance our assets where we believe such borrowing is prudent, appropriate and available. We have made collateralized borrowings in the form of sales of assets under agreements to repurchase, a mortgage loan participation and sale agreement, notes payable, and Federal Home Loan Bank advances. Copper Insurance, LLC, our wholly-owned captive insurance subsidiary, was previously granted membership with the Federal Home Loan Bank of Des Moines. However, this membership is expected to be terminated in approximately one year as a result of a rule that was recently finalized by the FHFA, pursuant to which captive insurers are no longer permitted to be members of Federal Home Loan Banks. In prior years we also made collateralized borrowings in the form of borrowings under forward purchase agreements. To the extent available to us, we expect in the future to obtain long-term financing for assets with estimated future lives of more than one year; this may include term financing and securitization of performing (including newly purchased jumbo mortgage loans), nonperforming and/or reperforming mortgage loans.
We will continue to finance most of our assets on a short-term basis until long-term financing becomes more available. Our short-term financings will be primarily in the form of agreements to repurchase and other secured lending and structured finance facilities, pending the ultimate disposition of the assets, whether through sale, securitization or liquidation. Because a significant portion of our current debt facilities consists of short-term borrowings, we expect to renew these facilities in advance of maturity in order to ensure our ongoing liquidity and access to capital or otherwise allow ourselves sufficient time to replace any necessary financing.
Our repurchase agreements represent the sales of assets together with agreements for us to buy back the assets at a later date. Following is a summary of the activities in our repurchase agreements financing:
81
2015 Quarter endedAssets sold under agreements to repurchase December 31 September 30 June 30 March 31 (in thousands)Average balance outstanding $2,814,424 $ 3,252,341 $3,172,806 $2,847,915 Maximum daily balance outstanding $3,587,271 $ 4,160,814 $3,511,918 $3,860,671 Ending balance $3,128,780 $ 2,864,032 $3,500,569 $3,562,109
2014 Quarter endedAssets sold under agreements to repurchase December 31 September 30 June 30 March 31 (in thousands)Average balance outstanding $2,462,497 $ 2,501,816 $2,253,127 $1,795,702 Maximum daily balance outstanding $3,081,785 $ 2,815,572 $2,814,572 $2,079,090 Ending balance $2,729,027 $ 2,416,047 $2,701,755 $1,886,710
2013 Quarter endedAssets sold under agreements to repurchase December 31 September 30 June 30 March 31 (in thousands)Average balance outstanding $1,725,759 $ 1,755,850 $1,385,350 $1,221,766 Maximum daily balance outstanding $2,362,466 $ 2,736,873 $2,108,956 $1,619,022 Ending balance $2,039,003 $ 1,978,651 $1,564,347 $1,614,866

The difference between the maximum and average daily amounts outstanding is due to increasing volume and the timing of loan purchases and sales in our correspondent acquisition business and timing of distressed loan acquisitions. The total facility size of our assets sold under agreements to repurchase was approximately $3.8 billion at December 31, 2015.
As discussed above, all of our repurchase agreements, forward purchase agreements and notes payable, and our mortgage loan participation and sale agreement, have short-term maturities:
As of December 31, 2015, leverage on MSRs and ESS continues to be limited in availability due to the requirement of each Agency that its rights and interest in the MSRs remain senior to those of any lender extending credit. As we continue to aggregate MSRs and ESS, the limited availability of financing could place stress on our capital and liquidity positions or require us to forego attractive investment opportunities.
Our debt financing agreements require us and certain of our subsidiaries to comply with various financial covenants. As of the filing of this Report, these financial covenants include the following:
Although these financial covenants limit the amount of indebtedness we may incur and impact our liquidity through minimum cash reserve requirements, we believe that these covenants currently provide us with sufficient flexibility to successfully operate our business and obtain the financing necessary to achieve that purpose.
PLS is also subject to various financial covenants, both as a borrower under its own financing arrangements and as our Servicer under certain of our debt financing agreements. The most significant of these financial covenants currently include the following:
• The transactions relating to mortgage loans and REO under agreements to repurchase generally provide for terms of approximately one year and, in one instance, two years.
• The transactions relating to mortgage loans under mortgage loan participation and sale agreement provide for terms of approximately one year.
• The transactions relating to assets under notes payable provide for terms of approximately one year.
• The transactions relating to mortgage loans under forward purchase agreements settled in full during the second quarter of the year ended December 31, 2014.
• profitability at the Company for at least one (1) of the previous two consecutive fiscal quarters, as of the end of each
fiscal quarter, and for both the prior two (2) calendar quarters, and at the Company and our Operating Partnership for the prior three (3) calendar quarters;
• a minimum of $40 million in unrestricted cash and cash equivalents among the Company and/or our subsidiaries; a minimum of $40 million in unrestricted cash and cash equivalents among our Operating Partnership and its consolidated subsidiaries; a minimum of $25 million in unrestricted cash and cash equivalents between PMC and PMH; and a minimum of $10 million in unrestricted cash and cash equivalents at each of PMC and PMH;
• a minimum tangible net worth for the Company of $860 million; a minimum tangible net worth for our Operating
Partnership of $700 million; a minimum tangible net worth for PMH of $250 million; and a minimum tangible net worth for PMC of $150 million;
• a maximum ratio of total liabilities to tangible net worth of less than 10:1 for PMC and PMH and 5:1 for the Company and our Operating Partnership; and
• at least two warehouse or repurchase facilities that finance amounts and assets similar to those being financed under our existing debt financing agreements.
• positive net income during each calendar quarter;
• a minimum in unrestricted cash and cash equivalents of $20 million;
• a minimum tangible net worth of $170 million; and
• a maximum ratio of total liabilities to tangible net worth of 10:1.

In addition to the financial covenants imposed upon us and our Servicer under our debt financing agreements, effective December 31, 2015, each of the Agencies has implemented new minimum financial eligibility requirements for Agency mortgage sellers/servicers and MBS issuers, as applicable. These minimum financial eligibility requirements are intended to set a minimum level of capital needed to adequately absorb potential losses and a minimum amount of liquidity needed to service Agency mortgage loans and MBS and cover the associated financial obligations and risks. Currently, we and our Servicer are required to comply with the following minimum financial eligibility requirements:
82
• A minimum net worth of a base of $2.5 million plus 25 basis points of UPB for total 1-4 unit residential mortgage loans serviced.
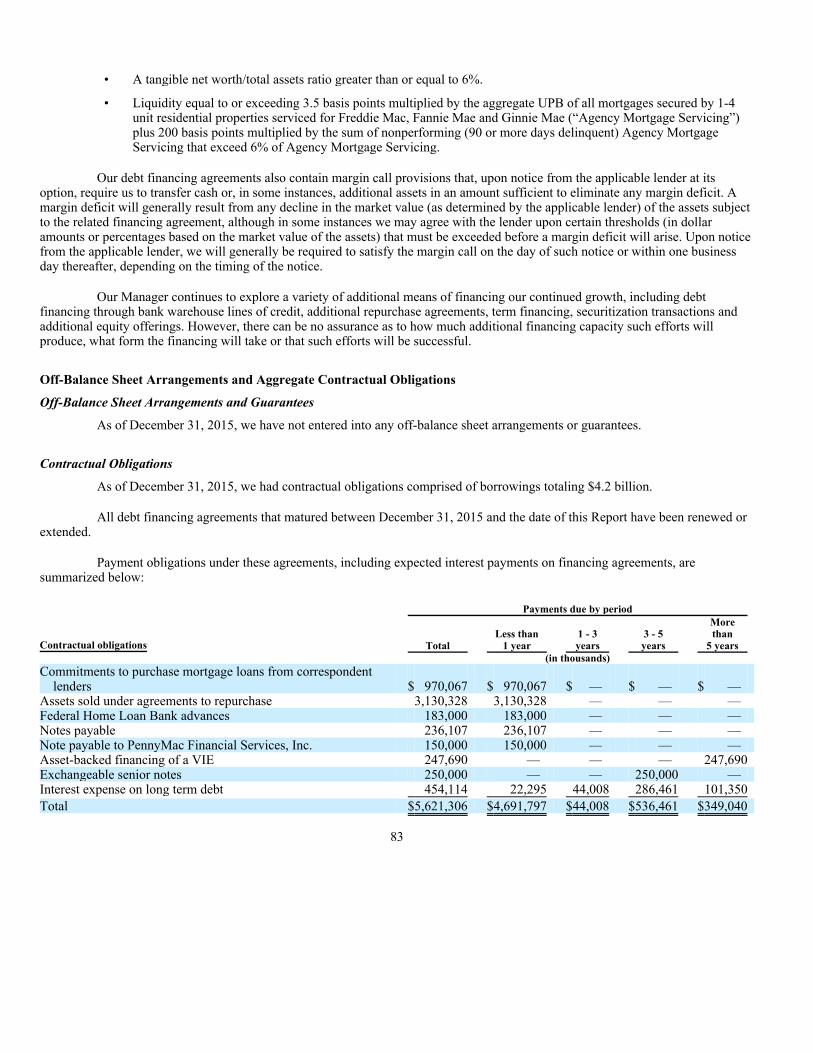
Our debt financing agreements also contain margin call provisions that, upon notice from the applicable lender at its option, require us to transfer cash or, in some instances, additional assets in an amount sufficient to eliminate any margin deficit. A margin deficit will generally result from any decline in the market value (as determined by the applicable lender) of the assets subject to the related financing agreement, although in some instances we may agree with the lender upon certain thresholds (in dollar amounts or percentages based on the market value of the assets) that must be exceeded before a margin deficit will arise. Upon notice from the applicable lender, we will generally be required to satisfy the margin call on the day of such notice or within one business day thereafter, depending on the timing of the notice.
Our Manager continues to explore a variety of additional means of financing our continued growth, including debt financing through bank warehouse lines of credit, additional repurchase agreements, term financing, securitization transactions and additional equity offerings. However, there can be no assurance as to how much additional financing capacity such efforts will produce, what form the financing will take or that such efforts will be successful.
Off-Balance Sheet Arrangements and Aggregate Contractual Obligations
Off-Balance Sheet Arrangements and Guarantees
As of December 31, 2015, we have not entered into any off-balance sheet arrangements or guarantees.
Contractual Obligations
As of December 31, 2015, we had contractual obligations comprised of borrowings totaling $4.2 billion.
All debt financing agreements that matured between December 31, 2015 and the date of this Report have been renewed or extended.
Payment obligations under these agreements, including expected interest payments on financing agreements, are summarized below:
83
• A tangible net worth/total assets ratio greater than or equal to 6%.
• Liquidity equal to or exceeding 3.5 basis points multiplied by the aggregate UPB of all mortgages secured by 1-4 unit residential properties serviced for Freddie Mac, Fannie Mae and Ginnie Mae (“Agency Mortgage Servicing”) plus 200 basis points multiplied by the sum of nonperforming (90 or more days delinquent) Agency Mortgage Servicing that exceed 6% of Agency Mortgage Servicing.
Payments due by period
Contractual obligations Total Less than
1 year 1 - 3 years
3 - 5 years
More than
5 years (in thousands)Commitments to purchase mortgage loans from correspondent
lenders $ 970,067 $ 970,067 $ — $ — $ — Assets sold under agreements to repurchase 3,130,328 3,130,328 — — — Federal Home Loan Bank advances 183,000 183,000 — — — Notes payable 236,107 236,107 — — — Note payable to PennyMac Financial Services, Inc. 150,000 150,000 — — — Asset-backed financing of a VIE 247,690 — — — 247,690 Exchangeable senior notes 250,000 — — 250,000 — Interest expense on long term debt 454,114 22,295 44,008 286,461 101,350
Total $5,621,306 $4,691,797 $44,008 $536,461 $349,040

The amount at risk (the fair value of the assets pledged plus the related margin deposit, less the amount advanced by the counterparty and accrued interest) relating to our debt financing is summarized by counterparty below as of December 31, 2015:
Management Agreement. We are externally managed and advised by our Manager pursuant to a management agreement, which was amended and restated effective February 1, 2013. Our management agreement requires our Manager to oversee our business affairs in conformity with the investment policies that are approved and monitored by our board of trustees. Our Manager is responsible for our day-to-day management and will perform such services and activities related to our assets and operations as may be appropriate.
Pursuant to our management agreement, our Manager collects a base management fee and may collect a performance incentive fee, both payable quarterly and in arrears. The term of our management agreement expires on February 1, 2017, subject to automatic renewal for additional 18-month periods, unless terminated earlier in accordance with the terms of the agreement.
The base management fee is calculated at a defined annualized percentage of “shareholders’ equity.” Our “shareholders’ equity” is defined as the sum of the net proceeds from any issuances of our equity securities since our inception (weighted for the time outstanding during the measurement period); plus our retained earnings at the end of the quarter; less any amount that we pay for repurchases of our common shares (weighted for the time held during the measurement period); and excluding one-time events pursuant to changes in GAAP and certain other non-cash charges after discussions between our Manager and our independent trustees and approval by a majority of our independent trustees.
Pursuant to our management agreement, the base management fee is equal to the sum of (i) 1.5% per annum of shareholders’ equity up to $2 billion, (ii) 1.375% per annum of shareholders’ equity in excess of $2 billion and up to $5 billion, and (iii) 1.25% per annum of shareholders’ equity in excess of $5 billion. The base management fee is paid in cash.
The performance incentive fee is calculated at a defined annualized percentage of the amount by which “net income,” on a rolling four-quarter basis and before deducting the incentive fee, exceeds certain levels of return on “equity.” For the purpose of determining the amount of the performance incentive fee, “net income” is defined as net income or loss computed in accordance with GAAP and certain other non-cash charges determined after discussions between our Manager and our independent trustees and approval by a majority of our independent trustees. For this purpose, “equity” is the weighted average of the issue price per common share of all of our public offerings, multiplied by the weighted average number of common shares outstanding (including restricted share units) in the four-quarter period.
The performance incentive fee is calculated quarterly and escalates as net income (stated as a percentage of return on equity) increases over certain thresholds. On each calculation date, the threshold amounts represent a stated return on equity, plus or minus a “high watermark” adjustment. The performance fee payable for any quarter is equal to: (a) 10% of the amount by which net income for the quarter exceeds (i) an 8% return on equity plus the high watermark, up to (ii) a 12% return on equity; plus (b) 15% of the amount by which net income for the quarter exceeds (i) a 12% return on equity plus the high watermark, up to (ii) a 16% return on equity; plus (c) 20% of the amount by which net income for the quarter exceeds a 16% return on equity plus the high watermark.
The “high watermark” is the quarterly adjustment that reflects the amount by which the net income (stated as a percentage of return on equity) in that quarter exceeds or falls short of the lesser of 8% and the Fannie Mae MBS Yield (the target yield) for such quarter. The “high watermark” starts at zero and is adjusted quarterly. If the net income is lower than the target yield, the high watermark is increased by the difference. If the net income is higher than the target yield, the high watermark is reduced by the difference. Each time a performance incentive fee is earned, the high watermark returns to zero. As a result, the threshold amounts required for our Manager to earn a performance incentive fee are adjusted cumulatively based on the performance of our net income over (or under) the target yield, until the net income in excess of the target yield exceeds the then-current cumulative high watermark amount, and a performance incentive fee is earned. The performance incentive fee may be paid in cash or in our common shares (subject to a limit of no more than 50% paid in common shares), at our option.
84
Counterparty Amount at risk (in thousands) Citibank, N.A. $ 373,474 Credit Suisse First Boston Mortgage Capital LLC 300,147 JPMorgan Chase & Co. 186,540 Bank of America, N.A. 56,826 Morgan Stanley Bank, N.A. 13,293 Daiwa Capital Markets America Inc. 7,639 BNP Paribas Corporate & Institutional Bank 3,817 Barclays Bank PLC 1,600
$ 943,336

Under our management agreement, our Manager is entitled to reimbursement of its organizational and operating expenses, including third-party expenses, incurred on our behalf. On December 15, 2015, we amended our management agreement to provide that the total costs and expenses incurred by our Manager in any quarter and reimbursable by us is capped at an amount equal to the quotient of (i) the product of (A) 70 basis points (0.0070), multiplied by (B) shareholders’ equity (as defined in the management agreement) as of the last day of such quarter, divided by (ii) four (4).
Our Manager may also be entitled to a termination fee under certain circumstances. Specifically, the termination fee is payable for (1) our termination of our management agreement without cause, (2) our Manager’s termination of our management agreement upon a default by us in the performance of any material term of the agreement that has continued uncured for a period of 30 days after receipt of written notice thereof or (3) our Manager’s termination of the agreement after the termination by us without cause (excluding a non-renewal) of our MBWS agreement, our MSR recapture agreement, or our servicing agreement (each as described and/or defined below). The termination fee is equal to three times the sum of (a) the average annual base management fee and (b) the average annual (or, if the period is less than 24 months, annualized) performance incentive fee, in each case earned by our Manager during the 24-month period before termination.
Our management agreement also provides that, prior to the undertaking by our Manager or its affiliates of any new investment opportunity or any other business opportunity requiring a source of capital with respect to which our Manager or its affiliates will earn a management, advisory, consulting or similar fee, our Manager shall present to us such new opportunity and the material terms on which our Manager proposes to provide services to us before pursuing such opportunity with third parties.
Servicing Agreement. We have entered into a servicing agreement with our Servicer pursuant to which our Servicer provides servicing for our portfolio of residential mortgage loans. The loan servicing provided by our Servicer includes collecting principal, interest and escrow account payments, if any, with respect to mortgage loans, as well as managing loss mitigation, which may include, among other things, collection activities, loan workouts, modifications, foreclosures and short sales. Our Servicer also engages in certain loan origination activities that include refinancing mortgage loans and financings that facilitate sales of real estate owned properties, or REOs. The term of our servicing agreement, as amended, expires on February 1, 2017, subject to automatic renewal for additional 18-month periods, unless terminated earlier in accordance with the terms of the agreement.
The base servicing fees for distressed whole loans are calculated based on a monthly per-loan dollar amount, with the actual dollar amount for each loan based on the delinquency, bankruptcy and/or foreclosure status of such loan or whether the underlying mortgaged property has become REO. Presently, the base servicing fee rates for distressed whole loans range from $30 per month for current loans up to $125 per month for loans that are in foreclosure. The base servicing fee rate for REO is $75 per month. To the extent that we rent our REO under our REO rental program, we pay our Servicer an REO rental fee of $30 per month per REO and a property management fee in an amount equal to our Servicer’s cost if property management services and/or any related software costs are outsourced to a third-party property management firm or 9% of gross rental income if our Servicer provides property management services directly.
The base servicing fees for loans subserviced by our Servicer on our behalf are also calculated through a monthly per-loan dollar amount, with the actual dollar amount for each loan based on whether the mortgage loan is a fixed-rate or adjustable-rate loan. The base servicing fees for loans subserviced on our behalf are $7.50 per month for fixed-rate loans and $8.50 per month for adjustable-rate mortgage loans. To the extent that these loans become delinquent, our Servicer is entitled to an additional servicing fee per loan falling within a range of $10 to $55 per month and based on the delinquency, bankruptcy and foreclosure status of the loan or $75 per month if the underlying mortgaged property becomes REO. Our Servicer is also entitled to customary ancillary income and certain market-based fees and charges, including boarding and deboarding fees, liquidation and disposition fees, and assumption, modification and origination fees.
In addition, because we do not have any employees or infrastructure, our Servicer is required to provide a range of services and activities significantly greater in scope than the services provided in connection with a customary servicing arrangement. For these services, our Servicer receives a supplemental servicing fee of $25 per month for each distressed whole loan and, through August 31, 2015, received a supplemental fee of $3.25 per month for each non-distressed subserviced loan. With respect to non-distressed subserviced mortgage loans, the supplemental servicing fee was subject to a cap of $700,000 per quarter. The supplemental servicing fee for non-distressed subserviced mortgage loans was eliminated, effective as of September 1, 2015. Our Servicer is entitled to reimbursement for all customary, bona fide reasonable and necessary out-of-pocket expenses incurred by our Servicer in connection with the performance of its servicing obligations.
Except as otherwise provided in our MSR recapture agreement, when our Servicer effects a refinancing of a loan on our behalf and not through a third-party lender and the resulting loan is readily saleable, or our Servicer originates a loan to facilitate the disposition of the real estate acquired by us in settlement of a loan, our Servicer is entitled to receive from us market-based fees and compensation consistent with pricing and terms our Servicer offers unaffiliated third parties on a retail basis.
85
To the extent that our Servicer participates in HAMP (or other similar mortgage loan modification programs), our Servicer is entitled to retain any incentive payments made to it and to which it is entitled under HAMP, provided that, with respect to any incentive payments paid to our Servicer in connection with a mortgage loan modification for which we previously paid our Servicer a modification fee, our Servicer is required to reimburse us an amount equal to the incentive payments.
Mortgage Banking and Warehouse Services Agreement. We have also entered into a mortgage banking and warehouse services agreement (the “MBWS agreement”), pursuant to which our Servicer provides us with certain mortgage banking services, including fulfillment and disposition-related services, with respect to loans acquired by us from correspondent lenders, and certain warehouse lending services, including fulfillment and administrative services, with respect to loans financed by us for our warehouse lending clients. The term of our MBWS agreement expires on February 1, 2017, subject to automatic renewal for additional 18-month periods, unless terminated earlier in accordance with the terms of the agreement.
Under our MBWS agreement, our Servicer has agreed to provide the mortgage banking services exclusively for our benefit, and our Servicer and its affiliates are prohibited from providing such services for any other third party. However, such exclusivity and prohibition shall not apply, and certain other duties instead will be imposed upon our Servicer, if we are unable to purchase or finance mortgage loans as contemplated under our MBWS agreement for any reason.
In consideration for the mortgage banking services provided by our Servicer with respect to our acquisition of mortgage loans, our Servicer is entitled to a fulfillment fee based on the type of mortgage loan that we acquire and equal to a percentage of the unpaid principal balance of such mortgage loan. Presently, the applicable percentages are (i) 0.50% for conventional mortgage loans, (ii) 0.88% for loans sold in accordance with the Ginnie Mae Mortgage-Backed Securities Guide, and (iii) 0.50% for all other mortgage loans not contemplated above; provided, however, that our Servicer may, in its sole discretion, reduce the amount of the applicable fulfillment fee and credit the amount of such reduction to the reimbursement otherwise due as described below. This reduction may only be credited to the reimbursement applicable to the month in which the related mortgage was funded.
We do not hold the Ginnie Mae approval required to issue Ginnie Mae MBS and act as a servicer. Accordingly, under our MBWS agreement, our Servicer currently purchases loans saleable in accordance with the Ginnie Mae Mortgage-Backed Securities Guide “as is” and without recourse of any kind from us at cost less an administrative fee paid by the correspondent to us plus accrued interest and a sourcing fee of three basis points.
In the event that we purchase mortgage loans with a total UPB in any month greater than $2.5 billion and less than $5 billion, our Servicer has agreed to discount the amount of such fulfillment fees by reimbursing us an amount equal to the product of (i) 0.025%, (ii) the amount of UPB in excess of $2.5 billion, and (iii) the percentage of the total UPB relating to mortgage loans for which we paid fulfillment fees in such month. In the event we purchase mortgage loans with a total UPB in any month greater than $5 billion, our Servicer has agreed to further discount the amount of fulfillment fees by reimbursing us an amount equal to the product of (i) 0.05%, (ii) the amount of UPB in excess of $5 billion, and (iii) the percentage of total UPB relating to mortgage loans for which we paid fulfillment fees in such month.
In consideration for the mortgage banking services provided by our Servicer with respect to our acquisition of mortgage loans under our Servicer’s early purchase program, our Servicer is entitled to fees accruing (i) at a rate equal to $1,500 per annum, and (ii) in the amount of $35 for each mortgage loan that we acquire. In consideration for the warehouse services provided by our Servicer with respect to mortgage loans that we finance for our warehouse lending clients, with respect to each facility, our Servicer is entitled to fees accruing (i) at a rate equal to $40,000 per annum for each of the first twenty (20) warehouse lending facilities active in any month and $10,000 per annum for each additional warehouse lending facility active in any month, and (ii) in the amount of $50 with respect to each mortgage loan that we finance thereunder. Where we have entered into both an early purchase agreement and a warehouse lending agreement with the same client, our Servicer shall only be entitled, with respect to any mortgage loan that becomes subject to both such agreements, to the $50 per mortgage loan fee provided under the warehouse lending agreement.
Notwithstanding any provision of our MBWS agreement to the contrary, if it becomes reasonably necessary or advisable for our Servicer to engage in additional services in connection with post-breach or post-default resolution activities for the purposes of a correspondent agreement, a warehouse agreement or a re-warehouse agreement, then we have generally agreed with our Servicer to negotiate in good faith for additional compensation and reimbursement of expenses to be paid to our Servicer for the performance of such additional services.
MSR Recapture Agreement. Effective February 1, 2013, we entered into an MSR recapture agreement with our Servicer. Pursuant to the terms of our MSR recapture agreement, if our Servicer refinances through its consumer direct lending business loans for which we previously held the MSRs, our Servicer is generally required to transfer and convey to us, without cost to us, the MSRs with respect to new mortgage loans originated in those refinancings (or, under certain circumstances, other mortgage loans) that have an aggregate unpaid principal balance that is not less than 30% of the total UPB of all such loans so originated. Where the fair market value of the aggregate MSRs to be transferred for the applicable month is less than $200,000, our Servicer may, at its option, wire
86

cash to us in an amount equal to such fair market value in lieu of transferring such MSRs. The initial term of our MSR recapture agreement expires, unless terminated earlier in accordance with the terms of the agreement, on February 1, 2017, subject to automatic renewal for additional 18-month periods, unless terminated in accordance with the terms of the agreement.
Spread Acquisition and MSR Servicing Agreements. Effective February 1, 2013, we entered into a master spread acquisition and MSR servicing agreement (the “2/1/13 Spread Acquisition Agreement”), pursuant to which we may acquire from our Servicer the rights to receive certain ESS arising from MSRs acquired by our Servicer from banks and other third-party financial institutions. Our Servicer is generally required to service or subservice the related mortgage loans for the applicable agency or investor. To date, we have only used the 2/1/13 Spread Acquisition Agreement for the purpose of acquiring ESS relating to Fannie Mae MSRs. The terms of each transaction under the 2/1/13 Spread Acquisition Agreement are subject to the specific terms thereof, as modified and supplemented by the terms of a confirmation executed in connection with such transaction.
To the extent our Servicer refinances any of the mortgage loans relating to the ESS we have acquired, the 2/1/13 Spread Acquisition Agreement contains recapture provisions requiring that our Servicer transfer to us, at no cost, the ESS relating to a certain percentage of the unpaid principal balance of the newly originated mortgage loans. To the extent the fair market value of the aggregate ESS to be transferred for the applicable month is less than $200,000, our Servicer may, at its option, wire cash to us in an amount equal to such fair market value in lieu of transferring such ESS.
On December 19, 2014, we entered into a second master spread acquisition and MSR servicing agreement with our Servicer (the “12/19/14 Spread Acquisition Agreement”). The terms of the 12/19/14 Spread Acquisition Agreement are substantially similar to the terms of the 2/1/13 Spread Acquisition Agreement, except that we only intend to purchase ESS relating to Freddie Mac MSRs under the 12/19/14 Spread Acquisition Agreement.
To the extent our Servicer refinances any of the mortgage loans relating to the ESS we have acquired, the 12/19/14 Spread Acquisition Agreement also contains recapture provisions requiring that our Servicer transfer to us, at no cost, the ESS relating to a certain percentage of the unpaid principal balance of the newly originated mortgage loans. To the extent the fair market value of the aggregate ESS to be transferred for the applicable month is less than $200,000, our Servicer may, at its option, wire cash to us in an amount equal to such fair market value in lieu of transferring such ESS.
On April 30, 2015, we amended and restated a third master spread acquisition and MSR servicing agreement with our Servicer (the “4/30/15 Spread Acquisition Agreement”). The terms of the 4/30/15 Spread Acquisition Agreement are substantially similar to the terms of the 2/1/13 Spread Acquisition Agreement and the 12/19/14 Spread Acquisition Agreement, except that we only intend to purchase ESS relating to Ginnie Mae MSRs under the 4/30/15 Spread Acquisition Agreement.
To the extent our Servicer refinances any of the mortgage loans relating to the ESS we have acquired, the 4/30/15 Spread Acquisition Agreement also contains recapture provisions requiring that our Servicer transfer to us, at no cost, the ESS relating to a certain percentage of the unpaid principal balance of the newly originated mortgage loans. However, under the 4/30/15 Spread Acquisition Agreement, in any month where the transferred ESS relating to newly originated Ginnie Mae mortgage loans is not equivalent to at least 90% of the product of the excess servicing fee rate and the unpaid principal balance of the refinanced mortgage loans, our Servicer is also required to transfer additional ESS or cash in the amount of such shortfall. Similarly, in any month where the transferred ESS relating to modified Ginnie Mae mortgage loans is not equivalent to at least 90% of the product of the excess servicing fee rate and the unpaid principal balance of the modified mortgage loans, the 4/30/15 Spread Acquisition Agreement contains provisions that require our Servicer to transfer additional ESS or cash in the amount of such shortfall. To the extent the fair market value of the aggregate ESS to be transferred for the applicable month is less than $200,000, our Servicer may, at its option, wire cash to us in an amount equal to such fair market value in lieu of transferring such ESS.
In connection with our entry into the 4/30/15 Spread Acquisition Agreement, we were also required to amend and restate the terms of a Security and Subordination Agreement (the “Security Agreement”) with CSFB. Under the terms of the Security Agreement, we pledged to CSFB our rights under the 4/30/15 Spread Acquisition Agreement and our interest in any ESS purchased thereunder. The Security Agreement is required as a result of a separate repurchase agreement between our Servicer and CSFB (the “MSR Repo”), pursuant to which our Servicer finances Ginnie Mae MSRs and servicing advance receivables and pledges to CSFB all of its rights and interests in any Ginnie Mae MSRs it owns or acquires, and a separate acknowledgement agreement with respect thereto, by and among Ginnie Mae, CSFB and our Servicer. As a condition to permitting our Servicer to transfer to us the ESS relating to a portion of those pledged Ginnie Mae MSRs, CSFB requires such transfer to be subject to CSFB’s continuing lien on the ESS, the pledge and acknowledgement of which were effected pursuant to the Security Agreement. CSFB’s lien on the ESS remains subordinate to the rights and interests of Ginnie Mae pursuant to the provisions of the 4/30/15 Spread Acquisition Agreement and the terms of the acknowledgement agreement.
The Security Agreement contains representations, warranties and covenants by us that are substantially similar to those contained in our other financing arrangements with CSFB. The Security Agreement also permits CSFB to liquidate our ESS along
87

with the related MSRs to the extent there exists an event of default under the MSR Repo, and it contains certain trigger events, including breaches of representations, warranties or covenants and defaults under other of our credit facilities, that would require our Servicer to either (i) repay in full the outstanding loan amount under the MSR Repo or (ii) repurchase the ESS from us at fair market value. To the extent our Servicer is unable to repay the loan under the MSR Repo or repurchase our ESS, an event of default would exist under the MSR Repo, thereby entitling CSFB to liquidate the ESS and the related MSRs. In the event our ESS is liquidated as a result of certain actions or inactions of our Servicer, we generally would be entitled to seek indemnity under the 4/30/15 Spread Acquisition Agreement.
Note Payable to our Servicer
In connection with the MSR Repo and the Security Agreement described above, we entered into an underlying loan and security agreement with our Servicer, dated as of April 30, 2015, pursuant to which we may borrow up to $150 million from our Servicer for the purpose of financing our investment in ESS (the “Underlying LSA”). In order to secure our borrowings, we pledge our ESS to our Servicer under the Underlying LSA, and our Servicer, in turn, re-pledges such ESS to CSFB under the MSR Repo.
The principal amount of the borrowings under the Underlying LSA is based upon a percentage of the market value of the ESS pledged to our Servicer, subject to the $150 million sublimit described above. Pursuant to the Underlying LSA, we granted to our Servicer a security interest in all of our right, title and interest in, to and under the ESS pledged to secure the borrowings.
We have agreed with our Servicer in connection with the Underlying LSA that we are required to repay our Servicer the principal amount of borrowings plus accrued interest to the date of such repayment, and our Servicer, in turn, is required to repay CSFB the corresponding amount under the MSR Repo. Interest accrues on our note relating to the Underlying LSA at a rate based on CSFB’s cost of funds under the MSR Repo. We were also required to pay our Servicer a fee for the structuring of the Underlying LSA in an amount equal to the portion of the corresponding fee paid by our Servicer to CSFB and allocable to the increase in the maximum loan amount under the MSR Repo resulting from the ESS financing.by PLS to CSFB and allocable to the increase in the maximum loan amount under the MSR Repo resulting from the ESS financing.
Borrowings of $150.0 million on the Underlying LSA were outstanding as of December 31, 2015, which are included in Note payable to PennyMac Financial Services, Inc. on our consolidated balance sheet.
Reimbursement Agreement. In connection with the initial public offering of our common shares (“IPO”), on August 4, 2009, we entered into an agreement with PCM pursuant to which we agreed to reimburse PCM for the $2.9 million payment that it made to the underwriters for the IPO (the “Conditional Reimbursement”) if we satisfied certain performance measures over a specified period of time. Effective February 1, 2013, we amended the terms of the reimbursement agreement to provide for the reimbursement of PCM of the Conditional Reimbursement if we are required to pay PCM performance incentive fees under our management agreement at a rate of $10 in reimbursement for every $100 of performance incentive fees earned. The reimbursement of the Conditional Reimbursement is subject to a maximum reimbursement in any particular 12-month period of $1.0 million and the maximum amount that may be reimbursed under the agreement is $2.9 million. The reimbursement agreement also provides for the payment to the IPO underwriters of the payment that we agreed to make to them at the time of the IPO if we satisfied certain performance measures over a specified period of time. As PCM earns performance incentive fees under our management agreement, the IPO underwriters will be paid at a rate of $20 of payments for every $100 of performance incentive fees earned by PCM. The payment to the underwriters is subject to a maximum reimbursement in any particular 12-month period of $2.0 million and the maximum amount that may be paid under the agreement is $5.9 million.
In the event the termination fee is payable to our Manager under our management agreement and our Manager and the underwriters have not received the full amount of the reimbursements and payments under the reimbursement agreement, such amount will be paid in full. The term of the reimbursement agreement expires on February 1, 2019.
88

Quantitative and Qualitative Disclosures About Market Risk
Market risk is the exposure to loss resulting from changes in interest rates, foreign currency exchange rates, commodity prices, equity prices, real estate values and other market-based risks. The primary market risks that we are exposed to are real estate risk, credit risk, interest rate risk, prepayment risk, inflation risk and market value risk. Our primary trading asset is our inventory of mortgage loans acquired for sale. We believe that such assets’ fair values respond primarily to changes in the market interest rates for comparable recently-originated mortgage loans. Our other market-risk assets are a substantial portion of our investments and are comprised of distressed mortgage nonperforming loans and MSRs. We believe that the fair values of MSRs also respond primarily to changes in the market interest rates for comparable mortgage loans. We believe that the fair values of our investment in distressed mortgage loans respond primarily to changes in the fair value of the real estate securing such loans.
Real Estate Risk
Residential property values are subject to volatility and may be affected adversely by a number of factors, including, but not limited to, national, regional and local economic conditions (which may be adversely affected by industry slowdowns and other factors); local real estate conditions (such as an oversupply of housing); construction quality, age and design; demographic factors; and retroactive changes to building or similar codes. Decreases in property values reduce the value of the collateral and the potential proceeds available to a borrower to repay our loans, which could cause us to suffer losses.
Credit Risk
We are subject to credit risk in connection with our investments. A significant portion of our assets is comprised of residential mortgage loans. The credit risk related to these investments pertains to the ability and willingness of the borrowers to pay, which is assessed before credit is granted. We believe that residual loan credit quality is primarily determined by the borrowers’ credit profiles and loan characteristics.
Interest Rate Risk
Interest rate risk is highly sensitive to many factors, including governmental monetary and tax policies, domestic and international economic and political considerations and other factors beyond our control. Changes in interest rates affect the fair value of, interest income and net servicing income we earn from our mortgage-related investments. This effect is most pronounced with fixed-rate investments, MSRs and ESS. In general, rising interest rates negatively affect the fair value of our investments in MBS and mortgage loans, while decreasing market interest rates negatively affect the fair value of our MSRs and ESS.
Our operating results will depend, in part, on differences between the income from our investments and our financing costs. Presently much of our debt financing is based on a floating rate of interest calculated on a fixed spread over the relevant index, as determined by the particular financing arrangement.
In the event of a significant rising interest rate environment and/or economic downturn, defaults could increase and result in credit losses to us, which could materially and adversely affect our business, financial condition, liquidity, results of operations and prospects. Furthermore, such defaults could have an adverse effect on the spread between our interest earning assets and interest bearing liabilities.
We engage in interest rate risk management activities in an effort to reduce the variability of earnings caused by changes in interest rates. To manage this price risk resulting from interest rate risk, we use derivative financial instruments acquired with the intention of moderating the risk that changes in market interest rates will result in unfavorable changes in the value of our interest rate lock commitments, inventory of mortgage loans acquired for sale, MBS, ESS, mortgage loans and MSRs. We do not use derivative financial instruments for purposes other than in support of our risk management activities.
Prepayment Risk
To the extent that the actual prepayment rate on our mortgage loans differs from what we projected when we purchased the loans and when we measured fair value as of the end of each reporting period, our unrealized gain or loss will be affected. As we receive prepayments of principal on our MBS investments, any premiums paid for such investments will be amortized against interest income using the interest method through the expected maturity dates of the investments. In general, an increase in prepayment rates will accelerate the amortization of purchase premiums, thereby reducing the interest income earned on the MBS investments and will accelerate the amortization of MSRs and ESS thereby reducing net servicing income. Conversely, as we receive prepayments of principal on our investments, any discounts realized on the purchase of such investments will be accrued into interest income using the interest method through the expected maturity dates of the investments. In general, an increase in prepayment rates will accelerate the accrual of purchase discounts, thereby increasing the interest income earned on the MBS investments.
89

Inflation Risk
Virtually all of our assets and liabilities are interest rate sensitive in nature. As a result, interest rates and other factors will influence our performance more so than inflation. Changes in interest rates do not necessarily correlate with inflation rates or changes in inflation rates. Furthermore, our consolidated financial statements are prepared in accordance with GAAP and any distributions we may make to our shareholders will be determined by our board of trustees based primarily on our taxable income and, in each case, our activities and balance sheet are measured with reference to historical cost and/or fair value without considering inflation.
Market Value Risk
Our mortgage loans and MBS are reported at their fair values. The fair value of these assets fluctuates primarily based on whether the mortgage loans are distressed or whether the MBS are backed by distressed mortgage loans. Mortgage loans (along with any related recognized IRLCs) and MBS that are backed by performing mortgage loans are more sensitive to changes in market interest rates, while mortgage loans and MBS backed by distressed mortgage loans are more sensitive to changes in real estate values and other factors such as the credit performance relating to the loans underlying our investments and the effectiveness and servicing practices of the servicers associated with the properties securing such investment.
Generally, in an interest rate market where interest rates are rising or are expected to rise, the fair value of our mortgage loans would be expected to decrease, whereas in an interest rate market where interest rates are generally decreasing or are expected to decrease, mortgage loan values would be expected to increase. The fair value of MSRs, on the other hand, tends to respond generally in an opposite manner to that of mortgage loans acquired for sale.
Generally, in a real estate market where values are rising or are expected to rise, the fair value of our investment in distressed mortgage loans would be expected to appreciate, whereas in a real estate market where values are generally dropping or are expected to drop, the fair values of distressed mortgage loan values would be expected to decrease.
The following table summarizes the estimated change in fair value of our portfolio of distressed mortgage loans (comprised of mortgage loans at fair value, excluding mortgage loans at fair value held by VIE) as of December 31, 2015, given several hypothetical (instantaneous) changes in home values from those used in estimating fair value:
The following table summarizes the estimated change in fair value of our mortgage loans at fair value held by VIE as of December 31, 2015, net of the effect of changes in fair value of the related asset-backed financing of the VIE at fair value, given several hypothetical (instantaneous) changes in interest rates and parallel shifts in the yield curve:
90
Property value shift in % -15% -10% -5% +5% +10% +15% (dollars in thousands)Fair value $1,884,960 $1,951,390 $2,011,647 $2,114,995 $2,158,808 $2,197,534 Change in fair value:
$ $ (181,143) $ (114,713) $ (54,456) $ 48,893 $ 92,705 $ 131,431 % (8.77)% (5.55)% (2.64)% 2.37% 4.49% 6.36%
Interest rate shift in basis points -200 -100 -50 50 100 200 (dollar in thousands)Fair value $369,751 $365,057 $360,046 $344,566 $334,490 $314,279 Change in fair value:
$ $ 16,309 $ 11,615 $ 6,605 $ (8,876) $ (18,952) $ (39,163) % 4.61% 3.29% 1.87% (2.51)% (5.36)% (11.08)%

Mortgage Servicing Rights
The following tables summarize the estimated change in fair value of MSRs accounted for using the amortization method as of December 31, 2015, given several shifts in pricing spreads, prepayment speed and annual per-loan cost of servicing:
The following tables summarize the estimated change in fair value of MSRs accounted for using the fair value option method as of December 31, 2015, given several shifts in pricing spreads, prepayment speed and annual per-loan cost of servicing:
Pricing spread shift in % -20% -10% -5% +5% +10% +20% (dollars in thousands)Fair value $451,828 $437,568 $430,759 $417,743 $411,519 $399,601 Change in fair value:
$ $ 27,674 $ 13,414 $ 6,605 $ (6,411) $ (12,635) $ (24,553) % 6.52% 3.16% 1.56% (1.51)% (2.98)% (5.79)%
Prepayment speed shift in % -20% -10% -5% +5% +10% +20% (dollars in thousands)Fair value $460,077 $441,420 $432,623 $415,995 $408,130 $393,216 Change in fair value:
$ $ 35,923 $ 17,266 $ 8,469 $ (8,159) $ (16,024) $ (30,938) % 8.47% 4.07% 2.00% (1.92)% (3.78)% (7.29)%
Per-loan servicing cost shift in % -20% -10% -5% +5% +10% +20% (dollars in thousands)Fair value $435,122 $429,638 $426,896 $421,412 $418,670 $413,186 Change in fair value:
$ $ 10,968 $ 5,484 $ 2,742 $ (2,742) $ (5,484) $ (10,968) % 2.59% 1.29% 0.65% (0.65)% (1.29)% (2.59)%
Pricing spread shift in % -20% -10% -5% +5% +10% +20% (dollars in thousands)Fair value $70,651 $68,557 $67,556 $65,640 $64,722 $62,963 Change in fair value:
$ $ 4,067 $ 1,973 $ 972 $ (944) $ (1,862) $ (3,621) % 6.11% 2.96% 1.46% (1.42)% (2.80)% (5.44)%
Prepayment speed shift in % -20% -10% -5% +5% +10% +20% (dollars in thousands)Fair value $74,714 $70,444 $68,466 $64,791 $63,082 $59,892 Change in fair value:
$ $ 8,130 $ 3,860 $ 1,882 $ (1,793) $ (3,502) $ (6,692) % 12.21% 5.80% 2.83% (2.69)% (5.26)% (10.05)%
Per-loan servicing cost shift in % -20% -10% -5% +5% +10% +20% (dollars in thousands)Fair value $68,464 $67,524 $67,054 $66,114 $65,644 $64,703 Change in fair value:
$ $ 1,880 $ 940 $ 470 $ (470) $ (940) $ (1,880) % 2.82% 1.41% 0.71% (0.71)% (1.41)% (2.82)%

Excess servicing spread
The following tables summarize the estimated change in fair value of our ESS as of December 31, 2015, given several shifts in pricing spreads and prepayment speed:
91
Pricing spread shift in % -20% -10% -5% +5% +10% +20% (dollars in thousands) Fair value $433,769 $422,826 $417,560 $407,417 $402,530 $393,104 Change in fair value:
$ $ 21,343 $ 10,401 $ 5,135 $ (5,009) $ (9,896) $ (19,321) % 5.18% 2.52% 1.25% (1.21)% (2.40)% (4.68)%
Prepayment speed shift in % -20% -10% -5% +5% +10% +20% (dollars in thousands) Fair value $451,609 $431,193 $421,615 $403,604 $395,127 $379,132 Change in fair value:
$ $ 39,183 $ 18,767 $ 9,190 $ (8,821) $ (17,298) $ (33,293) % 9.50% 4.55% 2.23% (2.14)% (4.19)% (8.07)%
Accounting Developments
In February 2015, the Financial Accounting Standards Board’s (“FASB”) Accounting Standards Codification (“ASC”) issued ASU 2015-02, Consolidation (Topic 810): Amendments to the Consolidation Analysis (“ASU 2015-02”). ASU 2015-02 affects reporting entities that are required to evaluate whether they should consolidate certain legal entities. ASU 2015-02 modifies the evaluation of whether limited partnerships and similar legal entities are VIEs or voting interest entities, eliminates the presumption that a general partner should consolidate a limited partnership and affects the consolidation analysis of reporting entities that are involved with VIEs, particularly those that have fee arrangements and related party relationships. ASU 2015-02 is effective for fiscal years, and for interim periods within those fiscal years, beginning after December 15, 2015. Early adoption is permitted. A reporting entity may apply the amendments in ASU 2015-02: (a) using a modified retrospective approach by recording a cumulative-effect adjustment to equity as of the beginning of the fiscal year of adoption; or (b) by applying the amendments retrospectively. We are currently assessing the potential effect that the adoption of ASU 2015-02 will have on our consolidated financial statements.
In April 2015, the FASB issued ASU No. 2015-03, Interest—Imputation of Interest (Subtopic 835-30): Simplifying the Presentation of Debt Issuance Costs (“ASU 2015-03”). The amendments in this ASU require that debt issuance costs related to a recognized debt liability be presented in the balance sheet as a direct deduction from the carrying amount of that debt liability, consistent with debt discounts. The recognition and measurement guidance for debt issuance costs are not affected by the amendments in this ASU. ASU 2015-03 should be applied on a retrospective basis and is effective for us for financial statements issued for fiscal years and interim periods within those fiscal years beginning after December 15, 2015.
We adopted ASU 2015-03 during the quarter ended June 30, 2015. As a result of the adoption of ASU 2015-03, we, on our December 31, 2015 consolidated balance sheet, reclassified $6.6 million in debt issuance costs from Other assets and allocated such costs in the amount of $1.5 million to Assets sold under agreements to repurchase; $92,000 to Notes payable and $4.9 million to Exchangeable Notes. There were no changes to our consolidated statements of income or consolidated statements of cash flows as a result of our adoption of ASU 2015-03.
On January 5, 2016, the FASB issued ASU 2016-01, Financial Instruments–Overall: Recognition and Measurement of Financial Assets and Financial Liabilities (“ASU 2016-01”). ASU 2016-01 affects the accounting for equity investments, financial liabilities under the fair value option, the presentation and disclosure requirements for financial instruments, and the valuation allowance assessment when recognizing deferred tax assets resulting from unrealized losses on available-for-sale debt securities.
ASU 2016-01 requires that:
The classification and measurement guidance will be effective for public business entities in fiscal years beginning after December 15, 2017, including interim periods within those fiscal years. All entities can early adopt the provision to record fair value changes for financial liabilities under the fair value option resulting from instrument-specific credit risk in other comprehensive income. Early adoption of these provisions can be elected for all financial statements of fiscal years and interim periods that have not yet been issued or that have not yet been made available for issuance. We are currently assessing the potential effect that the adoption of ASU 2016-01 will have on our consolidated financial statements.
92
• All equity investments in unconsolidated entities (other than those accounted for using the equity method of accounting) with readily determinable fair values will generally be measured at fair value through earnings.
• When the fair value option has been elected for financial liabilities, changes in fair value due to instrument-specific credit risk will be recognized separately in other comprehensive income. The accumulated gains and losses due to these changes will be reclassified from accumulated other comprehensive income to earnings if the financial liability is settled before maturity.
• For financial instruments measured at amortized cost, public business entities will be required to use the exit price when measuring the fair value of financial instruments for disclosure purposes.
• Financial assets and financial liabilities shall be presented separately in the notes to the financial statements,
grouped by measurement category (e.g., fair value, amortized cost, lower of cost or fair value) and form of financial asset (e.g., loans, securities).
• Public business entities will no longer be required to disclose the methods and significant assumptions used to estimate the fair value of financial instruments carried at amortized cost.
• Entities will have to assess the realizability of a deferred tax asset related to a debt security classified as available-for sale in combination with the entity’s other deferred tax assets.

In response to this Item 7A, the information set forth on pages 89 and 91 is incorporated herein by reference.
The information called for by this Item 8 is hereby incorporated by reference from our Financial Statements and Auditors’ Report beginning at page F-1 of this Report.
None
Disclosure Controls and Procedures
We maintain disclosure controls and procedures that are designed to ensure that information required to be disclosed in our reports filed under the Securities Exchange Act of 1934 (the “Exchange Act”) is recorded, processed, summarized and reported within the time periods specified in the SEC’s rules and forms, and that such information is accumulated and communicated to our management, including our Chief Executive Officer and Chief Financial Officer, as appropriate, to allow timely decisions regarding required disclosures. However, no matter how well a control system is designed and operated, it can provide only reasonable, not absolute, assurance that it will detect or uncover failures within our Company to disclose material information otherwise required to be set forth in our periodic reports.
Our management has conducted an evaluation, with the participation of our Chief Executive Officer and Chief Financial Officer, of the effectiveness of our disclosure controls and procedures as of the end of the period covered by this Report as required by paragraph (b) of Rules 13a-15 and 15d-15 under the Exchange Act. Based on our evaluation, our Chief Executive Officer and Chief Financial Officer have concluded that our disclosure controls and procedures were effective, as of the end of the period covered by this Report, to provide reasonable assurance that information required to be disclosed by us in the reports that we file or submit under the Exchange Act is recorded, processed, summarized and reported within the time periods specified in the applicable rules and forms, and that it is accumulated and communicated to our management, including our Chief Executive Officer and Chief Financial Officer, as appropriate, to allow timely decisions regarding required disclosure.
Internal Control over Financial Reporting
Management’s Annual Report on Internal Control over Financial Reporting
Our management is responsible for establishing and maintaining adequate internal control over financial reporting as defined in Exchange Act Rule 13a-15(f). Because of its inherent limitations, internal control over financial reporting may not prevent or detect misstatements. Also, projections of any evaluation of effectiveness to future periods are subject to the risk that controls may become inadequate because of changes in conditions, or that the degree of compliance with the policies or procedures may deteriorate. Management assessed the effectiveness of its internal control over financial reporting based on the criteria set forth by the Committee of Sponsoring Organizations of the Treadway Commission (COSO) in Internal Control—Integrated Framework (2013). Based on those criteria, management concluded that our internal control over financial reporting was effective as of December 31, 2015.
The effectiveness of our internal control over financial reporting as of December 31, 2015 has been audited by Deloitte & Touche LLP, an independent registered public accounting firm, as stated in their report which appears herein.
93
Item 7A. Quantitative and Qualitative Disclosures About Market Risk
Item 8. Financial Statements and Supplementary Data
Item 9. Changes in and Disagreements With Accountants on Accounting and Financial Disclosure
Item 9A. Controls and Procedures
REPORT OF INDEPENDENT REGISTERED PUBLIC ACCOUNTING FIRM
To the Board of Trustees and Shareholders of PennyMac Mortgage Investment Trust:
We have audited the internal control over financial reporting of PennyMac Mortgage Investment Trust and subsidiaries (“the Company”) as of December 31, 2015, based on criteria established in Internal Control—Integrated Framework (2013) issued by the Committee of Sponsoring Organizations of the Treadway Commission. The Company’s management is responsible for maintaining effective internal control over financial reporting and for its assessment of the effectiveness of internal control over financial reporting included in the accompanying Management’s Report on Internal Control Over Financial Reporting. Our responsibility is to express an opinion on the Company’s internal control over financial reporting based on our audit.
We conducted our audit in accordance with the standards of the Public Company Accounting Oversight Board (United States). Those standards require that we plan and perform the audit to obtain reasonable assurance about whether effective internal control over financial reporting was maintained in all material respects. Our audit included obtaining an understanding of internal control over financial reporting, assessing the risk that a material weakness exists, testing and evaluating the design and operating effectiveness of internal control based on the assessed risk, and performing such other procedures as we considered necessary in the circumstances. We believe that our audit provides a reasonable basis for our opinion.
A company’s internal control over financial reporting is a process designed by, or under the supervision of, the company’s principal executive and principal financial officers, or persons performing similar functions, and effected by the company’s board of trustees, management, and other personnel to provide reasonable assurance regarding the reliability of financial reporting and the preparation of financial statements for external purposes in accordance with generally accepted accounting principles. A company’s internal control over financial reporting includes those policies and procedures that (1) pertain to the maintenance of records that, in reasonable detail, accurately and fairly reflect the transactions and dispositions of the assets of the company; (2) provide reasonable assurance that transactions are recorded as necessary to permit preparation of financial statements in accordance with generally accepted accounting principles, and that receipts and expenditures of the company are being made only in accordance with authorizations of management and directors of the company; and (3) provide reasonable assurance regarding prevention or timely detection of unauthorized acquisition, use, or disposition of the company’s assets that could have a material effect on the financial statements.
Because of the inherent limitations of internal control over financial reporting, including the possibility of collusion or improper management override of controls, material misstatements due to error or fraud may not be prevented or detected on a timely basis. Also, projections of any evaluation of the effectiveness of the internal control over financial reporting to future periods are subject to the risk that the controls may become inadequate because of changes in conditions, or that the degree of compliance with the policies or procedures may deteriorate.
In our opinion, the Company maintained, in all material respects, effective internal control over financial reporting as of December 31, 2015, based on the criteria established in Internal Control—Integrated Framework (2013) issued by the Committee of Sponsoring Organizations of the Treadway Commission.
We have also audited, in accordance with the standards of the Public Company Accounting Oversight Board (United States), the consolidated financial statements as of and for the year ended December 31, 2015 of the Company and our report dated February 29, 2016 expressed an unqualified opinion on those financial statements.
94
/s/ DELOITTE & TOUCHE LLP Los Angeles, California February 29, 2016

Changes in Internal Control over Financial Reporting
There has been no change in our internal control over financial reporting during the quarter ended December 31, 2015, that has materially affected, or is reasonably likely to materially affect, our internal control over financial reporting.
None.
PART III
The information required by this Item 10 is hereby incorporated by reference from our definitive proxy statement, or will be contained in an amendment to this Report, in either case to be filed by April 29, 2016, which is within 120 days after the end of fiscal year 2015.
The information required by this Item 11 is hereby incorporated by reference from our definitive proxy statement, or will be contained in an amendment to this Report, in either case to be filed by April 29, 2016, which is within 120 days after the end of fiscal year 2015.
The information required by this Item 12 is hereby incorporated by reference from our definitive proxy statement, or will be contained in an amendment to this Report, in either case to be filed by April 29, 2016, which is within 120 days after the end of fiscal year 2015.
The information required by this Item 13 is hereby incorporated by reference from our definitive proxy statement, or will be contained in an amendment to this Report, in either case to be filed by April 29, 2016, which is within 120 days after the end of fiscal year 2015.
The information required by this Item 14 is hereby incorporated by reference from our definitive proxy statement, or will be contained in an amendment to this Report, in either case to be filed by April 29, 2016, which is within 120 days after the end of fiscal year 2015.
95
Item 9B. Other Information
Item 10. Directors, Executive Officers and Corporate Governance
Item 11. Executive Compensation
Item 12. Security Ownership of Certain Beneficial Owners and Management and Related Stockholder Matters
Item 13. Certain Relationships and Related Transactions, and Director Independence
Item 14. Principal Accounting Fees and Services

PART IV
96
Item 15. Exhibits and Financial Statement Schedules
Exhibit Number Exhibit Description
3.1
Declaration of Trust of PennyMac Mortgage Investment Trust, as amended and restated (incorporated by reference to Exhibit 3.1 of the Company’s Quarterly Report on Form 10-Q for the quarter ended September 30, 2009).
3.2
Amended and Restated Bylaws of PennyMac Mortgage Investment Trust (incorporated by reference to Exhibit 3.1 of the Company’s Current Report on Form 8-K filed on August 13, 2013).
4.1
Specimen Common Share Certificate of PennyMac Mortgage Investment Trust (incorporated by reference to Exhibit 4.1 of the Company’s Quarterly Report on Form 10-Q for the quarter ended September 30, 2009).
4.2
Indenture for Senior Debt Securities, dated as of April 30, 2013, among PennyMac Corp., PennyMac Mortgage Investment Trust and The Bank of New York Mellon Trust Company, N.A. (incorporated by reference to Exhibit 4.1 of the Company’s Current Report on Form 8-K filed on April 30, 2013).
4.3
First Supplemental Indenture, dated as of April 30, 2013, among PennyMac Corp., PennyMac Mortgage Investment Trust and The Bank of New York Mellon Trust Company, N.A. (incorporated by reference to Exhibit 4.2 of the Company’s Current Report on Form 8-K filed on April 30, 2013).
4.4 Form of 5.375% Exchangeable Senior Notes due 2020 (included in Exhibit 4.3).
10.1
Amended and Restated Limited Partnership Agreement of PennyMac Operating Partnership, L.P. (incorporated by reference to Exhibit 10.2 of the Company’s Quarterly Report on Form 10-Q for the quarter ended September 30, 2009).
10.2
Registration Rights Agreement, dated as of August 4, 2009, among PennyMac Mortgage Investment Trust, Stanford L. Kurland, David A. Spector, BlackRock Holdco II, Inc., Highfields Capital Investments LLC and Private National Mortgage Acceptance Company, LLC (incorporated by reference to Exhibit 10.1 of the Company’s Quarterly Report on Form 10-Q for the quarter ended September 30, 2009).
10.3
Amended and Restated Underwriting Fee Reimbursement Agreement, dated as of February 1, 2013, by and among PennyMac Mortgage Investment Trust, PennyMac Operating Partnership, L.P. and PNMAC Capital Management, LLC (incorporated by reference to Exhibit 1.6 of the Company’s Current Report on Form 8-K filed on February 7, 2013).
10.4
Amended and Restated Management Agreement, dated as of February 1, 2013, among PennyMac Mortgage Investment Trust, PennyMac Operating Partnership, L.P. and PNMAC Capital Management, LLC (incorporated by reference to Exhibit 1.1 of the Company’s Current Report on Form 8-K filed on February 7, 2013).
10.5
Amendment Number One to Amended and Restated Management Agreement, dated as of December 15, 2015, by and among PennyMac Mortgage Investment Trust, PennyMac Operating Partnership, L.P. and PNMAC Capital Management,LLC (incorporated by reference to Exhibit 10.1 of the Company’s Current Report on Form 8-K filed on December 18, 2015).
10.6
Second Amended and Restated Flow Servicing Agreement, dated as of March 1, 2013, between PennyMac Operating Partnership, L.P. and PennyMac Loan Services, LLC (incorporated by reference to Exhibit 10.14 of the Company’s Quarterly Report on Form 10-Q for the quarter ended March 31, 2013).
10.7
Amendment No. 1 to Second Amended and Restated Flow Servicing Agreement, dated as of November 14, 2013, between PennyMac Operating Partnership, L.P. and PennyMac Loan Services, LLC (incorporated by reference to Exhibit 10.1 of the Company’s Current Report on Form 8-K filed on November 20, 2013).
10.8
Amendment No. 2 to Second Amended and Restated Flow Servicing Agreement, dated as of June 1, 2014, between PennyMac Operating Partnership, L.P. and PennyMac Loan Services, LLC (incorporated by reference to Exhibit 10.8 of the Company’s Quarterly Report on Form 10-Q for the quarter ended June 30, 2014).
10.9
Amendment No. 3 to Second Amended and Restated Flow Servicing Agreement, dated as of December 11, 2014, between PennyMac Operating Partnership, L.P. and PennyMac Loan Services, LLC (incorporated by reference to Exhibit 10.8 of the Company’s Annual Report on Form 10-K for the year ended December 31, 2014).

97
Exhibit Number Exhibit Description
10.10
Amendment No. 4 to Second Amended and Restated Flow Servicing Agreement, dated as of March 31, 2015, between PennyMac Operating Partnership, L.P. and PennyMac Loan Services, LLC (incorporated by reference to Exhibit 10.9 of the Company’s Quarterly Report on Form 10-Q for the quarter ended March 31, 2015).
10.11
Amendment No. 5 to Second Amended and Restated Flow Servicing Agreement, dated as of September 1, 2015, between PennyMac Operating Partnership, L.P. and PennyMac Loan Services, LLC (incorporated by reference to Exhibit 10.10 of the Company’s Quarterly Report on Form 10-Q for the quarter ended September 30, 2015).
10.12†
PennyMac Mortgage Investment Trust 2009 Equity Incentive Plan (incorporated by reference to Exhibit 10.5 of the Company’s Quarterly Report on Form 10-Q for the quarter ended September 30, 2009).
10.13†
Form of Restricted Share Unit Award Agreement under the PennyMac Mortgage Investment Trust 2009 Equity Incentive Plan (incorporated by reference to Exhibit 10.8 to Amendment No. 3 to the Company’s Registration Statement on Form S-11, filed with the SEC on July 24, 2009).
10.14
Amended and Restated Master Repurchase Agreement, dated as of June 1, 2013, among Credit Suisse First Boston Mortgage Capital LLC, PennyMac Corp., PennyMac Mortgage Investment Trust and PennyMac Operating Partnership, L.P. (incorporated by reference to Exhibit 10.1 of the Company’s Current Report on Form 8-K filed June 5, 2013).
10.15
Amendment No. 1 to Amended and Restated Master Repurchase Agreement, dated as of August 29, 2013, among Credit Suisse First Boston Mortgage Capital LLC, PennyMac Corp., PennyMac Mortgage Investment Trust and PennyMac Operating Partnership, L.P. (incorporated by reference to Exhibit 10.1 of the Company’s Current Report on Form 8-K filed September 5, 2013).
10.16
Amendment No. 2 to Amended and Restated Master Repurchase Agreement, dated as of October 1, 2013, among Credit Suisse First Boston Mortgage Capital LLC, PennyMac Corp., PennyMac Mortgage Investment Trust and PennyMac Operating Partnership, L.P. (incorporated by reference to Exhibit 10.31 of the Company’s Annual Report on Form 10-K for the year ended December 31, 2013).
10.17
Amendment No. 3 to Amended and Restated Master Repurchase Agreement, dated as of December 27, 2013, among Credit Suisse First Boston Mortgage Capital LLC, PennyMac Corp., PennyMac Mortgage Investment Trust and PennyMac Operating Partnership, L.P. (incorporated by reference to Exhibit 10.1 of the Company’s Current Report on Form 8-K filed January 3, 2014).
10.18
Amendment No. 4 to Amended and Restated Master Repurchase Agreement, dated as of December 31, 2013, among Credit Suisse First Boston Mortgage Capital LLC, PennyMac Corp., PennyMac Mortgage Investment Trust and PennyMac Operating Partnership, L.P. (incorporated by reference to Exhibit 10.33 of the Company’s Annual Report on Form 10-K for the year ended December 31, 2013).
10.19
Amendment No. 5 to Amended and Restated Master Repurchase Agreement, dated as of January 10, 2014, among Credit Suisse First Boston Mortgage Capital LLC, PennyMac Corp., PennyMac Mortgage Investment Trust and PennyMac Operating Partnership, L.P. (incorporated by reference to Exhibit 10.33 of the Company’s Quarterly Report on Form 10-Q for the quarter ended March 31, 2014).
10.20
Amendment No. 6 to Amended and Restated Master Repurchase Agreement, dated as of February 21, 2014, among Credit Suisse First Boston Mortgage Capital LLC, PennyMac Corp., PennyMac Mortgage Investment Trust and PennyMac Operating Partnership, L.P. (incorporated by reference to Exhibit 10.3 of the Company’s Current Report on Form 8-K filed on February 24, 2014).
10.21
Amendment No. 7 to Amended and Restated Master Repurchase Agreement, dated as of May 22, 2014, among Credit Suisse First Boston Mortgage Capital LLC, PennyMac Corp., PennyMac Mortgage Investment Trust and PennyMac Operating Partnership, L.P. (incorporated by reference to Exhibit 10.33 of the Company’s Quarterly Report on Form 10-Q for the quarter ended June 30, 2014).
10.22
Amendment No. 8 to Amended and Restated Master Repurchase Agreement, dated as of October 31, 2014, among Credit Suisse First Boston Mortgage Capital LLC, PennyMac Corp., PennyMac Mortgage Investment Trust and PennyMac Operating Partnership, L.P. (incorporated by reference to Exhibit 10.24 of the Company’s Quarterly Report on Form 10-Q for the quarter ended September 30, 2014).
98
Exhibit Number Exhibit Description
10.23
Amendment No. 9 to Amended and Restated Master Repurchase Agreement, dated as of December 23, 2014, among Credit Suisse First Boston Mortgage Capital LLC, PennyMac Corp., PennyMac Mortgage Investment Trust and PennyMac Operating Partnership, L.P. (incorporated by reference to Exhibit 10.20 of the Company’s Annual Report on Form 10-K for the year ended December 31, 2014).
10.24
Amendment No. 10 to Amended and Restated Master Repurchase Agreement, dated as of April 30, 2015, among Credit Suisse First Boston Mortgage Capital LLC, PennyMac Corp., PennyMac Mortgage Investment Trust and PennyMac Operating Partnership, L.P. (incorporated by reference to Exhibit 10.22 of the Company’s Quarterly Report on Form 10-Q for the quarter ended March 31, 2015).
10.25
Amendment No. 11 to Amended and Restated Master Repurchase Agreement, dated as of July 27, 2015, among Credit Suisse First Boston Mortgage Capital LLC, PennyMac Corp., PennyMac Mortgage Investment Trust and PennyMac Operating Partnership, L.P. (incorporated by reference to Exhibit 10.23 of the Company’s Quarterly Report on Form 10-Q for the quarter ended June 30, 2015).
10.26
Amendment No. 12 to Amended and Restated Master Repurchase Agreement, dated as of October 30, 2015, among Credit Suisse First Boston Mortgage Capital LLC, PennyMac Corp., PennyMac Mortgage Investment Trust and PennyMac Operating Partnership, L.P. (incorporated by reference to Exhibit 10.25 of the Company’s Quarterly Report on Form 10-Q for the quarter ended September 30, 2015).
10.27
Amendment No. 13 to Amended and Restated Master Repurchase Agreement, dated as of December 15, 2015, among Credit Suisse First Boston Mortgage Capital LLC, PennyMac Corp., PennyMac Mortgage Investment Trust and PennyMac Operating Partnership, L.P.
10.28
Amendment No. 14 to Amended and Restated Master Repurchase Agreement, dated as of January 28, 2016, among Credit Suisse First Boston Mortgage Capital LLC, PennyMac Corp., PennyMac Mortgage Investment Trust and PennyMac Operating Partnership, L.P.
10.29
Guaranty, dated as of November 2, 2010, by PennyMac Mortgage Investment Trust and PennyMac Operating Partnership, L.P. and Credit Suisse First Boston Mortgage Capital LLC (incorporated by reference to Exhibit 10.14 of the Company’s Quarterly Report on Form 10-Q for the quarter ended September 30, 2010).
10.30
Master Repurchase Agreement, dated as of December 9, 2010, among PennyMac Corp., PennyMac Mortgage Investment Trust Holdings I, LLC, and PennyMac Loan Services, LLC, and Citibank, N.A. (incorporated by reference to Exhibit 1.1 of the Company’s Current Report on Form 8-K filed on December 15, 2010).
10.31
Amendment Number One to the Master Repurchase Agreement, dated as of February 25, 2011, by and among Citibank, N.A. and PennyMac Corp., PennyMac Mortgage Investment Trust Holdings I, LLC and PennyMac Loan Services, LLC (incorporated by reference to Exhibit 1.1 of the Company’s Current Report on Form 8-K filed on March 3, 2011).
10.32
Amendment Number Two to the Master Repurchase Agreement, dated as of December 8, 2011, by and among Citibank, N.A. and PennyMac Corp., PennyMac Mortgage Investment Trust Holdings I, LLC and PennyMac Loan Services, LLC (incorporated by reference to Exhibit 10.28 of the Company’s Annual Report on Form 10-K for the year ended December 31, 2011).
10.33
Amendment Number Three to the Master Repurchase Agreement, dated as of February 24, 2012, by and among Citibank, N.A. and PennyMac Corp., PennyMac Mortgage Investment Trust Holdings I, LLC and PennyMac Loan Services, LLC (incorporated by reference to Exhibit 10.30 of the Company’s Quarterly Report on Form 10-Q for the quarter ended March 31, 2012).
10.34
Amendment Number Four to the Master Repurchase Agreement, dated as of April 13, 2012, by and among Citibank, N.A. and PennyMac Corp., PennyMac Mortgage Investment Trust Holdings I, LLC and PennyMac Loan Services, LLC (incorporated by reference to Exhibit 10.32 of the Company’s Quarterly Report on Form 10-Q for the quarter ended June 30, 2012).
10.35
Amendment Number Five to the Master Repurchase Agreement, dated as of April 20, 2012, by and among Citibank, N.A. and PennyMac Corp., PennyMac Mortgage Investment Trust Holdings I, LLC and PennyMac Loan Services, LLC (incorporated by reference to Exhibit 10.33 of the Company’s Quarterly Report on Form 10-Q for the quarter ended June 30, 2012).

99
Exhibit Number Exhibit Description
10.36
Amendment Number Six to the Master Repurchase Agreement, dated as of May 31, 2012, by and among Citibank, N.A. and PennyMac Corp., PennyMac Mortgage Investment Trust Holdings I, LLC and PennyMac Loan Services, LLC (incorporated by reference to Exhibit 1.1 of the Company’s Current Report on Form 8-K filed on June 5, 2012).
10.37
Amendment Number Seven to the Master Repurchase Agreement, dated as of November 13, 2012, by and among Citibank, N.A. and PennyMac Corp., PennyMac Mortgage Investment Trust Holdings I, LLC and PennyMac Loan Services, LLC (incorporated by reference to Exhibit 10.39 of the Company’s Annual Report on Form 10-K for the year ended December 31, 2012).
10.38
Amendment Number Eight to the Master Repurchase Agreement, dated as of December 31, 2012, by and among Citibank, N.A. and PennyMac Corp., PennyMac Mortgage Investment Trust Holdings I, LLC and PennyMac Loan Services, LLC (incorporated by reference to Exhibit 10.40 of the Company’s Annual Report on Form 10-K for the year ended December 31, 2012).
10.39
Amendment Number Nine to the Master Repurchase Agreement, dated as of March 12, 2013, by and among Citibank, N.A. and PennyMac Corp., PennyMac Mortgage Investment Trust Holdings I, LLC and PennyMac Loan Services, LLC (incorporated by reference to Exhibit 1.1 of the Company’s Current Report on Form 8-K filed on March 13, 2013).
10.40
Amendment Number Ten to the Master Repurchase Agreement, dated as of April 19, 2013, by and among Citibank, N.A. and PennyMac Corp., PennyMac Mortgage Investment Trust Holdings I, LLC and PennyMac Loan Services, LLC (incorporated by reference to Exhibit 10.47 of the Company’s Quarterly Report on Form 10-Q for the quarter ended June 30, 2013).
10.41
Amendment Number Eleven to the Master Repurchase Agreement, dated as of June 25, 2013, by and among Citibank, N.A. and PennyMac Corp., PennyMac Mortgage Investment Trust Holdings I, LLC and PennyMac Loan Services, LLC (incorporated by reference to Exhibit 10.48 of the Company’s Quarterly Report on Form 10-Q for the quarter ended June 30, 2013).
10.42
Amendment Number Twelve to the Master Repurchase Agreement, dated as of July 25, 2013, by and among Citibank, N.A. and PennyMac Corp., PennyMac Mortgage Investment Trust Holdings I, LLC and PennyMac Loan Services, LLC (incorporated by reference to Exhibit 1.1 of the Company’s Current Report on Form 8-K filed on July 31, 2013).
10.43
Amendment Number Thirteen to the Master Repurchase Agreement, dated as of September 26, 2013, by and among Citibank, N.A. and PennyMac Corp., PennyMac Mortgage Investment Trust Holdings I, LLC and PennyMac Loan Services, LLC (incorporated by reference to Exhibit 10.48 of the Company’s Annual Report on Form 10-K for the year ended December 31, 2013).
10.44
Amendment Number Fourteen to the Master Repurchase Agreement, dated as of February 5, 2014, by and among Citibank, N.A. and PennyMac Corp., PennyMac Holdings, LLC and PennyMac Loan Services, LLC (incorporated by reference to Exhibit 10.11 of the Company’s Current Report on Form 8-K filed on February 6, 2014).
10.45
Amendment Number Fifteen to the Master Repurchase Agreement, dated as of May 13, 2014, by and among Citibank, N.A. and PennyMac Corp., PennyMac Holdings, LLC and PennyMac Loan Services, LLC (incorporated by reference to Exhibit 10.50 of the Company’s Quarterly Report on Form 10-Q for the quarter ended June 30, 2014).
10.46
Amendment Number Sixteen to the Master Repurchase Agreement, dated as of July 24, 2014, by and among Citibank, N.A. and PennyMac Corp., PennyMac Holdings, LLC and PennyMac Loan Services, LLC (incorporated by reference to Exhibit 10.42 of the Company’s Quarterly Report on Form 10-Q for the quarter ended September 30, 2014).
10.47
Amendment Number Seventeen to the Master Repurchase Agreement, dated as of August 7, 2014, by and among Citibank, N.A. and PennyMac Corp., PennyMac Holdings, LLC and PennyMac Loan Services, LLC (incorporated by reference to Exhibit 10.43 of the Company’s Quarterly Report on Form 10-Q for the quarter ended September 30, 2014).
10.48
Amendment Number Eighteen to the Master Repurchase Agreement, dated as of September 8, 2014, by and among Citibank, N.A. and PennyMac Corp., PennyMac Holdings, LLC and PennyMac Loan Services, LLC (incorporated by reference to Exhibit 10.44 of the Company’s Quarterly Report on Form 10-Q for the quarter ended September 30, 2014).

100
Exhibit Number Exhibit Description
10.49
Amendment Number Nineteen to the Master Repurchase Agreement, dated as of July 6, 2015, by and among Citibank, N.A. and PennyMac Corp., PennyMac Holdings, LLC and PennyMac Loan Services, LLC (incorporated by reference to Exhibit 10.44 of the Company’s Quarterly Report on Form 10-Q for the quarter ended June 30, 2015).
10.50
Amendment Number Twenty to the Master Repurchase Agreement, dated as of September 7, 2015, by and among Citibank, N.A. and PennyMac Corp., PennyMac Holdings, LLC and PennyMac Loan Services, LLC (incorporated by reference to Exhibit 10.47 of the Company’s Quarterly Report on Form 10-Q for the quarter ended September 30, 2015).
10.51
Amendment Number Twenty-One to Master Repurchase Agreement, dated as of October 22, 2015, among PennyMac Corp., PennyMac Holdings, LLC and PennyMac Loan Services, LLC and Citibank, N.A. (incorporated by reference to Exhibit 10.1 of the Company’s Current Report on Form 8-K filed on October 28, 2015).
10.52
Amendment Number Twenty-Two to Master Repurchase Agreement, dated as of December 2, 2015, among PennyMac Corp., PennyMac Holdings, LLC and PennyMac Loan Services, LLC and Citibank, N.A.
10.53
Guaranty Agreement, dated as of December 9, 2010, by PennyMac Mortgage Investment Trust in favor of Citibank, N.A. (incorporated by reference to Exhibit 1.2 of the Company’s Current Report on Form 8-K filed on December 15, 2010).
10.54
Amended and Restated Master Repurchase Agreement, dated as of August 25, 2011, among Credit Suisse First Boston Mortgage Capital LLC, PennyMac Corp., PennyMac Mortgage Investment Trust Holdings I, LLC and PennyMac Mortgage Investment Trust (incorporated by reference to Exhibit 10.28 of the Company’s Quarterly Report on Form 10-Q for the quarter ended September 30, 2011).
10.55
Amendment No. 1 to Amended and Restated Master Repurchase Agreement, dated as of June 6, 2012, among Credit Suisse First Boston Mortgage Capital LLC, PennyMac Corp., PennyMac Mortgage Investment Trust Holdings I, LLC and PennyMac Mortgage Investment Trust (incorporated by reference to Exhibit 10.38 of the Company’s Quarterly Report on Form 10-Q for the quarter ended June 30, 2012).
10.56
Amendment No. 2 to Amended and Restated Master Repurchase Agreement, dated as of March 28, 2013, among Credit Suisse First Boston Mortgage Capital LLC, PennyMac Corp., PennyMac Mortgage Investment Trust Holdings I, LLC and PennyMac Mortgage Investment Trust (incorporated by reference to Exhibit 10.50 of the Company’s Quarterly Report on Form 10-Q for the quarter ended March 31, 2013).
10.57
Amendment No. 3 to Amended and Restated Master Repurchase Agreement, dated as of May 8, 2013, among Credit Suisse First Boston Mortgage Capital LLC, PennyMac Corp., PennyMac Mortgage Investment Trust Holdings I, LLC and PennyMac Mortgage Investment Trust (incorporated by reference to Exhibit 10.51 of the Company’s Quarterly Report on Form 10-Q for the quarter ended March 31, 2013).
10.58
Amendment No. 4 to Amended and Restated Master Repurchase Agreement, dated as of October 1, 2013, among Credit Suisse First Boston Mortgage Capital LLC, PennyMac Corp., PennyMac Mortgage Investment Trust Holdings I, LLC and PennyMac Mortgage Investment Trust (incorporated by reference to Exhibit 10.54 of the Company’s Annual Report on Form 10-K for the year ended December 31, 2013).
10.59
Amendment No. 5 to Amended and Restated Master Repurchase Agreement, dated as of December 27, 2013, among Credit Suisse First Boston Mortgage Capital LLC, PennyMac Corp., PennyMac Holdings, LLC and PennyMac Mortgage Investment Trust (incorporated by reference to Exhibit 10.3 of the Company’s Current Report on Form 8-K filed on January 3, 2014).
10.60
Amendment No. 6 to Amended and Restated Master Repurchase Agreement, dated as of December 31, 2013, among Credit Suisse First Boston Mortgage Capital LLC, PennyMac Corp., PennyMac Holdings, LLC and PennyMac Mortgage Investment Trust (incorporated by reference to Exhibit 10.56 of the Company’s Annual Report on Form 10-K for the year ended December 31, 2013).
10.61
Amendment No. 7 to Amended and Restated Master Repurchase Agreement, dated as of February 21, 2014, among Credit Suisse First Boston Mortgage Capital LLC, PennyMac Corp., PennyMac Holdings, LLC and PennyMac Mortgage Investment Trust (incorporated by reference to Exhibit 10.53 of the Company’s Quarterly Report on Form 10-Q for the quarter ended September 30, 2014).

101
Exhibit Number Exhibit Description
10.62
Amendment No. 8 to Amended and Restated Master Repurchase Agreement, dated as of October 31, 2014, among Credit Suisse First Boston Mortgage Capital LLC, PennyMac Corp., PennyMac Holdings, LLC and PennyMac Mortgage Investment Trust (incorporated by reference to Exhibit 10.54 of the Company’s Quarterly Report on Form 10-Q for the quarter ended September 30, 2014).
10.63
Amendment No. 9 to Amended and Restated Master Repurchase Agreement, dated as of October 30, 2015, among Credit Suisse First Boston Mortgage Capital LLC, PennyMac Corp., PennyMac Holdings, LLC and PennyMac Mortgage Investment Trust (incorporated by reference to Exhibit 10.59 of the Company’s Quarterly Report on Form 10-Q for the quarter ended September 30, 2015).
10.64
Amendment No. 10 to Amended and Restated Master Repurchase Agreement, dated as of December 15, 2015, among Credit Suisse First Boston Mortgage Capital LLC, PennyMac Corp., PennyMac Holdings, LLC and PennyMac Mortgage Investment Trust.
10.65
Amendment No. 11 to Amended and Restated Master Repurchase Agreement, dated as of January 28, 2016, among Credit Suisse First Boston Mortgage Capital LLC, PennyMac Corp., PennyMac Holdings, LLC and PennyMac Mortgage Investment Trust.
10.66
Master Repurchase Agreement, dated as of November 7, 2011, among Bank of America, N.A., PennyMac Corp., PennyMac Mortgage Investment Trust and PennyMac Operating Partnership, L.P. (incorporated by reference to Exhibit 1.1 of the Company’s Current Report on Form 8-K filed on November 14, 2011).
10.67
Amendment No. 1 to Master Repurchase Agreement, dated as of August 17, 2012, among Bank of America, N.A., PennyMac Corp., PennyMac Mortgage Investment Trust and PennyMac Operating Partnership, L.P. (incorporated by reference to Exhibit 10.45 of the Company’s Quarterly Report on Form 10-Q for the quarter ended September 30, 2012).
10.68
Amendment No. 2 to Master Repurchase Agreement, dated as of January 3, 2013, among Bank of America, N.A., PennyMac Corp., PennyMac Mortgage Investment Trust and PennyMac Operating Partnership, L.P. (incorporated by reference to Exhibit 1.1 of the Company’s Current Report on Form 8-K filed on January 7, 2013).
10.69
Amendment No. 3 to Master Repurchase Agreement, dated as of March 28, 2013, among Bank of America, N.A., PennyMac Corp., PennyMac Mortgage Investment Trust and PennyMac Operating Partnership, L.P. (incorporated by reference to Exhibit 1.1 of the Company’s Current Report on Form 8-K filed on April 3, 2013).
10.70
Amendment No. 4 to Master Repurchase Agreement, dated as of January 31, 2014, among Bank of America, N.A., PennyMac Corp., PennyMac Mortgage Investment Trust and PennyMac Operating Partnership, L.P. (incorporated by reference to Exhibit 10.1 of the Company’s Current Report on Form 8-K filed on February 6, 2014).
10.71
Amendment No. 5 to Master Repurchase Agreement, dated as of March 27, 2014, among Bank of America, N.A., PennyMac Corp., PennyMac Mortgage Investment Trust and PennyMac Operating Partnership, L.P. (incorporated by reference to Exhibit 10.64 of the Company’s Quarterly Report on Form 10-Q for the quarter ended March 31, 2014).
10.72
Amendment No. 6 to Master Repurchase Agreement, dated as of July 9, 2014, among Bank of America, N.A., PennyMac Corp., PennyMac Mortgage Investment Trust and PennyMac Operating Partnership, L.P. (incorporated by reference to Exhibit 10.3 of the Company’s Current Report on Form 8-K filed on July 14, 2014).
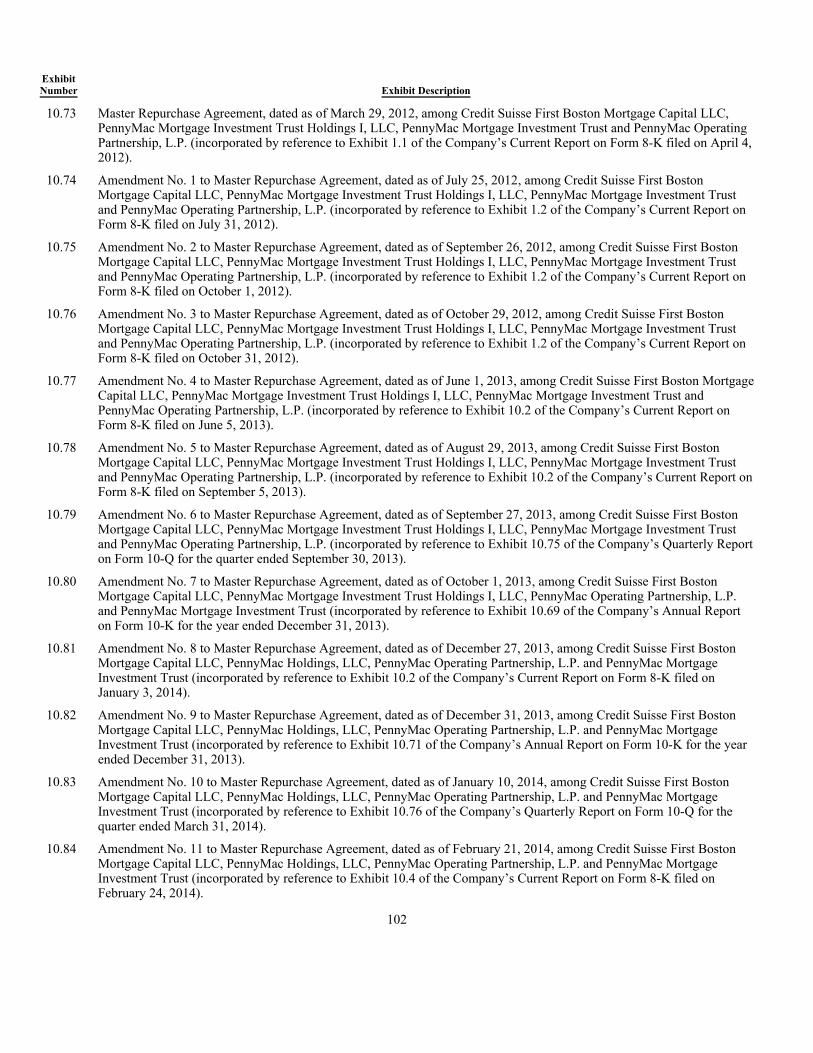
102
Exhibit Number Exhibit Description
10.73
Master Repurchase Agreement, dated as of March 29, 2012, among Credit Suisse First Boston Mortgage Capital LLC, PennyMac Mortgage Investment Trust Holdings I, LLC, PennyMac Mortgage Investment Trust and PennyMac Operating Partnership, L.P. (incorporated by reference to Exhibit 1.1 of the Company’s Current Report on Form 8-K filed on April 4, 2012).
10.74
Amendment No. 1 to Master Repurchase Agreement, dated as of July 25, 2012, among Credit Suisse First Boston Mortgage Capital LLC, PennyMac Mortgage Investment Trust Holdings I, LLC, PennyMac Mortgage Investment Trust and PennyMac Operating Partnership, L.P. (incorporated by reference to Exhibit 1.2 of the Company’s Current Report on Form 8-K filed on July 31, 2012).
10.75
Amendment No. 2 to Master Repurchase Agreement, dated as of September 26, 2012, among Credit Suisse First Boston Mortgage Capital LLC, PennyMac Mortgage Investment Trust Holdings I, LLC, PennyMac Mortgage Investment Trust and PennyMac Operating Partnership, L.P. (incorporated by reference to Exhibit 1.2 of the Company’s Current Report on Form 8-K filed on October 1, 2012).
10.76
Amendment No. 3 to Master Repurchase Agreement, dated as of October 29, 2012, among Credit Suisse First Boston Mortgage Capital LLC, PennyMac Mortgage Investment Trust Holdings I, LLC, PennyMac Mortgage Investment Trust and PennyMac Operating Partnership, L.P. (incorporated by reference to Exhibit 1.2 of the Company’s Current Report on Form 8-K filed on October 31, 2012).
10.77
Amendment No. 4 to Master Repurchase Agreement, dated as of June 1, 2013, among Credit Suisse First Boston Mortgage Capital LLC, PennyMac Mortgage Investment Trust Holdings I, LLC, PennyMac Mortgage Investment Trust and PennyMac Operating Partnership, L.P. (incorporated by reference to Exhibit 10.2 of the Company’s Current Report on Form 8-K filed on June 5, 2013).
10.78
Amendment No. 5 to Master Repurchase Agreement, dated as of August 29, 2013, among Credit Suisse First Boston Mortgage Capital LLC, PennyMac Mortgage Investment Trust Holdings I, LLC, PennyMac Mortgage Investment Trust and PennyMac Operating Partnership, L.P. (incorporated by reference to Exhibit 10.2 of the Company’s Current Report on Form 8-K filed on September 5, 2013).
10.79
Amendment No. 6 to Master Repurchase Agreement, dated as of September 27, 2013, among Credit Suisse First Boston Mortgage Capital LLC, PennyMac Mortgage Investment Trust Holdings I, LLC, PennyMac Mortgage Investment Trust and PennyMac Operating Partnership, L.P. (incorporated by reference to Exhibit 10.75 of the Company’s Quarterly Report on Form 10-Q for the quarter ended September 30, 2013).
10.80
Amendment No. 7 to Master Repurchase Agreement, dated as of October 1, 2013, among Credit Suisse First Boston Mortgage Capital LLC, PennyMac Mortgage Investment Trust Holdings I, LLC, PennyMac Operating Partnership, L.P. and PennyMac Mortgage Investment Trust (incorporated by reference to Exhibit 10.69 of the Company’s Annual Report on Form 10-K for the year ended December 31, 2013).
10.81
Amendment No. 8 to Master Repurchase Agreement, dated as of December 27, 2013, among Credit Suisse First Boston Mortgage Capital LLC, PennyMac Holdings, LLC, PennyMac Operating Partnership, L.P. and PennyMac Mortgage Investment Trust (incorporated by reference to Exhibit 10.2 of the Company’s Current Report on Form 8-K filed on January 3, 2014).
10.82
Amendment No. 9 to Master Repurchase Agreement, dated as of December 31, 2013, among Credit Suisse First Boston Mortgage Capital LLC, PennyMac Holdings, LLC, PennyMac Operating Partnership, L.P. and PennyMac Mortgage Investment Trust (incorporated by reference to Exhibit 10.71 of the Company’s Annual Report on Form 10-K for the year ended December 31, 2013).
10.83
Amendment No. 10 to Master Repurchase Agreement, dated as of January 10, 2014, among Credit Suisse First Boston Mortgage Capital LLC, PennyMac Holdings, LLC, PennyMac Operating Partnership, L.P. and PennyMac Mortgage Investment Trust (incorporated by reference to Exhibit 10.76 of the Company’s Quarterly Report on Form 10-Q for the quarter ended March 31, 2014).
10.84
Amendment No. 11 to Master Repurchase Agreement, dated as of February 21, 2014, among Credit Suisse First Boston Mortgage Capital LLC, PennyMac Holdings, LLC, PennyMac Operating Partnership, L.P. and PennyMac Mortgage Investment Trust (incorporated by reference to Exhibit 10.4 of the Company’s Current Report on Form 8-K filed on February 24, 2014).
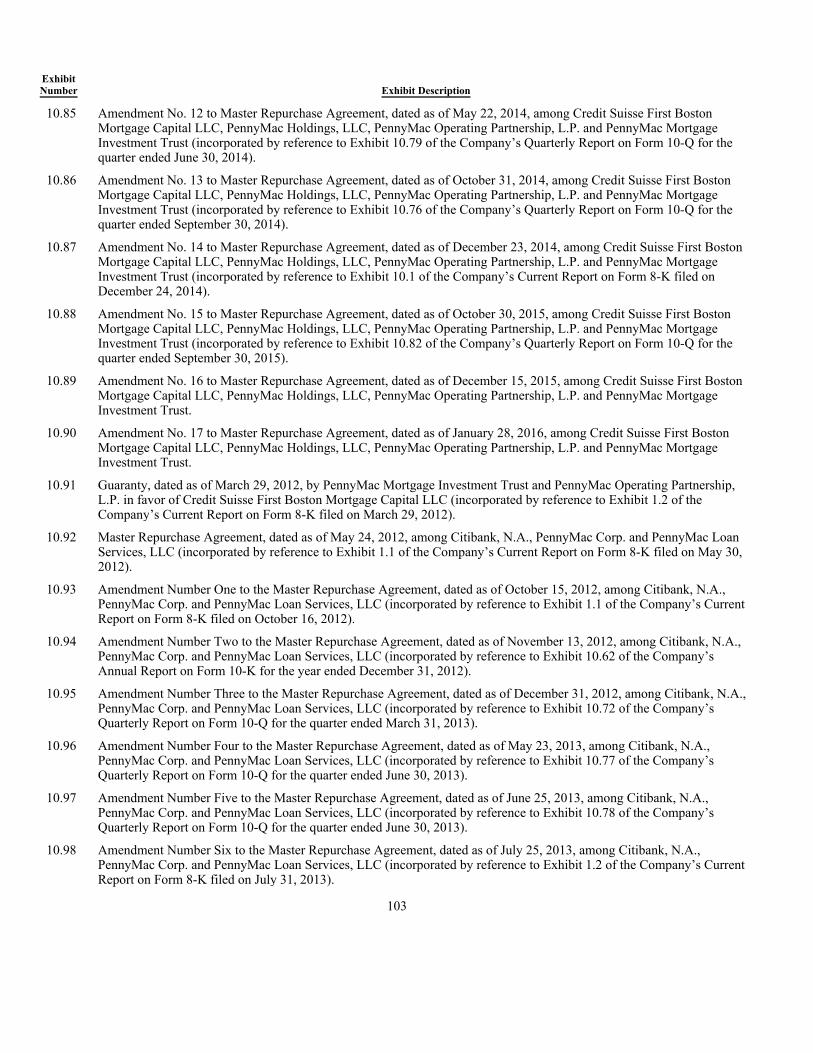
103
Exhibit Number Exhibit Description
10.85
Amendment No. 12 to Master Repurchase Agreement, dated as of May 22, 2014, among Credit Suisse First Boston Mortgage Capital LLC, PennyMac Holdings, LLC, PennyMac Operating Partnership, L.P. and PennyMac Mortgage Investment Trust (incorporated by reference to Exhibit 10.79 of the Company’s Quarterly Report on Form 10-Q for the quarter ended June 30, 2014).
10.86
Amendment No. 13 to Master Repurchase Agreement, dated as of October 31, 2014, among Credit Suisse First Boston Mortgage Capital LLC, PennyMac Holdings, LLC, PennyMac Operating Partnership, L.P. and PennyMac Mortgage Investment Trust (incorporated by reference to Exhibit 10.76 of the Company’s Quarterly Report on Form 10-Q for the quarter ended September 30, 2014).
10.87
Amendment No. 14 to Master Repurchase Agreement, dated as of December 23, 2014, among Credit Suisse First Boston Mortgage Capital LLC, PennyMac Holdings, LLC, PennyMac Operating Partnership, L.P. and PennyMac Mortgage Investment Trust (incorporated by reference to Exhibit 10.1 of the Company’s Current Report on Form 8-K filed on December 24, 2014).
10.88
Amendment No. 15 to Master Repurchase Agreement, dated as of October 30, 2015, among Credit Suisse First Boston Mortgage Capital LLC, PennyMac Holdings, LLC, PennyMac Operating Partnership, L.P. and PennyMac Mortgage Investment Trust (incorporated by reference to Exhibit 10.82 of the Company’s Quarterly Report on Form 10-Q for the quarter ended September 30, 2015).
10.89
Amendment No. 16 to Master Repurchase Agreement, dated as of December 15, 2015, among Credit Suisse First Boston Mortgage Capital LLC, PennyMac Holdings, LLC, PennyMac Operating Partnership, L.P. and PennyMac Mortgage Investment Trust.
10.90
Amendment No. 17 to Master Repurchase Agreement, dated as of January 28, 2016, among Credit Suisse First Boston Mortgage Capital LLC, PennyMac Holdings, LLC, PennyMac Operating Partnership, L.P. and PennyMac Mortgage Investment Trust.
10.91
Guaranty, dated as of March 29, 2012, by PennyMac Mortgage Investment Trust and PennyMac Operating Partnership, L.P. in favor of Credit Suisse First Boston Mortgage Capital LLC (incorporated by reference to Exhibit 1.2 of the Company’s Current Report on Form 8-K filed on March 29, 2012).
10.92
Master Repurchase Agreement, dated as of May 24, 2012, among Citibank, N.A., PennyMac Corp. and PennyMac Loan Services, LLC (incorporated by reference to Exhibit 1.1 of the Company’s Current Report on Form 8-K filed on May 30, 2012).
10.93
Amendment Number One to the Master Repurchase Agreement, dated as of October 15, 2012, among Citibank, N.A., PennyMac Corp. and PennyMac Loan Services, LLC (incorporated by reference to Exhibit 1.1 of the Company’s Current Report on Form 8-K filed on October 16, 2012).
10.94
Amendment Number Two to the Master Repurchase Agreement, dated as of November 13, 2012, among Citibank, N.A., PennyMac Corp. and PennyMac Loan Services, LLC (incorporated by reference to Exhibit 10.62 of the Company’s Annual Report on Form 10-K for the year ended December 31, 2012).
10.95
Amendment Number Three to the Master Repurchase Agreement, dated as of December 31, 2012, among Citibank, N.A., PennyMac Corp. and PennyMac Loan Services, LLC (incorporated by reference to Exhibit 10.72 of the Company’s Quarterly Report on Form 10-Q for the quarter ended March 31, 2013).
10.96
Amendment Number Four to the Master Repurchase Agreement, dated as of May 23, 2013, among Citibank, N.A., PennyMac Corp. and PennyMac Loan Services, LLC (incorporated by reference to Exhibit 10.77 of the Company’s Quarterly Report on Form 10-Q for the quarter ended June 30, 2013).
10.97
Amendment Number Five to the Master Repurchase Agreement, dated as of June 25, 2013, among Citibank, N.A., PennyMac Corp. and PennyMac Loan Services, LLC (incorporated by reference to Exhibit 10.78 of the Company’s Quarterly Report on Form 10-Q for the quarter ended June 30, 2013).
10.98
Amendment Number Six to the Master Repurchase Agreement, dated as of July 25, 2013, among Citibank, N.A., PennyMac Corp. and PennyMac Loan Services, LLC (incorporated by reference to Exhibit 1.2 of the Company’s Current Report on Form 8-K filed on July 31, 2013).

104
Exhibit Number Exhibit Description
10.99
Amendment Number Seven to the Master Repurchase Agreement, dated as of February 5, 2014, among Citibank, N.A., PennyMac Corp. and PennyMac Loan Services, LLC (incorporated by reference to Exhibit 10.12 of the Company’s Current Report on Form 8-K filed on February 6, 2014).
10.100
Amendment Number Eight to the Master Repurchase Agreement, dated as of July 24, 2014, among Citibank, N.A., PennyMac Corp. and PennyMac Loan Services, LLC (incorporated by reference to Exhibit 10.86 of the Company’s Quarterly Report on Form 10-Q for the quarter ended September 30, 2014).
10.101
Amendment Number Nine to the Master Repurchase Agreement, dated as of August 7, 2014, among Citibank, N.A., PennyMac Corp. and PennyMac Loan Services, LLC (incorporated by reference to Exhibit 10.87 of the Company’s Quarterly Report on Form 10-Q for the quarter ended September 30, 2014).
10.102
Amendment Number Ten to the Master Repurchase Agreement, dated as of September 8, 2014, among Citibank, N.A., PennyMac Corp. and PennyMac Loan Services, LLC (incorporated by reference to Exhibit 10.88 of the Company’s Quarterly Report on Form 10-Q for the quarter ended September 30, 2014).
10.103
Amendment Number Eleven to the Master Repurchase Agreement, dated as of July 6, 2015, among Citibank, N.A., PennyMac Corp. and PennyMac Loan Services, LLC (incorporated by reference to Exhibit 10.89 of the Company’s Quarterly Report on Form 10-Q for the quarter ended June 30, 2015).
10.104
Amendment Number Twelve to the Master Repurchase Agreement, dated as of September 7, 2015, among Citibank, N.A., PennyMac Corp. and PennyMac Loan Services, LLC (incorporated by reference to Exhibit 10.96 of the Company’s Quarterly Report on Form 10-Q for the quarter ended September 30, 2015).
10.105
Amendment Number Thirteen to Master Repurchase Agreement, dated as of October 22, 2015, among PennyMac Corp., PennyMac Loan Services, LLC and Citibank, N.A. (incorporated by reference to Exhibit 10.2 of the Company’s Current Report on Form 8-K filed on October 28, 2015).
10.106
Amendment Number Fourteen to Master Repurchase Agreement, dated as of December 2, 2015, among PennyMac Corp., PennyMac Loan Services, LLC and Citibank, N.A.
10.107
Guaranty, dated as of May 24, 2012, by PennyMac Mortgage Investment Trust in favor of Citibank, N.A. (incorporated by reference to Exhibit 1.2 of the Company’s Current Report on Form 8-K filed on May 30, 2012).
10.108
Master Repurchase Agreement, dated as of September 28, 2012, among Credit Suisse First Boston Mortgage Capital LLC, PennyMac Operating Partnership, L.P. and PennyMac Mortgage Investment Trust (incorporated by reference to Exhibit 1.1 of the Company’s Current Report on Form 8-K filed on October 3, 2012).
10.109
Amendment No. 1 to Master Repurchase Agreement, dated as of May 8, 2013, among Credit Suisse First Boston Mortgage Capital LLC, PennyMac Operating Partnership, L.P. and PennyMac Mortgage Investment Trust (incorporated by reference to Exhibit 10.80 of the Company’s Quarterly Report on Form 10-Q for the quarter ended March 31, 2013).
10.110
Amendment No. 2 to Master Repurchase Agreement, dated as of December 31, 2013, among Credit Suisse First Boston Mortgage Capital LLC, PennyMac Operating Partnership, L.P. and PennyMac Mortgage Investment Trust (incorporated by reference to Exhibit 10.90 of the Company’s Annual Report on Form 10-K for the year ended December 31, 2013).
10.111
Amendment No. 3 to Master Repurchase Agreement, dated as of January 10, 2014, among Credit Suisse First Boston Mortgage Capital LLC, PennyMac Operating Partnership, L.P. and PennyMac Mortgage Investment Trust (incorporated by reference to Exhibit 10.98 of the Company’s Quarterly Report on Form 10-Q for the quarter ended March 31, 2014).
10.112
Amendment No. 4 to Master Repurchase Agreement, dated as of October 31, 2014, among Credit Suisse First Boston Mortgage Capital LLC, PennyMac Operating Partnership, L.P. and PennyMac Mortgage Investment Trust (incorporated by reference to Exhibit 10.97 of the Company’s Quarterly Report on Form 10-Q for the quarter ended September 30, 2014).
10.113
Amendment No. 5 to Master Repurchase Agreement, dated as of April 14, 2015, among Credit Suisse First Boston Mortgage Capital LLC, PennyMac Operating Partnership, L.P. and PennyMac Mortgage Investment Trust (incorporated by reference to Exhibit 10.96 of the Company’s Quarterly Report on Form 10-Q for the quarter ended March 31, 2015).

105
Exhibit Number Exhibit Description
10.114
Amendment No. 6 to Master Repurchase Agreement, dated as of October 30, 2015, among Credit Suisse First Boston Mortgage Capital LLC, PennyMac Operating Partnership, L.P. and PennyMac Mortgage Investment Trust (incorporated by reference to Exhibit 10.105 of the Company’s Quarterly Report on Form 10-Q for the quarter ended September 30, 2015).
10.115
Amendment No. 7 to Master Repurchase Agreement, dated as of December 15, 2015, among Credit Suisse First Boston Mortgage Capital LLC, PennyMac Operating Partnership, L.P. and PennyMac Mortgage Investment Trust.
10.116
Amendment No. 8 to Master Repurchase Agreement, dated as of January 28, 2016, among Credit Suisse First Boston Mortgage Capital LLC, PennyMac Operating Partnership, L.P. and PennyMac Mortgage Investment Trust.
10.117
Guaranty, dated as of September 28, 2012, by PennyMac Mortgage Investment Trust in favor of Credit Suisse First Boston Mortgage Capital LLC (incorporated by reference to Exhibit 1.2 of the Company’s Current Report on Form 8-K filed on October 3, 2012).
10.118
Master Repurchase Agreement, dated as of November 20, 2012, among PennyMac Corp., Morgan Stanley Bank, N.A. and Morgan Stanley Mortgage Capital Holdings LLC (incorporated by reference to Exhibit 1.1 of the Company’s Current Report on Form 8-K filed on November 26, 2012).
10.119
Amendment Number One to the Master Repurchase Agreement, dated as of August 20, 2013, among PennyMac Corp., Morgan Stanley Bank, N.A. and Morgan Stanley Mortgage Capital Holdings LLC (incorporated by reference to Exhibit 10.96 of the Company’s Quarterly Report on Form 10-Q for the quarter ended September 30, 2013).
10.120
Amendment Number Two to the Master Repurchase Agreement, dated as of August 26, 2013, among PennyMac Corp., Morgan Stanley Bank, N.A. and Morgan Stanley Mortgage Capital Holdings LLC (incorporated by reference to Exhibit 10.97 of the Company’s Quarterly Report on Form 10-Q for the quarter ended September 30, 2013).
10.121
Amendment Number Three to the Master Repurchase Agreement, dated as of November 14, 2013, among PennyMac Corp., Morgan Stanley Bank, N.A. and Morgan Stanley Mortgage Capital Holdings LLC (incorporated by reference to Exhibit 10.95 of the Company’s Annual Report on Form 10-K for the year ended December 31, 2013).
10.122
Amendment Number Four to the Master Repurchase Agreement, dated as of December 19, 2013, among PennyMac Corp., Morgan Stanley Bank, N.A. and Morgan Stanley Mortgage Capital Holdings LLC (incorporated by reference to Exhibit 10.96 of the Company’s Annual Report on Form 10-K for the year ended December 31, 2013).
10.123
Amendment Number Five to the Master Repurchase Agreement, dated as of December 18, 2014, among PennyMac Corp., Morgan Stanley Bank, N.A. and Morgan Stanley Mortgage Capital Holdings LLC (incorporated by reference to Exhibit 10.101 of the Company’s Annual Report on Form 10-K for the year ended December 31, 2014).
10.124
Amendment Number Six to the Master Repurchase Agreement, dated as of July 27, 2015, among PennyMac Corp., Morgan Stanley Bank, N.A. and Morgan Stanley Mortgage Capital Holdings LLC (incorporated by reference to Exhibit 10.1 of the Company’s Current Report on Form 8-K filed on July 30, 2015).
10.125
Amendment Number Seven to the Master Repurchase Agreement, dated as of December 17, 2015, among PennyMac Corp., Morgan Stanley Bank, N.A. and Morgan Stanley Mortgage Capital Holdings LLC.
10.126
Guaranty, dated as of November 20, 2012, by PennyMac Mortgage Investment Trust in favor of Morgan Stanley Bank, N.A. and Morgan Stanley Mortgage Capital Holdings LLC (incorporated by reference to Exhibit 1.2 of the Company’s Current Report on Form 8-K filed on November 26, 2012).
10.127
Mortgage Banking and Warehouse Services Agreement, dated as of February 1, 2013, by and between PennyMac Loan Services, LLC and PennyMac Corp. (incorporated by reference to Exhibit 1.3 of the Company’s Current Report on Form 8-K filed on February 7, 2013).
10.128
Amendment No. 1 to Mortgage Banking and Warehouse Services Agreement, dated as of March 1, 2013, by and between PennyMac Loan Services, LLC and PennyMac Corp. (incorporated by reference to Exhibit 10.85 of the Company’s Quarterly Report on Form 10-Q for the quarter ended March 31, 2013).
10.129
Amendment No. 2 to Mortgage Banking and Warehouse Services Agreement, dated as of August 14, 2013, by and between PennyMac Loan Services, LLC and PennyMac Corp. (incorporated by reference to Exhibit 1.1 of the Company’s Current Report on Form 8-K filed on August 19, 2013).

106
Exhibit Number Exhibit Description
10.130
Amendment No. 3 to Mortgage Banking and Warehouse Services Agreement, dated as of December 15, 2015, by and between PennyMac Loan Services, LLC and PennyMac Corp. (incorporated by reference to Exhibit 10.2 of the Company’s Current Report on Form 8-K filed on December 18, 2015).
10.131
MSR Recapture Agreement, dated as of February 1, 2013, by and between PennyMac Loan Services, LLC and PennyMac Corp. (incorporated by reference to Exhibit 1.4 of the Company’s Current Report on Form 8-K filed on February 7, 2013).
10.132
Amendment No. 1 to MSR Recapture Agreement, dated as of August 1, 2013, by and between PennyMac Loan Services, LLC and PennyMac Corp. (incorporated by reference to Exhibit 10.103 of the Company’s Quarterly Report on Form 10-Q for the quarter ended September 30, 2013).
10.133
Master Spread Acquisition and MSR Servicing Agreement, dated as of February 1, 2013, by and between PennyMac Loan Services, LLC and PennyMac Operating Partnership, L.P. (incorporated by reference to Exhibit 1.5 of the Company’s Current Report on Form 8-K filed on February 7, 2013).
10.134
Amendment No. 1 to Master Spread Acquisition and MSR Servicing Agreement, dated as of September 30, 2013, by and between PennyMac Loan Services, LLC and PennyMac Operating Partnership, L.P. (incorporated by reference to Exhibit 10.105 of the Company’s Quarterly Report on Form 10-Q for the quarter ended September 30, 2013).
10.135
Amendment No. 2 to Master Spread Acquisition and MSR Servicing Agreement, dated as of November 14, 2013, by and between PennyMac Loan Services, LLC and PennyMac Operating Partnership, L.P. (incorporated by reference to Exhibit 10.105 of the Company’s Annual Report on Form 10-K for the year ended December 31, 2013).
10.136
Amendment No. 3 to Master Spread Acquisition and MSR Servicing Agreement, dated as of March 19, 2014, by and between PennyMac Loan Services, LLC and PennyMac Operating Partnership, L.P. (incorporated by reference to Exhibit 10.114 of the Company’s Quarterly Report on Form 10-Q for the quarter ended March 31, 2014).
10.137
Amendment No. 4 to Master Spread Acquisition and MSR Servicing Agreement, dated as of March 3, 2015, by and between PennyMac Loan Services, LLC, PennyMac Operating Partnership, L.P., and PennyMac Holdings, LLC (incorporated by reference to Exhibit 10.114 of the Company’s Quarterly Report on Form 10-Q for the quarter ended March 31, 2015).
10.138
Master Spread Acquisition and MSR Servicing Agreement, dated as of December 30, 2013, by and between PennyMac Loan Services, LLC and PennyMac Holdings, LLC (incorporated by reference to Exhibit 10.4 of the Company’s Current Report on Form 8-K filed on January 3, 2014).
10.139
Amendment No. 1 to Master Spread Acquisition and MSR Servicing Agreement, dated as of June 1, 2014, by and between PennyMac Loan Services, LLC and PennyMac Holdings, LLC (incorporated by reference to Exhibit 10.114 of the Company’s Quarterly Report on Form 10-Q for the quarter ended June 30, 2014).
10.140
Amendment No. 2 to Master Spread Acquisition and MSR Servicing Agreement, dated as of March 3, 2015, by and between PennyMac Loan Services, LLC and PennyMac Holdings, LLC (incorporated by reference to Exhibit 10.117 of the Company’s Quarterly Report on Form 10-Q for the quarter ended March 31, 2015).
10.141
Amended and Restated Master Spread Acquisition and MSR Servicing Agreement, dated as of April 30, 2015, between PennyMac Loan Services, LLC and PennyMac Holdings, LLC (incorporated by reference to Exhibit 10.1 of the Company’s Current Report on Form 8-K filed on May 6, 2015).
10.142
Amendment No. 1 to Amended and Restated Master Spread Acquisition and MSR Servicing Agreement, dated as of August 26, 2015, among Credit Suisse First Boston Mortgage Capital LLC, PennyMac Loan Services, LLC and PennyMac Holdings, LLC (incorporated by reference to Exhibit 10.129 of the Company’s Quarterly Report on Form 10-Q for the quarter ended September 30, 2015).
10.143
Amendment No. 2 to Amended and Restated Master Spread Acquisition and MSR Servicing Agreement, dated as of November 10, 2015, among Credit Suisse First Boston Mortgage Capital LLC, PennyMac Loan Services, LLC and PennyMac Holdings, LLC.
10.144
Amended and Restated Security and Subordination Agreement, dated as of April 30, 2015, between PennyMac Holdings, LLC and Credit Suisse First Boston Mortgage Capital LLC (incorporated by reference to Exhibit 10.4 of the Company’s Current Report on Form 8-K filed on May 6, 2015).

107
Exhibit Number Exhibit Description
10.145
Second Amended and Restated Security and Subordination Agreement, dated as of November 10, 2015, between PennyMac Holdings, LLC and Credit Suisse First Boston Mortgage Capital LLC.
10.146
Master Spread Acquisition and MSR Servicing Agreement, dated as of December 19, 2014, by and between PennyMac Loan Services, LLC, PennyMac Holdings, LLC and PennyMac Operating Partnership, L.P. (incorporated by reference to Exhibit 10.1 of the Company’s Current Report on Form 8-K filed on December 24, 2014).
10.147
Amendment No 1. to Master Spread Acquisition and MSR Servicing Agreement, dated as of March 3, 2015, by and between PennyMac Loan Services, LLC, PennyMac Operating Partnership, L.P., and PennyMac Holdings, LLC (incorporated by reference to Exhibit 10.122 of the Company’s Quarterly Report on Form 10-Q for the quarter ended March 31, 2015).
10.148
Amended and Restated Confidentiality Agreement, dated as of March 1, 2013, between Private National Mortgage Acceptance Company, LLC and PennyMac Mortgage Investment Trust (incorporated by reference to Exhibit 10.89 of the Company’s Quarterly Report on Form 10-Q for the quarter ended March 31, 2013).
10.149
Mortgage Loan Participation Purchase and Sale Agreement, dated as of December 23, 2011, among Bank of America, N.A., PennyMac Corp., PennyMac Mortgage Investment Trust and PennyMac Operating Partnership, L.P. (incorporated by reference to Exhibit 10.2 of the Company’s Current Report on Form 8-K filed on February 6, 2014).
10.150
Amendment No. 1 to Mortgage Loan Participation Purchase and Sale Agreement, dated as of August 17, 2012, among Bank of America, N.A., PennyMac Corp., PennyMac Mortgage Investment Trust and PennyMac Operating Partnership, L.P. (incorporated by reference to Exhibit 10.3 of the Company’s Current Report on Form 8-K filed on February 6, 2014).
10.151
Amendment No. 2 to Mortgage Loan Participation Purchase and Sale Agreement, dated as of October 29, 2012, among Bank of America, N.A., PennyMac Corp., PennyMac Mortgage Investment Trust and PennyMac Operating Partnership, L.P. (incorporated by reference to Exhibit 10.4 of the Company’s Current Report on Form 8-K filed on February 6, 2014).
10.152
Amendment No. 3 to Mortgage Loan Participation Purchase and Sale Agreement, dated as of December 5, 2012, among Bank of America, N.A., PennyMac Corp., PennyMac Mortgage Investment Trust and PennyMac Operating Partnership, L.P. (incorporated by reference to Exhibit 10.5 of the Company’s Current Report on Form 8-K filed on February 6, 2014).
10.153
Amendment No. 4 to Mortgage Loan Participation Purchase and Sale Agreement, dated as of January 3, 2013, among Bank of America, N.A., PennyMac Corp., PennyMac Mortgage Investment Trust and PennyMac Operating Partnership, L.P. (incorporated by reference to Exhibit 10.6 of the Company’s Current Report on Form 8-K filed on February 6, 2014).
10.154
Amendment No. 5 to Mortgage Loan Participation Purchase and Sale Agreement, dated as of March 28, 2013, among Bank of America, N.A., PennyMac Corp., PennyMac Mortgage Investment Trust and PennyMac Operating Partnership, L.P. (incorporated by reference to Exhibit 10.7 of the Company’s Current Report on Form 8-K filed on February 6, 2014).
10.155
Amendment No. 6 to Mortgage Loan Participation Purchase and Sale Agreement, dated as of January 2, 2014, among Bank of America, N.A., PennyMac Corp., PennyMac Mortgage Investment Trust and PennyMac Operating Partnership, L.P. (incorporated by reference to Exhibit 10.8 of the Company’s Current Report on Form 8-K filed on February 6, 2014).
10.156
Amendment No. 7 to Mortgage Loan Participation Purchase and Sale Agreement, dated as of January 31, 2014, among Bank of America, N.A., PennyMac Corp., PennyMac Mortgage Investment Trust and PennyMac Operating Partnership, L.P. (incorporated by reference to Exhibit 10.9 of the Company’s Current Report on Form 8-K filed on February 6, 2014).
10.157
Amendment No. 8 to Mortgage Loan Participation Purchase and Sale Agreement, dated as of March 27, 2014, among Bank of America, N.A., PennyMac Corp., PennyMac Mortgage Investment Trust and PennyMac Operating Partnership, L.P. (incorporated by reference to Exhibit 10.130 of the Company’s Quarterly Report on Form 10-Q for the quarter ended June 30, 2014).

108
Exhibit Number Exhibit Description
10.158
Amendment No. 9 to Mortgage Loan Participation Purchase and Sale Agreement, dated as of January 30, 2015, among Bank of America, N.A., PennyMac Corp., PennyMac Mortgage Investment Trust and PennyMac Operating Partnership, L.P. (incorporated by reference to Exhibit 10.130 of the Company’s Annual Report on Form 10-K for the year ended December 31, 2014).
10.159
Amendment No. 10 to Mortgage Loan Participation Purchase and Sale Agreement, dated as of December 22, 2015, among Bank of America, N.A., PennyMac Corp., PennyMac Mortgage Investment Trust and PennyMac Operating Partnership, L.P.
10.160
Guaranty, dated as of December 23, 2011, by PennyMac Mortgage Investment Trust and PennyMac Operating Partnership, L.P. in favor of Bank of America, N.A. (incorporated by reference to Exhibit 10.10 of the Company’s Current Report on Form 8-K filed on February 6, 2014).
10.161
Master Repurchase Agreement, dated as of July 9, 2014, among Bank of America, N.A., PennyMac Operating Partnership, L.P. and PennyMac Mortgage Investment Trust (incorporated by reference to Exhibit 10.1 of the Company’s Current Report on Form 8-K filed on July 14, 2014).
10.162
Amendment No. 1 to Master Repurchase Agreement, dated as of January 30, 2015, among Bank of America, N.A., PennyMac Operating Partnership, L.P. and PennyMac Mortgage Investment Trust (incorporated by reference to Exhibit 10.133 of the Company’s Annual Report on Form 10-K for the year ended December 31, 2014).
10.163
Guaranty, dated as of July 9, 2014, by PennyMac Mortgage Investment Trust in favor of Bank of America, N.A. (incorporated by reference to Exhibit 10.2 of the Company’s Current Report on Form 8-K filed on July 14, 2014).
10.164
Master Repurchase Agreement, dated as of January 27, 2015, among JPMorgan Chase Bank, National Association, PennyMac Corp., PennyMac Operating Partnership, L.P., PennyMac Holdings, LLC, PMC REO Trust 2015-1, TRS REO Trust 1-A, and PennyMac Mortgage Investment Trust (incorporated by reference to Exhibit 10.1 of the Company’s Current Report on Form 8-K filed on February 2, 2015).
10.165
Amendment No. 1 to Master Repurchase Agreement, dated as of March 27, 2015, among JPMorgan Chase Bank, National Association, PennyMac Corp., PennyMac Operating Partnership, L.P., PennyMac Holdings, LLC, PMC REO Trust 2015-1, TRS REO Trust 1-A, and PennyMac Mortgage Investment Trust (incorporated by reference to Exhibit 10.143 of the Company’s Quarterly Report on Form 10-Q for the quarter ended March 31, 2015).
10.166
Guaranty, dated as of January 27, 2015, by PennyMac Mortgage Investment Trust in favor of JPMorgan Chase Bank, National Association (incorporated by reference to Exhibit 10.2 of the Company’s Current Report on Form 8-K filed on February 2, 2015).
10.167
Loan and Security Agreement, dated as of March 31, 2015, between PennyMac Corp. and Citibank, N.A. (incorporated by reference to Exhibit 10.1 of the Company’s Current Report on Form 8-K as filed with the SEC on April 3, 2015).
10.168
Amendment Number One to the Loan and Security Agreement, dated as of May 13, 2015, between PennyMac Corp. and Citibank, N.A. (incorporated by reference to Exhibit 10.145 of the Company’s Quarterly Report on Form 10-Q for the quarter ended June 30, 2015).
10.169
Amendment Number Two to the Loan and Security Agreement, dated as of July 6, 2015, between PennyMac Corp. and Citibank, N.A. (incorporated by reference to Exhibit 10.146 of the Company’s Quarterly Report on Form 10-Q for the quarter ended June 30, 2015).
10.170
Guaranty, dated as of March 31, 2015, by PennyMac Mortgage Investment Trust in favor of Citibank, N.A. (incorporated by reference to Exhibit 10.2 of the Company’s Current Report on Form 8-K as filed with the SEC on April 3, 2015).
10.171
Loan and Security Agreement, dated as of April 30, 2015, by and between PennyMac Loan Services, LLC and PennyMac Holdings, LLC (incorporated by reference to Exhibit 10.2 of the Company’s Current Report on Form 8-K as filed with the SEC on May 6, 2015).
10.172
Amendment No. 1 to Loan and Security Agreement, dated as of October 30, 2015, by and between PennyMac Loan Services, LLC and PennyMac Holdings, LLC (incorporated by reference to Exhibit 10.159 of the Company’s Quarterly Report on Form 10-Q for the quarter ended September 30, 2015).

109
Exhibit Number Exhibit Description
10.173
Amendment No. 2 to Loan and Security Agreement, dated as of November 10, 2015, by and among Credit Suisse First Boston Mortgage Capital LLC, PennyMac Loan Services, LLC and PennyMac Holdings, LLC.
10.174
Amendment No. 3 to Loan and Security Agreement, dated as of December 15, 2015, by and among Credit Suisse First Boston Mortgage Capital LLC, PennyMac Loan Services, LLC and PennyMac Holdings, LLC.
10.175
Amendment No. 4 to Loan and Security Agreement, dated as of January 28, 2016, by and among Credit Suisse First Boston Mortgage Capital LLC, PennyMac Loan Services, LLC and PennyMac Holdings, LLC.
10.176
Guaranty, dated as of April 30, 2015, by PennyMac Mortgage Investment Trust in favor of Credit Suisse First Boston Mortgage Capital LLC (incorporated by reference to Exhibit 10.3 of the Company’s Current Report on Form 8-K filed on May 6, 2015).
10.177
Amended and Restated Guaranty, dated as of November 10, 2015, by PennyMac Mortgage Investment Trust in favor of Credit Suisse First Boston Mortgage Capital LLC.
10.178
Advances, Pledge and Security Agreement, dated as of June 16, 2014, between PMT Insurance, LLC and the Federal Home Loan Bank of Des Moines (incorporated by reference to Exhibit 10.150 of the Company’s Quarterly Report on Form 10-Q for the quarter ended June 30, 2015).
10.179
Affiliate Collateral Pledge and Security Agreement, dated as of May 26, 2015, by and among PennyMac Securities Holding, LLC, PMT Insurance, LLC, and the Federal Home Loan Bank of Des Moines (incorporated by reference to Exhibit 10.151 of the Company’s Quarterly Report on Form 10-Q for the quarter ended June 30, 2015).
10.180
Affiliate Collateral Pledge and Security Agreement, dated as of May 26, 2015, by and among PennyMac Corp., PMT Insurance, LLC, and the Federal Home Loan Bank of Des Moines (incorporated by reference to Exhibit 10.152 of the Company’s Quarterly Report on Form 10-Q for the quarter ended June 30, 2015).
10.181
Affiliate Collateral Pledge and Security Agreement, dated as of May 26, 2015, by and among PennyMac Holdings, LLC, PMT Insurance, LLC, and the Federal Home Loan Bank of Des Moines (incorporated by reference to Exhibit 10.153 of the Company’s Quarterly Report on Form 10-Q for the quarter ended June 30, 2015).
10.182
Guaranty, dated as of April 9, 2015, by PennyMac Mortgage Investment Trust in favor of Federal Home Loan Bank of Des Moines (incorporated by reference to Exhibit 10.154 of the Company’s Quarterly Report on Form 10-Q for the quarter ended June 30, 2015).
10.183
Mortgage Loan Purchase Agreement, dated as of September 25, 2012, by and between PennyMac Loan Services, LLC and PennyMac Corp.
10.184
Flow Sale Agreement, dated as of June 16, 2015, by and between PennyMac Corp. and PennyMac Loan Services, LLC (incorporated by reference to Exhibit 10.155 of the Company’s Quarterly Report on Form 10-Q for the quarter ended June 30, 2015).
10.185
Master Repurchase Agreement, dated as of September 14, 2015, among Barclays Bank PLC, PennyMac Corp., PennyMac Loan Services, LLC and PennyMac Mortgage Investment Trust (incorporated by reference to Exhibit 10.1 of the Company’s Current Report on Form 8-K filed on September 18, 2015).
10.186
Mortgage Loan Participation Purchase and Sale Agreement, dated as of September 14, 2015, among PennyMac Corp., PennyMac Loan Services, LLC and Barclays Bank PLC (incorporated by reference to Exhibit 10.2 of the Company’s Current Report on Form 8-K filed on September 18, 2015).
10.187
Loan and Security Agreement, dated as of September 14, 2015, among PennyMac Corp., PennyMac Mortgage Investment Trust and Barclays Bank PLC (incorporated by reference to Exhibit 10.3 of the Company’s Current Report on Form 8-K filed on September 18, 2015).
10.188
Amended and Restated Loan and Security Agreement, dated as of January 22, 2016, by and among PennyMac Corp., PennyMac Holdings, LLC, PennyMac Mortgage Investment Trust and Barclays Bank PLC (incorporated by reference to Exhibit 10.2 of the Company’s Current Report on Form 8-K filed on January 28, 2016).
10.189
Master Spread Acquisition and MSR Servicing Agreement, dated as of January 22, 2016, by and between PennyMac Corp. and PennyMac Holdings, LLC (incorporated by reference to Exhibit 10.1 of the Company’s Current Report on Form 8-K filed on January 28, 2016).

110
Exhibit Number Exhibit Description
10.190
Flow Commercial Mortgage Loan Purchase Agreement, dated as of December 1, 2015, by and between PennyMac Loan Services, LLC and PennyMac Corp.
10.191
Servicing Agreement, dated as of July 13, 2015, between PennyMac Corp., PennyMac Holdings, LLC, any other parties signing this Agreement as an owner of Mortgage Loans as listed in Schedule I and any New Owners, PennyMac Loan Services, LLC, and Midland Loan Services, a division of PNC Bank, National Association.
10.192
Commercial Mortgage Servicing Oversight Agreement, dated as of December 15, 2015, among PennyMac Corp., PennyMac Holdings, LLC, and PennyMac Loan Services, LLC.
21.1 Subsidiaries of PennyMac Mortgage Investment Trust.
23.1 Consent of Deloitte & Touche LLP.
31.1
Certification of Stanford L. Kurland pursuant to Rule 13a-14(a), as adopted pursuant to Section 302 of the Sarbanes-Oxley Act of 2002.
31.2
Certification of Anne D. McCallion pursuant to Rule 13a-14(a), as adopted pursuant to Section 302 of the Sarbanes-Oxley Act of 2002.
32.1**
Certification of Stanford L. Kurland pursuant to Rule 13a-14(b) and 18 U.S.C. Section 1350, as adopted pursuant to Section 906 of the Sarbanes-Oxley Act of 2002.
32.2**
Certification of Anne D. McCallion pursuant to Rule 13a-14(b) and 18 U.S.C. Section 1350, as adopted pursuant to Section 906 of the Sarbanes-Oxley Act of 2002.
101
Interactive data files pursuant to Rule 405 of Regulation S-T: (i) the Consolidated Balance Sheets as of December 31, 2015 and 2014, (ii) the Consolidated Statements of Income for the years ended December 31, 2015, 2014 and 2013, (iii) the Consolidated Statements of Changes in Shareholders’ Equity for the years ended December 31, 2015, 2014 and 2013, (iv) the Consolidated Statements of Cash Flows for the years ended December 31, 2015, 2014 and 2013, and (v) the Notes to the Consolidated Financial Statements.
** The certifications attached hereto as Exhibits 32.1 and 32.2 are furnished to the SEC pursuant to Section 906 of the Sarbanes-Oxley Act of 2002 and shall not be deemed filed for purposes of Section 18 of the Securities Exchange Act of 1934, as amended, nor shall it be deemed incorporated by reference in any filing under the Securities Act of 1933, except as shall be expressly set forth by specific reference in such filing.
† Indicates management contract or compensatory plan or arrangement.

PENNYMAC MORTGAGE INVESTMENT TRUST AND SUBSIDIARIES
INDEX TO CONSOLIDATED FINANCIAL STATEMENTS
December 31, 2015 PageReport of Independent Registered Public Accounting Firm Financial Statements:
Consolidated Balance Sheets F–1Consolidated Statements of Income F–3Consolidated Statements of Changes in Shareholders’ Equity F–4Consolidated Statements of Cash Flows F–5Notes to Consolidated Financial Statements F–7

REPORT OF INDEPENDENT REGISTERED PUBLIC ACCOUNTING FIRM
To the Board of Trustees and Shareholders of PennyMac Mortgage Investment Trust:
We have audited the accompanying consolidated balance sheets of PennyMac Mortgage Investment Trust and subsidiaries (the “Company”) as of December 31, 2015 and 2014, and the related consolidated statements of income, changes in shareholders’ equity, and cash flows for each of the three years in the period ended December 31, 2015. These consolidated financial statements are the responsibility of the Company’s management. Our responsibility is to express an opinion on these financial statements based on our audits.
We conducted our audits in accordance with the standards of the Public Company Accounting Oversight Board (United States). Those standards require that we plan and perform the audit to obtain reasonable assurance about whether the financial statements are free of material misstatement. An audit includes examining, on a test basis, evidence supporting the amounts and disclosures in the financial statements. An audit also includes assessing the accounting principles used and significant estimates made by management, as well as evaluating the overall financial statement presentation. We believe that our audits provide a reasonable basis for our opinion.
In our opinion, such consolidated financial statements present fairly, in all material respects, the financial position of PennyMac Mortgage Investment Trust and subsidiaries at December 31, 2015 and 2014, and the results of their operations and their cash flows for each of the three years in the period ended December 31, 2015, in conformity with accounting principles generally accepted in the United States of America.
We have also audited, in accordance with the standards of the Public Company Accounting Oversight Board (United States), the Company’s internal control over financial reporting as of December 31, 2015, based on the criteria established in Internal Control—Integrated Framework (2013) issued by the Committee of Sponsoring Organizations of the Treadway Commission and our report dated February 29, 2016, expressed an unqualified opinion on the Company’s internal control over financial reporting.
/s/ DELOITTE & TOUCHE LLP
Los Angeles, California February 29, 2016
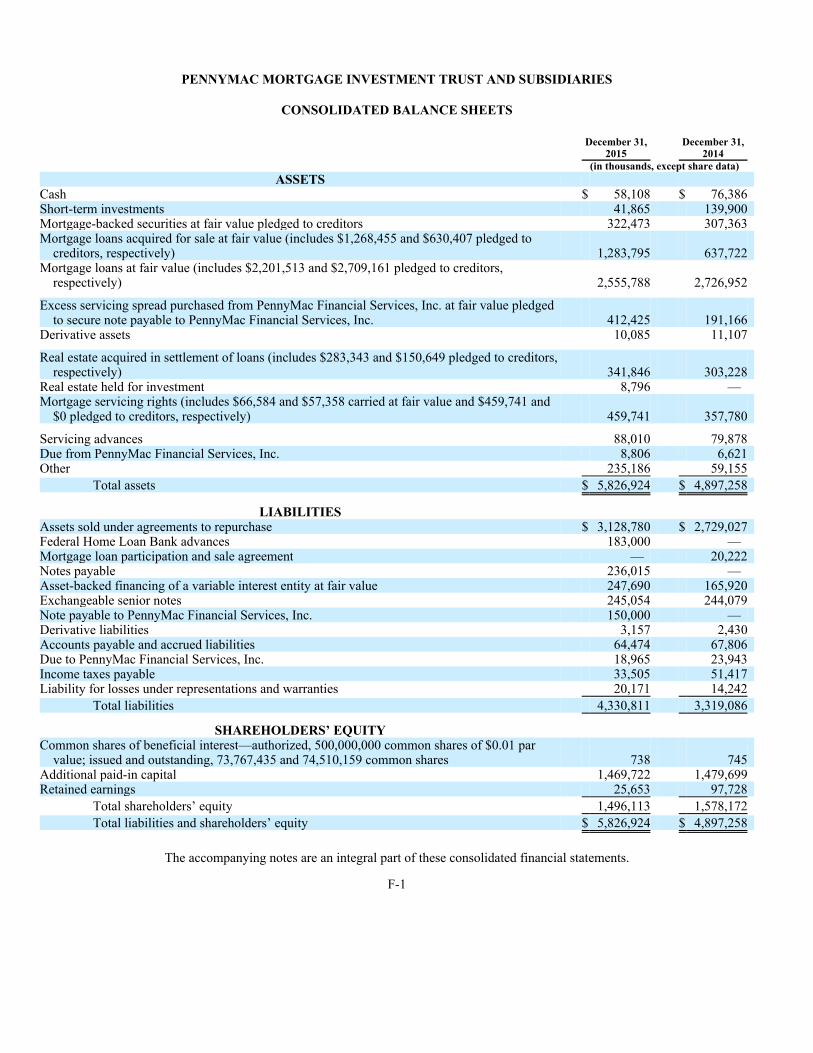
PENNYMAC MORTGAGE INVESTMENT TRUST AND SUBSIDIARIES
CONSOLIDATED BALANCE SHEETS
The accompanying notes are an integral part of these consolidated financial statements.
F-1
December 31, December 31, 2015 2014 (in thousands, except share data)
ASSETS Cash $ 58,108 $ 76,386 Short-term investments 41,865 139,900 Mortgage-backed securities at fair value pledged to creditors 322,473 307,363 Mortgage loans acquired for sale at fair value (includes $1,268,455 and $630,407 pledged to
creditors, respectively) 1,283,795 637,722 Mortgage loans at fair value (includes $2,201,513 and $2,709,161 pledged to creditors,
respectively) 2,555,788 2,726,952
Excess servicing spread purchased from PennyMac Financial Services, Inc. at fair value pledged to secure note payable to PennyMac Financial Services, Inc. 412,425 191,166
Derivative assets 10,085 11,107
Real estate acquired in settlement of loans (includes $283,343 and $150,649 pledged to creditors, respectively) 341,846 303,228
Real estate held for investment 8,796 — Mortgage servicing rights (includes $66,584 and $57,358 carried at fair value and $459,741 and
$0 pledged to creditors, respectively) 459,741 357,780
Servicing advances 88,010 79,878 Due from PennyMac Financial Services, Inc. 8,806 6,621 Other 235,186 59,155
Total assets $ 5,826,924 $ 4,897,258
LIABILITIES Assets sold under agreements to repurchase $ 3,128,780 $ 2,729,027 Federal Home Loan Bank advances 183,000 — Mortgage loan participation and sale agreement — 20,222 Notes payable 236,015 — Asset-backed financing of a variable interest entity at fair value 247,690 165,920 Exchangeable senior notes 245,054 244,079 Note payable to PennyMac Financial Services, Inc. 150,000 — Derivative liabilities 3,157 2,430 Accounts payable and accrued liabilities 64,474 67,806 Due to PennyMac Financial Services, Inc. 18,965 23,943 Income taxes payable 33,505 51,417 Liability for losses under representations and warranties 20,171 14,242
Total liabilities 4,330,811 3,319,086
SHAREHOLDERS’ EQUITY Common shares of beneficial interest—authorized, 500,000,000 common shares of $0.01 par
value; issued and outstanding, 73,767,435 and 74,510,159 common shares 738 745 Additional paid-in capital 1,469,722 1,479,699 Retained earnings 25,653 97,728
Total shareholders’ equity 1,496,113 1,578,172
Total liabilities and shareholders’ equity $ 5,826,924 $ 4,897,258
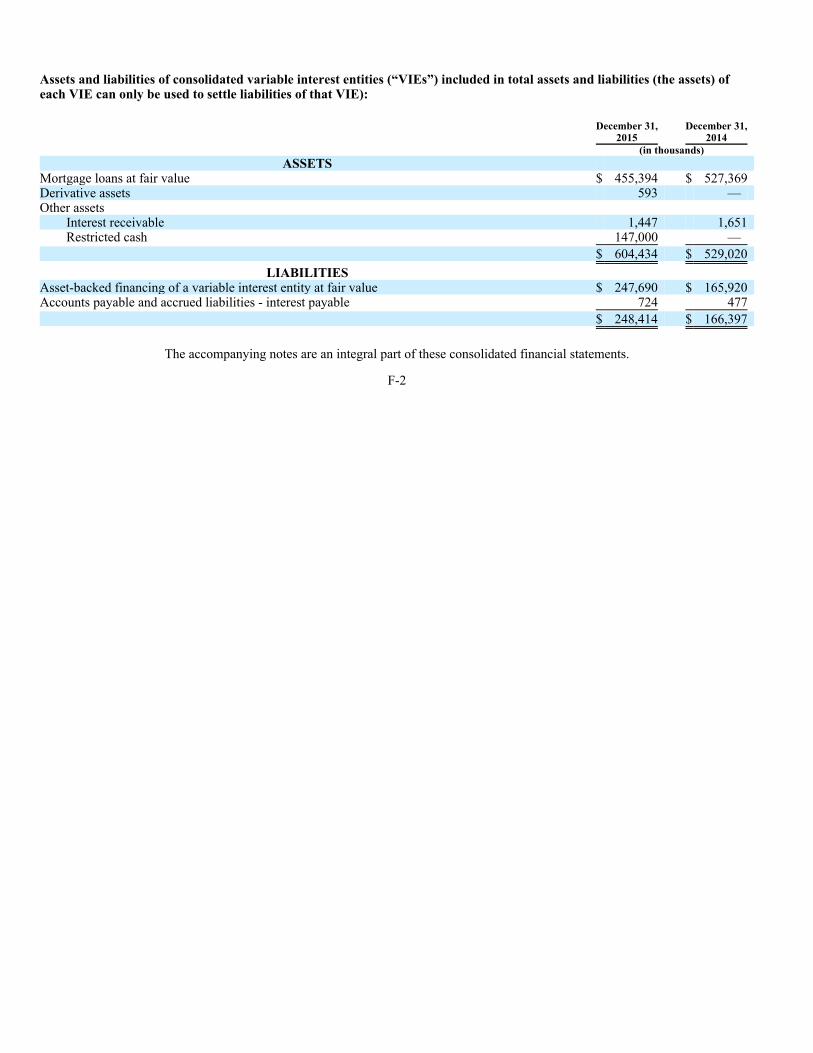
Assets and liabilities of consolidated variable interest entities (“VIEs”) included in total assets and liabilities (the assets) of each VIE can only be used to settle liabilities of that VIE):
The accompanying notes are an integral part of these consolidated financial statements.
F-2
December 31, December 31, 2015 2014 (in thousands)
ASSETS Mortgage loans at fair value $ 455,394 $ 527,369 Derivative assets 593 — Other assets
Interest receivable 1,447 1,651 Restricted cash 147,000 —
$ 604,434 $ 529,020
LIABILITIES Asset-backed financing of a variable interest entity at fair value $ 247,690 $ 165,920 Accounts payable and accrued liabilities - interest payable 724 477
$ 248,414 $ 166,397
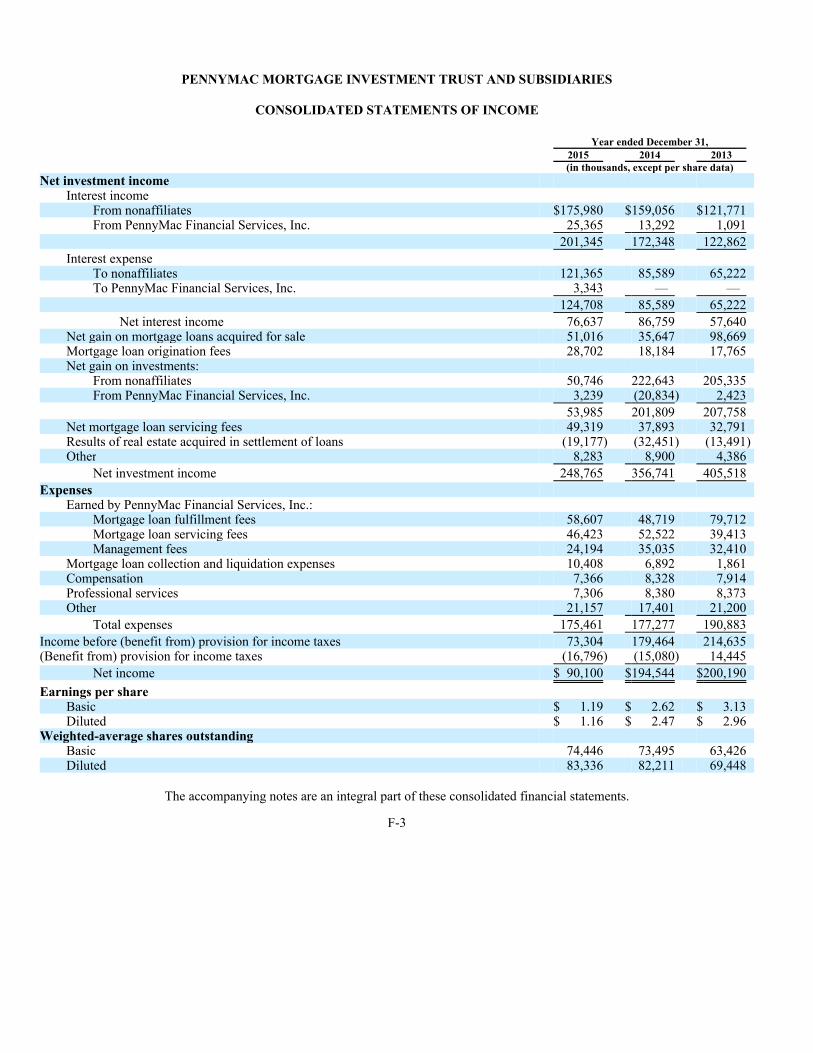
PENNYMAC MORTGAGE INVESTMENT TRUST AND SUBSIDIARIES
CONSOLIDATED STATEMENTS OF INCOME
The accompanying notes are an integral part of these consolidated financial statements.
F-3
Year ended December 31, 2015 2014 2013 (in thousands, except per share data)Net investment income
Interest income From nonaffiliates $175,980 $159,056 $121,771 From PennyMac Financial Services, Inc. 25,365 13,292 1,091
201,345 172,348 122,862
Interest expense To nonaffiliates 121,365 85,589 65,222 To PennyMac Financial Services, Inc. 3,343 — —
124,708 85,589 65,222
Net interest income 76,637 86,759 57,640 Net gain on mortgage loans acquired for sale 51,016 35,647 98,669 Mortgage loan origination fees 28,702 18,184 17,765 Net gain on investments:
From nonaffiliates 50,746 222,643 205,335 From PennyMac Financial Services, Inc. 3,239 (20,834) 2,423
53,985 201,809 207,758 Net mortgage loan servicing fees 49,319 37,893 32,791 Results of real estate acquired in settlement of loans (19,177) (32,451) (13,491) Other 8,283 8,900 4,386
Net investment income 248,765 356,741 405,518
Expenses Earned by PennyMac Financial Services, Inc.:
Mortgage loan fulfillment fees 58,607 48,719 79,712 Mortgage loan servicing fees 46,423 52,522 39,413 Management fees 24,194 35,035 32,410
Mortgage loan collection and liquidation expenses 10,408 6,892 1,861 Compensation 7,366 8,328 7,914 Professional services 7,306 8,380 8,373 Other 21,157 17,401 21,200
Total expenses 175,461 177,277 190,883
Income before (benefit from) provision for income taxes 73,304 179,464 214,635 (Benefit from) provision for income taxes (16,796) (15,080) 14,445
Net income $ 90,100 $194,544 $200,190
Earnings per share Basic $ 1.19 $ 2.62 $ 3.13 Diluted $ 1.16 $ 2.47 $ 2.96
Weighted-average shares outstanding Basic 74,446 73,495 63,426 Diluted 83,336 82,211 69,448

PENNYMAC MORTGAGE INVESTMENT TRUST AND SUBSIDIARIES
CONSOLIDATED STATEMENTS OF CHANGES IN SHAREHOLDERS’ EQUITY
The accompanying notes are an integral part of these consolidated financial statements.
F-4
Common shares
Numberof
sharesPar
value
Additional paid-in capital
Retained earnings Total
(in thousands, except per share data)Balance at December, 2012 58,904 $589 $1,129,858 $ 70,889 $1,201,336 Net income — — — 200,190 200,190 Share-based compensation 254 3 5,449 — 5,452 Common share dividends, $2.87 per share — — — (189,138) (189,138) Issuance of common shares 11,300 113 261,482 — 261,595 Underwriting and offering costs — — (12,321) — (12,321)
Balance at December 31, 2013 70,458 705 1,384,468 81,941 1,467,114 Net income — — — 194,544 194,544 Share-based compensation 235 2 5,750 — 5,752 Common share dividends, $2.40 per share — — — (178,757) (178,757) Issuance of common shares 3,817 38 90,551 — 90,589 Underwriting and offering costs — — (1,070) — (1,070)
Balance at December 31, 2014 74,510 745 1,479,699 97,728 1,578,172 Net income — — — 90,100 90,100 Share-based compensation 302 3 6,343 — 6,346 Common share dividends, $2.16 per share — — — (162,175) (162,175) Issuance of common shares — — 8 — 8 Repurchase of common shares (1,045) (10) (16,328) — (16,338)
Balance at December 31, 2015 73,767 $738 $1,469,722 $ 25,653 $1,496,113
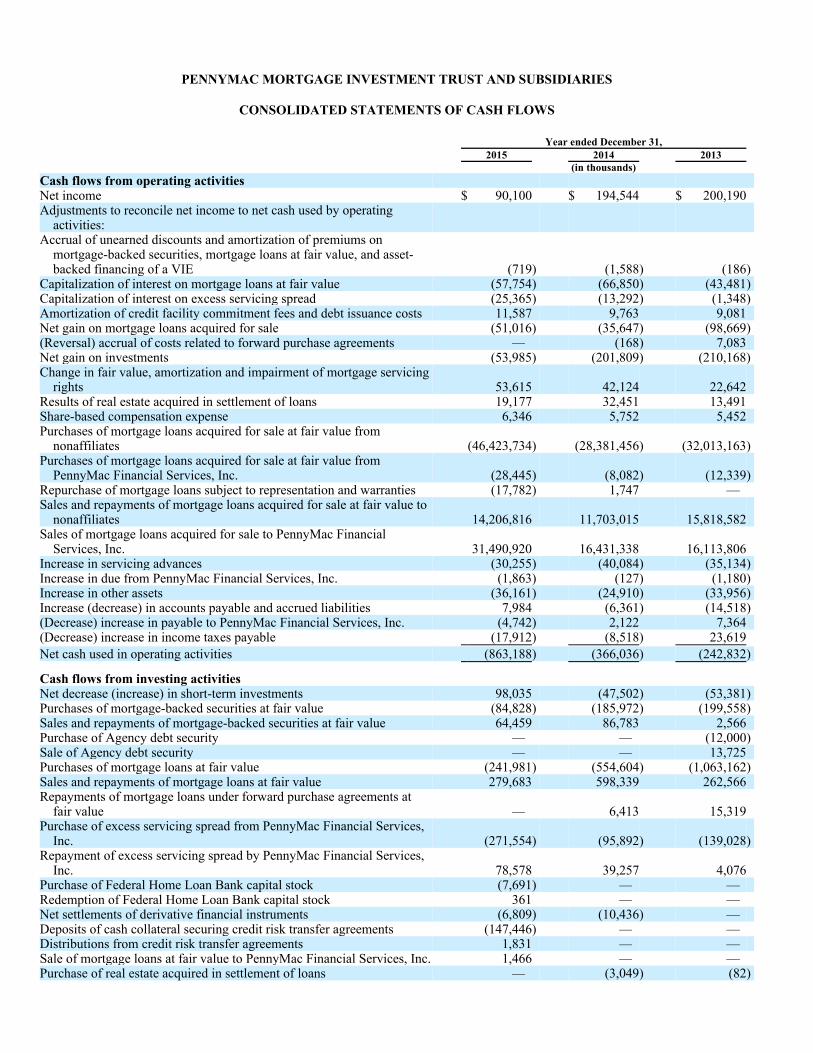
PENNYMAC MORTGAGE INVESTMENT TRUST AND SUBSIDIARIES
CONSOLIDATED STATEMENTS OF CASH FLOWS Year ended December 31, 2015 2014 2013 (in thousands)Cash flows from operating activities Net income $ 90,100 $ 194,544 $ 200,190 Adjustments to reconcile net income to net cash used by operating
activities: Accrual of unearned discounts and amortization of premiums on
mortgage-backed securities, mortgage loans at fair value, and asset-backed financing of a VIE (719) (1,588) (186)
Capitalization of interest on mortgage loans at fair value (57,754) (66,850) (43,481) Capitalization of interest on excess servicing spread (25,365) (13,292) (1,348) Amortization of credit facility commitment fees and debt issuance costs 11,587 9,763 9,081 Net gain on mortgage loans acquired for sale (51,016) (35,647) (98,669) (Reversal) accrual of costs related to forward purchase agreements — (168) 7,083 Net gain on investments (53,985) (201,809) (210,168) Change in fair value, amortization and impairment of mortgage servicing
rights 53,615 42,124 22,642 Results of real estate acquired in settlement of loans 19,177 32,451 13,491 Share-based compensation expense 6,346 5,752 5,452 Purchases of mortgage loans acquired for sale at fair value from
nonaffiliates (46,423,734) (28,381,456) (32,013,163) Purchases of mortgage loans acquired for sale at fair value from
PennyMac Financial Services, Inc. (28,445) (8,082) (12,339) Repurchase of mortgage loans subject to representation and warranties (17,782) 1,747 — Sales and repayments of mortgage loans acquired for sale at fair value to
nonaffiliates 14,206,816 11,703,015 15,818,582 Sales of mortgage loans acquired for sale to PennyMac Financial
Services, Inc. 31,490,920 16,431,338 16,113,806 Increase in servicing advances (30,255) (40,084) (35,134) Increase in due from PennyMac Financial Services, Inc. (1,863) (127) (1,180) Increase in other assets (36,161) (24,910) (33,956) Increase (decrease) in accounts payable and accrued liabilities 7,984 (6,361) (14,518) (Decrease) increase in payable to PennyMac Financial Services, Inc. (4,742) 2,122 7,364 (Decrease) increase in income taxes payable (17,912) (8,518) 23,619
Net cash used in operating activities (863,188) (366,036) (242,832)
Cash flows from investing activities Net decrease (increase) in short-term investments 98,035 (47,502) (53,381) Purchases of mortgage-backed securities at fair value (84,828) (185,972) (199,558) Sales and repayments of mortgage-backed securities at fair value 64,459 86,783 2,566 Purchase of Agency debt security — — (12,000) Sale of Agency debt security — — 13,725 Purchases of mortgage loans at fair value (241,981) (554,604) (1,063,162) Sales and repayments of mortgage loans at fair value 279,683 598,339 262,566 Repayments of mortgage loans under forward purchase agreements at
fair value — 6,413 15,319 Purchase of excess servicing spread from PennyMac Financial Services,
Inc. (271,554) (95,892) (139,028) Repayment of excess servicing spread by PennyMac Financial Services,
Inc. 78,578 39,257 4,076 Purchase of Federal Home Loan Bank capital stock (7,691) — — Redemption of Federal Home Loan Bank capital stock 361 — — Net settlements of derivative financial instruments (6,809) (10,436) — Deposits of cash collateral securing credit risk transfer agreements (147,446) — — Distributions from credit risk transfer agreements 1,831 — — Sale of mortgage loans at fair value to PennyMac Financial Services, Inc. 1,466 — — Purchase of real estate acquired in settlement of loans — (3,049) (82)

The accompanying notes are an integral part of these consolidated financial statements.
F-5
Sales of real estate acquired in settlement of loans 240,833 184,467 120,925 Sales of real estate acquired in settlement of loans under forward
purchase agreements — 5,365 651 Purchase of mortgage servicing rights (2,335) — (1,419) Sale of mortgage servicing rights 752 474 — Decrease in margin deposits and restricted cash 8,148 4,329 19,806
Net cash provided by (used in) investing activities 11,502 27,972 (1,028,996)
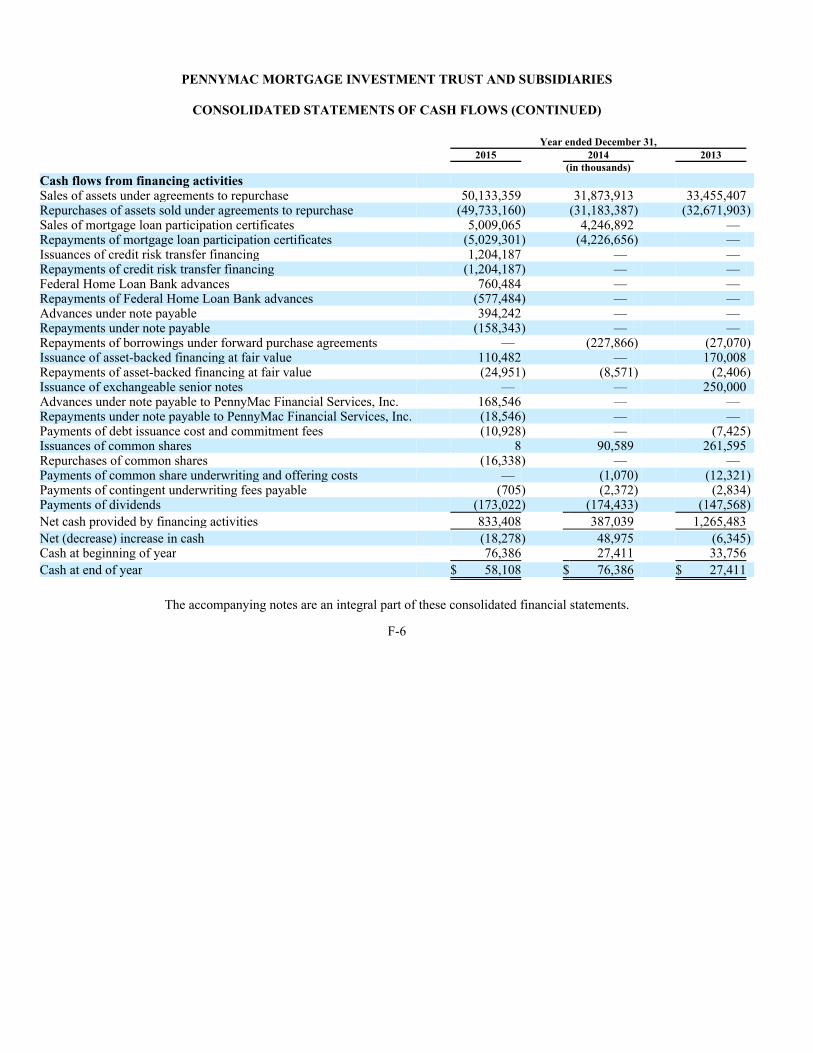
PENNYMAC MORTGAGE INVESTMENT TRUST AND SUBSIDIARIES
CONSOLIDATED STATEMENTS OF CASH FLOWS (CONTINUED)
The accompanying notes are an integral part of these consolidated financial statements.
F-6
Year ended December 31, 2015 2014 2013 (in thousands)Cash flows from financing activities Sales of assets under agreements to repurchase 50,133,359 31,873,913 33,455,407 Repurchases of assets sold under agreements to repurchase (49,733,160) (31,183,387) (32,671,903) Sales of mortgage loan participation certificates 5,009,065 4,246,892 — Repayments of mortgage loan participation certificates (5,029,301) (4,226,656) — Issuances of credit risk transfer financing 1,204,187 — — Repayments of credit risk transfer financing (1,204,187) — — Federal Home Loan Bank advances 760,484 — — Repayments of Federal Home Loan Bank advances (577,484) — — Advances under note payable 394,242 — — Repayments under note payable (158,343) — — Repayments of borrowings under forward purchase agreements — (227,866) (27,070) Issuance of asset-backed financing at fair value 110,482 — 170,008 Repayments of asset-backed financing at fair value (24,951) (8,571) (2,406) Issuance of exchangeable senior notes — — 250,000 Advances under note payable to PennyMac Financial Services, Inc. 168,546 — — Repayments under note payable to PennyMac Financial Services, Inc. (18,546) — — Payments of debt issuance cost and commitment fees (10,928) — (7,425) Issuances of common shares 8 90,589 261,595 Repurchases of common shares (16,338) — — Payments of common share underwriting and offering costs — (1,070) (12,321) Payments of contingent underwriting fees payable (705) (2,372) (2,834) Payments of dividends (173,022) (174,433) (147,568)
Net cash provided by financing activities 833,408 387,039 1,265,483
Net (decrease) increase in cash (18,278) 48,975 (6,345) Cash at beginning of year 76,386 27,411 33,756
Cash at end of year $ 58,108 $ 76,386 $ 27,411

PENNYMAC MORTGAGE INVESTMENT TRUST AND SUBSIDIARIES
NOTES TO CONSOLIDATED FINANCIAL STATEMENTS
Note 1—Organization
PennyMac Mortgage Investment Trust (“PMT” or the “Company”) was organized in Maryland on May 18, 2009, and commenced operations on August 4, 2009, when it completed its initial offerings of common shares of beneficial interest (“common shares”). The Company is a specialty finance company, which, through its subsidiaries (all of which are wholly-owned), invests primarily in residential mortgage loans and mortgage-related assets.
The Company operates in two segments, correspondent production and investment activities:
Most of the mortgage loans the Company has acquired in its correspondent production activities have been eligible for sale to government-sponsored entities such as the Federal National Mortgage Association (“Fannie Mae”) and the Federal Home Loan Mortgage Corporation (“Freddie Mac”) or through government agencies such as the Government National Mortgage Association (“Ginnie Mae”). Fannie Mae, Freddie Mac and Ginnie Mae are each referred to as an “Agency” and, collectively, as the “Agencies.”
The Company believes that it qualifies, and has elected to be taxed, as a real estate investment trust (“REIT”) under the Internal Revenue Code of 1986, as amended (the “Internal Revenue Code”), beginning with its taxable period ended on December 31, 2009. To maintain its tax status as a REIT, the Company has to distribute at least 90% of its taxable income in the form of qualifying distributions to shareholders.
The Company conducts substantially all of its operations and makes substantially all of its investments through its subsidiary, PennyMac Operating Partnership, L.P. (the “Operating Partnership”), and the Operating Partnership’s subsidiaries. A wholly-owned subsidiary of the Company is the sole general partner, and the Company is the sole limited partner, of the Operating Partnership.
Note 2—Concentration of Risks
As discussed in Note 1—Organization above, PMT’s operations and investing activities are centered in mortgage-related assets, a substantial portion of which are distressed at acquisition. The mortgage loans at fair value not acquired for sale or held in a Variable Interest Entity (“VIE”) are generally purchased at discounts reflecting their distressed state or perceived higher risk of default, as well as a greater likelihood of collateral documentation deficiencies.
Because of the Company’s investments, PMT is exposed, to a greater extent than traditional mortgage investors, to the risks that borrowers may be in economic distress and/or may have become unemployed, bankrupt or otherwise unable or unwilling to make payments when due, and to the effects of fluctuations in the residential real estate market on the performance of its investments. Factors influencing these risks include, but are not limited to:
F-7
• The correspondent production segment represents the Company’s operations aimed at serving as an intermediary between mortgage lenders and the capital markets by purchasing, pooling and reselling newly originated prime credit quality mortgage loans either directly or in the form of mortgage-backed securities (“MBS”), using the services of PNMAC Capital Management, LLC (“PCM” or the “Manager”) and PennyMac Loan Services, LLC (“PLS” or the “Servicer”), both indirect subsidiaries of PennyMac Financial Services, Inc. (“PFSI”).
• The investment activities segment represents the Company’s investments in mortgage-related assets, which include MBS, distressed mortgage loans, excess servicing spread (“ESS”), real estate acquired in settlement of loans (“REO”), real estate held for investment, mortgage servicing rights (“MSRs”), small balance commercial real estate mortgage loans, and credit risk transfer agreements (“CRT Agreements”). The Company seeks to maximize the value of its acquired distressed mortgage loans through proprietary loan modification programs, special servicing or other initiatives focused on keeping borrowers in their homes. Where this is not possible, such as in the case of many nonperforming mortgage loans, the Company seeks to effect property resolution in a timely, orderly and economically efficient manner, including through the use of resolution alternatives to foreclosure.
• changes in the overall economy, unemployment rates and residential real estate values in the markets where the properties securing the Company’s mortgage loans are located;
• PCM’s ability to identify and PLS’ ability to execute optimal resolutions of certain mortgage loans;
• the accuracy of valuation information obtained during the Company’s due diligence activities;
• PCM’s ability to effectively model, and to develop appropriate model inputs that properly anticipate, future outcomes;
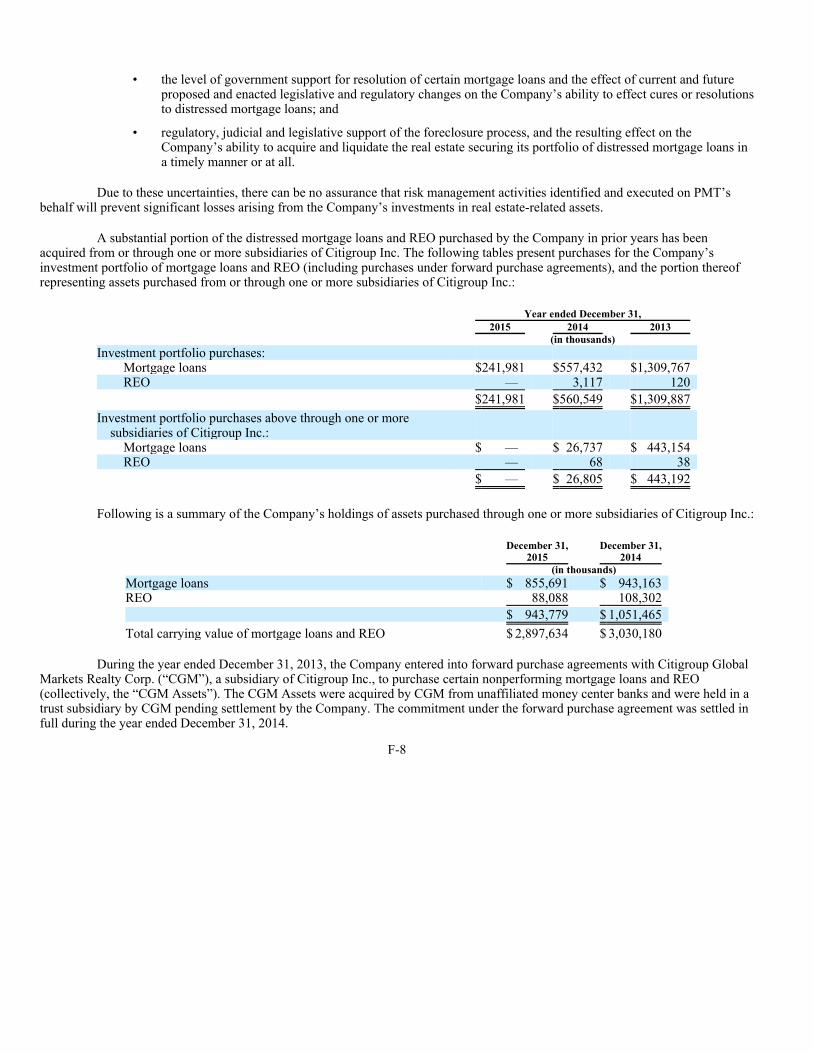
Due to these uncertainties, there can be no assurance that risk management activities identified and executed on PMT’s behalf will prevent significant losses arising from the Company’s investments in real estate-related assets.
A substantial portion of the distressed mortgage loans and REO purchased by the Company in prior years has been acquired from or through one or more subsidiaries of Citigroup Inc. The following tables present purchases for the Company’s investment portfolio of mortgage loans and REO (including purchases under forward purchase agreements), and the portion thereof representing assets purchased from or through one or more subsidiaries of Citigroup Inc.:
Following is a summary of the Company’s holdings of assets purchased through one or more subsidiaries of Citigroup Inc.:
During the year ended December 31, 2013, the Company entered into forward purchase agreements with Citigroup Global Markets Realty Corp. (“CGM”), a subsidiary of Citigroup Inc., to purchase certain nonperforming mortgage loans and REO (collectively, the “CGM Assets”). The CGM Assets were acquired by CGM from unaffiliated money center banks and were held in a trust subsidiary by CGM pending settlement by the Company. The commitment under the forward purchase agreement was settled in full during the year ended December 31, 2014.
F-8
• the level of government support for resolution of certain mortgage loans and the effect of current and future
proposed and enacted legislative and regulatory changes on the Company’s ability to effect cures or resolutions to distressed mortgage loans; and
• regulatory, judicial and legislative support of the foreclosure process, and the resulting effect on the
Company’s ability to acquire and liquidate the real estate securing its portfolio of distressed mortgage loans in a timely manner or at all.
Year ended December 31, 2015 2014 2013 (in thousands)Investment portfolio purchases:
Mortgage loans $241,981 $557,432 $1,309,767 REO — 3,117 120
$241,981 $560,549 $1,309,887
Investment portfolio purchases above through one or more subsidiaries of Citigroup Inc.:
Mortgage loans $ — $ 26,737 $ 443,154 REO — 68 38
$ — $ 26,805 $ 443,192
December 31,
2015 December 31,
2014 (in thousands) Mortgage loans $ 855,691 $ 943,163 REO 88,088 108,302
$ 943,779 $ 1,051,465
Total carrying value of mortgage loans and REO $ 2,897,634 $ 3,030,180

The Company recognized the CGM assets and related obligations as of the dates of the forward purchase agreements and recognized all subsequent income and changes in fair value relating to such assets. As a result of recognizing the CGM assets and related obligations, the Company’s consolidated statements of income and cash flows included the following amounts related to the forward purchase agreements:
The Company has no other variable interests in the trust subsidiary of CGM or other exposure to the creditors of the trust subsidiary that could expose the Company to loss.
Note 3—Significant Accounting Policies
PMT’s significant accounting policies are summarized below.
Basis of Presentation
The Company’s consolidated financial statements have been prepared in compliance with accounting principles generally accepted in the United States (“GAAP”) as codified in the Financial Accounting Standards Board’s (“FASB”) Accounting Standards Codification (“ASC”).
Use of Estimates
Preparation of financial statements in compliance with GAAP requires the Manager to make estimates and judgments that affect the reported amounts of assets and liabilities and the disclosure of contingent assets and liabilities at the date of the financial statements, and revenues and expenses during the reporting period. Actual results will likely differ from those estimates.
Consolidation
The consolidated financial statements include the accounts of PMT and all wholly-owned subsidiaries. PMT has no significant equity method or cost-basis investments. Intercompany accounts and transactions have been eliminated upon consolidation. The Company also consolidates assets and liabilities included in certain securitization transactions and forward purchase agreements as discussed below.
Securitization Transactions
The Company enters into various types of on- and off-balance sheet transactions with special purpose entities (“SPEs”), which are trusts that are established for a limited purpose. Generally, SPEs are formed in connection with securitization transactions. In a securitization transaction, the Company transfers mortgage loans on its balance sheet to an SPE, which then issues to investors various forms of beneficial interests in those assets. In a securitization transaction, the Company typically receives a combination of cash and interests in the SPE in exchange for the assets transferred by the Company.
SPEs are generally considered VIEs. A VIE is an entity having either a total equity investment that is insufficient to finance its activities without additional subordinated financial support or whose equity investors at risk lack the ability to control the entity’s activities. Variable interests are investments or other interests that will absorb portions of a VIE’s expected losses or receive portions of the VIE’s expected residual returns. Expected residual returns represent the expected positive variability in the fair value of a VIE’s net assets.
PMT consolidates the assets and liabilities of VIEs of which the Company is the primary beneficiary. The primary beneficiary is the party that has both the power to direct the activities that most significantly impact the VIE and holds a variable interest that could potentially be significant to the VIE. To determine whether a variable interest the Company holds could potentially be significant to the VIE, the Company considers both qualitative and quantitative factors regarding the nature, size and form of its involvement with the VIE. The Company assesses whether it is the primary beneficiary of a VIE on an ongoing basis.
F-9
Year ended December 31, 2014 2013 (in thousands) Statements of income:
Interest income $ 3,584 $ 3,659 Interest expense $ 2,363 $ 3,707 Net gain on investments $ 803 $ 11,720 Net mortgage loan servicing fees $ 516 $ 852 Results of REO $ (473) $ (20)
Statements of cash flows: Repayments of mortgage loans $ 6,413 $ 15,319 Sales of REO $ 5,365 $ 651 Repayments of borrowings under forward purchase agreements $ 227,866 $ 27,070

The Company evaluates the securitization trust into which mortgage loans are sold to determine whether the entity is a VIE and whether the Company is the primary beneficiary and therefore is required to consolidate the securitization trust.
Jumbo Mortgage Loan Financing
On September 30, 2013, the Company completed a securitization transaction in which PMT Loan Trust 2013-J1, a VIE, issued $537.0 million in unpaid principal balance (“UPB”) of certificates backed by fixed-rate prime jumbo mortgage loans at a 3.9% weighted yield. The VIE was consolidated by the Company as PMT determined it was the primary beneficiary of the VIE as it had the power, through its affiliate, PLS, in its role as servicer of the mortgage loans, to direct the activities of the trust that most significantly impact the trust’s economic performance. Further, the retained subordinated and residual interest trust certificates expose the Company to losses and returns that could potentially be significant to the VIE.
The asset-backed securities issued by the consolidated VIE are backed by the expected cash flows from the underlying fixed-rate prime jumbo mortgage loans. Cash inflows from these fixed-rate prime jumbo mortgage loans are distributed to investors and service providers in accordance with the contractual priority of payments and, as such, most of these inflows must be directed first to service and repay the senior certificates. After these senior certificates are settled, substantially all cash inflows will be directed to the subordinated certificates until fully repaid and, thereafter, to the residual interest that the Company owns in the trust.
The Company retains beneficial interests in the securitization transaction, including senior and subordinated certificates and residual interests issued by the VIE. The Company retains credit risk in the securitization because the Company’s beneficial interests include the most subordinated interests in the securitized assets, which are the first to absorb credit losses on those assets. The Company expects that any credit losses in the pools of securitized assets will likely be limited to the Company’s subordinated and residual interests. The Company has no obligation to repurchase or replace securitized assets that subsequently become delinquent or are otherwise in default other than pursuant to breaches of representations and warranties.
For financial reporting purposes, the mortgage loans owned by the consolidated VIE are included in Mortgage loans at fair value on the Company’s consolidated balance sheets and are also shown under a separate statement following the Company’s consolidated balance sheets. The securities issued to third parties by the consolidated VIE are included in Asset-backed financing of a variable interest entity at fair value on the Company’s consolidated balance sheets. The Company includes the interest income earned on the mortgage loans owned by the VIE and interest expense attributable to the asset-backed securities issued by the VIE on its consolidated income statements.
Credit Risk Transfer
The Company, through its wholly-owned subsidiary, PennyMac Corp. (“PMC”), entered into CRT Agreements with Fannie Mae, pursuant to which PMC, through subsidiary trust entities, sells pools of mortgage loans into Fannie Mae-guaranteed securitizations while retaining a portion of the credit risk underlying such mortgage loans in exchange for a portion of the contractual guarantee fee normally charged by Fannie Mae. The mortgage loans subject to the CRT Agreements are transferred by PMC to subsidiary trust entities which sell the mortgage loans into Fannie Mae mortgage loan securitizations and issue the credit guarantees to Fannie Mae. Transfers of mortgage loans subject to CRT Agreements receive sale accounting treatment upon fulfillment of the criteria for sale recognition contained in the Transfers and Servicing topic of the FASB’s ASC.
The Manager has concluded that the Company’s subsidiary trust entities are VIEs and the Company is the primary beneficiary of the VIEs as it is the holder of the primary beneficial interests which absorb the variability of the trusts’ results of operations. Consolidation of the VIEs results in the inclusion on the Company’s consolidated balance sheet of the credit guarantees, including the cash pledged to fulfill the guarantee obligation, on the Company’s consolidated balance sheet in the form of a net derivative and the pledged cash. The pledged cash represents the Company’s maximum contractual exposure to claims under its credit guarantee and is the sole source of settlement of losses under the CRT Agreements. Gains and losses on net derivatives related to CRT Agreements are included in Net gain on investments in the consolidated statements of income.
Forward Purchase Agreements
The Company entered into transactions whereby it agreed to purchase identified pools of mortgage loans and real estate at a later date while assuming all of the responsibilities for servicing the mortgage loans and the risks and rewards relating to holding such mortgage loans as of a cutoff date that is before the mortgage loans were purchased. All of the changes in the fair value and cash flows of the assets subject to forward purchase agreements were attributable solely to the Company, and such cash flows could only be used to settle the related liability. Such transactions are referred to as forward purchase agreements. Under forward purchase agreements, the assets are held by the seller within a separate trust entity. The Manager concluded that the Company was the primary beneficiary of those assets and therefore consolidated those assets and related liabilities in the separate trust entity.
F-10

The Company’s interests in the assets subject to forward purchase agreements were deemed to be contractually segregated from all other interests in the trust entity. When assets are contractually segregated, they are often referred to as a “silo.” For these transactions, the silo consisted of the assets subject to forward purchase agreements and the related obligation to purchase the assets. The Company directed all of the activities that impacted the economic results of the assets subject to forward purchase agreements.
The assets subject to forward purchase agreements are included in the notes to the consolidated financial statements as Real estate acquired in settlement of loans under forward purchase agreements and the related liabilities are included as Borrowings under forward purchase agreements.
Fair Value
PMT groups its assets and liabilities at fair value in three levels, based on the markets in which the assets and liabilities are traded and the observability of the inputs used to determine fair value. These levels are:
As a result of the difficulty in observing certain significant valuation inputs affecting “Level 3” financial statement items, the Manager is required to make judgments regarding these items’ fair values. Different persons in possession of the same facts may reasonably arrive at different conclusions as to the inputs to be applied in valuing these financial statement items and their fair values. Likewise, due to the general illiquidity of some of these financial statement items, subsequent transactions may be at values significantly different from those reported.
The Manager reclassifies its financial statement items between levels of the fair value hierarchy when the inputs required to establish fair value at a level of the fair value hierarchy are no longer readily available, requiring the use of lower-level inputs, or when the inputs required to establish fair value at a higher level of the hierarchy become available.
Short-Term Investments
Short-term investments are carried at fair value with changes in fair value recognized in current period income. Short-term investments represent deposit accounts. The Company categorizes its short-term investments as “Level 1” fair value financial statement items.
Mortgage-Backed Securities and Agency Debt Securities
The Company invests in Agency and non-Agency MBS. Purchases and sales of MBS and Agency debt are recorded as of the trade date. The Company’s investments in MBS and Agency debt securities are carried at fair value with changes in fair value recognized in current period income. Changes in fair value arising from amortization of purchase premiums and accrual of unearned discounts are recognized using the interest method and are included in Interest income. Changes in fair value arising from other factors are included in Net gain (loss) on investments. The Company categorizes its investments in MBS and Agency debt securities as “Level 2” fair value financial statement items.
Interest Income Recognition
Interest income on MBS and Agency debt securities is recognized over the life of the security using the interest method. The Manager estimates, at the time of purchase, the future expected cash flows and determines the effective interest rate based on the estimated cash flows and the security’s purchase price. The Manager updates its cash flow estimates monthly.
F-11
• Level 1—Quoted prices in active markets for identical assets or liabilities.
• Level 2—Prices determined or determinable using other significant observable inputs. Observable inputs are inputs that other market participants would use in pricing an asset or liability and are developed based on market data obtained from sources independent of the Company. These may include quoted prices for similar assets and liabilities, interest rates, prepayment speeds, credit risk and other inputs.
• Level 3—Prices determined using significant unobservable inputs. In situations where significant observable inputs are unavailable (for example, when there is little or no market activity for an investment at the end of the period), unobservable inputs may be used. Unobservable inputs reflect the Company’s own judgments about the factors that market participants use in pricing an asset or liability, and are based on the best information available in the circumstances.

Estimating cash flows requires a number of inputs that are subject to uncertainties, including the rate and timing of principal payments (including prepayments, repurchases, defaults and liquidations), coupon interest rate, interest rate fluctuations, interest payment shortfalls due to delinquencies on the underlying mortgage loans, the likelihood of modification and the timing of the magnitude of credit losses on the mortgage loans underlying the securities. The Manager applies its judgment in developing its estimates. However, these uncertainties are difficult to predict; therefore, the outcome of future events will affect the timing and amount of interest income.
Mortgage Loans
Mortgage loans are carried at their fair values. Changes in the fair value of mortgage loans are recognized in current period income. Changes in fair value, other than changes in fair value attributable to accrual of unearned discounts and amortization of purchase premiums, are included in Net gain on investments for mortgage loans classified as mortgage loans at fair value and mortgage loans under forward purchase agreements at fair value and Net gain on mortgage loans acquired for sale for mortgage loans classified as mortgage loans acquired for sale at fair value. Changes in fair value attributable to accrual of unearned discounts and amortization of purchase premiums are included in Interest income on the consolidated statements of income.
Sale Recognition
The Company purchases from and sells mortgage loans into the secondary mortgage market without recourse for credit losses. However, the Company maintains continuing involvement with the loans in the form of servicing arrangements and liability under the representations and warranties it makes to purchasers and insurers of the mortgage loans.
The Company recognizes transfers of mortgage loans as sales based on whether the transfer is made to a VIE:
Interest Income Recognition
The Company has the ability but not the intent to hold mortgage loans acquired for sale, mortgage loans at fair value excluding mortgage loans held in a VIE, and mortgage loans under forward purchase agreements, for the foreseeable future. Therefore, interest income on mortgage loans acquired for sale, mortgage loans at fair value excluding mortgage loans held in a VIE, and mortgage loans under forward purchase agreements is recognized over the life of the loans using their contractual interest rates.
The Company has both the ability and intent to hold mortgage loans held in a VIE for the foreseeable future. Therefore, interest income on mortgage loans held in a variable interest entity is recognized over the estimated remaining life of the mortgage loans using the interest method. Unearned discounts and purchase premiums are accrued and amortized to interest income using the effective interest rate inherent in the estimated cash flows from the mortgage loans.
Income recognition is suspended and the accrued unpaid interest receivable is reversed against interest income when mortgage loans become 90 days delinquent, or when, in the Manager’s opinion, a full recovery of income and principal becomes doubtful. Income recognition is resumed when the loan becomes contractually current.
• For mortgage loans that are not transferred to a VIE, the Company recognizes the transfer as a sale when it surrenders control over the mortgage loans. Control over transferred mortgage loans is deemed to be surrendered when (i) the mortgage loans have been isolated from the Company, (ii) the transferee has the right (free of conditions that constrain it from taking advantage of that right) to pledge or exchange the transferred mortgage loans, and (iii) the Company does not maintain effective control over the transferred mortgage loans through either (a) an agreement that entitles and obligates the Company to repurchase or redeem them before their maturity or (b) the ability to unilaterally cause the holder to return specific mortgage loans.
• For mortgage loans that are transferred to a VIE, the Company recognizes the transfer as a sale when the Manager determines that the Company is not the primary beneficiary of the VIE, as the Company does not both have the power to direct the activities that will have the most significant economic impact on the VIE and does not hold a variable interest that could potentially be significant to the VIE.

Excess Servicing Spread
The Company has acquired the right to receive the ESS related to MSRs owned by PFSI. ESS is carried at its fair value. Changes in fair value are recognized in current period income in Net gain on investments. Because ESS is a claim to a portion of the cash flows from MSRs, its valuation process is similar to that of MSRs. The Manager uses the same discounted cash flow approach to value the ESS as it uses to value the related MSRs except that certain inputs relating to the cost to service the mortgage loans underlying the MSRs and certain ancillary income are not included as these cash flows do not accrue to the holder of the ESS. The Company categorizes ESS as a “Level 3” financial statement item.
F-12

Interest Income Recognition
Interest income for ESS is accrued using the interest method, based upon the expected yield from the ESS through the expected life of the underlying mortgages. Changes to the expected interest yield result in a change in fair value which is recorded in Interest income.
Derivative Financial Instruments
In its mortgage loan origination activities, the Company makes contractual commitments to mortgage loan applicants to originate mortgages at specified interest rates (“interest rate lock commitments” or “IRLCs”). These commitments are accounted for as derivative financial instruments. The Company manages the risk created by IRLCs relating to mortgage loans acquired for sale by entering into forward sale agreements to sell the resulting mortgage loans and by the purchase and sale of interest rate options and futures. Such agreements are also accounted for as derivative financial instruments. These instruments may also be used to manage the risk created by changes in interest rates on certain of the MBS and MSRs the Company holds. The Company classifies its IRLCs as “Level 3” fair value financial statement items and the derivative financial instruments it acquires to manage the risks created by IRLCs and from holding MBS, mortgage loans pending sale and MSRs as “Level 1” or “Level 2” fair value financial statement items.
The Company enters into CRT Agreements whereby it retains a portion of the credit risk relating to mortgage loans it sells into Fannie Mae guaranteed securitizations in exchange for a portion of the contractual guarantee fee related to such securitizations. These investments are classified as “Level 3” fair value financial statement items.
All other derivative financial instruments are used for risk management activities.
The Company accounts for its derivative financial instruments as free-standing derivatives. The Company does not designate its derivative financial instruments for hedge accounting. All derivative financial instruments are recognized on the balance sheet at fair value with changes in fair value being reported in current period income. The fair value of the Company’s derivative financial instruments is included in Derivative assets and Derivative liabilities and changes in fair value are included in Net gain on mortgage loans acquired for sale, in Net gain on investments or in Net mortgage loan servicing fees, as applicable, in the Company’s consolidated statements of income.
When the Company has master netting agreements with its derivatives counterparties, the Company nets its counterparty positions along with any cash collateral received from or delivered to the counterparty.
Real Estate Acquired in Settlement of Loans
REO is measured at the lower of the acquisition cost of the property (as measured by cost in the case of purchased REO; or the fair value of the mortgage loan immediately before REO acquisition in the case of acquisition in settlement of a loan) or its fair value reduced by estimated costs to sell. The Company categorizes REO as a “Level 3” fair value financial statement item. Changes in fair value to levels that are less than or equal to acquisition cost and gains or losses on sale of REO are recognized in the consolidated statements of income under the caption Results of real estate acquired in settlement of loans.
Mortgage Servicing Rights
MSRs arise from contractual agreements between the Company and investors (or their agents) in mortgage securities and mortgage loans. Under these contracts, the Company is obligated to provide mortgage loan servicing functions in exchange for fees and other remuneration. The servicing functions typically performed include, among other responsibilities, collecting and remitting mortgage loan payments; responding to borrower inquiries; accounting for principal and interest, holding custodial (impound) funds for payment of property taxes and insurance premiums; counseling delinquent mortgagors; and supervising the acquisition and disposition of REO. The Company has engaged PFSI to provide these services on its behalf.
The Company recognizes MSRs initially at their fair values, either as proceeds from sales of mortgage loans where the Company assumes the obligation to service the mortgage loan in the sale transaction, or from the purchase of MSRs. The precise fair value of MSRs is difficult to determine because MSRs are not actively traded in observable stand-alone markets. Considerable judgment is required to estimate the fair values of these assets and the exercise of such judgment can significantly affect the Company’s earnings. Therefore, the Company categorizes its MSRs as “Level 3” fair value financial statement items.

The fair value of MSRs is derived from the net positive cash flows associated with the servicing contracts. The Company receives a servicing fee of generally 0.250% annually on the remaining outstanding principal balances of conventional mortgage loans. The servicing fees are collected from the monthly payments made by the mortgagors. The Company generally receives other remuneration including rights to various mortgagor-contracted fees such as late charges and collateral reconveyance charges and the Company is generally entitled to retain any interest earned on funds held pending remittance of mortgagor principal, interest, tax and insurance payments.
F-13

The Company accounts for MSRs at either the asset’s fair value with changes in fair value recorded in current period earnings or using the amortization method with the MSRs carried at the lower of amortized cost or fair value based on the class of MSR. The Company has identified two classes of MSRs: originated MSRs backed by mortgage loans with initial interest rates of less than or equal to 4.5%; and MSRs backed by mortgage loans with initial interest rates of more than 4.5%. Originated MSRs backed by mortgage loans with initial interest rates of less than or equal to 4.5% are accounted for using the amortization method. MSRs backed by loans with initial interest rates of more than 4.5% are accounted for at fair value with changes in fair value recorded in current period income.
MSRs Accounted for Using the MSR Amortization Method
The Company amortizes MSRs that are accounted for using the MSR amortization method. MSR amortization is determined by applying the ratio of the net MSR cash flows projected for the current period to the projected total remaining net MSR cash flows. The estimated total net MSR cash flows are estimated at the beginning of each month using prepayment inputs applicable at that time.
The Company assesses MSRs accounted for using the amortization method for impairment monthly. Impairment occurs when the current fair value of the MSR falls below the asset’s amortized cost. If MSRs are impaired, the impairment is recognized in current-period earnings and the carrying value of the MSRs is adjusted through a valuation allowance. If the fair value of impaired MSRs subsequently increases, the Company recognizes the increase in fair value in current-period earnings and adjusts the carrying value of the MSRs through a reduction in the valuation allowance to adjust the carrying value only to the extent of the valuation allowance.
The Company stratifies its MSRs by risk characteristic when evaluating for impairment. For purposes of performing its MSR impairment evaluation, the Company stratifies its servicing portfolio on the basis of certain risk characteristics including mortgage loan type (fixed-rate or adjustable-rate) and note interest rate. Fixed-rate mortgage loans are stratified into note interest rate pools of 50 basis points for note interest rates between 3.0% and 4.5% and a single pool for note interest rates below 3%. Adjustable rate mortgage loans with initial interest rates of 4.5% or less are evaluated in a single pool. If the fair value of MSRs in any of the note interest rate pools is below the carrying value (carrying value is amortized cost reduced by a valuation allowance) of the MSRs for that pool, impairment is recognized to the extent of the difference between the fair value and the existing carrying value for that pool.
The Manager periodically reviews the various impairment strata to determine whether the fair value of the impaired MSRs in a given stratum is likely to recover in the foreseeable future. When the Manager deems recovery of the fair value to be unlikely in the foreseeable future, a write-down of the cost of the MSRs for that stratum to its estimated recoverable value is charged to the valuation allowance.
Amortization and impairment of MSRs are included in current period income as a component of Net mortgage loan servicing fees.
MSRs Accounted for at Fair Value
Changes in fair value of MSRs accounted for at fair value are recognized in current period income as a component of Net mortgage loan servicing fees.
Servicing Advances
Servicing advances represent advances made on behalf of borrowers and the mortgage loans’ investors to fund delinquent balances for property tax and insurance premiums and out of pocket collection costs (e.g., preservation and restoration of mortgaged property or real estate acquired in settlement of loans, legal fees, appraisals and insurance premiums). Servicing advances are made in accordance with the Company’s servicing agreements and, when made, are deemed recoverable. The Company periodically reviews servicing advances for collectability. Servicing advances are written off when they are deemed uncollectible.
Borrowings
Borrowings, other than Asset - backed financing of a VIE at fair value, are carried at historical cost. Costs of creating the facilities underlying the agreements are included in the carrying value of the borrowing facilities and are amortized to Interest expense over the term of the borrowing facility on the straight-line basis.
F-14

Asset-backed financing of a VIE at Fair Value
The certificates issued to nonaffiliates by the Company relating to the asset-backed financing are recorded as borrowings. Certificates issued to nonaffiliates have the right to receive principal and interest payments of the mortgage loans held by the consolidated VIE. Asset-backed financings of the VIE are carried at fair value. Changes in fair value are recognized in current period income as a component of Net gain on investments. The Company categorizes asset-backed financing of the VIE at fair value as a “Level 2” fair value financial statement item.
Liability for Losses Under Representation and Warranties
The Company’s agreements with the Agencies and other investors include representations and warranties related to the mortgage loans the Company sells to the Agencies and other investors. The representations and warranties require adherence to Agency and other investor origination and underwriting guidelines, including but not limited to the validity of the lien securing the mortgage loan, property eligibility, borrower credit, income and asset requirements, and compliance with applicable federal, state and local law.
In the event of a breach of its representations and warranties, the Company may be required to either repurchase the mortgage loans with the identified defects or indemnify the investor or insurer. In such cases, the Company bears any subsequent credit loss on the mortgage loans. The Company’s credit loss may be reduced by any recourse it has to correspondent lenders that, in turn, had sold such mortgage loans to the Company and breached similar or other representations and warranties. In such event, the Company has the right to seek a recovery of related repurchase losses from that correspondent lender.
The Company records a provision for losses relating to representations and warranties as part of its mortgage loan sale transactions. The method used to estimate the liability for representations and warranties is a function of the representations and warranties given and considers a combination of factors, including, but not limited to, estimated future defaults and mortgage loan repurchase rates, the estimated severity of loss in the event of default and the probability of reimbursement by the correspondent mortgage loan seller. The Company establishes a liability at the time mortgage loans are sold and periodically updates its liability estimate. The level of the liability for representations and warranties is reviewed and approved by the Manager’s management credit committee.
The level of the liability for representations and warranties is difficult to estimate and requires considerable management judgment. The level of mortgage loan repurchase losses is dependent on economic factors, investor demand strategies, and other external conditions that may change over the lives of the underlying mortgage loans. The Company’s representations and warranties are generally not subject to stated limits of exposure. However, the Manager believes that the current unpaid principal balance of mortgage loans sold by the Company to date represents the maximum exposure to repurchases related to representations and warranties. The Manager believes the range of reasonably possible losses in relation to the recorded liability is not material to the Company’s financial condition or results of operations.
Underwriting Commissions and Offering Costs
Underwriting commissions and offering costs incurred in connection with the Company’s share offerings are reflected as a reduction of additional paid-in capital. Contingent offering costs that are deemed by the Manager as probable of being paid are recorded as a reduction of additional paid-in capital.
Loan Servicing Fees
Mortgage loan servicing fees and other remuneration are received by the Company for servicing mortgage loans. Mortgage loan servicing fees are recorded net of Agency guarantee fees paid by the Company. Mortgage loan servicing fees are recognized as earned over the life of the loans in the servicing portfolio. Mortgage loan servicing fees are deemed to be earned when they are collected.
Share-Based Compensation
The Company amortizes the fair value of previously granted share-based awards to compensation expense over the vesting period using the graded vesting method. Expense relating to share-based awards is included in Compensation expense on the consolidated statements of income.
The initial cost of restricted share units awarded is established at the Company’s closing share price on the date of the award. The Company adjusts the cost of its share-based compensation awards depending on whether the awards are made to its trustees and officers or to non-employees such as officers and employees of affiliates:
• Compensation cost is generally fixed at the fair value of the award date for awards to officers and trustees of the

F-15
Company.
• Compensation cost for share-based compensation awarded to employees of the Manager is adjusted to reflect changes in the fair value of awards in each subsequent reporting period until the award has vested, the service being provided is subsequently completed, or, under certain circumstances, is likely to be completed, whichever occurs first.

The Manager’s estimates of compensation costs reflect the expected portion of share-based compensation awards that are expected to vest.
Income Taxes
The Company has elected to be taxed as a REIT and the Manager believes the Company complies with the provisions of the Internal Revenue Code applicable to REITs. Accordingly, the Manager believes the Company will not be subject to federal income tax on that portion of its REIT taxable income that is distributed to shareholders as long as certain asset, income and share ownership tests are met. If PMT fails to qualify as a REIT, and does not qualify for certain statutory relief provisions, it will be subject to income taxes and may be precluded from qualifying as a REIT for the four tax years following the year of loss of the Company’s REIT qualification.
The Company’s taxable REIT subsidiaries are subject to federal and state income taxes. Income taxes are provided for using the asset and liability method. Deferred tax assets and liabilities are recognized for the future tax consequences attributable to differences between the financial statement carrying amounts of existing assets and liabilities and their respective tax bases. Deferred tax assets and liabilities are measured using enacted rates expected to apply to taxable income in the years in which the Manager expects those temporary differences to be recovered or settled. The effect on deferred taxes of a change in tax rates is recognized in income in the period in which the change occurs.
A valuation allowance is established if, in the Manager’s judgement, realization of deferred tax assets is not more likely than not. The Company recognizes a tax benefit relating to tax positions it takes only if it is more likely than not that the position will be sustained upon examination by the appropriate taxing authority. A tax position that meets this standard is recognized as the largest amount that exceeds 50 percent likelihood of being realized upon settlement. The Company will classify any penalties and interest as a component of income tax expense.
As of December 31, 2015 and 2014, the Company was not under examination by any federal or state income taxing authority.
Reclassification of Previously Presented Amounts
In April of 2015, the FASB issued Accounting Standards Update (“ASU”) No. 2015-03, Interest—Imputation of Interest (Subtopic 835-30): Simplifying the Presentation of Debt Issuance Costs (“ASU 2015-03”). The amendments in this ASU require that debt issuance costs related to a recognized debt liability be presented in the consolidated balance sheet as a direct deduction from the carrying amount of that debt liability. ASU 2015-03 specifies that its adoption be made on a retrospective basis. Accordingly, the Company has reclassified its debt issuance costs from Other assets as previously presented to Short-term borrowings and Long-term borrowings to conform its December 31, 2014 balance sheet to the current presentation. The adoption of ASU 2015-03 did not result in changes to the Company’s previously presented consolidated statements of income.
F-16
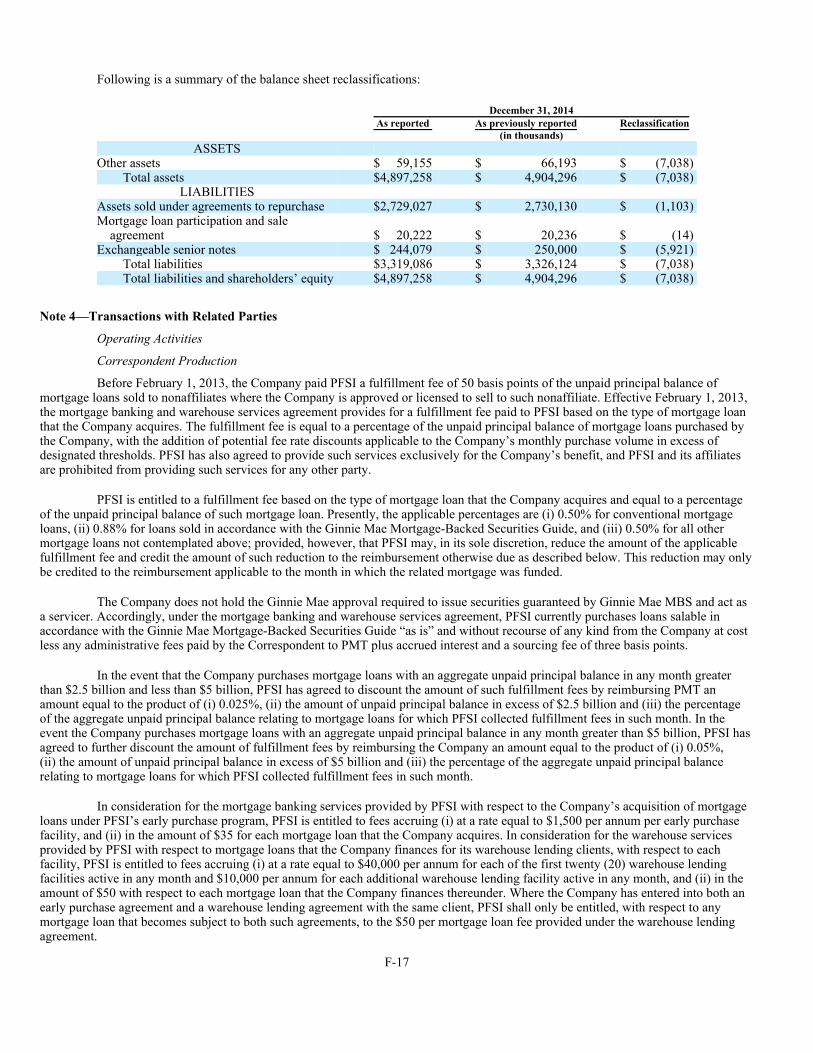
Following is a summary of the balance sheet reclassifications:
Note 4—Transactions with Related Parties
Operating Activities
Correspondent Production
Before February 1, 2013, the Company paid PFSI a fulfillment fee of 50 basis points of the unpaid principal balance of mortgage loans sold to nonaffiliates where the Company is approved or licensed to sell to such nonaffiliate. Effective February 1, 2013, the mortgage banking and warehouse services agreement provides for a fulfillment fee paid to PFSI based on the type of mortgage loan that the Company acquires. The fulfillment fee is equal to a percentage of the unpaid principal balance of mortgage loans purchased by the Company, with the addition of potential fee rate discounts applicable to the Company’s monthly purchase volume in excess of designated thresholds. PFSI has also agreed to provide such services exclusively for the Company’s benefit, and PFSI and its affiliates are prohibited from providing such services for any other party.
PFSI is entitled to a fulfillment fee based on the type of mortgage loan that the Company acquires and equal to a percentage of the unpaid principal balance of such mortgage loan. Presently, the applicable percentages are (i) 0.50% for conventional mortgage loans, (ii) 0.88% for loans sold in accordance with the Ginnie Mae Mortgage-Backed Securities Guide, and (iii) 0.50% for all other mortgage loans not contemplated above; provided, however, that PFSI may, in its sole discretion, reduce the amount of the applicable fulfillment fee and credit the amount of such reduction to the reimbursement otherwise due as described below. This reduction may only be credited to the reimbursement applicable to the month in which the related mortgage was funded.
The Company does not hold the Ginnie Mae approval required to issue securities guaranteed by Ginnie Mae MBS and act as a servicer. Accordingly, under the mortgage banking and warehouse services agreement, PFSI currently purchases loans salable in accordance with the Ginnie Mae Mortgage-Backed Securities Guide “as is” and without recourse of any kind from the Company at cost less any administrative fees paid by the Correspondent to PMT plus accrued interest and a sourcing fee of three basis points.
In the event that the Company purchases mortgage loans with an aggregate unpaid principal balance in any month greater than $2.5 billion and less than $5 billion, PFSI has agreed to discount the amount of such fulfillment fees by reimbursing PMT an amount equal to the product of (i) 0.025%, (ii) the amount of unpaid principal balance in excess of $2.5 billion and (iii) the percentage of the aggregate unpaid principal balance relating to mortgage loans for which PFSI collected fulfillment fees in such month. In the event the Company purchases mortgage loans with an aggregate unpaid principal balance in any month greater than $5 billion, PFSI has agreed to further discount the amount of fulfillment fees by reimbursing the Company an amount equal to the product of (i) 0.05%, (ii) the amount of unpaid principal balance in excess of $5 billion and (iii) the percentage of the aggregate unpaid principal balance relating to mortgage loans for which PFSI collected fulfillment fees in such month.
In consideration for the mortgage banking services provided by PFSI with respect to the Company’s acquisition of mortgage loans under PFSI’s early purchase program, PFSI is entitled to fees accruing (i) at a rate equal to $1,500 per annum per early purchase facility, and (ii) in the amount of $35 for each mortgage loan that the Company acquires. In consideration for the warehouse services provided by PFSI with respect to mortgage loans that the Company finances for its warehouse lending clients, with respect to each facility, PFSI is entitled to fees accruing (i) at a rate equal to $40,000 per annum for each of the first twenty (20) warehouse lending facilities active in any month and $10,000 per annum for each additional warehouse lending facility active in any month, and (ii) in the amount of $50 with respect to each mortgage loan that the Company finances thereunder. Where the Company has entered into both an early purchase agreement and a warehouse lending agreement with the same client, PFSI shall only be entitled, with respect to any mortgage loan that becomes subject to both such agreements, to the $50 per mortgage loan fee provided under the warehouse lending agreement.
F-17
December 31, 2014 As reported As previously reported Reclassification (in thousands)
ASSETS Other assets $ 59,155 $ 66,193 $ (7,038)
Total assets $4,897,258 $ 4,904,296 $ (7,038) LIABILITIES
Assets sold under agreements to repurchase $2,729,027 $ 2,730,130 $ (1,103) Mortgage loan participation and sale
agreement $ 20,222 $ 20,236 $ (14) Exchangeable senior notes $ 244,079 $ 250,000 $ (5,921)
Total liabilities $3,319,086 $ 3,326,124 $ (7,038) Total liabilities and shareholders’ equity $4,897,258 $ 4,904,296 $ (7,038)

The term of the mortgage banking and warehouse services agreement expires on February 1, 2017, subject to automatic renewal for additional 18-month periods, unless terminated earlier in accordance with the terms of the agreement.
Following is a summary of correspondent production activity between the Company and PLS:
Mortgage Loan Servicing
The Company, through its Operating Partnership, has a loan servicing agreement with PLS. Before February 1, 2013, the servicing fee rates were based on the risk characteristics of the mortgage loans serviced and total servicing compensation was established at levels that the Manager believed were competitive with those charged by other servicers or specialty servicers, as applicable.
Effective February 1, 2013, the servicing agreement was amended to provide for servicing fees earned by PLS that changed from being based on a percentage of the mortgage loan’s unpaid principal balance to fixed per-loan monthly amounts based on the delinquency, bankruptcy and/or foreclosure status of the serviced mortgage loan or the REO. PLS also remains entitled to market-based fees and charges including boarding and deboarding, liquidation and disposition fees, assumption, modification and origination fees and late charges relating to mortgage loans it services for the Company.
F-18
Year ended December 31, 2015 2014 2013 (in thousands)Fulfillment fees earned by PLS $ 58,607 $ 48,719 $ 79,712 Unpaid principal balance of loans fulfilled by PLS $14,014,603 $11,476,448 $15,225,153 Sourcing fees received from PLS $ 8,966 $ 4,676 $ 4,611 Unpaid principal balance of loans sold to PLS $29,867,580 $15,579,322 $15,366,378 Purchases of mortgage loans acquired for sale at fair value
from PLS $ 28,445 $ 8,082 $ 12,339 Tax service fee to paid to PLS $ 4,390 $ 2,080 $ — Mortgage banking and warehouse services fees paid to PLS $ — $ — $ 313 At year end:
Mortgage loans included in Mortgage loans acquired for sale pending sale to PLS $ 669,288 $ 209,325 $ 112,360
• Servicing fee rates for nonperforming loans ranged between 50 and 100 basis points per year on the unpaid principal balance of the mortgage loans serviced on the Company’s behalf. PLS was also entitled to certain customary market-based fees and charges, including boarding and deboarding fees, liquidation and disposition fees, assumption, modification and origination fees and late charges, as well as interest on funds on deposit in custodial accounts. In the event PLS either effected a refinancing of a loan on the Company’s behalf and not through a third-party lender and the resulting loan was readily saleable, or originated a loan to facilitate the disposition of real estate that the Company had acquired in settlement of a loan, PLS was entitled to receive market-based fees and compensation from the Company.
• For mortgage loans serviced by the Company as a result of acquisitions and sales with servicing rights retained
in connection with the Company’s correspondent production business, PLS was entitled to base subservicing fees and other customary market-based fees and charges as described above.
• The base servicing fees for distressed mortgage loans are calculated based on a monthly per-loan dollar amount, with the actual dollar amount for each mortgage loan based on the delinquency, bankruptcy and/or foreclosure status of such mortgage loan or the related underlying real estate. Presently, the base servicing fees for distressed mortgage loans range from $30 per month for current mortgage loans up to $125 per month for mortgage loans that are severely delinquent and in foreclosure.
• The base servicing fees for non-distressed mortgage loans subserviced by PLS on the Company’s behalf are also calculated through a monthly per-loan dollar amount, with the actual dollar amount for each loan based on whether the mortgage loan is a fixed-rate or adjustable-rate loan. The base servicing fees for loans subserviced on the Company’s behalf are $7.50 per month for fixed-rate loans and $8.50 per month for adjustable rate mortgage loans.
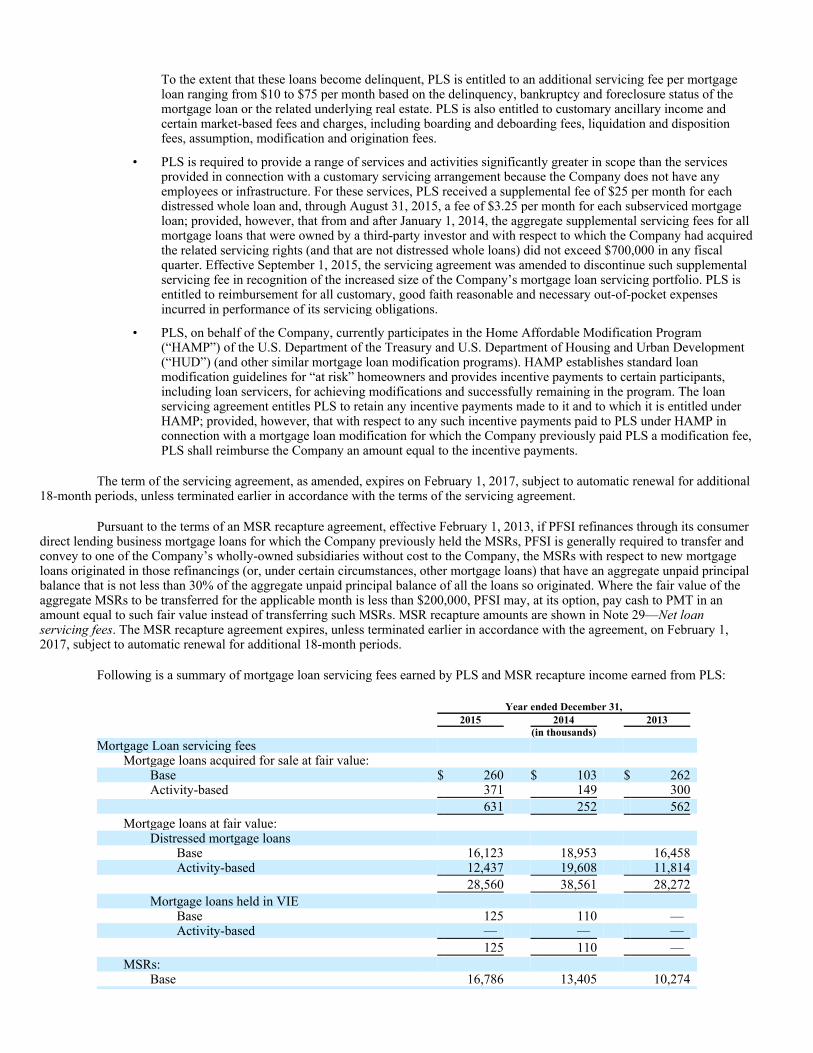
To the extent that these loans become delinquent, PLS is entitled to an additional servicing fee per mortgage loan ranging from $10 to $75 per month based on the delinquency, bankruptcy and foreclosure status of the mortgage loan or the related underlying real estate. PLS is also entitled to customary ancillary income and certain market-based fees and charges, including boarding and deboarding fees, liquidation and disposition fees, assumption, modification and origination fees.
The term of the servicing agreement, as amended, expires on February 1, 2017, subject to automatic renewal for additional 18-month periods, unless terminated earlier in accordance with the terms of the servicing agreement.
Pursuant to the terms of an MSR recapture agreement, effective February 1, 2013, if PFSI refinances through its consumer direct lending business mortgage loans for which the Company previously held the MSRs, PFSI is generally required to transfer and convey to one of the Company’s wholly-owned subsidiaries without cost to the Company, the MSRs with respect to new mortgage loans originated in those refinancings (or, under certain circumstances, other mortgage loans) that have an aggregate unpaid principal balance that is not less than 30% of the aggregate unpaid principal balance of all the loans so originated. Where the fair value of the aggregate MSRs to be transferred for the applicable month is less than $200,000, PFSI may, at its option, pay cash to PMT in an amount equal to such fair value instead of transferring such MSRs. MSR recapture amounts are shown in Note 29—Net loan servicing fees. The MSR recapture agreement expires, unless terminated earlier in accordance with the agreement, on February 1, 2017, subject to automatic renewal for additional 18-month periods.
Following is a summary of mortgage loan servicing fees earned by PLS and MSR recapture income earned from PLS:
• PLS is required to provide a range of services and activities significantly greater in scope than the services provided in connection with a customary servicing arrangement because the Company does not have any employees or infrastructure. For these services, PLS received a supplemental fee of $25 per month for each distressed whole loan and, through August 31, 2015, a fee of $3.25 per month for each subserviced mortgage loan; provided, however, that from and after January 1, 2014, the aggregate supplemental servicing fees for all mortgage loans that were owned by a third-party investor and with respect to which the Company had acquired the related servicing rights (and that are not distressed whole loans) did not exceed $700,000 in any fiscal quarter. Effective September 1, 2015, the servicing agreement was amended to discontinue such supplemental servicing fee in recognition of the increased size of the Company’s mortgage loan servicing portfolio. PLS is entitled to reimbursement for all customary, good faith reasonable and necessary out-of-pocket expenses incurred in performance of its servicing obligations.
• PLS, on behalf of the Company, currently participates in the Home Affordable Modification Program (“HAMP”) of the U.S. Department of the Treasury and U.S. Department of Housing and Urban Development (“HUD”) (and other similar mortgage loan modification programs). HAMP establishes standard loan modification guidelines for “at risk” homeowners and provides incentive payments to certain participants, including loan servicers, for achieving modifications and successfully remaining in the program. The loan servicing agreement entitles PLS to retain any incentive payments made to it and to which it is entitled under HAMP; provided, however, that with respect to any such incentive payments paid to PLS under HAMP in connection with a mortgage loan modification for which the Company previously paid PLS a modification fee, PLS shall reimburse the Company an amount equal to the incentive payments.
Year ended December 31, 2015 2014 2013 (in thousands)Mortgage Loan servicing fees
Mortgage loans acquired for sale at fair value: Base $ 260 $ 103 $ 262 Activity-based 371 149 300
631 252 562
Mortgage loans at fair value: Distressed mortgage loans
Base 16,123 18,953 16,458 Activity-based 12,437 19,608 11,814
28,560 38,561 28,272
Mortgage loans held in VIE Base 125 110 — Activity-based — — —
125 110 —
MSRs: Base 16,786 13,405 10,274

F-19
Activity-based 321 194 305
17,107 13,599 10,579
$ 46,423 $ 52,522 $ 39,413
MSR recapture income recognized $ 787 $ 9 $ 709 Average investment in:
Mortgage loans acquired for sale at fair value $ 1,143,232 $ 573,256 $ 899,971 Distressed mortgage loans $ 2,231,259 $ 2,121,806 $ 1,660,866 Mortgage loans held in a VIE $ 494,655 $ 533,480 $ 135,667
Average mortgage loan servicing portfolio $38,450,379 $30,720,168 $19,634,411
Management Fees
Before February 1, 2013, under a management agreement, PMT paid PCM a base management fee which was calculated at 1.5% per year of shareholders’ equity. The management agreement also provided for a performance incentive fee. The performance incentive fee was calculated at 20% per year of the amount by which “core earnings,” on a rolling four-quarter basis and before the incentive fee, exceeded an 8% “hurdle rate” as defined in the management agreement. The Company did not incur a performance incentive fee before February 1, 2013.
Effective February 1, 2013, the management agreement was amended to provide that:
The performance incentive fee is calculated quarterly and is equal to: (a) 10% of the amount by which net income for the quarter exceeds (i) an 8% return on equity plus the high watermark, up to (ii) a 12% return on equity; plus (b) 15% of the amount by which net income for the quarter exceeds (i) a 12% return on equity plus the high watermark, up to (ii) a 16% return on equity; plus (c) 20% of the amount by which net income for the quarter exceeds a 16% return on equity plus the high watermark.
For the purpose of determining the amount of the performance incentive fee:
“Net income” is defined as net income or loss computed in accordance with GAAP and certain other non-cash charges determined after discussions between PCM and PMT’s independent trustees and after approval by a majority of PMT’s independent trustees.
“Equity” is the weighted average of the issue price per common share of all of PMT’s public offerings, multiplied by the weighted average number of common shares outstanding (including restricted share units) in the rolling four-quarter period.
The “high watermark” is the quarterly adjustment that reflects the amount by which the net income (stated as a percentage of return on equity) in that quarter exceeds or falls short of the lesser of 8% and the Fannie Mae MBS yield (the target yield) for such quarter. The “high watermark” starts at zero and is adjusted quarterly. If the net income is lower than the target yield, the high watermark is increased by the difference. If the net income is higher than the target yield, the high watermark is reduced by the difference. Each time a performance incentive fee is earned, the high watermark returns to zero. As a result, the threshold amounts required for PCM to earn a performance incentive fee are adjusted cumulatively based on the performance of PMT’s net income over (or under) the target yield, until the net income in excess of the target yield exceeds the then-current cumulative high watermark amount, and a performance incentive fee is earned.
The base management fee and the performance incentive fee are both payable quarterly in arrears. The performance incentive fee may be paid in cash or a combination of cash and PMT’s common shares (subject to a limit of no more than 50% paid in common shares), at the Company’s option.
F-20
• The base management fee is calculated quarterly and is equal to the sum of (i) 1.5% per year of average
shareholders’ equity up to $2 billion, (ii) 1.375% per year of average shareholders’ equity in excess of $2 billion and up to $5 billion, and (iii) 1.25% per year of average shareholders’ equity in excess of $5 billion.
• The performance incentive fee is calculated at a defined annualized percentage of the amount by which “net
income,” on a rolling four-quarter basis and before deducting the incentive fee, exceeds certain levels of return on “equity.”
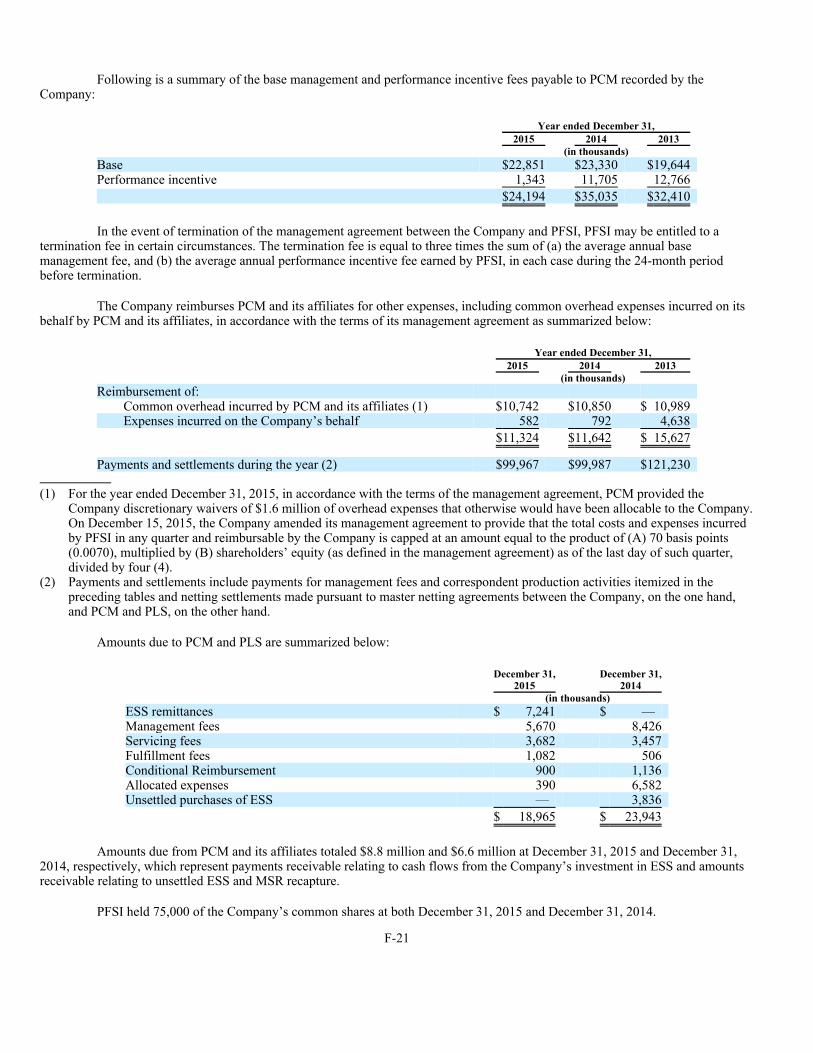
Following is a summary of the base management and performance incentive fees payable to PCM recorded by the Company:
In the event of termination of the management agreement between the Company and PFSI, PFSI may be entitled to a termination fee in certain circumstances. The termination fee is equal to three times the sum of (a) the average annual base management fee, and (b) the average annual performance incentive fee earned by PFSI, in each case during the 24-month period before termination.
The Company reimburses PCM and its affiliates for other expenses, including common overhead expenses incurred on its behalf by PCM and its affiliates, in accordance with the terms of its management agreement as summarized below:
Amounts due to PCM and PLS are summarized below:
Amounts due from PCM and its affiliates totaled $8.8 million and $6.6 million at December 31, 2015 and December 31, 2014, respectively, which represent payments receivable relating to cash flows from the Company’s investment in ESS and amounts receivable relating to unsettled ESS and MSR recapture.
PFSI held 75,000 of the Company’s common shares at both December 31, 2015 and December 31, 2014.
F-21
Year ended December 31, 2015 2014 2013 (in thousands)Base $22,851 $23,330 $19,644 Performance incentive 1,343 11,705 12,766
$24,194 $35,035 $32,410
Year ended December 31, 2015 2014 2013 (in thousands)Reimbursement of:
Common overhead incurred by PCM and its affiliates (1) $10,742 $10,850 $ 10,989 Expenses incurred on the Company’s behalf 582 792 4,638
$11,324 $11,642 $ 15,627
Payments and settlements during the year (2) $99,967 $99,987 $121,230
(1) For the year ended December 31, 2015, in accordance with the terms of the management agreement, PCM provided the Company discretionary waivers of $1.6 million of overhead expenses that otherwise would have been allocable to the Company. On December 15, 2015, the Company amended its management agreement to provide that the total costs and expenses incurred by PFSI in any quarter and reimbursable by the Company is capped at an amount equal to the product of (A) 70 basis points (0.0070), multiplied by (B) shareholders’ equity (as defined in the management agreement) as of the last day of such quarter, divided by four (4).
(2) Payments and settlements include payments for management fees and correspondent production activities itemized in the preceding tables and netting settlements made pursuant to master netting agreements between the Company, on the one hand, and PCM and PLS, on the other hand.
December 31,
2015 December 31,
2014 (in thousands) ESS remittances $ 7,241 $ — Management fees 5,670 8,426 Servicing fees 3,682 3,457 Fulfillment fees 1,082 506 Conditional Reimbursement 900 1,136 Allocated expenses 390 6,582 Unsettled purchases of ESS — 3,836
$ 18,965 $ 23,943

Investment Activities
Excess Servicing Spread
Pursuant to three master spread acquisition and MSR servicing agreements, effective February 1, 2013, December 19, 2014 and April 30, 2015, PMT may acquire from PFSI the rights to receive certain ESS arising from MSRs acquired by PFSI, in which case PFSI generally would be required to service or subservice the related mortgage loans. The terms of each transaction under each master spread acquisition and MSR servicing agreement will be subject to the terms of such agreement as modified and supplemented by the terms of a confirmation executed in connection with such transaction.
Following is a summary of investment activities between the Company and PFSI:
Financing Activities
PLS is a party to a repurchase agreement between it and Credit Suisse First Boston Mortgage Capital LLC (“CSFB”) (the “MSR Repo”), pursuant to which PLS finances Ginnie Mae MSRs and servicing advance receivables and pledges to CSFB all of its rights and interests in any Ginnie Mae MSRs it owns or acquires, and a separate acknowledgement agreement with respect thereto, by and among Ginnie Mae, CSFB and PLS.
Note Payable to PLS
In connection with the MSR Repo described above, the Company entered into an underlying loan and security agreement with PLS, dated as of April 30, 2015, pursuant to which the Company may borrow up to $150 million from PLS for the purpose of financing its investment in ESS (the “Underlying LSA”). In order to secure its borrowings, the Company pledged its ESS to PLS under the Underlying LSA, and PLS, in turn, re-pledged such ESS to CSFB under the MSR Repo.
The principal amount of the borrowings under the Underlying LSA is based upon a percentage of the market value of the ESS pledged to PLS, subject to the $150 million sublimit described above. Pursuant to the Underlying LSA, the Company granted to PLS a security interest in all of its right, title and interest in, to and under the ESS pledged to secure the borrowings.
The Company agreed with PLS in connection with the Underlying LSA that the Company is required to repay PLS the principal amount of borrowings plus accrued interest to the date of such repayment, and PLS, in turn, is required to repay CSFB the corresponding amount under the MSR Repo. Interest accrued on the Company’s note relating to the Underlying LSA at a rate based on CSFB’s cost of funds under the MSR Repo. The Company was also required to pay PLS a fee for the structuring of the Underlying LSA in an amount equal to the portion of the corresponding fee paid by PLS to CSFB and allocable to $150 million relating to the ESS financing.
Conditional Reimbursement
In connection with the initial public offering of PMT’s common shares (“IPO”) on August 4, 2009, the Company entered into an agreement with PCM pursuant to which the Company agreed to reimburse PCM for the $2.9 million payment that it made to the IPO underwriters if the Company satisfied certain performance measures over a specified period of time (the “Conditional Reimbursement”). Effective February 1, 2013, the Company amended the terms of the reimbursement agreement to provide for the reimbursement of PCM of the Conditional Reimbursement if the Company is required to pay PCM performance incentive fees under the management agreement at a rate of $10 in reimbursement for every $100 of performance incentive fees earned. The reimbursement of the Conditional Reimbursement is subject to a maximum reimbursement in any particular 12-month period of $1.0 million and the maximum amount that may be reimbursed under the agreement is $2.9 million.
F-22
Year ended December 31, 2015 2014 2013 (in thousands)ESS:
Purchases $271,554 $ 99,728 $139,028 Repayments $ 78,578 $ 39,257 $ 4,076 Interest income $ 25,365 $ 13,292 $ 1,091 ESS received pursuant to a recapture agreement $ 6,728 $ 7,343 $ — Net gain (loss):
Valuation changes $ (3,810) $(28,662) $ 2,423 Recapture income recognized 7,049 7,828 —
$ 3,239 $(20,834) $ 2,423
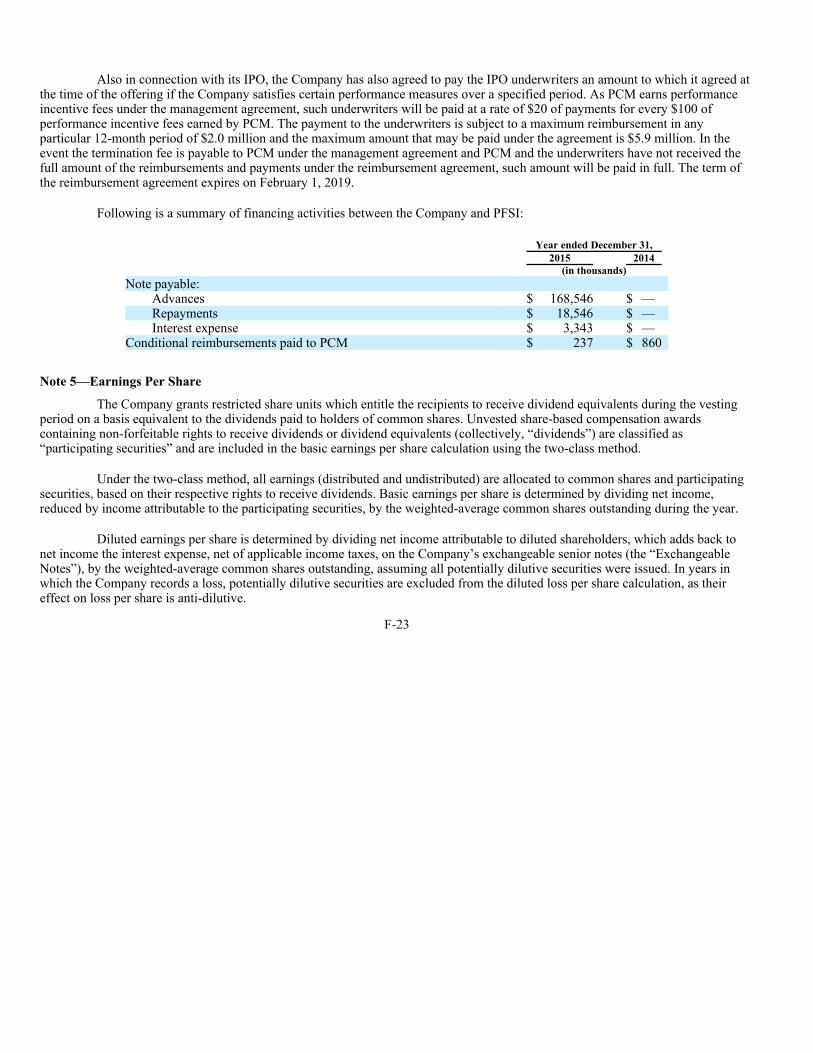
Also in connection with its IPO, the Company has also agreed to pay the IPO underwriters an amount to which it agreed at the time of the offering if the Company satisfies certain performance measures over a specified period. As PCM earns performance incentive fees under the management agreement, such underwriters will be paid at a rate of $20 of payments for every $100 of performance incentive fees earned by PCM. The payment to the underwriters is subject to a maximum reimbursement in any particular 12-month period of $2.0 million and the maximum amount that may be paid under the agreement is $5.9 million. In the event the termination fee is payable to PCM under the management agreement and PCM and the underwriters have not received the full amount of the reimbursements and payments under the reimbursement agreement, such amount will be paid in full. The term of the reimbursement agreement expires on February 1, 2019.
Following is a summary of financing activities between the Company and PFSI:
Note 5—Earnings Per Share
The Company grants restricted share units which entitle the recipients to receive dividend equivalents during the vesting period on a basis equivalent to the dividends paid to holders of common shares. Unvested share-based compensation awards containing non-forfeitable rights to receive dividends or dividend equivalents (collectively, “dividends”) are classified as “participating securities” and are included in the basic earnings per share calculation using the two-class method.
Under the two-class method, all earnings (distributed and undistributed) are allocated to common shares and participating securities, based on their respective rights to receive dividends. Basic earnings per share is determined by dividing net income, reduced by income attributable to the participating securities, by the weighted-average common shares outstanding during the year.
Diluted earnings per share is determined by dividing net income attributable to diluted shareholders, which adds back to net income the interest expense, net of applicable income taxes, on the Company’s exchangeable senior notes (the “Exchangeable Notes”), by the weighted-average common shares outstanding, assuming all potentially dilutive securities were issued. In years in which the Company records a loss, potentially dilutive securities are excluded from the diluted loss per share calculation, as their effect on loss per share is anti-dilutive.
F-23
Year ended December 31, 2015 2014 (in thousands) Note payable:
Advances $ 168,546 $ — Repayments $ 18,546 $ — Interest expense $ 3,343 $ —
Conditional reimbursements paid to PCM $ 237 $ 860

The following table summarizes the basic and diluted earnings per share calculations:
Dividends and undistributed earnings allocated to participating securities under the basic and diluted earnings per share calculations require specific shares to be included or excluded that may differ in certain circumstances.
Note 6—Loan Sales and Variable Interest Entities
The Company is a variable interest holder in various special purpose entities that relate to its loan transfer and financing activities. These entities are classified as VIEs. The Company has segregated its involvement with VIEs between those VIEs which the Company does not consolidate and those VIEs which the Company consolidates.
Unconsolidated VIEs with Continuing Involvement
The following table summarizes cash flows between the Company and transferees in transfers that are accounted for as sales where PMT maintains continuing involvement with the mortgage loans, as well as unpaid principal balance information at year end:
F-24
Year ended December 31, 2015 2014 2013 (in thousands except per share amounts) Basic earnings per share:
Net income $ 90,100 $ 194,544 $ 200,190 Effect of participating securities—share-based compensation
awards (1,689) (1,830) (1,751)
Net income attributable to common shareholders $ 88,411 $ 192,714 $ 198,439
Diluted earnings per share: Net income attributable to common shareholders $ 88,411 $ 194,544 $ 200,190 Interest on Exchangeable Notes, net of income taxes 8,468 8,456 5,556
Net income attributable to diluted shareholders $ 96,879 $ 203,000 $ 205,746
Weighted-average basic shares outstanding 74,446 73,495 63,426 Potentially dilutive securities:
Shares issuable pursuant to exchange of the Exchangeable Notes 8,467 8,418 5,647
Shares issuable under share-based compensation plan 423 298 375
Diluted weighted-average number of shares outstanding 83,336 82,211 69,448
Basic earnings per share $ 1.19 $ 2.62 $ 3.13
Diluted earnings per share $ 1.16 $ 2.47 $ 2.96
Year ended December 31, 2015 2014 2013 (in thousands)Cash flows:
Proceeds from sales $14,206,816 $11,703,015 $15,818,582 Servicing fees received (1) $ 97,633 $ 70,294 $ 51,712
Year end information: Unpaid principal balance of: Mortgage loans outstanding $42,300,338 $34,161,360 $25,792,933 Delinquent mortgage loans:
30-89 days delinquent $ 175,599 $ 110,176 $ 68,156 90 or more days delinquent
Not in foreclosure or bankruptcy 38,669 25,418 7,941 In foreclosure or bankruptcy 31,386 13,172 5,434
70,055 38,590 13,375
$ 245,654 $ 148,766 $ 81,531
(1) Net of guarantee fees.

Consolidated VIEs
Jumbo Mortgage Loan Financing
On September 30, 2013, the Company completed a securitization transaction in which PMT Loan Trust 2013-J1, a VIE, issued $537.0 million in UPB of certificates backed by fixed-rate prime jumbo mortgage loans, at a 3.9% weighted yield. The Company retained $366.8 million of those certificates. During the year ended December 31, 2015, the Company sold an additional $85.2 million in UPB of certificates issued under PMT Loan Trust 2013-J1, thereby reducing the certificates retained by the Company to $238.8 million in UPB as of December 31, 2015.
The VIE was consolidated by the Company as PMT determined it was the primary beneficiary of the VIE as it had the power, through its affiliate, PLS, in its role as servicer of the mortgage loans, to direct the activities of the trust that most significantly impact the trust’s economic performance. Further, the retained subordinated and residual interest trust certificates expose the Company to significant losses and returns that could potentially be significant to the VIE.
CRT Agreements
The Company enters into CRT Agreements whereby it retains a portion of the credit risk relating to mortgage loans it sells into Fannie Mae guaranteed securitizations in exchange for a portion of the contractual guarantee fee related to such securitizations.
Following is a summary of the CRT Agreements:
Note 7—Netting of Financial Instruments
The Company uses derivative financial instruments to manage exposure to interest rate risk created by its MBS, IRLCs, mortgage loans acquired for sale at fair value, mortgage loans at fair value held in VIE, ESS and MSRs. All derivative financial instruments are recorded on the consolidated balance sheets at fair value. The Company has elected to net derivative asset and liability positions, and cash collateral obtained (or posted) from (or to) its counterparties when subject to a legally enforceable master netting arrangement. The derivative financial instruments that are not subject to master netting arrangements are IRLCs and the net derivatives related to CRT Agreements. As of December 31, 2015 and December 31, 2014, the Company did not enter into reverse repurchase agreements or securities lending transactions that are required to be disclosed in the following tables.
F-25
Year ended
December 31, 2015 (in thousands) During the year:
Unpaid principal balance of mortgage loans transferred and sold under CRT Agreements $ 4,602,507
Deposits of restricted cash to secure guarantees $ 147,446 Gains (losses) recognized on derivative related to CRT
Agreements Realized $ 1,831 Resulting from valuation changes (1,238)
$ 593
Payments made to settle losses $ —
At year end: Unpaid principal balance of mortgage loans subject to
guarantee obligation $ 4,546,265 Delinquency
Current - 89 days delinquent $ 4,546,265 90 - or more days delinquent —
Carrying value of CRT Agreements: Restricted cash included in Other assets $ 147,000 Net derivative assets included in Derivative assets $ 593

Offsetting of Derivative Assets
Following is a summary of net derivative assets. As discussed above, all derivatives with the exception of IRLCs and the net derivatives related to CRT Agreements are subject to master netting arrangements.
F-26
December 31, 2015 December 31, 2014
Grossamounts
of recognized
assets
Grossamounts
offset in the
consolidatedbalance
sheet
Netamounts of assets
presentedin the
consolidatedbalance
sheet
Gross amounts
of recognized
assets
Gross amounts
offset in the
consolidatedbalance
sheet
Netamounts of assets
presentedin the
consolidatedbalance
sheet (in thousands)Derivatives subject to master netting arrangements:
MBS put options $ 93 $ — $ 93 $ 374 $ — $ 374 MBS call options — — — — — — Forward purchase contracts 2,444 — 2,444 3,775 — 3,775 Forward sale contracts 2,604 — 2,604 52 — 52 Put options on interest rate futures 1,512 — 1,512 193 — 193 Call options on interest rate futures 1,156 — 1,156 3,319 — 3,319
Netting — (3,300) (3,300) — (2,284) (2,284)
7,809 (3,300) 4,509 7,713 (2,284) 5,429 Derivatives not subject to master netting
arrangements: Net derivatives related to CRT Agreements 593 — 593 — — — Interest rate lock commitments 4,983 — 4,983 5,678 — 5,678
$ 13,385 $ (3,300) $ 10,085 $ 13,391 $ (2,284) $ 11,107

Derivative Assets and Collateral Held by Counterparty
The following table summarizes by significant counterparty the amount of derivative asset positions after considering master netting arrangements and financial instruments or cash pledged that do not meet the accounting guidance qualifying for netting.
F-27
December 31, 2015 December 31, 2014
Gross amounts not offset in the
consolidated balance sheet
Gross amounts not offset in the
consolidated balance sheet
Net amount of assets presented
in the consolidatedbalance sheet
Financial instruments
Cashcollateralreceived
Netamount
Net amountof assets presentedin the consolidated
balance sheet Financial
instruments
Cash collateralreceived
Netamount
(in thousands)Interest rate lock
commitments $ 4,983 $ — $ — $ 4,983 $ 5,678 $ — $ — $ 5,678 RJ O’Brien &
Associates, LLC 1,672 — — 1,672 3,034 — — 3,034 Barclays Capital 796 — — 796 — — — — Jefferies Group,
LLC 541 — — 541 133 — — 133 Morgan Stanley
Bank, N.A. 464 — — 464 104 — — 104 Ally Financial 209 — — 209 — — — — Royal Bank of
Canada 400 — — 400 — — — — Nomura Securities
International, Inc 119 — — 119 138 — — 138 Daiwa Capital
Markets 63 — — 63 29 — — 29 Deutsche Bank 6 — — 6 124 — — 124 Bank of America,
N.A. — — — — 738 — — 738 Credit Suisse First
Boston Mortgage Capital LLC — — — — 253 — — 253
Other 832 — — 832 876 — — 876
Total $ 10,085 $ — $ — $10,085 $ 11,107 $ — $ — $11,107

Offsetting of Derivative Liabilities and Financial Liabilities
Following is a summary of net derivative liabilities and assets sold under agreements to repurchase. As discussed above, all derivatives with the exception of IRLCs are subject to master netting arrangements. Assets sold under agreements to repurchase do not qualify for setoff accounting.
F-28
December 31, 2015 December 31, 2014
Gross amounts
of recognized liabilities
Gross amountsoffset in the
consolidatedbalance
sheet
Netamounts
of liabilitiespresented
in the consolidated
balance sheet
Grossamounts
of recognized liabilities
Gross amounts offset
in the consolidated
balance sheet
Netamounts
of liabilitiespresented
in the consolidated
balance sheet
(in thousands)Derivatives subject to master netting
arrangements: Forward purchase contracts $ 3,774 $ — $ 3,774 $ 34 $ — $ 34 Forward sales contracts 2,680 — 2,680 6,649 — 6,649 Put options on interest rate futures 39 — 39 — — — Call options on interest rate futures 305 — 305 — — — Treasury futures sales contracts — — — 478 — 478 Netting — (3,978) (3,978) — (4,748) (4,748)
6,798 (3,978) 2,820 7,161 (4,748) 2,413
Derivatives not subject to master netting arrangements:
Interest rate lock commitments 337 — 337 17 — 17
7,135 (3,978) 3,157 7,178 (4,748) 2,430 Assets sold under agreements to
repurchase 3,130,328 — 3,130,328 2,730,130 — 2,730,130 Unamortized commitment fees and
issuance cost (1,548) — (1,548) (1,103) — (1,103)
3,128,780 — 3,128,780 2,729,027 — 2,729,027
$3,135,915 $ (3,978) $3,131,937 $2,736,205 $ (4,748) $2,731,457

Derivative Liabilities, Financial Liabilities and Collateral Pledged by Counterparty
The following table summarizes by significant counterparty the amount of derivative liabilities and assets sold under agreements to repurchase after considering master netting arrangements and financial instruments or cash pledged that do not meet the accounting guidance qualifying for netting. All assets sold under agreements to repurchase represent sufficient collateral or exceed the liability amount recorded on the consolidated balance sheet.
Note 8—Fair Value
The Company’s consolidated financial statements include assets and liabilities that are measured based on their fair values. Measurement at fair value may be on a recurring or nonrecurring basis depending on the accounting principles applicable to the specific asset or liability and whether the Manager has elected to carry the item at its fair value as discussed in the following paragraphs.
Fair Value Accounting Elections
The Manager identified all of the Company’s non-cash financial assets and MSRs relating to loans with initial interest rates of more than 4.5%, to be accounted for at fair value. The Manager has elected to account for these financial statement items at fair value so such changes in fair value will be reflected in income as they occur and more timely reflect the results of the Company’s performance.
The Manager has also identified the Company’s CRT financing and asset-backed financing of the VIE to be accounted for at fair value to reflect the generally offsetting changes in fair value of these borrowings to changes in fair value of mortgage loans at fair value collateralizing these financings.
The Company’s accounting for MSRs is based on the class of MSRs. Originated MSRs backed by mortgage loans with initial interest rates of less than or equal to 4.5% are accounted for using the amortization method. Originated MSRs backed by loans with initial interest rates of more than 4.5% are accounted for at fair value with changes in fair value recorded in current period income.
For assets sold under agreements to repurchase, borrowings under forward purchase agreements and the Exchangeable Notes, the Manager has determined that historical cost accounting is more appropriate because under this method debt issuance costs are amortized over the term of the debt, thereby matching the debt issuance cost to the periods benefiting from the availability of the debt.
F-29
December 31, 2015 December 31, 2014 Gross amounts Gross amounts
Net amount of liabilities presented
in the consolidated
balance sheet
Financialinstruments
Cashcollateralpledged
Netamount
Net amountof liabilitiespresented
in the consolidated
balance sheet
Financial instruments
Cash collateralpledged
Netamount
(in thousands)Interest rate lock commitments $ 337 $ — $ — $ 337 $ 17 $ — $ — $ 17 Credit Suisse First Boston Mortgage
Capital LLC 893,947 (893,854) — 93 966,155 (966,155) — — Citibank 817,089 (816,699) — 390 797,851 (797,663) — 188 Bank of America, N.A. 538,755 (538,515) — 240 508,908 (508,908) — — JPMorgan Chase & Co. 467,427 (467,145) — 282 — — — — Morgan Stanley Bank, N.A. 214,086 (214,086) — — 121,975 (121,975) — — Daiwa Capital Markets 165,480 (165,480) — — 126,909 (126,909) — — Barclays Capital 24,346 (24,346) — — — — — — BNP Paribas Corporate &
Institutional Bank 10,203 (10,203) — — — — — — Fannie Mae Capital Markets 924 — — 924 102 — — 102 Goldman Sachs 819 — — 819 — — — — RBS Securities — — — — 208,520 (208,520) — — Other 72 — — 72 2,123 — — 2,123 Unamortized commitment fees and
issuance cost (1,548) 1,548 — — (1,103) 1,103 — —
Total $3,131,937 $(3,128,780) $ — $3,157 $2,731,457 $(2,729,027) $ — $2,430
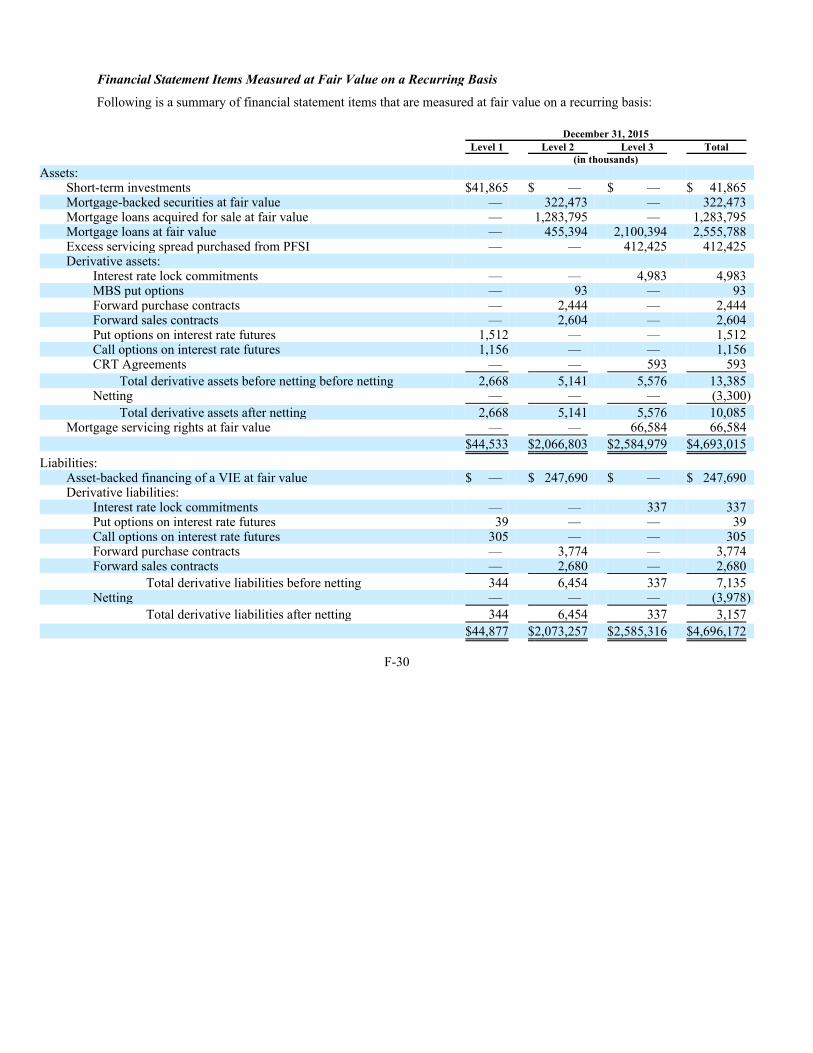
Financial Statement Items Measured at Fair Value on a Recurring Basis
Following is a summary of financial statement items that are measured at fair value on a recurring basis:
F-30
December 31, 2015 Level 1 Level 2 Level 3 Total (in thousands)Assets:
Short-term investments $41,865 $ — $ — $ 41,865 Mortgage-backed securities at fair value — 322,473 — 322,473 Mortgage loans acquired for sale at fair value — 1,283,795 — 1,283,795 Mortgage loans at fair value — 455,394 2,100,394 2,555,788 Excess servicing spread purchased from PFSI — — 412,425 412,425 Derivative assets:
Interest rate lock commitments — — 4,983 4,983 MBS put options — 93 — 93 Forward purchase contracts — 2,444 — 2,444 Forward sales contracts — 2,604 — 2,604 Put options on interest rate futures 1,512 — — 1,512 Call options on interest rate futures 1,156 — — 1,156 CRT Agreements — — 593 593
Total derivative assets before netting before netting 2,668 5,141 5,576 13,385 Netting — — — (3,300)
Total derivative assets after netting 2,668 5,141 5,576 10,085 Mortgage servicing rights at fair value — — 66,584 66,584
$44,533 $2,066,803 $2,584,979 $4,693,015
Liabilities: Asset-backed financing of a VIE at fair value $ — $ 247,690 $ — $ 247,690 Derivative liabilities:
Interest rate lock commitments — — 337 337 Put options on interest rate futures 39 — — 39 Call options on interest rate futures 305 — — 305 Forward purchase contracts — 3,774 — 3,774 Forward sales contracts — 2,680 — 2,680
Total derivative liabilities before netting 344 6,454 337 7,135 Netting — — — (3,978)
Total derivative liabilities after netting 344 6,454 337 3,157
$44,877 $2,073,257 $2,585,316 $4,696,172

F-31
December 31, 2014 Level 1 Level 2 Level 3 Total (in thousands)Assets:
Short-term investments $139,900 $ — $ — $ 139,900 Mortgage-backed securities at fair value — 307,363 — 307,363 Mortgage loans acquired for sale at fair value — 637,722 — 637,722 Mortgage loans at fair value — 527,369 2,199,583 2,726,952 Excess servicing spread purchased from PFSI — — 191,166 191,166 Derivative assets:
Interest rate lock commitments — — 5,678 5,678 MBS put options — 374 — 374 Forward purchase contracts — 3,775 — 3,775 Forward sales contracts — 52 — 52 Put options on interest rate futures 193 — — 193 Call options on interest rate futures 3,319 — — 3,319
Total derivative assets 3,512 4,201 5,678 13,391 Netting — — — (2,284)
Total derivative assets after netting 3,512 4,201 5,678 11,107
Mortgage servicing rights at fair value — — 57,358 57,358
$143,412 $1,476,655 $2,453,785 $4,071,568
Liabilities: Asset-backed financing of the VIE at fair value $ — $ 165,920 $ — $ 165,920 Derivative liabilities:
Interest rate lock commitments — — 17 17 MBS call options 478 — — 478 Forward purchase contracts — 34 — 34 Forward sales contracts — 6,649 — 6,649
Total derivative liabilities 478 6,683 17 7,178 Netting — — — (4,748)
Total derivative liabilities after netting 478 6,683 17 2,430
$ 478 $ 172,603 $ 17 $ 168,350

The following is a summary of changes in items measured using Level 3 inputs on a recurring basis:
Year ended December 31, 2015
Mortgage loans
at fair value
Excessservicingspread
Interestrate lock
commitments (1)
Net derivative related to CRT
Agreements
Mortgageservicing
rights Total (in thousands)Assets:
Balance, December 31, 2014 $2,199,583 $191,166 $ 5,661 $ — $57,358 $2,453,768 Purchases and issuances 241,981 271,554 — — 2,335 515,870 Repayments and sales (218,585) (78,578) — — — (297,163) Capitalization of interest 57,754 25,365 — — — 83,119 ESS received pursuant to a
recapture agreement with PFSI — 6,728 — — — 6,728 Interest rate lock commitments
issued, net — — 50,536 — — 50,536 Servicing received as proceeds from
sales of mortgage loans — — — — 13,963 13,963 Changes in fair value included in
income arising from: Changes in instrument-specific
credit risk 42,267 — — — — 42,267 Other factors 38,866 (3,810) (12,811) 593 (7,072) 15,766
81,133 (3,810) (12,811) 593 (7,072) 58,033
Transfers of mortgage loans to REO (285,331) — — — — (285,331) Transfers of mortgage loans at fair
value from “Level 2” to “Level 3” (2) 23,859 — — — — 23,859
Transfers of interest rate lock commitments to mortgage loans acquired for sale — — (38,740) — — (38,740)
Balance, December 31, 2015 $2,100,394 $412,425 $ 4,646 $ 593 $66,584 $2,584,642
Changes in fair value recognized during the period relating to assets still held at December 31, 2015 $ 77,867 $ (3,810) $ 4,646 $ 593 $ (7,072) $ 72,224
(1) For the purpose of this table, the interest rate lock asset and liability positions are shown net. (2) During the year ended December 31, 2015, the Manager identified certain “Level 2” mortgage loans that were not salable into
the prime mortgage market and therefore transferred them to “Level 3”.
Year ended December 31, 2014
Mortgage loans
at fair value
Mortgageloans under
forward purchase
agreements
Excessservicingspread
Interest rate lock
commitments (1)
Mortgage servicing
rights Total (in thousands)Assets:
Balance, December 31, 2013 $2,076,665 $ 218,128 $138,723 $ 1,249 $ 26,452 $2,461,217 Purchases 554,604 1,386 99,728 — — 655,718 Repayments and sales (572,586) (6,413) (39,257) — (139) (618,395) Accrual of interest — — 13,292 — — 13,292 ESS received pursuant to a recapture
agreement with PFSI — — 7,342 — — 7,342 Interest rate lock commitments issued, net — — — 56,367 — 56,367 Capitalization of interest 65,050 1,800 — — — 66,850 Sales — — — — — — Servicing received as proceeds from sales
of mortgage loans — — — — 47,693 47,693 Changes in fair value included in income
arising from: Changes in instrument-specific credit

F-32
risk 34,785 1,815 — — — 36,600 Other factors 179,896 (1,012) (28,662) 17,326 (16,648) 150,900
214,681 803 (28,662) 17,326 (16,648) 187,500
Transfers of mortgage loans under forward purchase agreements to mortgage loans 205,902 (205,902) — — — —
Transfers of mortgage loans to REO (344,733) — — — — (344,733) Transfers of mortgage loans under
forward purchase agreements to REO under forward purchase agreements — (9,802) — — — (9,802)
Transfers of interest rate lock commitments to mortgage loans acquired for sale — — — (69,281) — (69,281)
Balance, December 31, 2014 $2,199,583 $ — $191,166 $ 5,661 $ 57,358 $2,453,768
Changes in fair value recognized during the period relating to assets still held at December 31, 2014 $ 134,724 $ — $ (28,662) $ 5,661 $(16,648) $ 95,075
(1) For the purpose of this table, the interest rate lock asset and liability positions are shown net.
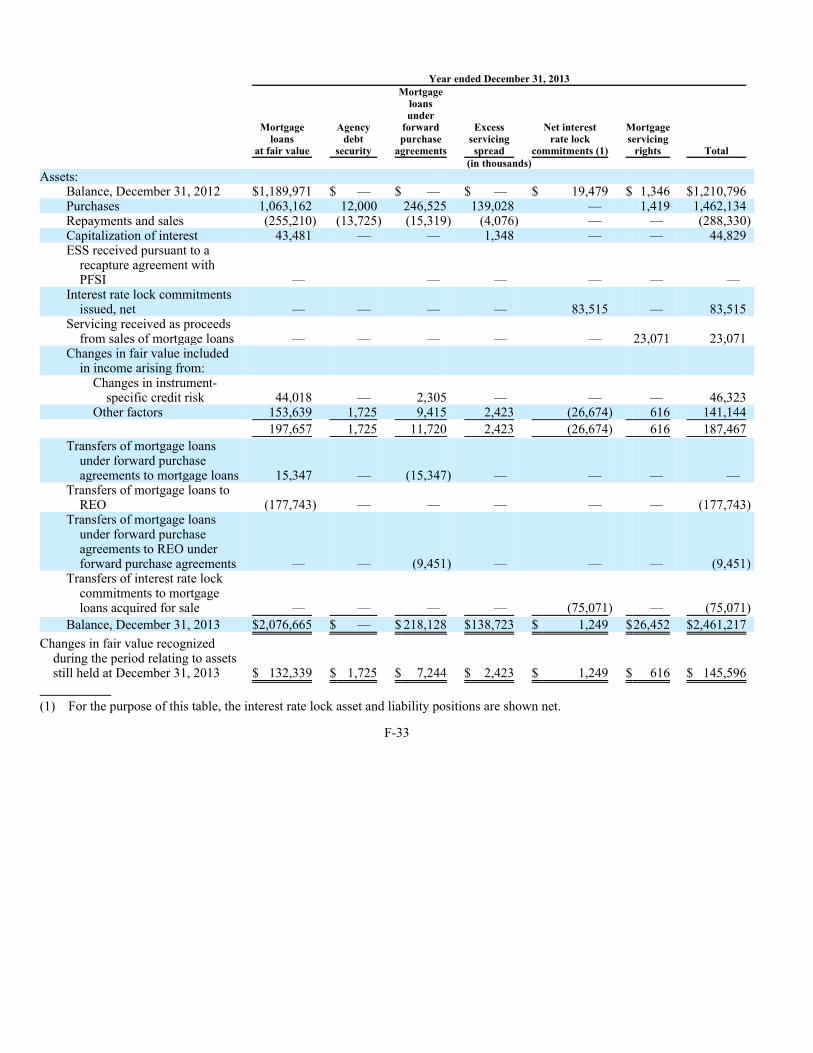
F-33
Year ended December 31, 2013
Mortgage loans
at fair value
Agencydebt
security
Mortgageloans under
forwardpurchase
agreements
Excessservicingspread
Net interest rate lock
commitments (1)
Mortgageservicing
rights Total (in thousands)Assets:
Balance, December 31, 2012 $1,189,971 $ — $ — $ — $ 19,479 $ 1,346 $1,210,796 Purchases 1,063,162 12,000 246,525 139,028 — 1,419 1,462,134 Repayments and sales (255,210) (13,725) (15,319) (4,076) — — (288,330) Capitalization of interest 43,481 — — 1,348 — — 44,829 ESS received pursuant to a
recapture agreement with PFSI — — — — — —
Interest rate lock commitments issued, net — — — — 83,515 — 83,515
Servicing received as proceeds from sales of mortgage loans — — — — — 23,071 23,071
Changes in fair value included in income arising from:
Changes in instrument-specific credit risk 44,018 — 2,305 — — — 46,323
Other factors 153,639 1,725 9,415 2,423 (26,674) 616 141,144
197,657 1,725 11,720 2,423 (26,674) 616 187,467
Transfers of mortgage loans under forward purchase agreements to mortgage loans 15,347 — (15,347) — — — —
Transfers of mortgage loans to REO (177,743) — — — — — (177,743)
Transfers of mortgage loans under forward purchase agreements to REO under forward purchase agreements — — (9,451) — — — (9,451)
Transfers of interest rate lock commitments to mortgage loans acquired for sale — — — — (75,071) — (75,071)
Balance, December 31, 2013 $2,076,665 $ — $ 218,128 $138,723 $ 1,249 $26,452 $2,461,217
Changes in fair value recognized during the period relating to assets still held at December 31, 2013 $ 132,339 $ 1,725 $ 7,244 $ 2,423 $ 1,249 $ 616 $ 145,596
(1) For the purpose of this table, the interest rate lock asset and liability positions are shown net.
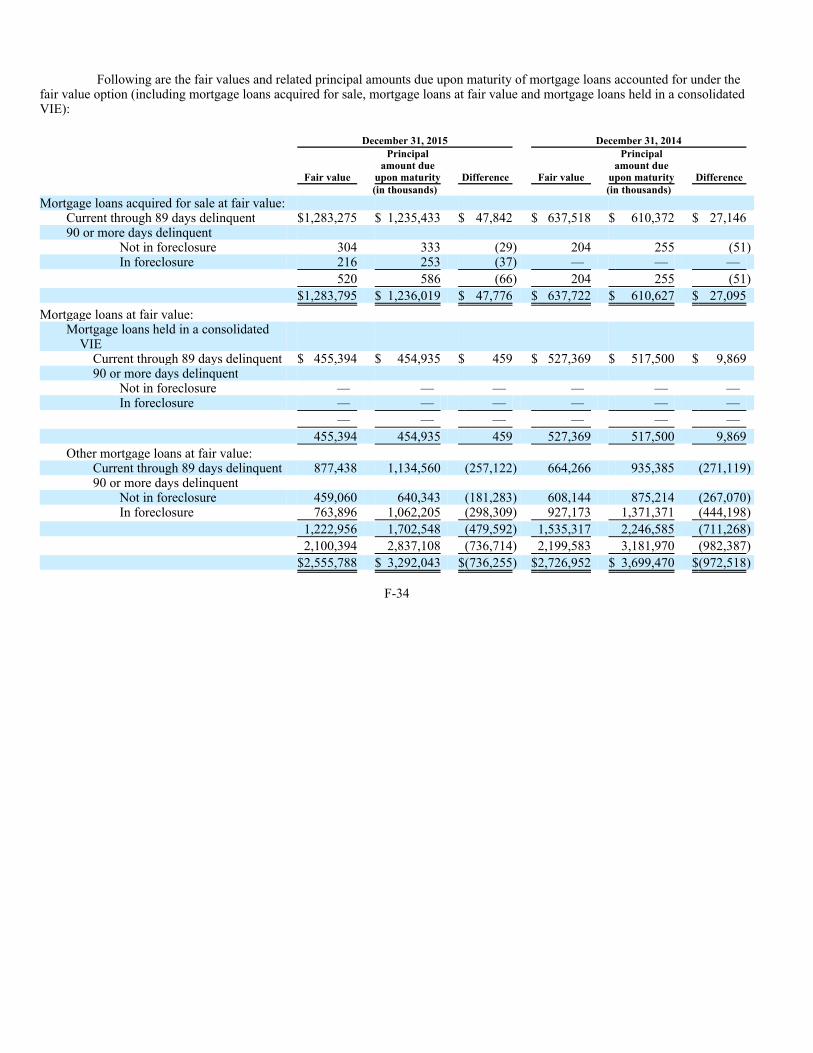
Following are the fair values and related principal amounts due upon maturity of mortgage loans accounted for under the fair value option (including mortgage loans acquired for sale, mortgage loans at fair value and mortgage loans held in a consolidated VIE):
F-34
December 31, 2015 December 31, 2014
Fair value
Principal amount due
upon maturity Difference Fair value
Principal amount due
upon maturity Difference (in thousands) (in thousands)Mortgage loans acquired for sale at fair value:
Current through 89 days delinquent $1,283,275 $ 1,235,433 $ 47,842 $ 637,518 $ 610,372 $ 27,146 90 or more days delinquent
Not in foreclosure 304 333 (29) 204 255 (51) In foreclosure 216 253 (37) — — —
520 586 (66) 204 255 (51)
$1,283,795 $ 1,236,019 $ 47,776 $ 637,722 $ 610,627 $ 27,095
Mortgage loans at fair value: Mortgage loans held in a consolidated
VIE Current through 89 days delinquent $ 455,394 $ 454,935 $ 459 $ 527,369 $ 517,500 $ 9,869 90 or more days delinquent
Not in foreclosure — — — — — — In foreclosure — — — — — —
— — — — — —
455,394 454,935 459 527,369 517,500 9,869
Other mortgage loans at fair value: Current through 89 days delinquent 877,438 1,134,560 (257,122) 664,266 935,385 (271,119) 90 or more days delinquent
Not in foreclosure 459,060 640,343 (181,283) 608,144 875,214 (267,070) In foreclosure 763,896 1,062,205 (298,309) 927,173 1,371,371 (444,198)
1,222,956 1,702,548 (479,592) 1,535,317 2,246,585 (711,268)
2,100,394 2,837,108 (736,714) 2,199,583 3,181,970 (982,387)
$2,555,788 $ 3,292,043 $(736,255) $2,726,952 $ 3,699,470 $(972,518)

Following are the changes in fair value included in current year income by consolidated statement of income line item for financial statement items accounted for under the fair value option:
F-35
Year ended December 31, 2015
Net gain on mortgage
loans acquired for
sale
Net interest
income
Net gain on
investments
Net loan servicing
fees Total (in thousands)Assets:
Short-term investments $ — $ — $ — $ — $ — Mortgage-backed securities at fair value — (35) (5,224) — (5,259) Mortgage loans acquired for sale at fair value 71,880 — — — 71,880 Mortgage loans at fair value — 1,253 70,470 — 71,723 Excess servicing spread at fair value — — 3,239 — 3,239 Mortgage servicing rights at fair value — — — (7,072) (7,072)
$ 71,880 $ 1,218 $ 68,485 $ (7,072) $134,511
Liabilities: Asset-backed financing of VIEs at fair value $ — $ (499) $ 4,260 $ — $ 3,761
$ — $ (499) $ 4,260 $ — $ 3,761
Year ended December 31, 2014
Net gain on mortgage
loans acquired for
sale
Net interest
income
Net gain on
investments
Net loan servicing
fees Total (in thousands)Assets:
Short-term investments $ — $ — $ — $ — $ — Mortgage-backed securities at fair value — 357 10,416 — 10,773 Mortgage loans acquired for sale at fair value 100,213 — — — 100,213 Mortgage loans at fair value — 1,848 242,449 — 244,297 Mortgage loans under forward purchase
agreements at fair value — — 803 — 803 Excess servicing spread at fair value — — (20,834) — (20,834) Mortgage servicing rights at fair value — — — (16,648) (16,648)
$ 100,213 $ 2,205 $ 232,834 $ (16,648) $318,604
Liabilities: Asset-backed financing of a VIE at fair value $ — $ (617) $ (8,459) $ — $ (9,076)
$ — $ (617) $ (8,459) $ — $ (9,076)

Financial Statement Items Measured at Fair Value on a Nonrecurring Basis
Following is a summary of financial statement items that were re-measured at fair value on a nonrecurring basis during the years presented:
Following is a summary of the related gains (losses) recognized as a result of remeasurement from financial statement items that were re-measured at fair value on a nonrecurring basis during the years presented:
F-36
Year ended December 31, 2013
Net gain on mortgage
loans acquired for
sale
Net interest
income
Net gain on
investments
Net loan servicing
fees Total (in thousands)Assets:
Short-term investments $ — $ — $ — $ — $ — Mortgage-backed securities at fair value — 46 (3,946) — (3,900) Mortgage loans acquired for sale at fair value (30,696) — — — (30,696) Mortgage loans at fair value — 232 191,356 — 191,588 Agency debt security — — 1,725 — 1,725 Mortgage loans under forward purchase
agreements at fair value — — 11,720 — 11,720 Excess servicing spread at fair value — — 2,423 — 2,423 Mortgage servicing rights at fair value — — — 616 616
$ (30,696) $ 278 $ 203,278 $ 616 $173,476
Liabilities: Asset-backed financing of a VIE at fair value $ — $ (92) $ 2,279 $ — $ 2,187
$ — $ (92) $ 2,279 $ — $ 2,187
December 31, 2015 Level 1 Level 2 Level 3 Total (in thousands)
Real estate acquired in settlement of loans $ — $ — $173,662 $173,662 Mortgage servicing rights at lower of amortized cost or fair value — — 145,187 145,187
$ — $ — $318,849 $318,849
December 31, 2014 Level 1 Level 2 Level 3 Total (in thousands)
Real estate acquired in settlement of loans $ — $ — $157,203 $157,203 Mortgage servicing rights at lower of amortized cost or fair value — — 91,990 91,990
$ — $ — $249,193 $249,193
Year ended December 31, 2015 2014 2013 (in thousands) Real estate asset acquired in settlement of loans $(24,546) $(24,896) $(11,856) Real estate asset acquired in settlement of loans under forward
purchase agreements — — (86) Mortgage servicing rights at lower of amortized cost or fair value (3,229) (5,138) 4,970
$(27,775) $(30,034) $ (6,972)
Real Estate Acquired in Settlement of Loans
The Company evaluates its REO for impairment with reference to the respective properties’ fair values less cost to sell on a nonrecurring basis. The initial carrying value of the REO is measured at cost as indicated by the purchase price in the case of purchased REO or as measured by the fair value of the mortgage loan immediately before REO acquisition in the case of acquisition in settlement of a loan. REO may be subsequently revalued due to the Company receiving greater access to the property, the property being held for an extended period or receiving indications that the property’s value may not be supported by developing market conditions. Any subsequent change in fair value to a level that is less than or equal to the property’s cost is recognized in Results of real estate acquired in settlement of loans in the Company’s consolidated statements of income.
Mortgage Servicing Rights at Lower of Amortized Cost or Fair Value
The Company evaluates its MSRs at lower of amortized cost or fair value for impairment with reference to the asset’s fair value. For purposes of performing its MSR impairment evaluation, the Company stratifies its MSRs at lower of amortized cost or fair value based on the interest rates borne by the mortgage loans underlying the MSRs. Mortgage loans are grouped into pools with 50 basis point interest rate ranges for fixed-rate mortgage loans with interest rates between 3.0% and 4.5% and a single pool for mortgage loans with interest rates below 3.0%. MSRs relating to adjustable rate mortgage loans with initial interest rates of 4.5% or less are evaluated in a single pool. If the fair value of MSRs in any of the interest rate pools is below the amortized cost of the MSRs, those MSRs are impaired.
When MSRs are impaired, the impairment is recognized in current-period income and the carrying value of the MSRs is adjusted using a valuation allowance. If the fair value of the MSRs subsequently increases, the increase in fair value is recognized in current period income only to the extent of the valuation allowance for the respective impairment stratum.
The Manager periodically reviews the various impairment strata to determine whether the fair value of the impaired MSRs in a given stratum is likely to recover. When the Manager deems recovery of value to be unlikely in the foreseeable future, a write-down of the cost of the MSRs for that stratum to its estimated recoverable value is charged to the valuation allowance.
Fair Value of Financial Instruments Carried at Amortized Cost
The Company’s Cash as well as certain of its borrowings are carried at amortized cost. Cash is measured using “Level 1” inputs. The Company’s assets sold under agreements to repurchase and mortgage loan participation and sale agreement are classified as “Level 3” financial statement items as of December 31, 2015 due to the lack of current market activity and the Company’s reliance on unobservable inputs to estimate these instruments’ fair values.
The Manager has concluded that the fair values of Cash, Assets sold under agreements to repurchase, Federal Home Loan Bank Advances, Mortgage loan participation and sale agreement and Notes payable approximate the agreements’ carrying values due to the immediate realizability of cash at their carrying amounts and to the borrowing agreements’ short terms and variable interest rates.
The Exchangeable Notes are carried at amortized cost. The fair value of the Exchangeable Notes at December 31, 2015 and December 31, 2014 was $230.0 million and $239.0 million, respectively. The fair value of the Exchangeable Notes is estimated using a broker indication of value. The Company has classified the Exchangeable Notes as “Level 3” financial statement items as of December 31, 2015 due to the lack of current market activity.
Valuation Techniques and Inputs
Most of the Company’s assets and the Asset-backed financing of a VIE are carried at fair value with changes in fair value recognized in current period income. A substantial portion of these items are “Level 3” financial statement items which require the use of unobservable inputs that are significant to the estimation of the items’ fair values. Unobservable inputs reflect the Company’s own judgments about the factors that market participants use in pricing an asset or liability, and are based on the best information available under the circumstances.
Due to the difficulty in estimating the fair values of “Level 3” financial statement items, the Manager has assigned responsibility for estimating fair value of these items to specialized staff and subjects the valuation process to significant executive management oversight. The Manager’s Financial Analysis and Valuation group (the “FAV group”) is responsible for estimating the fair values of “Level 3” financial statement items other than IRLCs and maintaining its valuation policies and procedures.
With respect to its Level 3 valuations, the FAV group reports to PCM’s valuation committee, which oversees and approves the valuations. The FAV group monitors the models used for valuation of the Company’s non-IRLC “Level 3” financial statement items, including the models’ performance versus actual results, and reports those results to the Manager’s senior management valuation committee. The Manager’s senior management valuation committee includes PFSI’s chief executive, financial, operating, risk and asset/liability management officers.
F-37
The FAV group is responsible for reporting to PCM’s valuation committee on a monthly basis on the changes in the valuation of the financial statement items, including major factors affecting the valuation and any changes in model methods and inputs. To assess the reasonableness of its valuations, the FAV group presents an analysis of the effect on the valuation of changes to the significant inputs to the models.
The fair value of our IRLCs is developed by the Manager’s Capital Markets Risk Management Staff and is reviewed by the Manager’s Capital Markets Operations group.
The following is a description of the techniques and inputs used in estimating the fair values of “Level 2” and “Level 3” financial statement items:
Mortgage-Backed Securities
The Company’s MBS include Agency and senior non-agency MBS. The Company categorizes its current holdings of MBS as “Level 2” financial statement items. Fair value of these MBS is established based on quoted market prices for the Company’s MBS or similar securities.
Mortgage Loans
Fair value of mortgage loans is estimated based on whether the mortgage loans are saleable into active markets:
The valuation process includes the computation by stratum of the mortgage loans’ fair values and a review for reasonableness of various measures such as weighted average life, projected prepayment and default speeds, and projected default and loss percentages. The FAV group computes the effect on the valuation of changes in input variables such as interest rates, home prices, and delinquency status to assess the reasonableness of changes in the mortgage loan valuation.
Changes in fair value attributable to changes in instrument-specific credit risk are measured by the effect on fair value of the change in the respective mortgage loan’s delinquency status and history at period-end from the later of the beginning of the period or acquisition date.
The significant unobservable inputs used in the fair value measurement of the Company’s mortgage loans at fair value are discount rate, home price projections, voluntary prepayment speeds and default speeds. Significant changes in any of those inputs in isolation could result in a significant change to the mortgage loans’ fair value measurement. Increases in home price projections are generally accompanied by an increase in voluntary prepayment speeds.
F-38
• Mortgage loans that are saleable into active markets, comprised of the Company’s mortgage loans acquired for sale at fair value and mortgage loans at fair value held in a VIE, are categorized as “Level 2” financial statement items. The fair values of mortgage loans acquired for sale at fair value are established using their quoted market or contracted price or market price equivalent. For the mortgage loans at fair value held in a VIE, the fair values of all of the individual securities issued by the securitization trust are used to derive a fair value for the mortgage loans. The Company obtains indications of fair value from nonaffiliated brokers based on comparable securities and validates the brokers’ indications of fair value using pricing models and inputs the Manager believes are similar to the models and inputs used by other market participants.
• Loans that are not saleable into active markets, comprised of the Company’s mortgage loans at fair value held outside the VIE and mortgage loans under forward purchase agreements at fair value, are categorized as “Level 3” financial statement items and their fair values are estimated using a discounted cash flow approach. Inputs to the discounted cash flow model include current interest rates, loan amount, payment status, property type, discount rates and forecasts of future interest rates, home prices, prepayment speeds, default speeds and loss severities or contracted selling price.
Following is a quantitative summary of key inputs used in the valuation of mortgage loans at fair value:
Excess Servicing Spread Purchased from PennyMac Financial Services, Inc.
The Company categorizes ESS as a “Level 3” financial statement item. The Company uses a discounted cash flow approach to estimate the fair value of ESS. The key inputs used in the estimation of the fair value of ESS include prepayment speed and discount rate. Significant changes to those inputs in isolation may result in a significant change in the ESS fair value measurement. Changes in these key inputs are not necessarily directly related.
ESS is generally subject to loss in fair value when interest rates decrease. Decreasing mortgage rates normally encourage increased mortgage refinancing activity. Increased refinancing activity reduces the life of the mortgage loans underlying the ESS, thereby reducing the fair value of ESS. Reductions in the fair value of ESS affect income primarily through change in fair value.
Following are the key inputs used in determining the fair value of ESS:
F-39
Key inputs December 31, 2015 December 31, 2014Discount rate
Range 2.5% – 15.0% 2.3% – 15.0%Weighted average 7.1% 7.7%
Twelve-month projected housing price index change Range 1.5% – 5.1% 4.0% – 5.3%Weighted average 3.6% 4.8%
Prepayment speed (1) Range 0.1% – 9.6% 0.0% – 6.5%Weighted average 3.7% 3.1%
Total prepayment speed (2) Range 0.5% – 27.2% 0.0% – 27.9%Weighted average 19.6% 21.6%
(1) Prepayment speed is measured using Life Voluntary Conditional Prepayment Rate (“CPR”). (2) Total prepayment speed is measured using Life Total CPR.
Key inputs December 31, 2015 December 31, 2014Unpaid principal balance of underlying mortgage loans (in
thousands) $51,966,405 $28,227,340Average servicing fee rate (in basis points) 32 31Average ESS rate (in basis points) 17 16Pricing spread (1)
Range 4.8% – 6.5% 1.7% – 12.0%Weighted average 5.7% 5.3%
Life (in years) Range 1.4 – 9.0 0.4 – 7.3Weighted average 6.9 5.8
Annual total prepayment speed (2) Range 5.2% – 52.4% 7.6% – 74.6%Weighted average 9.6% 11.2%
(1) Pricing spread represents a margin that is applied to a reference interest rate’s forward rate curve to develop periodic discount
rates. The Company applies a pricing spread to the United States Dollar London Interbank Offered Rate (“LIBOR”) curve for purposes of discounting cash flows relating to ESS.
(2) Prepayment speed is measured using Life Total CPR.

Derivative Financial Instruments
The Company categorizes IRLCs as a “Level 3” financial statement item. The Company estimates the fair value of IRLCs based on quoted Agency MBS prices, its estimate of the fair value of the MSRs it expects to receive in the sale of the mortgage loans and the probability that the mortgage loan will be purchased under the commitment as a percentage of the commitments it has made (the “pull-through rate”).
The significant unobservable inputs used in the fair value measurement of the Company’s IRLCs are the pull-through rate and the MSR component of the Company’s estimate of the fair value of the mortgage loans it has committed to purchase. Significant changes in the pull-through rate or the MSR component of the IRLCs, in isolation, may result in a significant change in fair value. The financial effects of changes in these inputs are generally inversely correlated as increasing interest rates have a positive effect on the fair value of the MSR component of IRLC value, but increase the pull-through rate for mortgage loan principal and interest payment cash flows that have decreased in fair value.
Following is a quantitative summary of key unobservable inputs used in the valuation of IRLCs:
The Company estimates the fair value of commitments to sell loans based on quoted MBS prices. The Company estimates the fair value of the interest rate options and futures it uses as hedging derivatives based on observed interest rate volatilities in the MBS market. These derivative financial instruments are categorized by the Company as “Level 2” financial statement items.
Real Estate Acquired in Settlement of Loans
REO is measured based on its fair value on a nonrecurring basis and is categorized as a “Level 3” financial statement item. Fair value of REO is established by using a current estimate of fair value from a broker’s price opinion or a full appraisal, or the price given in a current contract of sale.
REO fair values are reviewed by the Manager’s staff appraisers when the Company obtains multiple indications of fair value and there is a significant difference between the fair values received. PCM’s staff appraisers will attempt to resolve the difference between the indications of fair value. In circumstances where the appraisers are not able to generate adequate data to support a fair value conclusion, the staff appraisers will order an additional appraisal to determine the fair value.
Mortgage Servicing Rights
MSRs are categorized as “Level 3” financial statement items. The Company uses a discounted cash flow approach to estimate the fair value of MSRs. The key inputs used in the estimation of the fair value of MSRs include the applicable pricing spread, prepayment and default rates of the underlying mortgage loans, and annual per-loan cost to service mortgage loans, all of which are unobservable. Significant changes to any of those inputs in isolation could result in a significant change in the MSR fair value measurement. Changes in these key inputs are not necessarily directly related.
MSRs are generally subject to loss in fair value when mortgage interest rates decrease. Decreasing mortgage interest rates normally encourage increased mortgage refinancing activity. Increased refinancing activity reduces the life of the underlying mortgage loans, thereby reducing MSR fair value. Reductions in the fair value of MSRs affect income primarily through change in fair value and change in impairment. For MSRs backed by mortgage loans with historically low interest rates, factors other than interest rates (such as housing price changes) take on increasing influence on prepayment behavior of the underlying mortgage loans.
F-40
Key inputs December 31, 2015 December 31, 2014Pull-through rate
Range 60.2% – 100.0% 65.0% – 98.0%Weighted average 92.4% 94.9%
MSR value expressed as: Servicing fee multiple
Range 2.1 – 6.2 0.7 – 5.2Weighted average 4.9 4.3
Percentage of unpaid principal balance Range 0.5% – 3.8% 0.2% – 1.3%Weighted average 1.2% 1.1%
Following are the key inputs used in determining the fair value of MSRs at the time of initial recognition:
F-41
Year ended December 31, 2015 2014 2013Key inputs Amortized cost Fair value Amortized cost Fair value Amortized cost Fair value (MSR recognized and unpaid principal balance of underlying mortgage loan amounts in thousands)MSR recognized $140,511 $13,963 $73,640 $47,693 $159,961 $23,071Unpaid principal balance of underlying
mortgage loans $12,195,574 $1,430,795 $6,800,637 $4,573,369 $13,343,793 $2,148,185Weighted-average annual servicing fee
rate (in basis points) 25 25 25 25 26 26Pricing spread (1)
Range 6.5% – 17.5% 7.2% – 16.3% 6.3% – 17.5% 8.5% – 14.3% 5.4% – 17.5% 7.4% – 14.4%Weighted average 7.9% 8.5% 8.6% 9.1% 6.7% 8.2%
Life (in years) Range 1.3 – 12.0 2.2 – 9.4 1.1 – 7.3 1.6 – 7.3 1.3 – 7.3 2.7 – 7.3Weighted average 6.9 6.4 6.4 7.1 6.4 6.9
Annual total prepayment speed (2) Range 3.5% – 51.0% 6.8% – 34.2% 7.6% – 56.4% 8.0% – 42.7% 7.6% – 51.8% 7.9% – 27.0%Weighted average 9.0% 12.3% 9.6% 9.7% 9.1% 10.0%
Annual per-loan cost of servicing Range $62 – $134 $62 – $68 $59 – $140 $59 – $140 $68 – $140 $68 – $68Weighted average $64 $65 $69 $68 $68 $68
(1) Pricing spread represents a margin that is applied to a reference interest rate’s forward rate curve to develop periodic discount rates. The Company applies a pricing spread to the United States Dollar LIBOR curve for purposes of discounting cash flows relating to MSRs acquired as proceeds from the sale of mortgage loans.
(2) Annual total prepayment speed is measured using Life Total CPR.

Following is a quantitative summary of key inputs used in the valuation of MSRs as of the dates presented, and the effect on fair value from adverse changes in those inputs:
The preceding sensitivity analyses are limited in that they were performed at a particular point in time; only contemplate the movements in the indicated inputs; do not incorporate changes in the inputs in relation to other inputs; are subject to the accuracy of various models and inputs used; and do not incorporate other factors that would affect the Company’s overall financial performance in such scenarios, including operational adjustments made by the Manager to account for changing circumstances. For these reasons, the preceding estimates should not be viewed as earnings forecasts.
F-42
December 31, 2015 December 31, 2014 Amortized cost (1) Fair value Amortized cost (1) Fair value
(Carrying value, unpaid principal balance and effect on fair value amounts in
thousands)Carrying value $393,157 $66,584 $300,422 $57,358
Key inputs: Unpaid principal balance of underlying mortgage
loans $35,841,654 $6,458,684 $28,006,797 $6,278,676Weighted-average annual servicing fee rate (in
basis points) 26 25 26 25Weighted-average note interest rate 3.9% 4.7% 3.8% 4.8%Pricing spread (2)
Range 7.2% – 10.7% 7.2% – 10.2% 6.3% – 17.5% 8.1% – 16.3%Weighted average 7.3% 7.2% 7.9% 10.3%Effect on fair value of a:
5% adverse change $(6,411) $(944) $(5,801) $(937)10% adverse change $(12,635) $(1,862) $(11,410) $(1,845)20% adverse change $(24,553) $(3,621) $(22,086) $(3,577)
Weighted average life (in years) Range 1.3 – 7.7 2.5 – 6.1 1.8 – 7.2 1.8 – 7.2Weighted average 7.2 6.1 6.4 6.7
Prepayment speed (3) Range 8.1% – 51.5% 9.2% – 32.5% 7.8% – 47.9% 8.0% – 39.6%Weighted average 9.6% 13.2% 8.8% 11.4%Effect on fair value of a:
5% adverse change $(8,159) $(1,793) $(6,166) $(1,430)10% adverse change $(16,024) $(3,502) $(12,138) $(2,803)20% adverse change $(30,938) $(6,692) $(23,532) $(5,394)
Annual per-loan cost of servicing Range $68 – $68 $68 – $68 $62 – $134 $62 – $134Weighted average $68 $68 $62 $62Effect on fair value of a:
5% adverse change $(2,742) $(470) $(1,807) $(334)10% adverse change $(5,484) $(940) $(3,614) $(668)20% adverse change $(10,968) $(1,880) $(7,228) $(1,337)
(1) The effect on fair value of an adverse change in pricing spread, prepayment speed or per-loan cost of servicing may result in recognition of MSR impairment. The extent of impairment recognized will depend on the relationship of fair value to the carrying value of MSRs at the measurement date.
(2) Pricing spread represents a margin that is added to a reference interest rate’s forward rate curve to develop periodic discount rates. The Company applies a pricing spread to the United States Dollar LIBOR curve for purposes of discounting cash flows relating to MSRs.
(3) Prepayment speed is measured using Life Total CPR.

Securities Sold Under Agreements to Repurchase
Fair value of securities sold under agreements to repurchase approximates the accrued cost of the agreements, due to the variable interest rates and short maturities of such agreements.
Note 9—Short-Term Investments
The Company’s short-term investments are comprised of deposit accounts with U.S. commercial banks.
Note 10—Mortgage Loans Acquired for Sale at Fair Value
Mortgage loans acquired for sale at fair value is comprised of recently originated mortgage loans purchased by the Company for resale. Following is a summary of the distribution of the Company’s mortgage loans acquired for sale at fair value:
The Company is not approved by Ginnie Mae as an issuer of Ginnie Mae-guaranteed securities which are backed by government-insured or guaranteed mortgage loans. The Company transfers government-insured or guaranteed mortgage loans that it purchases from correspondent lenders to PLS, which is a Ginnie Mae-approved issuer, and earns a sourcing fee of three basis points on the UPB plus interest for the period it holds each such mortgage loan.
Note 11—Derivative Financial Instruments
The Company engages in interest rate risk management activities in an effort to reduce the variability of earnings caused by changes in interest rates. To manage the price risk resulting from interest rate risk, the Company uses derivative financial instruments acquired with the intention of moderating the risk that changes in market interest rates will result in unfavorable changes in the fair value of the Company’s MBS, inventory of mortgage loans acquired for sale, mortgage loans held by VIE, ESS, IRLCs and MSRs. The Company records all derivative financial instruments at fair value and records changes in fair value in current period income.
The Company is exposed to price risk relative to its mortgage loans acquired for sale and to the IRLCs it issues to correspondent lenders. The Company bears price risk from the time an IRLC is issued to a correspondent lender to the time the purchased mortgage loan is sold. The Company is exposed to loss if mortgage interest rates increase, because the fair value of the purchase commitment or mortgage loan acquired for sale decreases.
The Company is exposed to risk relative to the fair value of its mortgage loans at fair value. The Company is exposed to loss in fair value of its mortgage loans at fair value when interest rates increase. The Company includes mortgage loans at fair value in its hedging activities. The Company is also exposed to risk relative to the fair value of its MSRs and ESS. The Company is exposed to loss in fair value of its MSRs and ESS when interest rates decrease. The Company includes MSRs and ESS in its hedging activities.
The Company uses Eurodollar futures, which settle daily, with the intention of moderating the risk of changing market interest rates that will result in unfavorable changes in the value of the Company’s fixed-rate assets and economic performance of its LIBOR-indexed variable interest rate repurchase agreement liabilities.
F-43
December 31, 2015 December 31, 2014
Fairvalue
Unpaidprincipal balance
Fair value
Unpaidprincipalbalance
Loan type (in thousands)Conventional:
Agency-eligible $ 540,947 $ 525,192 $287,300 $274,650 Jumbo 54,613 54,096 137,440 134,079
Held for sale to PennyMac Loan Services, LLC — Government insured or guaranteed 669,288 637,666 209,325 198,265
Commercial real estate loans 14,590 14,461 — — Mortgage loans repurchased pursuant to representations and
warranties 4,357 4,604 3,657 3,634
$1,283,795 $1,236,019 $637,722 $610,628
Mortgage loans pledged to secure: Assets sold under agreements to repurchase $1,204,462 $609,608 Federal Home Loan Bank (“FHLB”) advances $ 63,993 $ — Mortgage loan participation and sale agreements $ — $ 20,862
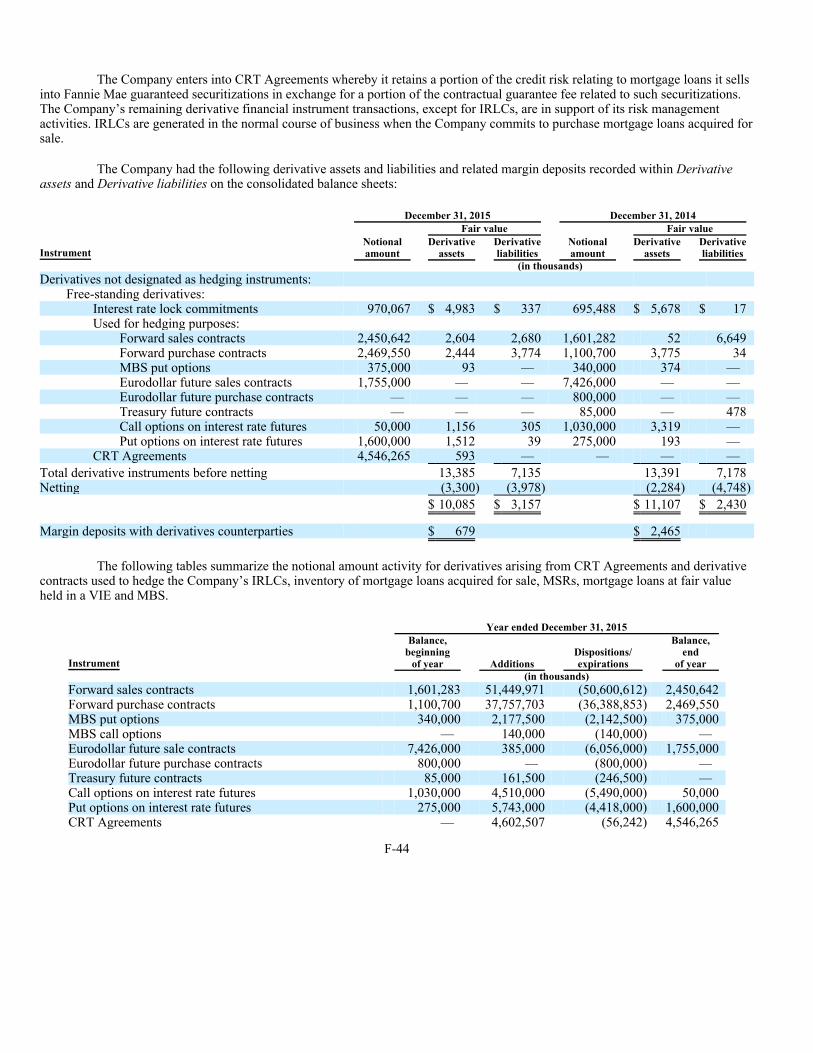
The Company enters into CRT Agreements whereby it retains a portion of the credit risk relating to mortgage loans it sells into Fannie Mae guaranteed securitizations in exchange for a portion of the contractual guarantee fee related to such securitizations. The Company’s remaining derivative financial instrument transactions, except for IRLCs, are in support of its risk management activities. IRLCs are generated in the normal course of business when the Company commits to purchase mortgage loans acquired for sale.
The Company had the following derivative assets and liabilities and related margin deposits recorded within Derivative assets and Derivative liabilities on the consolidated balance sheets:
The following tables summarize the notional amount activity for derivatives arising from CRT Agreements and derivative contracts used to hedge the Company’s IRLCs, inventory of mortgage loans acquired for sale, MSRs, mortgage loans at fair value held in a VIE and MBS.
F-44
December 31, 2015 December 31, 2014 Fair value Fair value
Instrument Notionalamount
Derivativeassets
Derivativeliabilities
Notional amount
Derivativeassets
Derivativeliabilities
(in thousands)Derivatives not designated as hedging instruments:
Free-standing derivatives: Interest rate lock commitments 970,067 $ 4,983 $ 337 695,488 $ 5,678 $ 17 Used for hedging purposes:
Forward sales contracts 2,450,642 2,604 2,680 1,601,282 52 6,649 Forward purchase contracts 2,469,550 2,444 3,774 1,100,700 3,775 34 MBS put options 375,000 93 — 340,000 374 — Eurodollar future sales contracts 1,755,000 — — 7,426,000 — — Eurodollar future purchase contracts — — — 800,000 — — Treasury future contracts — — — 85,000 — 478 Call options on interest rate futures 50,000 1,156 305 1,030,000 3,319 — Put options on interest rate futures 1,600,000 1,512 39 275,000 193 —
CRT Agreements 4,546,265 593 — — — —
Total derivative instruments before netting 13,385 7,135 13,391 7,178 Netting (3,300) (3,978) (2,284) (4,748)
$ 10,085 $ 3,157 $ 11,107 $ 2,430
Margin deposits with derivatives counterparties $ 679 $ 2,465
Year ended December 31, 2015
Instrument
Balance, beginning
of year Additions Dispositions/
expirations
Balance,end
of year (in thousands)Forward sales contracts 1,601,283 51,449,971 (50,600,612) 2,450,642 Forward purchase contracts 1,100,700 37,757,703 (36,388,853) 2,469,550 MBS put options 340,000 2,177,500 (2,142,500) 375,000 MBS call options — 140,000 (140,000) — Eurodollar future sale contracts 7,426,000 385,000 (6,056,000) 1,755,000 Eurodollar future purchase contracts 800,000 — (800,000) — Treasury future contracts 85,000 161,500 (246,500) — Call options on interest rate futures 1,030,000 4,510,000 (5,490,000) 50,000 Put options on interest rate futures 275,000 5,743,000 (4,418,000) 1,600,000 CRT Agreements — 4,602,507 (56,242) 4,546,265

Following are the net gains (losses) recognized by the Company on derivative financial instruments and the income statement line items where such gains and losses are included:
Note 12—Mortgage Loans at Fair Value
Mortgage loans at fair value are comprised of mortgage loans that are not acquired for sale and, to the extent they are not held in a VIE securing an asset-backed financing, may be sold at a later date pursuant to a management determination that such a sale represents the most advantageous liquidation strategy for the identified mortgage loan.
F-45
Year ended December 31, 2014
Instrument
Balance, beginning
of year Additions Dispositions/
expirations
Balance,end
of year (in thousands)Forward sales contracts 3,588,027 45,904,253 (47,890,997) 1,601,283 Forward purchase contracts 2,781,066 33,418,838 (35,099,204) 1,100,700 MBS put option 55,000 2,087,500 (1,802,500) 340,000 MBS call option 110,000 230,000 (340,000) — Eurodollar future sale contracts 8,779,000 3,032,000 (4,385,000) 7,426,000 Eurodollar future purchase contracts — 4,087,000 (3,287,000) 800,000 Treasury future sale contracts 105,000 482,600 (502,600) 85,000 Treasury future purchase contracts — 439,200 (439,200) — Put options on interest rate futures 52,500 1,687,500 (1,465,000) 275,000 Call options on interest rate futures — 3,530,000 (2,500,000) 1,030,000
Year ended December 31, 2013
Instrument
Balance, beginning
of year Additions Dispositions/
expirations
Balance,end
of year (in thousands)Forward sales contracts 4,266,983 72,719,643 (73,398,599) 3,588,027 Forward purchase contracts 2,206,539 56,191,824 (55,617,297) 2,781,066 MBS put option 495,000 3,335,000 (3,775,000) 55,000 MBS call option — 2,310,000 (2,200,000) 110,000 Eurodollar future sale contracts — 19,852,000 (11,073,000) 8,779,000 Eurodollar future purchase contracts — 660,000 (660,000) — Treasury future sale contracts — 180,000 (75,000) 105,000 Treasury future purchase contracts — 75,000 (75,000) — Put options on interest rate futures — 260,000 (207,500) 52,500 Call options on interest rate futures — 42,500 (42,500) —
Income statement line Year ended December 31,
2015 2014 2013 (in thousands)Interest rate lock commitments
Net gain on mortgage loans acquired for sale $ 37,725 $ 73,693 $ 56,841
Hedged item: Interest rate lock commitments and
mortgage loans acquired for sale Net gain on mortgage loans acquired for sale $(16,781) $(68,679) $151,641
Mortgage servicing rights Net loan servicing fees $ 481 $ 11,527 $ (1,987) Fixed-rate assets and LIBOR-
indexed repurchase agreements Net gain on investments $(19,353) $(22,565) $ (9,358) CRT Agreements Net gain on investments $ 593 $ — $ —

Following is a summary of the distribution of the Company’s mortgage loans at fair value:
Following is a summary of certain concentrations of credit risk in the portfolio of distressed mortgage loans at fair value:
F-46
December 31, 2015 December 31, 2014
Loan type Fairvalue
Unpaidprincipal balance
Fair value
Unpaidprincipal balance
(in thousands)Distressed mortgage loans
Nonperforming mortgage loans $1,222,956 $1,702,548 $1,535,317 $2,246,585 Performing mortgage loans:
Fixed interest rate 417,658 535,610 322,704 449,496 Adjustable-rate/hybrid 160,051 185,997 127,405 162,329 Interest rate step-up 299,569 412,749 213,999 323,350 Balloon 160 204 158 210
877,438 1,134,560 664,266 935,385 Fixed interest rate jumbo mortgage loans held in a VIE 455,394 454,935 527,369 517,500
$2,555,788 $3,292,043 $2,726,952 $3,699,470
Mortgage loans at fair value pledged to secure: Assets sold under agreements to repurchase $2,067,341 $2,543,242 FHLB advances $ 134,172 $ — Asset-backed financing of the VIE at fair value $ 455,394 $ 527,369
Concentration December 31, 2015 December 31, 2014 (percentages are of fair value)Portion of mortgage loans originated between 2005 and
2007 72% 75%Percentage of fair value of mortgage loans with unpaid-
principal balance-to-current-property-value in excess of 100% 48% 55%
Percentage of mortgage loans secured by California real estate 22% 22%
Additional states contributing 5% or more of mortgage loans
New YorkNew Jersey
Florida
New York New Jersey
Florida
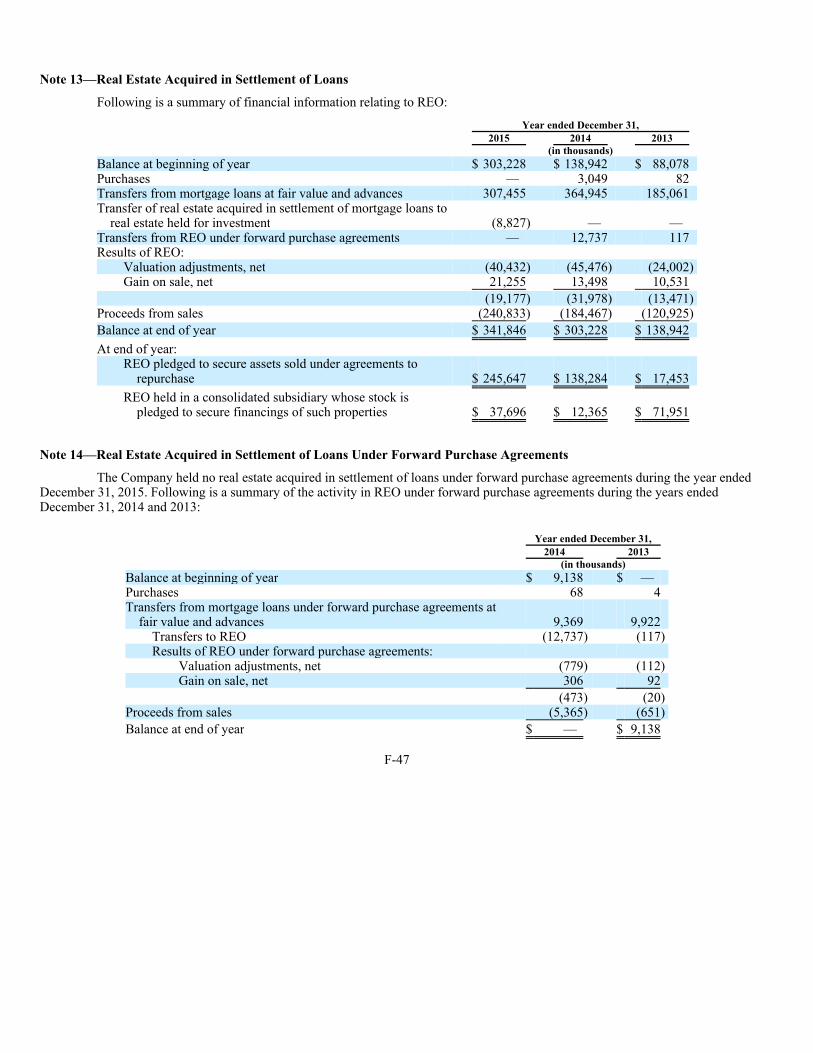
Note 13—Real Estate Acquired in Settlement of Loans
Following is a summary of financial information relating to REO:
Note 14—Real Estate Acquired in Settlement of Loans Under Forward Purchase Agreements
The Company held no real estate acquired in settlement of loans under forward purchase agreements during the year ended December 31, 2015. Following is a summary of the activity in REO under forward purchase agreements during the years ended December 31, 2014 and 2013:
F-47
Year ended December 31, 2015 2014 2013 (in thousands) Balance at beginning of year $ 303,228 $ 138,942 $ 88,078 Purchases — 3,049 82 Transfers from mortgage loans at fair value and advances 307,455 364,945 185,061 Transfer of real estate acquired in settlement of mortgage loans to
real estate held for investment (8,827) — — Transfers from REO under forward purchase agreements — 12,737 117 Results of REO:
Valuation adjustments, net (40,432) (45,476) (24,002) Gain on sale, net 21,255 13,498 10,531
(19,177) (31,978) (13,471) Proceeds from sales (240,833) (184,467) (120,925)
Balance at end of year $ 341,846 $ 303,228 $ 138,942
At end of year: REO pledged to secure assets sold under agreements to
repurchase $ 245,647 $ 138,284 $ 17,453
REO held in a consolidated subsidiary whose stock is pledged to secure financings of such properties $ 37,696 $ 12,365 $ 71,951
Year ended December 31, 2014 2013 (in thousands) Balance at beginning of year $ 9,138 $ — Purchases 68 4 Transfers from mortgage loans under forward purchase agreements at
fair value and advances 9,369 9,922 Transfers to REO (12,737) (117) Results of REO under forward purchase agreements:
Valuation adjustments, net (779) (112) Gain on sale, net 306 92
(473) (20) Proceeds from sales (5,365) (651)
Balance at end of year $ — $ 9,138
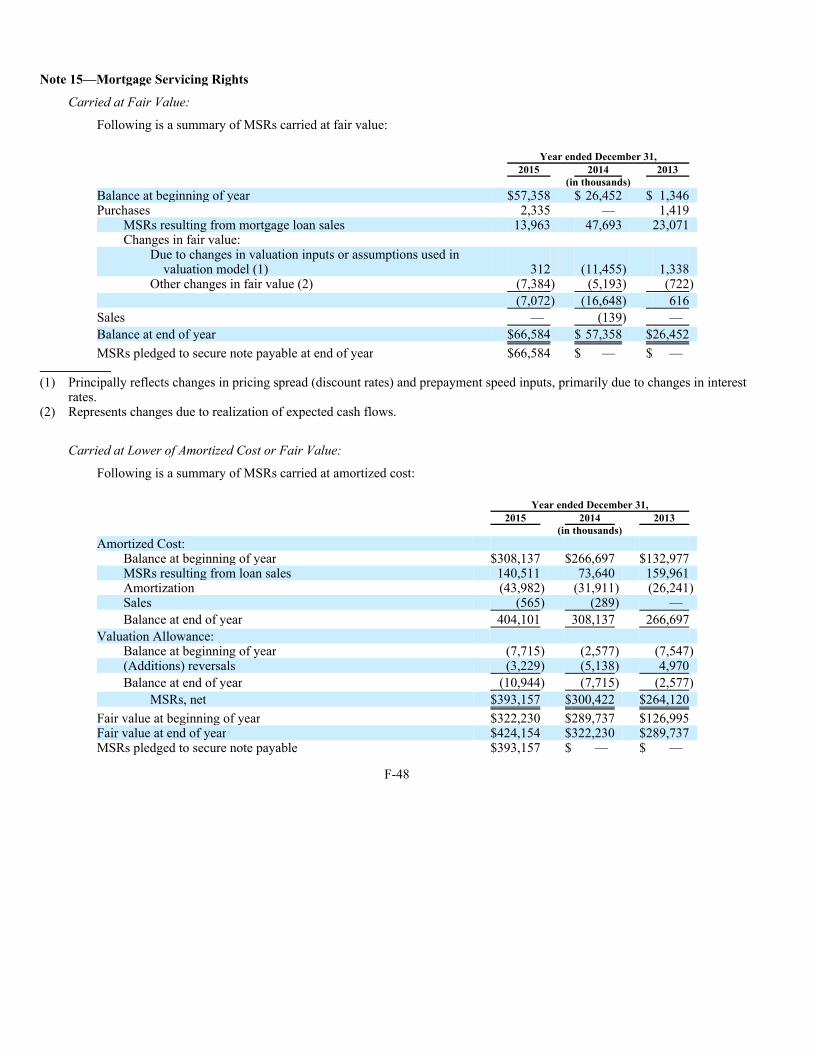
Note 15—Mortgage Servicing Rights
Carried at Fair Value:
Following is a summary of MSRs carried at fair value:
Carried at Lower of Amortized Cost or Fair Value:
Following is a summary of MSRs carried at amortized cost:
F-48
Year ended December 31, 2015 2014 2013 (in thousands) Balance at beginning of year $57,358 $ 26,452 $ 1,346 Purchases 2,335 — 1,419
MSRs resulting from mortgage loan sales 13,963 47,693 23,071 Changes in fair value:
Due to changes in valuation inputs or assumptions used in valuation model (1) 312 (11,455) 1,338
Other changes in fair value (2) (7,384) (5,193) (722)
(7,072) (16,648) 616
Sales — (139) —
Balance at end of year $66,584 $ 57,358 $26,452
MSRs pledged to secure note payable at end of year $66,584 $ — $ — (1) Principally reflects changes in pricing spread (discount rates) and prepayment speed inputs, primarily due to changes in interest
rates. (2) Represents changes due to realization of expected cash flows.
Year ended December 31, 2015 2014 2013 (in thousands) Amortized Cost:
Balance at beginning of year $308,137 $266,697 $132,977 MSRs resulting from loan sales 140,511 73,640 159,961 Amortization (43,982) (31,911) (26,241) Sales (565) (289) —
Balance at end of year 404,101 308,137 266,697
Valuation Allowance: Balance at beginning of year (7,715) (2,577) (7,547) (Additions) reversals (3,229) (5,138) 4,970
Balance at end of year (10,944) (7,715) (2,577)
MSRs, net $393,157 $300,422 $264,120
Fair value at beginning of year $322,230 $289,737 $126,995 Fair value at end of year $424,154 $322,230 $289,737 MSRs pledged to secure note payable $393,157 $ — $ —

The following table summarizes the Company’s estimate of future amortization of its existing MSRs carried at amortized cost. This estimate was developed with the inputs used in the December 31, 2015 valuation of MSRs. The inputs underlying the following estimate will change as market conditions and portfolio composition and behavior change, causing both actual and projected amortization levels to change over time.
Servicing fees relating to MSRs are recorded in Net loan servicing fees on the consolidated statements of income and are summarized below for the years presented:
Note 16—Assets Sold under Agreements to Repurchase
Following is a summary of financial information relating to assets sold under agreements to repurchase:
F-49
Year ended December 31, Estimated MSR
amortization (in thousands) 2016 $ 50,798 2017 45,300 2018 39,985 2019 35,292 2020 31,177 Thereafter 201,549
Total $ 404,101
Year ended December 31, 2015 2014 2013 (in thousands)Contractually-specified servicing fees $97,633 $76,300 $50,716
Year ended December 31, 2015 2014 2013 (dollars in thousands) During the year:
Weighted-average interest rate (1) 2.33% 2.12% 2.43% Average balance $3,046,963 $2,311,273 $1,552,912 Total interest expense $ 79,869 $ 58,304 $ 47,790 Maximum daily amount outstanding $4,710,412 $3,203,989 $3,124,616
At year end: Amount outstanding $3,130,328 $2,730,130 $2,039,605 Unamortized commitment fees and debt issuance
costs (1,548) (1,103) (602)
Balance $3,128,780 $2,729,027 $2,039,003
Weighted-average interest rate 2.33% 2.32% 2.29% Available borrowing capacity:
Committed $ 231,913 $ 652,360 $1,467,138 Uncommitted 661,756 695,000 150,000
$ 893,669 $1,347,360 $1,617,138
Margin deposits placed with counterparties $ 7,268 $ 5,579 $ 3,201 Fair value of assets securing agreements to
repurchase: Mortgage-backed securities $ 313,753 $ 307,363 $ 197,401 Mortgage loans acquired for sale at fair value 1,204,462 609,608 454,210 Mortgage loans at fair value 2,067,341 2,543,242 2,315,313 Real estate acquired in settlement of loans 283,343 150,649 89,404
$3,868,899 $3,610,862 $3,056,328
(1) Excludes the amortization of commitment fees and issuance costs of $8.9 million, $9.4 million, and $10.0 million for the years ended December 31, 2015, 2014 and 2013, respectively.

Following is a summary of maturities of outstanding assets sold under agreements to repurchase by maturity date:
The Company is subject to margin calls during the period the agreements are outstanding and therefore may be required to repay a portion of the borrowings before the respective agreements mature if the fair value (as determined by the applicable lender) of the assets securing those agreements decreases. Margin deposits are included in Other assets in the consolidated balance sheets.
The amount at risk (the fair value of the assets pledged plus the related margin deposit, less the amount advanced by the counterparty and interest payable) and maturity information relating to the Company’s assets sold under agreements to repurchase is summarized by counterparty below as of December 31, 2015:
Mortgage loans acquired for sale, mortgage loans and REO sold under agreements to repurchase
Securities sold under agreements to repurchase
The following is a summary of the tangible net worth and minimum required amounts for the Company and certain of its subsidiaries at December 31, 2015 to comply with the debt covenants contained in the borrowing agreements:
F-50
Remaining Maturity at December 31, 2015 Contractual
balance (in thousands) Within 30 days $ 1,304,803 Over 30 to 90 days 170,403 Over 90 days to 180 days — Over 180 days to 1 year 1,280,861 Over 1 year to 2 years 374,261
$ 3,130,328
Weighted average maturity (in months) 6.0
Counterparty Amount at risk
Mortgage loans acquired for saleWeighted-average
repurchase agreement maturity Facility maturity (in thousands) Citibank, N.A. $ 373,017 January 27, 2016 October 20, 2016 Credit Suisse First Boston
Mortgage Capital LLC $ 300,147 January 21, 2016 January 21, 2016 JPMorgan Chase & Co. $ 156,700 — January 26, 2017 Bank of America, N.A. $ 36,921 January 29, 2016 January 29, 2016 Morgan Stanley $ 13,293 February 20, 2016 December 16, 2016 Barclays $ 1,600 March 22, 2016 September 13, 2016
Counterparty Amount at risk Maturity (in thousands) Citibank, N.A. $ 456 March 30, 2016JPMorgan Chase & Co. $ 29,840 January 15, 2016Bank of America, N.A. $ 19,905 January 17, 2016Daiwa Capital Markets America Inc. $ 7,640 February 3, 2016BNP Paribas Corporate & Institutional Bank $ 3,817 January 19, 2016
Tangible net worth as of
December 31, 2015
Entity Balance Minimum required
(in thousands) PennyMac Mortgage Investment Trust $1,496,113 $860,000 Operating Partnership $1,536,295 $700,000 PennyMac Holdings, LLC $ 919,638 $250,000 PennyMac Corp. $ 396,780 $150,000

Note 17—Mortgage Loan Participation and Sale Agreement
One of the borrowing facilities secured by mortgage loans acquired for sale is in the form of a mortgage loan participation and sale agreement. Participation certificates, each of which represents an undivided beneficial ownership interest in a pool of mortgage loans that have been pooled with Fannie Mae or Freddie Mac, are sold to the lender pending the securitization of such mortgage loans and the sale of the resulting security. A commitment between the Company and a nonaffiliate to sell such security is also assigned to the lender at the time a participation certificate is sold.
The purchase price paid by the lender for each participation certificate is based on the trade price of the security, plus an amount of interest expected to accrue on the security to its anticipated delivery date, minus a present value adjustment, any related hedging costs and a holdback amount that is based on a percentage of the purchase price and is not required to be paid to the Company until the settlement of the security and its delivery to the lender.
The mortgage loan participation and sale agreement is summarized below:
Note 18—Federal Home Loan Bank Advances
In June 2015, the Company entered into a collateral, pledge, and security agreement with the Federal Home Loan Bank of Des Moines with no specified termination date. The Company may request advances up to a maximum of $400.0 million. The Company is required to comply with certain financial covenants and must also maintain capital stock equal to at least 4% of the outstanding balance of FHLB advances.
F-51
Year ended December 31, 2015 2014 (dollars in thousands) During the year:
Weighted-average interest rate (1) 1.62% 1.42% Average balance $ 49,318 $ 44,770 Total interest expense $ 1,001 $ 912 Maximum daily amount outstanding $148,032 $116,363
At year end: Amount outstanding $ — $ 20,236 Unamortized debt issuance costs — (14)
Balance $ — $ 20,222
Weighted-average interest rate 0.00% 1.42% Mortgage loans pledged to secure mortgage loan participation and sale
agreement — $ 20,862
(1) Excludes the effect of amortization of commitment fees of $193,000 and $266,000 for the years ended December 31, 2015 and 2014, respectively.

The FHLB advances are summarized below:
On January 12, 2016, the Federal Housing Finance Agency (“FHFA”) issued a final rule establishing new requirements for membership in the Federal Home Loan Banks (“FHLBanks”). The final rule excludes captive insurance companies such as the Company’s insurance subsidiary, Copper Insurance, LLC from membership.
For captive insurance companies that became members since the rule was proposed in 2014, including Copper Insurance, LLC, membership must be terminated within one year, and no additional advances may be made. Accordingly, the Company has repaid $83.0 million of the advances outstanding and expects to repay the unpaid balance outstanding at February 25, 2016, of $100.0 million on or before its maturity on March 3, 2016.
Note 19—Notes Payable
On March 31, 2015, the Company, through its wholly-owned subsidiary, PMC, entered into a Loan and Security Agreement with Citibank, N.A., pursuant to which PMC may finance certain of its MSRs relating to mortgage loans pooled into Freddie Mac MBS in an aggregate loan amount not to exceed $125 million. The note matures on March 29, 2016.
On September 14, 2015, the Company, through its wholly-owned subsidiary, PMC, entered into a Loan and Security Agreement with Barclays Bank PLC (“Barclays”), pursuant to which PMC may finance certain of its MSRs relating to mortgage loans pooled into Fannie Mae MBS in an aggregate loan amount not to exceed $200 million. The note matures on September 13, 2016, subject to a wind down period of up to one year following such maturity date.
Following is a summary of financial information relating to the notes payable:
F-52
Year ended
December 31, 2015 (dollars in thousands) During the year:
Weighted-average interest rate 0.30% Average balance $ 89,512 Total interest expense $ 275 Maximum daily amount outstanding $ 196,100
At year end: Balance $ 183,000 Weighted-average interest rate 0.30% Fair value of assets securing FHLB advances:
Mortgage-backed securities $ 8,720 Mortgage loans acquired for sale at fair value 63,993 Mortgage loans at fair value 134,172
$ 206,885
Year ended
December 31, 2015 (dollars in thousands) During the year:
Weighted-average interest rate (1) 4.31% Average balance $ 119,307 Total interest expense $ 6,826 Maximum daily amount outstanding $ 236,107
At year end: Amount outstanding $ 236,107 Unamortized commitment fees and debt issuance
costs (92)
Balance $ 236,015
Weighted-average interest rate 4.53% Mortgage servicing rights pledged to secure notes
payable $ 459,741
(1) Excludes the effect of amortization of commitment fees of $1.6 million for the year ended December 31, 2015.

Note 20—Borrowings under Forward Purchase Agreements
There were no borrowings under forward purchase agreements during the year ended December 31, 2015. Following is a summary of financial information relating to borrowings under forward purchase agreements:
Note 21—Asset-Backed Financing of the VIE at Fair Value
Following is a summary of financial information relating to the asset-backed financing of the VIE at fair value:
The asset-backed financing of the VIE at fair value is a non-recourse liability and secured solely by the assets of the VIE and not by any other assets of the Company. The assets of the VIE are the only source of funds for repayment of the certificates.
Note 22—Exchangeable Senior Notes
PMC issued in a private offering $250 million aggregate principal amount of the Exchangeable Notes due May 1, 2020. The Exchangeable Notes bear interest at a rate of 5.375% per year, payable semiannually. The Exchangeable Notes are exchangeable into common shares of the Company at a rate of 33.8667 common shares per $1,000 principal amount of the Exchangeable Notes as of December 31, 2015, which exchange rate increased from the initial exchange rate of 33.5149. The increase in the calculated exchange rate was the result of cumulative cash dividends exceeding the quarterly dividend threshold amount of $0.57 per share as provided in the related indenture.
F-53
Year ended December 31, 2014 2013 (dollars in thousands) During the year:
Weighted-average effective interest rate 2.84% 2.94% Weighted-average balance $ 82,056 $124,394 Interest expense $ 2,364 $ 3,707 Maximum daily amount outstanding $226,848 $244,047
At year end: Balance $ — $226,580 Interest rate 0.00% 3.02% Fair value of underlying loans and REO $ — $226,833
Year ended December 31, 2015 2014 2013 (dollars in thousands) During the year:
Weighted-average fair value $186,430 $167,752 $ 43,108 Interest expense $ 6,840 $ 6,489 $ 1,612 Weighted-average effective interest rate 3.35% 3.82% 3.69%
At year end: Fair value $247,690 $165,920 $165,415 Unpaid principal balance $248,284 $159,736 $167,694 Interest rate 3.50% 3.50% 3.50%
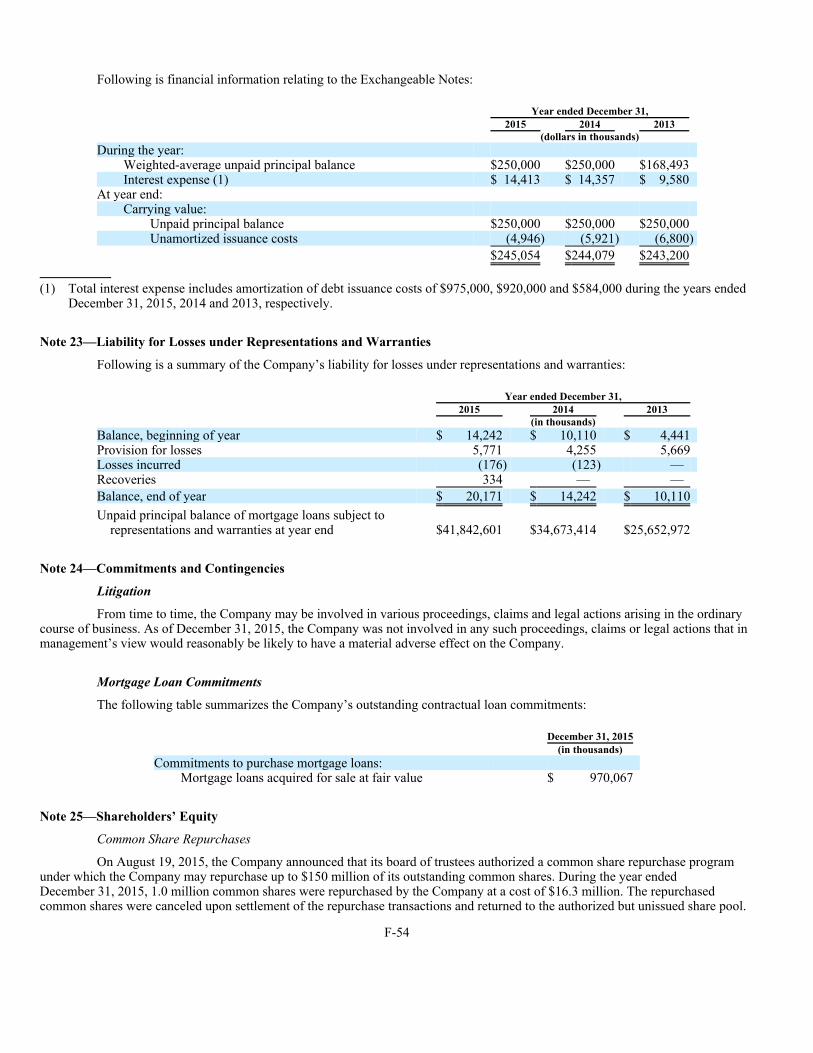
Following is financial information relating to the Exchangeable Notes:
Note 23—Liability for Losses under Representations and Warranties
Following is a summary of the Company’s liability for losses under representations and warranties:
Note 24—Commitments and Contingencies
Litigation
From time to time, the Company may be involved in various proceedings, claims and legal actions arising in the ordinary course of business. As of December 31, 2015, the Company was not involved in any such proceedings, claims or legal actions that in management’s view would reasonably be likely to have a material adverse effect on the Company.
Mortgage Loan Commitments
The following table summarizes the Company’s outstanding contractual loan commitments:
Note 25—Shareholders’ Equity
Common Share Repurchases
On August 19, 2015, the Company announced that its board of trustees authorized a common share repurchase program under which the Company may repurchase up to $150 million of its outstanding common shares. During the year ended December 31, 2015, 1.0 million common shares were repurchased by the Company at a cost of $16.3 million. The repurchased common shares were canceled upon settlement of the repurchase transactions and returned to the authorized but unissued share pool.
F-54
Year ended December 31, 2015 2014 2013 (dollars in thousands) During the year:
Weighted-average unpaid principal balance $250,000 $250,000 $168,493 Interest expense (1) $ 14,413 $ 14,357 $ 9,580
At year end: Carrying value:
Unpaid principal balance $250,000 $250,000 $250,000 Unamortized issuance costs (4,946) (5,921) (6,800)
$245,054 $244,079 $243,200
(1) Total interest expense includes amortization of debt issuance costs of $975,000, $920,000 and $584,000 during the years ended December 31, 2015, 2014 and 2013, respectively.
Year ended December 31, 2015 2014 2013 (in thousands)Balance, beginning of year $ 14,242 $ 10,110 $ 4,441 Provision for losses 5,771 4,255 5,669 Losses incurred (176) (123) — Recoveries 334 — —
Balance, end of year $ 20,171 $ 14,242 $ 10,110
Unpaid principal balance of mortgage loans subject to representations and warranties at year end $41,842,601 $34,673,414 $25,652,972
December 31, 2015 (in thousands) Commitments to purchase mortgage loans:
Mortgage loans acquired for sale at fair value $ 970,067

Common Share Issuances
The Company entered into an ATM Equity Offering Sales AgreementSM on February 12, 2014. During the year ended December 31, 2015, the Company did not sell any common shares under the agreement. During the year ended December 31, 2014, the Company sold a total of 3,817,611 of its common shares at a weighted average price of $23.73 per share, providing net proceeds to the Company of approximately $89.6 million, net of sales commissions of $970,000.
At December 31, 2015 the Company had approximately $106.9 million of common shares available for issuance under its ATM Equity Offering Sales AgreementSM.
On August 13, 2013, the Company issued and sold 11,300,000 common shares in an underwritten public offering and received $249.4 million of proceeds, after underwriting and estimated offering expenses. Proceeds from the issuance of these shares were used to fund the Company’s business and investment activities, including the acquisition of distressed mortgage loans and other investments; the funding of its correspondent production business, including the purchase of jumbo loans; the repayment of indebtedness; and for general corporate purposes.
As more fully described in Note 4—Transactions with Related Parties, on February 1, 2013, the Company entered into a Reimbursement Agreement, by and among the Company, the Operating Partnership and PCM. The Reimbursement Agreement provides that, to the extent the Company is required to pay PCM performance incentive fees under the management agreement, the Company will reimburse PCM for underwriting costs it paid on the offering date at a rate of $10 in reimbursement for every $100 of performance incentive fees earned. The reimbursement is subject to a maximum reimbursement in any particular 12-month period of $1.0 million, and the maximum amount that may be reimbursed under the agreement is $2.9 million. During the years ended December 31, 2015, 2014 and 2013, $237,000, $651,000 and $944,000 was paid to PCM, respectively.
The Reimbursement Agreement also provides for the payment to the IPO underwriters of the amount that the Company agreed to pay to them at the time of the IPO if the Company satisfied certain performance measures over a specified period of time. As PCM earns performance incentive fees under the management agreement, the IPO underwriters will be paid at a rate of $20 of payments for every $100 of performance incentive fees earned by PCM. The payment to the underwriters is subject to a maximum reimbursement in any particular 12-month period of $2.0 million and the maximum amount that may be paid under the agreement is $5.9 million. During the years ended December 31, 2015, 2014 and 2013, $473,000, $1.7 million, and $1.9 million, respectively was paid to the underwriters. The Reimbursement Agreement expires on February 1, 2019.
Note 26—Net Gain on Mortgage Loans Acquired for Sale
Net gain on mortgage loans acquired for sale is summarized below:
F-55
Year ended December 31, 2015 2014 2013 (in thousands) Cash (loss) gain:
Mortgage loans $ (76,914) $ (20,989) $(197,580) Hedging activities (17,742) (57,161) 136,829
(94,656) (78,150) (60,751)
Non cash (loss) gain: Receipt of MSRs in loan sale transactions 154,474 121,333 183,032 Provision for losses relating to representations and warranties
provided in loan sales (5,771) (4,255) (5,669) Change in fair value during the year of financial instruments
held at year end: IRLCs (1,015) 4,412 (18,230) Mortgage loans (2,977) 3,825 (9,265) Hedging derivatives 961 (11,518) 9,552
(3,031) (3,281) (17,943)
$ 51,016 $ 35,647 $ 98,669

Note 27—Net Interest Income
Net interest income is summarized for the years presented below:
F-56
Year ended December 31, 2015 2014 2013 (in thousands)Interest income:
From nonaffiliates: Short-term investments $ 815 $ 604 $ 542 Mortgage-backed securities 10,267 8,226 2,138 Agency debt security — — 222 Mortgage loans acquired for sale at fair value 48,281 23,974 33,726 Mortgage loans at fair value 96,536 100,340 75,759 Mortgage loans under forward purchase agreements — 3,584 3,659 Mortgage loans at fair value held by VIE 19,903 22,280 5,516 Other 178 48 209
175,980 159,056 121,771 From PFSI:
Excess servicing spread purchased from PFSI, at fair value 25,365 13,292 1,091
201,345 172,348 122,862
Interest expense: From nonaffiliates:
Assets sold under agreements to repurchase 79,869 58,304 47,790 Mortgage loans participation and sale agreement 1,001 912 — FHLB advances 275 — — Notes payable 6,826 — — Asset-backed financings of VIEs at fair value(1) 13,754 6,490 1,612 Exchangeable senior notes 14,413 14,358 9,580 Borrowings under forward purchase agreements — 2,363 3,707 Interest shortfall on repayments of mortgage loans
serviced for Agency securitizations 4,207 2,004 1,694 Interest on mortgage loan impound deposits 1,020 1,158 839
121,365 85,589 65,222 From PFSI:
Note payable to PFSI 3,343 — —
124,708 85,589 65,222
Net interest income $ 76,637 $ 86,759 $ 57,640
(1) Includes interest expense from Asset-backed financing of the VIE at fair value and CRT Agreements financing at fair value.
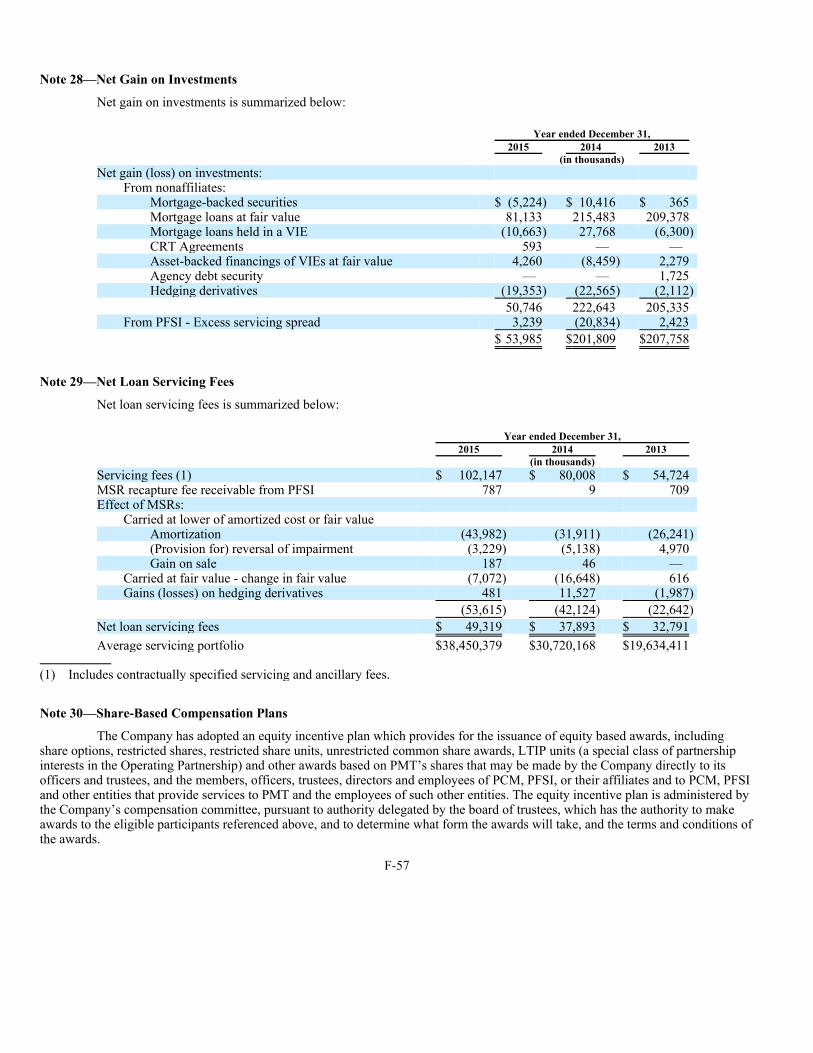
Note 28—Net Gain on Investments
Net gain on investments is summarized below:
Note 29—Net Loan Servicing Fees
Net loan servicing fees is summarized below:
Note 30—Share-Based Compensation Plans
The Company has adopted an equity incentive plan which provides for the issuance of equity based awards, including share options, restricted shares, restricted share units, unrestricted common share awards, LTIP units (a special class of partnership interests in the Operating Partnership) and other awards based on PMT’s shares that may be made by the Company directly to its officers and trustees, and the members, officers, trustees, directors and employees of PCM, PFSI, or their affiliates and to PCM, PFSI and other entities that provide services to PMT and the employees of such other entities. The equity incentive plan is administered by the Company’s compensation committee, pursuant to authority delegated by the board of trustees, which has the authority to make awards to the eligible participants referenced above, and to determine what form the awards will take, and the terms and conditions of the awards.
F-57
Year ended December 31, 2015 2014 2013 (in thousands) Net gain (loss) on investments:
From nonaffiliates: Mortgage-backed securities $ (5,224) $ 10,416 $ 365 Mortgage loans at fair value 81,133 215,483 209,378 Mortgage loans held in a VIE (10,663) 27,768 (6,300) CRT Agreements 593 — — Asset-backed financings of VIEs at fair value 4,260 (8,459) 2,279 Agency debt security — — 1,725 Hedging derivatives (19,353) (22,565) (2,112)
50,746 222,643 205,335 From PFSI - Excess servicing spread 3,239 (20,834) 2,423
$ 53,985 $201,809 $207,758
Year ended December 31, 2015 2014 2013 (in thousands) Servicing fees (1) $ 102,147 $ 80,008 $ 54,724 MSR recapture fee receivable from PFSI 787 9 709 Effect of MSRs:
Carried at lower of amortized cost or fair value Amortization (43,982) (31,911) (26,241) (Provision for) reversal of impairment (3,229) (5,138) 4,970 Gain on sale 187 46 —
Carried at fair value - change in fair value (7,072) (16,648) 616 Gains (losses) on hedging derivatives 481 11,527 (1,987)
(53,615) (42,124) (22,642)
Net loan servicing fees $ 49,319 $ 37,893 $ 32,791
Average servicing portfolio $38,450,379 $30,720,168 $19,634,411
(1) Includes contractually specified servicing and ancillary fees.

The Company’s equity incentive plan allows for grants of share-based awards up to an aggregate of 8% of PMT’s issued and outstanding shares on a diluted basis at the time of the award.
The shares underlying award grants will again be available for award under the equity incentive plan if:
Restricted share units have been awarded to trustees and officers of the Company and to employees of PCM and PFSI at no cost to the grantees. Such awards generally vest over a one- to four-year period.
The Company’s estimate of fair value includes assumed grantee vesting rates of 100% per year.
The table below summarizes restricted share unit activity and compensation expense:
As of December 31, 2015, 733,531 restricted share units with a weighted average grant date fair value of $21.26 per share unit are expected to vest over their average remaining vesting period of 20 months. The grant date fair values of share unit awards are based on the market value of the Company’s stock at the date of grant.
F-58
• any shares subject to an award granted under the equity incentive plan are forfeited, canceled, exchanged or surrendered;
• an award terminates or expires without a distribution of shares to the participant; or
• shares are surrendered or withheld by PMT as payment of either the exercise price of an award and/or withholding taxes for an award.
Year ended December 31, 2015 2014 2013
Number of units: Outstanding at beginning of year 725,412 661,372 665,617
Granted 310,636 300,131 255,445 Vested (301,763) (234,466) (253,509) Canceled (500) (1,625) (6,181)
Outstanding at end of year 733,785 725,412 661,372
Weighted Average Grant Date Fair Value: Outstanding at beginning of year $ 21.00 $ 19.95 $ 15.92
Granted $ 21.06 $ 21.05 $ 23.91 Vested $ 19.65 $ 19.68 $ 13.40 Expired or canceled $ 21.29 $ 18.74 $ 20.06
Outstanding at end of year $ 21.26 $ 21.00 $ 19.95 Compensation expense recorded during the year $6,345,000 $7,107,000 $6,763,000 Fair value of vested units during the year $5,928,569 $4,615,298 $3,727,420 Year end:
Units available for future awards (1) 5,226,312 5,293,433 5,029,174 Unamortized compensation cost $5,464,829 $7,023,418 $6,178,000
(1) Based on shares outstanding as of December 31, 2015. Total units available for future awards may be adjusted in accordance
with the equity incentive plan based on future issuances of PMT’s shares as described above.

Note 31—Other Expenses
Other expenses are summarized below:
Note 32—Income Taxes
The Company has elected to be taxed as a REIT for U.S. federal income tax purposes under Sections 856 through 860 of the Internal Revenue Code. Therefore, PMT generally will not be subject to corporate federal or state income tax to the extent that qualifying distributions are made to shareholders and the Company meets REIT requirements including certain asset, income, distribution and share ownership tests. The Company believes that it has met the distribution requirements, as it has declared dividends sufficient to distribute substantially all of its taxable income. Taxable income will generally differ from net income. The primary differences between net income and the REIT taxable income (before deduction for qualifying distributions) are the taxable income of the taxable REIT subsidiary (“TRS”) and the method of determining the income or loss related to valuation of the mortgage loans owned by the qualified REIT subsidiary (“QRS”).
In general, cash dividends declared by the Company will be considered ordinary income to the shareholders for income tax purposes. Some portion of the dividends may be characterized as capital gain distributions or a return of capital. The approximate tax characterization of the Company’s distributions is as follows:
The Company had elected to treat two of its subsidiaries as TRSs. In the quarter ended September 30, 2012, the Company revoked the election to treat its wholly owned subsidiary that is the sole general partner of the Operating Partnership as a TRS. As a result, beginning September 1, 2012, one subsidiary, PMC, is treated as a TRS. Income from a TRS is only included as a component of REIT taxable income to the extent that the TRS makes dividend distributions of income to the REIT. No such dividend distributions have been made to date. A TRS is subject to corporate federal and state income tax. Accordingly, a provision for income taxes for PMC and, for the periods for which TRS treatment had been elected, the sole general partner of the Operating Partnership is included in the Consolidated Statements of Income.
The Company files U.S. federal and state income tax returns for both the REIT and TRSs. These federal income tax returns for 2012 and forward are subject to examination. The Company’s state income tax returns are generally subject to examination for 2011 and forward. No returns are currently under examination.
F-59
Year ended December 31, 2015 2014 2013 (in thousands)Common overhead allocation from PFSI (1) $10,742 $10,477 $10,423 Loan origination 4,686 2,638 4,584 Insurance 1,304 989 890 Technology 1,279 984 826 Securitization — (150) 1,742 Other expenses 3,146 2,463 2,735
$21,157 $17,401 $21,200
(1) For the year ended December 31, 2015, in accordance with the terms of the management agreement, PCM provided the Company discretionary waivers of $1.6 million of overhead expenses that otherwise would have been allocable to the Company. On December 15, 2015, the Company amended its management agreement to provide that the total costs and expenses incurred by PFSI in any quarter and reimbursable by the Company is capped at an amount equal to the quotient of (i) the product of (A) 70 basis points (0.0070), multiplied by (B) shareholders’ equity (as defined in the management agreement) as of the last day of such quarter, divided by (ii) four (4).
Year ended December 31, Ordinary
incomeLong term capital gain
Return ofcapital
2015 41% 25% 34% 2014 86% 14% 0% 2013 83% 17% 0%
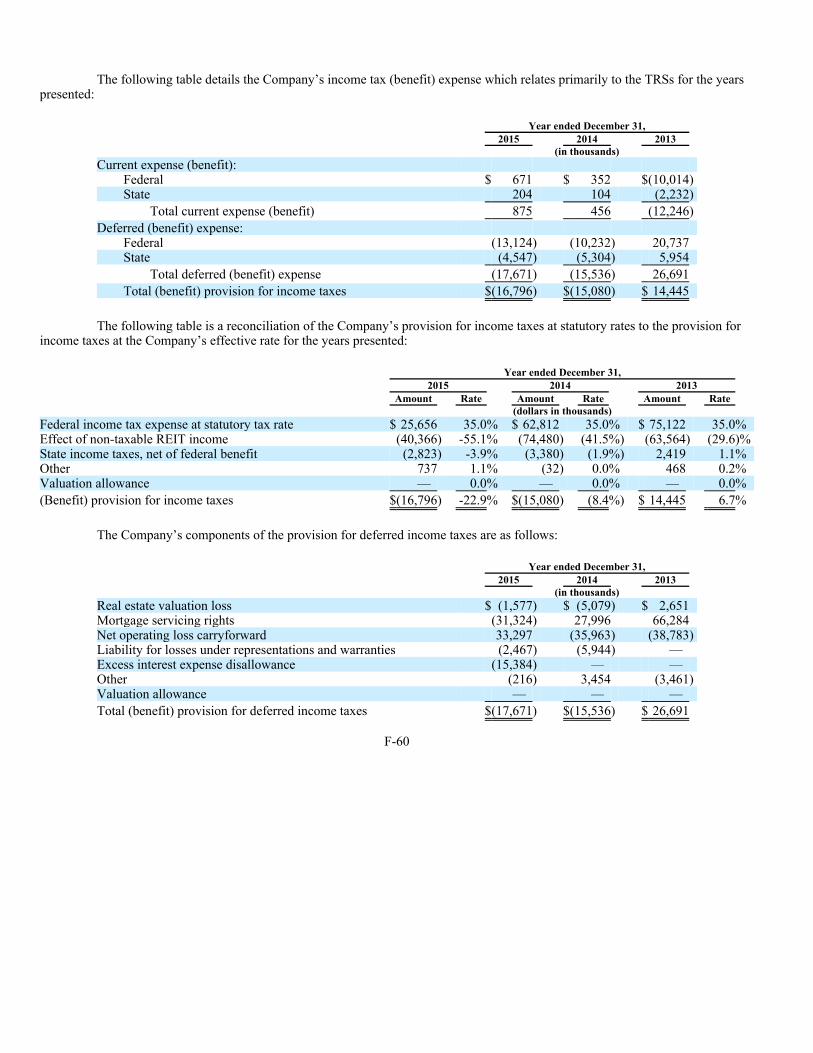
The following table details the Company’s income tax (benefit) expense which relates primarily to the TRSs for the years presented:
The following table is a reconciliation of the Company’s provision for income taxes at statutory rates to the provision for income taxes at the Company’s effective rate for the years presented:
The Company’s components of the provision for deferred income taxes are as follows:
F-60
Year ended December 31, 2015 2014 2013 (in thousands) Current expense (benefit):
Federal $ 671 $ 352 $(10,014) State 204 104 (2,232)
Total current expense (benefit) 875 456 (12,246)
Deferred (benefit) expense: Federal (13,124) (10,232) 20,737 State (4,547) (5,304) 5,954
Total deferred (benefit) expense (17,671) (15,536) 26,691
Total (benefit) provision for income taxes $(16,796) $(15,080) $ 14,445
Year ended December 31, 2015 2014 2013 Amount Rate Amount Rate Amount Rate (dollars in thousands)Federal income tax expense at statutory tax rate $ 25,656 35.0% $ 62,812 35.0% $ 75,122 35.0% Effect of non-taxable REIT income (40,366) -55.1% (74,480) (41.5%) (63,564) (29.6)% State income taxes, net of federal benefit (2,823) -3.9% (3,380) (1.9%) 2,419 1.1% Other 737 1.1% (32) 0.0% 468 0.2% Valuation allowance — 0.0% — 0.0% — 0.0%
(Benefit) provision for income taxes $(16,796) -22.9% $(15,080) (8.4%) $ 14,445 6.7%
Year ended December 31, 2015 2014 2013 (in thousands) Real estate valuation loss $ (1,577) $ (5,079) $ 2,651 Mortgage servicing rights (31,324) 27,996 66,284 Net operating loss carryforward 33,297 (35,963) (38,783) Liability for losses under representations and warranties (2,467) (5,944) — Excess interest expense disallowance (15,384) — — Other (216) 3,454 (3,461) Valuation allowance — — —
Total (benefit) provision for deferred income taxes $(17,671) $(15,536) $ 26,691
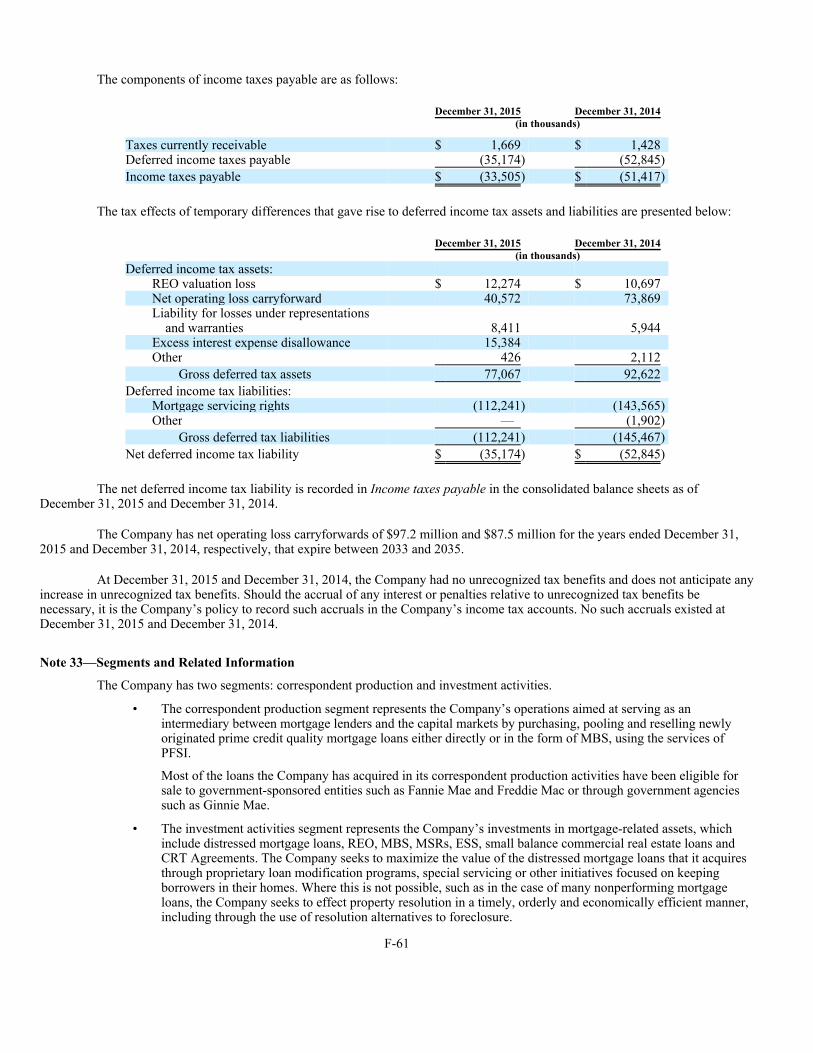
The components of income taxes payable are as follows:
The tax effects of temporary differences that gave rise to deferred income tax assets and liabilities are presented below:
The net deferred income tax liability is recorded in Income taxes payable in the consolidated balance sheets as of December 31, 2015 and December 31, 2014.
The Company has net operating loss carryforwards of $97.2 million and $87.5 million for the years ended December 31, 2015 and December 31, 2014, respectively, that expire between 2033 and 2035.
At December 31, 2015 and December 31, 2014, the Company had no unrecognized tax benefits and does not anticipate any increase in unrecognized tax benefits. Should the accrual of any interest or penalties relative to unrecognized tax benefits be necessary, it is the Company’s policy to record such accruals in the Company’s income tax accounts. No such accruals existed at December 31, 2015 and December 31, 2014.
Note 33—Segments and Related Information
The Company has two segments: correspondent production and investment activities.
Most of the loans the Company has acquired in its correspondent production activities have been eligible for sale to government-sponsored entities such as Fannie Mae and Freddie Mac or through government agencies such as Ginnie Mae.
F-61
December 31, 2015 December 31, 2014 (in thousands)
Taxes currently receivable $ 1,669 $ 1,428 Deferred income taxes payable (35,174) (52,845)
Income taxes payable $ (33,505) $ (51,417)
December 31, 2015 December 31, 2014 (in thousands) Deferred income tax assets:
REO valuation loss $ 12,274 $ 10,697 Net operating loss carryforward 40,572 73,869 Liability for losses under representations
and warranties 8,411 5,944 Excess interest expense disallowance 15,384 Other 426 2,112
Gross deferred tax assets 77,067 92,622
Deferred income tax liabilities: Mortgage servicing rights (112,241) (143,565) Other — (1,902)
Gross deferred tax liabilities (112,241) (145,467)
Net deferred income tax liability $ (35,174) $ (52,845)
• The correspondent production segment represents the Company’s operations aimed at serving as an intermediary between mortgage lenders and the capital markets by purchasing, pooling and reselling newly originated prime credit quality mortgage loans either directly or in the form of MBS, using the services of PFSI.
• The investment activities segment represents the Company’s investments in mortgage-related assets, which include distressed mortgage loans, REO, MBS, MSRs, ESS, small balance commercial real estate loans and CRT Agreements. The Company seeks to maximize the value of the distressed mortgage loans that it acquires through proprietary loan modification programs, special servicing or other initiatives focused on keeping borrowers in their homes. Where this is not possible, such as in the case of many nonperforming mortgage loans, the Company seeks to effect property resolution in a timely, orderly and economically efficient manner, including through the use of resolution alternatives to foreclosure.

Financial highlights by operating segment are summarized below:
F-62
Year ended December 31, 2015 Correspondent
production Investment
activities Intersegment
elimination & other Total (in thousands)Net investment income:
Interest income $ 39,976 $ 161,369 $ — $ 201,345 Interest expense (19,843) (104,865) — (124,708)
20,133 56,504 — 76,637 Net gain on mortgage loans acquired for
sale 51,016 — — 51,016 Net gain on investments — 53,985 — 53,985 Net loan servicing fees — 49,319 49,319 Other income (loss) 28,822 (11,014) — 17,808
99,971 148,794 — 248,765
Expenses: Loan fulfillment, servicing and
management fees payable to PFSI 60,619 68,605 — 129,224 Other 6,450 39,787 — 46,237
67,069 108,392 — 175,461
Pre-tax income $ 32,902 $ 40,402 $ — $ 73,304
Total assets at year end $ 1,286,138 $4,540,786 $ — $5,826,924
Year ended December 31, 2014 Correspondent
production Investment
activities Intersegment
elimination & other Total (in thousands)Net investment income:
Interest income $ 24,022 $ 150,714 $ (2,388) $ 172,348 Interest expense (15,899) (72,078) 2,388 (85,589)
8,123 78,636 — 86,759 Net gain on mortgage loans acquired for
sale 35,647 — — 35,647 Net gain on investments — 201,809 — 201,809 Net loan servicing fees — 37,893 37,893 Other income (loss) 18,290 (23,657) — (5,367)
62,060 294,681 — 356,741
Expenses: Loan fulfillment, servicing and
management fees payable to PFSI 49,872 86,404 — 136,276 Other 3,357 37,644 — 41,001
53,229 124,048 — 177,277
Pre-tax income $ 8,831 $ 170,633 $ — $ 179,464
Total assets at year end $ 654,476 $4,242,782 $ — $4,897,258

F-63
Year ended December 31, 2013 Correspondent
production Investment
activities Intersegment
elimination & other Total (in thousands)Net investment income:
Interest income $ 33,727 $ 94,435 $ (5,300) $ 122,862 Interest expense (26,808) (43,714) 5,300 (65,222)
6,919 50,721 — 57,640 Net gain on mortgage loans acquired
for sale 98,669 — — 98,669 Net gain on investments — 207,758 — 207,758 Net loan servicing fees — 32,791 32,791 Other income (loss) 17,715 (9,055) — 8,660
123,303 282,215 — 405,518
Expenses: Loan fulfillment, servicing and
management fees payable to PFSI 78,552 69,699 3,284(1) 151,535 Other 861 38,487 — 39,348
79,413 108,186 3,284 190,883
Pre-tax (loss) income $ 43,890 $ 174,029 $ (3,284) $ 214,635
Total assets at year end $ 472,089 $3,831,385 $ — $4,303,474
(1) Corporate absorption of fulfillment fees for transition adjustment related to the amended and restated management agreement effective February 1, 2013.

Note 34—Selected Quarterly Results (Unaudited)
Following is a presentation of selected quarterly financial data:
F-64
Quarter ended 2015 2014 Dec. 31 Sept. 30 June 30 Mar. 31 Dec. 31 Sept. 30 June 30 Mar. 31 (dollars in thousands, except per share data)For the quarter ended: Net investment income $ 50,569 $ 90,774 $ 69,765 $ 37,657 $ 53,059 $ 106,530 $ 120,556 $ 76,595 Net income $ 15,709 $ 38,812 $ 28,071 $ 7,508 $ 26,511 $ 54,949 $ 75,211 $ 37,873 Earnings per share:
Basic $ 0.21 $ 0.51 $ 0.37 $ 0.09 $ 0.35 $ 0.74 $ 1.01 $ 0.52 Diluted $ 0.21 $ 0.49 $ 0.36 $ 0.09 $ 0.34 $ 0.69 $ 0.93 $ 0.50
Cash dividends declared per share $ 0.47 $ 0.47 $ 0.61 $ 0.61 $ 0.61 $ 0.61 $ 0.59 $ 0.59 At period end:
Short-term investments at fair value $ 41,865 $ 31,518 $ 32,417 $ 44,949 $ 139,900 $ 37,452 $ 104,453 $ 91,338 Investment securities at fair value 322,473 315,599 287,626 316,292 307,363 267,885 218,725 198,110 Mortgage loans at fair value(1) 3,839,583 3,688,026 4,944,694 4,226,290 3,364,674 3,250,761 3,606,906 3,156,041 Excess servicing spread 412,425 418,573 359,102 222,309 191,166 187,368 190,244 151,019 Real estate acquired in
settlement of loans(2) 341,846 353,563 324,278 317,536 303,228 275,185 240,471 186,877 Real estate held for investment 8,796 4,448 1,544 — — — — — Mortgage servicing rights(3) 459,741 423,095 394,737 359,160 357,780 345,848 315,484 301,427 Other assets 400,195 357,409 332,976 243,991 233,147 233,519 186,187 135,041
Total assets $5,826,924 $5,592,231 $6,677,374 $5,730,527 $4,897,258 $4,598,018 $4,862,470 $4,219,853
Assets sold under agreements to repurchase and mortgage loan participation and sale agreement $3,128,780 $2,925,110 $3,571,181 $3,633,922 $2,749,249 $2,416,047 $2,700,868 $1,886,710
Federal Home Loan Bank advances 183,000 183,000 138,400 — — — — —
Credit risk transfer financing at fair value — — 649,120 — — — — —
Notes payable 236,015 192,332 244,878 — — — — — Borrowings under forward purchase
agreements — — — — — — — 216,614 Asset-backed financing of a VIE at
fair value 247,690 234,287 151,489 162,222 165,920 166,841 170,201 166,514 Exchangeable senior notes 245,054 244,805 244,559 244,317 244,079 243,844 243,612 243,384 Other liabilities 290,272 298,267 152,450 147,907 159,838 183,245 170,629 163,349
Total liabilities 4,330,811 4,077,801 5,152,077 4,188,368 3,319,086 3,009,977 3,285,310 2,676,571
Shareholders’ equity 1,496,113 1,514,430 1,525,297 1,542,159 1,578,172 1,588,041 1,577,160 1,543,282
Total liabilities and shareholders’ equity $5,826,924 $5,592,231 $6,677,374 $5,730,527 $4,897,258 $4,598,018 $4,862,470 $4,219,853
(1) Includes mortgage loans acquired for sale at fair value, mortgage loans at fair value, mortgage loans at fair value held by variable interest entity and mortgage loans under forward purchase agreements at fair value.
(2) Includes REO and REO under forward purchase agreements. (3) Includes mortgage servicing rights at fair value and mortgage servicing rights at lower of amortized cost or fair value.

Note 35—Supplemental Cash Flow Information
Note 36—Regulatory Net Worth
PMC is a seller-servicer for Fannie Mae and Freddie Mac. To retain its status as an approved seller-servicer, PMC is required to meet Fannie Mae’s and Freddie Mac’s capital standards, which require PMC to maintain a minimum net worth of $59.2 million and $30.9 million, respectively. The Manager believes PMC complies with Fannie Mae’s and Freddie Mac’s net worth requirement as of December 31, 2015.
Note 37—Recently Issued Accounting Pronouncements
In February 2015, the FASB issued ASU 2015-02, Consolidation (Topic 810): Amendments to the Consolidation Analysis (“ASU 2015-02”). ASU 2015-02 affects reporting entities that are required to evaluate whether they should consolidate certain legal entities. ASU 2015-02 modifies the evaluation of whether limited partnerships and similar legal entities are VIEs or voting interest entities, eliminates the presumption that a general partner should consolidate a limited partnership and affects the consolidation analysis of reporting entities that are involved with VIEs, particularly those that have fee arrangements and related party relationships. ASU 2015-02 is effective for fiscal years, and for interim periods within those fiscal years, beginning after December 15, 2015. Early adoption is permitted. A reporting entity may apply the amendments in ASU 2015-02: (a) using a modified retrospective approach by recording a cumulative-effect adjustment to equity as of the beginning of the fiscal year of adoption; or (b) by applying the amendments retrospectively. The Company is currently assessing the potential effect that the adoption of ASU 2015-02 will have on its consolidated financial statements.
In April 2015, the FASB issued ASU No. 2015-03. The amendments in this ASU require that debt issuance costs related to a recognized debt liability be presented in the balance sheet as a direct deduction from the carrying amount of that debt liability, consistent with debt discounts. The recognition and measurement guidance for debt issuance costs are not affected by the amendments in this ASU. ASU 2015-03 should be applied on a retrospective basis and is effective for the Company for financial statements issued for fiscal years and interim periods within those fiscal years beginning after December 15, 2015.
F-65
Year ended December 31, 2015 2014 2013 (in thousands) Cash paid for interest $117,223 $ 94,116 $ 67,374 Income tax paid (refunded), net $ 1,116 $ (6,562) $ (9,200) Non-cash investing activities:
Receipt of MSRs as proceeds from sales of loans $154,474 $121,333 $183,032 Transfer of mortgage loans acquired for sale at fair value to
mortgage loans at fair value held by variable interest entity $ — $ — $536,776 Transfer of mortgage loans and advances to real estate acquired in
settlement of loans $307,455 $364,945 $185,061 Transfers of mortgage loans acquired for sale to mortgage loans at
fair value $ 23,859 $ — $ — Purchase of mortgage loans financed through forward purchase
agreements $ — $ 2,828 $246,605 Transfer of mortgage loans under forward purchase agreements to
mortgage loans at fair value $ — $205,902 $ 15,347 Transfer of mortgage loans under forward purchase agreements and
advances to REO under forward purchase agreements $ — $ 9,369 $ 9,922 Purchase of REO financed through forward purchase agreements $ — $ 68 $ 4 Transfer of real estate acquired in settlement of mortgage loans to
real estate held for investment $ 8,827 $ — $ — Receipt of ESS pursuant to recapture agreement with PFSI $ 6,728 $ 7,343 $ — Transfer of REO under forward purchase agreements to REO $ — $ 12,737 $ 117
Non-cash financing activities: Purchase of mortgage loans financed through forward purchase
agreements $ — $ 2,828 $246,605 Purchase of REO financed through forward purchase agreements $ — $ 68 $ 4 Transfer of mortgage loans at fair value financed through
agreements to repurchase to REO financed under agreements to repurchase $ 85,134 $ 2,731 $ 44,395
Dividends payable $ 35,069 $ 45,894 $ 41,570
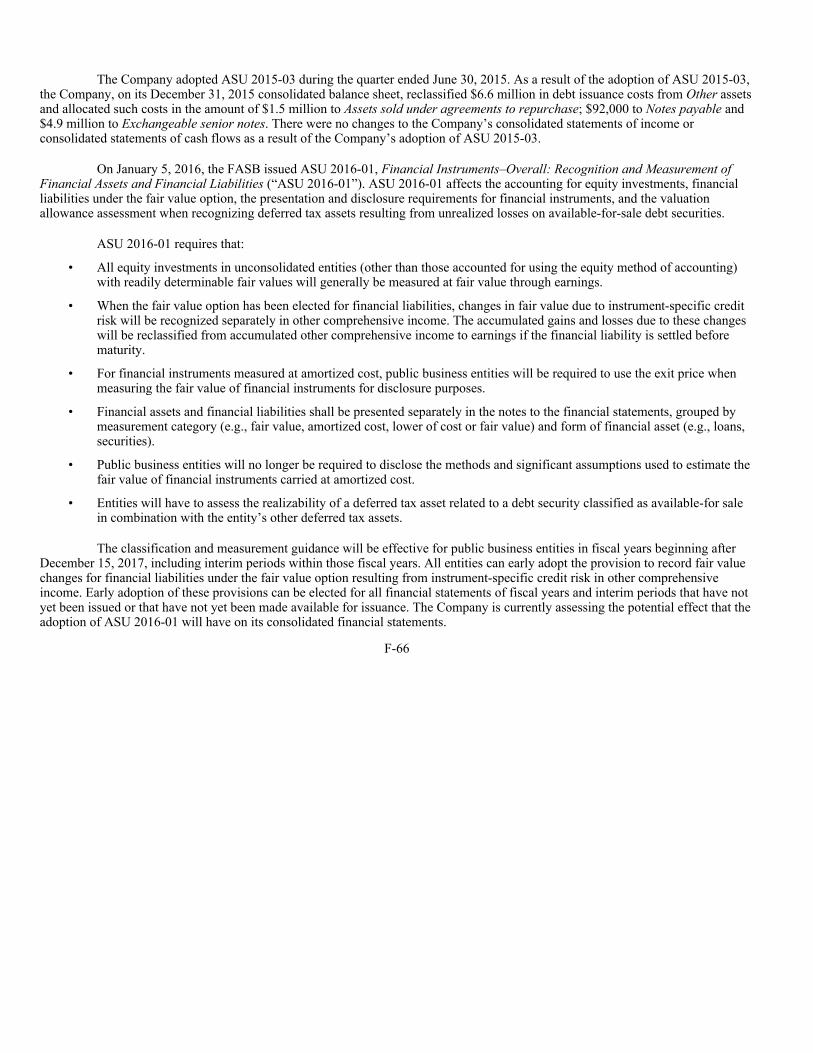
The Company adopted ASU 2015-03 during the quarter ended June 30, 2015. As a result of the adoption of ASU 2015-03, the Company, on its December 31, 2015 consolidated balance sheet, reclassified $6.6 million in debt issuance costs from Other assets and allocated such costs in the amount of $1.5 million to Assets sold under agreements to repurchase; $92,000 to Notes payable and $4.9 million to Exchangeable senior notes. There were no changes to the Company’s consolidated statements of income or consolidated statements of cash flows as a result of the Company’s adoption of ASU 2015-03.
On January 5, 2016, the FASB issued ASU 2016-01, Financial Instruments–Overall: Recognition and Measurement of Financial Assets and Financial Liabilities (“ASU 2016-01”). ASU 2016-01 affects the accounting for equity investments, financial liabilities under the fair value option, the presentation and disclosure requirements for financial instruments, and the valuation allowance assessment when recognizing deferred tax assets resulting from unrealized losses on available-for-sale debt securities.
ASU 2016-01 requires that:
The classification and measurement guidance will be effective for public business entities in fiscal years beginning after December 15, 2017, including interim periods within those fiscal years. All entities can early adopt the provision to record fair value changes for financial liabilities under the fair value option resulting from instrument-specific credit risk in other comprehensive income. Early adoption of these provisions can be elected for all financial statements of fiscal years and interim periods that have not yet been issued or that have not yet been made available for issuance. The Company is currently assessing the potential effect that the adoption of ASU 2016-01 will have on its consolidated financial statements.
F-66
• All equity investments in unconsolidated entities (other than those accounted for using the equity method of accounting) with readily determinable fair values will generally be measured at fair value through earnings.
• When the fair value option has been elected for financial liabilities, changes in fair value due to instrument-specific credit risk will be recognized separately in other comprehensive income. The accumulated gains and losses due to these changes will be reclassified from accumulated other comprehensive income to earnings if the financial liability is settled before maturity.
• For financial instruments measured at amortized cost, public business entities will be required to use the exit price when measuring the fair value of financial instruments for disclosure purposes.
• Financial assets and financial liabilities shall be presented separately in the notes to the financial statements, grouped by
measurement category (e.g., fair value, amortized cost, lower of cost or fair value) and form of financial asset (e.g., loans, securities).
• Public business entities will no longer be required to disclose the methods and significant assumptions used to estimate the fair value of financial instruments carried at amortized cost.
• Entities will have to assess the realizability of a deferred tax asset related to a debt security classified as available-for sale in combination with the entity’s other deferred tax assets.
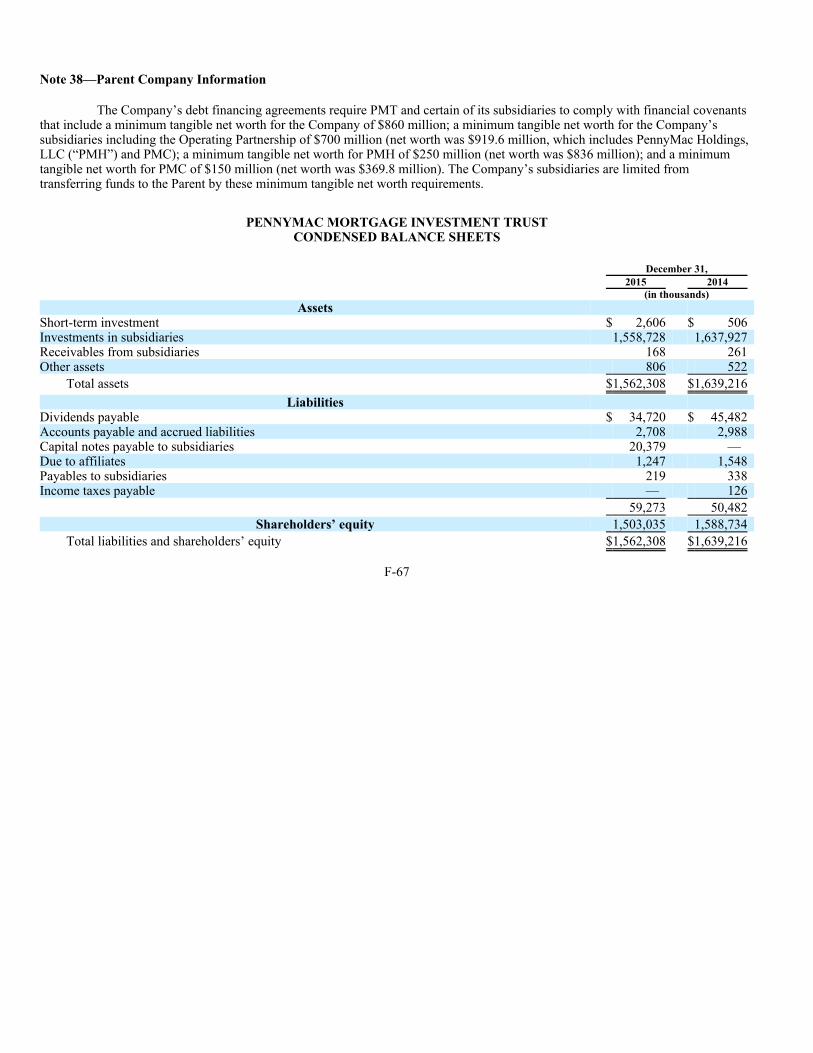
Note 38—Parent Company Information
The Company’s debt financing agreements require PMT and certain of its subsidiaries to comply with financial covenants that include a minimum tangible net worth for the Company of $860 million; a minimum tangible net worth for the Company’s subsidiaries including the Operating Partnership of $700 million (net worth was $919.6 million, which includes PennyMac Holdings, LLC (“PMH”) and PMC); a minimum tangible net worth for PMH of $250 million (net worth was $836 million); and a minimum tangible net worth for PMC of $150 million (net worth was $369.8 million). The Company’s subsidiaries are limited from transferring funds to the Parent by these minimum tangible net worth requirements.
PENNYMAC MORTGAGE INVESTMENT TRUST CONDENSED BALANCE SHEETS
F-67
December 31, 2015 2014 (in thousands)
Assets Short-term investment $ 2,606 $ 506 Investments in subsidiaries 1,558,728 1,637,927 Receivables from subsidiaries 168 261 Other assets 806 522
Total assets $1,562,308 $1,639,216
Liabilities Dividends payable $ 34,720 $ 45,482 Accounts payable and accrued liabilities 2,708 2,988 Capital notes payable to subsidiaries 20,379 — Due to affiliates 1,247 1,548 Payables to subsidiaries 219 338 Income taxes payable — 126
59,273 50,482
Shareholders’ equity 1,503,035 1,588,734
Total liabilities and shareholders’ equity $1,562,308 $1,639,216
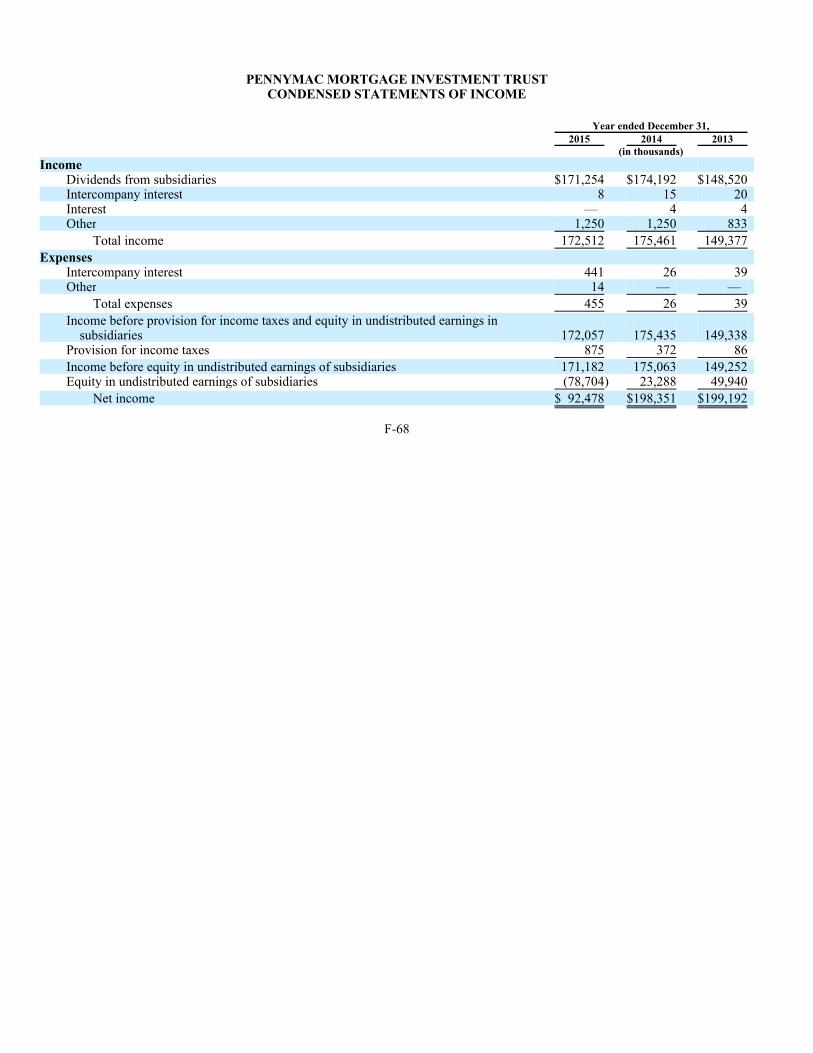
PENNYMAC MORTGAGE INVESTMENT TRUST CONDENSED STATEMENTS OF INCOME
F-68
Year ended December 31, 2015 2014 2013 (in thousands)Income
Dividends from subsidiaries $171,254 $174,192 $148,520 Intercompany interest 8 15 20 Interest — 4 4 Other 1,250 1,250 833
Total income 172,512 175,461 149,377
Expenses Intercompany interest 441 26 39 Other 14 — —
Total expenses 455 26 39
Income before provision for income taxes and equity in undistributed earnings in subsidiaries 172,057 175,435 149,338
Provision for income taxes 875 372 86
Income before equity in undistributed earnings of subsidiaries 171,182 175,063 149,252 Equity in undistributed earnings of subsidiaries (78,704) 23,288 49,940
Net income $ 92,478 $198,351 $199,192

PENNYMAC MORTGAGE INVESTMENT TRUST CONDENSED STATEMENTS OF CASH FLOWS
Note 39—Subsequent Events
The Manager has evaluated all events and transactions through the date the Company issued these consolidated financial statements. During this period:
For captive insurance companies that became members since the rule was proposed in 2014, including Copper Insurance, LLC, membership must be terminated within one year, and no additional advances may be made. Accordingly, the Company has repaid $83.0 million of the advances outstanding and expects to repay the unpaid balance outstanding at February 25, 2016, of $100.0 million on or before its maturity on March 3, 2016.
F-69
Year ended December 31, 2015 2014 2013 (in thousands)Cash flows from operating activities:
Net income $ 92,478 $ 198,351 $ 199,192 Equity in undistributed earnings of subsidiaries 78,704 (23,288) (49,940) Decrease (increase) in receivables from subsidiaries 915 107 (16) Increase in other assets (284) (1) (316) Decrease in accounts payable and accrued liabilities (257) (837) (2,582) Decrease in due to affiliates (238) (652) (1,169) (Decrease) increase payable to subsidiaries (119) (40) 314 (Decrease) increase in income taxes payable (126) 59 67
Net cash provided by operating activities 171,073 173,699 145,550
Cash flows from investing activities: Increase in investment in subsidiaries — (89,618) (249,315) (Increase) decrease in short-term investment (2,100) 834 2,059
Net cash used by investing activities (2,100) (88,784) (247,256)
Cash flows from financing activities: Net increase in intercompany unsecured note payable to PMT subsidiary 20,379 — — Issuance of common shares 8 90,588 261,595 Payment of common share underwriting and offering costs — (1,070) (12,321) Repurchases of common shares (16,338) — — Payment of dividends (173,022) (174,433) (147,568)
Net cash provided (used) by financing activities (168,973) (84,915) 101,706
Net change in cash — — — Cash at beginning of year — — —
Cash at end of year $ — $ — $ —
Non-cash financing activity — dividends payable $ 35,069 $ 45,894 $ 41,570
• On January 8, 2016, the Company sold an additional $62.2 million in certificates issued under PMT Loan Trust 2013-J1, thereby reducing the certificates retained by the Company to $146.3 million.
• On January 12, 2016, the FHFA issued a final rule establishing new requirements for membership in the FHLBanks. The
final rule excludes captive insurance companies such as the Company’s insurance subsidiary, Copper Insurance, LLC from membership.

F-70
• During February 2016, the Company repurchased 2.9 million common shares at a cost of $34.1 million under the common share repurchase program described in Note 25 to the consolidated financial statements. The repurchased common shares were canceled upon settlement of the repurchase transactions and returned to the authorized but unissued share pool. In February 2016, the Company’s board of trustees also approved an increase to its share repurchase program pursuant to which the Company is now authorized to repurchase up to $200 million of its common shares.

SIGNATURES
Pursuant to the requirements of Section 13 or 15(d) of the Securities Exchange Act of 1934, the registrant has duly caused this report to be signed on its behalf by the undersigned, thereunto duly authorized.
Dated: February 29, 2016
Pursuant to the requirements of the Securities Exchange Act of 1934, this report has been signed by the following persons on behalf of the registrant in the capacities and on the dates indicated.
PENNYMAC MORTGAGE INVESTMENT TRUST
By: /s/ Stanford L. Kurland Stanford L. Kurland,
Chairman of the Board of Trustees and Chief Executive Officer
(Principal Executive Officer)
Signatures Title Date
/s/ Stanford L. Kurland Stanford L. Kurland
Chairman of the Board of Trustees and Chief Executive Officer (Principal Executive Officer)
February 29, 2016
/s/ Anne D. McCallion Anne D. McCallion
Chief Financial Officer (Principal Financial Officer)
February 29, 2016
/s/ Gregory L. Hendry Gregory L. Hendry
Chief Accounting Officer (Principal Accounting Officer)
February 29, 2016
/s/ Scott W. Carnahan Scott W. Carnahan
Trustee
February 29, 2016
/s/ Preston DuFauchard Preston DuFauchard
Trustee
February 29, 2016
/s/ Randall D. Hadley Randall D. Hadley
Trustee
February 29, 2016
/s/ Clay A. Halvorsen Clay A. Halvorsen
Trustee
February 29, 2016
/s/ Nancy McAllister Nancy McAllister
Trustee
February 29, 2016
/s/ David A. Spector David A. Spector
Trustee
February 29, 2016
/s/ Stacey D. Stewart Stacey D. Stewart
Trustee
February 29, 2016
/s/ Frank P. Willey Frank P. Willey
Trustee
February 29, 2016