37
ü Plasma diagnostics and abundance determinations for planetary nebulae – current status Xiaowei Liu Department of Astronomy, Peking University

� �� �� � � �
�� � � � � � � � �� � � � � � ��� � � �� � � � � �� � �� � � �
� �� � ! "$# % & ' () *$+ ', -+ !. ' , /10 *$+, /, . ' 2 - %, 34 * ". 5+ . (76 8+ ! 9 % 4 ' : /, 4 3
ü' 9 %, ' ; <>= ? ; 3+ . ?@ @ APlasma diagnostics and abundance determinations
for planetary nebulae – cur rent statusXiaowei Liu
Department of Astronomy, Peking University

� �� �� � � �
�� � � � � � � � �� � � � � � ��� � � �� � � � � �� � �� � � �
The problem
Recombination versus collision excitation
Both disparities are legitimate and of astrophysical origins, rather than caused by observational errors, uncertainties in atomic data or contaminations of (weak) ORLs by excitation mechanisms other than recombination (e.g. fluorescence)
1) T e ORLs/Continua B T e CELs
2)X i+
H + ORLs for C,N,O,Ne C X i+
H + CELs for C,N,O,Ne

� �� �� � � �
�� � � � � � � � �� � � � � � ��� � � �� � � � � �� � �� � � �
Layout
D
Observations
D
Interpretation and evidence for a new component of H-deficient ultra-cold plasma
D
Failure of the paradigm of temperature/density fluctuations
D
Conclusions and what next?
Tsamis et al., 2003, MN, 345, 186; 2004, MN, submitted (12 Galactic, 3 Magellanic)Liu Y., 2004ab, MN, submitted (12 Galactic)Wesson R., et al., 2004, MN, in preparation (23 Galactic)
X.-W. Liu, in Planetary Nebulae: Their evolution and role in the Universe, IAU Symp. 209, eds. S. Kwok, M. Dopita and R. Sutherland, pp.339-346 (2003)

� �� �� � � �
�� � � � � � � � �� � � � � � ��� � � �� � � � � �� � �� � � �Observations

� �� �� � � �
�� � � � � � � � �� � � � � � ��� � � �� � � � � �� � �� � � �
Distribution of ORL/CEL abundance discrepancy factor (adf)
Log adf > 0, i.e. ORL abundance always higher than CEL values Log adf ≈ 0.35 dex, i.e. about a factor of two Largest adf found so far, log adf ≈ 1.9, i.e. about two order of magnitude
Num
ber
of P
Ne
Log adf
adf EF G GH I GJ KL
F G GH I GMN L
53 PNe

� �� �� � � �
�� � � � � � � � �� � � � � � ��� � � �� � � � � �� � �� � � �
Comparison of O/H derived from CELs and from ORLs
[O/H]CEL
≈ 8.5, close to the solar value of 8.69 [O/H]ORL varies from 8.5 to 10 The wide range of adf is entirely caused by variations in [O/H]ORL
[O/H
] OR
L &
[O
/H] C
EL
Log adf
Solar

� �� �� � � �
�� � � � � � � � �� � � � � � ��� � � �� � � � � �� � �� � � �
Correlation between temperature and abundance discrepancy factors
Hf 2-2 Te = 8820 K ([O I I I ]) = 900 K (BJ) O++/H+ = 1.1 10 O4 ([O I I I ]) = 90. 10 O4 (O I I )
Liu et al., 2001, MNRAS, 327, 141-168
Log
adf
(O+
+ /H
+)
Te([O I I I ]) – Te(BJ)

P QR ST U S V
WX YZ [ \] X ^ \_ ` ab \ [_ ^_ ] c�d e X fg ^ h i ^ gj X [b g \ c
Second row elements -- C, N, O and Ne
Log
(C+
+/O
++ )
fro
m C
EL
L
og (
N++
/O++
) fr
om C
EL
Log (C++/O++) from ORL Log (N++/O++) from ORL
k Large values of adf's are found for all abundant second row elements, C, N, O and Nek For a given nebula, adf's for C, N, O and Ne are of similar magnitude, in other words, both CELs and ORLs yield
Comparable C/O, N/O and Ne/O abundance ratios

P QR ST U S V
WX YZ [ \] X ^ \_ ` ab \ [_ ^_ ] c�d e X fg ^ h i ^ gj X [b g \ c
Third row element – magnesium
The large ORL abundance enhancement observed for second row elements is not present for the third row element magnesium.k Depletion onto dust grains unlikely to be significantk Evidence for nuclear processed mater ial?
Mg/
H ≈
Mg++
/H+ d
eriv
ed f
rom
Mg
II λ
4281
OR
L
Log ad f for O++/H+
Solar
M 2-24

P QR ST U S V
WX YZ [ \] X ^ \_ ` ab \ [_ ^_ ] c�d e X fg ^ h i ^ gj X [b g \ c
Nebular diameter and density
Negative correlation between adf and S(Hβ), Ne and E.C.Positive correlation between adf and nebular diameter
Large, low-density (therefore old) PNe have higher adf's (and ∆Te's) than young, compact ones
L
og a
d f
for
O+
+ /H+
Log Ne([S II]) (cm−3)
L
og a
d f
for
O+
+/H
+
Diameter (103 AU)

P QR ST U S V
WX YZ [ \] X ^ \_ ` ab \ [_ ^_ ] c�d e X fg ^ h i ^ gj X [b g \ c
N/O ratio – Type-I and non-Type-I PNe
L
og a
d f
for
O++
/H+
Log N/O from CELsL
og N
/O =
-0.
3 (P
eim
bert
83)
Log
N/O
= -0
.13
(KB
94)
Type-I and non-Type-I PNe have comparable adf's
P QR ST U S V
WX YZ [ \] X ^ \_ ` ab \ [_ ^_ ] c�d e X fg ^ h i ^ gj X [b g \ c
O++/H+
C++/H+
N++/H+
N3+/H+
C3+/H+
Ne++/H+
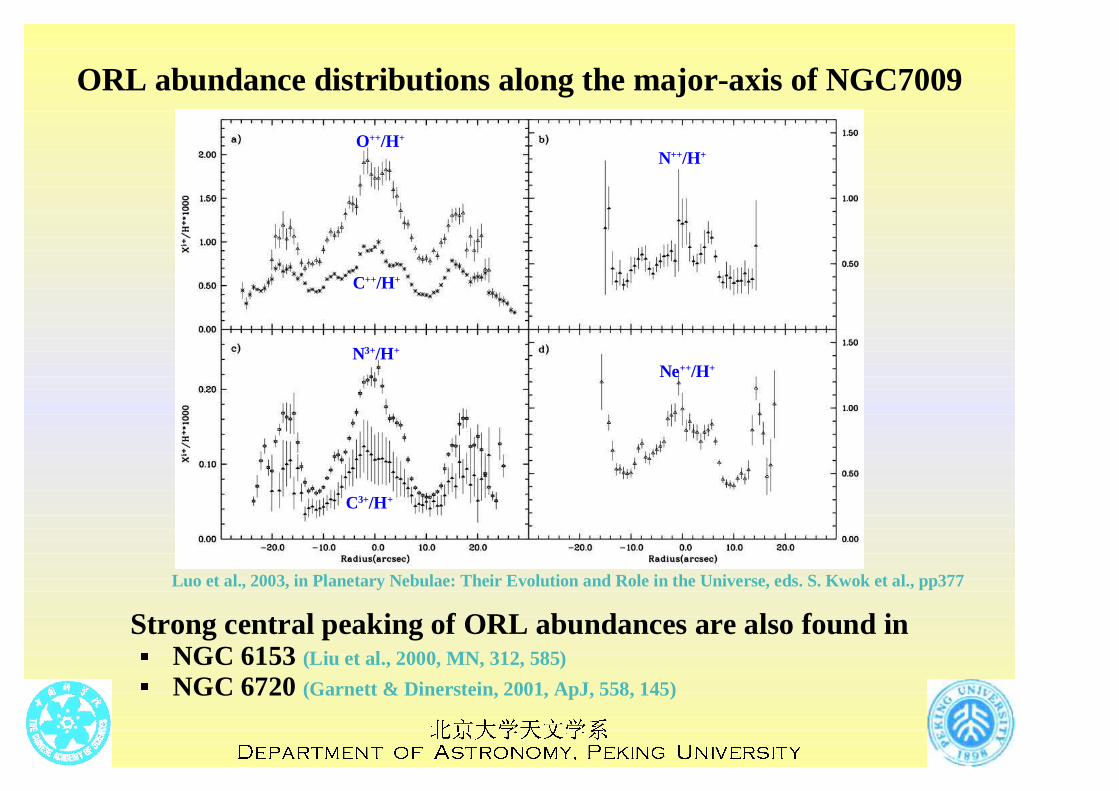
ORL abundance distributions along the major-axis of NGC7009
Luo et al., 2003, in Planetary Nebulae: Their Evolution and Role in the Universe, eds. S. Kwok et al., pp377
Strong central peaking of ORL abundances are also found inl NGC 6153 (Liu et al., 2000, MN, 312, 585)l NGC 6720 (Garnett & Dinerstein, 2001, ApJ, 558, 145)

P QR ST U S V
WX YZ [ \] X ^ \_ ` ab \ [_ ^_ ] c�d e X fg ^ h i ^ gj X [b g \ c
Galactic and extragalactic H II regions
adf for O++/H+
m Galactic
M 42 1.3 M 17 2.1 NGC 3576 1.8 M 8 2.0
m Magellanic Clouds
30 Doradus 2.4 LMC N 11B 6 SMC N66 2.3
m Extragalactic
NGC 604 (M33) 1.6 NGC 5461 (M101) 2.0 NGC 5471 (M101) 1.6 NGC 2363 2.2
Esteban et al., 1998, MN, 295, 401n M 42
Esteban et al., 1999, APJS, 120, 113n M 8
Esteban et al., 1999, RmxAA, 35, 65n M 17 (two positions; adf = 1.8, 2.2)
Tsamis et al., 2003, MN, 338, 687n M 42, M 17, NGC 3576, 30 Doradus, LMC N11B, SMC N66
Esteban et al., 2002, ApJ, 581, 241n NGC 604, NGC 5461, NGC 5471, NGC 2363

o pq rs t r u
vw xy z {| w } {~ � �� { z~ }~ | ��� � w �� } � � } �� w z� � { �Interpretation and evidence for
a new component of H-deficient ultra-cold plasma

o pq rs t r u
vw xy z {| w } {~ � �� { z~ }~ | ��� � w �� } � � } �� w z� � { �
Interpretations – a bi-abundance nebular model
�
A 'normal' component (0.3 solar masses):
� “ Normal” electron temperature (Te � 104 K)
� “ Normal” (solar ) abundances where
� Emits strongly in CELs �
A 'H-deficient' component (1×10⁻³ solar masses)
� Very low temperature (Te
�
103 K)
� Very high heavy elemental abundances (100 times solar)
� Emits strongly in heavy element ORLs but essentially no CELs
ORLs and CELs disagree because they trace distinct ionized regions.
∗∗
IR fine-structure lines suppressed by collisional de-excitation
Low Te(BJ) problematic
IR fine-structure lines suppressed by very low Te
Survival of the inclusions?
Two empir ical models envisaged for NGC 6153 (L iu et al. 2000)

o pq rs t r u
vw xy z {| w } {~ � �� { z~ }~ | ��� � w �� } � � } �� w z� � { �
�
Collisionally excited lines
jν ∝ T1/2exp(−E/kT);
jν ∝ N(X+i)Ne for N
e << N
c
∝ N(X+i) for Ne >> Nc
�Recombination lines
jν ∝ T−α where α ∼ 1
jν ∝ N(X+i+1)Ne
Emissivities of ORLs and CELs as functions of Te and Ne

o pq rs t r u
vw xy z {| w } {~ � �� { z~ }~ | ��� � w �� } � � } �� w z� � { �
Component 1 ('metal-rich') Component 2 ('normal') H: 10000 He: 6300 C: 310 N: 220 O: 600 H: 10000 He: 1000 C: 2.9 N: 4.2 O: 5.6 Ne: 180 Mg-Ar: Solar by mass Ne: 1.8 Mg - Ar: Solar by mass N(H): 4410 cm �3 Filling factor: 0.005 N(H): 1170 cm �3 Filling factor: 0.995 T
e: 1390 K Mass: 0.0031 M� T
e: 9040 K Mass: 0.38 M�
Averaged over the whole nebulaH: 10000 He: 1010 (em. ana: 1360) O: 6.9 ( �solar; em. ana: CEL = 5, ORL = 41)
Te([O III]): 9090 K T
e(H I BJ): 7080 K T
e(He I J3421): 3550 K T
e(C II, O II): 1400 K
The model predicts Te(CNONe ORLs)
� Te(He I)
�
Te(H I BJ)
�
Te([O III])
Mod
el /
Obs
0.0
0.5
1.0
1.5
2.0
0.0
0.5
1.0
1.5
2.0
H I, He I, He II and metal ORLs
UV, opt. and IR CELs
H
�
N I
II 4
379
O
II 4
651
N
e II
333
6
C
II 4
267
N
II 5
679
He
I 108
30
He
I 447
1
C
III
4649
[N I
] 52
00
[N I
II ]
57
�m[O
IV ]
26
�m
[N
e II
I ]
16
�m
A bi-abundance model for NGC 6153

� �� �� � � �
��� � ¡¢ � £ ¡¤ ¥ ¦§ ¡ ¤ £¤ ¢ ¨�© ª �« ¬ £ ® £ ¬¯ � § ¬ ¡ ¨
Te from He I line ratios(2p3Po -3d3D λ5876)/(2p3Po -4d3D λ4471)(2p1Po -3d1D λ6678)/(2p3Po -4d3D λ4471)
°
He I emission arises from regions of very low T
e ( ±103 K) in the most extreme nebulae° Log Ne
± 4.5 (/cm3) in Hf 2 ²2, no evidence of very dense condensations
Smits D. P., 1996, MNRAS, 278, 683; Sawey P., Berrington K. A., 1993, Atomic Data Nucl. Data Tables, 55, 81

� �� �� � � �
��� � ¡¢ � £ ¡¤ ¥ ¦§ ¡ ¤ £¤ ¢ ¨�© ª �« ¬ £ ® £ ¬¯ � § ¬ ¡ ¨
O++ 2p2 3P
J = 0J = 1J = 2
J = 5/2
O+ 3d 4FJ = 9/2J = 7/2
J = 3/2
³ 4076 J = 3/2
O+ 3p 4Do
J = 7/2J = 5/2
J = 1/2
³ 4649
Reference lineO+ 4f G[5]o
J = 9/2
J = 5/2
´ 4089
J = 11/2
J = 7/2
Direct recombination to the upper levels of λ4089, λ4076 and λ4649, levels of the highest J value of the given spectral term, are only possible from the J = 2 level of the ground 3P term of recombining O++ ions. (Liu 2003, in Planetary Nebulae: Their Evolution and Role in the Universe, eds. S. Kwok, M. Dopita and R. Sutherland, pp.339-346 (2003)
Average Te's of O II ORL emitting regions

� �� �� � � �
��� � ¡¢ � £ ¡¤ ¥ ¦§ ¡ ¤ £¤ ¢ ¨�© ª �« ¬ £ ® £ ¬¯ � § ¬ ¡ ¨
Ruiz et al., 2003, ApJ, 595, 247
O++ level population at Te = 103 K
and Ne = 3000 cm µ3
J Pop Therm 2 0.30 0.56 1 0.43 0.33 0 0.40 0.11
¶ Liu 2003, in IAU Symp. 209 Planetary Nebulae: Their Evolution and Role in the Universe, eds. S. Kwok, M. Dopita and R. Sutherland, pp.339-346 (2003)
¶ Tsamis et al., 2003, MN, 338, 687

� �� �� � � �
��� � ¡¢ � £ ¡¤ ¥ ¦§ ¡ ¤ £¤ ¢ ¨�© ª �« ¬ £ ® £ ¬¯ � § ¬ ¡ ¨
Log
adf
Log
adf
Log
adf
Log
adf
Log
adf
Te([O I I I ]) – Te(H I BJ)
Te([O I I I ]) – Te(O I I)
Te([O I I I ]) – Te(He I )
Te([O I I I ]) – Te(RL/RC)
Te(CNONe ORLs)
·
Te(He I)
·
Te(H I BJ)
·
Te([O II I ])

¸ ¹º »¼ ½ » ¾
¿ÀÁ  à ÄÅ ÀÆ ÄÇ È ÉÊ Ä ÃÇ Æ Ç ÅË�Ì Í ÀÎÏ Æ Ð ÑÆ Ï ÒÀ ÃÊÏ ÄË
Comparison of Te(O II), Te(He I), Te(H I BJ) and Te([O III])
Te(O II) T
e(He I) T
e(BJ) T
e([O III]) adf N
e (cm−3)
Hf 2-2 2360 775 900 8820 84 300M 1-42 450 2310 3560 9220 22 1200NGC 40 10600 7020 10600 18 1700M 2-24 570 3000 16300 17 1800Vy 2-2 1380 1890 9300 13910 12 11700DdDm 1 3500 8730 12300 12 4000NGC 2022 < 300 15900 13200 15000 16 1050NGC 6153 3200 3370 6080 9120 9.2 4000IC 2003 270 7670 8960 12650 7.3 5200 M 2-36 800 4160 5900 8380 6.9 3800Vy 1-2 3250 4430 6630 10400 6.2 1160M 3-27 4030 9020 13000 5.5 3200 NGC 2440 < 300 14000 16150 5.4 4000NGC 7009 1600 5380 8150 9980 4.7 3900M 3-34 950 8440 12230 4.2 4000NGC 6543 16300 5220 8340 7940 4.2 6400Hu 2-1 4370 8960 9860 4.0 7900
Liu X.-W., 2003, in IAU Symp. 209 Planetary Nebulae: Their Evolution and Role in the Universe, eds. S. Kwok, M. Dopita and R. Sutherland, pp.339-346 (2003); Tsamis Y. et al., 2004, MN, submitted; Liu Y. et al., 2004, MN, submitted; Wesson R. et al., 2004, MN, in preparation

¸ ¹º »¼ ½ » ¾
¿ÀÁ  à ÄÅ ÀÆ ÄÇ È ÉÊ Ä ÃÇ Æ Ç ÅË�Ì Í ÀÎÏ Æ Ð ÑÆ Ï ÒÀ ÃÊÏ ÄË
Te(CNONe ORLs)
Ó
Te(He I)
Ó
Te(H I BJ)
Ó
Te([O III])

¸ ¹º »¼ ½ » ¾
¿ÀÁ  à ÄÅ ÀÆ ÄÇ È ÉÊ Ä ÃÇ Æ Ç ÅË�Ì Í ÀÎÏ Æ Ð ÑÆ Ï ÒÀ ÃÊÏ ÄË
(Wesson et al. 2003, MN, 340, 253)
H-deficient knots in A 30
Ô
O II ORLs arise from 500 K plasma!Ô
H contributes < 1% in these knots, Much more extreme than the hypothesised H-deficient clumps in e.g. NGC 6153Ô
The knots are O-rich, rather than C-rich as reported previously
J3
J4
J2
J1
PA=330

¸ ¹º »¼ ½ » ¾
¿ÀÁ  à ÄÅ ÀÆ ÄÇ È ÉÊ Ä ÃÇ Æ Ç ÅË�Ì Í ÀÎÏ Æ Ð ÑÆ Ï ÒÀ ÃÊÏ ÄË
[O II
]
[Ne
III]
[Ne
III ]
[O II
I]
[Ne
IV]
[O II
I ]
[O II
I]
He
II
He
II
H
Õ
O II M1
O II M10N
e II
N II
C II
He
I
N II
I
WHT/ISIS spectra of knots J3 and J1 in Abell 30
He
I
He
I
O IIIBowen N III
Bowen
He
II
O II
He
I
He
I
O II
He
IH
e I
He
I
He
II
O II O IIHe
II
He
II +
H
Ö
[Ar
IV]
O II
J3
J1
J3
J1
The observed ORLs from C, N, O & Ne ions and their relative strengths are remarkably similar to those observed in other Pne such as Hf 2-2, M 1-42 and N6153

¸ ¹º »¼ ½ » ¾
¿ÀÁ  à ÄÅ ÀÆ ÄÇ È ÉÊ Ä ÃÇ Æ Ç ÅË�Ì Í ÀÎÏ Æ Ð ÑÆ Ï ÒÀ ÃÊÏ ÄËErcolano et al. 2003, MNRAS, 344, 1145
Ionizing star
He/H = 40O/He = 0.93
He/H = 40O/He = 0.14
CoreTe = 500-1000K
EnvelopeTe = 12000-16000K
D = 1.68e+17 cm
A 3-D photoionization model for a H-deficient knot in Abell 30
R = 4.50e+15 cm
Te
(K)
Ioni
zati
on f
ract
ion
H
eati
ng r
ate
Radius (4.8e+15 cm) Radius (4.8e+15 cm)
He+
He++ He0
Te
total
dust
photo ∼ 500 K
12000 K
17000 K
1700
0 K
1200
0 K

¸ ¹º »¼ ½ » ¾
¿ÀÁ  à ÄÅ ÀÆ ÄÇ È ÉÊ Ä ÃÇ Æ Ç ÅË�Ì Í ÀÎÏ Æ Ð ÑÆ Ï ÒÀ ÃÊÏ ÄËC
II
4f-5
g
× 9903
He
I 2s
3 S -
2p
3 Po
×10830
Collisionalexcitation
meta-stable
Solar
NGC6153 He/H is well correlated with adf and with Te([O III]) − Te(BJ)
→ He/H overestimated?(Zhang et al., 2004, MN, in press; Liu et al., 2004, MNRAS, submitted)
NGC6153Component 1 Component 2He/H=0.100 He/H = 0.63Te = 9000 K Te = 1400 K M = 0.38 Msun M = 0.0031 Msun
Average for the whole nebulaHe/H = 0.101
(empirical analysis: 0.136)
Implications for He abundances of ionized gaseous nebulae
H
e
Log adf

Ø ÙÚ ÛÜ Ý Û Þ
ßàá â ã äå àæ äç è éê ä ãç æ ç åë�ì í àîï æ ð ñæ ï òà ãêï äëFailure of the paradigm of temperature
fluctuations and density inhomogeneities

Ø ÙÚ ÛÜ Ý Û Þ
ßàá â ã äå àæ äç è éê ä ãç æ ç åë�ì í àîï æ ð ñæ ï òà ãêï äë
Effects of temperature/density fluctuations
ó
Temperature fluctuations - Opposite effects on CELs and ORLs - T
e derived from the [O III]na ratio will be
overestimated, causing the O++/H+ derived from the [O III]/H
ô
ratio being underestimated (Peimbert 1967; 1971)
ó
Density inhomogeneities - CELs suppressed in high density regions - For condensations with 106 < N
e < 107 cm-3, the
õ õ
4959, 5007 lines are suppressed relative to the
õ
4363 auroral line, causing Te derived from the [O III]na ratio being overestimated
(Rubin 1988; Viegas & Clegg 1994)
Both scenarios predict that: adf should correlate with Eex and/or Nc
Tex
0163440
29170
62137
86797
012
5007
4931
4959
4363
2321
2331
1661
1666
1D2
1S0
5So2
3P}88µm 52µm
[O III] 2p2,2s2p3
5003500
6.9 105
2.5 107
3.4 1010
Nc

Ø ÙÚ ÛÜ Ý Û Þ
ßàá â ã äå àæ äç è éê ä ãç æ ç åë�ì í àîï æ ð ñæ ï òà ãêï äë
CEL versus ORL abundances – evidence against temperature fluctuations and density inhomogeneities
For essentially all nebulae analysed: ö
Abundances derived from various CELs -- UV, Opt. or IR, agree with each otherö
ORL abundances consistently higher than CEL values Large low-density PNe have higher adf's and ∆Te's
ORLs NGC 6153
Optical CELs: Eex
> 104 K
IR CELs: Eex
< 103 K

Ø ÙÚ ÛÜ Ý Û Þ
ßàá â ã äå àæ äç è éê ä ãç æ ç åë�ì í àîï æ ð ñæ ï òà ãêï äë
T ÷ùø ú ûü ü
Tý Ný N þ dl dAü ü
Ný N þ dl dA
ÿ t ú2 ûü ü
Tý � T ÷ùø ú 2 Ný N þ dl dA
T ÷ùø ú2
ü ü
Ný N þ dl dA
[O III]: T0,A = 9000 – 11000 K, t2A < 0.01
Similar conclusion for NGC 6543 (Wesson & Liu 2004, MN, in press)
Temperature fluctuations in NGC7009 from HST/STIS spectroscopy
Rubin et al., 2002, MNRAS, 334, 777

Ø ÙÚ ÛÜ Ý Û Þ
ßàá â ã äå àæ äç è éê ä ãç æ ç åë�ì í àîï æ ð ñæ ï òà ãêï äë[O III]: T0,A = 7680 – 8360 K t2
A = 0.007 -- 0.018 [N II]: T
0,A = 9130 -- 10230 K
t2A = 0.006 -- 0.018
Temperature fluctuations in M 42 from HST/STIS spectroscopy
Rubin et al. 2003, MNRAS, 340, 362
WFPC2 imaging (O'Dell, Peimbert, Peimbert, 2003, AJ, 125, 2590)[O III]: T
0,A = 9240 – 9390 K, t2
A = 0.005 – 0.016
Ground-based Long-slit spectroscopy (Liu et al., 1995, ApJ, 450, L59)
Te([O III]) ≈ Te(BJ) ≈ constant across the nebula
Consistent with ORL/CEL ~ 1

� �� �� � � �
� � � � � � � �� � � � � � ��� � �� � � � � �� �� � �
WC
A small amount of H-deficient gas (ω ~10−5 to 10−3) can account for the observations
Diff. t2
(temp. fluctuations)
Diff. ff (2-comp. model)
Te
r
Te(He I) < Te(H I) < Te([O III])
Te
r
Te(H I) < Te(He I) < Te([O III])
Temperature fluctuations
Two-component model
Zhang, Liu & Liu, 2004, in preparation

� �� �� � � �
� � � � � � � �� � � � � � ��� � �� � � � � �� �� � �
�
IC 418 (adf ~ 1) (Williams et al., 2004, in preparation )
� Line widths
{O I I = 16.8±0.8 km/s} ~ {[O I I I ] = 15.7±0.2 km/s} < {[O I I ] = 42.6±0.6 km/s}
� NGC 5307 (adf = 1.9) (Ruiz et al., 2003, ApJ, 595, 247)
� Line widths
{O I I = 44±7 km/s} ~ {[O I I I ] = 48.4±0.7 km/s}
� Radial velocities
{O I I = 33±4 km/s} ~ {[O I I I ] = 30.1±0.5 km/s}
� Similar results for NGC 5315 (adf = 1.7) (Peimber t et al. 2004, APJS, 150, 431)
� “ No evidence in favour of high velocity O-r ich clumps” in NGC 5307 and NGC 5315 (as in Abell 30 and Abell 58)
Our H-deficient knot model doesn' t require that the posited knots be high-velocity
Compar ison of ORL and CEL widths

� �� �� � � �
� � � � � � � �� � � � � � ��� � �� � � � � �� �� � �
NE
Comparison of emission line widths of ORLs and CELs
O II < [O III] < [O II]
O II ORLs arise from either colder ionized regions or different spatial regions than those emitting [O III] and [O II] CELs
NGC 7009adf ~ 5
R = 48 000ESO 1.52m FEROS
D = 2.7''

� �� �� � � �
� � � � � � � �� � � � � � ��� � �� � � � � �� �� � �
Conclusions and what next?
!
Conclusions� ORLs good abundance tracers?
� CELs poor abundance tracers?
� Temperature/density fluctuations present? Full story?
� H-deficient ultra-cold plasma?
!
Nature and origins of H-deficient inclusions� Nuclear processed and then ejected material?
� Evaporating planetary disks?
!
Future progress will rely on an intimate interplay between: � Observations: deep, quantitative spectroscopy of faint emission lines Temperature, density, mass, composition (CNONe versus Mg)
� Atomic and plasma physics

� �� �� � � �
� � � � � � � �� � � � � � ��� � �� � � � � �� �� � �
Origins of cold, metal-rich plasmas – evaporating planetesimals?


