201
MULTI-CRITICAL POINTS IN WEAKLY ANISOTROPIC MAGNETIC SYSTEMS a neutron-scattering study of two low--dimensional antiferromagnets J.A.J. Basten.

MULTI-CRITICAL POINTS IN WEAKLY ANISOTROPIC MAGNETIC SYSTEMS
a neutron-scattering study of two low--dimensional antiferromagnets
J.A.J. Basten.

·-
THE • Rekercé n rum
ing. jl·~-2- 1(:}
orsh. I KC 36 ?o 2
~~ou I MUL TI·CRITICAL POINTS IN WEA ANISOTROPIC MAGNETIC SYSTEMS
a neutron-scattering study of two low-dimensional antiferromagnets
PROEFSCHRIFT
TER VERKRIJGING VAN DE GRAAD VAN DOCTOR IN DE TECHNISCHE WETENSCHAPPEN AAN DE TECHNISCHE HOGESCHOOL EINDHOVEN, OP GEZAG VAN DE RECTOR MAGNIFICUS, PROF. DR. P. VAN DER LEEDEN, VOOR EEN COMMISSIE AANGEWEZEN DOOR HET COLLEGE VAN DEKANEN IN HET OPENBAAR TE VERDEDIGEN OP DINS·
DAG 20 FEBRUARI 1979 TE 16.00 UUR.
DOOR
JOHANNES ANDREAS JOSEPHUS BASTEN
GEBOREN TE NIJMEGEN

Dit proefschrift is goedgekeurd door de promotoren
Prof.Dr. P. van der Leeden
en
Prof.Dr. J.A. Goedkoop

If we have a correct theory but merely prate
about it, pigeon-hole it and do not put it into
practice, then that theory, however good, is of
no significance. Knowledge begins with practice,
and theoretical knowledge which is acquired
through must then return to practice "
Mao Tsetung, "On practice"
Aan Hanneke, Peter en Maarten

GRAPTER I
GRAPTER II
GRAPTER III
GRAPTER IV
I -
CONTENTS
INTRODUCTION
References
SCALING THEORY OF CRITICAL PHENOMENA
3
6
2.1. Introduetion 7
2.2. Basic definitions 8
2.3. Critica! behaviour and neutron scattering 13
2.4. Universality 22
2.5. Sealing 26
2.6. Ihe calculation of critica! behaviour 36
2.7. The Renormalization-Group approach 42
References 58
PRASE TRANSITIONS AND CRITICAL BERAVIOUR IN
WEAKLY A.~ISOTROPIC k~TIFERROMAGNETS
3.1. Introduetion
3.2. Phase diagrams of spin-flop systems in the
61
61
MF-approximation 63
3.3. RG-predictions for critica! behaviour in
spin-flop systems 70
3.4. Ihe extended-sealing theory of multicritical
behaviour in spin-flop systems 78
3.5. Spin-flop systems in a ske'" magnetic field 87
References 92
CRITICAL BERAVIOUR OF CoBr2•6{0.48 D20, 0.52 H20}
NEAR THE NEEL POINT 95
4. 1. Introduetion 95
4.2. Crystallography and magnetic interactions 96
4.3. Experimental 99
4, 4. I emperature dependenee of the staggered
magnetization
4.5. Critica! scattering near TN
100
103

- 2 -
CONTENTS (continued)
CHAPTER V
CHAPTER VI
4.6. Conclusions
4.7. Appendix
References
TETRACRITICAL BEHAVIOUR OF
CoBrz•6{0.48 DzO, 0.52 HzO}
5.1. Introduetion
5.2. Experimental
5.3. Determination of the paramagnetic phase
boundaries
5.4. The transition to the SF-phase
5.5. The magnetic phase diagram
5.6. Discussion
5. 7. Appendix
References
EXPERTMENTAL STUDY OF BICRITICAL BEHAVIOUR
111
113
J 14
IJ 7
117
118
120
122
130
133
136
138
IN CsMnBr3•2DzO 141
6.1. Introduetion 141
6.2. Crystallography and magnetic interactions 142
6.3. Sample and apparatus 146
.6.4. Short-range and long-range order 148
SUMMARY
SAMENVATTING
6.5. The spin-flop transition 152
6.6. The paramagnetic phase boundaries 158
6.7. Analysis of the magnetic phase diagram 163
6.8. Experimental test of the extended-sealing
hypothesis 169
6.9. Discussion and conclusions 179
6.10.Appendix 183
Reierences
LIST OF ABBREVIATIONS AND SYMBOLS
DA.'<KWOORD
185
187
189
191
193
194 LEVENSBERICHT

- 3 -
CHAPTER I
INTRODUCTION
In the description of phase transitions classica! theories, such as
the molecular-field theory for magnetic systems, may be considered as
exact for systems with infinite-range interactions I II. They usually
account fairly well for the occurrence of various types of ordering,
also in systems with short-range interactions. However, the validity
of this description is drastically reduced near critical points, where
the short-range interactions play an important role. So far, no exact
solution for three-dimensional systems near criticality exists. Even
for the simplified mathematica! systems of lower spatial dimensionality
d, which have been the subject of widespread interest, only in very
few cases an exact solution could be obtained 121. It appeared that
physical realizations of such low-dimensional systems can be fotmd in
certain magnetic materials, where the interactions between the magnetic
moments are restricted to ebains or layers 131. These so-called low
dimensional magnetic systems offer an interesting possibility to
verify calculations based on simplified model Hamiltonians. As an
alternative approach several approximative methods have been developed,
usually basedon series expansions and other extrapolation techniques,
which yield fairly good descriptions of ordering processes in d=3
systems even closetoa critical point 141.
Both calculations and experiments show that in many systems the same
singular behaviour of thermodynamic variables is found near critica
lity, suggesting that the ordering proceeds in the same way. Apparently
the type of the interaeticus which lead to the long-range order, is
of minor importance for the description of the ordering process itself.
The critical behaviour appears to depend only on a limited number of
parameters, specifically on the sparial dimensionality (d) and the
number of degrees of freedom (n) that take part in the ordering. Ibis
common feature of ordering systems is known as The origin
of long-range order can be found in the di vergence of the range of the
correlations in a system at the ordering temperature. It appears that

- 4 -
this divergence of the correlation length causes all singularities
which are observed in a system near criticality. As we shall discuss
in chapter II, the relation to the correlation length imposes strong
limitations to the functional form of the singularities and implies
close relations between the various critical quantities. This feature
of ordering systems is known as sealing Is I.
Only recently Wilson et al. 161 integrated these semi-phenomenological
concepts of sealing and universality and extended them to a detailed
methad for the calculations of critical behaviour. This approach,
called the Renormalization-Group (RG) approach, had a very important
impact on the theoretical understanding of criticality. The success
of the RG-theory has encouraged theoreticians to praeeed to studies on
the phenomena which occur when different kinds of critical behaviour
compete. As we shall see in chapter III, the existence of such a
competition is usually limited to the neighbourhood of certain points
in thermadynamie field space, the so-called multi-critice:l points 171. For the description of multi-critical behaviour a straightforward
extension of the sealing concept is sufficient. This so-called
extended-sealing theory, which is introduced in Chapter III, predicts"
many characteristics of multi-critical points and gives also a des
cription of the crossover from one kind of critical behaviour to
another ISI. In the experimental verification of the extended-sealing
theory, which so far has been t:ragmentary, magnetic systems again play
an important role. This is due to the convenient way in which the re
levant thermadynamie field parameters can be changed, in combination
with the large variety of critical and multi-critical behaviour dis
played by magnetic systems. Although the fundamental concepts of the
theory on critical phenomena are applicable in a wide range of systems,
our discussions will be restricted mainly to magnetic systems and more
specifically to antiferromagnets.
In the experimental part of this report results are presented of
neutron scattering studies on the critical and multi-critical behaviour
of two low-dimensional antiferromagnets. Both materials are so-called
spin-flop systems, i.e. antiferromagnets with weakly anisotropic inter
actions. CoBr2 ·6{0.48 D20,0.52 HzO} is well known as a good approxi-

5
mation of the d=2 XY-model (i.e. d=2, n=2) 191. An extensive study has
been performed on the critica! behaviour of this compound close to
the ordering temperature TN. A careful profile analysis of the observed
criticai-scattering data provides a rather complete picture of the
ordering process. We have also investigated the multi-critical behaviour
of this material and the spin-flop region. These measurements provide
for the first time streng evidence for the existence of a so-called
intermediate phase in a spin-flop system, which has been questioned
by theoreticians for a long time I JOl. The second material investigated
is CsHnBrg•2DzO, known as a goed approximation of the d=l Heisenberg
model (i.e. d=J, n=3) I IJ 1. The experiments on this compound have been
performed to verify various aspects of the extended-sealing theory on
multi-critical behaviour in spin-flop systems. The results of this
study provide the first verification of the central assumption of this
theory, i.e. the extended-sealing hypothesis itself I si.
The erganizat ion of this re.port is as fellows. We start in chapter II
with an introduetion in the field of critica! phenomena. We discuss
the concepts of sealing and universality and the integration of both
ideas in the calculational approach of the Renormalization-Group (RG)
theory. In chapter III we will focus our attention to the magnet ie
phase diagrams of spin-flop systems and the related critical and
multi-critical behaviour. The predictions of bath the molecular-field
(HF) theory and of sealing theory will be presented, as they are aften
comp lementary. Chapter IV contains the results of our neutron -scat te
ring study on the critica! behaviour of CoBr2 ·6{0.48 D20,0.S2 HzO}
near the Nêel point. The experiment on the same compound in an applied
magnetic field is discussed in chapter V. Finally, in chapter VI the
neutron-scattering study on CsMnBr 3 •2D20 is treated. References have
been gathered at the end of each chapter. A list of symbols and
abbreviations is give.n at the end of this report. Throughout this
work numerical results of least-squares fits are given with 1o
standard deviations, based on statistics only, within parentheses and
expressed in units of the last decimal place; for instanee
IN= 3.1 175(10) K means TN = 3.1175 ± 0.0010 K.

6 -
111 H.E. Stanley, "Introduction to Phase Transitions and Critical
Phenomena" (Oxford U.P., New York, 1971 ).
121 "Phase Transitions and Critical Phenomena", Vol. 1, (C. Domb and
M.S. Green, Eds.), (Academie Press, New York, 1972).
131 L.J. de Jonghand A.R. Miedema, Adv. Phys. 11_, I (1974),
M. Steiner, J. Villain and G.G. Windsor, Adv. Phys. 87 (1976).
141 "Phase Transitions and Critical Phenomena", Vol.3,(C. Domband
M.S. Green, Eds.), (Academie Press, New York, 1974).
lsl L.P. Kadanoff in "Phase Transitions and Critical Phenomena",
Vol.5A, (C. Domband M.S. Green, Eds.), .(Academie Press, New
York, 1976).
161 K.G. Wilson, Phys. Rev. , 3174, 3184 (1971),
K.G. Wilson and J.B. Kogut, Phys. Reports J2C, 75 (1974).
I 71 Recent reviews are: A.Aharony, Physica 86-88B , 545 (1977) and
W.P, Wolf, Physica 86-88B, 550 (1977).
jsj E. Riedel and F.J. Wegner, Z. Physik ~. 195 (1969),
P. Pfeuty, D. Jasnow and M.E. Fisher, Phys. Rev. BlO , 2088 (1974).
191 J.P,A.M. Hijmans, Q.A.G. van VIimmeren and W.J.M,· de Jonge,
Phys. Rev. Bl2 , 3859 (1975), J.W. Metselaar, L.J. de Jongh and
D. de Klerk, Physica ~, 53 (1975).
I 101 D.R. Nelson, J.M. Kosterlitz and M.E. Fisher, Phys. Rev. Lett.
813 (1974).
1111 K. Kopinga, Phys. Rev. Bl6 , 427 (1977) and references therein,

- 7 -
CHAPTER II
SCALING THEORY OF CRIIICAL PHENOHENA
2. 1. Introduetion
The investigations reported in this work relate to critical phenomena,
a field of research which has been the subject of a fastly expanding
number of theoretical studies. In the present investigations the
choice of the topics, the applied methods in the data analysis and
the interpretation of the results are all . three closely interwoven
with recent theoretical developments. Therefore, we feel that it is
necessary to give a review of the concepts and ideas which constitute
the basis of the modern theory of critical phenomena.
In this chapter we shall confine ourselves to a presentation of the
most important quantities and concepts, with use of a minimum of
mathematics. Therefore, we shall often appeal to topological and
beuristic arguments. The reader who wants to go into further detail,
is referred to the many excellent papers and hooks which have been
publisbed during the last few years and which treat the developments
and the results of modern theory on phase transitions and critical
phenomena, either on an introductory or on a review level I l-5j. In
addition, a large variety of introductions has been published on the
Renormalization-Group (RG) approach of calculations related to critical
behaviour j6-10j. In this work no such RG-calculations will be per
formed nor reproduced. On the other hand, we shall repeatedly use
predictions and results, which have been obtained by means of RG
calculations. Therefore, it seems convenient to present also an intro
duetion in the terminology of the RG.
In section 2.2. we start with the basic definitions of quantities and
concepts used in the description of critical phenomena. The singular
behaviour which is observed near critical points, is described in
section 2.3. There we shall also show that many aspects of critical
behaviour, for example in magnetic systems, can be stuclied elegantly

- 8 -
by means of neutron scattering. The subsequent two sections treat the
concepts of sealing and universality, interpreted as a direct con
sequence of the divergence of the correlation length ~ at critical
points.
The sections 2.6. and 2.7. treat the principlesof the RG-approach
of the calculation of critical behaviour. This part of the chapter
may be skipped without consequences for the understanding of the
experimental part of this work. In section 2.6. we shall show how
calculations of critical behaviour are simplified in a fundamental
way because of the divergence of ~. which permits the use of effective
Hamiltonians. Insection 2.7. we treat the calculational recipe of the
RG-approach and indicate how the results are obtained.
2.2. Basic definitions
We consider a magnetic system in contact with its environment, which
consists for instanee of a magnetic field a and a heat reservoir at
temperature T. At equilibrium the variabie "extensi ve" quantit ies of
the system, such as the magnetization M and the entropy S, will take
on values which minimize the Gibbs free energy
G -+ -+
U - H•M- TS , (2. 1)
where U is defined as the internal energy of the sample plus magnetic
field I 11 [. According to Griffiths and Wheeler [ 12[, the thermo-
dynamic variables in (2. 1) can be classified as 11 and
"densities". The fields, denoted as hi' have the property that they
assume identical values in two or more phases which are in therma
dynamie equilibrium. This is not necessarily true for the conjugated
densities, which are defined by
(2.2)
According to this definition, a and T in (2. I) are fields, whereas ~ and S are densities. In general the definition of G in (2. I) may be
extended with additional pairs of conjugated variables in terms of the

9
Now, a first-order transition can be defined as a discontinuity
of at least one of the densities, say o., as a function of at least J
the conjugated field. At this transition the state of the system is not
uniquely defined, One can distinguish between two phases l and 2,
characterized by different density values p~l) and p~ 2 ), whereas
h. (l) = h. (2
) for all fields In the z:dimensio~al field space ]. ].
this first-order phase transition extends as a (z-l)-dimensional
hypersurface, the so-called aoexiatence surface (CXS). The CXS separates
the two distinct phases l and 2. Such a surface may terminate in
various ways I 121. Firstly, the CXS may interseet another CXS J.n a
bounda~, a hypersurface of dimension z-2 at which three phases
are in equilibrium. Secondly, the CXS may terminate in a criticaZ
nnvn•n~r~;, a hypersurface of dimension z-2, with the property that the
discontinuities in the densities vanish continuously upon approaching
a point of this critical hypersurface. In this terminology, a multi
critical surface can he defined as a surface in field space, where two
or more critical boundaries meet each other. In the rest of this
chapter we shall mainly deal with the properties of magnetic systems
close to critical boundaries.
H
t t t t
/
!" I
critica!
~~ region
,. ' I \ I I
\ T~--), ,_:_,.,.,.·"~~
T
coexlstence line critical point (T•T.,.H•O)
Fig. 2.1 ..
HT-phase diagram of a
ferromagnet.
The simplest example of a critical houndary in a magnetic system is
the Curie point Tc of a ferromagnet. In the two-dimensional field
space, spanned by the fields HandT, a first-order transition ex
tends as a one-dimensional CXS along the T-axis (Fig. 2.1.). At this
coexistence line two phases J and 2 coexist, which are distinguished
by a different value of the density M, viz. M1 and M2 =- M1. As a

- 10
function of T the discontinuity in M, i.e. M1
ly upon approaching the critica! point Tc.
Mz varrishes continuous-
It has been pointed out by Griffiths and Wheeler I 121, that the type
of critica! behaviour which is observed upon approaching a critica!
boundary,crucially depends on the path of approach in field space.
Consequently, for a correct analysis of critica! phenomena a further
subdivision of the fields and densities is needed, This division has
to be determined for each critica! point CP at the critical boundary
of a CXS, and therefore has only "local" validity. In a point CP in
field space, a field for which the corresponding axis is not asymp-
totically parallel to the CXS at CP, is called an
the conjugated density is called an ordering or an order
and
parameter. The remairring fields are fie lds and the con-
&msities. The nonordering fields,
asymptotically parallel to the CXS at CP, are further divided in
irrelevant fields, which are asymptotically parallel to the critica!
boundary at CP, andrelevant fields, which are not asymptotically
parallel to the critica! boundary at CP. These definitions imply that
any relevant field carries the system away from criticality, whereas
an irrelevant field carries the system along the critica! boundary.
In this sense also an ordering field is always relevant, Here we
emphasize once more, that this subdivision of the various fields not
necessarily remains the same along the whole critical boundary. It will
beseen insection 2.7., that the above division of fieldscan be ex
tended in a logical way for the description of multi-critical behaviour.
At the critical point of a ferromagnet in HT-space (Fig. 2.1.), the
magnetic field H is the ordering field and the magnetization M is the
order parameter. The tempersture T is a relevant nonordering field and
the entropy S is a nonordering density. According to the definitions,
also a combination of fields like
h H + (T-T ) 3 c
(2.3)
the critical boundary consists of a single critical point, any
nonordering field is relevant, since it carries the system away from
criticality.

and
t H 3 +(T-T ) c
- 11 -
(2.4)
might be used as local definitions of the ordering field and the non
ordering relevant field, respectively. Although this would be not very
useful in this simple case, we shall meet situations where it is rnuch
less clear which choice of fields is the most convenient one for the
description of the encountered critical phenomena.
Hst ABAB
t + t + ~--; '
' ' I I I
T
I I + t 2. 2. AB A B
A phase diagram similar to Fig. 2.1. is shown by an anisatrapie anti-
ferromagnet in zero magnetic field (Fig. 2.2.). ForT < the rnagnetic
moments are ordered in two sublattices A and B with sublattice magne
tizations MA paralleland MB antiparallel tosome easy axis.~ The
order parameter is now the
(2.5)
As the conjugated ordering field a fictitious
may be defined, which points in opposite directions for the two sub-->-
lattices, and therefore shows the same spatial symmetry as Mst' In
the two-dimensional field space spanned by H8
t and T, again a' tirst
order phase boundary extends as a one-dimensional CXS along the T-axis
(Fig. 2. 2.). At this coexistence line two phases I and 2 coexis t,
which are distinguished by a different value of the order parameter
viz. M(l) ~ - M )/2 and M(z) = CM' - M' )/2 re-MA)- 12 ) st B st A B L
, As a function of the relevant nonordering field T the
* We shall not consider antiferromagnets with more than two sublattices,

- 12
order parameter vanishes continuously upon approaching the critical
point TN' the Néel point,
H
Hst t ~ t l AB A B
Fig. 2. 3.
Possible (H8t,ll,'l')
diagram o:n
antijèrromagnet.
If we extend the field space with a third dimension, viz. the external
magnetic field H, the CXS appears to be a coexistence surface, exten-
ding in the plane (Fig. 2.3.), Therefore, H can be considered as
a nonord~ring field in an antiferromagnet. The two-dimensional CXS can
be limited in certain cases entirely by a critica! line, as drawn in
Fig. 2.3, From the shape of the critical boundary in this particular
case, it may be derived that H is an irrelevant field at the Néel
point (H=O, , whereas H is relevant elsewhere. T is a relevant
field along the entire critica! line, except in the point (H=Hc' T=O).
In the following sections we shall focus on the critical behaviour of
a system near a single critica! point, which may be part of a more
extensive critical boundary. We shall show that many aspects of
critical behaviour,among others in ferromagnets and antiferromagnets,
can be investigated directly by means of thermal neutron scattering
I 131. For the time being we are not concerned with multi-critical
points, which will appear again insection 2.7. The possible occurrence
of various phase diagrams in real antiferromagnets will be discussed
in chapter III.

- 13-
2.3. Critical behaviour and neutron scattering
A system near a critical point is characterized by large fluctuations
in the order parameter, which become slower and extend over larger
distances as the critical point is approached. In a magnetic system
these fluctuations can be introduced through a space-time spin
correlation function GaS(R,t) defined by
(Jtt) (2.6)
Here, the angular brackets denote the thermal average value at a given
temperature T, so (2. 6) is the probabi lity of finding the S-component
SÎ(t) of the spin at position R and at time t, given that the a
component of the spin at the origin was Sa(O) at time 0. In an anti-o
ferromagnet as well as in a ferromagnet the order parameter is pro-
portional to
If the critical point is approached from the disordered phase along a
path in field space corresponding to a relevant nonordering field, the
extent R of the region where Gaa(R,t) has a finitenon-zero value _,_
increases, although the value of <SR(t)> is still zero. This means that
the short-range order in the system grows. This growing of the regions
with correlated spins continues until at the critical point <SR(t)>
departs from zero, i.e. until Zong-range order (LRO) is established.
Also in the ordered phase fluctuations in the order parameter still
exist and wide regions are present where the spins have a "wrong"
orientation. Complete ordering will only exist at T=O. The fluctuations
around the equilibrium value
function
are expressed by the net correlation
(2. 7)
which has the property to be zero far from the critical point, bath
in the disordered and in the ordered phase, The behaviour of the spin
fluctuations sketched above can be studied directly by means of neutron
scattering,

- 14 -
If a beam of thermal neutrons is incident upon a solid, the interaction
between the nuclei of the atoms and the neutrons will give rise to
nuclear scattering I 141, Sirree the neutron carries a magnetic moment,
there will be an additional magnetic scattering, due to the inter
action between the magnetic moments of the atoms and the neutron.
Here we are interested mainly in the magnetic scattering process. In
a scattering experiment part of the neutrons will be scattered, which
results in a change in their wave veetors by
k- k 0
(2.8)
-+ -+ Here k
0 and k are the wave veetors of the incoming and scattered
neutrons, respectively,and Q is the so-called scattering vector. The
neutron energy loss is equal to
E - E 0
fiw (2.9)
where fi is Planck's constant and m the neutron mass. When unpolarized
neutrons are used, the double-differential magnetic scattering cross
section per unit solid angle ~ and per unit energy E is given by I 141
(2. I 0)
where
J \ -+ -+ aS -+
dt L exp {i(Q•R-wt)} G (R,t). (2. !I) -+ R
In (2. 10) f(Q) is the magnetic formfactor, aaS the Kronecker delta
and Q the a-component of the unit vector Q/Q. From (2.10) it appears a
that this neutron scattering cross section is proportional to the
space-time Fourier transfarm of the correlation function (2.6).
Close to critical points, the critical fluctuations in the order
parameter appear as quasi-static to the scattered neutrons I 15,161
This implies that the inelasticity of the scattering is s.mall and

- 15 -
êaS(Q,w) corresponds to a narrow profile centered at w=O. As the
critical point is approached the width ~w of this profile decreases,
which is known as the phenomenon of critical slowing down. Here, we
shall confine ourselves to a study of this quasi-static behaviour of
the fluctuations close to criticality. To determine the static cor
relation function GaS(R) = GaS(R,t=O), we do not need the complete
energy analysis of the scattering cross section (2.10). This can be aS -> ->
seen directly from the definition of G (R). Actually only the Q-
dependence of
~as -> 1 -> ->- aS ->-G (Q) - L exp(iQ•R)G (R)
00
~as ->-/ dwG (Q,w) (2. 12)
->-R
has to be determined. GaS(Q) may he considered as the wave-vector
representation of the spin fluctuations. In an ordered solid with + ->- •
reciprocal lattice veetors Q0
= 2TIT, correspond~ng to the magnetic unit
cell, GaS(Q) has the periodicity of the reciprocal lattice, i.e.
êaS(Q) = êaS(q), where we introduced the deviation vector
+ q Q -
a With the Fourier transfarm of SR given by
s_c; q
I exp (iq·R) SÎ + R
we can write (2.12) in the commonly used notation
GaS(Q) - êaS (q) I exp Ciq. R) <Sa S~> 0 R
+ R
<S_c; ss_,_> q -q
As ~n (2. 7), a net correlation function êaS(q) can be defined as n
It will be seen below, that G~S(q) w a bell-shaped function,
(2. 13)
(2. 14)
(2.15a)
(2.15b)
maximum at q=O and with widths Ka, Kb and Kc a long the a, b and c-axes,
respectively, which indicate an appropriate orthogonal set of crystal
axes.

k1 = k +-Ik 0 =k- k0
01 = k1-k0
/
/ I
/
- 16 -
k
Fig. 2. 4.
Scattering veetors _,_ _,_ Q and Q1, corres-
ponding to neutrons
which are detected
at the same scattering angle but have been scattered elastically and
inelastically, respectively.
In a critical-scattering experiment GaS(q) can be determined to a very n
good approximation I 15, 16j by measuring the differential cross section
do/dD. The essential approximation in this procedure is the following.
If the scattering is inelastic, the neutron wave vector will change
not only in direction but also in magnitude. It follows directly
from (2.8) and (2.9) that for small w
Lik (2. 16)
It is shown in Fig. 2.4. that neutrons, scattered in the same
direction with a slightly different energy transfer Ll(fiw), are not
scattered with the same momenturn transfer fiQ. Therefore, the
Q-dependence of GaS(Q) can be determined directly from do/dD only if n
the condition
L\k << K (2. 17)
is fulfilled, i.e. if the spread Lik due to the inelasticity (2.16) -aS _,_
is much smaller than the width Kof Gn (q). The assumption that (2. 17)
holds in a scattering experiment is known as the quasi-static approxi
mation. The origin of this denomination will be explained below. If
(2. 17) holds, the expression
(2. 18)

- 17-
is valid. The cross section can be separated into two terms,
(2. 19)
[c~S (Q) + l exp (iQ· ïb <S~> <S~> J , R
where the first term represents short-ranged fluctuations and the
second term is the Bragg term, correponding to the LRO.
350
'lil' 300 ..... z ::;) 250 0 u 0 200 ~
> ..... c;; z w ..... z
Fig. 2.5.
do/d~(q) through the (111)
reciprocal lattice point in
RbMnF3 at T near Tc. The full
line is a least-squares fit of ~!I Gn (q) from eq. (2.20) folded
with the (high) experimental
resolution (taken from \16\).
As an example, Fig. 2.5. shows the neutron scattering cross section do ~ . d~(Q), measured w1th an extremely high resolution around the (!I I)
reciprocal lattice point in cubic RbMnF 3 \ !6\. Similar scattering ~ ~
profiles are observed near all reciprocal lattice points Q0
= 2wr,
where according to (2. 19) magnetic Bragg peaks appear in the ordered ~a aS aS ~
phase of RbMnF 3 • The shape of Gn(q) C=o Gn (q) in a cubic system)
appears to be perfectly described by

- 18 -
(2.20)
The corresponding net static correlation function Ga(R) can be found n
as 1171
exp [-KaR]
Rd-2+n , for R ->- oo • (2. 21)
In (2.20) and (2.21) the exponent n represents the deviation in the
shape of Gn from the classical Ornstein-Zernike theory I 181. 1/Ka = ~a clearly plays the role of a correlation length, as it is a measure of
a-+ a a a the range of Gn(R) = <S
0 SR> . In general a different amplitude A and
width Ka are found for each spin component. In a non-cubic, anisatrapie
system expressions similar to (2.20) and (2.21) held for each component
of q and R, respect i vely 1131 .
With 1/K = ~ and v = fik/m as the neutron velocity, the quasi-static
approximation (2. 17) can be written as
m 1 >> ~ W fik TEkf V
where we used (2. 16). The left side represents a characteristic time
of the spin fluctuations and the right side is the passage time for a
neutron through a correlated region. Therefore, the above requirement
implies that the spin fluctuations appear static to the neutrons.
Through the fluctuation-dissipation theorem,relations exist between ~as _,.
the net static correlation function Gn (Q) and many ether therma-
dynamie quantities, such as the generalized susceptibility xaS(Q).
This is the response function of the magnetic system for a statie,
spatially modulated magnetic field
a _,. H (R) (2.22)
and is defined as

- 19 -
(2.23)
-+ -+ For Q
0=2n, (2.23) corresponds to the familiar susceptibility
xaS 3MS/3Ha in a ferromagnet and to the staggered susceptibility
x:~ 3M:t/3H:t ln an antiferromagnet. It can be shown that I 141
1-exp(-lî.w/kBT) J lî.w/kBT
(2.24)
where kB is the Boltzmann constant, gis the effective g-value of the
magnetic ions and ~B is the Bohr magneton. Eq.(2.24) reduces to
(2.25)
under the condition
(2.26)
which is known as the quasi-elastic
The double-logarithmic plots in Fig. 2.6. show some experimental
results for the inverse correlation range K~ and the staggered sus
ceptibility x// as a function of temperature, detemined in the st
tetragonal antiferromagnet MnF2 both above and below T I 19,201. c
Here, the parallel signs refer to the fluctuations of the lo~gitudinal
spin components, i.e. the components along the easy axis. A part of
the data has been detemined from a complete analysis of the inelastic
scattering cross section (2. 10), whereas another part has been obtained
from tr1e quasi-elastic scattering cross section (2.19). The absence of
systematic deviations indicates that the quasi-static approximation
(2. 17) holds in the latter analysis.

10
0
~ HJ
~ -~
10'
1::, .À. I NEL AS TIC
10'
.001 -01
- 20 -
r 1.02 ±5 0.20±2 )' 1.27 ±2 1.27±6 K 1.94 ±4 2.3 ±3 V 063:!:2 0.56:!:5
----
'
.10
1.0
0.1
1.0
the data, obtained with the parameters
the nonordering static susceptibility
= the nearest-neighbours distance.
~ c c
"'
Fig. 2.6.
Longitudinal staggered
susceptibility xft and
the inverse correlation
range K// vs. I T-T I /T , c c
observed in MnF2 , both
above and below T . c
Solid lines correspond
to the optimum fits of
eqs.(2.27) and (2.28) to
indicated. x~t is normalized on o d 11 _s " . d x an K &s norma&&Ze on
(Taken from I19,20IJ
The temperature dependences of 1/K. and xst appear to be well des
cribed by so-called single-power laws II, IJl near T c
I IK
and
where we introduced the reduced temperature
t T/T -1. c
(2. 2 7)
(2.29)
In (2.27) and (2.28) ~ 0 and r are called crüical amplitudes, v and y are so-called critical exponents. (2.27) implies a divergence of the

- 21 -
correlation length ~ = 11K in the net correlation function (2.21) on
approaching the critical point, as we anticipated at the beginning of
this section. xst shows a similar critical singularity. The power
laws (2.27) and (2.28) hold both forT >Tc and forT <Tc' as is
shown by the straight lines in the double-logarithmic plots of Fig. 2.6.
Henceforth we will distinguish quantities for T < Tc by primed symbols.
In addition to ~ and xst many other quantities appear to become
singular at Tc and to follow a similar power-law behaviour close to Tc.
The most common singularities are tabulated in Table 2.1 ., both fora
ferromagnet and for an antiferromagnet. From this table it can be
seen that the role of xst and x (and also of Mst and M) in an anti
ferromagnet are interchanged in a ferromagnet. We mentierred in
Table 2.1. Summary of definitions of critical amplitudes and critical
exponents for several singular quantities in magnetic
systems t = T/Tc-1.
singularity + path of approach quantity
ferromagnet antiferromagnet
correlation length ~(T) ~ ltl V
H=O UT) ~oltl-v, = ' =
0 H st
=0
order parameter M(T) IM(O) = Bit IS '
H=O Mst(T)IMst(O) = BIt I 13 ' H =0 st
ordering rltl-y rltl-y susceptibility x(T) =
' H=O x st (T) =
' H =0 st
specific heat CH(T) = !':I t ~-a '
H=O eH (T) = !':I t ~-a '
H =0 a a st st
nonordering susceptibility X (T) = C I t ~-a
' H=O x(T) = C I t 1-a , H =0
st st order parameter I M(H) I = DI Hl1 I ö' t=O IMst(Hst)l = DI H 11 I ö' t=O
st
section 2.2. that the critical behaviour of a quantity depends on the
pathof approach to the critical point I 121. This can beseen ~n
Table 2.1., camparing the varrishing of the order parameter as a function
of t (or any other relevant nonordering field) and as a function of
the ordering field. The power laws for the nonordering susceptibility
and for the specific heat show the same critical exponent a, as botll
quantities correspond to a derivative of a nonordering density with
- 22 -
respect to the conjugated nonordering field. In the next sections we
shall show that all critical singularities are a direct consequence
of the divergence of the correlation length ~ at Tc.
2.4. Universality
In the description of physical phenomena, one aften starts from the
implicit assumption that the problem contains a minimum length L,
which is characterized by the following facts:
(a) the length scale of the physical phenomena of interest is much
larger than L,
(b) the form of the equations and the parameters ~n the equations
descrihing the physical phenomena are defined with respect to L,
(c) these parameters summarize the relevant information concerning
motions over a scale smaller than L.
One can give many examples of the above statement I si. For instance,
in atomie phenomena the scale of interest is the atomie size, which
~s much larger than the nuclear size, i.e. L ~ nuclear size ~a few
fermis. In the SchrÖdinger equation for the electrans parameters are
contained which depend on the total nuclear charge and moments. These
parameters represent the total effect of the nucleus on the electrons.
The motion of each specific nucleon over a scale much less than L and
the specific details of the interactions between different nucleons
are not of interest. A second example is the sound propagation in a
gas of these atoms. The relevant lengtbs are much larger than the
mean free pathof the atoms. Thus we have L ~a few mean free paths ~
microns. In the sound-wave equation parameters appear which contain
the compressibility and viscosity. These parameters can be calculated by
studying the motion of atoms over scales less than a few mean free
pat hs.
If one wants to give a description of a (magnetic) system reaching a
long-range ordered state, one must study the critical fluctuations,
described in the previous section. The scale of interest for a
description of critical phenomena is of the order of the correlation
length ~ and largely exceeds the microscopie distances. Therefore, it

- 23 -
should be possible to define also a minimum length L with the above
properties (a) - (c) for the description of critical phenomena. L
should be much smaller than ~ and larger than the interatomie distances.
Then, it should be possible to give a description of the critical
phenomena in equations which are defined with respect to L. The
parameters in these equations should represent the total effect of all
processes and interactions which take place over a scale smaller than
L. In sections 2.6. and 2.7. we shall show that this is the very
approach of the Renomalization-Group technique in descrihing and
calculating critical behaviour. Here we want to emphasize a direct
and important consequence of the above statement.
If the exact form of the microscopie interactions between the cor
related particles (magnetic moments) is not quite important in the
description of critical phenomena, many different systems must behave
in the same way close to criticality. This is observed indeed in a
varlety of experiments and calculations I 1,2,4,51. It appears that
only some very general characteristics of the system are important,
so that critical systems can be divided in a few so-called
classes. Systems within the same universality class show
identical critical exponents and very similar equations of state. This
distinction of universality classes is the content of the
which s tates:
The universality class of a critical system with only short
ranged interactions is determined uniquely by:
I. the spatial dimensionality dof the system,
2. the number of independent vector components n of the order
parameter.
In antiferromagnetic systems the effect of longe-ranged interactions
(such as dipole-dipole interactions) is unimportant because of the
alternating sign of the moments. Therefore, all possible
antiferromagnetic systems can he collected in an n-d phase diagram.
This is sho~o'Il in Fig. 2. 7., where for I ,; d ,; 4 the various physically
significant cases are indicated. Systems in which I, 2 and 3 spin
components take part in the ordering process are better known as
Ising, XY and Heisenberg systems, respectively. In addition to certain

- 24
magnetic systems, also superfluid helium and liquid 3He- 4He mixtures
are described by n=Z. Normal fluids, fluid mixtures and alloys
correspond to n~J 11,61. The case n=O appears to describe the statis
tics of polymer chains in a salution !211.
n
spherical
4
Heisenberg 3
XY- planar 2
lslng
polymers 0
Gaussian -2
•
2
... ~
ö lfn expansion
0
0
0
E- expanslon <_,
3
E = 4-d
~/ ~/
~/ / /
V classi
v d>
cal
4 V all n
; :::: //
/ //
/
4 d
0
2. ?.
Diagram of the
(n,d)
relevant
types of systems.
Heavy solid lines
to syste~3 of whioh the oritioal behaviour has been solved
exactly. 0 are the systems. The d=2 XY and d=2
model The squares in-
dioate the oomman systems whioh order in three dimensions. Their
critioal behaviour is described by methods using ex-
pansions in E = 4-d m1d/or 1/n.
In Fig. 2. 7. the heavy solid lines indicate syste:ms for which exact
solutions of the critical behaviour are available. The only realistic
system that has been solved exactly at this moment is the d=Z Ising
model in zero field 1221 . Ihe classical or mean-field model appears to
apply to all systems with dimensionality d2:4. This result will be
further discussed insection 2.7. and is important as a starting
point of approximative RG-calculations (the so-called E-expansion),

- 25 -
to find solutions for systems with small E;4-d. A similar role is
played by the exact salution for n=oo, the so-called spherical model,
which is the point of departure for tbe 1/n-expansion. Thus, approximate
solutions in terrus of small 1/n are sought for more realistic problems.
The Gaussian model for n=-2 corresponds to a merely formal salution of
the mean-field model, which appears to be also exactly solvable for
all d if one substitutes n=-2. To our knowledge this model bas no
physiçal significance. The one-dimensional lattices (d=l) have been
solved for all n 1231 and it is found that they show no LRO for TiO.
For the common d=3 systems no exact solutions are available, but good
approximative descriptions for the critical bebaviour of many
quantities have been obtained from various series expansions 1241.
A su~~ry of the critieal-exponent values for several universality
classes is given in Table 2.2. The predictions for the various
TdbZe 2.2. Summar>J af'
cZasses. The exponents are
vaZues j'ar several
in tabZe 2.1.
metbod ref.
0 11e 131, 15 ';, exact j22,25l
'I! 1/a 0.303-0.318 1.250(1) 5.00(5) 0.640(3) 0. 047 (JO) series j26j
0.1 10(8) 0. 325 (1) 1.240(1) 4 .82(6) 0.630(1) 0.0315(25) s.-exp. '27' ZBI -0.02(3) 0.348(7) 1.318(10) 4.77(6) 0.670(6) 0.04(1) series
-o. oo7 (9) o. 346(9) 1. 3 16(9) 4.81 (8) 0.669(3) 0.032(15) s-exp.
-o. 14(6) 0.373(14) I .405(20)
universality classes have been confirmed by experiments on a large
number of systems, bath magnetic and nonmagnetic. The critical ex
ponents appear to fulfill certain relations such as
a + 28 + y 2
l26j
128 j
a + S(8+1) 2 (2.30) dv + a 2
(2-n )v * y
* This relation follows directly from the definition of x in eqs. (2.20)
and (2.25).

- 26
and many others j1 j. As we shall show in the next section, the.se
relations are a direct consequence of the asymptotic sealing in
variance of a system near criticality. In additie~ several relations
between critical amplitudes appear to be universal j30,31j. For three
universality classes the values of these ratios are summarized in
Table 2.3.
Table 2.3. Su~aYy of rD 1/o
d n A/A'
2 I I
l 0.51 3 1
0.55
l l. 52 3 I
1.36
2. 5.
r;r•
37.69
5.07
4.80
-
ratios (taken from , 3 0 I ) . =Ar • (Compare
2.1. for definitions)
R c
6.78
0.059
0.066
o. 165
o. 17
.8.
R methad x
0.319 i exact
1. 7 5 series
1.6 c-exp.
1.23 series
I. 33 c-exp.
c f system near
(taken from j32 i ) .
So far, our visualization of critical fluctuations is like Fig. 2.8.
Droplets, correlated regions of all sizes up to a maximum size ~.
appear near the critica! point. However, this picture is incomplete.
As each fluctuating region of size ~ is also a nearly critical system,
fluctuations will appear within these draplets and within these
fluctuations yet more appear (see Fig. 2.9.). This clustering of
draplets into draplets continues until the scale of microscopie
distauces is reached. From this picture one may conclude that critical

27
phenomena are related to fluctuations over all length scales between
s and the microscopie distance between particles. (cited from L.P.
Kadanoff !321).
2. 9.
inside of
1:nside of droplets".
picture of a
system near
(taken from I ) •
In other words, a system close to the critical point is sealing in
variant within the limits set by the distance between particles and S•
lvnen observing the fluctuations in such a system through a microscope,
one can decrease the resolving power withafactor s>l and the same
image will appear. This procedure can be repeated until ultimately the
maximum size sof the correlated regions becomes apparen.t. This ob
servation implies that s must be the only significant length in the
description of critical fluctuations. Other lengths, such as inter
atomie distances are too short to play a role. A subsequent unavoidable
conclusion is that the behaviour of the critical fluctuations in the
order parameter on approaching the cri ti cal point, may be cons idered
as being due to a simple change of length scale. Since many critical
quantities are in turn directly related to these critical fluctuations
in the order parameter, a hypothesis may be formulated which
states Jsl: "The behaviour of any physical quantity near a critical point can be
deduced from the way in which it varies under a change in. length
scale. The divergence of the only significant length at the critical
point accounts for the singular critical behaviour of all other
quantities".
The simplest example of this idea is the following. Consider a d
dimensional system with an energy per unit volume è(L). L is a charac
teristic minimum length of the system. If the unit length is enlarged

28 -
d with a factor s, the new energy density becomes s times as large.
Simultaneously the numerical value of the length L deercases with a
factor s. So, under a change in length scale G varies as
'/;(L/s) (2.31)
Sinces is taken arbitrary, eq. (2.31) defines ~as a homogeneaus
of L I I I. This implies that ê is known over the whole range
of its argument, if it is known in one point. It can be verified that
this applies to (;'in (2.31), by choosing s=L. The result is
(2.32)
'\,
which establishes the dependenee of G on the minimum length L.
According to the sealing hypothesis this functional form of G should
hold close to a critical point.
With the correlation length ( as the only relevant length in a critical
system, we define our characteristic minimum length L as L = ~/M,
with M a large number. Then we can write the variation of G with tem-
perature as
(T)/M] (2.33)
This result shows that the critical behaviour of G is determined by
the critical behaviour of ~. For instance, in an antiferromagnet at I
one has ~~t-v for t;:,O and I;~ ltl-v for t<\)0, and (2.33)
becomes
G(T) ~ tvd for and t/1',0
and (2.34) v'd
G(T) ~ ltl , for and tO)O .

- 29 -
In the above introductory example we used an energy density with
argument L to elucidate the idea. Now we want to derive the
functional form which is imposed by the sealing hypothesis on the
more familiar Gibbs free energy of, for instance, an antiferromagnet:
G(Hst'H,T). As we shall see, the procedure is straightforward but de
mands a very careful handling of the definitions of the various fields,
which we introduced in sectien 2.2.
Let us start from a critical point CP, located at [CH t) ,H , • As s c c
we have discussed insection 2.3., CP can be characterized as a point
in (H8t,H,T)-space where the correlation length E; diverges, irrespective
of the path of approach to CP. First we shall choose so-called
scaUng for the description of the critical behaviour near CP.
The first optimum sealing field h is identified with the field which
yields the strengest divergence of E; close to CP and is represented by
ç:(h) (2.35)
Along any pathof approach to CP which has a component along the h-axis,
the divergence of E; close enough to CP will be described by (2.35).
In the plane perpendicular to the h-axis, we can search for the second
optimum sealing axis t, which yields the strengest divergence of
for h=O. This divergence will be described by
sCt) (2.36)
Again, it can be noted that the divergence of ~ is correctly described
by (2. 36) a long any path in the h=O plane, which has a component a long
the t-axis. Similarly, a third optimum sealing axis g is introduced,
along which the divergence of E; is given as
ç:(g) (2.37)
Expression (2.37) applies only for h=t=O.

- 30 -
No new aspects are added when more fields are taken into account. It
was pointed out by Griffiths and Wheeler I 121, that one needs three
and only three types of flelds to obtain a complete description of
the critical behaviour near CP. In the following we shall confine our
selves to this three-dimensional (h,g,t)-space. How the h, g and t axes
are directed in. the (Hst' will not be indicated. We shall
treat the general case in which all three types of fields can be
distinguished, with corresponding exponents After Griffiths
and h~eeler, h,t and g can be identified with the optimum choice of the
ordering field, relevant nonordering field and irrelevant field,
respectively. Now the behaviour of ~(h,g,t) close to CP may be re
presented as the sum of three power laws
(2.38)
When the path of approach contains all three field components, the
strongest divergence (2.35) will ultimately win and describe the
behaviour of ~ correctly close to CP. For h=O (2.36) takes over and for
h~t=O the divergence of~ is described by (2.37).
According to the sealing hypothesis, the behaviour of any quantity,
G(h,g,t) for instance, is determined by the behaviour of ~ only.
Therefore we may write
G(h,g,t) = (';L~(h,g,t)/Mj -aT -aG
+~ g ) IM] • og
(2.39) Combining (2.31) and (2.39) we can write
G(h,g,t) (h,g,t)/t{l = s-d 'i.';[~(h,g,t)/Ms]
CtsJ/aT)-sr +
+ (2.40)
According to (2.39) this is identical with
G(h,g,t) (2.41)

- 31 -
With s an arbitrary number, (2.41) defines G(h,g,t) as aso-called
generalized homogeneaus function I I I. The analogue of (2.32) can -ar
also be obtained by choosing s = t in (2.41):
G(h,g,t) ard G(-h __ __ g_
I) t aT/aH ar/aG '
t t
aTd CÇ:(-h- __ g_
) - t ar/aH ar/aG
t t
(2.42)
Bath notations (2.41) and (2.42) are equivalent I 11 and are commonly
used as alternative, more mathematical definitions of the sealing
hypothesis.
The generalized-homogeneous function tormulation of the sealing
hypothesis, (2.41) or equivalently (2.42), appears to be a very
powerful tool in the description of critical phenomena l33l. For
instance, it implies that all derivatives of G with respect to the
fields, i.e. all densities in the tormulation of Eq. (2.2), are
generalized homogeneaus functions toa. This can be verified by
repeated differentiation of (2.41). The order parameter m, for instance,
is obtained as
m(h,g,t) (1/~-d) (h I/aH I/aG I/aT) s m s . , g s , t s ..
(2.43)
The ordering susceptibility x follows as
x(h,g,t) (2/aH-d) 1/a I/aG t si/aT) • s X (h s H, g s ,
(2.44)
The specific heat is found from (2.4I),with t identified with T-Tc' as
C(h,g,t)
(2.45)

- 32 -
A second important consequence of the sealing hypothesis (2.41) is
that it leads to the experimentally observed exponent relations (2.30).
This can be demonstrated as follows. Let us take an antiferromagnet as
an example and identify Hst as the ordering field h, /Tc as the
relevant nonordering fieldt, and as an irrelevant nonordering
field g. From (2.43) we can derive the power law
(1/a -d) I/a m(h) = s H m(h s H), for g=t=O (2.46)
Using h -aH
Hst and m = Mst' this yields with s = !Hst! substituted:
(2. 47)
at H = He' T = Tc. The last equality follows from the usual definition
of this power law, as presented in Table 2.1. From (2.47) we find
From (2.43) with s
the power law
-aT I tI substituted, we obtain at H
This gives for the exponent i3 the result
Similarly we derive from (2.44) with s
Finally, for a we find from (2.45) with s -aT
ltl the relation
From (2.36) we can idenfity
(2.48)
0
(2.49)
(2.50)
(2. 51)
(2.52)
- 33 -
(2.53)
As all exponents are funetions of aH, and d, there must exist many
relations between the exponents. It ean be easily verified by means of
(2.48) - (2.53) that among others the first three relations in (2.30)
are fulfilled.
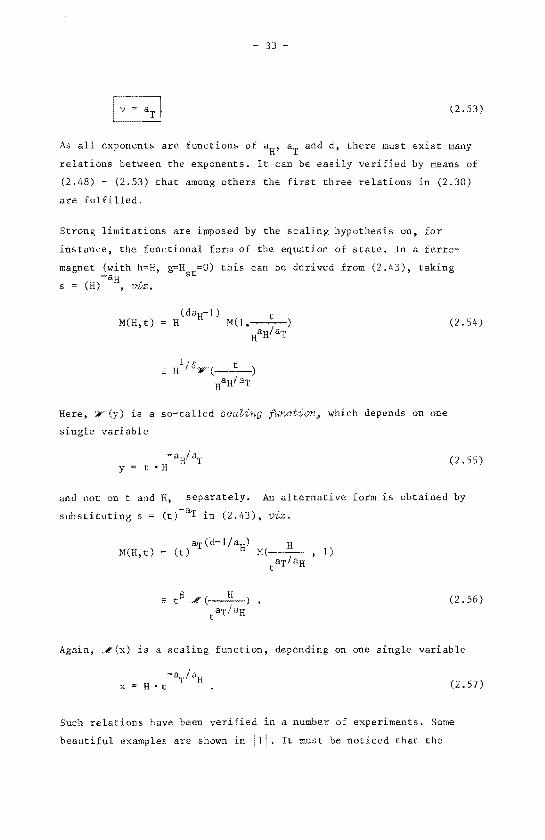
Strong limitations are imposed by the sealing hypothesis on, for
instanee, the funetional form of the equation of state. In a ferro
magnet (with h=H, g=H8
t=O) this ean be derived from (2.43), taking -aH .
s = , V'J....'Z.
M(H,t) H
1 H
1 ) (2.54)
Here, ~(y) is a so-ealled
single variabie
function, whieh depends on one
and not on t and H,
substituting s = (t
M(H, t)
(2.55)
separately. An alternative form is obtained by
in (2.43), viz.
(2.56)
Again, Jt (x) is a sealing funetion, dep en ding on one single variab le
(2.57)
Sueh relations have been verified in a number of experiments. Some
beautiful examples are shown in I 11. It must be notieed that the

- 34
sealing hypothesis (2.41) does not predict the values of the exponents,
nor the exact of the sealing functions.
In the sections 2.4. and 2.5. we introduced two important aspects of
critical phenomena, viz.
I. Critical fluctuations show an infinitely increasing correlation
length ~ on approaching the critical point. Therefore, a length L
can be indicated which is much smaller than ~ and yet much larger
than the interatomie distauces ann' lt should be possible to
describe critical phenomena with equations, in which the parameters
contain the integrated effects of all processes on length scales
smaller than L.
2. A system close to a critical point is sealing invariant between
limits which are set by ann on one hand and ~ on the other hand.
The critical behaviour of any quantity may be considered to be due
to a change in ~. Therefore the result of any effect working on a
critical system, may be considered as merely a transformation of
length scale.
These observations indicate the procedure by which one possibly can
perform real
In the first place one can try to formulate an effective Hamiltonian
~ 1 , defined with respect to a (minimum) length L, in which all
irrelevant details (i.e. with a length scale < L) are contained in the
parameters.~' must describe the critical fluctuations on a scale >> L.
Following the above observation 2., we can study how ~ transfarms
into an effective Hamiltonian~' under a change in length scale. It
would be very attractive to find an;e' with a form similar to the
original~, so that the corresponding parameterscan be related to
each other. Repeating this transformation process, one can try to
obtain reenrsion relations for these parameters. At least this should
be possible for a system at a critical point where, according to the
sealing hypothesis, the system is expected to be sealing invariant.
Then one may also hope to obtain useful ib.formation about a system

- 35
near a critical point, by studying effective Hamiltonians which
closely resembie the critical one. The sketched procedure is the
approach chosen in the Renormalization-Group (RG) technique for the
calculation of critical behaviour.
In the next two sections (2.6. and 2.7.) we shall present a more
detailed description of the RG-approach. lt must be emphasized that
this part may be skipped by readers who are interested mainly in the
experimental part of this work.

36 -
In this section we shall start with a more elaborate discussion of
the various steps involved in the RG-approach. As a point of departure
we use the well known spin-bloek picture of Kadanoff I 1, , as was
done by Wilson in one of his early presentations of the RG-approach
l35l. By means of this model the concept of effective Hamiltonians
will be elucidated. Next we shall indicate the steps to be performed
in the calculation of the RG-transformation. We shall not actually
perfarm these steps, but only show the procedure on basis of the
Kadanoff picture. The calculation will be performed for an exactly
solvable model in sectien 2.7. There, the RG-approach in the calcula
tion of critical behaviour will be treated.
The prescription, how to remave unimportant details from the calcula
tion of large-scale effects, is trivial IBI. Let P(y1,y
2,y
3) be the
probability distribution function for the random variables
-oo <y1 , y 2
<.,. To calculate the average value of any func ti on
f(y1
,y2
,y3
) of these variables we evaluate the integral
(2.58)
For a function f' which does not dèpend on y3
, we can define an equi
valent distribution function P'(y1
- f dy 3 p (y l 'y 2
Then we can calculate the average value of f' as
<f'> p'
(2.59)
(2.60)
For the problem of critical fluctuations, this procedure implies that
one has to formulate a probability function in which the total effect
of all small-scale details are incorporated.

. .
2. 10.
- 37 -
• • • I • • . l·
. . . : 1:
i :•
. . . . . . . ~---1---'.!!at'-,___---1~ I
of Kadanoff, in which a are taken in a block
to a b loek spin ~r D •
Consider a ferromagnetic system of N Ising spins on a simple cubic
lattice with exchange interactions between nearest neighbours. The
Hamiltonian of this system is given by
:r = -2 l: <i, j>
J cit. -~
(2.61)
where s. denotes the ~
spin at site R.; <i,j> denotes the summatien ~
over all nearest-neighbour pairs of spins. We shall use normalized
Ising spins with values +1 or -1, J is clearly defined with respect
to a length scale L = ann the lattice constant. Near a critical
point, we are only interested in spin fluctuations over distauces
much larger than ann' Then we can divide the lattice into N' N/sd
blocks of side L
of the form
(Fig. 2. JO) and try to derive a Hamiltonian:r'
-2 1: 1' cït:-ît:) <i'j'> ~ J
, s! J
( 2. 6 2)
·which describes the interaction between the block spins S'.
<i', j '> denotes the summa ti on over all pairs of block· spins. The
details of processes inside the blocks must be contained in J'.
In practice, the transformation of Jr' into :r' is not straightforward.
For instance, the Ising spins in (2.61) have values ±1, whereas the
block spins S' in (2.62) will only have a similar two-fold spin value
at T = 0, where all spins are perfectly ordered. However, close to Tc

38 -
spin fluctuations exist over all length scales up to ;, and we can ex
peet block spins with values varying from -sd to sd with an average
value 0. Fortunately the distribution of spin values in blocks with,
say, sicles 10 ann or 50 ann or 350 ann will be less different. ~~en the
spins would have no interactions at all this distribution function would
undoubtedly be a Gaussian. Otherwise, it will have a more general bell
shaped form, such as
D(S') "' exp(-vs'2 + uS' 4 + ..... ) •
D(S') is expected to be even inS', to reach a maximum at S'
to be integrable.
(2.63)
0 and
In the case of the Ising system (2.61) the probability function for
the calculation of average values for any quantity is related to the
partition function
\'+] j'+] •I Z l. l. exp(-d!"tkBT). s .=-1 Sr.=- I
l
(2.64)
Z is obtained by weighting each state by the appropriate Boltzmann
factor calculated from (2.61), and the summing over all states of the
system. Anticipating the following step, we can rewrite (2.64) as
z f
with
li dS.f TI D(S.) i=I,N :t·i=I,N 1
2 ö(Si-1),
{2.65)
(2.66)
and f li dSi derroting that the integral has to be performed for all -coi=::J,N
N spins Si• The kernel in (2.65) can be identified with
the probability function Pin (2.58).
Similarly we can introduce a partition function for the spin-bloek
system as
Z' f rr ds:{ n D(s:) i= I ,N'
1 i= I ,N' 1 {2.67)

- 39 -
••here dl"'' is the desired new Hamiltonian descrihing the interactions
between block spins. With the spin-distribution function D(Si) of
(2.63) we can write
z• = f u(S! ) 4 + ~
j rr i= I ,N'
I
dS. ~ exp~~. ( 2. 6 8)
· The overlined Jr indicates a so-called reduced Hamiîtonian. From its
definÜion
i t can be seen, that JiF is the combination of an energy term and an
entropy term. In (2.68) exp[K'[ corresponds to the new probability
function P' in (2,59), which we are looking for. Z' is the wanted
partition function in terros of variables which are significant for the
spin-bloek system, ·viz. the block spins S~. With (2.68) one can ~
calculate, for instance, the two block spin correlation function as
j (2.69)
which is the analogue of (2,60). In the following subsection, we shall
show how one can arrive from one to another , i.e. how the step
(2.59) can be carried out in the spin-bloek system,
Here we shall illustrate how the effective reduced Hamiltonian in
(2.68) can be calculated from the original reduced Hamiltonian K
This is in fact the first step in the iteration process of a RG-calculation.
For such calculations it would be ideal if a set of integration variables
can be found in the integral (2,68) which factorize the integrand. For
example, if K1 0 the partition function z' reduces to the product of
N1
independent single-variabie ') integrals, If u=O and higher-order
terms in S~ are absent, then the integrand factorizes in terms of the ~

40 -
Fourier-transforrned variables S+, defined in (2.14). For this reason
h · · 1 f h f q · f -(rn) 1) ( ) t e pr1nc1p e o t e trans orrnat1on rorndF to , where rn re-
places a nurnber of rn primes, can be most conveniently explained in
momenturn space.
We can define dF in momenturn space as
+• (2.70) -q
with
~ + J(q) L exp(iq.R) J(R). (2. 71)
-+ R
The integration in (2.70) runs over the first Brillouin zone.
J has been norrnalized to give the factor ! in front of (2.70). For
the present discussion we shall anticipate on a result of the iteration
process, narnely that the magnitude of the spins appears to be an unirn
portant quantity in the critical behaviour of a rnagnetic systern. This
allows us to use a spin-distribution function of the forrn (2.63) in
stead of (2.66) already in the first step of the iteration process. 1
Th en we can wri te the reduced Harni l tonian Ji' as
(2. 72)
Here D(S) has been truncated at the quartic term. Now the partition
function Z is written as
z
where J-+ TI d q<l\
0
J -+ TI d s_.. exp q < \ q
(2.73)
indicates that the integration has to be perforrned
J>!oreover, the function exp(-u) exp[uCSk-:1) 2], i.e. (2.63) with v 2u,
closely resembles (2.66), for u-+-oo.

- 41 -
for all s_._ with lql smaller than A • With A we introduce a cutoff 0 0
which in (2.73) still coincides with the Brillauin-zone boundary.
It will follow from the iteration process that the specific shape of
this Brillouin zone is not important at all. Therefore we can simply
use a spherical Brillouin zone:
In our spin system the small-scale fluctuations are related to the S+
with large wave veetors q, i.e.closetoA , whereas the large-scale q 0
fluctuations are represented by the S+ with small q close to the
center of the Brillouin zone. This in~icates an easy way to eliminate
small-scale processes out of our spin-bloek model and to define an effective
reduced Hamiltonian~: Following the guide lines of eqs. (2.59) and
(2.60) we define
d exp[~J (2. 74)
as the new probability function, which contains the total effect of
all small-scale processes with wave veetors q >A. Here a logica! choice
for the cutoff is A= 2rr/L, with L the linear size of the spin block.
The new partition function Z' now becomes
Z' J rr d (2. 75) oo q <A
which is the equivalent of (2.68). However, in this stage we did
define r'.
In the calculation of the expectation value for any quantity which
does not depend on the small-scale processes within the spin blocks,
we now can use (2.75) insteadof (2.73). This means that the number
of integrations to be performed is reduced with a factor (L/ann)d s d
This procedure may be repeated: enlarge the linear size of the spin
blocks with a factor s, reduce the cutoff A with a factor s and calcu
late a subsequent reduced Hamiltonian ~(m) and the new partition
function Z(m). This process may be identified with the observation of
a critical system through a microscope with repeatedly reduced re
solving power (compare section 2.5.).
The sealing hypothesis expresses the expectation that in a critical

- 42 -
system the iteration process can be continued without producing essen-
. 1 h · -=-(m) '1 h bl k · 2 /A h tJ.a c anges J.n Je , untl. t e oe sJ.ze L 1!. approac es i;;. ~(m)
The variations will take place only in the parameters of Je , like J
and Û in (2.72). Finally the situation will be reached, that only a
few giant spin blocks remain for which the calculation possibly can be
performed, If the variation of the parameters J(m) and ~(m) can be
foliowed during the iteration process, one can try to reverse the
iteration sequence and solve the original many-particle problem. This
procedure has been applied recently by Rudnick and Nelson !361, to
calculate the equation of state in a critical system.
An alternative interesting possibility occurs if the iteration process
ends in an reduced Hamiltonian which remains unchanged under
further iterations. This can only occur in a system where the cutoff
A may become infinitely small, i.e. where the block size may become
infinitely large without ever reaching ~. This situation clearly corres
ponds to a system at a critica! point. ~* is called a fixed point
and a large amount of work in RG-calculations is spent in the search
for fixed points in various systems. It will be shown in the next
section tbat studying the changes due to tbe iterations in reduced
Hamiltonians wbich slightly differ from ~*, yields important numerical
a critica! point,
For instance, the values of critical exponents can be obtained.
In section 2.6. we used the Ising model as a starring point for the
discussion on effective Hamiltonians. Here we shall praeeed with a
more general type of Hamiltonian. Many types of physically interesting
Hamiltonians can be >vritten as
,;r" ~ "fe'x + ~.i' (2.76)
where represents "exchange" terms of the farm
(2. 77)

- 43 -
and ~.i represents "single-ion" terms of the form
Aai3s~ s! + L a i3 y 6 s .... s_,_ S+ s..,. + ••• . i R R a,S,y,o R R R R
(2.78)
ai3 -+ The most comrnon examples of physically interesting forms of J (R) are
surnmarized in Table 2.4. 1371. For n=3 the isotropie case corresponds
to the Heisenberg model. From the spin-anisotropic type one can arrive
at the Ising model (J2
J, Jx = JY = 0) or the XY-model (J 2 = 0, Jx JY J).
Table 2.4.
actions
Lower t'wo is further
types
the
In
nents qa are normatized to the eutoffs so q /A . a a
Type
Isotropie J(R) 6ai3
Spin-anisotropic Ja(R)
Cubic J(Ra)
Isotropie "Dipolar" K(R) Ra Ri3/R2
Dzya.loshinski -Horiy AY (R)
(r + q2) oaS
(r + a
~r+ q2 + f(q )2l o a aS ...
-hqaqS + gquqi3/q2
iay + constants
Wi th these forrns of iJY and the comrnonly used spin-dis tribution function
(2.63) the reduced Hamiltonian
form
can be expressed in the very general
I a,8
where
..... q<A
0
vuSyo f f r 4 ->- -+ J .. ,.
q q! q"
(2. 79)
+ •••
(2.80)

- 44 -
Here we used the generalization of (2.71) for the Fourier transfarm of
an anisotropic JaS(R). With the specific choice (2.78) fordFs.i and
(2.63) forD the quantity V~SY 8 is a q-independent combination of
BaSy 8 and u. The q-dependent terms quartic in s~ are usually unimportant q
In case of short-range exchange interactions,JaS(q) may be expanded
in powers of q,
(2.81)
where we introduced q ; q I A and separated the tem q2 8 from the a a a aS
sumover y and 8. With (2.81) we find for (2.80) the commonly used
notation
(2.82)
where
(2.83)
Various . aS ~
examples of the funct~on V2 (q) are given in Table 2.4.
In ref. 1371 detailed expressions for V~Sy 8 may be found. From (2.83)
it can be seen how the temperature enters into the calculation. As T
is lowered, one or more eigenvalues of the matrix raS may vanish.
It will be seen below, that this leads to criticality at the temper
ature Tas. 0
In the RG-approach one attemp~ to relate the various
aS d aSy8 f d d "1 . V2 an V4 o two subsequent re uce Ham~ ton~ans
constants in the
~(m) and ~(m+ I )
calculated from (2.74) in an iteration process where the cutoff A is . (m+l) (m)
repeatedly decreased by a factor s, b.e. A ; A /s. From its
d f . · · · · b · h ~(m) · d f" d · h · e ~n~t~on ~t ~s o v~ous t at dF ~s e ~ne w~t respect to ~ts cut-
ff ' (m) · f ~(m) · f 1 1 · o H • An express~on or dF ~s use u on y when the correspond~ng
cutoff A(m) is specified. Therefore, two reduced Hamiltonians can be
correctly compared only when they have the same cutoff. For a compar-. f ..::cm) . h ..::cm+ I) 1. f d f. ~son o dF w~t dF , a resca ~ng has to be per orme ~rst to

- 45 -
make the numerical value of the cutoff A (m+ 1) equal (m)
to A , by de-
fining a new· unit length (m+l) (m)
et =s.e!l, • Th is has to be done in each
iteration cycle. Usually a lso the spin va lues are rescaled in order
to keep the constant in the of (2.82) equal to unity.
Summarizing the three steps in a complete cycle of the RG-iteration
process, we have .:::.(m) · f d · .:::.(m+l) d' (? 74) ff · JF ~s trans .orme ~n dl" accor ~ng to ~. . The cuto ~s
reduced as
1) = A(m) /s.
The number of degrees of freedom reduces correspondingly as N(mt'l) = N(m) /sd.
As a result of the redefining of the unit length as
(2. 84)
all numerical values of the spatial veetors and momenta are re
scaled as
î\:(m)/s (2.85a)
q<m+l) (2.85b)
This brings the numerical value of A(m+ 1) back to the value of
Simultaneously the density of points in the Brillouin zone is red duced by a factor s •
The spin veetors are rescaled with a factor c to preserve the
numerical constant in the
1)
q sim) Ie
q
of (2.82), i.e.
(2.86)
With ~fm+ I) indicating th<é r:escaled?+ 1, the above complete 'cycle
of the iteration process is denoted as
1) p i;Cm) l
where is the s)cmbol of a RG-transformation.
The transformation under of the Gibbs free energy,defined by

46 -
is expressed by the following transformation rule
Similarly, one finds for the net spin-correlation function
Gai3 r (m+ 1) n LR
(2.87)
(2.88)
Now, the iteration process can be started and one can cernpare the 2(m+l) ~(m)
numerical values of the constauts in Jl"' 1 and ~1 , and establish .ai3yo aBy6
recursion relations for the coefficients raS' J 1 and V4 , as was
expressed in Kadanoff's block-spin idea. There is one minor difference
between the RG-approach and the Kadanoff picture in sectien 2. 6. In
the Kadanoff model one increases the spin blocks in a system of
constant magnitude with a given ;. Here the cutoff is fixed, and s • (m+l) (m)
decreases ln each cycle as s s /s according to (2.85a).
As an example we consider the reduced Hamiltonian (2. 79) containing
only the terms bilinear in the spin variables, i.e.
t q<A
0
Here we shall confine ourselves to an isotropie system, where
J(q) J(q 2 ) and hence we obtain:
with (cf. (2.83))
r J( 0)-A.
The corresponding partition function is according to (2.75)
z a r L J IT d S+ exp l- U a~ q<A q q<A
0 0
(2.89)
(2.90)
(2.91)
(2.92)

47
This is the product of Nxn independent single-variabie Gaussian integ
rals (n the number of spin components), and can be solved exactly as
z (21T) ( 2. 9 3)
Also the expectation values of several interesting physical quantities
can be calculated exactly. For example, the net two-spin correlation
function GaS(q) is calculated as n
<S'! q
_, > -q
~If}1 d aS -oo q<A
0
From aTGaS(O) we find (cf. (2.91)): n
q Cl. s [~] (S S +)exp dl"' q -q
(2.94)
(2.95)
For T T0
the susceptibility diverges, so T0
must be identified
with the critical temperature. The divergence is described by a crideal
exponent y 1 (cf. Table 2.1). Comparison of (2.94) with (2.20) shows
that in the above model
r "' r- (2.96)
so v = ~, and moreover n = 0. Exactly the same results are obtained
from mean-field calculations I 1 I. Therefore, the above reduced model
Hamiltonian (2.89) is known as the classica] model. This result is not
very surprising, as (2.89) implies a Gaussian spin-distribution function
((2.63) with u=O) in which short-range interactions between spins are
not taken into account.
~ext, we shall consider the iteration procedure of the RG-approach for
this classica! model. In the first step (2.84) we reduce the cutoff !::.,
with a factor s, i.e. A'= ,\fs. Then dl"' is found from (2, 74) to be

So,
r:- •' exp~.J
exp [-~
f I:
s
A o< s
=di" + c.ons tant. A
0
48
TI d S+ exp f + q
s < q<Ao
(2. 97)
(2.98)
Resc.aling the lengtbs and spins ac.c.ording to (2.85) and (2.86) yields
(2.99)
In order to keep the constant in the ~2 -term equal to unity, we have
substituted
(2.100)
Frorn this procedure it c.an be c.onc.luded firstly, that the exact choice
and shape of the cutoff is not significant, since the original choice
is restored after each cycle. Secondly, the spin value is rescaled in
each cycle, so the value of the original spins is not important for
the results of this RG-procedure.
For the recursion relation of r we find
(2. 10 I)

- 49 -
~~en the complete expression for
one finds in addition 1371 of (2.82) is taken into account
(2.102)
(2.103)
From the expressions (2. lOl) to (2. 103) it can be seen that under the
iterative application of the RG-transformation P(with s >I, of course),
the r-term increases infinitely, whereas the ?2-term temains constant
and higher-order terms vanish.
In the iteration process, the special case ~(m+l)= ~(m) = ~* corresponds to a so-called fixed point. This can only occur if the
correlation length ~ remains much greater than 1/A in the whole iter
ation procedure. This means that
lim ~(m) ~(o) /sm » 1 (2. 104) I!f+OO
which fot s > holds only if t;(o) = 00 • Apparently a fixed point always
corresponds to a system with ~ = oo, i.e. a system at a critical point.
In the above example this situation will ultimately be reached under
the condition r 0, i.e. fot T This once again identifies T0 as
the critic al temperature. For r 'f 0 (2. I OI) implies an ever-increasing
rCm) due to the iteration process. This corresponds to an increasing
(T-T0 ), and the series of reduced Hamiltonians ~(m) describes how
the sys tem is removed from the cri tic al point. This is in accordance
with the content of the sealing hypothesis, viz. the change in any
physical quantity near a critical point can be deduced from the way it
behaves under a change in length scale.
It is not difficult to derive how the coefficient of the quartic term
Va4
Syó in (2.79) changes under the RG-transformation. We find
(2.105)
(compare (2.99)). With (2. 100) one arrives at

4-d s
- 50 -
(2.106)
From (2.106) it can be concluded that the quartic term varrishes under
the iterations for
4-d < o. (2.107)
This means that the classica! model gives a good description for any
system with d > 4. For d < 4 one can try to treat the quartic term as a
small perturbation compared with the quadratic term. From (2.106) it
·becomes clear that i t is far more important that <: = 4-d is small, than
that is small. On basis of this idea a special perturbation
methad has been developed, the so-called technique. 138,
6-IOI
In general, the RG-transformation IR cannot be given in an exact form.
If one starts from the reduced Hamiltonian (2.79), which might be ex
tended with odd terrus in the spin variables to describe magnetic
systems in preserree of a magnetic field, the transformation is always
approximative. In most cases, the corresponding calculations are
complicated numerical procedures, where the use of a large computer
is indispensable. The above choice for u:<. as a partial trace over the
spin variables in momenturn space is certainly not unique. For instanc.e,
an IR which remains closer to the transformations in the Kadanoff model
and is applied in real space, was developed by Niemeijer and Van
Leeuwen I 391 to treat Ising systems. Although the calc.ulations in
volved in RG-transformations for rea1ly existing systems are compli
cated, the principle remains simple, and it is instruc.tive to notice
how important information on critica! behaviour may be derived from
the sequenc.e of RG-transformations.
This c.an be conveniently illustrated by following the variations of
~(m) under the repeated action of IR in a parameter space. Th is space
is spanned by all parameters whlc.h are present in 2, eac.h parameter
corresponding to an axis. Eac.h point in this parameter space corres-
ponds to a spec.ific. , with specific. valnes for eac.h of the parameters.

- 51 -
Fig. 2.11.
Parameter space with iso-~
su1~[aces. The tine represents
In the above classica! model, the axes would correspond to r,
v: 6Y8
, O'(q4) etcetera. The parameterspace can be considered as an
extension of the field space, which was introduced in section 2.2.
All thermodynamic fields are included in one or more parameters, for
instanee r T-T0
in the classica! model. However, not all parameters
correspond to thermadynamie fi.elds, as also parameters like the strength . • . . • . (Aas d aSyr5 . of exchange lnteractlons J or slngle-lon anlsotroples an B ln
(2.78)) are present.
ends in a fixed
2.12.
'l'r•ajectories o.f various 1•educed
Hami lto;ians Jf''. (T 2 > T 1
>
i.s on cr1:tical-
surface Soo and its
AU other trajectories cur1Je a:Jvay .fl~om S00
•
In parameter space one can indicate iso-~ surfaces, i.e. (hyper) planes
of constant correlation length, the plane ~ = being called the cr•iticaL
sur.face. Fig. 2. 11. shows some iso-~ surfaces, crossed by the pathof
a system with smoothly varying temperature. At T Tc this path reaches
the critica! surface. In the classica! model the direction of the path
would be along the r-axis. Each point of the path can be taken as a

- 52 -
starting point for the RG-iteration process. As discussed above, the
iterations will carry the system to smaller
since
if one starts at Tl Tc,
,(o)/ m c, s ' s I . (2.108)
However, if the point at the critical surface is the starting point,
then ~ remains infinite (see Fig. 2. 12.). Starting
described hy ~(m) for increasing m is called the
, the path
of
Fig. 2. 12. illustrates that the trajectories of all reduced Hamiltonians,
not lying on the critical surface, curve away from 500
• The trajectory
of (T=Tc) will be a line in the critical surface, which can end in
two ways. Either, it can end in a , where
(2.109)
or it can flow to a region in parameter space, in which the partition
function has a thermodynamic instability, repreaenting a first-order
transition 1371. Here we shall confine ourselves to the fixed points.
In the discussion of the classical model we shortly mentioned that
the critical behaviour of a system near a critical point can be derived
from the way in which a reduced Hamiltonian :;;r close to :i·* is trans
formed under the repeated action of l=l. The location of 7 with respect
to ifF"' can be indicated as
+ (2. 11 0)
where Q denotes a unit vector in the parameter space and l corresponds
to the "distance" between K and Ir*. To find a description of the critical hehaviour, it is assumed in the
RG-approach that the RG-transformation IR can be linearized near the
fixed point. This is expressed by
(2. lil)
where describes a linear transformation of fiiv.

- 53 -
One can define a set of eigenveetors Q. and eigenvalues H. as 1 ~
For a reduced Hamiltonian expressed in terros of these eigenveetors as
~(m) :;r*+f:t~m)Q., . ~ 1
(2. 1 1 3) 1
the RG-transformation consists of linear transformations like
t~m+1) Q. ~ ~
(2. 114)
The operator l and its eigenvalues depend explicitly on the choice for
the scale factors. The operators l(s) constitute a semi-group, character
ized by the property
l (ss.) (s) (s'). (2. 115)
Hence we have
(2. I 16)
for all eigenvalues Hi' which is fulfilled by
H. ~
(2. 1 1 7)
The change in dis tance ti between ,;;Cm) and dl"* in the direction of Qi under the action of Q is then found as
lè ~m) 1
s""
~i m (s ) t?
~
a,
a3
a.
(2. I 1 8)
Fixed ,~~ wüh the
critical
by irrelevant
a:nd Q1
is a relevant;
eigenvector.

- 54 -
* Ài If there is some eigenvector t;i with eigenvalue s , where Ài > 0, the
distance between ,~Cm) and ,:.r* will increase towards infinity along
the Q.-axis, according to (2.118), unless ~? 0. As the system is l l
carried away from criticality for ~?1 0, the corresponding eigenvector l .,
Qi is called relevant. An eigenvalue Hi with Ài < 0 will decay and the
corresponding eigenvector Q. is called irrelevant. If some À.= 0, the l l
corresponding Q. is called marainaZ. So, one can imagine that the :L ~
parameter space near a fixed point on the critical surface is spanned
by the complete set of eigenveetors Q., and that the critical surface 1
is spanned by the irrelevant veetors only (see Fig. 2. 13.). The
trajectory of a reduced Hamiltonian with the coefficients ~i of all
relevant eigenveetors zero, i . . a point at the critical surface, will
end at the fixed point Y,* . Otherwise, the trajectory will bend away
from S00
• Therefore, at least some of the coefficients ~i belonging to
relevant eigenveetors Q. may be considered as the relevant fields, l
which were introduced in section 2.2. A similar conclusion can be
drawn about irrelevant fields. For the classical model we already ob
served that the parameter r corresponds to a relevant eigenvector Q. :L
ofil, as its eigenvalue is s 2 according to (2.101), i.e. À.=2. The 1
numerical value of r must be identified with the coefficient ~i of
this Q. which therefore corresponds to the relevant field T-T • By 1 0
means of eqs. (2.102) and (2. 103) one may classify jaSyo as marginal 1
and the terms &(q4 ) as irrelevant.
With use of the recurwion relations (2.118) for the fields 2~m), we 1
obtain for the Gibbs free energy (2.87) the expression
-[ (m+l) {m+l) J G ~ l '~2 ''' '· •
-[À1(m) Àz(m) J G s 11
,s ~2 , •....
c[~ (m) 1 , , .... .J . {2. 119)
So, the RG-approach yields that G is a generalized homogeneaus function,
as long as the linearized transformation i. is a good approximation of
IR, i.e. when the term CI'(X. 2) in (2.111) is negligable. With increasing
relevant ti this assumption will ultimately become unvalid. We can
therefore define the critical region as the region in parameter space

- 55 -
where the expression (2.119) holds. Also the correlation function
(2.88) is a generalized homogeneaus function. With c =sa, where a is
an arbitrary number, we find
(2.120)
From the exponents À1, À2 etc. all other critical exponents can be
derived, as was illustrated extensively in section 2.5. Hence, the
critical exponents of a critical system can be calculated in the RG
approach, by determining the eigenvalues of the linearized RG-trans
formation t_ (2. 117).
In general, more than one fixed point can be present on the critical
surface. To each fixed point a characteristic type of critical be
haviour is related. Each fixed point will have its own domain of
attraction, which covers all reduced Hamil tonians J1P on with
trajectories ending in the fixed point under consideration. One can
draw an extensive analogy between the trajectory foliowed by an ~(m) under the repeated action of ll and the path of a ball on a surface
with relief under the action of gravitation l35l. A fixed point
corresponds in this analogy to a point in the surface relief, where
the slope in all directions is zero. Different types of fixed points
then can be characterized by their stability. On there can be
one or more stabie fixed points (corresponding to potenrial wells in
the analogy), unstable fixed points (mountain tops) or saddle-point
like fixed points. All three types of fixed points are shown in
Fig. 2.14.
A fixed point (point A in Fig. 2. 14.) is surrounded by its
domain of attraction, which is spanned by the irrelevant veetors
All reduced HamiltoniansjF in this domain have trajectoriesending
ln This implies that all systems, which are described by some ~
in this domain, wi 11 show the cri tic al behaviour corresponding to ~* .

- 56 -
between two u.Jhich can
2.14.
reZated to rmûtioriticat
b.ehavZ:our. The trajecto:ry of P
ilZustrates the
rise to crossover behaviour.
Therefore, one can conclude that these domains of attraction constitute
corresponds to a specific universality class. A saddle-point-like fixed
point is unstable with respect to some of the eigenveetors in the
critical surface, which apparently are reZevant for this specific kind
of critical behaviour (point C in Fig. 2.14). This behaviour is inter
preted as multi-critical behaviour and this kind of fixed points denoted
as multi-critical points. The domain of attraction of such a fixed
point (i.e. the multi-critical surface) constitutes only a small sub
space of the entire critical surface. Consequently also in the therma
dynamie field space, the occurrence of multicritical points will be rare
compared with the occurrence of critical points. For an unstable fixed
point all eigenveetors are relevant. Therefore, such a point will be
seldomly found in nature.
The competition between two fixed points can give rise to crossover
phenomena. A trajectory can closely pass by a fixed point and ulti
mately bend towards another one (see Fig. 2.15). In such a case it is
possible to observe two kinds of critical behaviour. During the RG
iteration process one can initially, i.e. on a small length scale,
cbserve a critical behaviour which is characteristic for fixed point
C (in Fig. 2. 14), whereas finally, i.e. on a large length scale, the
characteristic critical behaviour of fixed point A is found. A similar
crossover can be observed in thermadynamie field space, when two or
more critical points, belonging to different universality classes, are

- 57 -
located at close distance. This behaviour will be described in more
detail in chapter III and constitutes one of the main topics in the
experimental study on CsMnBr 3.2D20, which we describe in chapter VI.
2.15. Artist at
the critical- sux•face from fixed

- 58 -
II
111 H.E. Stanley, "Introduction to Phase Transitions and Critical
Phenomena", (Oxford U.P., Ne" York, 1971).
121 "Phase Transitions and Critical Phenomena", Vol. 1-3 and 5,
(C. Domb and M.S. Green, Eds.), (Academie Press, Ne" York, 1972-77).
131 C.J. Thompson, Contemp. Phys. ~. 203 (1978).
141 "Critical Phenomena", Proceedings of the International School
of Physics "Enrico Fermi", Course LI, (H.S. Green, Ed.),
(Academie Press, Ne" York, 1971).
151 "Local Properties at Phase Transitions", Proceedings of the
International School of Physics "Enrico Fermi", Course LIX,
(K.A. !>!Üller and A. Rigamonti, Eds.), (~orth Holland, New York,
1976).
161 H.E. Fisher, Rev. Mod. Phys. 46, 597 (1974).
171 P. Pfeuty and G. Toulouse, "Introduction to the Renormalization
Group and to Critical Phenomena", (Wiley-Interscience, Netv York,
1977).
js[ S.K. Ma, Rev. Mod. Phys. 597 (1974); S.K. Ma, "Hodern Theory
of Critical Phenomena", (W.A. Benjamin Inc., Massachusetts, 1976).
[9[ K.G. Wilsou and J.B. Kogut, Phys. Reports l 75 (1974).
I lOj Vol. 6 in the series of !2!.
[ 11 [ F. Reif, "Fundamentals of Statistica} and Thermal Physics",
(l'lcGrawhill, New York, 1965).
[ 12[ R.B. Griffiths and J.C. Wheeler, Phys. Rev. ~l• 1047 (1970).
I 131 See J. Als-Nieisen in vol. SA of 121.
I 14[ W. 'larshall and S.W. Lovesey, "Theory of Thermal ~eutron Scat
tering", (Oxford U.P., New York, 1971).
I 15[ M.P. Schulhof, P. Heller, R. Nathans and A. Linz, Phys. Rev. B~,
2304 (1970).
1161 A. Tucciarone, H.Y. Lau, L.M. Corliss, A. Delapalme and
J.l'!. Hastings, Phys. Rev. B4, 3206 ( 1971).
1171 M.E. Fisher, J. Math. Phys. ~. 944 (1964)'
M.E. Fisher and R.J. Burford, Phys. Rev. I 583 (1967).
I1BI L.S. Ornstein and F. Zernike, Proc. Acad. Sci. Amsterdam
793 (1914), z. Physik 134 (1918).
I 191 N.A. Lurie, G. Shirane, P. Heller and A. Linz, AIP Conf. Proc.
_!_Q, 93 (1972).

- 59 -
[2ol M.P. Schulhof, R. Nathans, P. Hellerand A. Linz, Phys. Rev.
2254 (1971).
[21[ P.G. de Gennes, Phys. Lett. 38A, 339 (1972).
[22[1. Onsager, Phys. Rev. 65, 117 (1944),
B. Kaufman, Phys. Rev. ~. 1244 (1949).
[231 H.E. Stanley in Vol. 3 of !2[.
[241 Vol. 3 of [2[.
[25[ C. Domb in Vol. 3 of !zl , see a lso Vol. I of [2[ .
[26[ Various authors. Values tabuiatod by D. J. Wallace in Vol. 6
of !2[.
!27[ J.C. le Guillou and J. Zinn-Justin, Phys. Rev. Lett. 39, 95 (t977).
!28! G.A. Baker, Jr., B.G. Nickeland D.I. Meiron, Phys. Rev. B
1365 (1978).
!29! H.E. Stanley, Phys. Rev. ~. 1718 (1968).
!Jo! A. Aharony and P.C. Hohenberg, Physica 86-88B, 611 (1977),
M. Barmatz, P.C. Hohenberg and A. Kornblit, Phys. Rev. ~.
1947 (1975).
!31! P.C. Hohenberg, A. Aharony, B.I. Halperin and E.D. Siggia,
Phys. Rev. !.Q, 2986 ( 1976).
l321 L.P. Kadanoff in Vol. SA of [z!.
[33! A. Hankey and H.E. Stanley, Phys. Rev. B6, 3515 (1972).
!34[ L.P. Kadanoff, Physics l• 263 (1966).
[35[ K.G. Wilson, Phys. Rev. B4 3174 (1971).
[361 J. Rudnick and D.R. Nelson, Phys. Rev. BI 2208 (1976).
!37! A. AharonyinVo1. 6of !2\, seealso 161.
!38[ K.G. Wilson and M.E. Fisher, Phys. Rev. Lett. 248 (1972).
139[ Th. Niemeijer and J.M.J. van Leeuwen, in Vol. 6 of 2[.

- 60 -
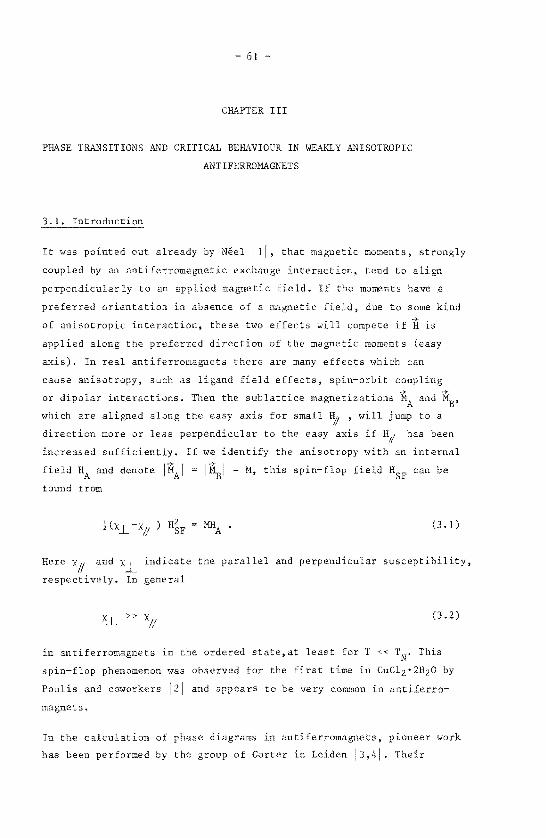
- 61 -
CHAPTER III
PHASE TRANSITIONS At~D CRITICAL BEHAVIOUR IN WEAKLY ANISOTROPIC
ANTIFERROMAGNETS
3.1. Introduetion
It was pointed out already by Néel ! I I, that magnetic moments, strongly
coupled by an antiferromagnetic exchange interaction, tend to align
perpendicularly to an applied magnetic field. If the marneuts have a
preferred orientation in absence of a magnetic field, due to some kind
of anisatrapie interaction, these two effects will compete if H is
applied along the preferred direction of the magnetic moments (easy
axis). In real antiferromagnets there are many effects tvhich can
cause anisotropy, such as ligand field effects, spin-orbit coupling
ar dipolar interactions. Then the sublattice magnetizations MA and
which are aligned along the easy axis for small Hl' , will jump to a
direction more ar less perpendicular to the easy axis if has been
increased sufficiently. If we identify the anisotropy with an internal
field HA and denote IMAI : : M, this spin-flop field HSF can be
found from
! (X_L MHA . (3. I)
Here x§ and indicate the parallel and perpendicular susceptibility,
respectively. In general
(3.2)
in antiferromagnets in the ordered state,at least forT << Th is
spin-flop phenomenon was observed for the first time in CuClz•2HzO by
Poulis and coworkers 121 and appears to be very camman in antiferro
magnets.
In the calculation of phase diagrams in antiferromagnets, pioneer work
has been performed by the group of Gorter in Leiden 13,41. Their

- 62
calculations are based on the molecular-field (MF) approximation,
which is exact for systems with d ~ 4, but displays severe short
comings close to critical points in realistic systems with d ~ 3, as
we showed in chapter II. Kevertheless, the MF-approximation has proven
to be a good guide in the prediction of qualitative features of phase
diagrams in antiferromagnets. Therefore, we shall start in section 3.2.
with a presentation of the MF-results for antiferromagnets with weak
spin anisotropy, often called spin-flop systems. In sectien 3.2. we
shall confine ourselves to the results obtained for spin-flop systems
in a parallel magnetic field H# , i.e. with H applied along the easy
axis.
Gomplementary information, especially on the critical behaviour in
spin-flop systems, is obtained from calculations in the RG-approach.
The main lines and results of this approach in spin-flop systems are
presented in sectien 3.3. We shall show that in spin-flop systems two
different magnetic phase diagrams can occur, which in addition to
lines of critical points also display a multi-critical point. Sofar,
only the so-called bieritiaat point has been observed in spin-flop
sys tems. The so-called tetraaritiaal point is predicted in MF-ap
proximation, but has been questioned for several years on basis of
RG-calculations jsj. Recently, Bruce and Aharony pointed out that such
a point can exist in spin-flop systems, indeed j61. In chapter V of
this work we shall present strong evidence for the preserree of such a
tetracritical point in GoBr2•6(0.48 D20, 0.52 H20). Section 3.3. may
be skipped by readers who are only interested in the experimental part
of this work.
In section 3.4. we present the so-called extended-sealing theory,
which describes the critical behaviour close to a multi-critical
point. This theory is a straightforward extension of the sealing
theory of critical points, treated insection 2.5., and provides also
a description of the crossover from critical to multi-critical behaviour.
The presentation and discussion of the predictions based on the ex
tended-sealing hypothesis will be rather extensive, as the experimental
verification of this hypothesis near the bicritical point in the phase
diagram of GsMnBr 3•2D20 forms the essential part of chapter VI.

- 63 -
Finally, section 3.5. treats the phase diagrams and the corresponding
critical behaviour of spin-flop systems in a skew magnetic field, -i.e.
with H not parallel to the easy axis.
As a starting point of the discussion He consicter a microscopie
Hamiltonian of the general form
-zE Il~ 6 c"R. <i,j> aS 1.
s~ s~ -1. J I I
i a (3. 3)
consisting of an anisotropic exchange term and a Zeeman term. <i,j>
indicates the sum over all pairs of spins and S~ denotes the a 1.
component of
JaS in (3.3)
(3.3) as
the spin at site We shall assume that all tensors
will have the same principal axes, so that we can write
:r~ - z I I <i,j> a
s~ s~ -1. J E I
a i
where L now denotes a summatien of the components along the three
(3. 4)
princi~al axes of J and Ja Jaa. Here we shall confine ourselves to
simple antiferromagnets, which can bedescribed by two interpenetrating
sublattices A and B.
In the MF-approximation one can write the Gibbs free energy of such a
two-sublattice antiferromagnet as 171
(3. 5)
Here the magnetizations of the sublattices are normalized as
and (3. 6)
where )l s. (3. 7)
)l is the magnitude of the magnetic moment of the N magnetic ions.
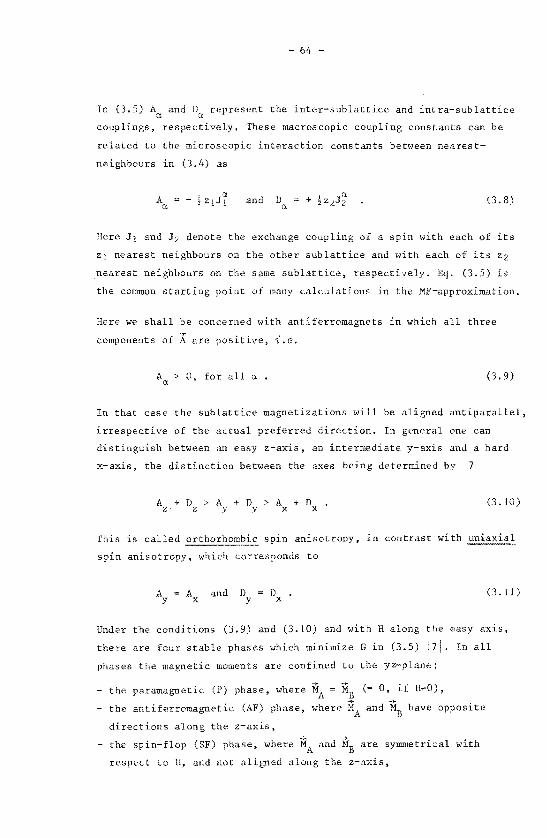
64 -
In (3.5) A~ and D~ represent the inter-sublattice and intra-sublattice
couplings, respectively. These macroscopie coupling constants can be
related to the microscopie interaction constauts between nearest
neighbours in (3.4) as
A ~
and (3. 8)
Here J 1 and J 2 denote the exchange coupling of a spin with each of its
ZJ nearest neighbours on the other sublattice and with each of its z2
nearest neighbours on the sarne sublattice, respectively. Eq. (3.5) is
the cornrnon starting point of rnany calculations in the MF-approximation.
Here we shall be concerned with antiferromagnets in which all three
cornponents of A are positive, 1:.e.
A~> 0, for all a • (3. 9)
In that case the sublattice magnetizations will be aligned antiparallel,
irrespective of the actual preferred direction. In general one can
distinguish between an easy z-axis, an intermediate y-axis and a hard
x-axis, the distinction between the axes being deterrnined by 7 i
A + D + z z > + D x
spin anisotropy, which corresponds to
A y
A and D x y D x
(3. 10)
( 3. I I )
Under the conditions (3.9) and (3.10) and with H along the easy axis,
there are four stable phases which minimize Gin (3.5) 171. In all
phases the magnetic mornents are confined to the yz-plane:
- the
- the
-+ -+ paramagnetic (P) phase, where MA = MB
-+ antiferrornagnetic (AF) phase, where MA
directions along the z-axis,
_,. and MB have opposite
-+ -+ - the spin-flop (SF) phase, where MA and MB are symmetrical with
respect to H, and not aligned a long the z-axis,

- 65 -
-+ a less familiar, intermediate (I) phase, where MA and make
unequal angles with H.
The behaviour of the sublattic.e magnetizations as a function of H can -+
be visualized for T=O, where and ~are completely saturated, i.e. N
MA = MB 2 p. Then one can express the homogeneaus magnetization M and the staggered magnetization as
-+ (-;:; + -+ N mB) A ::ll.l sin :S (0, -cos;;;, sin;:;) (3. I 2)
and -+ (-;:; - -+
(0, sin ç, cos t;) (3. 13) Mst - mB) N l.l cos 0 ' A
where the angles ö and ç are defined in Fig. 3.1.
-+ -+ Definition of M, M
8t, ö
and 1; in an
z.ations
For the four different phases the variation of and 1; with H at T=O
are surnmarized in Table 3. I., tagether with the corresponding stabi
lity conditions i BI.
Table 3, • Character and conditions of in
antiferl'Omagnetic systerr.s with t:'wo sublattices /8/
Phase Picture sin ç sin ö stability conditions
AF - 0 0 h.:;/q -\'~ [<h-IQ)/ (-RIQ)]! -' IQ:shsMi</Q(l-R), I [IQ(h-/Q)/(-R)J 2 R<O,
IQ (l-R/Ql
i s; ~ I h/ ( 1-R) R<l ,Q<l ,/Q(J-R):sh;Sl-R
--- I 1 hc::Max(l-R, Q-R) ---,2-D , Q=(A -A +D)/(A +A +D), y z y z y
R=+2D/(A +A +D), h=l.IH/ (A +A +D) z y z y

- 66 -
In an increasing magnetic field, the phase with the lowest free energy
will always be realized. For different combinations of molecular-field
constants, the sequences of realized solutions are depicted in Fig.
3.2. The same result has been obtained by other authors 191 with
AF
D A.
different combina.tions of MF-constants
the
T=O.
3.
thema-
stable
so lutions oeeurri ng
from 171 ),
reference to the ordered phases in 4He quanturn crystals, a system
which is described by a Hamiltonian similar to (3.3). In the present
context, we are interested in systems which display two or more ordered
phases. Fig. 3.2. shows that this behaviour can be met in systems where
D<A <A+D, y z (3. 14)
These systems all have an SF-phase and therefore are called spin-flop
systems. Haterials in which D > A correspond to the so-called meta-y
magnets, which recently have been reviewed by Stryjewski and Giordano
I tol. Systems with Ay > A2+D do not fulfill condition (3.10), which
defines z as the easy axis. The spin-flop systems can be divided into
two classes, which display a qualitatively different behaviour in a
magnetic field.
The most familiar class of spin-flop systems consists of materi.als
with 0 < D < AY < A2
+ D. At r~o the magnetic moments of these systems
are ordered in an AF-phase for H < HSF and in an SF-phase for H >
The spin-flop transition at H HSF' introduced in section 3. I., is

- 67 -
a first-order transition. At HSF the order parameter of the system in
the AF-phase, i.e.
(3. 15)
changes discontinuously from a finite value to zero. Simultaneously,
the order parameter of the system in the SF-phase, changes dis-
continuously from zero to a finite value. is defined by
Mj_ - My st st ' (3. 16a)
in case of a system with orthorhombic anisotropy, and by
(3.16b)
1n case of uniaxial anisotropy. At a sufficiently high magnetic field
vanishes continuously at the critical point (H = ' T 0). For
H He the system is in the P-phase, which in nonzero field corresponds
to a field-induced ferromagnetic ordering.
A typical H# I-diagram for this class of systems is shown in Fig. 3.3a
i4,11 i. As indicated insection 2.2., the transition from the AF-phase to
the P-phase takes place at a line of critical points T// (H), which is !I c
the continuation of the Néel point for H t 0. At Tc (H) the order
h . 11 • . . 1 parameter of the AF-p ase, he. M t'van1shes. SJ.mJ.lar y, the order ..1.. s
parameter of the SF-phase M8
t vanishes. at a secoud line of critical
points (H), which is the continuation of (H He' T = 0) for I t 0.
Below, these two cri ti cal lines will of ten be called "the paramagnetic
phase boundaries". Both critical lines meet the first-order spin-flop
line, being the continuatien of the point (H T = 0) for I t 0,
at the samepoint (Hb,Ib). According to the.definition insection 2.2.,
(Hb,Tb) is a multi-critical point. It is commonly called a bicritical
point I 121, as in the H# T diagram two different lines meet
in this point. It wi 11 be shown below, that this denominatien must be
considered as an ad-hoc choice, although the terminology suggests a
logical di vision of mul ti -critical points. In the description of
cri tic al behaviour near the bi cri tic al point, which is treated in

section 3.4., the order parameters
AF
(a)
p
bicritical -~-point
Fig. 3. 3. B(Jhematic (H11
T)
68
and Mj_ both play a role. st
SF
AF
(b)
p
tetracritical / point
T/(H)
of a spin-flop system dis-
pluying (a) a bicritiaaZ a:nd (b) a tetracriticaZ point.
Solid lines indicate lines of critical points, the dashed
line corresponds to a
The second class of spin-flop systems is less familiar and consists of
materials with D < 0 < A < A + D. MF-calculations for T = 0 ! 7,111 y z
yield a transition at H HIA' where the system passes from the AF-
phase into the I-phase. The point (H T 0) is a critical . j_ . . h .
po~nt where Mst' be~ng zero ~n the AF-p ase, starts to ~ncrease. In
the I-phase Mij is decreasing but still nonzero, in other words, a st . .... gradual rotanon of M t takes place with increasing field Hf, • At
11 s H H1S > HIA' M
8t varrishes continuously, which indicates that the point
(H HlS' T = 0), where the transition to the SF-phase takes place,
is a critical point. Apparently both and t are important in the
description of the magnetic order in the I-phase, as both quantities
play the role of order parameters. The characteristic feature of the
I-phase is the coupling between both order parameters. This will be
extensively discussed in sectien 3.3. For increasing field values j_
l~ > H15 , M8
t gradually decreases and ultimately varrishes at the criti-
cal point (H = He' T = 0).
A typical example of the complete H# I-diagram displayed by this class

- 69 -
of spin-flop systems !I II, is shown in Fig. 3.3b. In addition to the
paramagnetic phase boundaries // (H) and T J.. (H), two other lines of c
cri ti cal points HIA (T) and RIS (I') are present, which separate the
I-phase from the AF- and the SF-phase, respectively. All four critica!
lines meet in aso-called tetracritical point !I I I. During several
years the existence of such a tetracritical point in common antiferro
magnets has been questioned, due to RG-calculations which yield a
tetracritical fixed point only for nz3.l as d$3. For conclusive arguments
one cannot rely on Ml''-theory, as the validity of the J;!F-approximation
is strongly reduced close to critica! points. So, even if MF-theory
prediets an I-phase for certain systems, this phase might exist only
far from criticality. In section 3.3. we shall discuss the arguments
of Bruce and Aharony 161, which lead to the conclusion that a tetra
critica! point iudeed can exist for d~3, but that the corresponding
multi-critical behaviour is the same as the behaviour close to a
bicritical point.
Finally, i t should be noted that the terminology of multi-critical
points neither is logical nor uniquely determined. The first failure of
this nomenclature becomes clear if the above bicritical point is con
sidered in presence of a (small) field component Hi along the y-axis.
As is shown in Fig. 3.8. and discussed insection 3.5., at least three
critica! lines and surfaces in this three-dimensional space
meet in the point (H T , Hi ; 0). Moreover, this space of
thermadynamie fields is still far from complete. The ambiguity of the
terminology becomes clear in the treatment of tetracritical points.
In addition to the above tetracritical point with coupled order para
meters, an essentially different type of tetracritical point exists in
randomly mixed magnetic syste~s with competing spin anisotropies. In
this tetracritical point, which recently has been reported by, Bevaart
et aL II3, I4j, the order parameters are and a different type
of multi-critical behaviour is expected ! 151. Insection 3.3. it will
be shown that the difference between these two tetracritical points is
due to the presence or absence of a coupling term of the form S~S~ in
the Hamiltonian.
Section 3.3. treats the RG-approach in the calculation of critica! and
multi-critical behaviour in spin-flop systems. Especially the de bate

- 70 -
about the existence of tetracritical points will be elucidated.
Readers, who missed sections 2.6. and 2.7. can also skip section 3.3.,
without loosing the conneetion with section 3.4., where the predictions
of the extended-sealing theory for bicritical and tetracritical points
will be presented.
In this section we shall consider the reduced Hamiltonian
spin-flop system, as derived by Kosterlitz et at. 1161. The specific
features of this system, differing from the description of the classical
m~del in section 2.7., are:
- the introduetion of two sublattices in the calculation,
- the presence of a magnetic field H,
the different role p layed by two spin components, which changes wi th
the magnitude of H,
the explicit elaboration of the terms quartic in the spin variables.
We shall roughly sketch the treatment of some of these aspects in :he
derivation in ref. I 161, which ultimately yields an expression forjp
which is included in (2.79), viz. the type in Table 2.4.
Next, the recursion relations for the relevant parameters, obtained
from the RG-iteration, and the role of different relevant fields in the
description of the critical and multi-critical behaviour are discussed.
Finally the discussion about the existence of tetracritical points in
d=3 antiferromagnets will be presented extensively.
In the RG-:-calculations of Kosterlitz et al. 1161 on the critical
behaviour of spin-flop systems, the Hamiltonian (3.4) serves as point
of departure. Assuming two sublattices A and B, the inter-sublattice and
intra-sub1attice terms can be separated, which leads to a reduced
Hami 1 tonian iF of the form:
[z I J~ s~ s~ + <i J. > 1A JB
A' B <
(3. 17)

71
Here we used the usual truncated function D(S) of
(2.63).
to sub
is the a-component of the spin at site R. which belongs lA
A, <i A' j B> indicates that the summatien has to be per-
fornted over all pairs of spins which are on different sublattices.
Similarly, A> and <iB,jB> indicate summations over all pairs of
spins on sublattice A and B, respectively. J1 and J2 represent the
inter-sublattice and intra-sub la ttice exchange interac tions, res
pectively, and depend on the distance between spins.
Like in section 2.6., the quadratic part of (3.17) can be diagonalized
in terms of Fourier-transformed spin variables. Here the appropriate
Fourier transforms are
(3. 18)
s.t and _,.q
may be considered as the microscopie equivalents of :ti and
M8
t in momenturn space. Then (3. 17) can be written as
(3. 19)
where
J~(q) "' L exp (iq•Ï.\:) [ (R) :!: J~(il}] /kBT (3. 20) + R
and Ha/kBT. (3.21)
The last term in (3. 19) consists of many cross terms of the form
(3. 22)
As bas been discussed tosome extent insection 3.2., it is sufficient
to distinguish between the spin component parallel to the easy axis,
i.e. and the spin compone.nts perpendicular to the. e.asy axis, i.e.

72
+~ . +~ S~, to descn.be a spin-flop system in a parallel field H// . Sq wi11
consist of the x and y-components of in a uniaxial system, whereas
only S~ is important in an orthorhombic system. In the following we
shall confine ourselves to a uniaxial system in a parallel field. The
result can be easily adapted to the orthorhombic case. Ref. 116 treats
also spin-flop systems in a skew field, which will be discussed in
sectien 3.5. We now introduce the notation
(3.23)
where the ~-subscripts have been omitted and the parallel and perpen
dicular components of S are distinguished in a convenient way. Then q
the reduced Hamiltonian (3.19) can be decomposed in three parts I 161:
+ + (3.24)
::'bere iij1
and X_j_ contain only o-terms and , respectively, and
~x contains the cross terms which are purely quartic in the spin
components.
In a similar procedure as in sectien 2.7. the componentsof the short
range interactions (q) and (q) in (3. 19) can be expanded in powers
of q = _g_ (cf. (2.81)), where the basic temperature variables become A
and
r~
By definition one
can be eliminated
)/j (3. 25a)
/j. (3.25b)
bas Tl/ • Next the linear Zeeman term in (3,19) 0
by defining a new spin variable c -r o + M and a
corresponding adj ustment of all coefficients. For instance, the dis
placed temperature variables become
(3.26a)
)/j + (3.26b)

- 73 -
h dl(//) .. . w ere an a0
<a0
are posLtLve constants, proport1onal to
M2 /kBT. It appears that all terms in o+ and ;+ are either strongly
irrelevant or can be integrated out of the partirion function Z 1 l6j,
so that ultimately a reduced Hamiltonian is obtained of the form
_j f (r// )o~ f Cr.l +iF) I"; _I 2
+ 2
+ q q
+ f f f {uo~ + 2 w 1->-12
1->- ( s_ + v s_ .: + ' (3.27) + + q q' qn
where the usual momentum-conserving subscripts have been delered for
convenience. Terros in have been omitted as they appear to be ir-
relevant. The anisatrapie
an important role either
aSy& rv "" terros jl qy q
0 (cf. (2.81)) do not play
and will not be taken into account below.
In the quartic term of (3.27) the coefficients u, v and ware positive,
vary slowly with Tand Hl/ and satisfy no special relations j 161. In
absence of the coupling term with coefficient w and higher-order terms,
(3.27) would represent two uncoupled critical systems, via, the system
of parallel spinvariables a and the system of perpendicular spin
variables s .
In the discussion of the critical behaviour corresponding to (3.27),
we must distinguish between two critical surfaces, corresponding to
f,/1 oo and = "'• where and f,J_ are the correlation lengtbs of
the spin fluctuations in the parallel and the perpendicular spin compo
nents, respectively. Under the iterative action of the RG-transformation
, the trajectory of any "iY with r;; and rj_ both nonzero, will bend
away from both critical surfaces. The derivation of this result fellows
the lines of the discussion on the classical model in sectien 2.7.
Similar to in sec ti on 2. 7.
tibilities c.an be exoressed {with o_,_ q
(2.95)), now the staggered suscep-
(s:/1 ' 1"-q (s)1 } as q q
(3.28a)

- 74
and
< -q=O > r ' j_
(3.28b)
and will diverge for r~ 0 and for = 0, respectively. For 2 // ..L // .1_ r11 « r_l_(-i,e. for H;; « (T
0 - )/(a
0 - a
0 ), cf, (3.26)), the
divergence of x~ takes place at the highest temperature, viz. st
(3.29a)
For T < T§ a LRO of the parallel spin components is established in an c
AF-phase. Therefore ) corresponds to the critical phase boundary
rf (H) in Fig. 3.3. Since only one spin component is involved in this
ordering process, the transition will be Ising-like, i.e. the tra-
j ectory of ;iF with r;; = 0 wi ll end in the Ising fixed point~, located * 'l< 'l< 'l< * at r;; = 0, r__L= oo, u u
0, w v oo, with u
0 a nonzero constant
(to be calculated), For r.1_ « r11 ,i.e. for H7; » (T: r;)/(af -a;),
will diverge at the highest T, ~~z. at the critical points
(3.29b)
and establish a long-range ordered SF-phase. In case of orthorhombic
spin anisotropy this transition will be Ising-like, wherea.s in a uni
axial system the transition will be XY-like. The corresponding fixed
points are located at rg oo, 0, u* w* oo, v* = v0
t 0.
For r11
and r__1_ both close to zero, ~ •. close to the intersection of
both critical surfaces, multi-critical behaviour can be expected.
rg = rj_ ~ 0 corresponds to a special region in the (Hg T)-diagram,
namely close to the intersectien of the critical line.s Tl/ (H) and c
T~(H), i.e. the bicritical (or tetracritical) point of Fig. 3.3. At
this point both x[t and x~ diverge, according to (3.28). This
situation, however, deserves a more profound analysis of (3.27) in
order to determine the possible fixed points close to the "multi
critical" surface. Consiclering the Hamiltonian (3.27) with arbitrary
numbers n// and nl of vector components in and 1, respectively,
Kosterli tz e·t al. 1161 find to order 4-d in an s-expansion, the
following reenrsion relations for the coefficients in (3.27):

- 75
s2 [r_L + 4(r:J_+2)flv + 2n/! f1w -4(nj_+2)f2 vr_l_- 2n// f 2 r// J ,
u' sE[u- 4(n// +8)
v'
w'
- 4n // f2w2J , 4(n//+2)u- 4(n...l_+2)v]
where the functions f 1 and f 2 are defined as
and f2(s)
1\ is the cutoff, as usual fixed at a constant value.
(3. 30)
(3. JO a)
From (3.30) six fixed points have been located at the critical surface
near rfi% r~, of which four have w* ~ 0, corresponding to deccupled
Hamiltonians (cf. (3. 27)). All four are unstable for small pertur
bations of w from zero, for all n : n// + n_L < 11 + O'(s) !16j. Of the
two remaining fixed points, the first one is located at
.. u "' V u
0 (n+8)
rd r_L ~- s(n+2)/2(n+8)
(3.31)
with s = 8?T2AsE, and describes bicritical behaviour. It can be seen
from (3.27) with u v = w that this fixed point corresponds to a
critical point where o and ~ play an identical role. This fixed point
therefore leads to Heisenberg-like critical behaviour in the uniaxial
case and XY-like behaviour in the orthorhombic case, It is stable for
! 161
4
where the value nx(d=J) ~ 3.1. for n > nx(d) a new fixed point becomes
stable, the so-called bicanical fixed point ! 16j, which is not

- 76 -
important in this context, From their calculations Kosterlitz et al.
concluded that in real antiferromagnets (with d=3, ns3), the bicritical
fixed point (3.30) is the only stable mult~critical fixed point, and
therefore no tetracritical behaviour could be expected. The resulting
types of critical behaviour in spin-flop systems have been tabulated
in Table 3.2.
Table 3.2. Types of critical behaviour in spin-flop systems
Anisotropy r // << r__l_ r;; >> r __1_ r// 8:; r__l_
type n;; type Il__L __ type n -- ---- ----
uniaxial Ising I XY 2 Heisenberg 3
orthorhombic Ising I Ising I XY 2 ,
Recently Bruce and Aharony ]6] argued that tetracritical and bicritical
behaviour are net necessarily connected with different fixed points.
They pointed out that an intermediate phase and a tetracritical point
can exist in a real antiferromagnet in spite of the fact that the
asymptotic multi-critical behaviour lS determined by the bicritical
fixed point. They attributed the difference between bicritical and
tetracritical behaviour to the sign of an irrelevant parameter ~ 0
which remains important, however small the parameter~ actually is. 0
In this subsectien we shall discuss the line of arguments of Bruce and
Aharony.
First, the reduced Hamiltonian (3.27) is written in a more symmetrical
ferm as
Y -! { (ro+ij2)(o2+];j2)-jgo[Co2_];j2)
q q
f f f ju (o2 +]-;] 2 )2 + ~ o 2 ]-;Fl
qq'q"L'o o .J (3.32)

- 77 -
Now the term with g0
= rV -r~ represents the relevant quadratic term
which breaks the n-fold spin-rotational synnnetry shown by (3. 32)
for g0~0. Deviations in u, v and w with respect to the bicritical
fixed point at ui< ~ vi< ~ vt ~ u0
(cf. (3.30)), are irrelevant and have "v
been omitted in (3.32). An exception is made for the v0-term in (3.32),
which must be classified as a dangerous irrelevant parameter j6j, lead
ing to the difference between bicritical and tetracritical points.
Fr om the maxurrum 1n ,:;r (corresponding to a minimum in ;r , cf. (2. 68)), i t "v
can be simply verified that for g0
~ 0 the v0
-term induces a preferred
spin orienta tion a long or perpendicular to the easy axis (~ 0 or a ~ 0) "v "v
for v0
> 0. On the other hand, for v0
< 0 an orientation somewhere
along a diagonal direction is preferred (i.e. ; f 0 and a f 0). This
latter possibility corresponds to a skew ordering of the staggered
magnetization with respect to the easy axis, with a coupling between
a and ;. This is exactly what one would expect to occur in the I-phase.
Now, the main question is whether this I-phase can remain stable even
if the multi-critical point is approached. Bruce and Aharony argue that,
although
point (T
"v the v
0-term decreases asymptotically,close to the multi-critical
~ Tm), as shown by Kosterlitz et al. j16j, it remains the only
symmetry breaking term in (3.32) if g0
~ 0. Therefore, the preferred
skew orientation will persist up to Tm, which defines the multi
critical point as a tetracritical point.
In the ordered phases (T < Tm) of a tetracritical system (with ~0 < 0) _,_
the direction of Mst will be determined by the competition between the "v v
0-term, which prefers a skew ordering, and the g
0-term, which prefers
an ordering parallelor perpendicular to the easy axis, for g0
< 0 and
g > 0, respectively. Only very close to the g ~ 0 axis the ~ -term will 0 0 0
be important enough to impose the skew ordering. Therefore the intermediate phase
can be expected for ~0 < 0 in a small region close to the g0
~ 0 axis. "v •
With vanishing v0
, z.e. as the multi-critical point is approached, this
region narroHs asymptotically to zero. This is shown in Fig. 3.Sb.,
which will be discussed extensively in section 3.4. For ~ > 0, the 0
quartic term has no influence on the ordering process and it consoli-
dates the anisotropy of the quadratic g0-term forT< Tm. This implies
that the spins order along the easy axis for g0
< 0 and nearly

- 78 -
perpendicular to the easy axis for g0
> 0. At g0
= 0, the spins jump
from one orientation to the other. This characterizes the line g0
= 0
as the spin-flop line. The corresponding (g,t)-diagram is shown in
Fig. 3.5a. The direct connections between Figs. 3.3. and 3.5. forma
main topic in section 3.4.
Finally, it is convenient to explain in the present context the diffe
rence between the above tetracritical point in spin-flop systems and
the multi-critical point in mixed magnetic systems with competing spin
anisotropies, which is also called a tetracritical point. From the
above discussion it will be clear, that the tetracritical point treated
in this section exists owing to a coupling term of the form
o 2 ];] 2 in the (reduced) Hamiltonian. Therefore it is called a tetra
critical point with coupled order-parameters, although this coupling
asymptotically varrishes as the multi-critical point is approached. The
corresponding multj-critical behaviour is described by the bicritical
fixed point (3.30). On the other hand, the tetracritical point in
mixed magnets corresponds to one of the above mentioned fixed points
at w* = 0, which are unstable for small perturbations of w. Therefore,
this tetracritical point can exist only in materials where two com
pletely independent spin systems are present, which also will order
independently. This tetracritical point with decoupled order parameters
is realized when both spin systems accidentally order at the same
therma-dynamie field values.
3.4. The extended-sealing theory of multi-critical behaviour in spin
flop systems
In the (H;;, T)- phase diagrams of spin-flop systems, the ordered AF
phase and SF-phase are separated from the P-phase by the critical lines
Tl/ (H) and T__L(H), respectively, which meet in a multi-critical point.
T~ (H) is a l~ne of critical points where the order parameter of the c 0 11
AF-phase, &.e. Mst' varrishes and where
parallel spin components take place. As
ponent (n// =I), the critical behaviour
critical fluctuations of the I! M posesses one relevant com-s t //
at T (H) must be classified as c
Ising-like (cf. Fig. 2.7.). At the line of
order parameter of the SF-phase, i.e. M__L st'
critical points T__L(H) the c
which consists of two
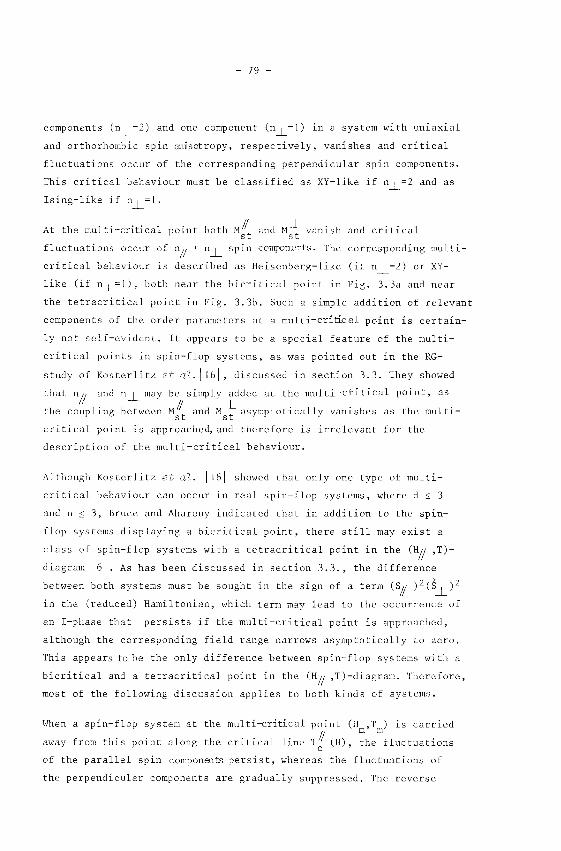
- 79 -
components (nj_ =2) and one component (n_L=l) in a system with uniaxial
and orthorhombic spin anisotropy, respectively, varrishes and critical
fluctuations occur of the corresponding perpendicular spin components.
This critical behaviour must be classified as XY-like if n_L=2 and as
Ising-like if n_L=l.
At the mul ti -critica 1 point bath M// st and M_j_ vanish
st and cri ti cal
fluctuations occur of n// + n_L spin components. The corresponding multi-
critical behaviour ~s described as Heisenberg-like (if n_L=2) or XY-
like (if n_L =1), bath near the bicritical point in Fig. 3.3a and near
the tetracritical point ~n Fig. 3.3b. Such a simple addition of relevant
components of the order parameters at a multi-critical point is certain
ly nat self-evident. It appears to be a special feature of the multi
critical points in spin-flop systems, as was pointed out in the RG
study of Kosterlitz et al.j16j, discussed in section 3.3. They showed
that n // and n_L may be simply added at the mul ti -cri ti cal point, as
the coupling between M//t and M_L asymptotically varrishes as the multi-s st
critical point is approached, and therefore is irrelevant for the
description of the multi-critical behaviour.
Although Kosterlitz et al. j16j showed that only one type of multi
critical behaviour can occur in real spin-flop systems, where d ~ 3
and n ~ 3, Bruce and Aharony indicated that ~n addition to the spin
flop systems displaying a bicritical point, there still may exist a
class of spin-flop systems with a tetracritical point in the (H~ ,Tl
diagram j6j. As has been discussed insection 3.3., the difference
between bath systems must be sought in the sign of a term (S~ ) 2 (S_L) 2
~n the (reduced) Hamiltonian, which term may lead to the occurrence of
an I-phase that persists if the multi-critical point is approached,
although the corresponding field range narrows asymptotically to zero.
This appears to be the only difference between spin-flop systems with a
bicritical and a tetracritical point in the (H~ ,T)-diagram. Therefore,
most of the following discussion applies to bath kinds of systems.
When a spin-flop system at the multi-critical point (Hm,Tm) is carried
away from this point along the critical line T~ (H), the fluctuations c
of the parallel spin components pers is t, whereas the fluc tuations of
the perpendicular components are gradually suppressed. The reverse

- 80 -
situation will take place, if the system lS carried along Tj_(H). c
Starting from the high spin isotropy at the multj-critical point, a
gradually increasing anisotropy is induced in this way and ultimately
the critical behaviour of the system becomes fully characteristic for
an anisatrapie (Ising or XY) system. Therefore, one can define an
anisotropy parameter g, which plays the role of a relevant nonordering
field at the multicritical point (cf. section 2.2.), and which is a
combination of the applied magnetic field H# and of the temperature T.
This anisotropy g has been first introduced as a field in a sealing
analysis of the bicritical point in spin-flop systems by Riedel and
Wegner II 71 . Subsequently, Pfeuty et al. liS I , formulated the i de a lil
the farm of the so-called extended-sealing hypothesis for the des
cription of bicritical behaviour:
(3.33)
This expression defines the Gibbs free energy at the bicritical point
as a generalized homogeneaus function (compare (2.41)) of two relevant
ordering fields H#t and Hj_, and of two relevant nonordering fields s st
g and t. g and t clearly play an identical role as bath fields carry
the system away from the multi-critical point. With s = I tl-aT sub
stituted in (3.33) and with the definitions
cp, (3.34)
one arrives at a commonly used equivalent notation for (3.33):
(3.35)
Here ab is the bicritical exponent corresponding to the specific heat
(cf. Table 2. 1. and eq. (2.52)), 6a and 6j_ are the so-called gap
exponents, which result when (3.33) is repeatedly differentiated with
respect to the corresponding ordering fields H~t and H~ and cp is the
so-called crossover exponent for reasans which will become clear
shortly. (3.33) or (3.35) are expected to give a good description of
the critical behaviour in the vicinity of the multi-critical point, i.e.

- 81 -
for small values of t and g.
The extent of the region in which (3.33) or (3.35) holds without severe
corrections to the asymptotic sealing behaviour, strongly depends
on the choice of the fields g and t. Fisher i I9j showed that the
optimum sealing fields ~ and 1 for the description of the bicritical and
equivalently of the "tetracritical" behaviour are given by
'" g
with
g
g - pt '" t
t
t + qg (3.36)
(T-T ) /T • m m
(3. 37)
(Th is form 1VÏ1l be familiar for readers who did not omit section
cf. (3.26) with '" IJ}· discussed section 3. 3., g = r// - As lil 3. 3., the 'v
optimum choice of the g = 0 aXlS in a bicritical system obviously
coincides with the spin-flop line at the bicritical point, so
p = T (dH2 /dT)b m SF
(3. 38)
In a tetracritical system p must be calculated by RG-techniques. The
choice of the 1 = 0 axis is less clear. As a zero-order approximation
1n s = 4-d, Fisher obtained for q in (3.36) the estimate ji9j
dT//
q (n=n// +n_Jl =- 3:;2 [~ _ m dH // H,rO
(3.39)
In Fig. 3.4. the axes corresponding to these optimum sealing fields are
shown in the (H~ ,T) phase diagram of a bicritical spin-flop system with
uniaxial spin anisotropy (i.e. n=3). Henceforth we shall write all
sealing results explicitly in terms of ~ and 1.
With G as a generalized homogeneaus function of H/,s/t' HJL ~ and 1, the st' power laws for all thermadynamie quantities can be obtained in the
usual way (cf. section 2.5.). For instance, single differentiation of
(3.33) with respect to H:t gives
11 c'" '") Mst g,t
I! 1/aH-d //"-'I/ar;"-' I/aT H//
s Mst(gs J, ts ), for st HJL st 0 •
(3.40)

t=o' axis \ < /
\
SF \ \
H~F(T)
AF
Tb
- 82 -
}t(H1~)
-9=0 a x is
I 11(H2) c ïl
T
Fig. 3. 4.
(Hl! ,T)-phase of a
uni=ial spin-flop systeem,
a bicritical
point. The sealing
relations (;). ;5,1) and (3. 35)
will be fulfilled with
respect to -the indicated op-timum .sealing =es g = 0 and ~ = 0. g and ~
are in (3. 36).
With s l '"t ~-aT substituted, this yields
'" -a whereas one finds with s = [g[ G substituted
0,
I'" Sb/Ijl '" Bb g [ , for t
(3 .41)
0 .
(3.42)
These expressions show that there are two different exponents connected
with the bicritical (or similarly the tetracritical) behaviour of the
order parameter in the AF-phase M:t in the (H# ,T)-plane, depending on
the pathof approach to (H~, Tb). Sb describes its t-variation along
the path g = 0, whereas Sb/Ijl describes its g-variation along the path "v t = 0. It appears to be a general property of any critical quantity,
that the exponents corresponding to the t and g variation differ by a
factor cjl.
From (3.40) two types of bicritical scalinu functions for MI/ can be -a st
obtained. With s = [g[ G one arrives at

- 83 -
o, t) (3.43)
'"hich is only interesting for g < 0, as M;t 0 for g > 0. With
S = I , -aT ( ti substituted in 3.40), one obtains
(3. 44)
11 'V This sealing function consists of two branches, d#'+ for t
for t < 0. Similar power laws and sealing functions can be derived for ~ #
M8t. By double differentiation of (3.33) with respect to H~t' one
obtains the parallel staggered susceptibility • Also for this
quantity one can derive power laws and sealing functions. Of these we
only mention
, ± (3.45)
where
- 2 (3.46)
~any similar examples can be given for other quantities. All bicritical
exponents are related through exponent relations, similar to (2.30)
again, and have bicritical values, which according to Kosterlitz et al.
I 161 correspond to the d=3 Heisenberg values if 2 or the d=3 XY
values if n~L = 1 (see Table 2.2.).
The extended-sealing expression (3. 33) for G is supposed to be valid
in the direct surroundings of the bicritical point. Since both the •v// ·v 0
" ! 'V paramagnetic. phase boundaries te (g) and t~(g), and the spin-flop line
(g = 0) join in the bicritical point, (3.33) must contain also information
about the corresponding critical and first-order behaviour of all
quant~tLeS near these phase transitions. For instance, for g < 0 we
expect that xft diverges for ·~ (g) with an Ising-exponent y, i.e.
(3.47)
where
t (0) • (J. 48)

- 84 -
Since this divergence of x// should be consistent vJith (3.45) and the st factor 1-yb is nonsingular at ~ 0), the sealing function X~ (x),
which depends on one single variable
x (3.49)
must have the asyrnptotic form
X: (x) cr : (x-i)/il-y for x + x (3.50)
'V// ev Here x corresponds to the phase boundary t~ (g), which then determines
"-'// 'V the variatien of the critical point t~ with g as
Usually (3.51) is written ~n the farm
(3. 52)
where w // = +x, Similarly the shape of the paramagnetic phase boundary
of the SF-phase is written as
(3.53)
So, it can be concluded that the extended-sealing hypothesis (3. 33)
implies a predietien for the shape of the paramagnetic phase boundaries
close to the multi-critical point. At a large distance from (H2 ,T ), m m where (3.33) is no longer valid, these phase boundaries will correspond
'V to straight lines in the t) and (Hd ,T)-diagrams 116). This can
beseen directly from (3.29) insection 3.3. and is shown in Fig. 3.4.
The values for the crossover exponent 1> in case of uniaxial and
orthorhombic spin-anisotropy have been calculated with the RG-technique
by Pfeuty et al. I 181 as
and
1.175 (15)
1.250 (15)
for n
for n
2
3 (3.54)
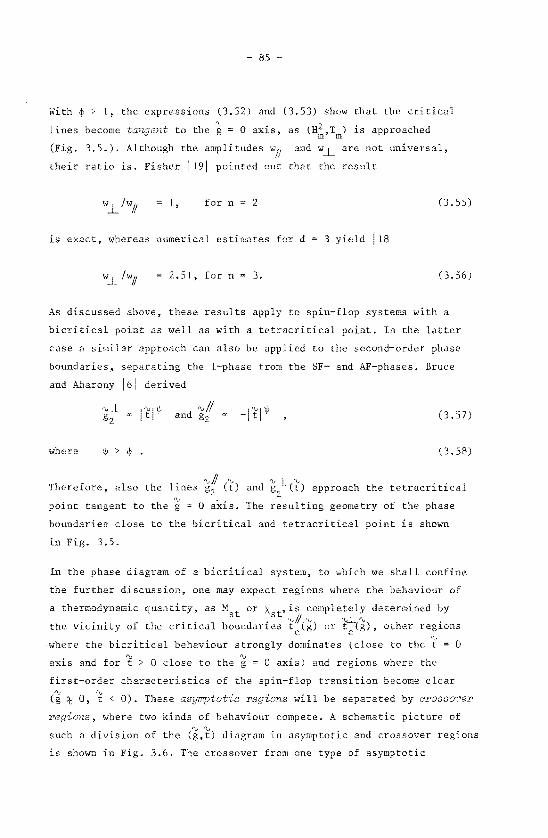
- 85
Hith ~ > I, the expressions (3.52) and (3.53) show that the critical
lines become tangent to the g = 0 axis, as (H2 ,T ) is approached m m (Fig. 3.5.). Although the amplitudes w// and w_L are not universal,
their ratio is. Fisher I 19! pointed out that the result
I , for n 2 (3. 55)
is exact, whereas numerical estimates for d 3 yield lts!
2.51, for n 3. (3. 56)
As discussed above, these results apply to spin-flop systems with a
bicritical point as well as with a tetracritical point. In the latter
case a similar approach can also be applied to the secoud-order phase
boundaries, separating the I-phase from the SF- and AF-phases. Bruce
and Aharony !61 derived
(3.57)
lvhere 1/1 > ~ • (3.58)
• cv// cv cv_L " Therefore, also the hnes g2 (t) and g
2 (t) approach the tetracritical
point tangent to the 'g 0 axis. The resulting geometry of the phase
boundaries close to the bicritical and tetracritical point is shown
in Fig. 3,5.
In the phase diagram of a bicritical systen1, to which we shall confine
the further discussion, one may expect regions where the behaviour of
a thermadynamie quantity, as M8
t or
the vicinity of the critical boundaries
where the bicritical behaviour strongly
is completely determined by rv/1 rv . tc(g) or , other reg1ons
dominates (close to the ~ 0
axis and for t 0 close to the g = 0 axis) and regions where the
first-order characteristics of the spin-flop transition become clear ""' ·V (g% 0, t < 0). These asymptotic will be separated by crosso~er
regions, where two kinds of behaviour compete. A schematic picture of
such a division of the ('g,~) diagram in asymptotic and crossover regions
is shown in Fig. 3.6. The crossover from one type of asymptotic

- 86 -
g g
(a) (b)
Fig. 3.5. Shape of the phase boundaries in the (g,t)-diagram, implied
by (3.33), near a bicritical point (a) and near a tetra
critical point (b).
behaviour to another can be analyzed very well on the basis of the
bicritical sealing functions 1201. In principle any sealing function,
like (3.43) to (3.45) may be used.
Fig. 3. 6.
Division of the bicritical phase
diagram of Fig. 3.5a in regions
with different asymptotic
behaviour. Shaded areas
correspond to crossover regions.
Consicter the sealing function AF#of (3.44) which consists of two
branches
and
.ff/1 (x) + M!/t'f)/ l'fl Sb
~!(x) "'M~tct'f)/1~1 Sb
for 'f > 0 (3.59a)
'V for t < 0 , (3.59b)

- 87 -
where x is defined by {3.49) as x= jgj/jtj~. In {3.42) we found the 00
• • f // 1 h 'V Ü • g-var~at~on o M8
t a ong t e t = ax~s as
(3.42)
This implies that both and Af'// must have a bicritical x-region for
x + =, with the following asymptotic behaviour
for x + m • (3.60)
Similar to the sealing function X//(x) in (3. 50), a lso Af'// (x) must display + +
critica} behaviour close to the paramagnetic phase boundary (3.52),
-i.e ..
1/ [ • '] 8 .ff+ (x) "' (x-x) /x for x + x _ + w// . (3.61)
With (3.41) we findas the asymptotic behaviour of.~!(x) in the first-
order region close to the g 0 axis
constant, for x+ 0 . (3.62)
So, in the sealing function ~//(x) a crossover from a bier i tic al
exponent (at large x) to a critical exponent S (for x + w# ) can
be observed. A similar crossover behaviour can be expected in the J... _L /1
analogous sealing function Jf+ (x) for .Hst. The sealing function .flf'_ (x)
and similarly .A'__!_( x), will show a crossover from the bicritical
exponent (at large x) to zero (for x +
might use the sealing functions X//(x) and
P-phase one
(cf. (3.45)), to
abserve crossover from bicritical to critical behaviour. The crossover
analysis sketched here will be employed extensively in the analysis of
the (multi-) critical behaviour in CsMnBr 3·2D20.
3
In the previous sections of this chapter only magnetic fields applied
along the easy axis were taken into account. Here we shall consider
cases in which the external field is skew, i.e. applied at some
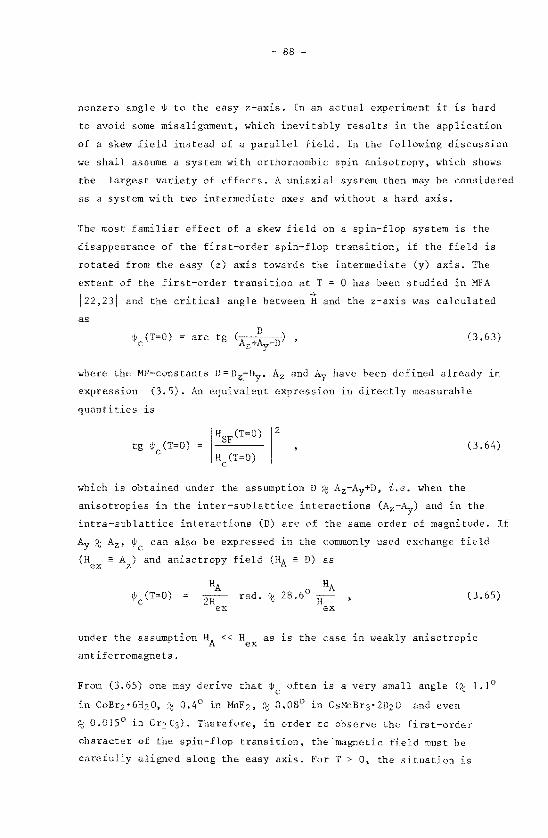
- 88 -
nonzero angle oJ; to the easy z-axis. In an actual experiment it is hard
to avoid some misalignment, which inevitably results in the application
of a skew field instead of a parallel field. In the following discussion
we shall assume a system with orthorhombic spin anisotropy, which shows
the largest variety of effects. A uniaxial system then may be considered
as a system with two intermediate axes and without a hard axis.
The most familiar effect of a skew field on a spin-flop system is the
disappearance of the first-order spin-flop transition, if the field is
rotared from the easy (z) axis towards the intermediate (y) axis. The
extent of the first-order transition at T = 0 has been studied in MFA +
and the critical angle bet>veen H and the z-axis was calculated
as
(T=O) are tg (3.63)
where the MF-constants D=Dz-DY. A2 and Ay have been defined already in
expression (3.5). An equivalent expression in directly measurable
quantities is
tg (T=O) (3. 64)
which is obtained under the assumption D ~ A2 -Ay+D, i.e. when the
anisotropies in the inter-sublattice interactions (A2 -Ay) and in the
intra-sublattice interactions (D) are of the same order of magnitude. If
can also be expressed in the commonly used exchange field
(Hex = A2
) and anisotropy field (HA = D) as
rad. :t 28.6° (3.65)
under the assumption HA <<
antiferromagnets.
as is the case in weakly anisotropic
From (3.65) one may derive that >J;c often is a very small angle (~ 1.1°
in CoBrz•6HzO, ~ 0.4° in MnFz, ~ 0.08° in Cs}mBr3•2D20 and even
~ 0.015° in Crz C3). Therefore, in order to observe the first-order
character of the spin-flop transition, the 'magnetic field must be
carefully aligned along the easy axis. ForT> 0, the situation is

- 89
even worse 1241, since it appears that
(T) 't
The first-order spin-flop "shelf" has been extensively studied in
GdAl03 jz41 and is depicted in Fig. 3.7.
n = 1 /
.,: surface
n= 2 --re+~~$=-~->-~ bicritlcal
point
Fig. 3.?.
(3.66)
orthorho~bic spin
anisotropy. The first-
shelf
is heaviZy shaded.
SF It is berdered by two lines of critical points, indicated as Tc (Hi).
lf the magnetic field is applied under an angle w > ~ (T) with respect c-+
to the z-axis, no jump will occur in the direction of Mst' Only a
rapid reorientation will remain, which for w >> ~c(T) can be described
by the MF-expression lzsl
tg(2~ + 2~) ( 3. 6 7)
where Ç is the angle between and the z-axis (see Fig. 3.1 .).
Also near the bicritical point, there are pronounced effects caused
by a small Ri-component of the magnetic field. Kosterlitz et II6I showed that in a system with orthorhornhic spin-anisotropy, the critical
behaviour near the entire paramagnetic critical surface Tc(Hp ,Hi)
is lsing-like, except for a single point in the Hi = 0 plane,
namely the bicri tical point, with XY-exponents (see Fig. 3. 7.).
For fixed T < Tb, the phase boundary should be a stnooth curve in

- 90 -
the (Hff,Hi)-plane. Quite analogous to the variatien of Tc with g, derived in the previous section, the change in Tc at fixed H // = Hb
when a small field Hi is applied should vary as I 161
Since ~ > I (as before), the phase boundary in the H# = Hb plane is
tangent to
boundaries
and Gerber
the line H. 0 as shown in Fig. 3.8. The shape of the SF l . . .
Tc (Hi) and Tc(Hi) has been verlfled lil GdAl03 by Rohrer
lz6l. In the projection in Fig. 3.8., the bicritical
point of the (H# ,T)-diagram here appears as a tetracritical rather
than a bicritical point. This indicates the completely "ad hoc"
terminology for multi-critical points.
n = 1 n = 2 line
T Fig. 3. 8.
n =1 line
Projection of the (H# ,Hi,T)
diagram on the plane
If a magnetic field component ~ exists along the hard axis of an
orthorhombic antiferromagnet, a completely different behaviour can be
observed. In this case the first-order spin-flop phase boundary, which
will have a hyperbalie shape IJl, is connected to the paramagnetic
phase boundary for all temperatures. This gives rise to a line of
bicritical points Tb(Hh), as shown in Fig. 3.9. lz71.
Fora uniaxial system the (H// ,H j_,T)-diagram is slightly different
from Fig. 3.7. Here the perpendicular field component destrays not
only the Heisenberg behaviour at the bicritical point, but also the
XY-characteristics at the SF-P phase boundary. This results in the
(H# ,H_L,T)-phase diagram of Fig. 3. 10.

n 2 bicritical line
:/
/ /I
3.9. (a)
(a)
- 91 -
n~l
(/ surface
-T
"" ""1 surface
(b) Pro,iection
n- 2 seam
'\n= 1 surface
n=3 /bicritical
point
(b)
an
su:rface, bcunded by Zine
Fig. 3.10.
of
a wziaxiaZ antiferro-
magnet.

-92
Far too little experimental or theoretical evidence exists to provide
an analogous sununary for antiferromagnets that display a tetracritical
point in the H~ T-diagram. MF-studies l24al at T = 0 show that the
I-phase only extends in the easy-hard plane and possibly coexists with
the paramagnetic phase at a tetracritical point. The (H;; ,Hh,T)
diagram might strongly resembie Fig. 3.9. (a) with the first-order
surface "split up" into two second-order surfaces, which both conneet
to the Ising surface in one tetracritical line. However, the I-phase
does not necessarily coexist with the paramagnetic phase at all
temperatures and the picture might be much more complex.
L. Néel, Ann. Physique (10) ~. 5 (1932), (1 1) 232 (1936).
N.J. Poulis, J. van den Handel, J. Ubbink, J.A. Poulis and
C.J. Gorter, Phys. Rev. 552 (1951),
N.J. Poulis and G.E.G. Hardeman, Physica l§_, 201 and 315 (1952).
l3i C.J. Gorter and J. Haantjes, Physica 8 285 (1952).
141 C.J. Gorter and Tineke van Peski-Tinbergen, Physica ~. 273 (1956).
151 D.R. Nelson, J.M. Kosterlitz and M.E. Fisher, Phys. Rev. Lett.
813 (1974).
161 A.D. Bruce and A. Aharony, Phys. Rev. !ll• 478 (1975).
171 Olga P. van Wier, Tineke van Peski-Tinbergen and C.J. Gorter,
Physica 32, 116 (1959). In our notatien the x and y-axes are
interchanged.
181 A more extended sununary is given by N. Yamashita, J. Phys. Soc.
Jpn. 32, 610 (1972). This author unjustly claims the discovery
of a "deviated-ferro" phase, af. Ref. 171.
191 H. Matsuda and T, Tsuneto, Progr. Theoret. Phys. (Kyoto),
Suppl. No. 46, 411 (1970).
I !OI llll
1121
1131
E. Stryjewski and N. Giordano, Adv. Phys. 487 (1977).
K.S. Liu and ~.E. Fisher, J. Low Temp. Phys. IQ, 655 (1973).
M.E. Fisher and D.R. Nelson, Phys. Rev. Lett. I 350 ( 19 7 4) •
L. Bevaart, E. Frikkee, L.J. de Jongh, ECN report ECN-78-122
and to be published.

- 93 -
l14j L. Bevaart, E. Frikkee, J.V. Lebesque and L.J. de Jongh, Solid
State Commun. 539 (1978), L. Bevaart, E. Frikkee and
L.J. de Jongh, Solid State Commun. 25, 1031 (1978).
I 15j A. Aharony and S. Fishman, Phys, Rev, Lett. li• 1587 (1976).
I 161 J.M. Kosterlitz, D.R. Nelson and M.E. Fisher, Phys. Rev.
412 (1976).
I 17j E. Riedel and F.J. Wegner, Z. Physik 225, 195 (1969).
l1sj P. Pfeuty, D. Jasnow and M.E. Fisher, Phys. Rev. !!Q, 2088 (1974),
J19: M.E. Fisher, Phys. Rev. Lett. 1634 (1975).
jzoj E.K. Riedel, Phys. Rev, Lett. ~. 675 (1972),
E.K. Riedeland F.J. Wegner, Phys. Rev. 294 (!974),
121 I D.R. Nelson and E. Domany, Phys. Rev. ~' 236 (1976),
E. Domany, D.R. Nelson and M.E. Fisher, Phys. Rev. 3493 (1977),
E. Domany and M.E. Fisher, Phys. Rev. BI 3510 (1977).
izzj H. Rohrer and H. Thomas, J. Appl. Phys. 40, 1025 (1969).
j23j G.K. Chepur:nykh, Sov. Phys.-Solid State J..Q., 1517 (1968),
M.I. Kaganov and G.K. Chepur:nykh, Sov. Phys.-Solid State 745
(1969).
j24j K.W. Blazey and H. Rohrer, Phys. Rev. lil• 574 (1968),
K.W. Blazey, H. Rohr:er: and R. Webster, Phys. Rev. B4, 2287 (1971).
i 24aj H. Rohr:er, AIP Conf. Proc. 268 (AIP, New York, 1975).
j25j See, for instance, T. Nagamiya, K. Yosida and R. Kubo, Adv. Phys.
!!_, (1955) eq. (5.12).
[26j H. Rohrer and Ch. Ger:ber, Phys. Rev, Lett. ~' 909 (1977).
j27j H. Rohrer, B. Derighetti and Ch. Gerber, Physica 86-88B, 597
(1977).

- 94 -

- 95
CHAPTER IV
CRITICAL BEHAVIOUR OF CoBrz•6{0.48 DzO, 0.52 H20} NEAR THE NÎfEL POI1'T
4. !. Introduetion
As was described in chapter II, the present knowledge of the (quasi-)
static behaviour of systems near criticality is concisely contained in
the concepts of sealing and universality. In these concepts critical
systems are classified by only two quantities, ·:Jiz. the lattice dimen
sionality d and the number n of relevant vector components of the
order parameter. In n-d space the case n=2, d=2 farms a curious point.
It has been pointed out by Stanley and Kaplau lil that such a system
possibly shows a transition which is characterized by a divergence of
the ordering susceptibility, whereas the order parameter remains zero
below the transition. This so-called Stanley-Kaplan transition to a
quasi-ordered state bas been questioned by many authors. In the cal
culations of a number of critical quantities considerable difficulties
are eneouncered in the n=2, d=2 limit and large differences are found
in the results from different calculational methods. Therefore, Betts
et al. ! 2i conclude that d=2 XY-systems near criticality appear to
forma particular class, in which universality possibly is violated.
In this respect it appeared worthwhile to start an investigation of
the critical behaviour in the antiferromagnet CoBr2•6H20, which is
known as a good magnet ie approximation of the d=2 XY-model ! 3-51 . The
transition to d=3 long-range order (LRO) observed at % 3.!5 K !41 must be due to small deviations from the d=2 XY-model, as the ideal
model cannot show LRO 161. In order to search for d=2 XY-features and
to investigate the mechanism that triggers the transition to LRO,
quasi-elastic neutron scattering experiments have been performed. For
several reasons, elucidated in the next two sections, a partly
deuterated sample was selected for the present work. Some preliminary
results have been presented at the International Conference on }1agne
tism 1976 171. The content of this chapter bas been publisbed in a
somewhat different form in the proceedings of the International
Symposium on Neutron Inelastic Scattering in Vienna, !977 i BI.

- 96 -
4.2. Crystallography and magnetic interactions
The s tructure of CoBr2 •6H20 is des cribed by the monoclinic, face
centered space group C 2/m, with unit-cell dimensions a=ll.OO ~.
b~7. 16 ~. c=6.90 g and 8=124° !91. The unit cell contains two formula
units. Cabaltions are situated on inversion centers and are octa-
hedrally coordinated by four oxygen and two bramine ions (Fig. 4.1a).
The isolated I,CoBr2o4.J-clusters show approximately fourfold symmetry
around the Br-Co-Br axis, which is close to the a*-axis (Fig. 4.Jb).
The perfect cleavage of the crys tals
(b)
4. 1. Deta~iZs of the structure of CoBr2 •6H20. Cabalt atoms
are bLack., bramine atoms shaded and oxygen atoms are x-epre-
a) arrangement of the -octahedra
,chemicaZ o.nd the ab-plane.
tween adjacent appear be r•elatively weak.
b) Sketch of
easy (y) axes the
mediate ( B) axis coincides wi th the
hard (ct)
tensor 131 • The in ter-• ->i'< I-* -+i'< I~
b-ax&s (a J..c, c J..a),

- 97
parallel to the (001) plane indicates that the chemical bonding between
adjacent ab-planes is relatively weak. The cornpletely deuterated
material, on the other hand, undergoes a crystallographic phase
transition from monoclinic C 2/m to a triclinic structure with space
group between 77 K and 4.2 K IIOI. The triclinic deformation of the
unit cell and the changes in the ionic positions within the cell are
rather small. Previous NMR and AF.-1R experiments on CoBr2·6{xD20(I-x)H20}
with varying x, denoted as CBx, indicate that at T=J .2 K the monoclinic
triclinic transition occurs at x~ 0.55 1111. The anticipated mono
clinic-triclinic phase boundary in J<T-space is shown in Fig. 4.2.
100
T(K)
50-
0.0
C2/m
0.5
of the
/ /
/ /
Pl
x
Fig. 4. 2.
1.0
chosen for the present neutron scattering
At this phase boundary a spontaneons and reversible twinning of the
crystal occurs, so that in the triclinic phase four kinds of crystallo
graphic domains exist which in pairs show mirror symmetry with respect
to the original monoclinic ac-mirror plane I IOI.
The magnetic moments of the Co2+-ions in CBx are ordered antiferro
magnetically bel01v the Néel temperature IN ';\; 3. I K. As the Co-ions are
located at a twofold axis, in the C 2/m structure the direction of the
moments is either perpendicular or parallel to the b-axis.
In the purely hydrated material the preferred direction (y-axis) of
the sublattice rnagnetization is in the ac-plane at 8° frorn the c-axis
towards the c~-axis (Fig. 4.Ib) 131. The array of magnetic moments is
shown in Fig. 4.3a and can bedescribed by the magnetic space group
21/m
1 1121. In the systems with a triclinic structure (x> 0.55)
the magnetic moments are rotated away from the ac-plane towards the
b-axis over an angle ~ I 11!. The division in two sublattices is

- 98 -
essentially the same as in the monoclinic structure (Fig. 4.3) and the
corresponding magnetic space group is P Za Ï lt 01 • I he variatien of ~ as
a function of x is shown in Fig. 4.4.
·~ c
(a) (b)
Fig. 4. 3. Árt'ays of moments in system CBx.
a) In the monoclinic structure the easy axis is in ac-
mirror p lane at approximate ly 8° from the a-axis tO!Jards
the -axis 131. b) the triclinic struature the easy axis ~s rotated
an angle 4> out of ac-p towards t he b-axis 11 0, 1.
lpr--.,.---r---r---r---,
30°
20°
10°
0 x
4. 4.
Rotation 4>
the a
deuterium
of easy out of
function of
x. Fr om llijmans et al.
The large variation in the angle 4> as a result of only slight changes
in the surrounding octahedron of the Co-ion indicates that the Sy-plane
in CBx is a plane with a weak spin anisotropy. The existence of this
easy plane and the corresponding XY-character of CBx has mainly been
detected by susceptibility measurements 13,131. In terros of an effective
spins';~ with anisotropic g-value and exchange parameter J,
Hijmans et al. 131 obtained gy . 70, .82 and ;2.02 (subscripts
a, i3 and y refer to the principal axes of the susceptibility tensor,
I·

- 99
which are indicated in Fig. 4. lb). Taking into account the orbital con
tributions to the g-values, they arrive at (J /J )=0.29 and (J /J0)=0.98.
" y y ~ These values clearly indicate that the Sy-plane is an easy plane in
which the anisotropy is only small.
The spatial dimensionality of the magnetic system bas been discussed
by Haseda II41. There are two features which are of importance, i.e.
the interactions in the centered ab-plane and the interactions between
the planes. As is shown in Fig. 4.la, a number of possible exchange
interactions within the ab-planes may be distinguished. Analyzing the
nature of the exchange paths, Haseda concluded that J 2 and J 3 probably
would be small compared with J 1• From specific heat measurements
Kopinga et al. 141 obtained Z(J2+J3) ::(: 1.0 Kcompared with 4JJ=l9.4 K.
The exchange interaction J' between the ab-planes was estimated by
Haseda to range between 0.01 Kand 0.1 K 1141. The ratio J'/J 1 :j; 10- 2
indicates the d=2 character of CBx.
4.3. Experimental
Because of the large cross section of hydragen for incoherent scattering,
in neutron diffraction experiments a purely deuterated sample is pre
ferred. However, in the present experiment a partly deuterated sample
has been used to avoid difficulties due to the presence of domains in
the triclinic structure for x> 0,55. Single crystals were grown by
slow evaporation at room temperature from a saturated salution of
CoBrz in a mixture of 50% D20 and 50% H20. Typical dimensions of the
samples we re 2 x J. 5 x 0. 5 cm3• To check on the crystallographic struc
tur~ part of the produce was used to record a neutron diffraction
powder diagram at 4.2 K. The anticipated C 2/m structure was readily
confirmed, with unit-cell dimensions a;10.973(3) ~. b=7.120(2) R, c;6.838(1) Rand S;J24.92(1) 0 • From refinement of the effective
scattering length at the deuterium positions, a value x=0.483(8) was
obtained. This sample will further be denoted as CB48.
The experiments have been performed on a two-axis diffractometer at the
Petten HFR reactor. Neutron wavelengtbs of 2.570 Rand I. 163 ~. eer
responding to neutron energies of 12.4 meV and 60.5 meV respectively,
were obtained from a Cu (lil) monochromator. In the first case a

- 100
pyrolytic graphite filter was used to diminish higher order wavelength
contaminations. Soller slits with a horizontal divergence of 30' were
placed befare the monochromator and in front of the BFrdetector.
Vertical collimation was defined by 60' soller slits between mono
chromator and sample and in front of the detector. Tempersture control
was achieved by regulating the vapour pressure of the He-bath in which
the sample was immersed. Pressure could be kept constant for half a
day (typical time required for a complete scan of the critical scat
tering) within 0.5-1.0 mm Hg, corresponding to an uncertainty of I .0 mK
in the temperature region near T~.
4.4. Tempersture dependenee of the staggered magnetization
From the general expression for the (quasi-) static magnetic scattering
cross section, presented in eq. (2.19), it can be derived that the LRO
in CB48, described by the magnetic space group c2c 21
/m' and shown in
Fig. 4.3a, leads to magnetic Bragg reflections (h,k,~) with (h+k)
2n+ I and J'- = (2n+ I) /2, indexed with respect to the crystallographic
unit cell. The intensities of these reflections can be derived from
eq, (2.19) as
I(Q,T) "' jf(Q)j ( 4. 1)
where a now refers to the principal' axes a, i3 and y of the susceptibi-a
lity tensor (cf. Fig. 4.lb) and M8
t is the a-component of the staggered
magnetization. Because of the transformation properties of the space<
group C 2/m nuclear reflections are confined to reciprocal lattice
points with h+k = 2n.
Our measurements were restricted to the a~c~-reciprocal lattice plane,
which is shown in Fig. 4.5. The tempersture dependenee of M8
t has been
determined from the intensity variatien of a few intense magnetic
Bragg reflections with I. In order to check on extinction effects,
rneasurements were performed on both a large (1.5 cm3) and a small
(0. I cm3) single crystal. From this it was concluded that even in the
large sample extinction is negligible. Most data of M8t(T) were ob
tained frorn the top intensities of magnetic Bragg peaks, corrected for

- 101
4.5. The lattice plane of CB48. and squart;!S
and mwlear rej'lections,
y-axis êS indicated. q deviation of' Q from the nearest mnn>'"'"""
is u.sed in seCJtion 4. 5.
repre.sents the
Bragg and
the background and second-order nuclear contributions, which were
determined above TN. Correction of the magnetic intensities for
critical-scattering contributions appeared to be significant only very
close to TN. In this temperature region a sufficient number of critical
scattering profiles was recorded to determine the correction at the
(I 0!) reileetion by interpolation. Typ i cal va lues are 50% for
t i 1-T/TN! = 10-4 , 30% fort = lo-3 and only 3% for t Jo- 2 . From
the va lues at the (I O!) reflection the correction for other reflections
was calculated.
To campare the observed temperature variatien of M8
t with the predicted
single-power law behaviour (cf'.section 2.3.) and to obtain estimates
for the parameters TN, S and B, least-squares fits of
I(T) "' ( 4. 2)
to the data were performed. First the c-range in which (4.2) holds,
~i,e. the ex tent of the critical region has been determined. Our
approach to this problem is based on the requirement that different
fits, in which data points within the interval 0< t ':. tmax are taken into
account, must yield the same estimates for i3 and B, independent of the
specific choice of tmax up to an upper value of tmax' which then

- 102 -
corresponds to the edge of the critica! region, This requirement will
be fulfilled only if the correct value of the parameter is used.
The procedure is illustrated in Fig. 4.6. where for several choices of
TN the resulting estimate for 8 is shown as a function of tmax' From
these results one may conclude that (4.2) gives an adequate description
of the datafort ~ 0.015(5) and
Q.6r--r---,----.-~-.--..
/) 0.5
: 3.1175(JO)K.
4. 6.
Values for the exponent S, obtained
from least-squares
observed M;t (T),
and data
of (4.
into account, Eq. (4-
to
was
we re
gives
an description of the data
for t ;;; 0. 015 (5) and 3.1175(10)K.
The experirnental data for H~t(T) are shown in the double-logarithmic
plot in Fig. 4. 7., tagether with the best fit of (4.2) to the data
with t < 0.015 and TN fixed at 3.1175 K. For this best fit the esti
rnates 8 0.326(5) and B: 1.7(2) are obtained. The uncertainty in B
is mainly caused by the extrapolation of M8t(T) to T=O over a tempe
rature region of 0.45 TN. F9r t 0.02 the data clearly show a deviation
frorn the power law. However, the significanee of attributing an ad
ditional s-value to the data in the range 0.02 < t < 0.2 161 is doubt
ful. A further discussion of these results will be given in section
4.6., in combination with the results of the critical scattering
analyses.

- 103 -
10" I /
30% 1.5 3 crystal / 0 cm /
('11
1 • 10 3/2 / ,...........,
6 101/21 /~.P·
0.1 cm3 crystal /.~ ~ 101/2 ~~ " +' en
~ -1
1- 10 ..._.,.
+' en (3 ... 0.326(5) ::E '----' B = 1.7(2)
1Ö4
1Ö3 -2 -1
10 10 1 t
4.?. of ]2 .!.' .• as a ;unetêon af ~ The soUd line represents the best of (4. 2) the c,
data with t ~ 0.015 and at 3.1175 K.
Insection 2.3. the phenomenon of critical scattering near critical
points has been introduced. We stated that if the scattering
of neutrons by fluctuating spins is quasi-elastic II51 and quasi
static I 161, the (quasi-elastic) scattering cross sectien and the
static susceptibility tensor x are related by (2,19) and {2.25))
do d!l " T {4. 3)
... For the Q-dependence of x several approximants have been proposed.
Here a slightly modified version of the isotropie first approximant,
proposed by Fisher and Burford 11 71 and i ntroduced earlier as (2. 20),

- 104 -
will be used, namely
which applies to a low-dimensional system. In (4.4) q Q - 2Tï-;, the
deviation vector (see Fig. 4.5.). The staggered susceptibility is
defined by xst x(Q;2~~) and ~ is the anisotropic inverse correlation a a
length of the fluctuations. In general a different xst and inverse
correlation lengtbs ?a are found for each spin component. Again r
describes the deviation from the simple Lorentzian shape of x(q) which
is predicted by Ornstein-Zernike theory.
In order to select the most suitable magnetic reflections for the ob
servations on spin components parallel and perpendicular to the easy
y-axis, the direction of the latter in the ac-plane of CB48 had to be
determined, From the variatien of the critical field HIA at which the
spin system enters the I-phase, as a function of the direction of the
external magnetic field applied in the ac-plane, the y-axis has been
determined at 7.6(5) 0 from the c-axis towards the (see Fig.5.5.).
From Fig. 4.5. it can be seen that at the (10 3/2) reflection the angle
between Q and the easy axis is only 3°. Therefore, only perpendicular
spin components should be observable in that case.
Fig. 4.8. shows some
a-axis through the ( 1
intensities in scans parallel to the
reflection for T > TN. Even for T ; 3.122 K.
c 1600 'ë
Observed intensi t-ies scans
3.122 K I SCANS ACROSS
• 3,133 KJtJ~ (10%)REFLECTION Cl! " 4,24 K ~ second order
en ~~nuclear peak 1: 1400 :I background
8 ~ " ... . . \·: \"' .. -" ·~ - .-------.--1200 ~ ~ t 0 o od5co c;;,-ooCO *'6 Oo~
Fig. 4. 8.
the a-axis
Peflection
(À = 1. 163 . The contri-
bution of -0.1 0
perpendicuZar to the easy =·is
appears very smaU absent.

- ]05
very close to - 3.1175 K, no critical scattering could be observed.
At most a slight elevation of the background with respect to the
4.24 K level is visible. From this it may be concluded that all per
pendicular spin fluctuations are absent or very small. In contrast,
the longitudinal spin fluctuations, observed near the (Iol/2) reflection,
are very pronounced forT ~ TN' as we shall see below. Appatently, the
srnall spin anisotropy in the easy By-plane is sufficient to suppress
fluctuations in for < T < 4.24 K. Therefore, the transition at
TN must be characterized as Ising-like (n-1) rather than X~-like (n-2).
A further discussion of this re sult wi ll follow in section 4. 6.
+ lhe q-dependence of the longitudinal fluctuations as a tunetion of
ternperature has been determined near the (lol/2) reflection, both
above and below TN. In reciprocal space q-scans were made parallel to
the a-axis and the c"'-axis, to deterrnine the correlation lengtbs 1/Ka
within the ab-layers and I/Kc~ between the layers. Fig. 4.9. shows
sorne typical observed critical scattering profiles for T > TN,
These experimentally observed intensity distributions in q-space are
a convolution of the scattering cross section {4.3) and the instrumen
tal resolution function
I(Q0
) o: T[f(Q0
)]2 L [1-Q~a] f dQ (4. 5)
Cl
The resolution tunetion R(Q-Q ) for a two-crystal spectrometer rnay be 0
expressed by
R(Q-Q ) 0 (4.6)
For each Q0
the matrix elements M .. (Q ), which describe the shape and ~J 0
orientation of the corresponding resolution ellipsoid, can be cal-
culated I 181. As a check on this calculation, several actual resolution
ellipses in the ac-plane were mapped out, using Bragg reflections as a
probe. A tew typical results are shown in Fig. 4. 10.

- 106
1400-,-~~~~~----~--------~.---------~~------~~---------··················-~
3.415K X st • 5.4(15)x10
1
100° K •• 0.022~),!r'
1400~ 3.171 K 2 · Xst z2.2(3)X10
scans in a-direct' (10;) reflection
.............. · ..
3.415K
K<!. o.oac2JJr'
3.171 K
scans in c~direction (10!) reflection
" : K •• o.o17(2)Jr' 'ë 100 ;:
11) -~ !' ~. § 600 . . . ... ....~t•\.' · ...... • • ...... 0 0
1800: 3.130 K 3
~ 3.130 K :, • X st .1.4(2) x 10 ,.
• , : /""'second order : 1 : lf.,. 0.0058(6)A- !i/ nuclear peak Kc'• 0.022(2)À-
1 ::
1400 lt r: 1000 high background KI /critica! . ~~\
1
d\o hy~rogen .J ~ . scattermg ~-- \ • • • 1
600 -0.~· •• ~0~~~~·:':~:=-.Jmm-~~====--"---~ J -o.3 o _g.1 0.2 o.3J-o.4 -0.3 -0.2 -0.1 o q.1 0.2 o.3 U4
q.(l l qc.or >
Fig. 4..9. critiaaî scattering
neax• the
-axis 0.
with
refZection in scans
2.570 5iJ. Solid ss =x = 0.
simultaneousl.y
observed
to the a- a:nd
fits of (4 •• 5) to
scans were
= x yy ( q=O).
The observed intensity profiles near the (10 1/2) reflection were
fitted with the theoretical expression (4.5), where and XSS were
taken zero in agreement with the conclusion from the measurements near
the (103 ) reflection. The three-dimensional integral of (4.5) cannot
be solved analytically, but Yelon et al. II9I pointed out that, with
expression (4.4) inserted for xYY, it can be reduced toa one-dimen
sional integration. In the deconvolution program, which has been em
ployed, the final integration has been performed in a Caussian
quadratures calculation 1zo1. For each point Q of a scan the magnetic 0
farmfactor f(Q ) , the factor (1-(F.) and the resolution ellipsoid -* + o oy
R(Q-Q0
) were calculated. In the least-squares fits scans parallel and
perpendicular to the a-axis were treated simultaneously with the

- J 07
(201)
0.02
qa (A-') 4.10.
(202) between two ob-
served reso-
0.02 Zution ac-
qe.(A-') pZane. Ci~~cZes denote data
w~i-t;.h intensity /
SoZid lines n"T
are the caZculated 50% -0.02
" quantities xst x YY (q=O), , Kc"" and the intensity of the second-
erder Bragg peak as free parameters. Since the same path elements of
the dominant exchange interaction J1 are involved in the spin cor
relations along the a- en b-axis (Fig. 4.la.), the numbers of correlatèd
spins along these axes were assumed to be equal. Iherefore, we have
b/a in eq. (4.4), where 1/K is expressed in R and
not in numbers of spins. In the fits the background, which is very
high due to the large fraction of hydrogen in the sample, was appro
ximated by a second-order polynomial in and qc*· In the fi"?al de
termination of the critical scattering parameters the background and
(for T > TN) the secend-order nuclear Bragg peak have been fixed at
their average values. As expected, the obtained estimates for and
K are strongly correlated. No serious attempt could be undertaken to
determine a deviation of the profiles from Ornstein-Zernike theory
(n=O in (4.4)), as for this purpose much better counting statistics
and higher resolution are required.

- 108 -
From the profile analysis the temperature dependenee of both the
intralayer correlation ~ength (1/Ka) and the interlayer correlation
length 1/Kc* could be detennined in the entire range 2.9K< T < 4.25K,
in which measurements were perfonned. Both correlations show the same
temperature dependenee as is reflected in the constant ratios
Kc'*o/Ka% 3. 7 forT > and K~-~</K~% 2.8 forT < TN' (If only one scan
was available for a fit, the ratio Kc-~</Ka was fixed to this value).
This behaviour means that the transition to LRO in CB48 is essentially
three dime.nsional in character over this temperature range, The only
remainder of the d=2 characteristics of CBx at higher temperature lsi is that the numbers of correlated spins along the a-axis (Na) and
along the b-axis (Nb, assumed to be equal to Na) forT > are 3.6(3)
times as large as the numbcr of correlated spins along the -axis,
perpendicular to the ab-plane (Nci!<), This can be easily calculated
from
c sin f3 ~a
K lil c
K a
The temperature dependences of the inverse correlation lengths and of
the staggered susceptibility havebeen compared with the single-power
lavJS
(T)
and
x * a,c
(4. 7)
( 4. 8)
both for T > TN and for T < Primed symbols will be used to indicate
the quantities obtained forT< TN. Least-squares fits of (4.7) and
(4.8) to the data with t < 0.02 yield an average value for the ordering
temperature 3. 118 ( 1) K, which is in perfect agreement with the
value determined from the staggered-magnetization data.
Figs. 4. 11. and 4.12. present the temperature dependenee of the in
verse intralayer (Ka) and interlayer (Kc*) correlation lengtbs for
T > TN and T < TN, respectively. The identical behaviour of Ka en Kc*

",....--... .,... I
~
~
Fig. 4.11.
109 -
1 V(Kc-) ~ 0.67 (4) V (K8 ) = 0.66 (8) KcyKa=3.7(3)
"' ? ~J 1Ö1 .... '<>
.... .; ? ....
t .",. .. t t -2
10
t
of the inverse and
(Kc/"') correZation on t for T > Circîes and
squares ar•e obtained with À 2. 5?0 51 and À :::: 1.163 A, The solid lines al'e Zea.st-Bquares of
data, with TN at 3.11?5 K.
in this respect is obvious. Solid lines are least-squares fits of
(4.8) to the data, with again fixed at 3.1175 K and tmax = 0.02.
The resulting 'rvalues are 0.66(8) for Ka and 0.67(4) for Kc*· With
v fixed at the value v = 0.67, the amplitudes Ka= 0.28(1) and
Kc*= 1.01(3) are obtained. ForT TN the exponents v' 0.65(11)
and v' 0.69(6) result for 1 and K1*, respectively. l'iith v' fixed c
at 0.67 one obtains K1
0.65(3) and K1* = 1.81(6). a c
The staggered susceptibility data for T > TN and T < are ~hown in
Fig. 4. 13. Data frorn different samples were brought on the same scale
by a proportionality factor. The drawn lines correspond to (4.7)
fitted with TN = 3.1175 K and tmax 0.02. The corresponding exponents
are y = 1.18(7) forT TN and y' = 1.16(13) forT< TN' From a fit

~ ,.... I
$ ' :;c:
4.12.
104
.-----11) ..... '2 ::I
~ ... cv ... .....
:.0 ... ~
..... ."
~ 10
1
Por the
- I 10
1 tf( ff~·) = 0.69 (6) v'(ff~) =0.65(11)
" K~fK~ 2.8(2) " " -1 " 10 / "
" + I
-2 10
-3 10~~~~~~~~~-L~~~
1Ó4
1Ó3
1Ó2
18
Xs;
-3 10
1 t
K~ and K~'~< on t (1' < TN). Campare Fig. 4.11.
' -2
10 '
y -1.18 (7) y' -1.16 (13)
r/r-4.0{3l
Xst
~ t ~ ' ' ~~J ~
' ~ -1
10 t
1
Fig. 13.
bility versus t for
> T N a:ad 1' < TN.
I data ruzve been dOWn a long
the vertical axis over one SoUd li-nes fits of (4.7) to
the data, with N fi:r:ed at 3.1175K. further Fig. 4.11.

- 111 -
with y = y' = 1.17 the ratio of the amplitudes was obtained to be
?/r' 4.0(3).
For t > 0.02 both the correlation lengtbs and the staggered suscepti
bility data appear to deviate markedly from the single-power law
behaviour. The region in which these quantities follow a power-law
behaviour is roughly equal to the observed critica! region of the
staggered magnetization (cf, sectien 4.4.), in agreement with the
theoretica! predictions jzsl. However, there may be severe systematic
errors in the values obtained for ~ and xst in the region t 0.02,
as they strongly rely on a correct determination of the high background.
4.6. Conclusions
The critical region of CB48 has been investigated by detailed quasi
elastic neutron scattering experiments. The critica! scattering data
were analysed within the quasi-static approximation 1161. As our re
sults do not show systematic differences between K-values derived
from data taken with neutrons of different energies (Figs. 4.11. and
4.12.), this approximation appears to hold for the experiments that
were described.
Althougil the system CBx is a good approximation of the d=2 XY-model
at high temperature T >> TN 13-51, the present experiment shows that
the critica! behaviour in the temperature range 0 < t < 0.02 may be
described as d=3 Ising-like. The d=3 character can be derived from
the identical temperature dependenee of the interlayer and intralayer
correlation lengths, which indicates that both correlations play an
identical role in the ordering proces. Also the critical exponents that
were obtained, certainly exclude a d=2 ordering (cf. Table 4.1.). In
the critica! region t < 0.02 the only remainder of the low-dimensional
characteristics of CBx.is, that the number of correlated spins along
a direction in the ab-plane is a factor 3 to 4 larger than the number
perpendicular to the layers. A possible crossover to d=2 behaviour at
t > 0.02 could not be observed. The experimental data for xst and K
show even an opposite tendency. However, from this observation no
clear conclusions may be drawn, since the results for and K at
t > 0.02 might be affected by severe systematic errors, as we noted

- 112
already in the previous section.
Table 4.1. Critical e::cponents in CB48, compared with mcdel systems
I sys tem/ I Ref I s I y y' i \) I \) • l
CB48 0.326(5)1 1.18(7) 1.16(13) 0.67(4) 0.67(6) ::(; 0
!
n~tl21 ,231 !
d;3 0.325(1) 1
1. 240( 1) 1.240(1) 0.630(1) 0.630(1) 0.0315(25)
122 0.311(7) i 1.250(1) l. 250(1) 0.640(3) 0.640(3) 0. 04 7 ( 1 0)
1 d=3 n=2 1231 0. 346(9) 11.316 (9) I 1.316(9) 0.669(3) 0.669(3) 0. 032 (15)
i 1221 0.348(7) 1.318(10 1.318(10,0.670(6) 0.670(6) 0. 04 (I)
I d=2 n=1 1241 1 /s 7 I 4 7; I I lj4
From the critical exponents one cannot distinguish if the ordering in
CB48 is Ising-like or XY-like, as the differences between the theo
retica! va lues are only small. However, the Is ing-character of the
ordering may be deduced from the non-divergenen of the spin fluctu
ations perpendicular to the easy axis. Apparently the small exchange
anisotropy in the Sy-plane is sufficient to suppress spin fluctuations
along the S-axis. A similar behaviour was reported for ~fuF2 , where also
a small (unaxial) anisotropy is present lt61,. The perpendicular spin
fluctuations do not diverge in HnF2 either, but they could be observed.
To estimate the magnitude of the perpendicular spin fluctuations in
CB48, a crude comparison can be made.
In MnF2 x~t and K~, related to the perpendicular spin fluctuations,
are almost temperaturn independent for t < 0.01 and roughly equal to
the longitudinal values for t ::t; 5 ~ 10-2. If the same properties are
assumed in CB48, at most a broad profile ::(; 0.03 ~- 1 ) of low in-
tensity, cornparable with the upper profiles in Fig. 4.9., would result
even at TN. Moreover, only spin fluctuations along the S-axis probably
would contribute to in CB48. Therefore, it is not surprising that
near the (I / 2) reflection only a slight elevation of the background
was observed.

113-
Hithin the experimental errors several exponent relations are ful-
filled in CB48, such as "( y ' , v = v' and y (2-n)v. A good estimate
of n can be derived from the values of S and v that were obtained.
From the exponent relation l+n = 28/v, a value n -0.03(6) results.
This value and the obvious d=3 characteristics of the critica! scattering
in CB48, justify the le analysis with n=O a posteriori.
Besides the cri ti cal exponents, a lso the obtained cri tic al amplitudes
are in good agreement with the theoretica! values for the d=3 Ising
model. The amplitude B I .7(2) may be compared with the calculated
value .B 1.569(3) for a simple cubic lattice with S , 221. The
experiment al value 4. 0(3) for the ratio r /I'' may be compared with the
theoretica! values 5.07 (from series expansions) and 4.80 (from the
s-expansion, cf. Table 2.3.).
In conclusion it may be stated that in CB48 below 4,2 K both the aniso
tropy in the XY-plane and the interlayer interactions already exert
their influences on the ordering, and no d=2 XY-features can be
reeavered for t < 0.5.
In least-squares fits of a single-power law
(A4 .1)
to a number of data points (Ii,ti), it is important that also the
uncertainty in ti is taken into account in a correct way, w'hereas the
data usually have a comparable uncertainty inT, the relative error
in t increases rapidly as Ti approaches Tc' In a double-logarithmic
plot around each datapoint an "error ellipse" may be drawn with v and y
vx as main axes. Here and vx are the uncertainties in yi = in Ii and
in xi =in ti' respectively. All ellipses, which are congruent with
the error ellipse at (yi,xi) can be denoted as
y-y. 2 (--l) +
v y
2
g • (A4. 2)

- 114
One of these ellipses, indicated with g = gi' will touch the straight
line, which represents the power law (A4.1).The here applied weighing
procedure now minimizes the sum I: g. 2 . l l
A direct consequence of this method is that for each choice of the
weights must be recalculated as the ox depend on Tc. Although the
present procedure results in larger uncertainties in the estimates of
I0
, and a in (A4.1), it is certainly more realistic than a method
in which a constant ox or no at all is used.
lil H.E. Stanley and T.A. Kaplan, Phys. Rev. Lett. Jl, 913 (1966).
12 i D.D. Betts in "Phase Trans itions and Cri ti cal Phenomena", Vo 1. 3
(C. Domb and M.S. Green, Eds.), (Academie Press, New York, 1974),
D.D. Betts and M. Plischke, Can. J. Phys. 54, 1553 (1976) and
references therein.
131 J.P.A.M. Hijmans, Q.A.G. van VIimmeren and \oJ.J.M. de Jonge,
Phys. Rev. 3859 (1975).
141 K. Kopinga, P.W.M. Borm and W.J .M. de Jonge, Phys. Rev. ~.
4690 (1974).
151 J.W. Metselaar, L.J. de Jonghand D. de Klerk, Physica 79B, 53
(1975).
N.D. Mermin and H. Wagner, Phys. Rev. Lett. 11 33 (1966).
J.A.J. Basten and A.L.M. Bongaarts, Physica 86-88B 677 (1977).
J.A.J. Basten, Proc. of the Int. Symp. on Neutron Inelastic
Scatterin~,Vol II (IAEA, Vienna, 1978), page 247.
191 E.V. Stroganov, S. Andreev, Kochina and V. Soloviev, Vestn.
Leningrad. Univ. Ser. Fiz. Khim. ll• 114 (1961).
I JOl J.A.J. Basten and A.L.M. Bongaarts, Phys. Rev. ~. 2119 (1976).
I 1 Ij J.P.A.M. Hijmans, W.J.M. de Jonge, P.van der Leeden and
/121 I 131 1141
1151
M.J. Steenland, Physica ~. 76 (1973).
R. Kleinberg, Bull. Am. Phys. Soc. ll• 759 (1966).
T.E. Murray and G.K. Wessel, J. Phys. Soc. Jpn, 24, 738 (1968).
T. Haseda, J. Phys. Soc. Jpn. 483 (1960).
W. Marshall and S. W. Lovesey, ''Theory of Thermal Neutron Scat tering"
(Oxford D.P., New York, 1971).

- 115
1161 M.P. Schulhof, P. Heller, R. Nathans and A. Linz, Phys. Rev. !!_,
2304 (1970).
i 171 M.E. Fisher and R.J. Burford, Phys. Rev. 156, 587 (1967).
il8 I M.J. Cooper and R. Nathans, Acta Crys t. A24, 481 (1968),
M.J. Cooper, Acta Cryst. 624 (1968). For. some minor
corrections see B. Dorner, Acta Cryst. 319 (1972).
119 I W.B. Yelon, D.E. Cox, P.J. Kortman and W.B. Daniels, Phys. Rev.
B9, 4843 (1974).
A.W. Lowan, N. Davids and A. Levenston, Bull. Am. Math. Soc. ~.
739 (1942).
J.C. le Guillou and J. Zinn-Justin, Phys. Rev. Lett. 95 (1977).
D.J. Wallace in "Phase Transitions and Cri ti cal Phenomena" Vol. 6
(C. Domband M.S. Green, Eds.),(Academic Press, New York, 1976), Table VI.
123 I G.A. Baker Jr., B.G. Nickeland D.I. Meiron, Phys. Rev. BI
1365 (1978).
1241 C. Domb in "Phase Transitions and Critical Phenomena", Vol.3
(C. Domband M.S. Green, Eds.),(Academic. Press, New York, 1974).
lz5l L.J. de Jonghand H.E. Stanley, Phys. Rev. Lett. 817 (1976).

- 116 -

- 117 -
CHAPIER V
TETRACRITICAL BEHAVIOUR OF CoBr2 • 6 {0.48 DzO, 0.52
5. 1. Introduetion
CoBrz•6H20 bas been reported to show a spin-flop transition in a
parallel field at HSF ~ 7.5 kOe (for I=O) I 1,21. This rather low
value is due to the weak spin anisotropy in the Sy-plane, which we
discussed to some extent in section 4.2. In view of the convenient
location of the bicritical point at (Tb ~ 2.90 K, Rb ~ 9.31 kOe) I I ,21,
it appeared attractive to perform a neutron scattering study on the
bicritical behaviour in this materiaL
Purpose of the present experiment was to study the intensity variations
for several magnetic Bragg reflections as a function of a parallel
magnetic field and the temperature. From these results we wanted to
determine the magnetic phase diagram and to test the smoothness
hypothesis 131 along the paramagnetic phase boundaries TU(H) and T~(H). c c
As a well-defined easy axis is crucial to perferm such a study, we had
to avoid the domain structure, which is present in the triclinic phase
for deuterium fractions x> 0.55 (Fig. 4.2.). On the other hand, a
diminishing of the incoherent neutron scattering due to hydragen atoms
would be preferable. Therefore, a sample with x 0.48 (CB48) was used,
like in the zero-field experiment described in chapter IV.
To our surprise, the magnetic phase diagram for CB48 appeared to be
essentially different from the reported diagram for CoBrz•6HzO 121.
The present neutron scattering experiment provides strong evidence that
in CB48 the AF-phase and the SF-phase are separated by an intermediate
phase and not by the usual spin-flop transition. To our knowledge this
is the first time that an I-phase with coupled order parameters is re
ported for an antiferromagnetic system.

- 118 -
5.2. Experimental
As mentioned ~n sectien 4.5., the y-axis of CB48 is situated ~n the
a~c*-mirror plake, but its direction within this plane does not co-
incide with one of the crystallographic axes (Fig. 4.5.). This ~s a
substantial handicap for the performance of neutron scattering expe
riments in a parallel magnetic field. Obviously, the possibility to
use a vertical magnetic field along the easy y-axis will be excluded,
since in general no magnetic Bragg refle.ctions will be observable in
the horizontal aS-plane. Therefore, we had to use a geometry with a
horizontal magnetic field and the a*c* reciprocal-lattice plane, which
-as was shown in sectien 4.4. - contains many magnetic reflections, as
scattering plane. This, however, has the disadvantage that many reflec
tions cannot be measured because of the interceptance of the incoming
or scattered neutron beam by the poles of the magnet (Fig. 5.1a.).
As can be seen from Fig. 5. lb. only a small part of the a~c*-plane can
be investigated, the extent depending on the neutron wavelength used,
The present experiment has been performed on the two-axis diffracto
meter HBS at the Petten HFR reactor. A neutron wavelengthof 1.163 R has been used, obtained from a Cu(l 1 1) monochromator. The sample was
a large single crystal of 2 x 1.5 x 0.5 cm3 which was shaped roughly
ellipsoirlal to reduce inhomogeneities in the demagnetizing field. The
sample was mounted in a liquid-He bath cryostat, which was mounted on ~
a conventional magnet with H horizontal, The cryostat + sample could
be rotated around a vertical axis with respect to the magnet. The in
homogeneity of the magnetic field over the sample was better than 0.5%.
Temperature control within 1-2 mK was achieved by regulating the vapour
pressure of the He-bath.
Special care has been taken to obtain an accurate horizontal orientation
of the magnetic field H and the a*c* reciprocal-lattice plane. The
deviation of H frorn horizontal due to irnperfections in the construction
of the diffractometer has been determined to besmaller than 4'.
The a~c*-plane has been adjusted horizontally with JO' vertical colli
mators between monochromator and sample and in front of the BF3-
detector. For this purpose the intensities of several sets of Bragg

Fig. 5.1.
- 119 -
d;;i} c ---------0 ;~ (a)
-c a• ~~-r--~~~~-,L-~~r-----~~~~ h=5
(a) Schematic of the scattering geometry with the horizonta.' + +
maanetic field H along the easy y-axis and the scattering vector ('
in the (30~/2 ) direction. k0
and k indicate the incoming and
scattered neutron beam with À= 1.163 A. (b) Reciprocal lattice of CB48. Dots and squares indicate magnetic
and nuclear reflections, respectively. The shaded and doubly
shaded areas correspond to the attainable part of the
space for À = 1.163 A and À = 2. 5?0 A, respectively, when is
directed the easy axis.
reflections have been optimized. In this way a horizontal orientation
of the a*c*-plane has been achieved within 2'-3'. Therefore the
maximum angle betweenHand the easy-hard a*c*-plane has been esti
matedas 7'. Optimum orientation of H along the easy axis within the
* * + a c -plane has been obtained by rotating H with respect to the sample
(see section 5.4.).
+ With H along the easy axis, all attainable magnetic Bragg reflections
(Fig. 5.1b.) have weak intensities in the AF-phase, since the corres-

- !20 -
ponding factors (I-Q2 ) are small (cf. eq. (4.I)). To determine the y
temperature a~d field dependenee of the order parameter in the AF-. 11 y . . . 5
phase, &.e. Mst = Mst' the 1ntens1ty varlation of the weak (10 / 2 )
reflection has been studied. The (H,T) behaviour of the order parameter
in the SF-phase, i.e. M_L = MS , can be determined directly from the st st_
intensity variation of the (I0 3/z)-reflection . With (I-Q~) = and
(I-Q~) ~ 0, only M;t will contribute to the magnetic intensity of this
Bragg reflection. Finally, for the observation of the homogeneaus
magnetization M(H,T), which gives a small magnetic contribution at the
same reciprocal lattice points where nuclear Bragg peaks occur, the weak
nuclear (OOI) reflection has been used.
5.3. Determination of the paramagnetic phase boundaries
/1 The locations of the AF-P phase boundary Tc(H) and the SF-P phase boun-
dary T~(H) in the H#T-diagram have been obtained from the disappearance
of the order parameters M// and Mj_, respectively. For the determination j_ st st -
of M (H,T) the temperature variation of the (I0 3/z) intensity has st
been observed at several H-values. After correction of the data for
the background and second-order nuclear scattering, which were deter
mined far above TN' for each H-value least-squares fits of
I(T) ~ fl.!_Lt(T)/M_L (o)f ~ s st
(5. I)
to the data have been performed. Here t = (I -T /T~(H)) and B, S j_ and
T~(H) were treated as free parameters. The fitting procedure des-c
cribed in chapter IV has been used.
The results for fits in which all data have been taken into account,
are shown in Fig. 5.2. The corresponding ~-values and critical tempe
ratures T~(H) are collected in Table 5. I. If only data with t < 0.035 c
are taken into account,the resulting ~values are slightly larger
(average value Bj_ = 0.32(2)) but the results for T~are not signifi
cantly different from the tabulated values. In accordance with the
smoothness hypothesis 131, no systematic change in sj_ is observed ~
along the phase-boundary Tc(H). The weighted average value Sj_ = 0.3I(I)
is in good agreement with predicted values for the d=3 Ising model

- 121 -
3 10
3' ï: ::J ;.. ~
~ .IJ
~ "~ -1;; .!
10 10
3
Fig. 5.2. Double-logarithmic plot of the
several H-values as a function
H(kOe)
• 9.91 0 11.00 & 11.99 v 13.29
• 14.27 . 15.00
102
101
1-T/Tc.l.(H)
j_ observed (Mst) 2 data at
of t = 1-T/T~(H). The solid c line corresponds to the average value from least-squares
fits 2 S ..L = 0. 6 2 ( 2) .
(cf.Table 4.1.). The slight increase of T~with H has been observed
also in the purely hydrated compound [2[ .
..L Table 5.1. Estimates of T/fi) :._nd 6.1_ from least-squares fits of (5.1)
to the (10 3/2) intensities at constant !i .
H(kOe) ..L
Tc (K) s..L I
15.00 2.870(2) 0. 306 ( 12)
14.2 7 2. 871 (I) 0.311(7)
13.29 2.871(2) 0.313(11)
!I. 99 2.867(2) 0.306(13)
!I. 00 2.861 (2) 0.308(14)
9. 91 2.855(2) 0.331(19)
For the determination of T/~H) the temperature dependenee of the weak c -
magnetic intensity of the (!0 5/2) reflection has been determined at
H = 2.50 kOe and H = 8.00 kOe. These measurements were very time-

- 122 -
consuming and the data appeared not accurate enough to perfonn a least
squares fit of
(5.2)
with B, B;; and T~(H) simultaneously variable. Therefore, ~/ was fixed
at the theoretical value 0.325, in agreement with the observed value
at the Néel point (Table 4. 1). Fig. 5.3. shows the fits of (5.2) to
the observed intensities at bath H-values, which obviously are well I!
described by this value of S. The corresponding values of Tc are
tabulated ~n Table 5.2.
t
5. 3.
Double-logarithmic plot of the
observed (M~) 2 data at H = 8.00 kOe
and H = 2. 50 kOe. 1'he so lid lines
represent best fits of eq. (5. 2) to
the data wi th ~ at 0. 325.
At five constant temperatures T < TN the variation of the top intensity
of the (105/2) reflection with H has been recorded. Although the data
of these field scans are too inaccurate to extract the critical ex-
ponent S;; from them, they do yield rough estimates for the corres
ponding H#(T). These values arealso collected in Table 5.2. c
5.4. The transition to the SF-phase
For the observation of the AF-SF transition the variation in the peak
intensity of the (103/2) reflection, proportional to (~) 2 , has st
been recorded in field scans at constant temperature. A typical re-
sult for T << TN is shown in Fig. 5.4. In the AF-phase (H < H1
A) the

- !23 -
Table 5. 2. Estimates of Tf(H) and s11 from the (10 5h) 1:ntensity.
(see main text)
H(kOe) T//(K) c S;;
0 3.1175(10 0.326(5)
2.50 3. !OI (4) 0.325 fixed
4.75(25) 3.048(2) -
6.25(25) 2.997(2) -
7.25(25) 2.946(2) -
8.00 2.915(5) 0.325 fixed
8.25(25) 2.898(2) -
9. 00 ( 15) 2.848(2) -
observed intensity hardly exceeds the background, as <,ras expected from
1-Q~ ~ 0. Between HIA and HlS a linear increase in intensity is ob
served and in the SF-phase (H > H1
S) the intensity stays almast
constant up to the maximum applied field of IS kOe .
.., CD -....._
"' " ~ 0
T ~ 1.743 K
1000 w ~ 27.58°
"'-~ ·~ 500 c ~ :s
...
background
'-""---'.....,~ _____ \,_ ___ _
8 9 H(kOe)
Fig. 5. 4.
Top intensity of the (10 3/2)
reflection, observed in a
field scan at T = 1.?43 K.
w indicates the angle between
H and the c*-axis.
The precise direction of the easy axis in the a*c*-plane can be deter
mined from the variation of HlA and HlS when the applied magnetic
field is rotated in this plane. H1A(w) is shown in Fig. 5.5., where w

- 124-
represents the angle between H and the c*-axis. The observed de
pendence is symrnetrical around w0
= 27,3(5) 0 and closely resembles
a casecant function. The w-dependence of RIS is completely similar
over the entire scanned w-range. From symmetry considerations the
direction of the easy axis must be identified with w0
, i.e. at 7.6(5) 0
from the c-axis towards the c * -axis (cf. Fig. 5. Ib.). Th is value hardly
differs from the direction reported for the hydrated compound 141. The
approximate casecant behaviour of RIA(w) and RIS(w) indicates that the -+
component of R along the hard a-axis has little influence on these
critical fields.
I I
Hl A I T=1.743(2) K
(kOe) I \ I \ I \ I \
\ I \ I
\ I \ I
7.4 " 1/
c•-axis • c -axis Wo
00 10° 20° 30° 40° w
•; I
50°
Fig. 5. 5.
Dependenee of HIA on w, sym-
metrical around w 27.3(5)0, 0
The dash-dotted line corres-
ponds to H IA ( w) c: 7. 35 kOe/
cos ( w-w0
).
At a first-order spin flop transition a linear increase in intensity
1s expected over a small range of external fields due to demagnetization
effects 151. Rowever, the field range RIS- RIA~ 1500 Oe where
linearity is observed at T = 1.743 K, amply exceeds the maximum value
of 6H which can be expected from demagnetization. In general this

- 125 -
field range 6H is well predicted by MF-calculations 161. Taking the
X_1_ value reported for the hydrated material 141 and applying the
max1mum demagnetization factor N(=4rr), one arrives in MF-approximation
at
6H (T=O) max 4rr X~ HSF(T=O) ~ 160 Oe . (5. 3)
Frequently, the crigin of a discrepancy between the observed and cal-+
culated 6H is due to a deviation of H from the easy-hard plane. If
the mismatch angle ~ between H and the easy-hard plane exceeds the
critical angle ~c 171, no first-order transition takes place and a
braaderring of the field range in which the spin rotatien takes place,
will be observed (cf. sectien 3.5.). This appeared to be the case in
our experiment on the spin-flop system CsMnBr3•2D20 (CMB) Is I, which
we shall report in chapter VI. Here we shall show that this explanation
is certainly not appropriate for the discrepancy in CB48.
+ As we discussed in sectien 3.5., the rotatien of Mst can bedescribed
by the MF-expression
tg(2ç + 2~)
+
cos
s1n 2~
2~ - (H/H ) 2 SF
if the angle between H and the ay-plane, which corresponds to
(5.4)
~ = arctg(HS/HY), is much greater than the critical angle (~ >> ~c). + .
Here Ç is the angle between :::st and the easy y-ax1s. The corresponding
field dependenee of the (103/2) intensity is then given by
I oo (M~ )2 st
(5. 5)
In Fig. 5.6. the observed intensity variatien at I. 743 Kis compared
with the MF-predictions for two values of ~· Here we assumed M2 st
constant over the shown field range, which will not induce gross
errors in a weakly anisatrapie system with H5F(T=O) << Hc(T=O), It can
beseen in Fig. 3. I. that the sublattice magnetizations will remain
almast antiparallel during the rotation, as can be calculated in MF
approximation from

6
5
--.. ., 0
4 oo:t ~ ., ë :l 0 u 3 M~
'--'
~ ëii
2 "' .2! .5
7
- 126 -
1.743 (2) K ;
W=24.5o ql= 50
</1 = 30
8 9 H (kOe)
Fig. 5. 6.
Accurately determined
shape of the increase in
top intensity of the
(10 3/2) reflection com-
with the molecular
field predictions for
two values of the mis
alignment angle ~ between
H and the easy axis.
(5.6)
for T=O (compare Table 3. 1.). The failure of the description of the
observed intensity variation by (5.5) is concluded from the following
facts.
- The agreement in Fig. 5.6. is very poor indeed, whereas in CMB the _,.
rotation of Mst is perfectly described by (5.5) (compare Fig. 6. 10.).
Even on a highly enlarged field scale the intensity increase in CB48
appears to be really linear, in contrast to the calculated curves. _,.
- To account fora field range 6H of 1.5 kOe for the rotatien of Mst
from an AF- to an SF-ordering, a mismatch angle ~ of approximately 5°
must be assumed. Such a severe misalignment can be absolutely dis
carded, as we discussed at length insection 5.2., where the mismatch
in this experiment was estimated as~~ 7'. Moreover, ~ = arctg(H /H) s y would vary clearly in case of a severe misalignment if H is rotated
with respect to the sample. Therefore one would expect then clear
changes in the ratio (H1 S-HIA)/HIA as a function of w which, however,

- 127 -
have not been observed in the entire scanned range -5° < w < 50°.
(')
0 ....
c:: E 0 N ~
1/) ....
1.54
§ 1.52 0 0
"'o ....
6
( o o1)
8 10
H (kOe)
Fig. 5. ?.
Observed field dependenee of the
top intensities of the (l0 3hJ and the (OOl) reflection at
T = 2.096 K. The two spikes in
the (OOl) intensity near HIA
and H15
are of nuclear origin
and indicate the presence of
crystallographic changes.
The anomalous behaviour of this transition in CB48 is also indicated
by the observed field dependenee of the peak intensity of the (OOI)
reflection, shown in Fig. 5. 7. for T = 2. 096 K. At a normal first-
order spin-flop transition the nuclear and magnetic intensities are
additive and an increase lil in the magnetic contribution to the reflection
is expected. An expression similar to (4.1) shows that this
magnetic contribution is quadratic in M, so lil is proportional to liM2 ,
where liM is the discontinuous change in the homogeneaus magnetization
at the transition. Here, however, two spikes are present in I(OOI),
approximately at RIA and H18
. These cannot be from purely magnetic
origin since the negative derivatives di/dH would correspond to a

- 128 -
. . . . dM . negat~ve suscept~b~l~ty dH' Apparently by the appl~cation of an ex-
ternal magnetic field, crystallographic. changes are induced in CB48
which are large enough to be observable.
Referring to our discussion in chapter III, an alternative explanation +
of the broad H-range, in which the rotation of Mst takes place, auto-
matically emerges, namely the presence of an intermediate I-phase.
In this case HIA and HIS must be considered as the critical fields
separating the I-phase from the AF- and the SF-phase respectively.
In addition to the above-mentioned arguments, there are several other
indications which support the suggestion of an intermediate phase in
CB48.
I. MF-theory prediets a linear increase of the (103/ 2 ) intensity (see
Fig. 5.6.) with H in an intermediate phase. In MF-approximation 191 (see Table 3.1 .), the rotation of the sublattice magnetizations in
the I-phase is described by
(h-/Q)/ (-R/Q) (5. 7)
Q (h-IQ) I (-R/Q) (5.8)
in the stability range
/Q < h < /Q(I-R) . (5.9)
Here h = vH/(A +A +D), Q = (A -A +D)/(A +A +D), R = +2D/(A +A +D) zy zy zy+ zy
and D = D -D . The inter-sublattice coupling A and the intra-z y +
sublattice coupling D have been defined in chapter III, eq. (3.8).
In a weakly anisatrapie system Q << I, so that
This means that during the rotation the sublattice magnetizations
remain almast antiparallel. Therefore .the magnitude of Mst may
be considered as a constant and

- 129 -
(5. 1 O)
which expresses the linearity of I (103/2) as a function of H.
2. The extent of the field range HIS-HIA ~ 1500 Oe is quite acceptable
in the case of an I-phase. Accepting the idea of an I-phase for a
moment, we can calculate the anisotropy in A and D from the observed
fields HIA and HIS' in combination with the reported value of He in
the hydrated compound 121. From Table 3.1. we take the MF-expressions
).JHIA [CA -A +D) (A +A +D)j 1 z y z y (5. 1 1)
).JHIS I
(A +A -D) [CA -A +D)/ (A +A +D)] 2 z y z y z y (5. 12)
and ).JH ~ (A +A-D) (5. 13) c z y
For T ~ 1. 743 K we observed HIA ~ 7.35 kOe and HIS ~ 8.95 kOe. From
!2! we take Hc(1.743 K) ~ 47.5 kOe. With these values inserted in
(5.11)- (5.13) we obtain
and
A/A ~o.n y z
A z
4.14 K
(D -D )/A z y z
-0. 17 (5. 14)
(5. 15)
If we use extrapolated values for T ~ 0, viz. HIA ~ 6.1 kOe,
H ~ 7.7 kOe and H IS ~ c 54 kOe, the ratios (5. 14) hardly change,
whereas Az is increased to Az ~ 4.60 K. These values can be compared
with the reported results in CoBr2•6H20 I JO!
A /A ~ 0.95 y z
and A z
4.80 K.
The anisotropy 1n D is not known. Although the anisotropy in A for
the hydrated material is clearly smaller than the calculated value
(5. 14), the results (5.14) and (5. 15) appear to be quite acceptable,
indeed.
3. In case of an I-phase, HIA and HIS are second-order phase boundaries.
Then the slightly increased intensity in the AF-phase at H ~ HIA

- 130 -
(cf. Fig. 5.6.) can be interpreted as critical scattering from
fluctuations of spin components along the intermediate axis.
(Near a first-order transition no critical scattering would occur.)
Similarly the slightly decreased intensity for H 1;: H can be con-// IS
sidered as an effect of fluctuations in
M_[_ which is visible. st
Mst' reducing the component
4. As we have seen in section 4.2., a crystallographic phase transition
takes place in the system CBx near x= 0.55 for low T. Therefore it
is not astonishing, that the monoclinic crystal structure of CB48 is
quite unstable. Apparently, the magnetic and electrastatic inter
actions in CB48 correspond to comparable energies, sirree we are able
to induce crystallographic changes by the application of a magnetic
field. The preserree of magneto-elastic coupling in CB48, makes the
occurrence of an intermediate phase very conceivable. As is derived
in the Appendix this coupling gives rise to terms of the form
S 2s 2 = S 2 s 2 in the free energy, which couples the order parameters -y B 7/ _L
MI/ and M_L. As was pointed out by Bruce and Aharony ! 11 I, the st st
preserree of a (strong) term of this form in the Hamiltonian is
a
and
necessary condition for the appearance of an I-phase, where M~ st
Mj_ are ordered simultaneously (cf. section 3.3.). st
From these arguments at least a strong suspicion emerges that in CB48
no simple spin-flop transition occurs but that an intermediate phase
exists bet,oeen the AF- and SF-phase. Only the verification whether the
intensity increase at H ~ HIA and the decrease at H ~ HlS are due to
critical scattering indeed, would be a completely conclusive argument.
Unfortunately, such an experiment has not been performed yet.
5.5. The magnetic phase diagram
Fig. 5.8. shmos the intensity variation of the magnetic (103/2) re
flection (oc (Mj_) 2 ), as a function of HandT. From this picture a st
good impression is obtained of the location of the I-phase in the HT
phase diagram. The corresponding critical lines HIA(T) and HIS(T) are
a lso shm,m in the H2 va. T diagram of Fig. 5. 9. , tagether wi th the
paramagnet ie phase boundaries T//(H) and T_[_(H). From these data the c c
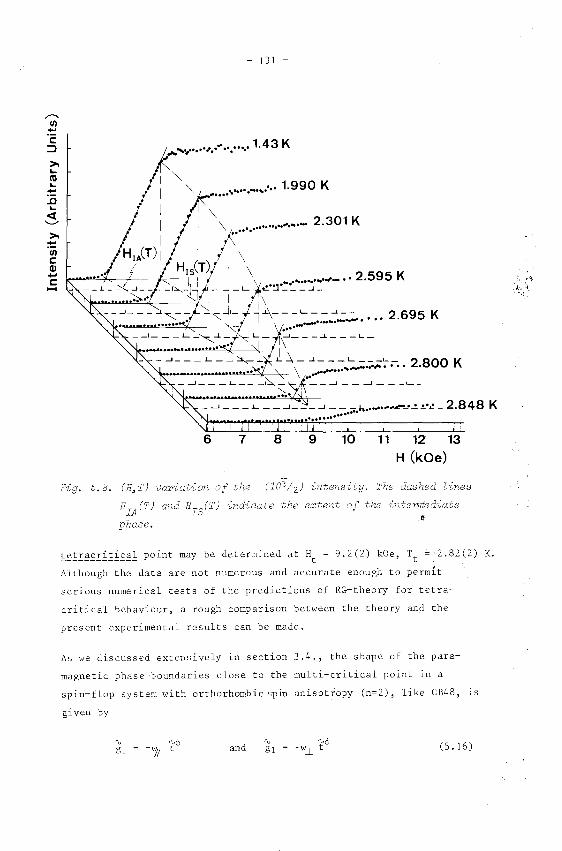
>:t::! IJ)
c QJ +' c
- 131 -
-·~· .... ·· ....... 1.43 K .,.. .... , . .-. . .. 1.990 K
................. -..... 2.301 K
_ .......... •J- .. 2.595 K ~·:.1·_:__...,!_
i\ T'-\---'---...l-- 2.695 K .... -·-··--........... .
2.800 K
--' -- --'- _ --'--- ....~ __ -!. •• _. ... ....-_·..!~·~ _ 2.848 K ················
6 7 8 9 10 11 12 13
H (kOe)
Fig. 5. 8. (H,T) variatien of the (10 3/ 2 ) The dashed lines
H IA (T) and H riT) indicate the ex tent of the intemlediate
phase.
~~~!§~Ii~i~§1 point may be determined at Ht = 9.2(2) kOe, Tt = ·2.82(2) K.
Although the data are not numerous and accurate enough to permit
serious numerical tests of the predictions of RG-theory for tetra
critical behaviour, a rough comparison between the theory and the
present experimental results can be made.
As we discussed extensively insection 3.4., the shape of the para
magnetic phase boundaries close to the multi-critical point in a
spin-flop system with orthorhombic spin anisotropy (n=2), like CB48, is
given by
and (5. 16)

200
2 Hext
(kOe2)
150
50
SF
AF
2.4
- 132 -
7 tetracritical
point
2.6 2.8 2.0 T (K)
p
Fig. 5.9.
Observed H~2 vs. T
diagram of CB48.
Estimated sealing
=es g=O and ?;:::o are indicated,
tagether with
Fisher's estimate of the ?;:::o =is j13J. The tetracritical point is
located at Ht = 9.2(2) kOe, Tt = 2.82(2) K.
with ~/ = +~. The boundaries of the I-phase are J! IJ
(5. I 7)
with ~/ = +~. Bruce and Aharony J I! J pointed out that
'!Jz > rt • (5. IS)
Fora rough comparison between theory and experiment, one can determine
the directions of the optimum g=O and f=O sealing axes using the pre
dicted symmetry for bath pairs of phase boundaries (5.16) and (5.17).
The estimates of bath axes are shown in Fig. 5.9. f.lso Fisher's

- 133 -
estimate J !2J for the direction of the i=O axis is shown, according
to (3.39) taken with a slope (n+2)/3n 2/ 3 as large as the slope
[ctT:/d )JH=O of the paramagnetic phase boundary T~(H2) at H=O.
The difference between the two estimates is possibly due to the d=2
character of CB48. In a low-dimensional system the MF-type of approach
which leads to Fisher's estimate J!2J is nat entirely appropriate.
Along the major part of Tfi(H2 ) the MF-prediction of a straight line c
appears to hold. As expected, deviations from MF-theory become
apparent only very close to the tetracritical point. As in many spin
flop systems J!3J, it is hardly visible that T_L(H2 ) comes in tangent c
to the g=O axis. Finally, it can be concluded that the theoretica!
predietien (5.18) appears to hold in CB48, as the I-phase boundaries
start to approach the g=O axis at a much larger distance from the
tetracritical point than the paramagnetic phase boundaries do.
5.6. Discussion
In this neutron-scattering experiment on CB48 it was found that the
transition from the AF-phase to the SF-phase extends over an anomalously
braad range for the applied magnetic field. The existence of this broad
field range has been confirmed recently by preliminary magnetization
measurements on a number of small single crystals grown from the same
salution as the sample used in the neutron-scattering study Jt4J. As
we have shown in section 5.4., the observations cannot be explained
if one assumes a first-order spin-flop transition. Moreover, in the
same field range anomalous intensity changes for a nuclear reflection
were observed, which indicate a variatien in the crystallographic
structure. We showed that these observations are streng indications
for the presence of an intermediale phase in CB48, although the evidence
is certainly not exhaustive. Many questions still remain unanswered
and deserve further investigation.
We have nat enough information to our disposal to decide which kind
of crystallographic changes occur in CB48 at and Group-
theoretica! arguments indicate that the crystallographic unit cell
must undergo a triclinic distartion (whatever small) in case of an
I-phase. This would imply a (small) shift in the peak positions of

- 134 -
all Bragg reflections and possibly a variatien of the nuclear intensi
ties. Unfortunately we have no data to verify wilether a shift in the
peak positions actually occurs. It is possible indeed, to explain the
spike in the (OOT) intensity (Fig. 5.7.) near as the effect of a
small ( ~ 2%) increase of the nuclear intensity combined with a slight
shift in peak position. If the system is assumed to return to a
monoclinic symmetry in the SF-phase again, the reverse process should
occur near H18
. If the shifts are only small, the effect on the re
corded (103/2) intensities can remain bidden in the experimental
scatter, as much shorter counting times were used than for the study
of the (OOJ) reflection. This explanation is speculative and the line
of reasoning is heavily based on the assumption that the magnetic
moment rotation and the crystallographic distartion are directly
related.
It appears to be very probable that in CB48 a subtle equilibrium
exists between a weak magnetic anisotropy in the Sy-plane and an
easily distorted crystallographic structure. The crystallographic
instability of CB48 might be expected from the proximity of the
monoclinic-triclinic phase transition at x~ 0.55 for low T (Fig.4.2.),
which we discussed to some extent in section 4.2. Apparently the
intermediate phase in CB48 and the triclinic phase of CBx for x > 0.55
are closely related. m1ereas in CB48 a rotation of appears to
induce crystallographic changes, the reverse process occurs in CBx for ·• x> 0.55, where in zero-field M
8t gradually rotates as a function of
x (see Fig. 4.4.), due to an increasing triclinic distortien of the
crystallographic unit cell 115,161. Recently, calculations were re-
ported on a cubic with externally applied stress I 171,
which yield results completely comparable with our observations in
CB48.
From the similarity of the magnetic ordering in the I-phase of CB48
and in the triclinic phase of CBx in zero-field, one might imagine that
these systems are part of the same phase in a (three-dimensional)
xHT-diagram, To verify this assertion and to study how in CBx the
behaviour changes from bicritical (at x=O) into tetracritical (at
x=0.48), it would be interesting todetermine the HT-phase diagrams

- 135
of a series of samples with varying x. Such an experimental determi
nation of the entire xHT-diagram of CBx can provide deeper insight
in the relations between different kinds of critical and multi
critical behaviour I tal.
Summarizing the results of the present experiment one may conclude
that at least strong evidence is found for the existence of an 1-phase
in CB48. To our knowledge, this would be the first time that an inter
mediate phase with coupled order parameters is observed in an anti
ferromagnetic system. This coupling is probably due to magneto-elastic
coupling. A further investigation of criticality near the intermediate
phase boundaries RIA (T) and H18 (T), near the paramagnetic phase
boundaries T;Y(H) and T_L(H) and close to the corresponding tetracritical c c
point, would be straightforward. However, the determination of rlf (H,T) st would be time consuming if the same instrumental geometry is used as
in the present experiment. In conclusion it can be stated that this
neutron-scattering experiment on CB48 in a parallel magnetic field in
dicates, that in the series of spin-flop systems CBx with varying x
a large variety of magnetic phase diagrams may be expected.

136
5.7.
Magneto-elastic coupling exists to some extent in any magnetic system,
as aresult of the fact that various magnetic interactions, for in
stance exchange interactions, spin-orbit coupling and dipole-dipole
interactions depend on the interionic di stances 119!. In addition to
shifts in the ionic coordinates within each unit cell, so-called
"internal" magnetostrictive coupling, also a change in the macros
copie crystal dimensions, i.e. "external" magnetostriction and a
modified crystal symmetry may result. This phenomenon probably takes
place near the critical fields and , observed in GB48 (Fig.5.7.).
In this appendix we shall not discuss this observation in GB48. Here,
we merely show how a coupling term of the farmS~ S~in the Hamiltonian
can originate from magneto-elastic coupling.
The treatment of magnetostriction and internal strain in an antiferro
magnet is taken to follow simllar lines as the corresponding treat
ment in ferromagnetic materials, but with the contribution from each
sublattice to the magneto-elastic energy being additively cornbined
12o1. For each sublattice we can write down the usual expression for
the energy density
E E + E e~ m.e
(AS. 1)
where is the energy density due to internal strain and Em.e is
the magneto-elastic coupling term. ln the classica! static theory of
magnetostriction, the sublattice magnetization is coupled to the
uniform macroscopie strain by terms in E, invalving polynomials in
the strains multiplied by polynomials in the direction cosines of the
(sublattice) magnetization. We shall follow a similar, but quantum
mechanical procedure, taken from Gallen and Gallen 119,20 I, in which
the spin and elastic modes are coupled in the Hamiltonian· rather than
in the free energy.
After 1191 the purely elastic term in the Hamiltonian can be written
as

c ]N
- 137 -
(A5.2)
where the standard strain components s~ are presented in Table 5.3.
c are elastic constants. The lowest-order contributions to the ~\)
magneto-elastic coupling term ?m.e are linear in the strain compo-
nents and of zero and second degree in the spin components. Terros
linear in the spin components can be excluded, since they are not
symmetrie under time reversal. For our purpose it is sufficient to
consider only one sublattice and to confine ourselves to the one-ion
magneto-elastic coupling. Then Km.e takes the form
Here
e
5. 3.
~
2
3
4
and
s ~
(A5.3)
functions in the eZastic and
enerqtf terms, taken fl'om j19j
represent the six basis functions for the spin components,
collected in Table 5.3., and B are the one-ion magneto-elastic ~\)
coupling constants. In the spin basis functions products like
- S S] iS2
are absent, since they are of first rather than y x
second degree.
Both terros (A5.2) and (A5.3) can be added to the familiar magnetic
Hami ltonian, consis ting of an anisotrop:ic exchange coupling term and
a Zeeman term, for instance. In a MF-type of approach we can find

- 138
the ground-state energy through an initial minimization of the ex-
pectation value of ~with respect to the strain components This
corresponds to the more familiar procedure of a minimization of (A5. I)
with respect to the macroscopie strains 121 I. Without going into
details it can be seen that the expressions for the equilibrium strains,
resulting from
E: )1
I c)lv V
s + I V
V
B <o > )lV V
0 (A5. 4)
will be linear combinations of the various <ov>. With these expressions
substituted, ~R, and ~.e will consist of terms of the form < crv>'
which represent a coupling between the order parameters of the AF-phase
and the SF-phase, indeed.
References to thapter V
/1 I H. Forstat, J.N. McElearney and P.T. Bailey, Phys. Lett. 27A, 70
(1968).
121 J.W. Metselaar and D. de Klerk, Physica 65, 208 (1973).
/3/ R. B. Griffi tbs, in "cri ti cal Phenomena in Alloys, Magnets and
Superconductors", eds. R.E. Mills, E. Aseher and R.I. Jaffee,
(NcGraw-Hill, New York, 1971) and Phys. Rev. Lett. 24, 1479 (1970).
/4/ J.P.A.M. Hijmans, Q.A.G. van VIimmeren and W.J.N. de Jonge,
Phys. Rev. ~. 3859 (1975).
15/ A.L.M. Bongaarts and W.J.H. de Jonge, Phys. Rev. Bl 3434 (1977),
A.F.G. Wyatt, J. Phys. C_!_, 684 (1968).
A.R. King and D. Paquette, Phys. Rev. Lett. 30, 662 (1973).
H. Rohrer and H. Thomas, J. Appl. Phys. l 025 (1969).
J.A.J. Basten, E. Frikkee and W.J.M. de Jonge, J. de Phys. (Paris),
12_, C6-819 (1978).
! 9/ Olga P. van Wier, Tineke van Peski -l'inbergen and C .J. Gorter,
Physica ~. 116 (1959). N. Yamashita, J. Phys. Soc. Jpn. ~. 610
( 1972).
/10/ K. Kopinga, P.W.H. Borm and W.J.M. de Jonge, Phys. Rev. ~!_Q_,
4690 (1974). It must be noted that the J1
of Kopinga et al.
corresponds to !A in our notation.

- 139
A.D. Bruce and A. Aharony, Phys. Rev. ~' 478 &1975).
M.E. Fisher, Phys. Rev. Lett. 1634 (1975).
See for instance, M.E. Fisher, AIP 24, 273 (1975).
W.J.M. de Jonge, private communication.
J.A.J. Basten and A.L.~. Bongaarts, Phys. Rev. B14, 2119 (1976),
J.P.A.H. Hijmans, W.J.M. de Jonge, P. van der Leeden .and
~.J. Steenland, Physica 76 (1973).
!171 T.J. Fairclough, J. Phys. Cl! 1899 (1978).
IIBI Such a study has been performed on the system K2Mnl-xFexF'+,
L. Bevaart, E. Frikkee and L.J. de Jongh, Solid State Commun.
1031 (1978), L. Bevaart, Ph. D. Thesis (Leiden, 1978), EeN
report ECN-45.
II9! E. Gallen and H.B. Gallen, Phys. Rev • ..!32_, 578 (1963), I A455
(1965).
!201 E. Gallen, J. Appl. Phys. 39, 519 (1968).
1211 J. Smit and H.P.J. Wijn in "Ferrites" (Philips Teehuical Library,
Eindhoven, 1959).

- 140 -

- 141 -
CHAPTER VI
EXPERTMENTAL STUDY OF BICRITICAL BEHAVIOUR IN CsMnBr3·2D20
6. 1. Introduetion
CsMnBr3•2DzO (CMB) belongs to a series of compounds AMB 3·2aq with
A Cs, Rb; M Fe, Co, Mn; B Cl, Br and aq ; H20, D20, which are
interesting on account of their pseudo one-dimensional (d;1) charac
teristics and the variety of their magnetic phase diagrams. The
strongly anisotropic,metamagnetic compound CsCoC1 3•2D20(CCC) has been
the subject of detailed studies in order to gather evidence about the
sealing properties and the universality of tricritical and critical
behaviour j1 j. The nature of the interactions in RbFeCl3•2H20 and
CsFeCl3·2H20 seems to be even more pronounced Ising-like than in CCC.
In these Fe-compounds resonances of large spin clusters can be ob
served j2j and their magnetic phase diagrams contain a ferrimagnetic
ph as e j3j. Like CCC, these Fe-compounds are isomorphous j4' with the
well known CsMnCl3•ZH20 (CMC).
CMC has been the subject of a large number of experimental investi
gations to abserve the properties of the pseudo d=l Heisenberg system
j5!. Neutron scattering experiments on CMC gave for the first time
conclusive evidence for the existence of an antiferromagnetic chain
structure j6j. As a consequence of the nearly perfect Heisenberg
character, CMC displays a spin-flop transition at a rather low parallel
magnetic field HSF(T=O) :(; 17 kOe j7j. The bicritical point has been
localized at Tb= 4.36 K, Hb = 20.55 kOe js1. From X-ray and NMR
measurementsit was concluded that the crystallographic structures of
CMB and CMC are isomorphous j9j and are described by the orthorhombic
spaeegreup Pcca 1 JOj. Although both compounds have very similar mag
netic phase diagrams I lij, the symmetry in the ordered phase appears
to be different. The magnetic spaeegreup of CMB is Pc'c'a', which im
plies that the magnetic and crystallographic unit cell are the same
j9j. In CMC the magnetic unit cell has a doubled b-axis, the spaee
greup is P2bc'ca' j12j. In both systems the easy axis coincides with

142
the crystallographic b-axis. Here we shall give a report of the re
sults of a neutron scattering study on the magnetic phase transitions
in deuterated CMB in a parallel magnetic field. Specifically we shall
focus on the behaviour close to the bicritical point.
For this experiment CMB, rather than the better known CMC was chosen,
on account of experimental restrictions, Because of the value of the
bicritical field ~' the experiment had to be performed within a
cryomagnetic system, in which a vertical magnetic field is combined
with a horizontal scattering plane geometry. In contradistinction
to CMB, CMC does not have magnetic reflections in the ac-plane, which
is horizontal when H is applied along the easy axis.
Section 2 contains details about the crystallographic and magnetic
structure of deuterated CMB, verified in a neutron powder diffraction
experiment. Section 3 contains experimental details. In section 4 the
neutron scattering measurements on a single crystal of CMB in a (nearly)
parallel magnetic field are presented. A detailed analysis of the
phase diagram is given in sections 5 and 6. In the next two sections
we compare the experimental data with the predictions of the extended
sealing theory on bicritical behaviour. Finally, the results are dis
cussed in section 9.
In order to verify the conclusions of SwÜste et al. 191 on the
crystallographic and magnetic structure of CMB, a neutron powder
diffraction experiment was performed. The sample consisted of approxi
mately 30 g powdered CsMnBr3•2D20 from the same batch as the sample
that we used- in the single-crystal experiment.
Neutron diffraction patterns in the range 0.02 < sin8/À ~ 0.36 g-l were recorded at 300 K and 1.2 K. The observed and calculated profiles
were compared in Rietveld's profile refinement program liJ!. In this
analysis the scattering lengths were taken as 0.541 (Cs), -0.387 (Mn),
0.679 (Br), 0.667 (D), -0.374 (H) and 0.580 (0) in units of Jo- 12 cm. 2+
The Watson and Freeman 1141 formfactor of Mn was used and the
structural parameters of CsCoCl3•2DzO servedas starting values of

143 -
"' the atomie positions. The deuterium fraction x of the sample could be
obtained from a refinement of the effective scattering length at the
deuterium positions.
In the analysis of the diffraction pattem at 300 K the expected Pcca
structure was readily confirmed. The final parameter values at room
temperature did not differ much from the values at 1.2 K, which are
given in Table 6. I. The unit cell contains four formula units. Part
Table 6. . Struetui'al a:nd pai'amete:rs of deutemted CMB at
at om
Cs
Mn
Br1
Bril
0
a =
b =
c
1. 2 K. crnJstaUographic a:nd spacegroups a:re
Pcca and Pc'c'a',
based on statistics only, a:re given within par>entheses in
units of the last deeimal:
x y z
l 0 0.1441(21) 4
0 0.4644(29) l 4
! I 0.1491 (18) ~
0.0931 (8) 0.2122(8) 0. 3922 (9)
0.0652(18) 0. 6809 ( 18) 0. 3632 (JO)
o. 0285(15) 0.6912(20) 0.4411(13)
0. 1633(15) 0.6918(19) 0. 3790(16)
9.4527(9) î JJa 0
7.4267(6) R jJb = 3.99(6) JJB 1 I . 864 2 (13) R ~'c = 0
:il:'= 0.824(11)
of the structure is shown in Fig. 6.1. Like in the isomorphs, the
structure of CMB consists of cis-octahedra which are coupled along the
a-axis by a shared bromine ion. The resulting chains are separated
from each other by layers of Cs-ions in the b-direction and by
hydrogen (deuterium) bonds along the c-direction.

.,. 144 -
Fig. 6.1. Schematia 1'8P1'esentation of the
struature of CsMnBr3•2DzO (CMBj.
and deuterium honds is shown.
chain-
of deuteriums
In the diagram at 1.2 K additional intensity, attributed to magnetic
order, is observed to be concentraeed mainly at the same scattering
angles where the nuclear Bragg reflections occur. This is what one
would expect if the magnetic unit cell is not doubled >vith respect to
the crystallographic cell. The magnetic contributions to the reflec-
tions with h i = odd are the most obvious. No special extinction
conditions exist in the various magnetic subgroups of the Pcca
structure. However, due to the particular positions of the Mn2+-ions
in the unitcellat R:. =co, ~-a, 0, co, ~+6, n. CL l+o, 0 and J
with a small o 0.036, there are approximative extinction
conditions for the magnetic reflections. This readily can be derived
from the magnetic structure factor in the magnetic Bragg-scattering
cross section
( 6. 1 )

- 145 -
(6. I) is a slightly different notation for eq. (2.19). < \l· > is the ~ J
magnetic moment at site R. and a refers to the principal axes of the J
x-tensor, which in an orthorhombic system coincide with the crystallo-
graphic axes. From the nearly-extinction conditions it can be con-
cluded that the presence of strong h odd reflections indicates
an antiferromagnetic coupling of the magnetic moments, bath along the
a-axis and along the c-axis, which corresponds to the predicted
magnetic spaeegreup Pc'c'a' indeed [9:. The resulting array of magnetic
moments, which in the AF-phase are directed along the b-axis, is shown
in Fig. 6.2.
Fig. 6.2.
The a:r:ray of o:rde:red
moments in CMB in
8 the AF-phase ( spac:eg:roup
Pc 'c 'a').
In a magnetic field along the b-axis CHB undergoes a spin-flop
transition (RSF ~ 21 kOe at T = 0), where the magnet ie marnEmts jump
approximately to the intermediate c-axis [15[. The weakly anisatrapie
character of CHB can also be derived from susceptibility and magneti-
zation rneasurements, which yield forT 0 an anisotropy field
BA Rb - = 770 Oe and an exchange field Rex ~ 273 kOe, i.e.
RA/R ~ 2.8~Jo-3. Dipale-field calculations give R -R = 756 Oe and ex " b c = 2166 Oe, which indicates that the anisotropy is rnainly due
to dipale-dipale interaction jJ5j. The low-dimensional behaviour of
CMB can, for instance, be derived from specific-heat measurements [ 16[.
The ternperature dependenee of the magnetic heat capacity is very well

- 146
approximated by the theoretical estimate for an S 5 /z Heisenberg
linear chain systern with an intrachain exchange interaction J/~ =
- 2.6 K (Fig. 6.3.). An estirnate of the interchain interaction J' can
10
"" ö E 8 ~
... 6
" .t:
~ u 4 " a. .. . ~ ~ c
"' .. E
• f I
10 20 30 T(K)
theoretic:al estîmate
with Jjkm -2.6K
40
6.3. Magnetic heat
pond to the data corrected for the Zattice contribution. 'The
error bars the uncertainty in the data.
The drQJ,Jn curve denotes the theoreticaZ estimate for an
s:::, 5h The anomaZy
Zinear chain system with
2.8 Kis due toa smaZZ
Cs 2MnBr4 • 2H zO (taken from I IBI ) .
2.6 K.
of
be obtained, when this J-value and the observed Néel temperature of
hydrated CMB, TN = 5.75 K, are inserted in arelation proposed by
Oguchi 1171. This yields a ratio IJ'/JI = 1.4 * l 1161, which de
fines CMB as a fairly good pseudo one-dirnensional system.
6.3. Sample and apparatus
Large single crystals of CsMnBr3•2D20 were grown by evaporation of a
saturated salution of MnBrz and CsBr in a molar ratio of approximately
6:1 in DzO at room temperature. The sample was shaped to an approxi
mately disk-like ellipsoid with dirnensions 15 x 15 x 4 mrn3, in order

- 147 -
to minimize inhomogeneities in the internal field due to demagneti
zation effects. Since the sample had to be mounted in the inner vacuum
chamber (IVC) of the cryostat, it was placed in a sealed gas-filled
capper capsule to prevent dehydration.
The experiments were performed on a conventional double-axis diffracto
meter at the Petten HFR reactor. The neutron wavelengthof 1.473 R was
obtained from a Zn (002) monochromator. Seller slits with a horizontal
divergence of 30' were placed befere the monochromator and in front
of the 3He-detector. Vertical collimation was defined by 60' seller
slits between monochromator and sample and in front of the detector.
We used an Oxford Instruments cryostat with a superconducting magnet,
which can produce a vertical magnetic field up to 50 kOe. The homo
geneity of the field is better than 0.1% over a 15 mm diameter
spherical volume. In the field scans of the present experiment the
magnetic field was increased in steps of about 60 Oe. Like the dif
fractometer settings also the adjustment of the field was controlled
by a P 9205 on-line computer.
The sample was pre-oriented in the sample holder in order to achieve.
an accurate alignment of the easy b-axis along the vertical field
direction after mounting. To this purpose the intensities of several
nuclear reflections in the reciprocal a*c*-plane were optimized in
presence of a 30' vertical collimation. After mounting of the sample
holder on the extension of the 1 K chamber of the cryostat, no final
adjustments could be made. From the required canting angle of the
cryomagnetic system (+ sample) out of the vertical position in order
to realize a horizontal orientation of the a*c*-plane, the mismatch
betweenHand the easy axis was estimated as 0.3 ± 0.3° both in the
bc- and ln the ab-plane.
Temperature control was achieved by balancing the cooling effect of
the 4.2 K bath and a constant current supply to a heating resistor.
To obtain temperatures below 4.2 K the pressure in the 1 K chamber
was reduced. The heat contact between the sample holder and the 4.2 K
bath was improved by admitting a few cm 3 He contact gas in the IVC,
which separates both systems. In this way a short-term temperature
stability better than 1 mK was obtained near the bicritical temperature

- 148 -
Tb~ 5.25 K, with a max1mum drift of 5 mK over a day. To obtain
temperatures above 10 K the IVC was evacuated and a commercial
temperature controller could be used.
A calibrated Ge-resistor was used for the temperature registration 1n
zero field. This thermometer was placed on the same block to which the
sample holder was attached. In order to realize a reliable temperature
registration also in presence of a magnetic field, the magneto
resistance of the Ge-resistor was measured in steps of 1 kOe at several
(better than 1 mK) constant temperature values. By interpolation with
a 5th degree polynominal a complete (H,T) calibration network '"as
obtained.
6.4. Short-range and long-range order
In the a*c*-reciprocal lattice plane, to which our experiments were
confined, the magnetic and nuclear Bragg reflections do not coincide.
Using the transformation properties of Pc'c'a' it can be derived from
(6. 1) that the only nonzero magnetic Bragg reflections in the a*c*
plane occur for h = i = 2n+1 with intensities
IhOi cr lf(Q):2 L (1 - Q~)(M~t)2, a a, b, c. (6. 2) a
According to the crystallographic spacegroup Pcca, nuclear reflections
occur at the reciprocal lattice points with i= 2n (see Fig. 6.4.).
c
I 103
1 ~1~3 "'y 101 301
a•
Fig. 6. 4.
The a*c*-plane of the reciprocal lattice.
Magnetic and nuclear reflections are in
dicated by fi Ued and open circles, res
pectively. 8 is the angle between Q and
the intermediate (c) axis.
In an applied magnetic field the induced homogeneaus magnetization M
will also contribute slightly to these nuclear reflections.

- 149 -
The magnetic scattering will be concentrated in magnetic Bragg re
flections, only if complete d=3 magnetic long-range order is esta
blished in the system. For T >> TN (~ 6.3 K) the magnetic correlations
along the chain direction will be dominant, which leads to magnetic
critical scattering concentrated in planes perpendicular to the a
axis. This effect was observed indeed and is illustrated in Fig. 6.5.
Fig.
18 (T 0 0.85)
(a)
0
16 *
_....._
2 . . ... ï: :::l
3.0 3.4 2.6 2.8 T >-
~ lilt . 45 K
1·3 (b) .... • 28 K :ö l=2
12.90 K ~20 t-1
0
* 8.60 K >- h"J h=3 a• ~ 6.756K .... ïii " secend order c ~ 18 (3 0 T) peak .E;
*0 ~
16 0
~·
*~ * 0 • 0 • • 0 • • • • • • •
14. • • 0.6 0.8 1.0 1.2 1.4 T
6.5. Typical critical-scattering profilesforT > TN ~ 6.3 K,
observed near the (301) reciprocal lattice point in scans
perpendicular (a) and parallel (b) to the plane h~3.
For a few temperature values the intensity profile is shown, observed
along a path perpendicular to the h=3 plane at 9, = 0.85 (Fig. 6.5a)
and along a path within the h=3 plane (Fig. 6.5b). At the reciprocal
lattice point (301) asecondorder nuclear peak is present. At 12.9 K

- 150 -
a uniform increase of the intensity with respect to the background at
28 K is observed along the entire (30T) line, whereas the intensity
in the perpendicular direction is obviously concentrated around h=3.
This indicates that the fluctuations are strongly correlated along the
a-axis, whereas the chains are very weakly coupled along the c-axis.
It has not been verified explicitly that also the coupling along the
b-direction is negligible.
The dataforT = 8.6 K (Fig. 6.5b) show an apparent concentration of
the intensity ~n the h=3 plane into a scattering peak around the
lattice point i= 1. So, the interchain coupling J' exerts its in
fluence already at T/TN% 2. This same value of 2 TN has been reported
by Skalyo et al.for CMC 161, where IJ'/JI = 8 x 10- 3 1161, which is
not very different from the CMB-value. The influence of J' increases
as the number of correlated spins in the chains increases and TN is
approached. In Fig. 6.5. it is clear that both the interlayer and the
intralayer correlation lengths grow below 13 K. In the present ex
periment rather complete sets of critical scattering data near the
(103) and (301) reflections have been recorded as a function of both
temperature and magnetic field.
In the remainder of this chapter we shall focus on the magnetic Bragg
scattering, which occurs if the system is ordered in all three di
mensions. Both in the AF-phase and in the SF-phase, the variations in
peak intensity of three magnetic Bragg reflections, viz. (103), (101)
and (301), have been recorded mainly in field scans at constant
temperature. From these intensities the (H,T) variation of the order
parameters in both phases can be obtained. As can be seen from eq.
(6.2), the intensity of a magnetic Bragg-reflection (hOi) in the
a*c*-plane may be written as
Ihüi (H, T)
Here M~t is the component of Mst along the easy b-axis, i.e. the
order parameter of the AF-phase, and Ms~ is the component of Mst
(6. 3)

151 -
along the intermedîate c-axis, i.e. the order parameter of the SF-phase.
We assumed M:t(H,T) along the hard a-axîs to be zero. In (6.3) is
the angle between the scattering vector Qhüt and the c-axis (see Fig.
6.4.). The scale factor Cht depends on many quantities, such as the
magnetic formfactor, the instrumental resolution and the illumination
factor of the sample in a specific scattering geometry. In addition to
the magnetic intensity (6.3) the observed peak intensities will con
tain also a non-magnetic contribution Bht' which consists of back
ground and secoud-order nuclear scattering.
It is not very probiernatie to obtain M;t or M;~ from any reflection
with a sufficiently high magnetic intensity, if the whole sample is
either in the AF-phase (with M~ = 0) or in the SF-phase (with M~t 0).
However, if the sample is divided in dornains, so that AF- and SF-
order coexist, or if M has a direction somewhere between the b-axis st and the c-axis, the separation of Mft and is not completely
straightforward. This situation is encountered for instanee near the
spin-flop transition. Then we have to determine MU and M~t separately st s
by camparing the intensities of two or more magnetic reflections.
Eq. (6.3) indicates that this determination is possible, if for each
reflection Cht' eht and the non-magnetic contribution Bh.Q, are known.
With the calculated from the crystal structure data, the constauts
and Bht' which in the ideal case are independent of HandT, can
be abtairred from the intensities observed within the AF- and SF
phases. The employed procedures to determine these constauts and to
obtain statistically justified estimates for Mft (H,T) and H~t (H,T) is
described in Appendix 6.10.
Some typical peak-intensity variations, observed in field scans close
to the spin-flop transition at various T-values, are shown in Fig. 6.6a.
The data have been corrected for the non-magnetic contributions
and the scale factors Cht have been eliminated to achieve that all
three curves coincide in the AF-phase. Details of the data collapsing
are shown in Fig. 6. 7. and discussed in Appendix 6. 10. The fact that
the same set of constauts (Bht' Ch.Q,) could be used for all temperatures,
indicates that extinction can be neglected. The scaled intensities in
the SF-phase are found to be proportional to the corresponding

40~LC· 30
b ;:nèf'P 20
10
10
20 25 30
(a) H (kOe)
- 152 -
20 25 30
(b) H (kOe)
Fig. 6. 6.
intensities of three
magnetic Bragg
tions for
Triangles (103),
squares (101) and
T.
circles (301). a
small fraction of the d2ta in each scan is shcr";n. Details of the
data collapsing in the boxed regions are shown in Fig. 6. 7. 11, _L, •
(b) The resulting field dependences of (M8t)L and (M
8t)L, obta&ned
f1'0m the th1'ee cur'Ves on the left, are indicated by open and
closed circles, respectively.
, which shows that the c-axis is the intermediate axis indeed.
The results for the corresponding field variations of (Mb ) 2 and (MJLt) 2 st s
separately are shown in Fig. 6.6b. In many calculational programs in
the further analyses, such separated M# and MJL results have been st st used as input data.
6.5. The spin-flop transition (T <Tb)
Although the observed change in the orientation of~ at T = 3.736 K st
seems to be a rather rapid one in Fig. 6.6b., it is nota first-order
transition. This is better visible on the enlarged field scale in
Fig. 6. 8., where the rounding in [M:t (H)j 2. and [M* (H)] 2 is obvious,

- 153
and can be concluded also from a simple calculation of the maximum
field range in which te first-order spin-flop transition in CMB
might occur. Taking the XJLvalue reported for hydrated CMB IJS! and
40r---~---.---. ..... ••
•• 0 •
Fig. 6. 8.
3.736K eo The change in orientation of M8
t at
10 • 0 T = 3.?36 K, shoum on an
H (kOe)
scale. Values for
( J... )2 • ". d " M8
t are -z.na-z.cate by
,,,;; •2 ' !rlstJ ana
open and
cZosed circles,
applying the maximum demagnetization factor N (=4n) one arrives in MF
approximation at
!lH ma x 4n % 34 Oe, (6.4)
- 154 -
-+ However, the reorientation of Mst clearly extends over more than 500 Oe.
The 0.1% field inhomogeneity can account for only ~ 25 Oe. Indeed, as
we have seen insection 3.5., the first-order character of the spin
flop transition can only be observed if the mismatch angle w between
Îl and the easy axis does nat exceed the critical angle I ï8l (cf.eq. (3.65))
0.08° . (6. 5)
Moreover, at T = 3. 7 K ~ 0. 7 Tb the critical angle will be reduced
already to about 0.02° (cf, eq. (3.66)), whereas the mismatch in the
present experiment has been estimated as w ~ 0.3° ± 0.3°.
Since w >> yc(T) for all our data, the MF-expression I 191
Sln 2y tg c2~; + 2w) (6. 6)
which was introduced in chapter III as eq, (3.67), should give a good -+
description of the rotation of Mst with increasing H. For a few values
of w the field dependenee of
(6. 7)
is shown ln Fig. 6.9. In order to verify the MF-prediction for our
data, first the field dependenee of M~t(H), which is nat predicted by
(6.6), has to be constructed from the observed data
1Mj' H ] 2 + 1Mj_ (Hl 2 L'st()obs L'st )_jobs (6. 8)
Subsequently, the theoretical predictions for the separate components
MI/ (H) and M..L (H) can be calculated as st st
MI! (H) st
j_ Mst (H)
Mst(H) cos (6. 9)
( 6. 1 0)
with ç determined by (6.6). Same typical results are shown ln Fig. 6. 10.,

- 155 -
Fig. 6.9.
l>JF-pr·ediction for the
rotation of Mst with in
creasing H for several
values of the misalignment
angle ~· The angle ç is
determined by eq. (6. 6).
(MI/ ) 2 and (Mj_ ) 2 are proportional to cos 2 ç and 1-cos 2 ç, respectively. st st
from which one may conclude that over the whole investigated temperature
range the observed rotation of Mst is excellently described by the
HF-prediction with ~ ~ 0. 5°.
H(kOe)
Fig. 6.10. Comparison of the observed and calculated rotation of Mst at
several temperature values. The solid lines represent the
MF-prediction of (Mft) 2 and (M;;) 2 for ~ = 0. 5°. The
variation in M~t is shown by the dash-dotted line.

- 156 -
The intersection of the curves for (M// ) 2 and (Mj_) 2 occurs at st st
H. 1. s.
(6. 11)
Sirree the difference between H. and HSF is negligible for ~; 0.5°, LS.
these points of intersection provide an accurate determination of the
spin-flop field HSF(T). The spin-flop line, abtairred in this way, is
shown in Fig. 6. 16., tagether with the results for the other phase
boundaries.
The theoretical curves in Fig. 6.9. also provide an easy way to correct
the data for the rounding effects due to the misalignment. Sirree the
curve for (M~ ) 2 approaches the stepfunction closer as ~ decreases, st
one can take
and
0
j_ (M )2
st
(M_L) 2 st
0
for H > HSF (6. 12)
as the result for ~ ; 0. If the data would be gathered with an exact -+
alignffient of H along the easy axis, such a discontinuous behaviour of
/1 _L d b d . 6 Mst and Mst woul have been o serve . F1g. . 11. shows the temperature
dependenee of M~t(H;HSF)' which can be described fairly well by a
single-power law with Tc; 5.275(9) Kandan exponent 2S; 0.58(2).
We shall return to this result in section 6. 7.
OL---~--~----~~~ 4.0 5.0 T(K)
6.11.
Temperature variation of
H = Hs/T).

- 157 -
For a few temperature values also the field variatien of the nuclear
(200) reflection has been recorded, mainly close to the "spin-flop"
transition in order to abserve the intensity increase caused by the
induced homogeneaus magnetization M. A calculation, similar to the
one in (6.2) shows that this magnetic contribution is quadratic in M.
Although the (200) nuclear reflection is very weak, the magnetic con
tribution is still a very small fraction of the total intensity (see
Fig. 6. 12.). The expected jump in the magnetization at the spin-flop
transition is well resolved at T = 3. 75 K, but for each point in
Fig. 6. 12. a counting time of 100 minutes was required to get
0 0
2.9 0 0 •
~ 3.75 K ï~ 0 ~ ~ !) Fig. 6.12. ~ ~ 0 u
Jwrrp in the intensity of the nuclear -~ ~
0 0 0 0 (200) reflection at the spin-flop -:::-
0 transition for T = 3.75 K due to 0 2.8 ~
>
the con tribution of the homogeneaus 22 24 26 magnetization M. H(kOe)
sufficient statistical accuracy. Therefore, it would have been too
time-consuming to undertake extensive measurements of the temperature
variatien of this jump. Finally we show in Fig. 6. 13. the square root
of the magnetic contribution to the (200) intensity at T = 3. 75 K, as
a function of H. According to MF-theory M should be proportional to H
in the SF-phase, which appears to be the case indeed.
~
2! 3 ï: :::l
> ~ 2 :ë ~ ~
/
0
3.75 K
/
/ /
•
20 40 H(kOe)
Fig. 6.13.
Field dependenee of the homogeneaus
magnetization at T = 3. 75 K.

- 158 -
6.6. The paramagnetic phase boundaries (T >ToL
For field scans at a temperature sufficiently far above the bicritical
temperature Tb' one does not need the involved separation procedure of 11 j_
Mst and Mst" As can be seen in Fig. 6.6b., even at T = 5.299 K, which
appears to be fairly close to Tb~ 5.25 K, the AF- and SF-ordering
occurs in well-separated (H,T) regions, with a disordered paramagnetic
phase in between. The intensities of the magnetic reflections then are
simply proportional to either (M~t) 2 or (M~) 2 and can be used directly
to determine the phase boundaries of the ordered phases. To determine
the location of these lines of critical points T~(H) and T~(H), we c c
performed least-squares fits of the power laws
(6. 13)
to the data. Here t = I T/T//,_L(H)-1 I and t = I H/i1•j_(T )-1 I in tempera-c c
ture and field scans, respectively. In the fits B, S and He or Tc were
variable. As equal counting times were used for the three reflections,
the intensity of the (103) reflection appeared to weak in the SF
phase, to yield reliable results. No corrections have been applied for
possible critical scattering contributions. Instead, in the analysis
of the data with tmin S t S tmax' the lower cutoff tmin has been
varied between 10- 3 and 5*10- 3 , which appeared to have little effect
on the resulting parameters. This indicates that corrections due to
critical scattering may be neglected in the present rough fits. Since
the inhomogeneity of the magnetic field is ~ 0. 1%, data with t < 10- 3
have been omitted.
Fig. 6. 14. shows some typical log(I) - log(t) results for peak intensi
ties in both the AF-phase and the SF-phase, recorded in field scans at
constant temperature. It appears that the intensities approximately
follow a single-power law over a wide field range. Because of the
large number of field scans which were taken, also the number of re
sulting S-values is rather large. Fig. 6. 15. gives the results for S
from fits of (6. 13) to the data with 10- 3 < t < 10- 1 and presented as
a function of the resulting t = T (H)/T -1. A statistical analysis c c b
of the data, which show no systematic variation along the phase

-2 10
SF - phase T = 5.307 K He= 27. 26 kOe
- 159 -
AF- phase T = 5.593 K He= 22.95 kOe
-1 10
0 (1 01) 0 (301) Á ( 1 03)
t
Fig. 6.14. Typical double-logarithmic plot of the intensity variations
of magnetic Bragg peaks, observed in field scans at constant
T. Solid lines indicate the power-law behaviour (6.13)
with an exponent 2S = 0.650.
boundaries, yields the average values 7; 0.321(6) and SJL= 0.326(7).
Both values are in good agreement with the theoretical predictions for
the d=3 Ising model, viz. S = 0.325(1) from s-expansions [20[ and B =
0.312(5) from series expansions [21[ ,and show no systematic differences.
From this it may be concluded that in spite of the Heisenberg-like
character of CMB at high temperature, the critical behaviour close to
T~ and Tj_is Ising-like. Apparently the weak anisotropy is sufficient c c
to break the n=3 symmetry.
An analysis of the influence of a variatien in the upper cutoff tmax
indicates a slight but systematic decrease in S with increasing tmax
(see Table 6.2.). A possible explanation of this effect is that the
data with high t-values are not within the critical region, and a
crossover region to bicritical behaviour is entered at high t. Since

I
0.35 r-A
6o . • 6
~ A p .6 /". . • h
• . .. ~.: .-,. . " . .
0.30- . I
I
. . A.
• 6
h 6" . ~ .
I
. .
- 160 -
-
~j_
(3;/
-Fig . 6. 15 .
Resulting values for Sff (dots)
and S...L (triangles), presented
as a fuaction of the parameter
te= Tc(H)/Tb-1. Bath para-
meters are obtained from fits of (6.13) to data with 10- 3 < t < lo- 1 •
The arrows indicate the statistical averages S~ and S...L. The solid
lines correspond to theoretical predictions for the d=3 Ising model,
viz. 0.325(1) taken from 1201 and 0.312(5) from 1211.
Table 6.2, S-values as a function of
t 0.03 0. 1 0.3 ma x
B/1 0.34(3) 0.321(6) 0.298(6)
B_L 0.34(3) 0. 326(7) 0.311(7)
the exact location of these crossover regions is unknown in this stage
of the analysis, the determination of S-values from single field
scans or temperature scans must be presented with some reservation. In
previous reports of the present investigation 122,231 we have quoted
the S-values for t max
0. 1 since for t < 0. 1 the changes remain within
the statistical uncertainties, whereas this is not true for t > 0.1.
As we shall see in sectien 6.8. the extended-sealing analysis provides
a more reliable determination of B;; and S...L.
For the present discussion it is much more important that the resulting
values of Hc(T) appear to change hardly with varying tmax The AF-P
and SF-P phase boundaries obtained are shown in Fig. 6. 16. The striking
increase of T~(H) for H > Hb is a characteristic feature of pseudo
d=1 Heisenberg systems I 11,241 and has nothing to do with the predicted
bicritical "umbilicus" 1251, which was discussed in sections 3.4. and 3.5.

50
29
28 40
27
26
~30 25
0 .::J.. -I
20
10
- 161 -
5.2 5.3
SF I p
·~.
"""Y \.\,,\ AF
0~~~~\-4.0 4.5 5.0 5.5 6.0
T(K)
Fig. 6.16. Magnetic phase diagram of CMB. The increase of T~with H
is characteristic for a pseudo d=l Heisenberg system. The
insert shows details near the triple point (Tm, Hm).
In order to determine the shape of the phase boundaries close to the
triple point (Tm,Hm) and in particular to obtain an accurate estimate
of the location of this point, a closer analysis of the data in the
region around (T ,H ) has been performed. For this purpose the se-// m m _L
parated (M8t) 2 and (Mst) 2 data were used, abtairred from field scans at
constant temperature bath for T < T and for T > T . These G'1// (H)] 2 m m st
and rM_L(HJ]2 data have been compared with the power-law behaviour 1,1 st -
(6. 13), with B fixed at 0.32. The resulting values for H~(T) and c
H~(T) are shown in Fig. 6. 17a. In the fits only data with c
0.015 < [H/H (T)-1 [ < 0.1 were taken into account. Apparently the c
phase boundaries interseet each other at Tm% 5.275(10) K. Of course
the results for T < Tm have no physical meaning, but the results for
T > Tm have! To check this statement, the same data were also fitted

- 162 -
to (6. 13) with a variable B. The resulting B-values are shown in
Fig. 6. 17b. It is obvious that the results deviate from S = 0.32 for
H (kOe)
Fig. 6.17.
(a) T (K)
'7
'7 '7
• . .
(b)
5.3 T (K)
(a) Critical field values H#(T) (triangles) and H~(T) (dots), deter-c c
mined from fits of (6.13) with S fixed at 0.32. Separated data of
[Mft(Hf] 2 and LM:t(HJ] 2 for T both above and below Tm were used.
Spin-flop field data are indicated by open circles.
(b) Resulting i3_L (dots) and B;; (triangles) values, from similar fits
of (6.13) to the samedata as in (a), now with 13 variable. From
these results the triple point was located at Tm= 5.275(10) K,
H 26. 55(5) kOe. m
T > Tm, but are well described by this value for T > Tm. In this stage
it must also be noted that M2 (H=Hs ) disappears at the same tempera-st F ture Tm (see Fig. 6.1 1.). From this analysis the common point of the
three phase boundaries can be located rather accurately at
Tm 5.275(10) K, Hm = 26.55(5) kOe. From Fig. 6. 17a. or similarly
from the insert in Fig. 6. 16., it is obvious that the phase boundaries
1,//(H) and T.l..(H) do not come in tangent to the "spin-flop line" at c c
T = T . This is indeed what should be expected if the magnetic field m
is not aligned perfectly along the easy axis.

- !63
6.7. Analysis of the magnetic phase diagra~
Although the overall features of the magnetic phase diagram of CMB
deviate markedly from those for d=3 systems, the critical behaviour
near the phase boundaries must be considered as essentially three
dimensional. As we mentioned in the previous section, the observed
S-values are in good agreement with the d=3 Ising value, which is
theoretically predicted for S;; and in an n;2 spin-flop system 1261.
Consequently, we expect that also the behaviour close to the bicritical
point in CMB will show the regular characteristics of a d=3 n=2
spin-flop system. This implies for instance, that the theoretical
predictions for the shape of the paramagnetic phase boundaries T//(H) c
and T~(H), must also hold in CMB. As these predictions have been dis-c
cussed extensively in chapter III, section 3.4, we shall confine our-
selves here to a recapitulation of the expressions which are relevant
in the present analysis.
According to the extended-sealing theory 125,261, the shape of the
AF-P and SF-P phase boundaries is described by
+w_L
The optimum sealing axes are given by 1271
'V g 'V g - pt and t t + qg
where
g 2 - Hz and t T/Tb I. H b
'V The g=O axis must be tangent to the spin-flop line at Tb, that is
p
The value of q is not universa!. Starting from mean-field theory
Fisher 1271 obtained the estimate
dT// q(n) c )
dH2 H=O
(6. 14)
(6. 15)
(6. 16)
(6. 17)
(6. 18)

- 164 -
which is expected to be valid for small values of (4-d) = c. So it is
doubtful whether (6.18) also applies to a pseudo d=l system like CHB.
Bq. (6.15) - (6.18) are identical with the expressions (3, 36) - (3. 39)
in chapter III. Although the amplitudes '1; and W_L in (6.14) are not
universal, their ratio is. Fisher 1271 showed that
Q(n) n-1 + (!f(f:) , (6. 19)
Numerical estimates yield 261 Q(3) 'lj 2 .. 51 for d=3, Again it is very
questionable whether this estimate would apply to pseudo d;1 systems,
For n=2 the ratio is exactly determined by syrnmetry as Q(2) = 1,
In the previous section we noted that the phase boundaries r 11 and Tj_ c c
do not approach to the spin-flop line tangentially, in contradistinction
to the theoretical prediction (6.14). This effect must be expected
when the magnetic field is not perfectly aligned along the easy axis,
as has been emphasized by Rohrer 1281. This is illustrated in Fig.
6. 18., where the theoretically predicted shape of the critical surface
for an orthorhombic spin-flop system in the three-dimensional (T,H~ ,Hi)
space is shown. Here Hv and represent the components of the
applied magnetic field along the easy and intermediate axis, respecti
vely. The component along the hard axis (Rh) does not play a role in
the following discussion. Close to the (n=2) bicritical point (Tb,Hb,O)
the n=l critical surface bas an "umbilical" shape 1251. Any sectien of
this surface which contains the bicritical point
to the one expressed by (6. 14) for Tij (H ) and c '11
plane.
has a shape similar
(Hg) in the Hi;Q
If the applied field is slightly misaligned, and therefore a small
nonzero Hi is present, the observed phase diagram will not be repre
sented by the section of the critical surface at Hi=O, but by a sectien
at a small value of Hi. Both sections are indicated in Fig. 6. 18.
Apparently the sectien at finite Hi is rounded at a temperature T = Tm.
This is indeed the shape of the phase diagram observed in ~B. However,
one always can define a pseudo-bicritical point (Tb,Hb,Hi) in such a
way that the shape of the section at finite Hi is well described by
(6. 14) with respect to this pseudo-bicritical point at temperatures

- 165
T,;
critica! ;v
surface
Fig. 6.18.
CY'itical sur;face of an n=2 spin-flop system in , ~/ ,
0t components of H the easy and intermediate
axes, (Compca'e 3.4. and 3.8.). Sections of
this = 0 and nonzero are indicated. For T
of section at nonzero
with respect to the
is rounded at T
is described (6.14)
point section
sufficiently far above Tm. ' will be somewhat higher than However,
when is only small, the differences Tb-Tb will not be large and the
deviation of the observed phase boundaries from the ideal shape (6. 14)
will be localized in a small region close to
In this spirit we may compare our data for T// (H) and T.L (H) obtained c c ,
in a slightly misaligned field, with the theoretical expressions (6.14).
It must be emphasized here, that the above arguments only apply to the
of the phase boundaries. From the analysis in this section we

166 -
shall obtain estimates for the crossover exponent ~ and the location
of the pseudo-bicritical point. We shall not find bicritical exponents
on approaching the critical point Tm' because it is a point of the
Ising surface and therefore will show d=3 Ising characteristics.
In order to obtain Tb,Hb and ~. we have compared the expressions (6. 14)
with our data forT > 5.285 Kin least-squares fits. In the following
we shall distinguish no longer explicitly between Tb and In all
fits the value (dH~F/dT)b = 75.4 kOe2/K, obtained from the slope of
the spin-flop transition line, was used. The ratio wJL/wn was fixed
to unity, because of the very strong correlation with the choice of
the ~=0 axis, i.e. with the value of q.
• 'ft."'S.24K 1.6 o Tt."'5.25K 20
.. T"•5.26K 7 'P o T~"'5,27K 'Ë .
1.4
~ .. . ~
1.2 10$
~ " 1.0 " 30
1)".02 0.05 01 0.2 0.02 0.05 0.1 0.2
rm .. Ïmax
F"~g. 6.19. Fitted valuea of ~ and w!/ = WJL aa a function of ~m= for
several ahoices of Tb. From these results 5.255{5) K
haa been eatimated. For ~ > 0.1 the data deviate
ca~tly from (6.14).
As the range of ~ in which (6. 14) holds is not universal, we have tried
to determine this range in an objective way. The approach is based
on the requirement that all fits in which data with ~ S ~ are taken max into account, must yield the same estimate for any variable, independent
of up to an upper value of ~ • This requirement can only be ma x fulfilled if the correct value of is used. The procedure is
illustrated in Fig. 6. 19., where for several choices of Tb the fitted
values of ~ and wg = wj_ are shown as a function of ~max' The estimates

- 167 -
for q and ~ are not shown, as these hardly vary with
From the results in Fig. 6. 19. we can determine
Tb 5.255(5) K ,
"' and t max
which estimate gives constant parameter values up to 1 % 0. 15. For max
'i! > o. 15 ma x curves show a systematic increase with f , which inmax dicates that systematic deviations of the data from (6. 14) become
significant for i> 0.15.
With Tb fixed at 5.255 K, a least-squares fit to the data with i~ 0.15
gives
26.541(17) kOe, 1.226(9)
q 5.38(10) x 10-s kOe-2 and '1/ w_j_ 7033 (52) kOe2.
If, in addition to Tb' ~ is fixed at the theoretica! predietien
~; 1. 175, the values
26.555(21) kOe, q 5.57(12) x 10-5 kOe-2
and 6226(38) k0e2
result. Bath fitted curves are compared with the data in Fig. 6.20.
Also Fisher's estimate for the E=O axis (6.18) has been included.
Indeed, the observed phase boundaries appear to be well described by
the theoretica! expressions (6.14) with respecttoa pseudo-bicritical
point at 5.255 K. Only a slight rounding effect due to the misalignment
of the field is observed for 5.255 K < T < 5.285 K. The curve fitted
with fixed ~ = 1.175 deviates rapidly from the dataforT t 5.5 K,
whereas the best fitted curve(~= 1.226) starts to deviate at T% 5.8 K.
With the uncertainty in Tb taken into account, we would quote as final
parameter estimates
Tb = 5.255(5) K, 26. 55(2) kOe
(6.20)
1.22(6) and q 5.5(2) x 10-5 koe-2

- 168 -
I
2000 / ''#
//. ' /- SF /
" j_J-- c
;;-- 1500 'I G) 700 ~ 0 p ~ ~
"' J: 1000 5.2
""'-..._...?
500 -o--o- ~
HsF(T) t ! AF
4.0 4.5 5.0
T(K)
Fig. 6. 20. H2 vs T-diagram of the observed phase boundar~es eompared
with best fits of (6.14) in whieh $was variable (solid
Zine) and $ 1.175 (dash-dotted). In these to the
data with < 0.15~ was fixed 5.255 K. The fitted
= 0 axis (soZid) and the (dashed)
t 0 axis (6.18) arealso shown. The insert shows details
near
where it should be emphasized that
bicritical point.
in fact refers to the pseudo-
From this analysis of the phase diagram it may be concluded that also
in the pseudo d=l system CMB the shape of the second-order phase
boundaries near the bicritical point is predicted correctly by extended
sealing theory. The observed $-value is in fair agreement with the
theoretical predietien for an n.=2 system. However, it should be empha
sized that the fitted slope q of the ~;Q axis strongly deviates from
Fisher's estimate (6. 18) (See Fig. 6.20.). Apparently this estimate
is not appropriate for CMB, as might be expected, because the mean
field type of approach used in the determination is probably not
applicable to pseudo d=J systems.

169 -
6.8. Experimental test of the extended-sealing hypothesis
The heart of the theory on bicritical behaviour is the extended
sealing hypothesis 125,261. As we discussed extensively in chapter III,
this hypothesis can be formulated as a generalized homogeneous
function postulate for the free energy
'\; g
(6.21) I I
Eq. (6.21) is a recapitulation of (3.35), where the various quantities
have been defined. In the last few years experimental studies on a
number of spin-flop systems have been undertaken to verify the exten
ded-sealing theory for bicritical points 128-35!. In most cases the
tests were restricted to a cernparisen of the experimentally determined
shape of the paramagnetic phase boundaries with the theoretical pre
dicrions (6.14), similar to the analysis performed in the previous
section. Hitherto a more direct experimental verification of the
sealing functions was lacking. In this section, however, we shall
present an extensive sealing analysis of our data on M:t(H,T) and
(H, T) in CHB. The results of this analysis represent the first
direct test of the central assumption in the theory on bicritical
behaviour, namely of the extended-sealing hypothesis (6.21) itself.
A direct implication of (6.21) is that also the derivatives of G
must be generalized homogeneaus functions. For instance, the order
parameter in the SF-phase should vary as
(6.22)
Similarly, a sealing function obtained for the order parameter
in the AF-phase (cf. sectien 3.4., eq. (3.44)). AF#is nonzero only
for g 0, whereas .LJ... is of interest for g > 0. It must be noticed . . .. ) .. ( d . . 1 1 //) . f that the scal1ng funct1on ~ an s1m1 ar y,K cons1sts o two
l. 0 u _L 0
branches, .I + for t > 0 and .Af'_ for t < 0. The exponent ~\ corresponds
to a purely bicritical behaviour of the order parameters(cf. sectien
3.4.) and is predicted to have the d=3 XY value 12s1. Alternative
sealing functions for M~t and M~t have been defined in (3.43) as

170
(6.23)
and the analogue for M1t• Since sealing functions are expected to be
universa! 136,371, the sealing functions for M# and Mj_ should be st st
identical in an n=2 spin-flop system, The sealing relations (6,22)
and (6.23), and the analogues for M1t• should hold within the entire
neighbourhood of the bicritical point. This can be verified directly
in the present experiment on CMB. Since fi'1 depends on
x (6.24)
and not on g and i separately, (6,22) prediets that our data M# (~g Î) st '
j_ "v ~ • I~ I eb and M8t(g,t), properly scaled w~th a factor B t , must coincide
with the curve (x) for i> 0 and with.K_(x) for i < 0. A similar
data collapsing should occur according to (6.23), when the data
scaled withafactor blgiPb/$, areplottedas a function of
y (6.25)
Both sealing functions Jl and Y can be used equally well in order to
test the data collapsing in CMB. However, the way in which inforrnation
on different kinds of critica! behaviour is contained in J/ and "Jf.~,
is utterly ·dissimilar. In the sealing function '11", data gathered in a
(g,Î)-region close to the spin-flop line are fully displayed in a
wide y-range (y ~- oo), whereas the inforrnation from the (g,Î) region
close to the axis (see Fig. 6.20) is compressed in a small y-
interval around y=O. On the other hand, the sealing function .ll gives
hardly information about the (g,i) region close to the spin-flop line,
which is compressed around x=O in .<#f'_ Now, the data originating
from the (g,i) region close to the axis, are highly emphasized
and cover the entire large-x range of bath branches of . .K (x). It is
clear that the sealing procedures are complernentary. Therefore, both
analyses will be performed in order to get a complete image of the
ordered phases in CMB.

171 -
From ~(y) information can be extracted in particular on the behaviour
of M8
t close to the spin-flop line. As we discussed insection 3.4.,
the ~-variation of MU and MJL along the g=O axis is given by st st
This implies that the sealing tunetion ~(y) for y +
asymptotic behaviour given by
Mst(g,'î:) l~,sb ~(y) <X
lgiSbj~
Close to the paramagnetic phase boundaries, given by g
y= I), y (y) must display critical behaviour:
?r(y)"' (I-y) 8 , for y + 1.
( 6. 26)
"" must show the
(6.27)
I Cv
1 ,j)
±:w t · (i.e.
(6.28)
In (6,27) and (6.28) the exponents Sb and S are predicted to have the
d=3 XY and Ising values, respectively 12s!. Therefore, it should be
possible to abserve the crossover from bicritical to critical behaviour
as a change in the slope of'J'/'(y) drawn in a double-logarithmic plot
as a function of (1-y).
To verify the predicted data collapsing and to abserve the crossover
behaviour in ~(y) we have compared the scaled data of CMB in a plot of
tn(M5 tcg,'i');lg! 13b/~) vs. R,n(l-y). In this sealing analysis the direc
tions of the g=O and i=O axes were taken from the analysis of the
phase boundaries in the previous section. The values of ~. Sb and the
position of the bicritical point ca; ,Tb) have been varied, in order
to study the effects of these variations on the sealing results. It
appears that good estimates for these parameters can be obtained
from the quality of the data collapsing. The value of w w// = wj_,
which is used in the normalization of y, was adapted simultaneously
with a change in ? or a shift in (Hb2 , Tb), in order to retain the
best description of the paramagnetic phase boundaries Tff and c

- 172 -
theory
11
fl/ 2
1 st order
1
0.5
100 10
Fig. 6.21.
Opti.rrrum data
to yieLd the sealing
lines. The dashed curves aor~espond
for '1F with t.=l.
5
2
power law
critica! ...
1 (1- y) 0.1
soaled acco~ding to (6.23)
the p~ocess the
!DrmP?.TJ?rm.<; plot of
the theoretiaaZ prediation ( 6. 31)

- 173-
Fig. 6.21. shows the optimum result for the scaled data which was ob-
tained for Tb= 5.255 K, ~ 1.20 and 1\ 0.34. Approximately 5500
data points from 35 field scans (20 kOe < H < 32 kOe) in the tempera
ture range 3.5 K < T < 5.7 K are contained in these sealing plots.
Some data very close to the paramagnetic phase boundaries, which
clearly contained a contribution from critical scattering, have been
omitted. Close to the spin-flop line the data for M2 (Mff )2 + (Mj_) 2 // _L st . st st
have been used insteadof the observed Mst or Hst-data, J.n order to
correct for the rounding effect due to the small misalignment of the
field (cf. eq. (6.12)).
In addition to the striking data collapsing, the symmetry between the
M1t and M;-data, which is expected for an n=2 spin-flop system, is
obvious. Both r 11 and ~-j_show the expected asymptotic behaviour
close the paramagnetic phase boundaries (6.28), as is shown by the
straight lines for 1-y + 0, which have a slope 8 = 0.325, i.e. the
theoretical value fora d=3 Ising system j20j. However, no crossover
to the bicritical behaviour (6.27) is observed. This could not be
expected either, because we are not observing the behaviour (6.26) of
along the spin-flop line, as y +-oo, but rather the behaviour along
a "pseudo-spin-flop line" at finite nonzero (compare Fig. 6.18.).
In fact we are scanning in a slightly different way the temperature
dependenee of M8
t along this pseudo-spin-flop line, i.e. Fig. 6. I I.
We shall discuss this behaviour in more detail in the next section,
together with the other results of the sealing analysis.
In Fig. 6.21. also a theoretica! predietien for Y(y) is shown, de
rived from RG-calculations to first order in s 4-d j38j as
Y(y)
• { 1 3s ln[2(I-n- 1 )]
2(n+8) R( 1-y)
The function R(I-y) is given by
R(l-y) 9 n+8
(6.29)
(6.30)

- 174
For an n=Z spin-flop system (6.29) simplifies to
~(y) (6.3!)
In the critica! region, i.e. y 7 I, the (1-y)B term ensures that (6.31)
varrishes with the correct Ising exponent B. Close to the spin-flop
transition, i.e. y ~- oo, expression (6.31) prediets a power-law
behaviour with an exponent
(6.32)
for all € ~ I. Indeed (6.31) is supposed to hold only in the range
-l ~ y < i, i.e. not too close to the first-order spin-flop transition.
In Fig. 6.21. the expression (6.3I) for E=I is shown, with ~'(y)
scaled to coincide with the data for I-y = I. It appears that within
the range of validity, the deviation of (6.3I) from the single-power
law (6.28) is much smaller than the scatter in our data. Therefore,
no firm conclusions can be drawn about the correctness of (6.3I).
The quality of the data collapsing teeomes distinctly worse if one of
the parameters , Sb or ~ in the sealing process, deviates from the
optimum values used in Fig. 6.2I. The most obvious is the effect of
a change in Tb. Both for Tb < 5.24 K and for Tb > 5.27 K absolutely
none satisfactory data collapsing can be obtained for any value of Sb
and ~. Within these boundaries for Tb' the optimum values of Sb and ~
were estimated as Sb= 0.34(2) and ~ = I.20(3). For parameter values
Tb' Bb and ~ outside these ranges, the data gathered in field scans at
different temperature start to deviate from the single-power law be
haviour at different y-values in the range I > I-y > 0. In the sealing
plots this looks like a fan which is unfurled. Although it is difficult
to quantify the criteria used in judging the plots, we feel confident
to give the following estimates for the parameters in CMB:
Tb= 5.255(10) K, ~ I.20(3) and Sb= 0.34(2) • {6.33)
In these estimates we have also taken into account the results of the • • . • IJ second scallng procedure, correspondlng to the scallng functlons Af
- 175-
j_ and .~ (6.22). The values for Sb and ~ are in good agreement with the
theoretica! predictions Sb; 0.346(9) [39[ and ~; 1.175(15) [26[,
respectively.
The sealing functions Ar(x) with x defined in (6.24), are especially
suitable to analyze the behaviour of M in the (g,~) region close to st the ~;0 axis. As we discussed in section 3.4. the g-variation of M//
st along the ~;0 axis is given by
(6.34)
This implies that both branches Af: and Af~ must have the following
asymptotic behaviour for x + oo
11 "' "' Mst(g,t)
[~[Sb
"' Close to the paramagnetic phase boundaries g
display critical behaviour, i.e.
(6.35)
(6.36)
With (6.26) the asymptotic behaviour of Af~(x) close tothespin-flop
transition (x + 0) is found as
11 "' "' Mst(g,t)
[~[Sb constant, for x + 0.
In a plot of ~n Af#(x) vs. ~n(x-i) the crossover from criticalto +
(6.37)
bicritical behaviour, represented by (6.36) and (6,35) respectively,
should be observable as a change in slope from S to Sb/~. Similarly, a /I plot of ~n .I_(x) vs. ~n(x) should show a change in slope from zero to
I . ...L <"' "') . Sb ~ with increasing x. The discusslon of Mst g,t proceeds ln a com-
pletely similar way and therefore eqs. (6.35) to (6.37) also apply to .L
Af±'

10
5
0.5
Fig. 6.22.
- 176 -
bicritical
f3;;/ (/J ~0.281(4)
~," '~~0.326(6) / "'critica!
1st order
-2 0 1
10 10 10 2 3
10 10 X- Xe
Optimum data collapsing of M.~t and M~ data, scaled according to (6. 22) . ld 7 l . . 1/ d _L h . . f to y&e tne sca &ng funct&ons .L an Ar • Bot funct&ons cons&st o
two branches Ar+ (squares) and Ar_ (circles). The parameter values
(6. 33) have been used. In this plot of Jtn .ff vs. Jtn(x-xc), x is defined
by ( 6. 24), = 0 for .J( _ and = 1 for Jt +. The so lid lines corres-
pond to the asymptotic bicritical (cf. (6.35)) and critical (cf. (6.36))
behaviour. The shady lines enclose the 25% crossover regions defined
in the main text.

- 177 -
Fig. 6.22. shows the optimum sealing results for the data on CMB in
a plot of tn[Mst(g,'t:');[!:'[ 6b] vs. tn(x-xc)' obtained with the parameter
values (6.33). Here xc = 1 for Af+ and xc = 0 for ~{_. Again the data
collapsing is excellent and the symmetry between .ff11 and .#'_Lis
striking. The predicted asymptotic critical behaviour (6.36) of .411/ +
and .A_]_ for x-x + 0 appears to be fulfilled. Least-squares fits of + c
(6. 36) to the data wi th (x-xc) < 1. 4 yield the s lopes S;; 0. 32 1 ( 4)
and Sj_ = 0.326(6). These values may be compared with the estimates
from theseparate field scans in the previous section (Table 6.2.).
Bath are in good agreement with the theoretical predictions S =
0.325(1) (s-expansion [20[) and 0.312(5) (series [21[). The predicted
bicritical behaviour of .41+ for x-xc->- oo (cf. (6, 35)) is clearly con
firmed, too. Although the difference between the theoretical values
for S and Sb/~ is only small, the crossover from critical to bicritical
behaviour is obvious. Least-squares fits of (6,35) to the data with
(x-xc) > 30 yield the slopes (SbN)// = 0.288(2) and (Sb/~>...t_ = 0.280(3).
Of course, these results may not be considered as independent esti
mates for Sb/~, since the exponents Sb and ~ separately have been used
in the sealing procedure. However, these values demonstrate that the
disappearance of the order parameter in the bicritical region along
'" the t=O axis is described correctly by the exponent Sb/~= 0.34/1.2
0.283, in agreement with (6.34). Also .#' shows the predicted asymp
totic behaviour (6.35) for x-xc + oo, For Jt11 we find (Sb/~);; = 0.280(2)
and for A'j_the slope (Sb/~)_L = 0.282(4) is obtained. For x-xc->- 0
the slope of .41_ strongly decreases, but apparently a small slope of
approximately 0.03 remains present for small x-xc, This can be ex
plained as an effect of the small misalignment of the magnetic field.
In order to obtain a more quantitative picture of the crossover from
critical to bicritical behaviour in A+ and from bicritical to first
order behaviour in A_, we have determined in least-squares fits for
each half-decade in x-xc the effective exponent Seff' which corresponds
to the observed local slope in Fig. 6.22. [40[. The results for A~ and .411.. are shown in Fig. 6. 23., where x indicates the center of the
+ r
related (x-xc) range. In the same figure, the exponents are shown,
which result from least-squares fits of a single power law to all data
with (x-xc) < xr as well as the results for all data with (x-xc) > xr.

...L f3eff
- 178 -
Fig. 6. 23.
(3:ff The e!fective exponents S~ff and seff' d~ermined from
JftJ and J1( + for each half
decade in (x-xc) centred
around xr (open circles).
Triangles and dots corres
pond to the exponents S re
sulting from least-squares fits of a power law to all data with
x-xc < xr and x-xc > xr, respectively. The dashed line approximately
represents the crossover in Seff from 6 to Sb/~. The arrows indicate
the boundaries of the 25% crossover regions.
These combined data give a good impression of the crossover of Seff' in
spite of the small difference between the asymptotic values S and Sb/~.
The arrows indicate the (x-xc) values where Seff is estimated to de
viate 25% of IS - Sb/~1 from either S or Sb/~. The 25% crossover regions
bath for Af+ and .f( _ are also indicated in Fig. 6. 22., and their
location in the H2 vs. T phase diagram is shown in Fig. 6.24. The
widths of the 25% crossover regions in the sealing plot Fig. 6.22.,
determined as
for J1( +, and as
for -~-' appear to be in good agreement with the predictions of Riedel

- 179-
and Wegner [40[. A further discussion of these results is presented in
the next section.
T {K)
Fig. 6, 24.
Part of the H2 vs
T diagram of CMB
(cf. Fig. 6.20.),
with the experi
mentaUy deter
mined 25% cross
over regions in the ordered phases enclosed by shady lines.
6.9. Discussion and conclusions
Up to now most experiments on bicritical behaviour have been confined
to an accurate determination of the shape of the magnetic phase
boundaries [29-34[. Comparison with the extended-sealing prediction
(6. 14) leads to an estimate of the crossover exponent ~. the ratio of
amplitudes Q(n) w~ /w~ and the direction q of the t~O axis. In most
cases either Q or q has been determined with the other quantity fixed,
because of their strong mutual correlation. This prevents an unambiguous
determination of the (n~2) or (n~3) character of the system, since
Fisher's estimate (6. 18) for q appears to be not very reliable. In all
materials investigated up to now, it has been possible to achieve a
good description of the observed phase boundaries bath with the n~2
values Q(2) 1, ~ ~ 1. 175(15) and with the n~3 values Q(3)% 2.51,
~ ~ 1.25, if q is treated as an adjustable parameter. Also in the
present analysis of the phase diagram of CMB, the q-estimate appears

- 180 -
to be completely unreliable because of the pseudo one-dimensional
characteristics of CMB. So, also in this study the n;2 character of
CMB could not be extracted from the shape of the phase boundaries, but
was ultimately confirmed by the complete similarity of the sealing
plots for M__L and M// . st st
More interesting than the determination of the phase boundaries are
studies of the behaviour of a critical quantity in the vicinity of
the bicritical point. To our knowledge such studies thusfar were only
performed on GdAl03, for which compound the jump in the homogeneaus
magnetization 6M(f<O, g;Q) along the spin-flop line and the homo-
'" '" geneaus susceptibility x along the g;Q axis (t>O) have been reported
1281. Also the behaviour of 6M at small nonzero H. and in particular 1
the crossover in 6M from bicritical behaviour to the critical behaviour
correponding to the critical edge of the spin-flop shelf TSF (Fig.3.8) c
has been studied l3sl.
The present investigation yields the first experimental test of the
central hypothesis in the theory of bicritical behaviour, i.e. of the
extended-sealing hypothesis (6.21). The neutron scattering data on CMB
provide the possibility of an extensive sealing analysis, in which all
theoretical predictions are fully confirmed. Crossover of critical to
bicritical behaviour is observed in Mst(H,T) and the corresponding
critical exponents have been determined.
In the papers of Rohrer et al. 134,351, the importance of an exact
alignment of H along the easy axis for a correct determination of
bicritical exponents is emphasized. A mismatch angle of 10- 3 - 10-2
degrees would change the behaviour 1n a crucial way. On the contrary
we prove in the present experiment on CMB that it is possible to de
termine bicritical exponents in a magnetic field which is misaligned
by O.So, which is much greater than the critical angle ~c· In this
discussion we shall show that bath findings are not contradictory but
more or less complementary. To understand this, one must consider
within which region in (H~ ,Hi,T)-space the data are collected which
are used in the analysis of the bicritical behaviour.

- 181 -
Rohrer et al. 128,351 state correctly that a very precise alignment of
H along the easy axis is essential in order to obtain bicritical ex
ponents from measurements in the (H~,T)-region close to the g=O axis,
Indeed, we have found a rounding of the paramagnetic phase boundaries
close to the (pseudo-) bicritical point (Figs. 6. 18. ,6.20.). We have
detected also that the jump in M behaves more or less Ising-like "' st
rather than XY-like along the g=O axis (Fig. 6. I 1.). We did notabserve
a crossover from critical
sealing functions r// (y)
were the sealing functions
(n=l) to bicritical (n=2) behaviour in the ..1.
and 7r (y) for y 7 oo (Fig. 6.21 .). Neither /1 _l_
.ff_(x) and .ff_(x) completely constant for
x 7 0, but retained a small slope corresponding roughly to the diffe
rence between Sb and S (Fig. 6.22.).
However, in the present experiment the most interesting information is
not extracted from the regions close to g=O, but from the entire (H§,T)
space and especially from the bicritical region around the t=O axis
(Fig. 6.24. ). The advantage of this bicritical region in (H//'Hi,T)-space
is that it extends far from the bicritical point, like a wheel with the
g=O axis in the (H~,T) plane as a spindle, and that it is unaffected
by critical lines close by. Therefore data from a wide region, also
far from the Hi=O plane, can be used to determine bicritical behaviour.
Apparently the relatively small difference between the positions of
the bicritical point (Tb,Hi=O) and the pseudo-bicritical point (Tb',
Hi small) appears to be negligible for the behaviour in the (H#,Hi,T)
plane at constant Hi/H~ . As shown in Fig. 6.22., even for large x
values no deviation from a single power law with bicritical exponent
Sb/~ is observed.
When the location of the t=O axis is known, it should be possible to
attain a very precise and independent determination of the exponent
Sb/~ from direct measurements of the intensity variation of ~ magnetic
Bragg reflection along t=O. This would be a much simpler experiment
than the investigations along the g=O axis. A disadvantage of the region
close to t=O is that in that region only the staggered magnetization
and the staggered susceptibility are really relevant quantities, which
are only measurable by neutron scattering experiments.

- 182 -
Conclusions
The results of the present neutron scattering experiment on CMB may be
summarized by stating that the predictions of the extended-sealing
hypothesis, which is underlying renormalization-group calculations and
the theory on bicritical behaviour, are fully confirmed. Even in this
pseudo d=l system the shape of the phase boundaries near the bicritical
point appear to be predicted correctly. Fisher's estimate of the non
universal value q is not appropriate, as might be expected from the
MF-type of approach used in the determination, which clearly is not
applicable in pseudo d=l systems.
A much stronger verification of the extended-sealing hypothesis itself
is the striking collapsing of scaled data from the entire (H# ,T)
diagram on two sealing functions .1111 and .H'_L(or alternatively on ril
.!. and 7r ). Crossover from critical to bicritical behaviour has been
observed in .11! and Af~ The corresponding critical exponents S and
Sb appear to be in excellent agreement with the d=3 Ising and XY
values, respectively, as predicted by RG-calculations j20,39j. Also
the theoretical prediction for the crossover exponent ~ has been con
firmed. It is the first time that such a penetrating experimental
verification of the extended-sealing hypothesis in spin-flop systems
has been performed.

- 183 -
6. 10. Appendix
Determination of M~ (H) and Mj_(H) from the peak intensities Ih (H) ------------------~~---------~~--------------------------------2!_
In order to determine the best estimates for the scale factor ej = eh~ and for the non-magnetic background Bj = Bh~ in each separate field
scan Ij(H,T) = IhO~(H,T), the three available scans have been compared
mutually in a least-squares fitting program. With the observed in
tensities in a scan denoted by
j: I, 2, 3 (A 6. I)
in the AF-phase and by
I.(H.,T): e. sin2 8. [Mj_(H.,T)] 2 + B.; j:l,2,3 J l J J st l - J
(A 6. 2)
ln the SF-phase, the fitting procedure implies that for each T-value
the quan tit i es
and
H. E AF l
H. ESF l
{I. (H. ,T) - )( J l J
11 2 I.
1(H.,T) -ö.}; j:l,2,3
J + l J cycl.
j_ ..L 2 {I. (H. , T) - a. I. I (H. , T) - li. } ; j: I , 2, 3
J l J J+ l J. cycl.
are minimized. Here
l. J
e .;e. 1 J J+
B.- l J J
..l a. J
af · 2e I · 2 e J s ln j s ln - j +I
b~ B. J J
(A 6. 3)
(A 6. 4)
(A 6. 5)
(A 6.6)
Since the angles Gj are known, estimates for
from the fitted parameters af/ ,_Land b// • ...L.
e. and B. can be obtained J J
J J The symbols Hi E AF, SF
indicate that for the fits only those field ranges were used, which
undoubtedly belong to the AF-phase and SF-phase, respectively.
Although the estimates obtained in this way were satisfactory, the
all ,...Land b!l ,..l.values appeared to be strongly correlated. J

- 184 -
In order to imprave the accuracy of the estimates, the values of the
background scattering B. were derived first from fits in which only J
(H,T)-regions were taken into account where the magnetic con-
tributions to the peak intensities are very small. In these fits
first-order approximations for the C.-values were used. Subsequently, J
better C.-values were derived from fits which used only (H,T)-regions J
where the magnetic intensities are much higher than the background.
From this procedure a set of Cj and Bj-values resulted, which leads to
scaled field scans I~c(H,T) ; (I.-B.)/C. for all three reflections, J J J J
which coincide perfectly at all (H,T)-values in the AF-phase. A good
example of the quality of this data collapsing in two completely
different (H,T)-regions is shown in Fig. 6. 7. From this result it may
be concluded in the first place that extinction effects can be ne
glected, Secondly, that the c-axis is proven to be the intermediate
direction, indeed, since the scaled intensities are found to be pro
portional to the corresponding sin28 in the SF-phase.
With the obtained parameter set, the contributions of M~ and MJL to st st
the intensity of a reflection can be separated close to the AF-SF phase
boundary. For the scaled intensities
j; I, 2, 3 (A 6. 7)
standard deviations o.I have been derived from the counting statistics
J (MsJLt) 2 of I. and from the estimated uncertainties in B. and C .. Then J J J
has been determined as
where
JL (M )2
st
JL G.
J I. I 2 I zJ-1 L(oj ) + (oj+l) .
(M~ )2 has been derived as st
j; 1 ,2 '3
cycl.
(A 6. 8)
(A 6. 9)

- 185 -
(M// ) 2 st
'{//(se ·2 1sc.2 )/('2 ·2 )}/' // L G. I. 1s1n8.-. s1n8. I Sln8.-sln8. I L GJ., j J J+ J J J+ J J+ j
j=l ,2,3 cycl. (A 6. I 0)
(A 6. !I)
References to Chapter VI
lil A.L.M. Bongaarts and W.J.M. de Jonge, Phys. Rev, ~. 3424 (1977),
12 I Q.A.G. van Vlimmeren, W.J.M. de Jonge and M.S.J. Schuilwerve,
(Proc. Statphys 13, Haifa, 1977) Annals of the Israel Physical
Society l (2), 606 (1978), Q.A.G. van Vlimmeren, C.H.W. SwÜste
and W,J.M. de Jonge, J, de Phys. (Paris) 22, C6-743 (1978).
131 K. Kopinga, Q.A.G. van Vlimmeren, A.L.M. Bongaarts and W.J.M. de
Jonge, Physica 86-88B, 671 (1977)
141 J.A.J. Basten, Q.A.G. van Vliromeren and W.J.M. de Jonge, Phys.
Rev. ~. 2179 (I 978).
151 See for instance, H. Nishihara, W.J.M. de Jonge and T, de Neef,
Phys. Rev. ~' 5325 (1975) and references therein.
161 J, Skalyo, G. Shirane, S.A. Friedberg and H. Kobayashi, Phys.
Rev. B2, 1310 and 4632 (1970).
171 A.C. Botterman, W.J.M. de Jonge and P, de Leeuw, Phys. Lett, 30A,
150 (1969).
181 G.J. Butterworth and J.A. Woollam, Phys. Lett. 29A, 259 (1969).
191 C.H.W. SwÜste, W.J.M. de Jonge and J.A.G.W. van Meyel, Physica
]J:_, 2 I ( I 9 7 4) •
I 101 S.J. Jensen, P. Andersen and S.E. Rasmussen, Acta Chem. Scand.
_!i, 1890 (1962).
I I I I W.J.M. de Jonge, J.P.A.M. Hijmans, F. Boersma, J.C. Schouten and
K. Kopinga, Phys. Rev. ~. 2922 (1978).
I 121 R.D. Spence, W.J.M. de Jonge and K.V.S. Rama Rao, J. Chem. Phys.
2l· 4694 (1969).
1131 H.M. Rietveld, J. Appl. Cryst. l• 65 (1969).
1141 R.E. WatsonandA.J. Freeman, ActaCryst.~, 27 (1961),
I 151 A.C. Botterman, Ph. D. Thesis (Eindhoven, 1976) (unpublished),
l16l K. Kopinga, Phys. Rev. ~. 427 (1977).

- 186 -
I 171 T. Oguchi, Phys. Rev. ~.A 1098 (1964).
I 181 H. Rohrer and H. Thomas, J. Appl. Phys. ~. 1025 (1969).
[191 T. Nagamiya, K. Yosida and R. Kubo, Adv. Phys. ~. 1 (1955).
1201 J.C. le Guillou and J. Zinn-Justin, Phys. Rev. Lett. ]1, 95 (1977).
1211 D.J. Wallace in "Phase Transitions and Critical Phenomena", Vol.6.
(C. Do~b and M.S. Green Eds, Academie, New York, 1976), Table VI.
1221 J.A.J. Basten, E. Frikkee and W.J.M. de Jonge, J. de Phys. (Paris)
]1, C6-819 (1978).
1231 J.A.J. Basten, E. Frikkee and W.J.M. de Jonge, Phys. Lett.68A, 385.
1241 J.P.A.M. Hijmans, K. Kopinga, F. Boersmaand W.J.M. de Jonge,
Phys. Rev. Lett. 40, 1108 (1978).
1251 J.M. Kosterlitz, D.R. Nelson and M.E. Fisher, Phys. Rev. ~.
412 (1976), M.E. Fisher, AlP Conf. Proc. 24, 273 (1975).
1261 P. Pfeuty, D. Jasnow and M.E. Fisher, Phys. Rev. ~. 2088 (1974).
1271 M.E. Fisher, Phys. Rev. Lett. ~. 1634 (1975).
1281 H. Rohrer, Phys. Rev. Lett. li• 1638 (1975), AIP Conf. Proc.
l±· 268 (1975).
1291 Y. Shapira and e.c. Becerra, Phys. Lett. 57A, 483 (1976) on MnFz.
l3ol A.R. King and H. Rohrer, AlP Conf. Proc.~. 420 (1976) on MnFz.
131 I H. Rohrer and Ch. Gerber, Phys. Rev. Lett. 38, 909 (1977) on
GdAl03•
1321 Y. Shapira and e.c. Becerra, Phys. Lett. 59A, 75 (1976), Phys.
Rev . .!?_!_§_, 4920 (1977) on Crz03, Phys. Lett. 57A, 483 (1976) on
MnF2 •
l33l N.F. Oliveira, Jr., A. Paduan Filho, S.R. Salinas, Phys. Lett.
55A, 293 ( 1975) on NiCl 2 • 6H20.
1341 R.A. Butera and D.R. Rutter, J. Appl. Phys. ~. 1344 (1978) on
MnCl2 ·4H20.
l35l H. Rohrer and Ch. Gerber, J. Appl. Phys. ~. 1341 (1978).
l36l M. Barmatz, P.C. Hohenberg and A. Kornblitt, Phys. Rev. ~.
1947 (1975).
1371 P.C. Hohenberg, A. Aharony, B.I. Halperin and E.D. Siggia,
Phys. Rev. ~. 2986 (1976).
[38[ E. Domany, D.R. Nelson and M.E. Fisher, Phys. Rev. BIS, 3493,
3510 (1977).
[391 G.A. Baker, Jr., B.G. Nickeland D.I. Meiron, Phys. Rev. ~.
1365 (1978).
I40I E.K. Riedeland F.J. Wegner, Phys. Rev. ~. 294 (1974).

- 187 -
Summary
This report starts with a rather extensive presentation of the
concepts and ideas which constitute the basis of the modern theory
of static critical phenomena. It is shown how at a critical point
the semi-phenomenological concepts of universality and sealing are
directly related to the divergence of the correlation length and
how they are extended to a calculational methad for critical be
haviour in Wilson's Renormalization-Group (RG) approach.
Subsequently the predictions of the molecular-field and RG-theories
on the phase transitions and critical behaviour in weakly anisa
tropie antiferromagnets are treated. In a magnetic field applied
along the easy axis, these materials can display an (H,T) phase
diagram which contains either a bicritical point or a tetracritical
point. Especially the behaviour close to these multi-critical points,
as predicted by the extended-sealing theory, is discussed.
The experimental part of this study is contained in the chapters IV
VI. Results are presented of elastic and quasi-elastic neutron
scattering studies on the critical and multi-critical behaviour in
two low-dimensional, weakly anisotropic antiferromagnets, vi2.
CoBr 2 .6{0.48D20,0.52H20} (CB48) and CsMnBr 3.2D20 (CMB). In chapter
IV we report the rather complete picture which has been obtained of
the critical behaviour of CB48 near the Néel point. Although CB48
at high temperature is a good approximation of the two-dimensional
(d=2) XY-model, the present experiment shows that the critical be
haviour may be described as d=3 Ising-like. Both the critical ex
ponents and the critical amplitudes that were obtained are in good
agreement with the theoretical values for the d=3 Ising model.
In chapter V the magnetic phase diagram of CB48 in a parallel mag
netic field is presented. Strong evidence has been found fot the
existence of an intermediate (I) phase between the antiferromagnetic
and the spin-flop phase, which implies that the (H,T)-diagram con
tains a tetracritical instead of a bicritical point. This would be
the first time that an I-phase with coupled order parameters has
been observed in an antiferromagnetic system.
The neutron-scattering data on CMB (chapter VI) are used to verify

- 188 -
the extended-sealing hypothesis, which is the central assumption in
the theory and (RG-) calculations of multi-critical behaviour.
Even in this pseudo-cl=] system the shape of the phase boundaries
near the bicritical point is found to be correctly predicted by the
extended-sealing theory. Moreover, a striking data-collapsing of
the scaled order parameters M// (H, T) and Ml (H, T), determined ln st st
the entire (H//,T)- phase diagram, on two sealing functions could be
achieved. This is a very direct confirmation of the extended
sealing hypothesis. Crossover from critical to bicritical behaviour
has been observed. The corresponding critical exponents S and Sb,
and the crossover exponent ~ are found to be in good agreement with
the theoretical values.

- 189 -
Samenvatting
In hoofdstuk II van dit proefschrift wordt een tamelijk uitgebreide
inleiding gegeven tot de begrippen en ideeën die de basis vormen van
de huidige kennis van faseovergangen en (quasi-statische) kritieke
verschijnselen. Met name wordt er ingegaan op de direkte relatie,
welke bestaat tussen de divergentie van de korrelatielengte(n) in
kritieke punten en de semi-fenomenologische begrippen "universali
teit" en "schaling", welke zijn vervat in twee hypothesen.
De universaliteitshypothese stelt:
Het kritieke gedrag van een systeem waarin alleen interakties
met korte dracht voorkomen, hangt alleen af van
- de ruimtelijke dimensionaliteit (d) van het systeem;
- het aantal (n) onafhankelijke vektorkomponenten van de
ordeparameter.
De schalingshypothese stelt:
Het gedrag van elke fysische grootheid in de buurt van een kri
tiek punt kan worden afgeleid van de manier waarop deze groot
heid zich gedraagt onder een verandering van de lengteschaal.
Deze twee hypothesen zijn enige jaren geleden uitgebouwd tot een
methode om kritiek gedrag te berekenen, namelijk Wilson's aanpak ge
baseerd op transformaties met behulp van een zogenaamde "Renormali
satie-Groep" (RG). Deze aanpak wordt kort uiteengezet in hoofdstuk II.
In hoofdstuk III worden de voorspellingen behandeld van de molekulaire
veldtheorie en de RG-theorie met betrekking tot de faseovergangen en
het kritieke gedrag in antiferromagneten met zwakke anisotropie. In
een magnetisch veld aangelegd langs de voorkeursrichting, kunnen deze
materialen een (H,T)-diagram vertonen, dat hetzij een bikritiek het
zij een tetrakritiek punt bevat. Hier wordt in het bijzonder aandacht
geschonken aan het voorspelde gedrag in de buurt van deze multi
kritieke punten en de afleiding daarvan uit een "uitgebreide-schalings
theorie".
In de hoofdstukken IV tot en met VI worden enkele experimenten be
schreven aan twee laagdimensionale antiterramagneten met zwakke an
isotropie, namelijk aan CoBr 2 .6{0.48D20,0.52H2o}, kortweg CB48, en
aan CsMnBr 3 .2D20, kortweg CMB. Hiervan is het kritieke en multikri-

- 190 -
tieke gedrag onderzocht met behulp van elastische en quasi-elastische
neutronenstrooiing. Hoofdstuk IV biedt een tamelijk kompleet beeld
van het kritieke gedrag van CB48 in de buurt van het Néelpunt. Hoewel
CB48 bij hoge temperatuur een goede benadering is van het tweedimen
sionale XY-model (d=2, n=2), toont het hier beschreven experiment aan
dat het kritieke gedrag goed wordt beschreven door het driedimensionale
Ising-model (d=3, n=l).
In hoofdstuk V wordt het magnetische fasediagram van CB48 in een
parallel magnetisch veld gepresenteerd. Er zijn duidelijke aanwij
zingen gevonden voor het optreden van een zogenaamde "intermediaire
(I) fase" tussen de antiferromagnetische en de spinflop-fase, hetgeen
betekent dat het (H,T)-diagram een tetrakritiek in plaats van een
bikritiek punt bevat. Dit zou de eerste keer zijn dat een I-fase met
gekoppelde ordeparameters is waargenomen in een antiferromagneet.
De gegevens met betrekking tot CMB zijn in hoofdstuk VI gebruikt om
de uitgebreide-schalingshypothese te verifiëren, welke de centrale
aanname is in de voorspellingen en (RG-) berekeningen van multikritiek
gedrag. Zelfs in dit pseudo-eendimensionale systeem blijkt de vorm
van de fasegrenzen goed te worden voorspeld door de theorie. Bovendien
bleek dat alle meetresultaten voor de ordeparameters, bepaald in de
geordende fasen van het (H,T)-diagram en korrekt geschaald, samen
vielen op twee schalingsfunkties. Dit is een zeer direkte bevestiging
van de juistheid van de uitgebreide-schalingshypothese. In de scha
lingsfunkties kon de overgang van kritiek naar bikritiek gedrag
(crossover) worden waargenomen. De korresponderende kritieke expo
nenten 8 en Sb' alsmede de crossover-exponent ~. blijken in goede
overeenstemming te zijn met de theoretisch voorspelde waarden.

- 191 -
LIST OF ABBREVIATIONS AND SYMBOLS
AF
AFMR
CBX
CB48
CMB
cxs
I
LRO
MF
NMR
p
RG
SF
_,. A _,. D
D
D (S)
G
GaS(R,t)
Gas(R t) n '
GaS (R) n
c;as(Q,w)
GaS(Q) n
Hf/ HA
He x
RIA
Ris
HsF _,. Hst
df'
Jr'
antiferromagnetic (phase)
antiferromagnetic resonance
CoBr 2 .6{xD 20,(1-x)H20}
CBx with x~0.48
CsMnBr 3 .2D 20
coexistence surface
intermediate (phase)
long-range order
molecular field
nuclear magnetic resonance
paramagnetic (phase)
renormalization group
spin-flop (phase)
introduced at page:
inter-sublattice interaction
intra-sublattice interaction
=: D - D z y spin distribution function
Gibbs free energy
space-time correlation function
net space-time correlation function
= GaS(R, t~O), net static correla~ion ftmction n
. aS(_,. ) doubly Four~er-transformed G R,t
= GaS(q), Fourier transferm of GaS(R) n n
magnetic field along the easy axis
anisotropy field
exchange field
AF -> I transition field
SF -> I transition field
AF -> SF transition field, spin-flop field
staggered magnetic field
Hamiltonian expressed in Q-dependent quantities
effective Hamiltonian
reduced Hamiltonian
63
63
65
38
8
13
13
15
14
15
61
61
88
68
68
61
11
40
34
39
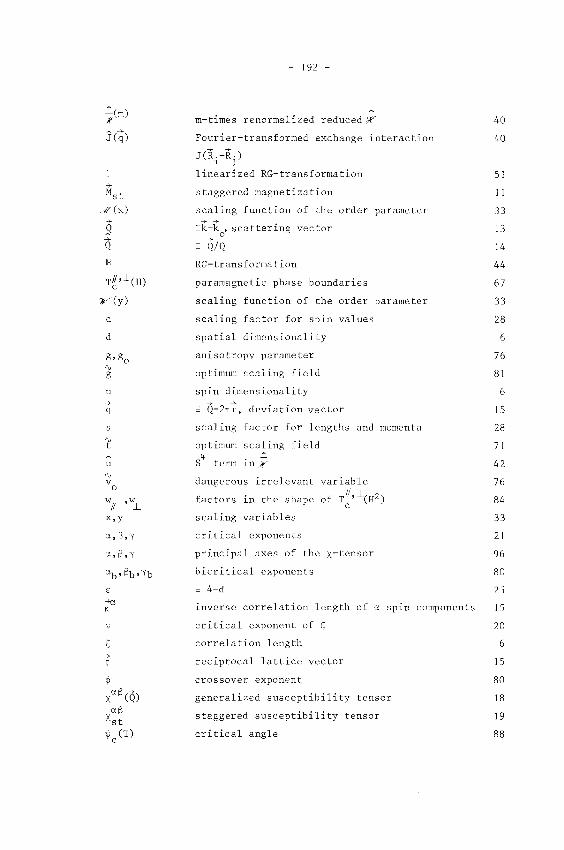
+ Mst
.#(x)
§ Q R
T// ,l (H) c
;r(y)
c
d
n + q
s
1: u 'V V
0
w11
, wj_
x,y
a,S,y
a,S,y
E
+a K
\)
+ T
~
x aS (Q)
aS x st 1jJ c (T)
- 192 -
m-times renormalized reduced :R
Fourier-transformed exchange interaction
JC]L-R..) 1 J
linearized RG-transformation
staggered magnetization
sealing function of the order parameter + +
:=k-k0
, scattering vector
= Q/Q RG-transformation
paramagnetic phase boundaries
sealing function of the order parameter
sealing factor for spin values
spatial dimensionality
anisotropy parameter
optimum sealing field
spin dimensionality
= Q-2n~, deviation vector
sealing factor for lengtbs and momenta
optimum sealing field
s4 term in ;r
dangerous irrelevant variable
factors in the shape of T~'l(H2) c
sealing variables
critical exponents
principal axes of the x-tensor
bicritical exponents
= 4-d
inverse correlation length of a spin components
critical exponent of ~
correlation length
reciprocal lattice vector
crossover exponent
generalized susceptibility tensor
staggered susceptibility tensor
critical angle
40
40
SI
11
33
13
14
44
67
33
28
6
76
81
6
IS
28
71
42
76
84
33
21
96
80
2S
IS
20
6
IS
80
18
19
88

- 193 -
Nawoord
Op deze plaats wil ik iedereen danken die op de een of andere wijze
heeft meegewerkt of bijgedragen aan het tot stand komen van dit
proefschrift en het hierin beschreven onderzoek.
Dr.Ir. A.L.M. Bongaarts heeft me op bijzonder sympathieke wijze inge
wijd in de theorie en praktijk van de elastische neutronenver
strooiing en magnetische faseovergangen.
De stimulans die Dr.Ir. W.J.M. de Jonge, Dr. E. Frikkee en Dr. J.
Bergsma mij op de juiste momenten gaven door hun voortdurende be
langstelling en inspirerende diskussies zowel tijdens de experimenten
als bij het interpreteren en rapporteren, is voor mij van erg grote
betekenis geweest.
Bij het schrijven van dit proefschrift heb ik dankbaar gebruik ge
maakt van het kommentaar van Prof.Dr. P. van der Leeden en Prof.Dr.
J.A. Goedkoop.
Tijdens de experimenten was de assistentie die H.H.A. Plas en J.F.
Strang zelfs bij nacht en ontij verleenden, onvervangbaar. Ook de
mensen van de groep elektronika waren, indien nodig, steeds snel
paraat. H. Haddersmaakte voor mij de goede CsMnBr 3.2D 20 kristallen.
Veel waardering heb ik voorts voor het nauwgezette typewerk, zowel
van dit proefschrift als van verscheidene er aap voorafgaande publi
katies, verzorgd door respectievelijk mevr. E.A.M. Endel-Kramer en
mej. G. MÖls. F. de Jong heeft zorggedragen voor de enorme hoeveel
heid teken- en plakwerk en de reprografische dienst van het ECN onder
leiding van E. van Rooy nam de druktechnische uitvoering voor zijn
rekening. De directie van het ECN ben ik dank verschuldigd voor de
mogelijkheid deze tekst van een extern ECN-rapport tevens als proef
schrift te laten verschijnen.
Al mijn collega's, zowel in Petten als in Eindhoven, dank ik voor de
prettige kontakten en diskussies tijdens de afgelopen vier jaren.
Tenslotte wil ik hier ook Peter en Maarten noemen, die me maandenlang
amper zagen omdat pappa zonodig "een boekje moest schrijven", en voor
al Hanneke voor wie ik langzamerhand weinig meer dan een pensiongast
geleken moet hebben.

18 febT'Uari 1949
juni 1967
sept.1967- sept.1973
aug.1972- aug.1973
aug.1973- aug. 1974
aug.1974- aug.1975
aug.1975- dec.1978
- 194 -
Levensbericht
Geboren te Nijmegen
Eindexa;nen Gymnas1:um-s aan het College van
het H. Kruis te Uden
Studie aan de Technische Hogeschool Eindhoven
in de afdeling der Technische Natuurkunde.
Afstudeerwerk onder leiding van Ir. J.P.A.M.
Hijmans in de sectie Fysische Analyse Methoden
onder leiding van Prof.Dr. P. van der Leeden
met als onderwerpen: "Invloed van exchange
interakties op vorm en breedte van ESR-lijnen
in bijna-ééndimensionale systemen" en
"Magnetische ordening en faseovergangen in
antiferromagneten, een literatuurstudie".
Part-time natuurkundeleraar aan het St. Joris
lyceum en Eikenburg te Eindhoven.
Natuurkundeleraar aan de scholengemeenschap
"Theresia" te Tilburg.
Wetenschappelijk medewerker van de T.H. Eind
hoven in de onderwerpgroep magnetisme onder
leiding Van Prof.Dr. P. van der Leeden en
Dr. W.J.M. de Jonge, gedetacheerd bij het
Reactor Centrum Nederland (RCN) te Petten.
Wetenschappelijk medewerker van het Energie
onderzoek Centrum Nederland (vroeger RCN) in
de groep Vaste Stof Fysica onder leiding van
Dr. J. Bergsma.

STELLING~N
t. In hOL bi'kr-i.tieke gebi-E::::d d~t :l.~"I he.t rnaRne.ti::;che f.t.1.tiedL.13r.q,m van
o::.·c:n :-:wt)k (f.nisotrope antl fc~rromagneet optr~edt t<)0d <le t=o a!:i,
kl1nrH~n bikritieke grc)1)t::he(len korrekt w.:..1tdC'.n bC:':pi1~1 d zonder dat
(.h:i.-u:-voor een cxtrc:em g0e(le ori'enta.ti~ v.:.\n ht~t 1r..1g~1etisc~11..': v(~l,~1
i~ vereist.
Dit procfschrift, Hoofdstuk VI.
L. In zwak i:.\0if:'"1trope antifi::1·r0rn.ugn~te1) mas he.t veldgebied w:~ai:
t)vL~r ;::ic:h de overg.:in;; van de antiferromagnoti.$.<:.he f.1se naar
de spin£ l(i11f<).!;1t:! \Ii ts trekt ~ ni.i.:.·t: ~O~)df'-'r nadere analyo12 word('.~1)
r.(JC!f,eSt"'..hreven aan ccn h:umbi n.atie. van demagni:::-tisut i -::~,.,.~~.! rekten
en een inhvmogc~niteit of niet-per£oi::·1~tt~ o·ri.~nt.1tie van het
magt\~1;~!;1~'.h.€! veld.
Dit proefochrdc, HMfdetuk V.
3. In hct llJ:.>trc-:(lt:n \"al.1 c:en intermc..~diuire (a.~e in CoBr,~6{0.480 2 0, 0, 52t1 2o) epelen magnoto~dastische koppeli ngstermen in do
u~,ttii 1. toniann e.e.n e~~lmt i(;le r.'!."ll.
Dit proefschrifc, Hoofd•tuk V.
4. Evenals in caur,-6{0.4BD 2o, 0.52H2o) komL er in CoC1 2 .6H20
(.~i.,·.~i. inte:rmetliaire. fase voor tu.'.;$6n d~~ ;\rH.ifer'r'oma~ne.tische en
de spinflopfa•e.
5. ne vergelijking vart i1ct fnsedi~grnM vsn een ~wak anisotrup~
.antif.:.:•rr.:..1magneet in de buurt van het multikriti~k-t:!. f•u1Lt met de
theoretisc:h voorspeld~ vorm bij een XY nrultikritiek punt i~
rc-:.:d.i~tisc.her dan d1::: vergclijking met de=: voor5r;elling'-!n bij
Ct:~n He1s.,°!nherg multikritiek punc.
A.H. Kine en H. Rohrer, AIP Conf. Proc. 32_, 420 (1976)
R.A. llutera en D.R. RutU•r, .). ilppl. Phys. 49, J]/1/1 (1978)

fl. Hct dooi- Be\1;1;1I'(" i"~~ ;_1),, w.:H.trgenomen k"t""itit=!ke ~~dr';\,g v~p1
l(::i Mil J -xJ·'c xl\ komt n ie t ove :i:'f!.t~11 lli(.' l he.: t dllO't"" Aharony en Fi. :::b1Jl.l1"l
voor.9pe.ld1~ 1:v·dn1g vm1 <Ir.::n systeem w.~.':lrin 1·.w1~i"~ ~~~)l1rl(m rna.gnctio.dH:.'
ionen me.t tep;~np;e~~tclde ~µinani!::iotrapieen (")]1 :.:::r.;1t·i:.:q·j.~d1~~ w~ .. 1z.<.:
~)v~r uq11iva.lente ro~~t~rrl~Jt~ct1 zijn verdeeld.
L. Beva.8.rt? E. f·'r"il-dc.t·i..: ;,:n L.J. de Jonr,h, S'"111d Sr.~1rc.~ C:c)mm.
?5, IOJl (1~7ll) ~o l.. Re"''ltl, l::CN-IB-122.
/\. Ah,1rn11y rn s. l'ishman, Phys. Rev. i.,,ll:. l2_, 1587 (19'16).
7. Ecn korrekte l~t~l);"!.l ir~B v~1r1 de:· 0rdcningstemp1::n·:·1t.11ur 11i1 }fr)~::-:1'.-1ut=!Y
meti11gt~11 i~ i.i~ J;_1;_1gdi.mensionale 1'r1F.t.gi"1.et.i~cl11:~ ~;y~;terncn veels1 on
mo ~~i,'. j, i j le. ,
M..l'.H. ThurlingR 7 E.M. ll~r\dr'i.k~ t'n H.W. de: Wijn,
s,,1 id SL<1tc Comm • .:!_:'._, 12~'1 ( 1 'J78) _
H.Th. le P&.vt~r, !•' .. ,JT v.::m St~enwijk e1"1 R.C. V;l1"l. l'hic~I,
8. Dt.! ko11kll1Si(•!_; dil' Murani afleidt ttil:" ,.Je_ dt)(iJ:' hi:.·m vc.:r:-:c.Lmr..'ld.:.:
ni!11trone1~s tr(ic'1). ln,g~~gcg-cvern; met betrekk i 11p, tot de~ 1...· i. gt·n~.;lrnppc·n
van ~-Mn spin8L1;.::(•n in hi:.::t _ri;i:::bied van klein~ 1mpulsov0r<lr~khl
r.::i..1n aan twi.i f"f!l nnd(:.;r.h(wi;;.
A.P. Mur.mi, H,y,. l!"v- L(•ll. ~' 1406 (1'!78).
\I. I)(> door Sh11lmo11~ t~r ;d _ ~1.~mc:·tt'n Lt'mpcratuuraf.hankelijkheL1 v.-:i.n
clir~ 1~01~kl·nr.-rciati.c tussen de annihilat"it'!:qu~fnrn )11 ~~·-~rm.:miu1'T'I ver
toont een system;1tis1:l1~ ~(wijkir~~ van h~t door h~n herek~nd~
v(:!r'~(Jop, Dt•;=.:;1_' ~twijking ka11 aan.?.:i.~nl1jl:. w1.irdf~1t verkleind dour
in het clon'I' h1~n r:i.~br'1.1dq <:.' mtidc,:,'°l c.,ok de temper.~t11\1rbewep;i1~?: v.~ri
t!t·t kristalrooster on te 111=·!n11:~n.
M_!\_ Sh11l111;lll, G.M. lleardoley en S. Hc,rko, Appl. Pl,y:;. oc• J67 (1975).
10. Tnternat:101~;1)(' w1.,.'-l't'·n-'~' . .'h.t~ppi:!'lijke i:;on.r,resgen w:1arvoor h~~pt1.:1l<.l1""':
meetmethoden of t'!.'.h':\)(~ri1;1c-~;Hi"~l.:.~ t(.~<.:hni;,:lc.t~n al::: thematia~-.:h 1dt
f'/li~)~~1j'11,111l i..,rr.irdi.~n g•::'kozen~ verlie?.el"I 1')111"1. hc-!r;t•l<lrl:;:rccht ~odru d'-'
hl'lrt'ffende methode.n 1~n l,(•c,'.hri,i('l\t'n i::i.jn inrii!htn-gerd.

11. Het verdient aanb0v~1 ing ~l!Jtom.o.ti~c:h !=lc:h.'lkf!lende automobielen
uit veiligh<!'j.d~1.iv~l".'wee;:ine,e.n 11it te ru~ten met een dummy kup""
pt~.1 i.I)?-;!=ll".>f!.d.1.~l.
12. Het is bttrcur~~~WaAr<lig dat het huidige b@~tand v~r' Q"d~rwi.i~
in~tf':1l i1"1.Re.n in Nederland g~en goude ;Jfspif'.g~ling vormt van de
verspreiding van ver~ch i. l li.:."'.rJ.de 1 eve11!=lhe.gchouwinAen onder d.:..'
oud€rs v•~ sc}100J~o~n~le kinderen. Derhalve dient d(i rrain~Ying
en (CP-.cnwerki.np, dl e op diverse plaat!='C!l dour lllkr..ile ~d i"1(lerheids
gtl~i":']".>~ti[)e1~11 wordt ondervonden bij bt't oprj.c:hten v;,Hi. nieuwe
~t.holen~ aktief te word(!"n bc~tredcn.
.,T.A . .J. Rn~ten 20 februari 1979 .


