July 2000 ICHEP 2000, Osaka Results from KTeV • Introduction • The KTeV Detector • Status of analysis • Conclusions E. Blucher, Chicago e KTeV Collaboration: Arizona, Chicago, Colorado, Elmhurst, Fermilab, Osaka, Rice, Rutgers, UCLA, UCSD, Virginia, Wisconsin
Transcript
July 2000 ICHEP 2000, Osaka
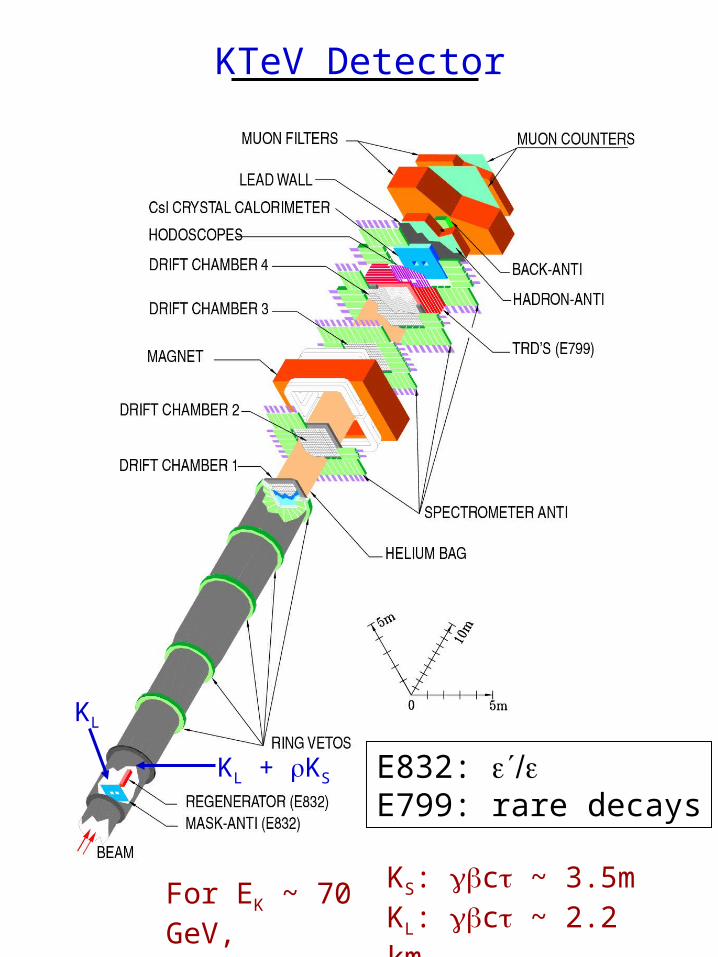
Results from KTeV
• Introduction• The KTeV Detector• Status of analysis• Conclusions
• First result used from 1996 and from first 18 days of 1997 E832 run (1997a).• Current analysis is based on remaining 1997 data -- ~3 larger sample than first result.• 1999 run 1996 + 1997 with better systematics
1997 Reconstructed Mass Distributions(before background subtraction)
( distributions exclude 1997a data used in publication.)
~1.6 MeV
~1.5 MeV
Backgrounds
• Misidentified kaon decays– For K+-: KLe, KL
– For K00: KL000
• Scattered K events– From regenerator and final collimator
Main classes of background:
K00 events
1997 Reconstructed Vertex z Distributions
Acceptance
• Acceptance correction based on detailed Monte Carlo simulation.
• High statistics decay modes (e.g., K e,
K 30) are used to check MC simulation.• Largest systematic error in first result came
from data/MC comparison of z distributions for K +:
1997a K + Data / MC Comparison from first result
+ Data/MC z slope: = 1.6
Total syst. error from K+: = 2.0
Total systematic error: = 2.8
(from first result)
KTeV 1997* Data / Monte Carlo Comparison(preliminary)
* excludes 1997a data used in publication.
KL KLe
KL KL
KTeV 1997 Data / Monte Carlo Comparison(preliminary)
Status of Analysis of 1997 Data
• K: ~ complete; all systematics have been evaluated (current sys. error ~ 2/3 sys. error in first result). Work to reduce systematic error is continuing.
• K : completing systematic studies.
The 1997 analysis has been doneblind. The value of is still hidden.
Stability of Vacuum Beam (KL) / Regenerator Beam (“KS”) Ratio for
• 1997b K data are consistent with 1997a K data used in published result.
• K ratio and are still hidden.
Run periods in 1997b
publ
ishe
d da
ta
rest
of
1997
dat
a
97a 97b 1104
KTeV preliminary
(statistical errors only)
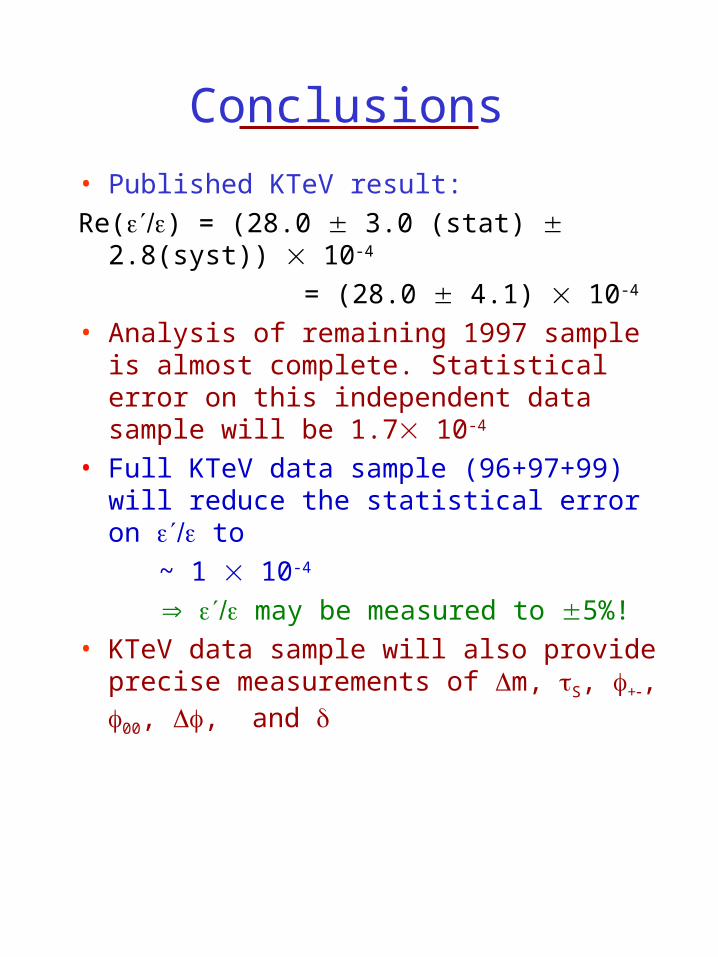
Conclusions
• Published KTeV result:
Re() = (28.0 3.0 (stat) 2.8(syst)) 10-
4
= (28.0 4.1) 10-4
• Analysis of remaining 1997 sample is almost complete. Statistical error on this independent data sample will be 1.7 10-4
• Full KTeV data sample (96+97+99) will reduce the statistical error on to
~ 1 10-4
may be measured to 5%!• KTeV data sample will also provide precise