24
© RightNow Technologies, Inc. CX Analytics: Best Practices in Measuring For Success Nick Lenzmeier, Software Development Manager
| Date post: | 17-Dec-2015 |
| Category: |
Documents |
| Upload: | alvin-mclaughlin |
| View: | 214 times |
| Download: | 2 times |

© RightNow Technologies, Inc.
CX Analytics: Best Practices in Measuring For SuccessNick Lenzmeier, Software Development Manager
2
Learn how to leverage recent enhancements to the RightNow Platform to Measure for Success.
Learn Best Practices for RightNow Analytics as we work through examples in the product.
Target Audience: Users of RightNow Analytics who are familiar with the following topics: tables, columns, filters, joins, expressions.
Session Objectives

3
Custom Objects: Building your own reporting tables.
Custom Attributes: Reporting on parent-child incidents.
Report Table Add-Ins: Reporting on data from external sources.
Business Hours Computations: Reporting on business hour metrics in real time.
Wrap-Up and Q & A
Session Outline
4
Released in November ‘10
Business users now have the ability to create custom schema/objects.
Why it matters in Analytics:
Custom objects have native support within Analytics.
Custom objects can be used to support reporting scenarios that are difficult, if not impossible, to support with the standard tables.
Custom objects can be used to model custom menus, which can then be shared across multiple custom objects.
Custom Objects

5
Objective: Track incident backlog/burn down across product version, agent and time.
Why it’s difficult with standard tables: The stats table tracks incident backlog but only across interface and time.
The transactions table contains the necessary information but a custom script is required to transform the data into the desired format.
How Custom Objects solve the problem: Provide the mechanism to create your own reporting tables.
Custom Object Example

6
RightNow CXBusiness Processes
Custom Object Example - Workflow
Define the Data Model
Define the ETL• Extract
• Transform• Load
Define the Reports
Create the Backlog Custom Object
Create the Daily Backlog Extract
Report
Create the Backlog Reports
(E) Extracts all outstanding
Incidents
(T) Transforms data by rolling up by Account
and Product
(L) Loads Backlog table via Custom
Script/Connect for PHP

7
Goal:
Custom Object Example

8
Best Practices Filters – Use date range filters whenever possible.
Drilldowns – Use drilldowns to allow users to explore the details behind aggregates.
Charts – Use charts to simplify data interpretation.
Trending – Add trend lines to provide insight.
date_group – Use the date_group expression when you need time intervals in your result set that do not contain any data.
Custom Object Example
9
Released in August ‘11.
Similar to custom fields but have the same support as fields in custom objects.
Why it matters in Analytics: Allows users to join from standard tables to other standard tables on custom
attributes.
Allows users to join from one standard table to itself on a custom attribute.
Allows users to re-use menus (both standard and custom) across multiple custom attributes.
Custom Attributes
10
Objective: Easily track duplicate incidents
Why it’s difficult with custom fields: Parent-child relationships could be captured in custom fields but not easily reported
upon. Typically required custom scripts with direct SQL.
How Custom Attributes solve the problem: Parent-child relationships are supported, even self-referencing relationships on
standard tables.
Custom Attributes Example
11
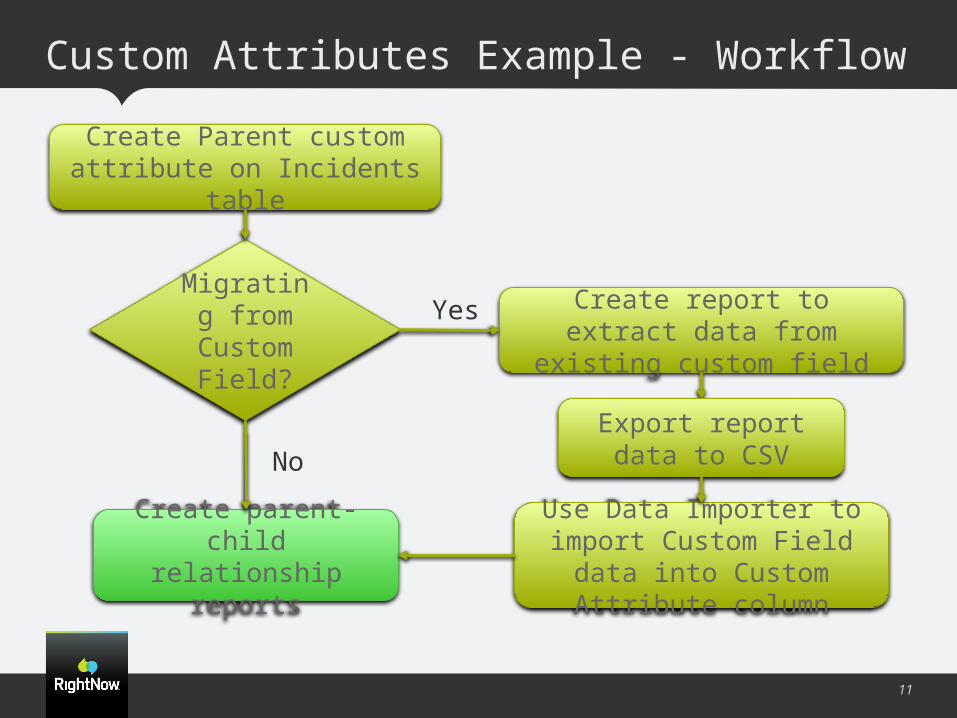
Custom Attributes Example - Workflow
Create Parent custom attribute on Incidents
table
Migrating from
Custom Field?
Create report to extract data from existing custom
field
Use Data Importer to import Custom Field
data into Custom Attribute column
Create parent-child relationship reports
Yes
NoExport report data
to CSV

12
Goal:
Custom Attributes Example
13
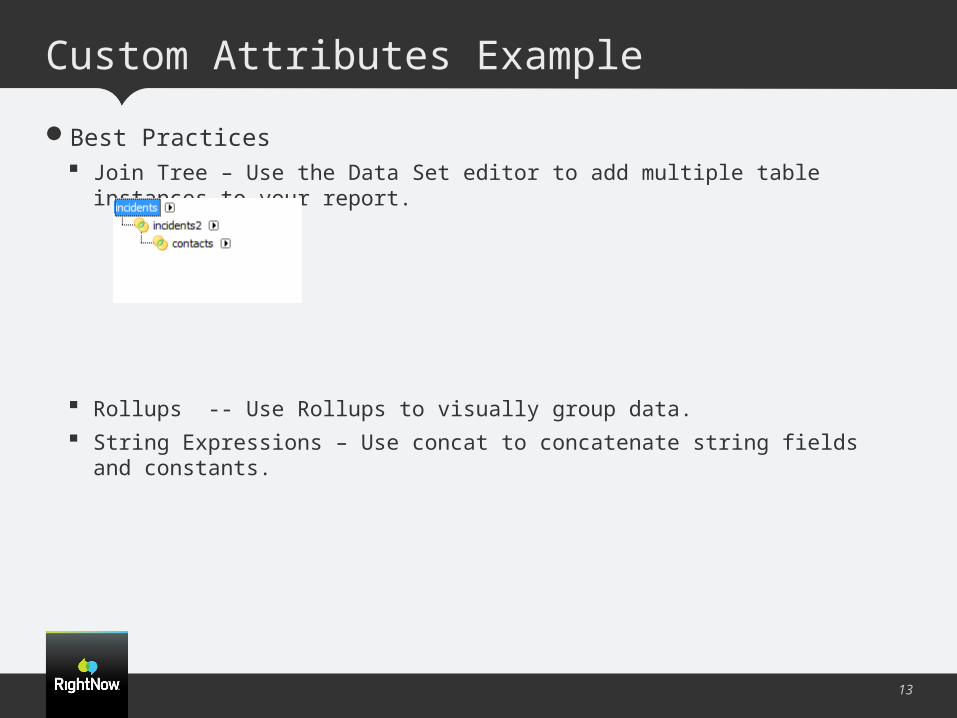
Best Practices Join Tree – Use the Data Set editor to add multiple table instances to your report.
Rollups -- Use Rollups to visually group data.
String Expressions – Use concat to concatenate string fields and constants.
Custom Attributes Example

14
Released in August ‘11
Allows external data sources to be exposed to the product via the Add-In client integration framework.
Why it matters in Analytics: Report Table Add-Ins appear in the data dictionary and have full client-side support
in RightNow Analytics.
Report Table Add-Ins can access data in any format or location the Add-In developer chooses.
Limitations Supported: Charts, conditional formatting, report linking, dashboards, exports, print.
Not Supported: Expressions, joins, exceptions, scheduled reports.
Require development in .NET.
Report Table Add-Ins
15
PCRightNow Hosting
PC
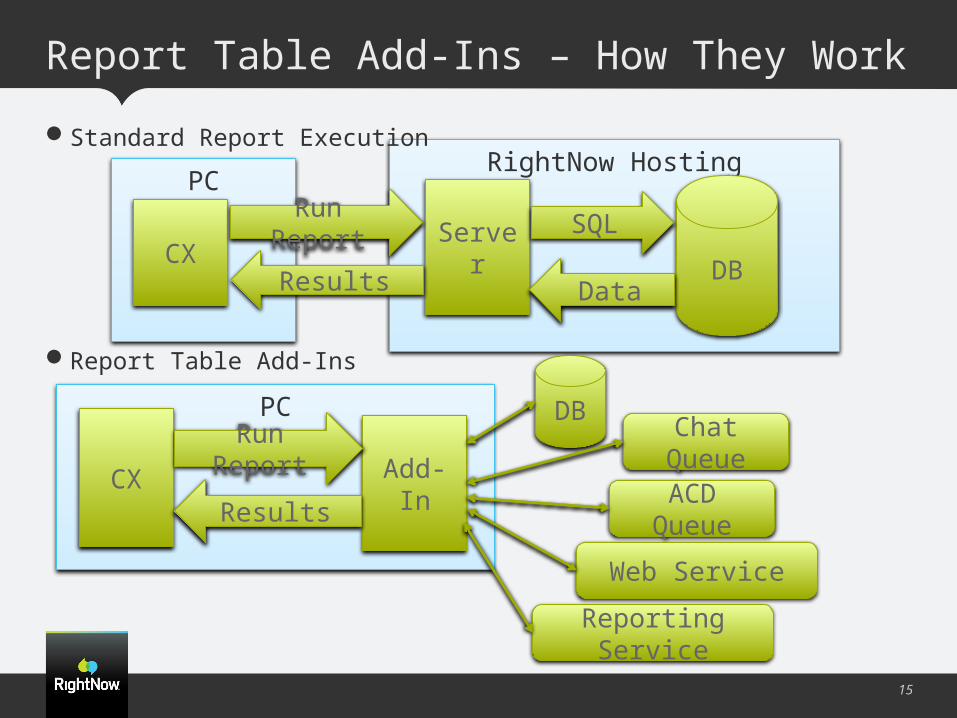
Report Table Add-Ins – How They Work
Standard Report Execution
Report Table Add-Ins
DBCX
Server
Run Report SQL
DataResults
CX
DB
Add-In
Run Report
Results
Chat QueueACD
Queue
Reporting Service
Web Service
16
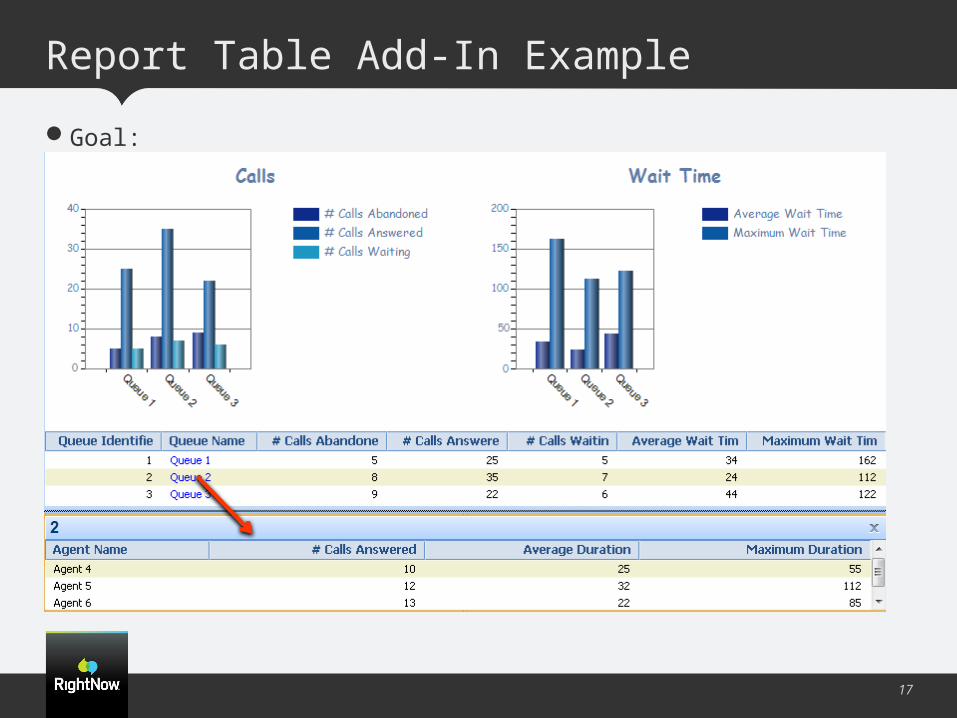
Objective: Provide real-time reporting on ACD queues from within RightNow CX.
Why it’s difficult: Two possible options
- Use a browser control to access a reporting portal. Can be added to a dashboard but no ability to print, export, use standalone.
- Import ACD data into CX custom objects. Lose real-time aspect.
How Report Table Add-Ins solve the problem: Allow for real-time integrations. No need to replicate data.
Reports have same look and feel as other RightNow reports.
Report Table Add-In Example
17
Goal:
Report Table Add-In Example

18
Best Practices Charts – Use automatic layout to quickly layout charts for the best possible
presentation.
Report Linking – Use report linking to drill from one report to another when joins are not available.
Report Table Add-In Example
Queues AgentsReport Link

19
New function provides support for ad hoc relative date computations.
Released in August ’11
Why it matters in Analytics: Previously, relative date computations were only available in cached tables.
Example: inc_performance.rel_time.
The new rel_date_diff function exposes this functionality to any date field in the data dictionary or simple date expression.
Limitations Only available for display.
Not available for complex expressions, filters or exceptions.
Business Hour Computations
20
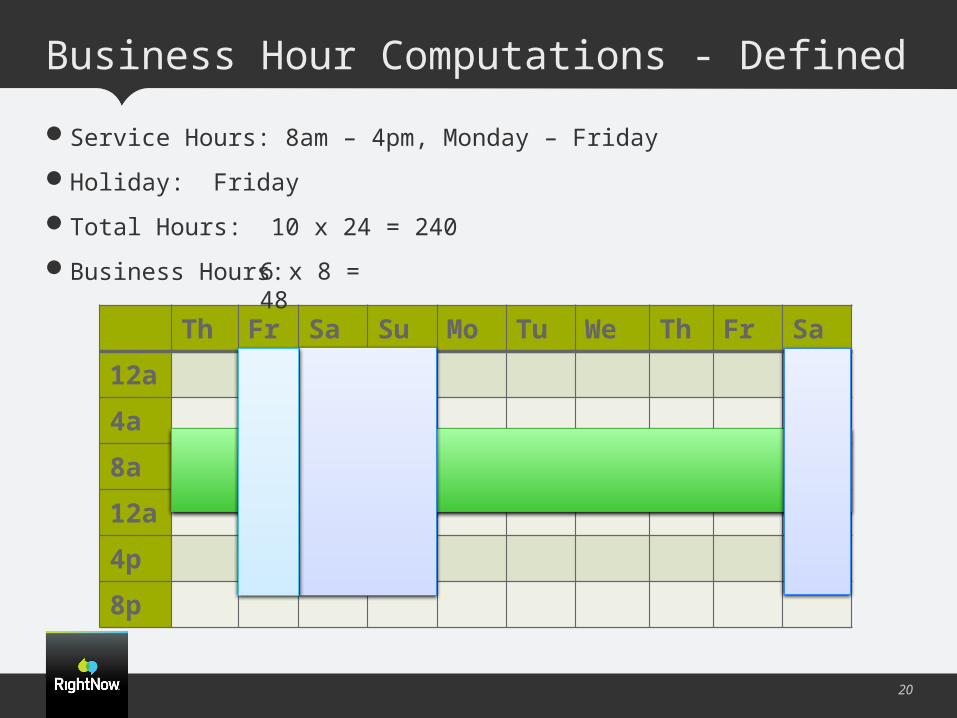
Service Hours: 8am – 4pm, Monday – Friday
Holiday: Friday
Total Hours: 10 x 24 = 240
Business Hours:
Business Hour Computations - Defined
Th Fr Sa Su Mo Tu We Th Fr Sa
12a
4a
8a
12a
4p
8p
6 x 8 = 48

21
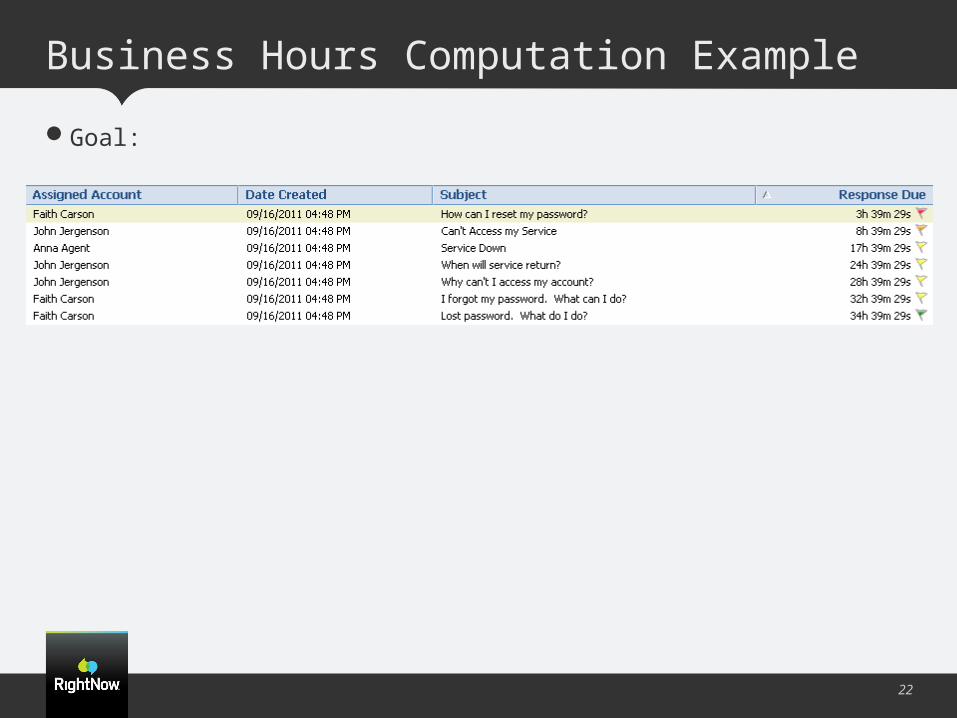
Objective: Create a report that computes the amount of time, in business hours, until an incident response is due.
Why it’s difficult with standard date_diff functionality: Business hour computations need to take into account the working hours, working
days and holidays.
Such computations typically require very complex expressions and/or custom script solutions.
How rel_date_diff solves the problem: Given a response requirement, it computes the difference between two dates in
business hours.
Business Hours Computation Example
22
Goal:
Business Hours Computation Example

23
Best Practices rel_date_diff – Use rel_date_diff to compute date differences in business hours.
Formatting – Use number formatting to properly format a time in seconds column.
Conditional Formatting – Use conditional formatting to give visual cues to your data.
Business Hours Computation Example
24
Upcoming Enhancements November ’11
- Community Reporting
- Actionable Knowledge Foundation Reporting
Q & A
Other Resources Documentation
Community
Training
Professional Services
Thank You!
Wrap-Up


