1.2.4.4 Impacts at 1.5°C warming associated with different pathways ................................ 27 26
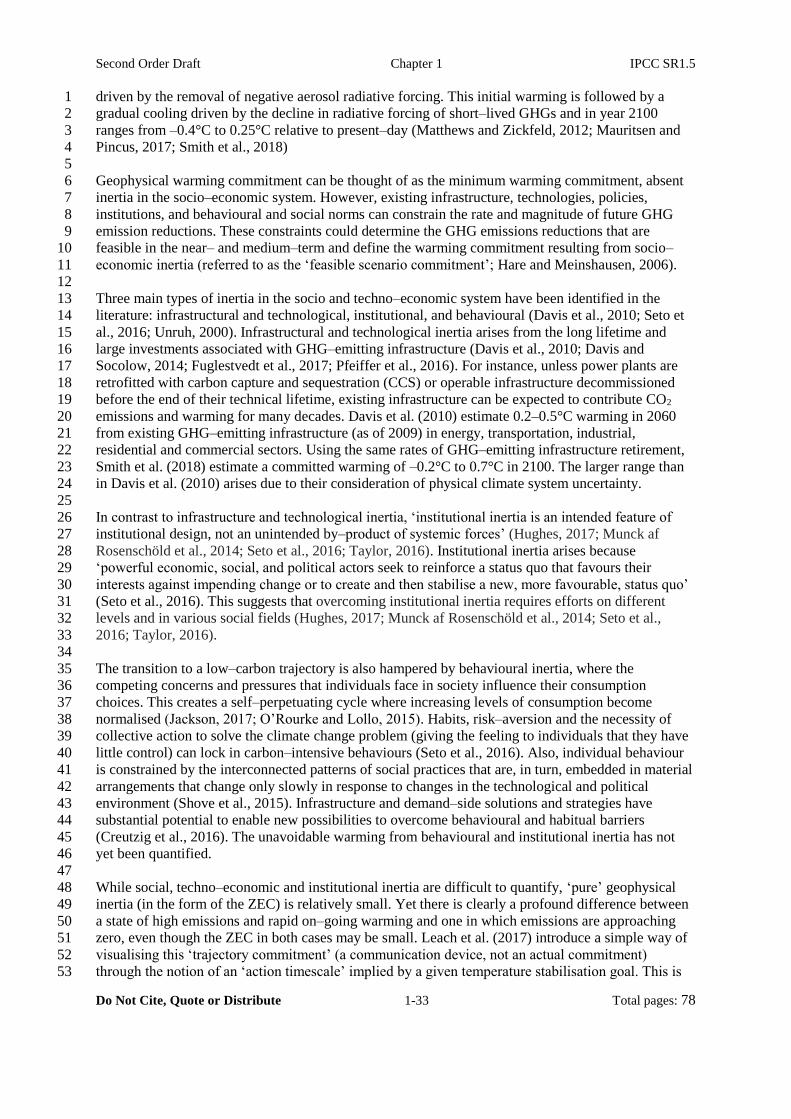
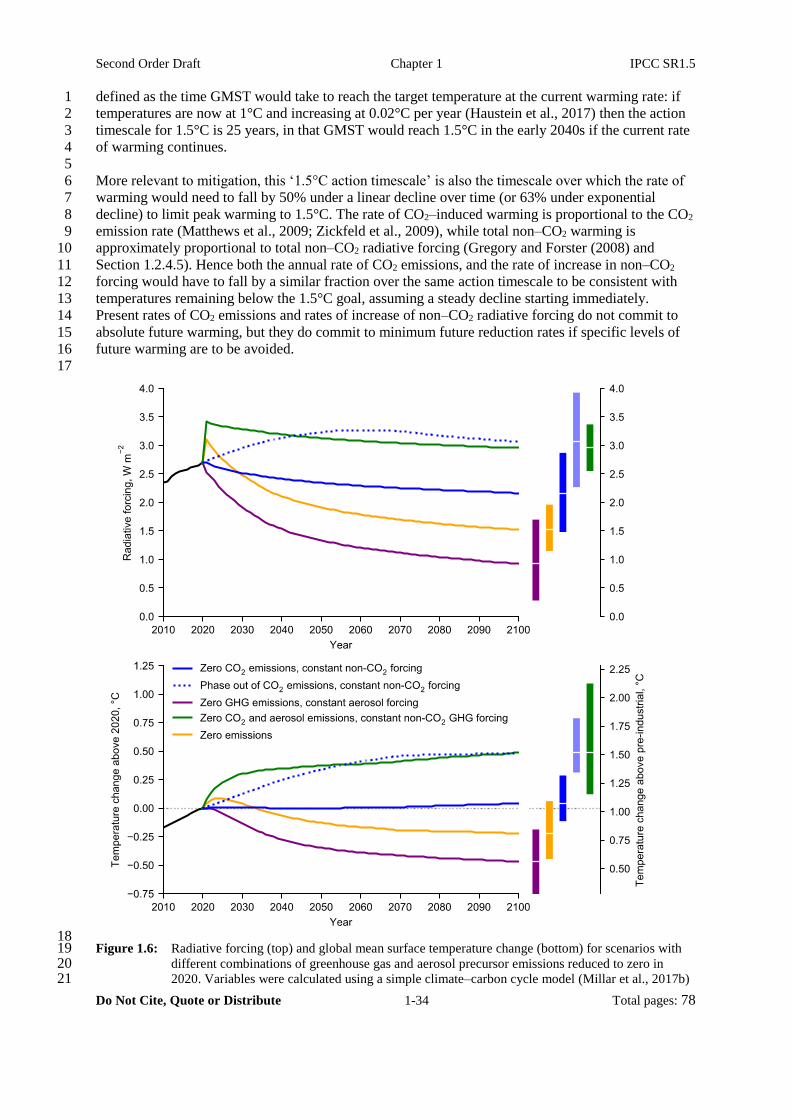
1.2.4.5 Framing cumulative budgets for CO2 and non–CO2 climate forcing using AGWP . 27 27
1.2.5 Definition of ‘balance’ and net zero emissions ............................................................. 28 28
Cross-Chapter Box 1.2: Comparing long–lived and short–lived climate forcers with CO2–29
equivalent emissions metrics in the context of 1.5°C pathways ............... 29 30
1.2.6 Definitions of warming commitment ............................................................................ 32 31
32
Multiple dimensions of impacts at 1.5° C and beyond ..................................................... 35 33
1.3.1 Physical Dimensions of Impacts ................................................................................... 36 34
1.3.1.1 Spatial and temporal distribution of impacts ............................................................ 36 35
1.3.1.2 Implications of 1.5°C for extreme events and associated impacts ............................ 37 36
1.3.1.3 Non–temperature related impacts ............................................................................. 37 37
1.3.1.4 Probability, uncertainty and non–linearity of impacts .............................................. 37 38
1.3.2 Dimensions of Ecosystem Impacts ............................................................................... 38 39
1.3.2.1 Sensitivity of organisms and ecosystems to climate change ..................................... 38 40
1.3.2.2 Drivers of ecosystem impacts ................................................................................... 38 41
Second Order Draft Chapter 1 IPCC SR1.5
Do Not Cite, Quote or Distribute 1-3 Total pages: 78
1.3.2.3 Resilience and irreversibility .................................................................................... 38 1
1.3.2.4 Impacts of climate change mitigation efforts on ecosystems .................................... 39 2
1.3.3 Human dimensions of impacts including vulnerability and adaptive capacity ............. 39 3
4
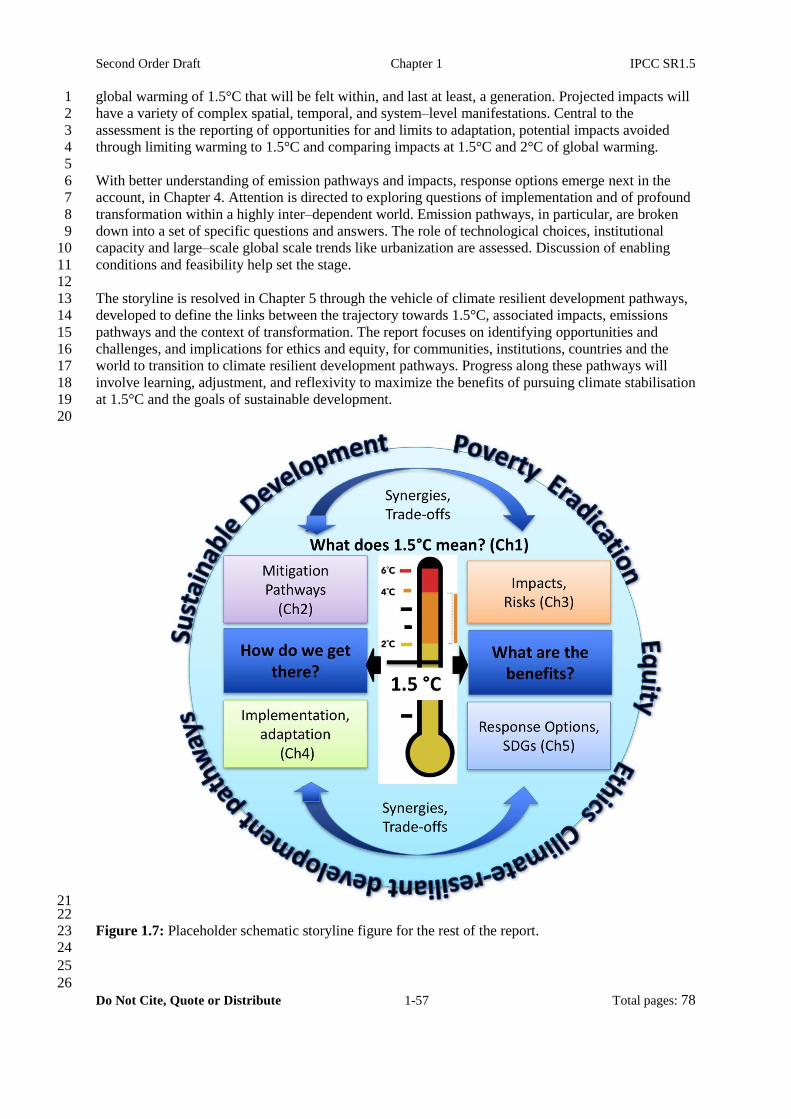
1.5°C in the context of strengthening the global response to the threat of climate change, 5
sustainable development, and efforts to eradicate poverty, with consideration for ethics 6 and equity ............................................................................................................................... 40 7
1.4.1 Equity, rights and responsibilities ................................................................................. 40 8
1.4.2 Eradication of Poverty .................................................................................................. 42 9
1.4.5 Transformation, Transformation Pathways, and Transition .......................................... 44 12
1.4.6 Implementation and policies ......................................................................................... 45 13
Cross-Chapter Box 1.3: Framing feasibility: Key concepts and enabling condition for limiting 14
global temperature increases to 1.5°C ...................................................... 46 15
1.4.7 Trade–offs and synergies of adaptation, mitigation and sustainable development ....... 49 16
Box 1.2: The Sustainable Development Goals (SDGs) ................................................................... 50 17
18
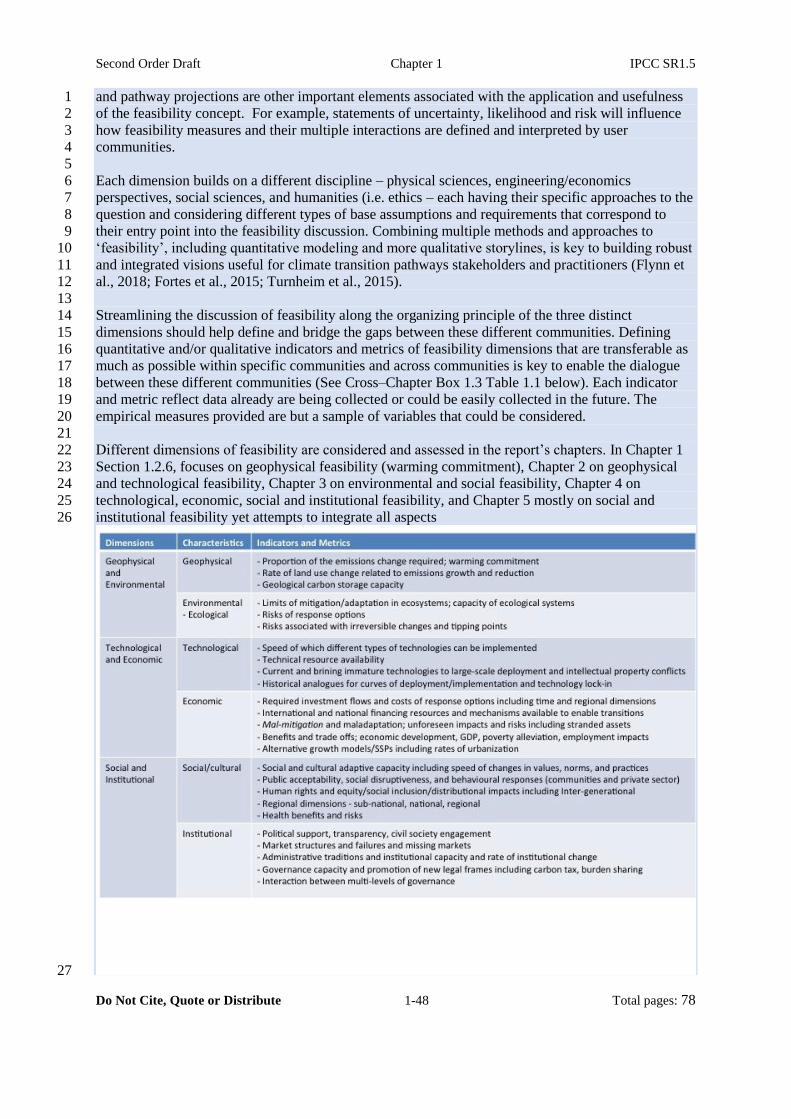
Assessment frameworks and emerging methodologies that integrate climate change 19 mitigation and adaptation with sustainable development .................................................. 51 20
1.5.1 Multidimensional costs and benefits ............................................................................. 51 21
1.5.2 Types of knowledge and evidence used in the report ................................................... 52 22
1.5.3 Climate models and associated simulations available for the present assessment ........ 53 23
1.5.4 Detection and attribution of change in climate and impacted systems ......................... 54 24
25
Consideration and communication of confidence, uncertainty and risk ....................... 54 26
Do Not Cite, Quote or Distribute 1-4 Total pages: 78
1
Executive Summary 2 3
Warming of the climate system is unequivocal and it is extremely likely that anthropogenic 4
greenhouse gas emissions were the dominant cause of the warming observed since the mid-20th-5
century. At COP21 in 2015, UNFCCC parties expressed the ambition in the resulting Paris 6
Agreement to limit the increase in global average temperature above pre-industrial levels to “well 7
below 2°C” and to “pursue efforts” to limit warming to 1.5°C. This opening chapter provides the 8
framing and context of this Special Report on Global Warming of 1.5°C, outlines the structure that 9
subsequent chapters will follow, and introduces the important underpinning definitions and concepts. 10
11
For stabilisation of global temperatures at any level, total net global greenhouse gas emissions, if 12
expressed in terms that give all climate drivers a similar global temperature impact as CO2, 13 must be reduced to zero. CO2 emissions accumulate in the climate system, so warming will continue 14
until anthropogenic CO2 emissions reach net zero, with equivalent reductions in other climate drivers. 15
{1.2} 16
17
Implementation of the current level of Nationally Determined Contributions (NDCs) specified 18
under the Paris Agreement by 2025 or 2030 will not in themselves be sufficient to limit warming 19 to 1.5 °C. Currently-specified NDCs imply stabilisation of global GHG emissions near their current 20
level by 2030 and do not specify total cumulative emissions of long-lived greenhouse gases such as 21
CO2 before these are reduced to net zero. Continued stable CO2 emissions after 2030 would result in 22
indefinite warming. {1.2} 23
24
Current patterns of development and resource consumption, particularly of fossil fuels, present 25 structural impediments to achieving ambitious temperature stabilisation goals. Existing multi-26
level inequalities between regions, including in technology, finance, human capital and governance 27
constrain approaches to address the challenge of limiting global warming to 1.5°C.{1.1; 1.4.1} 28
29
Clarity and transparency is important for the interpretation of the Paris Agreement. 30 Quantifying the increase in global average temperature above pre-industrial levels implies choosing 31
the variables and coverage used to define “increase in global average temperature”; and the reference 32
period used to define “pre-industrial”. This report adopts a working definition of global average 33
temperature at any given time as the average of land surface air and sea surface temperatures over a 34
30-year period centred on that time. This average is corrected for the impact of any short-term natural 35
climate drivers, such as volcanoes, in that 30-year period. The 51-year reference period 1850-1900 is 36
considered representative of pre-industrial conditions, consistent with AR5. Using the datasets 37
assessed in AR5, the decade 2006-2015 is estimated to have been 0.87°C (±0.1°C) warmer than 1850-38
1900, and the best estimate is that all of this warming was human-induced. Hence a warming of 1.5°C 39
relative to pre-industrial conditions corresponds to a warming of 0.63°C (±0.1°C) relative to observed 40
temperatures for the decade 2006-2015. Expressing future changes relative to this more recent decade 41
reduces sensitivity of results to the historical period. {1.2.2} 42
43
Human-induced warming reached approximately 1°C above pre-industrial in 2017, with 44
greater warming already experienced in many regions and seasons. [High confidence] 45 Temperatures were assessed in AR5 to be rising at 0.17°C (±0.07°C) per decade, and hence reached 46
1°C above pre-industrial (0.13°C above 2006-2015) around 2017/18. Temperatures continue to 47
fluctuate naturally on either side of this externally driven warming trend. A large volcanic eruption 48
could cause a temporary cooling of observed global temperatures without affecting the underlying 49
warming as defined in this report. Most land regions are experiencing greater warming than the global 50
average, with annual average warming already exceeding 1.5°C in many regions. Over one quarter of 51
the global population live in regions that have already experienced more than 1.5°C of warming in at 52
least one season.{1.2.2 & 1.2.3} 53
Second Order Draft Chapter 1 IPCC SR1.5
Do Not Cite, Quote or Distribute 1-5 Total pages: 78
1
Past emissions do not commit to substantial future surface warming, but do commit to future 2 sea level rise. If all anthropogenic emissions were reduced to zero immediately, any further warming 3
beyond that already experienced would last at most a decade and be indistinguishable from natural 4
variability over that time. Although a hypothetical scenario, this indicates that future warming 5
depends on future emissions and that substantial warming beyond that which has already been 6
experienced is not geophysically unavoidable. [High confidence] Whether or not this occurs depends 7
on future rates of emission reductions. In contrast, impacts that depend on cumulative warming, such 8
as sea level rise, will continue to intensify even after global emissions are reduced to zero.{1.2.6} 9
10
The cumulative impact of CO2 emissions means that any initial delay in emission reductions 11
requires faster subsequent reductions to meet the same temperature goal, or subsequent active 12 net CO2 removal to reduce temperatures following a temperature overshoot. At the present rate 13
of human-induced warming, global temperatures would reach 1.5°C in the 2040s, or earlier if 14
emissions continue to rise and warming continues to accelerate. [High confidence] To avoid 15
temperatures exceeding 1.5°C, the rate of human-induced warming would need to be reduced, starting 16
immediately, by 50% by the 2040s, and subsequently reduced to zero on a similar timescale 17
thereafter.{1.2.6} 18
19
The concept of pathway provides a valuable conceptual narrative and operational framing for 20 understanding the conditions required to enable limit warming to a 1.5°C. Multiple potential 21
pathways towards the ambition of limiting warming to 1.5°C exist, with different implications for 22
mitigation and impacts. But avoiding exceedance of 1.5°C requires rapid and deep reductions in 23
greenhouse gas emissions. A 50% reduction in the rate of human-induced warming requires halving 24
the annual global emission rate of cumulative greenhouse gases such as CO2, with corresponding 25
reductions in other climate drivers. {1.3/1.2} 26
27
Impacts at 1.5°C in this report refer to the projected impacts when the global mean 28 temperature is 1.5°C above pre-industrial levels. Several regions already experience higher levels 29
of warming and associated impacts. For many regions, an increase in global mean temperature of 30
1.5°C or 2°C also implies substantial increases in the occurrence and/or intensity of some extreme 31
events. Impacts are not all driven by warming. Some are related directly to greenhouse gas 32
concentrations, and some could also result from ambitious efforts to constrain atmospheric 33
greenhouse gas concentrations (e.g. the displacement of land by Bioenergy with Carbon Capture and 34
Storage, or BECCS). Hence impacts at 1.5°C depend on how 1.5°C has been achieved. Finally, the 35
character and severity of impacts depend not only on the hazards (e.g. changes in climate averages 36
and extremes) but also on the vulnerabilities of different communities, and their exposure to climate 37
threats. Adaptive capacity to a 1.5°C warmer world will vary markedly for individual sectors and 38
across sectors such as water supply, public health, infrastructure, ecosystems and food supply.{1.3} 39
40
Many impacts of transient warming passing through 1.5°C would be very different from the 41 impacts if climate stabilised at 1.5°C, or returned to 1.5°C following an overshoot. For example, 42
some ecosystems may not recover after a temperature overshoot. A 1.5°C warmer world will 43
exacerbate other global scale risks such as the degradation of ecosystems, extreme events such as heat 44
waves, reduced food security, increased disease outbreaks, and reduced access to fresh water. The 45
probability of extreme weather and climate events and irreversible changes increases rapidly at higher 46
warming levels. Extreme weather and climate risks that result in resource depletion, conflict and 47
forced migration are impacting economic development worldwide, and warming of 1.5°C or beyond 48
present increased challenges to addressing the Sendai Framework for Disaster Risk Reduction 2015-49
2030. Increased exposure to these hazards and severe inequity in resource distribution, chronic 50
poverty and marginality in many global regions amplifies vulnerability to climate change. Many 51
existing risks specific to rural areas and medium to large size urban areas and cities will be magnified 52
{1.3} 53
Second Order Draft Chapter 1 IPCC SR1.5
Do Not Cite, Quote or Distribute 1-6 Total pages: 78
1
Links, synergies and trade-offs between mitigation, adaptation and sustainable development, as 2
well as the different dimensions of feasibility, are critical to understanding climate resilient 3 development pathways to limiting global warming to 1.5°C. The connections between limiting 4
global warming to 1.5°C and ambitions of sustainable development are societally and spatially 5
complex and multifaceted. Such connections can be synergistic or involve trade-offs and are best 6
understood holistically, recognising how all aspects of life on Earth are impacted by human decisions 7
in the Anthropocene. AR5 noted that climate change constitutes a moderate threat to current 8
sustainable development and a severe threat to future sustainable development. AR5 also concluded 9
that ill-designed responses could offset already achieved gains. However, important synergies exist 10
between achieving the UN Sustainable Development Goals (SDGs) and climate responses. Positive 11
synergies between mitigation, adaptation and sustainable development can be presented within the 12
narrative of climate resilient development pathways of both rural areas and cities. Feasibility is 13
considered in this report as the systems-level capacity to achieve a specific goal or target. A complete 14
vision of feasibility requires integration of natural system considerations into human system 15
scenarios, the placement of technical transformations into their political, social, and institutional 16
context, and an indication that feasibility is dynamic across spatial, social and temporal scales.{1.4.5; 17
1.4.6; 1.4.7} 18 19
Climatic variability and climate change may exacerbate poverty, particularly in countries and 20 regions where poverty levels are high. Modest changes in rainfall and temperature patterns can push 21
marginalized people into poverty, as they lack the means to recover from shocks. Changes in the 22
frequency of extreme events in an 1.5°C warmer world especially when occurring in a series, plus 23
increased exposure, can significantly erode poor people’s already limited resources and adaptation 24
and mitigation capacity, and further undermine their livelihoods in terms of economic assets, housing, 25
infrastructure, and social networks.{1.4.2} 26
27
Recognising that the impacts of climate change for warming levels beyond 1.5°C and associated 28
response to these impacts could fall disproportionately on the poor and vulnerable, ethics and 29 equity are essential elements of this assessment. Equity—informed by ethics—offers a useful 30
organizing framework for understanding the asymmetry between the distributions of opportunities, 31
benefits and costs in relation to climate change, among present and future generations. Three key 32
points of connection between climate change and equity are associated with the conditions under 33
which a 1.5°C warmer world can be achieved: asymmetry in the contributions to the problem; 34
asymmetry in impacts and vulnerability, such that the worst impacts may fall on those that are least 35
responsible for the problem, including future generations; and asymmetry in the power to decide and 36
implement solutions and response strategies. Mitigation and adaptation options also have potentially 37
profound implications for equity, especially if framed without considerations of the complex local-38
national to regional linkages and feedbacks in socio-ecological and socio-economic systems.{1.4.1} 39
40
Limiting global warming to 1.5°C is associated with an opportunity for innovative global, 41
national and subnational governance, enhancing adaptation and mitigation within the 42 framework of sustainable development, poverty eradication, ethics and equity. Work on adaptive 43
and flexible governance systems and policy experimentation can provide key insights on decoupling 44
economic growth from greenhouse gas emissions. Significant governance challenges include the 45
ability to incorporate multiple stakeholder perspectives in the decision-making process to reach 46
meaningful and equitable decisions; interaction across scales and coordination between the different 47
levels of government, NGOs, Congressional Budget Offices, academia and the private sector; and the 48
capacity to raise financing, and support for technological and human resource development for such 49
actions. Governance capacity includes the wide range of activities and efforts needed to develop 50
coordinated climate mitigation and adaptation strategies in the context of sustainable development 51
taking into account equity, ethics and poverty eradication.{1.4} 52
53
Second Order Draft Chapter 1 IPCC SR1.5
Do Not Cite, Quote or Distribute 1-7 Total pages: 78
Transitioning from climate change mitigation planning to practical implementation is a major 1 challenge in constraining global temperature to 1.5°C. Barriers which also apply to adaptation 2
include finance, education and new innovative knowledge, information, technology, public attitudes, 3
social values, and practices, and human resource constraints, plus institutional capacity to strategically 4
deploy resources. Regional diversity, including highly fossil-fuel-invested and emerging economies, 5
is an important consideration in a limiting global temperature to 1.5°C. Incorporating strong linkages 6
across sectors, devolution of power and resources to sub-national and local governments, especially 7
within cities and areas rapidly urbanizing, with the support of national government and facilitating 8
partnerships among public, civic, private sectors and education institutions are key to implementing 9
identified response options.{1.4} 10
11
A diverse set of state-of-the-art assessment methodologies provides enhanced capacity to 12 understand and specify potential conditions of a 1.5°C warmer world. Incorporating knowledge 13
from different sources, as well as educating and building awareness at various levels could provide for 14
informed decision making to implement context-specific responses to 1.5°C of warming, and the 15
associated uncertainties. Reliable climate data is insufficient in many areas, especially in low-income 16
countries. Instrument data along with indigenous and local knowledge and experience are both critical 17
for verifying climate models and for evaluating climate change scenarios for 1.5°C warming. Cost-18
benefit analyses are by themselves insufficient for assessing a 1.5°C world. Costs and benefits can 19
occur at very different times, even across different centuries for different regions, and often cannot 20
completely describe unpredictable feedback loops and impacts for other regions.{1.5} 21
22
23
24
Second Order Draft Chapter 1 IPCC SR1.5
Do Not Cite, Quote or Distribute 1-8 Total pages: 78
Building a knowledge base for a 1.5°C World 1
2
Previous Intergovernmental Panel on Climate Change (IPCC) reports have explicitly demonstrated 3
evidence of human interference in the climate system. The IPCC Fifth Assessment Report (AR5) 4
found that the average global surface temperature has reached approximately 1°C above pre–5
industrial levels (IPCC, 2013), and monthly average temperatures of 1.4°C above these same levels 6
have been observed. The warming to date has generated observable impacts world–wide, and acts as 7
an amplifier of risks for natural and human systems (see Chapter 3 of this report). It is this rising risk 8
that underpins the ambition of the Paris COP21 agreement, to ‘pursue efforts to limit’ the rise in 9
global temperatures to 1.5°C above pre–industrial levels in the context of sustainable development 10
and poverty eradication (see Box 1.1 on the Anthropocene). 11
12
The present report assesses the enabling conditions and challenges to limit the rise in global 13
temperatures to 1.5°C above pre–industrial levels, and the effects and impacts of a 1.5°C warmer 14
world. The report considers the potential global response to this challenge within the context of 15
achieving sustainable development and poverty eradication while addressing the long–standing ethical 16
dilemmas posed by climate change, with particular reference to the United Nations Framework 17
Convention on Climate Change (UNFCCC) notion of equity. While economic growth has been 18
accompanied by increased life expectancy, educational attainment and income, many regions are 19
characterised by severe inequity in income distribution that amplifies vulnerability to climate change. 20
The world population continues to rise and is projected to reach 9.7 billion by 2050 (UN, 2015), with 21
much of this growth occurring in hazard–prone small and medium sized cities in vulnerable low and 22
moderate–income countries (Birkmann et al., 2016). 23
24
The spread of material consumption with rising incomes and changing lifestyles is a major driver of 25
global resource use, environmental degradation and pollution, and a contributor to rising greenhouse 26
gas (GHG) emissions (Fleurbaey et al., 2014b). These profound global–scale changes currently 27
underway explain the recognition that we now live in a new era, the ‘Anthropocene’, in which human 28
influence is the principal agent of change on the planet (see Box 1.1 on the Anthropocene). Climate 29
change is one among numerous other global-scale human imprints such as large scale conversion of 30
Earth’s land surface from forest and grassland to croplands, grazing lands and cities; significant 31
biodiversity loss; changes in the global phosphorus and nitrogen cycles; ocean acidification; and sea 32
level rise characteristic of the Anthropocene. 33
34
The present report provides an assessment of current knowledge of the extent and interlinkages of the 35
global environmental, economic, financial, social and technical conditions that a 1.5°C warming 36
world represents. Complex ethics questions arise in that both climate change and any potential 37
responses to it that exacerbate poverty and inequality, globally and locally, and carry implications for 38
inter–generational justice. This set of conditions demands interdisciplinary research and reflection, 39
pointing to a systems approach that takes into account social inequalities and the unequal distribution 40
of both, risks in exposure, and ability to respond, to climate change (Bäckstrand et al., 2017; Dryzek, 41
2016; Lövbrand et al., 2017; Pattberg and Zelli, 2016). 42
43
44
1.1.1 Pathways, Impacts, and Sustainable Development 45
46
Limiting global warming to 1.5°C will require substantial societal and technological transformations. 47
This assessment builds on previous IPCC assessments to provide a range of pathways, including 48
implementation strategies to understand the enabling conditions required for such a transformation. 49
These pathways and connected strategies are framed operationally within the context of the United 50
Nations 2030 Agenda for Sustainable Development and conceptually within the Anthropocene. Ways 51
to alter or slow the pace of current warming are illustrated through mitigation pathways (see Chapter 52
2 of this report). The enabling conditions required for achieving the 1.5°C warming include a range of 53
Second Order Draft Chapter 1 IPCC SR1.5
Do Not Cite, Quote or Distribute 1-9 Total pages: 78
geo–physical, technological, and socio–economic dimensions of feasibility (described in Cross–1
Chapter Box 1.3). Limiting warming to 1.5°C also involves identifying advantageous technology and 2
policy levers with which it may be possible to accelerate the pace of transformation (see Chapter 4 of 3
this report). Some pathways are more consistent than others with the requirements for sustainable 4
development (see Chapter 5 of this report). 5
6
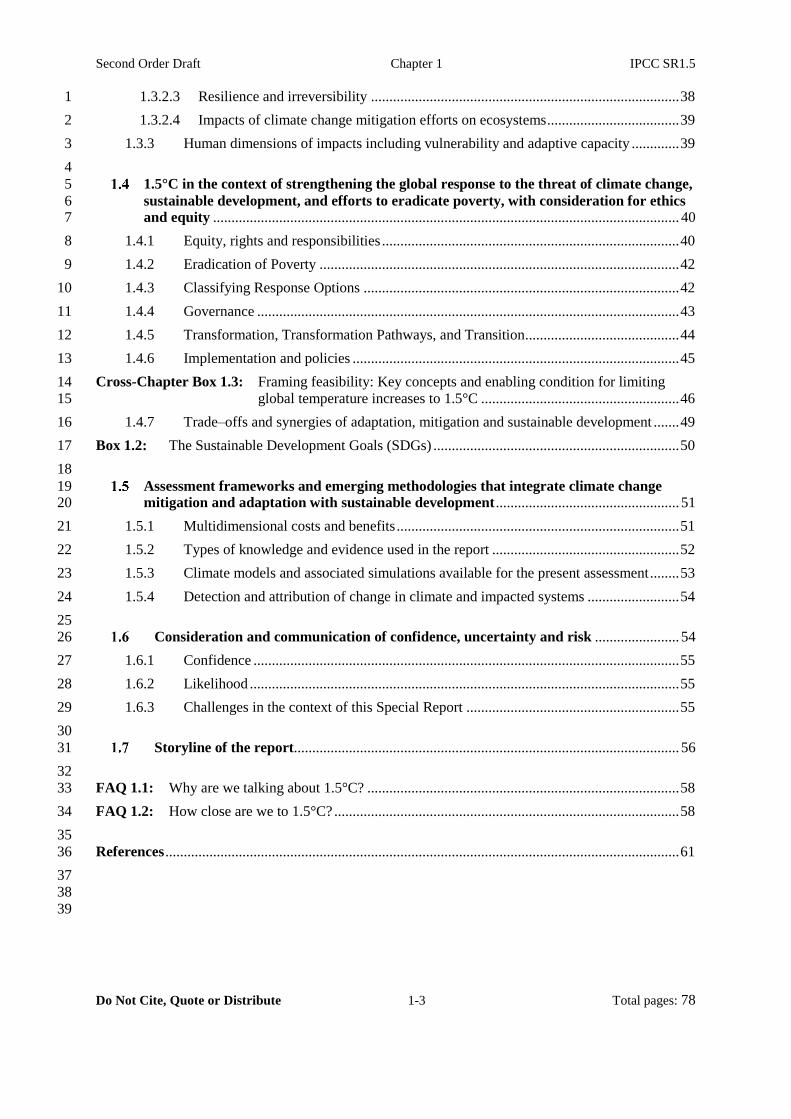
Temperature rise to date already has resulted in profound alterations to human and natural systems, 7
bringing new risks for human well–being and economic development (IPCC, 2014a; Chapter 3 of this 8
report). Many regions of the world have experienced local warming above 1.5°C already (see 9
Figure 1.1 and Chapter 3 Section 3.3.1). Increases in extreme weather events, droughts, floods, sea 10
level rise and biodiversity loss are already affecting economic development worldwide and present a 11
challenge to addressing the Sendai Framework for Disaster Risk Reduction (Mysiak et al., 2016; 12
Chapter 3 Section 3.4). Most affected people live in low and middle income countries, some of which 13
have already experienced decline in food security, linked in turn to rising migration and poverty. 14
Small islands and populations residing in megacities, coastal regions and in high mountain ranges are 15
among the most affected (Albert et al., 2017). 16
17
18 Figure 1.1: Realised experience of present–day warming. Colours externally–forced warming in over the over 19
2006–2015 relative to 1850–1900 for the most strongly warming season at any location using the 20 GISTEMP dataset (Hansen et al., 2010b). The density of dots indicates the population (2010) in 21 any 1°x1° grid box. Warming trends are calculated in an identical way to Figure 1.3. The underlay 22 shows SDG Global Index Score ranks at a country level indicating performance across 17 23 sustainable development goals. White indicates missing data. The histogram shows the 24 distribution of warming shown on the map. See Technical Annex of this chapter for further 25 details. 26
27
The feasibility of any global commitment to a 1.5°C pathway depends, in part, on the nationally 28
determined contributions (NDCs), committing nation states to specific GHG emission reductions. The 29
current NDCs are not ambitious enough to secure the 1.5°C warmer world and are instead tracking 30
toward a warming of 3–4°C above preindustrial temperatures by 2100, with the potential for further 31
Second Order Draft Chapter 1 IPCC SR1.5
Do Not Cite, Quote or Distribute 1-10 Total pages: 78
warming thereafter (Rogelj et al., 2016; UNFCCC, 2016). The analysis of pathways in this report 1
reveals opportunities for greater decoupling of economic growth from the rate of GHG emissions. 2
Movement toward 1.5°C requires an acceleration of this trend. Integrated reflexive policy institutions 3
capable of operating at multiple scales (from local to regional and international) will be essential to 4
affect the far–reaching policy change required to bring about reductions in GHGs consistent with a 5
1.5°C warmer world, while simultaneously strengthening global responses to poverty and addressing 6
associated emerging ethics and equity issues (Bäckstrand et al., 2017; Dryzek and Pickering, 2017; 7
Lövbrand et al., 2017). 8
9
AR5 (IPCC, 2014b) concluded that climate change constrains possible development paths, that 10
synergies and trade–offs exist between climate responses and socio–economic contexts, that 11
capacities for effective climate responses overlap with capacities for sustainable development, and 12
that existing societal patterns (e.g., overconsumption) are intrinsically unsustainable (Fleurbaey et al., 13
2014b). As a result, attempts to limit warming to 1.5°C , while at the same time reducing poverty, will 14
benefit from attentiveness to the Anthropocene narrative on the unprecedented social–ecological and 15
technical change with differential impacts and risks that give rise to the need for a sustainable 16
development framework (Delanty and Mota, 2017) (Box 1.1 on the Anthropocene). A fuller 17
understanding of 1.5°C related impacts, risks, and actions comes from a variety of established or 18
emergent knowledge bases that are also critical to fully realise the conditions for strengthening of the 19
sustainable development agenda (Olsson et al., 2017). 20
21
In this assessment, the definition of sustainable development, rooted in the 1987 report Our Common 22
Future, includes ‘… development that meets the needs of the present without compromising the 23
ability of future generations to meet their own needs’ (WCED, 1987). The recent UN Sustainable 24
Development Goals (SDGs) are an interlinked network of targets that are crucial to addressing the 25
interconnected challenges of advancing human wellbeing. Building on the successes and limitations 26
of the Millennium Development Goals, the SDGs acknowledge more integrated systems and lend 27
themselves to inclusive implementation and policy integration across sectors. 28
29
SDG13 specifically requires ‘urgent action to address climate change and its impacts’, but most if not 30
all of the 17 SDGs are directly relevant to climate action. They include, for example, ending poverty 31
and hunger, reducing inequality, making cities resilient and sustainable, encouraging sustainable 32
consumption and production, making energy affordable and clean, promoting ‘decent work’ and 33
conserving biodiversity on land and sea (UN General Assembly, 2015). The SDGs require that the 34
achievement of targets be assessed through suitable indicators periodically at global conferences, 35
offering a useful forum in which to monitor and promote efforts to manage climate change 36
sustainably in the context of other global challenges. 37
38
The interdependence of SDGs resonates strongly with the AR5 findings that climate change amplifies 39
conditions of poverty and inequality. SDGs have a strong focus on equity and environment and apply 40
to all countries as global goals (see Box 5.1). Nevertheless, how to achieve these aspirations alongside 41
the transitions needed to secure a 1.5°C warming world are associated with innovative planning 42
efforts. The new approach signalled by the Paris Agreement does not leave mitigation entirely to 43
bottom–up efforts or top–down directives. Instead, voluntary country pledges are embedded in ‘an 44
international system of climate accountability and a “ratchet” mechanism’ (Falkner, 2016), 45
encouraging actions also by non–state actors such sub–national entities including cities (Morgan and 46
Northrop, 2017). This extends to the efforts by citizens where individuals take measures to reduce 47
their personal emissions in order to lobby for structural changes through legislative and regulatory 48
measures within their jurisdictions. Limiting the rise in global temperatures to 1.5°C while meeting 49
the ambition of the SDGs will be associated with enabling conditions to adjust current lifestyles, 50
development trajectories, and economic systems, and exploring new ways of facilitating social 51
investment, reducing inequality and deliver ecological and financial stability (Jackson, 2017). 52
53
Second Order Draft Chapter 1 IPCC SR1.5
Do Not Cite, Quote or Distribute 1-11 Total pages: 78
1
1.1.2 Equity and Ethics Framing for a 1.5°C Warming World 2
3
The aspiration to stay within a 1.5°C target raises ethical concerns that have long been central to the 4
climate debate. The UNFCCC process has been guided by ethical consideration articulated in 5
particular through the principle of equity (Kolstad et al., 2014). Article 3 of the UNFCCC establishes 6
that Parties should ‘protect the climate system … on the basis of equity’ and Article 2 of the Paris 7
Agreement likewise provides that it ‘will be implemented to reflect equity… in the light of different 8
national circumstances’. Further, the Paris Agreement Article 4 calls for ‘rapid reductions’ of 9
greenhouse gases to be achieved ‘on the basis of equity, and in the context of sustainable development 10
and efforts to eradicate poverty’. While Article 14 requires that the ‘global stocktake’ be undertaken 11
‘in light of equity and the best available science’. All of these articles place ‘equity’ in the context of 12
the relative distribution of the burdens of climate action between different countries. 13
14
These considerations of ethics and equity have been most recently articulated in questions of human 15
rights (Adger et al., 2014; Caney, 2010; Fleurbaey et al., 2014b; Humphreys, 2010; IBA, 2014; Knox, 16
2015; OHCHR, 2009). How, for example, will an average global temperature rise of 1.5°C impact 17
upon human rights especially of the already vulnerable persons, including their rights to water, 18
shelter, food, health and life? How will it affect the rights of the urban and rural poor, indigenous 19
communities, women, children, the elderly and people with disabilities? How will mitigation efforts 20
to meet the 1.5°C target in low and middle income countries affect human development and 21
wellbeing? (Caney, 2010). 22
23
This report will examine whether and how failure to limit warming to 1.5°C will result in further 24
human rights consequences. It assesses at the degree to which the gap between 1.5°C and 2°C 25
amounts to a greater likelihood of drought, flooding, resource depletion, conflict and forced 26
migration, each affecting individuals’ human rights in many parts of the world and with a potential to 27
negatively affect the global economy (See Chapter 3) (Adger et al., 2014; Campbell et al., 2016; FAO 28
et al., 2015; OHCHR, 2009). The report will also examine whether mitigation and adaptation policies 29
have potentially profound human rights implications of their own, especially if framed without 30
considerations of the complex local–national to regional interlinkages and feedback loops in social–31
ecological systems (Dryzek and Pickering, 2017; Knox, 2015; UNHRC, 2016). 32
33
1.1.3 Report Structure 34
35
The thrust of this report is to assess enabling conditions for the global community, within the context 36
of the Sustainable Development Goals (SDGs), to limit the global temperature increase to 1.5°C 37
above pre–industrial levels and address adaptation to the associated impacts inclusive of poverty 38
eradication, equity and ethics issues. The report consists of five chapters and a summary for policy 39
makers. It also includes a set of boxes to elucidate specific or cross–cutting themes, frequently asked 40
questions for each chapter and a glossary. 41
42
Chapter 1, on “framing and context” has seven major sections that are linked to the remaining four 43
chapters forming the body of the report. The introduction section of Chapter 1 serves to situate the 44
assessment within social–ecological systems in the context the Anthropocene. It points to the central 45
role of governance in constraining global temperatures to 1.5°C warming and responding to 46
associated impacts within the sustainable development framework. The next section focuses on 47
understanding 1.5°C, global versus regional warming and linkages to 1.5°C –consistent pathways and 48
associated emissions, further developed in Chapter 2. The section on multiple dimensions of impacts 49
at 1.5°C opens the way to Chapter 3 on impacts of 1.5°C global warming on natural and human 50
systems, and coupled social–ecological systems. While the section on strengthening the global 51
response to the threat of climate change is the basis for Chapters 4 and 5 and, respectively, cover 52
implementing the global response to the threat of climate change, and sustainable development, 53
Second Order Draft Chapter 1 IPCC SR1.5
Do Not Cite, Quote or Distribute 1-12 Total pages: 78
poverty eradication and reducing inequalities in the context of 1.5°C global warming. Chapter 1 also 1
provides a framing on assessment methods used in the report and approaches to communicating 2
confidence, uncertainty and risk. 3
4
The report flows from this initial framing to Chapter 2 and ‘how 1.5°C global warming could be 5
achieved’, where greenhouse gas emissions consistent with warming of 1.5°C and characterizing 6
mitigation and development pathways that are compatible with a 1.5°C world are covered. Chapter 2 7
also assesses technological, environmental, institutional and socio–economic opportunities and 8
challenges related to 1.5°C pathways and builds upon the IPCC AR5 WGII work with an emphasis on 9
sustainable development in mitigation pathways. Responding to the Chapter 2 assessment, impacts 10
and risks of 1.5°C global warming on social–ecological systems are assessed in Chapter 3. This third 11
chapter is focused on observed and attributable global and regional climate changes and impacts, 12
vulnerabilities and the adaptation experiences to key global and regional impacts and risks at 1.5°C. It 13
links adaptation potential and limits to adaptive capacity. Avoided impacts and reduced risks at 1.5°C 14
are compared with 2°C and comparative higher levels of warming. The assessment of system level 15
conditions such as timeframes, slow versus fast onset impacts, irreversibility and tipping points are 16
included. 17
18
Chapters 4 and 5 focus on development–linked solutions and implications for the near term and 19
longer term. Chapter 4 considers the costs and benefits of 1.5°C warming, synergies, trade–offs and 20
an integration of adaptation–mitigation–development, and addresses governance approaches and 21
implementation strategies cognizant of equity and justice. The chapter has a section on case studies 22
for implementation of adaptation and mitigation options at different scales and circumstances, and 23
lessons learned that will be valuable to strengthening the global response to climate change. Chapter 5 24
covers linkages between achieving the SDGs and 1.5°C. Positive and unintended effects of adaptation 25
and mitigation response measures and pathways for a 1.5°C warmer world are examined, with 26
implications for sustainable development, poverty eradication, and reducing inequalities, as well as 27
for the SDGs. The chapter discusses opportunities and challenges for climate–resilient development 28
pathways, supported through emerging evidence from case studies from national to community scales. 29
30
Box 1.1: The Anthropocene as Framing 31
32
Introduction 33 The concept of the Anthropocene and the aspiration of the Paris Agreement are linked. The 34
Anthropocene expresses empirical evidence that human impacts on the Earth System have become so 35
large they led to a proposal that the Earth has entered a different geological epoch, the Anthropocene 36
(Crutzen, 2002; Crutzen and Stoermer, 2000; Gradstein et al., 2012). Abundant observational data of 37
this transition exists (Steffen et al., 2016; Waters et al., 2016), among which contemporary rates of 38
change are very fast compared to previous abrupt shifts in Earth’s climate. The rate of CO2 increase, 39
currently at about 20 ppm per decade, is 100 times faster than any sustained rise in CO2 during the 40
past 800,000 years (Wolff, 2011) and at least an order of magnitude greater than the rates observed in 41
short bursts during the last deglaciation (Marcott et al., 2014; Rhodes et al., 2017). While global 42
average surface temperature is now rising at a rate 170 times faster than the average rate of change 43
since the mid–Holocene (ca. 7,000 years BP) (Marcott et al., 2013). 44
45
The physical dimensions of the Anthropocene and 1.5°C global warming 46 Although the process of formal adoption of the Anthropocene proposal is still subject to debate 47
(Zalasiewicz et al., 2017), a strong majority of the Anthropocene Working Group (AWG) by the Sub–48
Committee on Quaternary Stratigraphy of the International Commission on Stratigraphy have agreed 49
that (i) the Anthropocene is real from a geological perspective; (ii) it should be formalized as an 50
epoch and included in the Geological Time Scale, following the Holocene; and that (iii) a mid–20th 51
century beginning of the Anthropocene is most appropriate. Markers in the stratigraphic record 52
include an array of novel manufactured materials of human origin, such as aluminium, concrete and 53
Second Order Draft Chapter 1 IPCC SR1.5
Do Not Cite, Quote or Distribute 1-13 Total pages: 78
plastics; particulates from fossil fuel combustion; radionuclides from the fallout of nuclear tests; and 1
others leading to the conclusion that “these combined signals render the Anthropocene 2
stratigraphically distinct from the Holocene and earlier epochs” (Waters et al., 2016). The literature 3
on the Anthropocene has expanded rapidly beyond the geological science to other earth system 4
sciences, the social sciences and humanities. Increasingly, social science and humanities literature 5
show that the Anthropocene provides a framing to understand pathways through which society could 6
pursue equitable, innovative and responsible approaches for a warming planet. 7
8
The underlying narrative of recent IPCC reports and the Paris Agreement embody the intent behind 9
the Anthropocene. Human action is driving global change and that human action can be consciously 10
applied to address this rate of change. The ambition of the Paris Accord to ‘pursue efforts to limit’ the 11
rise in global temperatures to 1.5°C above pre–industrial levels recognizes that humanity has achieved 12
an unprecedented ability to influence geophysical planetary processes. In this way, the Paris 13
Agreement is better understood and assessed within the context of the Anthropocene. 14
15
This assessment report carries this approach forward and employs the Anthropocene as a framing 16
device to advance an understanding of the impacts and risk of the 1.5° C warming world and the 17
multiple pathways that define the trajectory of the physical and societal systems during this transition. 18
The assessment of limiting global warming to 1.5° C above pre–industrial levels, in the context of 19
strengthening the global response to the threat of climate change, sustainable development, and efforts 20
to eradicate poverty require a holistic approach that integrates human–biophysical interconnectivity 21
across multiple scales. This makes this report amenable to the concept of the Anthropocene. 22
23
Framing in the Anthropocene 24 The Anthropocene is emerging as a “boundary concept”: a term that can serve to embed critical 25
insights into understanding the drivers, dynamics and specific challenges in responding to the 26
ambition of keeping global temperature well below 2° C and adapting to a 1.5° C warmer world 27
(Brondizio et al., 2016). It offers a structured understanding of the culmination of past and present 28
human–environmental relations and provides an opportunity to better visualize the future and 29
minimizing pitfalls (Delanty and Mota, 2017; Pattberg and Zelli, 2016). By acknowledging the 30
dominant influence of human action on planetary functions, society is acknowledging differentiated 31
responsibility and opportunity to probe its capacity to mobilize activities to realize desirable change in 32
ways that will maintain planetary viability and prospects for climate resilient sustainable development 33
(Harrington, 2016). Humanity, while facing high uncertainty and poor control over the trajectory of 34
planetary processes (Shove and Walker, 2007), also has reflexivity, anticipatory capacity and ability 35
to learn in order to alter the climate change trajectory and its impacts (Palsson et al., 2013). As a result 36
a major question for this assessment is how, under the Anthropocene can climate mitigation and 37
adaptation be better integrated with sustainable development to reduce negative environmental 38
impacts and minimize poverty? These climate resilient sustainable development pathways are 39
assessed in the latter chapters of this report (especially Chapter 5). 40
41
Human–driven climate change is another expression of the depth of the global interlinkages of the 42
human and nature interactions that are an embodiment of the Anthropocene concept. While human 43
influence over the Earth System has consolidated over the last 60–150 years through accelerated 44
economic and demographic growth and connectivity, the result has not been wholly uniform 45
(Lövbrand et al., 2015; Palsson et al., 2013). The Anthropocene epoch is in fact a manifestation of the 46
differential influence that some populations, specific activities and technologies, and, importantly, 47
worldviews and associated values have on planetary functions (Brondizio et al., 2016; Castree, 2015; 48
Lövbrand et al., 2015; Palsson et al., 2013). 49
50
Employed in a nuanced and reflexive manner, the Anthropocene provides an opportunity to raise 51
questions regarding the regional differences, social inequities and uneven capacities and drivers of 52
global social–environmental changes, which in turn motivates the search for solutions as explored in 53
Second Order Draft Chapter 1 IPCC SR1.5
Do Not Cite, Quote or Distribute 1-14 Total pages: 78
Chapter 4 (Biermann et al., 2016). It links uneven influence of human actions on planetary functions 1
to an unevenly distribution of impacts (assessed in Chapter 3) as well as the responsibility and 2
response capacity to for example, limiting global warming to no more than a 1.5° C rise above pre–3
industrial levels. As a result efforts to curtail greenhouse gas emissions without incorporating the 4
intrinsic interconnectivity and disparities associated with the Anthropocene world may themselves 5
negatively affect the development ambitions of some global regions more than others (see Chapter 2 6
1.2.1 Working definitions of 1.5°C and 2°C warming relative to preindustrial levels 12
13
What is meant by ‘the increase in global average temperature … above pre–industrial levels’ referred 14
to in the Paris Agreement depends on the choice of pre–industrial reference period, whether 1.5°C 15
refers to total warming or the human–induced component of that warming, and which variables and 16
geographical coverage are used to define global average temperature change. The cumulative impact 17
of these definitional ambiguities (e.g. Hawkins et al., 2017) is a couple of tenths of a degree, 18
comparable to natural multi–decade temperature variability on continental scales (Deser et al., 2012). 19
Most practical mitigation and adaptation decisions do not depend on quantifying warming to this level 20
of precision, but a consistent working definition is helpful to ensure consistency across chapters and 21
figures in this report. 22
23
This report defines the increase in global average temperature above pre–industrial levels at a given 24
point in time as the global average of combined land surface air and sea surface temperatures for a 25
30–year period centred on that time, excluding the impact of any short–term natural forcing 26
fluctuations and assuming any secular trend continues throughout that 30–year period. On this 27
definition, an explosive volcanic eruption might temporarily reduce observed global temperatures, but 28
would not reduce the estimated overall warming relative to pre–industrial levels. Likewise, if 29
temperatures are warming at 0.2°C per decade (Kirtman et al., 2013), then warming on the definition 30
proposed here at the end of a 30–year period would be 0.3°C higher than the average over that 30–31
year period, because this definition assumes that this trend would continue. In the context of 32
ambitious mitigation goals, using a traditional definition of “observed climate” using an average over 33
a recent multi–decade period can introduce a substantial bias unless the trend is taken into account. 34
There are multiple ways of estimating this quantity (e.g., Foster and Rahmstorf, 2011; Haustein et al., 35
2017; Medhaug et al., 2017): this section does not endorse a particular method, but aims to clarify 36
what is being estimated. For consistency with AR5, the reference period 1850–1900 is used to 37
represent pre–industrial conditions. The implications of this choice are discussed in 1.2.1.2 below. 38
39
Using the global temperature datasets in AR5, combined and updated, this report therefore considers 40
that 1.5°C relative to pre–industrial conditions corresponds to 0.86°C (±0.05°C 5–95% range) warmer 41
than the period 1986–2005, or 0.63°C (±0.10°C) warmer than the decade 2006–2015, the periods 42
1986–2005 and 2006–2015 having been 0.64°C and 0.87°C warmer than 1850–1900 respectively, 43
with corresponding uncertainties. This assumes that temperatures in both periods are representative of 44
a 30–year period centred on them. Where possible, the later period is used, because temperatures in 45
the earlier period were affected by the eruption of Mount Pinatubo. These figures are consistent with 46
the overall assessment of the current level and rate of warming in AR5 and the 2013–15 Structured 47
Expert Dialogue. Where possible, estimates of impacts and mitigation pathways are expressed relative 48
to these more recent periods to avoid conflating uncertainty in projections with uncertainty in 49
historical changes 50
1.2.1.1 Definition of global average temperature 51
52
Second Order Draft Chapter 1 IPCC SR1.5
Do Not Cite, Quote or Distribute 1-15 Total pages: 78
The IPCC has traditionally defined changes in observed global mean surface temperature (GMST) as 1
a weighted average of observed near–surface air temperature (SAT) changes over land and sea surface 2
temperature (SST) changes over the oceans (Morice et al., 2012). Modelling studies have typically 3
used a simple area average of SAT over land, sea–ice and oceans. In the context of ambitious 4
temperature goals, and under conditions of rapid warming, the difference can be significant. Cowtan 5
et al. (2015) show that the use of blended SAT/SST data gives approximately 0.1°C less warming 6
from the 19th century to the present in the 5th Climate Model Intercomparison Project (CMIP5) 7
ensemble than the use of area–average SAT, about half of which emerges in the recent period of rapid 8
sea–ice retreat, while Richardson et al. (2016) show that incomplete coverage reduces this warming 9
by a further 0.1°C (see inset panel in Stocker et al., 2013, Figure TFE8.1 and Figure 1.1). However, 10
Richardson et al. (2017) show that coverage and blending has less impact on future warming relative 11
to the present, particularly under ambitious mitigation scenarios. Hence the choice of blended 12
SAT/SST or global SAT to define GMST is primarily an issue for the interpretation of the historical 13
record for model evaluation and the definition of warming to the present, not for projection of future 14
changes. The simple climate models used in many Integrated Assessment Models do not distinguish 15
SAT and SST, but are typically calibrated to more complex models or observations, and hence could 16
reproduce either a pure SAT or blended SAT/SST metric. 17
18
The three GMST reconstructions used in AR5 differ in their treatment of missing data. GISTEMP 19
(Hansen et al., 2010a) places the most weight on poorly–observed regions like the Arctic, while 20
NOAA (Vose et al., 2012) and HadCRUT (Morice et al., 2012) are progressively closer to a simple 21
average of available observations, which is equivalent to assuming that the average warming in 22
unobserved regions is the same as that in observed regions. Since AR5, considerable effort has been 23
devoted to more sophisticated statistical modelling to account for the impact of incomplete 24
observation coverage (Cowtan and Way, 2014; Jones, 2016; Rohde et al., 2013). The main impact of 25
statistical infilling is to increase estimated warming to date by about 0.1°C (Richardson et al., 2017). 26
Full assessment of the reliability of these infilling methods is beyond the scope of this report. The 27
2013–2015 Structured Expert Dialogue relied on the GMST reconstructions used in AR5 and contains 28
the statement: “At the current level of warming of 0.85°C above pre–industrial levels, impacts have 29
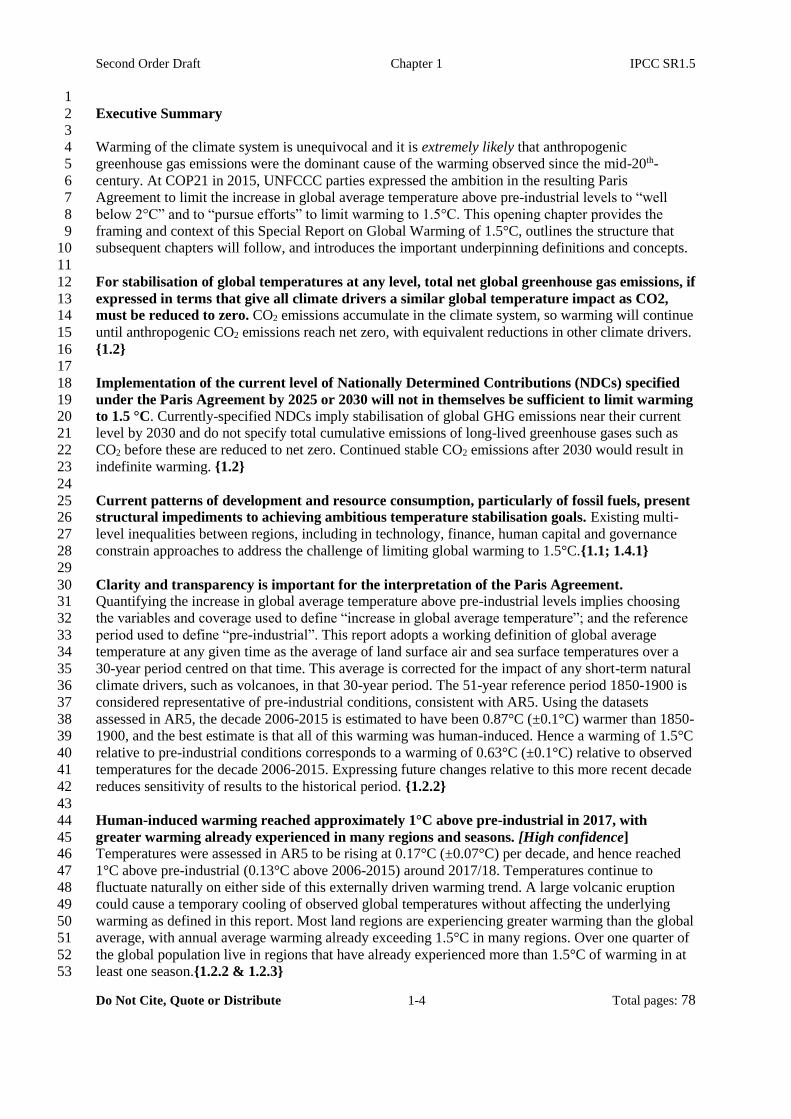
been observed on all continents and in all oceans”. Redefining GMST to represent a pure SAT metric 30
with fully global coverage could increase this 0.85°C figure to over 1°C, without affecting projected 31
future changes relative to the present, as shown by the difference between the blue dashed and solid 32
lines in Figure 1.2. This would be similar to the impact of adopting different reference periods to 33
1850–1900. For consistency with the guidance given in the Structured Expert Dialogue, therefore, this 34
report defines warming to date using blended versions of the GMST datasets with their incomplete 35
coverage, consistent with the use of these datasets in AR5. Compared to AR5, datasets have been 36
extended in time and some have small methodological updates (Karl et al., 2015) which affect trends 37
over recent decades, but not warming relative to the 19th century. Available estimates of warming 38
from various datasets are provided in Table 1.1. 39
40
Second Order Draft Chapter 1 IPCC SR1.5
Do Not Cite, Quote or Distribute 1-16 Total pages: 78
1 Figure 1.2: Evolution of global mean surface temperature (GMST) over the period of instrumental 2
observations. Grey line shows departures from the 1850–1900 reference period for monthly 3 means of the HadCRUT4, NOAA and GISTEMP datasets assessed in AR5, with line thickness 4 indicating inter–dataset range. Green line shows the Berkeley Earth Surface Temperature as an 5 example of more recent datasets using statistical methods to further account for the impact of 6 incomplete coverage. All observational datasets shown represent GMST as a blended mix of near 7 surface air temperature over land and sea surface temperature over oceans. Human–induced 8 (orange) and total human– and naturally–forced (red) contributions to these GMST changes are 9 shown calculated following Otto et al. (2015) and Haustein et al. (2017). Proportional uncertainty 10 in the level of human–induced warming in 2016 is set equal to that assessed in Bindoff et al. 11 (2013). Thin blue lines show the modelled global–mean surface air temperature (dashed) and 12 blended surface air and sea surface temperature accounting for observational coverage (solid) 13 from the CMIP5 ensemble under the Historical and RCP8.5 scenario (Cowtan et al., 2015; 14 Richardson et al., 2016). The pink shading indicates a range for temperature fluctuations over the 15 Holocene (Marcott et al., 2013; Marsicek et al., 2017). Near–term predictions for global mean 16 warming for the 2016–2035 period from Kirtman et al. (2013) are shown in light blue. See 17 Technical Annex 1.A of this chapter for further details. 18
19 20 1.2.1.2 Choice of reference period 21
22
Any choice of reference period used to approximate ‘pre–industrial’ conditions is a compromise 23
between data coverage and representativeness. This report adopts the 51–year reference period, 1850–24
1900 inclusive, assessed as representative of pre–industrial conditions in AR5 (e.g., Box TS.5, Figure 25
1 of Field et al., 2014a). The years 1880–1900 are subject to strong but uncertain volcanic forcing, but 26
the net impact of this forcing on observed temperatures over the full 51–year period appears to be 27
small: in HadCRUT4, average temperatures over 1850–1879 are less than 0.01°C from the average 28
for 1850–1900. Hawkins et al. (2017) argue that the 1720–1800 period is more representative of pre–29
Second Order Draft Chapter 1 IPCC SR1.5
Do Not Cite, Quote or Distribute 1-17 Total pages: 78
industrial forcing conditions, at the cost of increased uncertainty. Temperatures rose by 0.0–0.2°C 1
from 1720–1800 to 1850–1900 (Hawkins et al., 2017; Schurer et al., 2017), but the anthropogenic 2
contribution to this warming is uncertain (Schurer et al., 2017). The 18th century represents a 3
relatively cool period in the context of Holocene temperatures that are estimated to have peaked 4
around 5,000 years ago and declined slightly since (Marcott et al., 2013; Marsicek et al., 2017). 5
6
Modelling studies and projections may require different reference periods: for example, carbon 7
budget calculations in the AR5 (e.g. Table 2.2 of the IPCC (2014a)) used 1861–1880 to avoid the 8
volcanic forcing problem. Many impact studies use 1986–2005. The use of a more recent reference 9
period, offset by historical observations, avoids conflating uncertainty in past and future changes, 10
which may have a substantial impact on results (e.g. Millar et al., 2017a). Two recent reference 11
periods will be used in this report: 1986–2005 and 2006–2015. In using a single decade to represent a 12
30–year average centred on that decade, it is important to consider the potential impact of internal 13
climate variability. The years 2008–2013 were characterised by persistent cool La Niña conditions 14
(Kosaka and Xie, 2013; Medhaug et al., 2017), potentially related to multi–decadal Pacific variability 15
(e.g., England et al., 2014), but these were partially compensated for by El Niño conditions in 2006 16
and 2015. Figure 1.2 indicates that natural variability (internally generated and externally driven) had 17
little net impact on average temperatures over 2006–2015, in that the average temperature of the 18
decade is similar to the estimated externally–driven warming, while volcanic activity significantly 19
depressed temperatures in 1986–2005. In carbon budget calculations in which emissions are 20
calculated from a particular year, this report recommends using the 2006–2015 reference period and 21
offsetting to the year from which emissions are counted using the AR5 estimate of 0.17°C 22
(±0.07°C) decade–1 for the trend from 1996 to 2026. 23
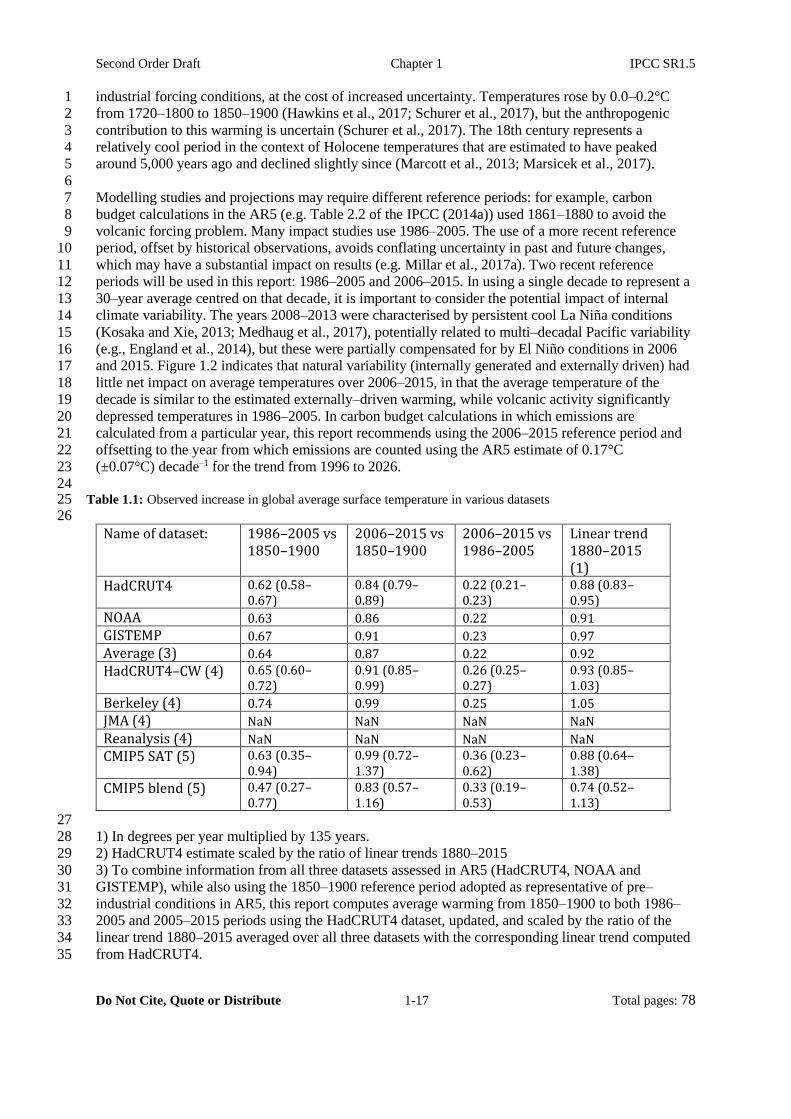
24 Table 1.1: Observed increase in global average surface temperature in various datasets 25
26
Name of dataset: 1986–2005 vs 1850–1900
2006–2015 vs 1850–1900
2006–2015 vs 1986–2005
Linear trend 1880–2015 (1)
HadCRUT4 0.62 (0.58–0.67)
0.84 (0.79–0.89)
0.22 (0.21–0.23)
0.88 (0.83–0.95)
NOAA 0.63 0.86 0.22 0.91
GISTEMP 0.67 0.91 0.23 0.97
Average (3) 0.64 0.87 0.22 0.92
HadCRUT4–CW (4) 0.65 (0.60–0.72)
0.91 (0.85–0.99)
0.26 (0.25–0.27)
0.93 (0.85–1.03)
Berkeley (4) 0.74 0.99 0.25 1.05
JMA (4) NaN NaN NaN NaN
Reanalysis (4) NaN NaN NaN NaN
CMIP5 SAT (5) 0.63 (0.35–0.94)
0.99 (0.72–1.37)
0.36 (0.23–0.62)
0.88 (0.64–1.38)
CMIP5 blend (5) 0.47 (0.27–0.77)
0.83 (0.57–1.16)
0.33 (0.19–0.53)
0.74 (0.52–1.13)
27
1) In degrees per year multiplied by 135 years. 28
2) HadCRUT4 estimate scaled by the ratio of linear trends 1880–2015 29
3) To combine information from all three datasets assessed in AR5 (HadCRUT4, NOAA and 30
GISTEMP), while also using the 1850–1900 reference period adopted as representative of pre–31
industrial conditions in AR5, this report computes average warming from 1850–1900 to both 1986–32
2005 and 2005–2015 periods using the HadCRUT4 dataset, updated, and scaled by the ratio of the 33
linear trend 1880–2015 averaged over all three datasets with the corresponding linear trend computed 34
from HadCRUT4. 35
Second Order Draft Chapter 1 IPCC SR1.5
Do Not Cite, Quote or Distribute 1-18 Total pages: 78
4) Not included in observational datasets assessed in AR5. JMA and Reanalysis data will be added if 1
possible in the Final Draft. 2
5) Estimated relative to 1861–80 plus 0.02°C for the offset in HadCRUT4 from 1850–1900. CMIP5 3
values are the mean of the RCP8.5 ensemble, with 5–95% ensemble range. They are included to 4
illustrate the difference between a truly global surface air temperature record (SAT) and a blended air 5
and water temperature record accounting for incomplete coverage (blend), following Richardson et al. 6
(2016). Note that 1986–2005 temperatures in CMIP5 appear to have been depressed more than 7
observed temperatures by Mount Pinatubo. 8
9
10
1.2.1.3 Total versus human–induced warming in mitigation and impact studies 11
12
Total warming refers to the actual temperature change, irrespective of cause, while human–induced 13
warming refers to the component of that warming that is attributable to human activities. Mitigation 14
studies focus on human–induced warming, while studies of climate change impacts typically refer to 15
total or externally–forced warming, defined by multi–decade averages. 16
17
In the absence of strong natural forcing due to changes in solar or volcanic activity, the difference 18
between total and human–induced warming is relatively small. Figure 1.2 shows, for example, that 19
human–induced warming since the 19th century is currently close to total observed warming, the net 20
contribution of natural climate variations being small once they are averaged out: this situation would 21
change were one or more large volcanoes to erupt. Monthly temperatures fluctuate substantially 22
around this externally–driven warming. 23
24
Many impacts take time to observe. For example, it may not become clear that the frequency of a 25
particular class of extreme weather event is changing until decades after the change has begun, simply 26
because the events happen infrequently. Hence, although GMST on the working definition adopted 27
here is estimated to have reached 1°C around 2017/18, the statement that ‘we are already experiencing 28
the impacts of 1°C of warming’ needs to be interpreted carefully. Impacts over the past 20 years were 29
associated with temperatures that were, on average, 0.17°C (±0.7°C) colder than the present level of 30
warming, based on the AR5 estimate of the warming trend over this period. Extreme event attribution 31
approaches based on statistical and/or dynamical modelling (e.g. van Oldenborgh et al., 2017) can 32
address this bias, but informal estimates of ‘recent impact experience’ necessarily understate the 33
temperature impact of current warming in a rapidly warming world. 34
35
On the definition of a ‘1.5°C warmer world’ proposed in this section, global temperatures would 36
fluctuate equally on either side of 1.5°C over a sufficiently long time period and in the absence of a 37
large volcanic eruption (which would cause a temporary cooling). Alternative definitions, such as 38
maintaining the probability of temperatures fluctuating over 1.5°C below a specified level, are more 39
ambiguous, since they depend on the averaging timescale used and the properties of future natural or 40
internal variability. For example, Figure 1.2 indicates there is a substantial chance of temperatures in a 41
single month fluctuating over 1.5°C between now and 2020, but this would not constitute 42
temperatures ‘reaching 1.5°C’ on our working definition. Observed 20–year–average global 43
temperatures varied by ±0.1°C (5–95% range), while monthly temperatures varied by ±0.2°C, around 44
the human–induced warming trend over the period 1861–2017. Regional temperature fluctuations 45
would be larger on both timescales (Deser et al., 2012). 46
47
48
1.2.2 Global versus regional and seasonal warming 49
50
Warming is not observed or expected to be spatially uniform, nor distributed uniformly across all 51
months of the year, and is generally expected to be greater over land than over the oceans (IPCC, 52
2013). Hence a 1.5°C increase in GMST will be associated with warming substantially greater than 53
Second Order Draft Chapter 1 IPCC SR1.5
Do Not Cite, Quote or Distribute 1-19 Total pages: 78
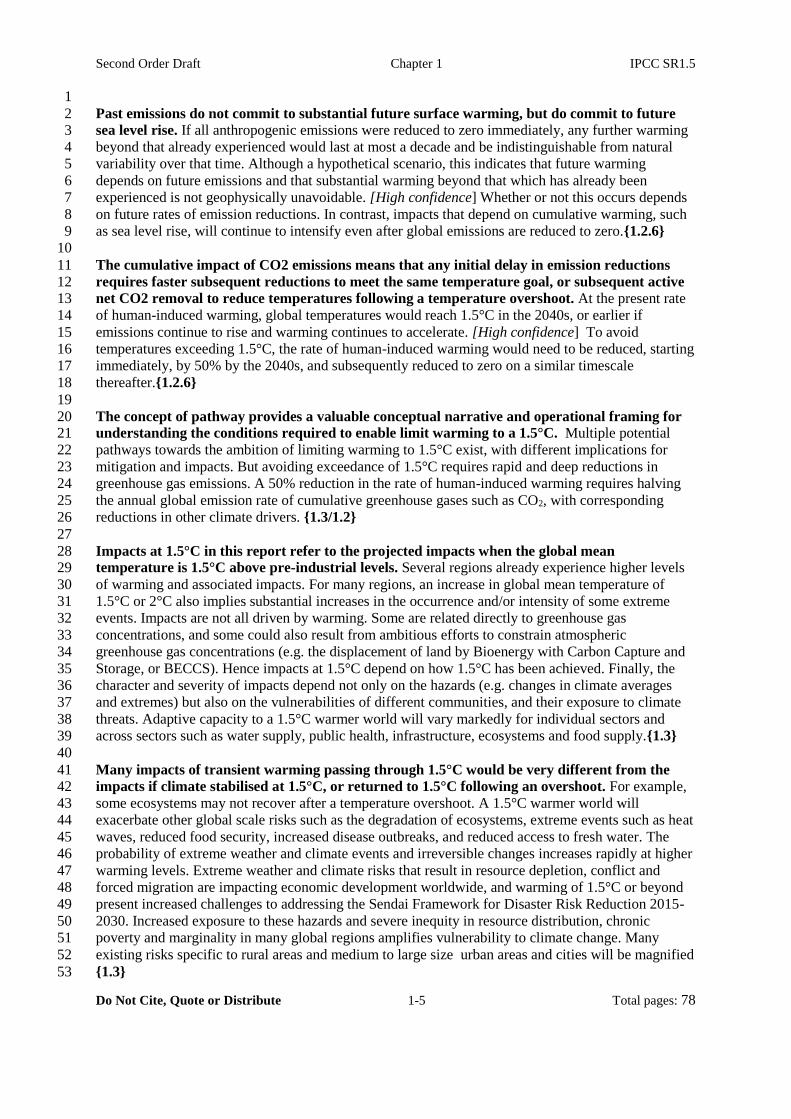
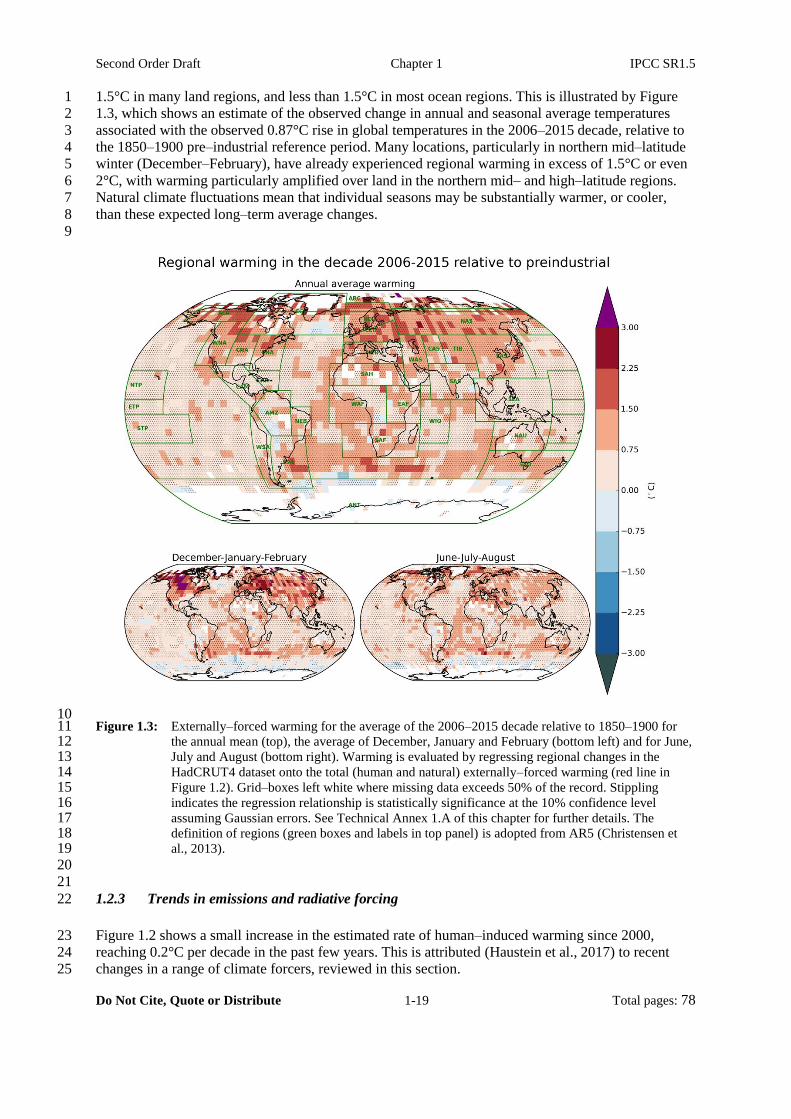
1.5°C in many land regions, and less than 1.5°C in most ocean regions. This is illustrated by Figure 1
1.3, which shows an estimate of the observed change in annual and seasonal average temperatures 2
associated with the observed 0.87°C rise in global temperatures in the 2006–2015 decade, relative to 3
the 1850–1900 pre–industrial reference period. Many locations, particularly in northern mid–latitude 4
winter (December–February), have already experienced regional warming in excess of 1.5°C or even 5
2°C, with warming particularly amplified over land in the northern mid– and high–latitude regions. 6
Natural climate fluctuations mean that individual seasons may be substantially warmer, or cooler, 7
than these expected long–term average changes. 8
9
10 Figure 1.3: Externally–forced warming for the average of the 2006–2015 decade relative to 1850–1900 for 11
the annual mean (top), the average of December, January and February (bottom left) and for June, 12 July and August (bottom right). Warming is evaluated by regressing regional changes in the 13 HadCRUT4 dataset onto the total (human and natural) externally–forced warming (red line in 14 Figure 1.2). Grid–boxes left white where missing data exceeds 50% of the record. Stippling 15 indicates the regression relationship is statistically significance at the 10% confidence level 16 assuming Gaussian errors. See Technical Annex 1.A of this chapter for further details. The 17 definition of regions (green boxes and labels in top panel) is adopted from AR5 (Christensen et 18 al., 2013). 19
20
21
1.2.3 Trends in emissions and radiative forcing 22
Figure 1.2 shows a small increase in the estimated rate of human–induced warming since 2000, 23
reaching 0.2°C per decade in the past few years. This is attributed (Haustein et al., 2017) to recent 24
changes in a range of climate forcers, reviewed in this section. 25
Second Order Draft Chapter 1 IPCC SR1.5
Do Not Cite, Quote or Distribute 1-20 Total pages: 78
Most studies partition anthropogenic climate forcers into two groups by their lifetime. CO2 and other 1
long–lived climate forcers (LLCFs) such as nitrous oxide, sulphur hexafluoride and some halogenated 2
gases contribute to forcing over decades and centuries. Other halogenated gases, ozone precursors and 3
aerosols are defined as short–lived climate forcers (SLCF) due to their lifetime of one to several years 4
in the atmosphere. Although methane is either considered as a LLCF or SLCF in published studies or 5
reports (Bowerman et al., 2013; Estrada et al., 2013; Heede, 2014; Jacobson, 2010; Kerr, 2013; 6
Lamarque et al., 2011; Saunois et al., 2016a; WMO, 2015), we assign methane as a SLCF for the 7
purpose of climate assessment, because its lifetime is comparable to or shorter than the thermal 8
adjustment time of the climate system (Smith et al., 2012). 9
10
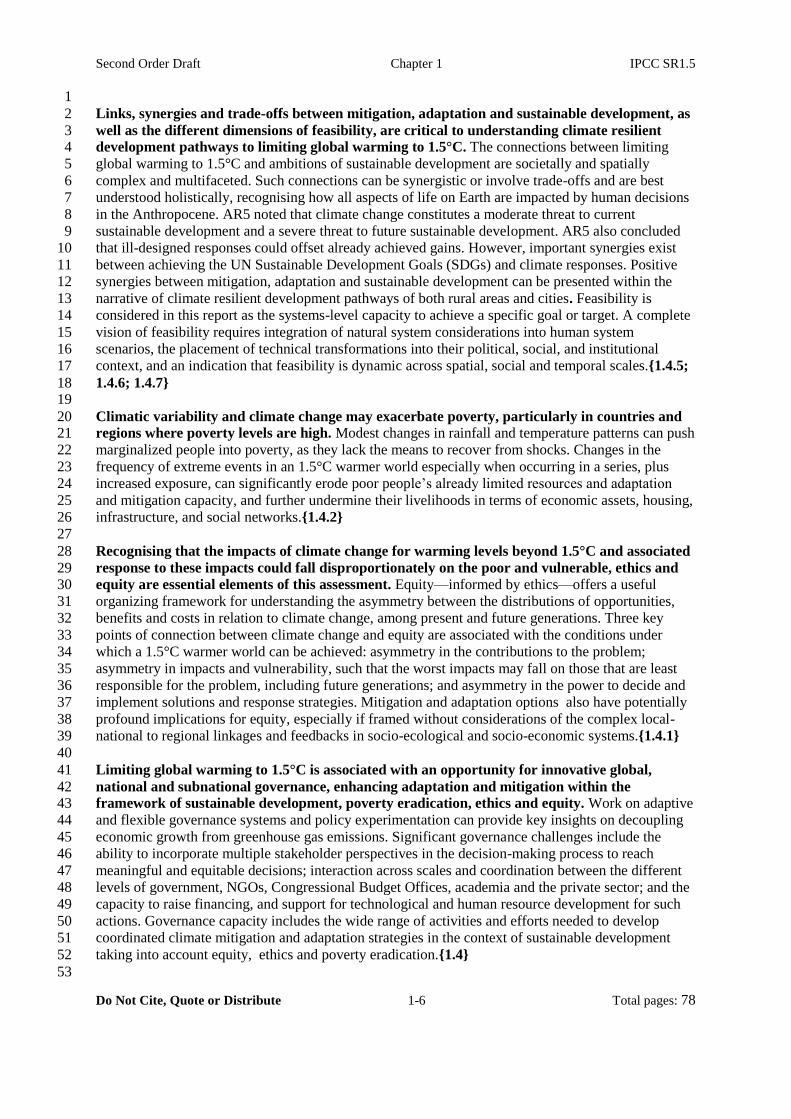
Figure 1.4: Time series of anthropogenic radiative forcing (a), CO2, methane (CH4) and nitrous oxide (N2O) 11 emissions (b–d) for the period 1986–2016. Anthropogenic radiative forcing is estimated according 12 to Etminan et al. (2016) using Dlugokencky and Tans (2016) for greenhouse gases concentrations 13 and ECLIPSE data for aerosols. Anthropogenic CO2 emissions are from the Global Carbon 14
Second Order Draft Chapter 1 IPCC SR1.5
Do Not Cite, Quote or Distribute 1-21 Total pages: 78
Project (GCP; Le Quéré et al., 2017), and EDGAR (Joint Research Centre, 2011) datasets. 1 Anthropogenic emissions of CH4 and N2O (e) are estimated from EDGAR (JRC, 2011) and the 2 US Environmental Protection Agency (EPA, 1990). Economic crisis (Former Soviet Union, A; 3 Asian financial crisis, B; global financial crisis, C) are reported following the methodology of 4 (Peters et al., 2011). 5
CO2, methane and nitrous oxide are the most prominent contributors of anthropogenic radiative 6
forcing, contributing 63%, 20% and 6% of the anthropogenic radiative forcing in 2016 respectively, 7
as shown in Figure 1.4. Other LLCFs such as the halogenated gases (hexafluoride SF6 and 8
chlorofluorocarbon CFCs) are responsible of about 37% of the anthropogenic radiative forcing. 9
Emissions such as black carbon and sulphur dioxide form different types of aerosol particles, which 10
interact with short – and long – wave radiation and alter clouds. The resulting net aerosol radiative 11
forcing is spatially inhomogeneous and uncertain. Globally averaged, it is estimated to have reduced 12
the globally averaged anthropogenic forcing by about 27% (figures from Myhre et al. (2013), 13
updated). 14
Since 2013, the growth of CO2 emissions has slowed down because of changes in the energy mix 15
moving from coal to natural gas and increased renewable energy generation as shown in Figure 1.4b 16
(Boden et al., 2015). This slowdown in CO2 emission growth has occurred despite global GDP growth 17
increasing to 3%year–1 in 2015, implying a structural shift away from carbon intensive activities 18
(Jackson et al., 2015; Le Quéré et al., 2017). In 2016, however, anthropogenic CO2 emissions are 19
36.18 CO2 y–1 and have begun to grow again by 0.4% with respect to 2015 (Le Quéré et al., 2017). 20
Global average concentration in 2016 has reached 402.3 ppm, which represents an increase of about 21
38.4% from 1850–1900 average (290.7 ppm). 22
Unlike CO2, methane and nitrous oxide emissions have followed the most carbon–intensive pathways 23
assessed in AR5 (Saunois et al., 2016b; Thompson et al., 2014). However, current trends in methane 24
and nitrous oxide emissions are not driven in the same way by human activities. About 60% of 25
methane emissions are attributed to human activities (e.g. ruminants, rice agriculture, fossil fuel 26
exploitation, landfills and biomass burning, Saikawa et al., 2014; Saunois et al., 2016b), while about 27
40% of nitrous oxide emissions are caused by various industrial processes and agriculture (Bodirsky 28
et al., 2012; Thompson et al., 2014). It is thus more complicated to link rates of emissions to 29
economic trends or energy demands than is the case with CO2 (Peters et al., 2011). 30
Estimates of anthropogenic emissions for methane and nitrous oxide are uncertain as shown by the 31
difference between datasets in Figure 1.4 EDGARV4.2 (JRC, 2011) estimates and US–EPA 32
projections give a global amount of methane emission ranging between 392.87 and 378.29 TgCH4y–1 33
by 2016 which corresponds to a relative increase of 0.6–1% compared to 2015 emissions. However, 34
livestock emissions in these databases are considered to be underestimated (Wolf et al., 2017). Similar 35
uncertainties exist for anthropogenic N2O emissions for which only US–EPA projections are 36
available. According to US–EPA projections, anthropogenic N2O emissions reach 11.2 TgN2O y–1, 37
representing a relative increase of about 1% compared to 2016. Anthropogenic CH4 and N2O 38
emissions also appear to respond to major economic crises. 39
40
41
1.2.4 Definition of 1.5°C consistent pathways and associated emissions and impacts 42
43
The Paris Agreement calls for achieving ‘balance between anthropogenic emissions by sources and 44
removals by sinks of greenhouse gases in the second half of this century’. However, it does not 45
associate a specific pathway with the long–term 1.5°C temperature goal, so classifying temperature 46
pathways that might be considered consistent with 1.5°C is an important task for this report. Three 47
broad categories of temperature pathways are used in this report, associated with very different 48
impacts and emissions: pathways remaining below 1.5°C (which may also include pathways that 49
Second Order Draft Chapter 1 IPCC SR1.5
Do Not Cite, Quote or Distribute 1-22 Total pages: 78
reach 1.5°C but do not exceed it by a significant margin relative to internal climate variability), 1
pathways temporarily exceeding 1.5°C (where ‘temporary’ here is with reference to the timescale to 2
2100, allowing an exceedance duration of at most a few decades), and pathways permanently 3
exceeding 1.5°C (meaning a very low probability of returning to 1.5°C on any policy–relevant 4
timescale). These three categories can be used to broadly characterise mitigation options and impacts 5
associated with 1.5°C pathways over the 21st century, although no classification is exhaustive. For 6
example, the rate of warming in 2100 is highly relevant to impacts such as sea level rise that continue 7
to change after 2100. In general, pathways remaining below or temporarily exceeding 1.5°C show 8
stable or falling temperatures in 2100, but exceptions are possible in principle. 9
10
The word ‘scenario’ is sometimes used interchangeably with the word ‘pathway’. This report will not 11
attempt to refine these definitions but, in general, pathway will be used to describe the specific 12
evolution over time of particular climate variables, such as emissions or temperatures, while scenario 13
will be used to refer to the underlying assumptions (see Cross–Chapter Box 1.1 on scenarios and 14
pathways). 15
16
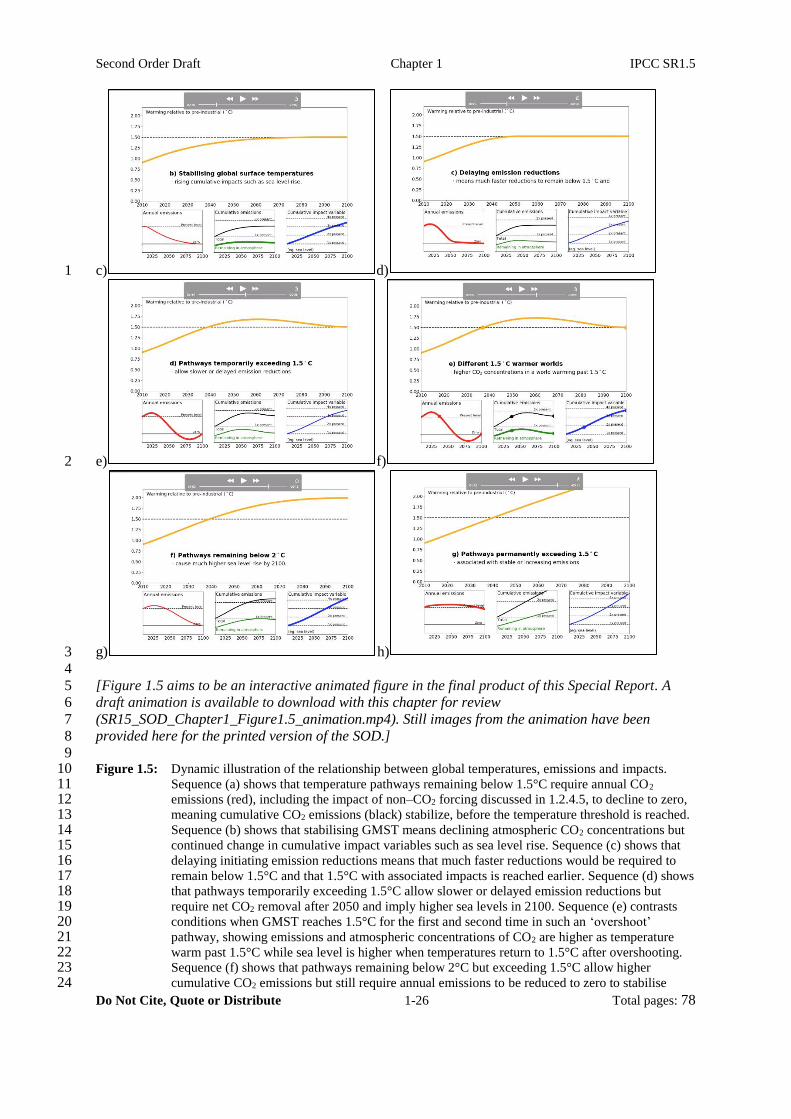
Figure 1.5 is used to illustrate these categories of temperature scenarios and associated annual and 17
cumulative emissions of CO2, assuming for illustration that the net impact of other climate forcers is 18
either negligible or can be expressed in terms of the equivalent amount of CO2 emissions that would 19
have the same impact as the non–CO2 forcing on radiative forcing and GMST (non–CO2 forcing in 20
discussed in Section 1.2.4.5). While many impacts respond to GMST change shown in the large 21
panel, some such sea level rise respond to cumulative or integrated temperature, meaning the rate of 22
change of the impacted variable scales with GMST. This introduces different timescales of response, 23
shown in the lower right panel. 24
25
Cross-Chapter Box 1.1: Scenarios and Pathways 26
27
Contributing Authors: Kristie L. Ebi, Sabine Fuss, Mikiko Kainuma, Elmar Kriegler, Keywan 28
Riahi, Joeri Rogelj, Petra Tschakert and Rachel Warren 29
30
The objective of this box is to frame how climate scenarios and pathways are used in this report and 31
not to discuss all definitions of scenarios and pathways presented within the climate research literature 32
(Rosenbloom, 2017). 33
34
A scenario is a consistent, plausible, and integrated description of a possible future of the human–35
environment system, including a narrative with qualitative trends and quantitative projections (IPCC, 36
2000). Climate change scenarios provide a framework for developing and integrating emissions, 37
climate change and climate impact projections, including an assessment of their inherent 38
uncertainties. The long–term and multi–faceted nature of climate change requires climate scenarios to 39
describe how assumptions about inherently uncertain socio–economic trends in the 21st century could 40
influence future energy and land use, resulting emissions, and climate change as well as human 41
vulnerability and exposure to climate change. Such driving forces include population, GDP, 42
technological innovation, governance, and lifestyles. Climate change scenarios are used for analysing 43
and contrasting climate policy choices. 44
45
The notion of a 'pathway' can have different meanings in the climate literature. It is often used to 46
describe the temporal evolution of a set of scenario features, such as GHG emissions and 47
socioeconomic development. As such, it can describe individual scenario components or sometimes 48
be used interchangeably with the word “scenario”. For example, the Representative Concentration 49
Pathways (RCPs) describe greenhouse gas concentration trajectories (van Vuuren et al., 2011) and 50
the Shared Socio–Economic Pathways (SSPs) are a set of narratives of societal futures augmented 51
by quantitative projections of socio–economic determinants such as population, GDP, and 52
urbanization (Kriegler et al., 2012; O’Neill et al., 2014). Socio–economic driving forces consistent 53
Second Order Draft Chapter 1 IPCC SR1.5
Do Not Cite, Quote or Distribute 1-23 Total pages: 78
with any of the SSPs can be combined with a set of climate policy assumptions (Kriegler et al., 2014) 1
that together would lead to emissions and concentration outcomes consistent with the RCPs (Riahi et 2
al., 2017). This is at the core of the new scenario framework for climate change research that aims to 3
classify scenarios according to their similarities in the SSP and RCP dimensions (Ebi et al., 2014; van 4
Vuuren et al., 2014). 5
6
In other parts of the literature, 'pathway' implies a solution oriented scenario describing a pathway 7
from today’s world to achieving a set of future goals. Sustainable Development Pathways (SDPs) 8
describe possible pathways where climate policy becomes part of a larger sustainability 9
transformation resulting in sustainable development within a stable and resilient earth–system 10
(Rockström et al., 2009). The IPCC 5th Assessment Report, Working Group II report presented 11
climate–resilient pathways as sustainable development trajectories that combine adaptation and 12
mitigation with the goal to reduce negative impacts from climate change and ensure effective risk 13
management. Such pathways represent a range of future trajectories of development and 14
transformational change; they are negotiated through iterative and participatory processes to evaluate 15
values, preferences, and benefits and risks of climate resilience (Denton et al., 2014). Adaptation 16
pathways are understood as a series of adaptation choices involving trade–offs between short–term 17
and long–term goals and values (Reisinger et al., 2014). They are decision–making processes over 18
several potential actions sequenced over time with the purpose of deliberating and identifying 19
socially–salient solutions in specific places (Barnett et al., 2014; Fazey et al., 2016; Wise et al., 2014). 20
21
Climate change scenarios have been used in IPCC assessments since the First Assessment Report 22
(Leggett et al., 1992). The SRES scenarios (named after the IPCC Special Report on Emissions 23
Scenarios; IPCC, 2000), published in 2000, consist of four scenarios that do not take into account any 24
future measures to limit greenhouse gas (GHG) emissions; however, many policy scenarios have been 25
developed based on these scenarios (Morita et al., 2001). The SRES scenarios are superseded by a 26
new set of SSP–RCP–based scenarios (Riahi et al., 2017). The RCPs comprise a set of four GHG 27
concentration trajectories that jointly span a large range of plausible human–caused climate forcing 28
ranging from 2.6 W m-2 (RCP2.6) to 8.5 W m-2 (RCP8.5) by the end of the 21st century (van Vuuren 29
et al., 2011). They were used to develop new climate projections in the 5th Coupled Model 30
Intercomparison Project (CMIP5; Taylor et al., 2012) and were assessed in the IPCC 5th Assessment 31
Report. Based on the CMIP5 ensemble, RCP2.6, provides a better than two in three chances of 32
staying below 2°C and a median warming of 1.6°C relative to 1850–1900 in 2100 (Collins et al., 33
2013). 34
35
The SSPs were developed to complement the RCPs with varying socio–economic challenges to 36
adaptation and mitigation. Based on five narratives, the SSPs describe alternative socio–economic 37
fossil–fuelled development (SSP5), and a middle–of–the–road development (SSP2) (O’Neill et al., 39
2017; Riahi et al., 2017). Socioeconomic drivers, including population and education (Samir and 40
Lutz, 2017), economic growth (Crespo Cuaresma, 2017; Dellink et al., 2017; Leimbach et al., 2017), 41
and urbanisation (Jiang and O’Neill, 2017), are quantified for all SSPs. Based on the narratives and 42
the driver projections, SSP–based scenarios were developed for a range of climate forcing levels, 43
including the end–of–century forcing levels of the RCPs (Riahi et al., 2017) and a level below 44
RCP2.6 to explore pathways limiting warming to 1.5°C above pre–industrial (Rogelj et al., 2017). 45
The SSP–based 1.5°C pathways are assessed in Chapter 2 of this report. The scenarios offer an 46
integrated perspective on socio–economic, energy–system (Bauer et al., 2017), land–use (Popp et al., 47
2017), air pollution (Rao et al., 2017) and greenhouse gas emissions developments (Riahi et al., 48
2017). A subset of SSP–based baseline and mitigation scenarios will be used to drive the next round 49
of climate change projections (CMIP6) to be assessed in the Sixth Assessment Report of the IPCC 50
(O’Neill et al. 2016). Because of their harmonised assumptions, scenarios developed with the SSPs 51
facilitate the integrated analysis of future climate impacts, vulnerabilities, adaptation, and mitigation. 52
53
Second Order Draft Chapter 1 IPCC SR1.5
Do Not Cite, Quote or Distribute 1-24 Total pages: 78
Scenarios and Pathways in this Report 1 This report focuses on scenarios that could limit global mean surface air temperature increase to 1.5°C 2
above pre–industrial and pathways that align with the goals of sustainable development and poverty 3
eradication. Pace and scale of mitigation and adaptation are assessed in the context of historical 4
evidence to determine where unprecedented change is required (see Chapter 4). Other scenarios are 5
also assessed, primarily as benchmark for comparison for, for example, impacts, mitigation and/or 6
adaptation requirements. These include baseline scenarios that assume no climate policy; scenarios 7
that assume some kind of continuation of current climate policy trends and plans, many of which are 8
used to assess the implications of the NDCs; and scenarios holding warming below 2°C above pre–9
industrial. This report assesses the spectrum from global mitigation scenarios to local adaptation 10
choices – complemented by a bottom–up assessment of individual mitigation and adaptation options 11
and their implementation (policies, finance, institutions, governance, see Chapter 4). Regional, 12
national, and local scenarios as well as decision–making processes over values and difficult trade–offs 13
are important for understanding the challenges of limiting global mean temperature increase to 1.5°C 14
and are thus indispensable when assessing implementation. 15
16
This report introduces Climate resilient development pathways as low–emission, sustainable 17
development trajectories that promote fair and equitable climate resilience and well–being for all in a 18
1.5°C warmer world, in alignment with the Agenda 2030 and the Sustainable Development Goals 19
(SDGs, United Nations, 2015, see Chapter 5). They entail priorities about the futures we want and the 20
ethics and equity dimensions of the societal transformation needed to get there. 21
22
Different climate policies result in different temperature pathways, which result in different climate 23
risks. Temperature pathways are classified into continued warming pathways (in the cases of baseline 24
and reference scenarios), pathways that keep temperature below a specific limit, and pathways that 25
temporarily exceed or overshoot a specific limit (like 1.5°C or 2°C). In the case of a temperature 26
overshoot, net negative CO2 emissions are required to remove excess CO2 from the atmosphere. 27
28
Emission pathways also can be classified as ‘prospective’ or ‘adaptive’. Prospective pathways assume 29
emissions will be consistent with a given probability of global mean surface temperature remaining 30
below a temperature target, such as a 50:50 or two–thirds chance of staying below 1.5°C, based on 31
current knowledge of the climate system response. Adaptive pathways assume emissions will evolve 32
to stay below a desired temperature limit, with emissions plans changing as the knowledge about the 33
climate response is updated. The 1.5°C pathways assessed in Chapter 2 are prospective. Their 34
associated risks from climate change would therefore include, and might indeed be dominated by, the 35
risks of warming levels higher than 1.5°C that might emerge with some limited probability. In 36
contrast, the ‘risks of warming of 1.5°C’assessed in Chapter 3 refer to risks in a world that held 37
warming to 1.5°C, without considering probabilities (unless otherwise qualified), and therefore can be 38
related more directly to the risks associated with adaptive 1.5°C pathways. 39
40
41
1.2.4.1 Pathways remaining below 1.5°C 42
43
The simplest 1.5°C–consistent pathway is one in which human–induced warming rises monotonically 44
to stabilise at 1.5°C. Because of the inertia of the climate, carbon cycle and energy systems, the rate of 45
human–induced warming varies slowly over decades, resulting in smooth temperature pathways if 46
temperature goals are achieved through emission reductions alone (Huntingford et al., 2017). As 47
Figure 1.5 illustrates, annual CO2 emissions are proportional to the rate of change of CO2–induced 48
warming. Hence if reductions are delayed until temperatures are close to the proposed limit, pathways 49
remaining below 1.5°C necessarily involve very rapid rates of net CO2 emission reductions, 50
potentially requiring active CO2 removal combined with rapid reductions in other climate forcers. 51
52
Second Order Draft Chapter 1 IPCC SR1.5
Do Not Cite, Quote or Distribute 1-25 Total pages: 78
Stabilizing GMST requires net annual CO2 emissions to decline to near zero or slightly below 1
(depending on the long–term adjustment of the carbon cycle), but does not imply stabilizing other 2
properties of the climate system. If other forcings are constant and positive, CO2 concentrations and 3
hence radiative forcing need to decline to stabilize GMST (Matthews and Caldeira, 2008; Solomon et 4
al., 2009), as shown by the cumulative emissions remaining in the atmosphere, which is proportional 5
to atmospheric concentrations, green line in the middle lower panel in Figure 1.5. Falling atmospheric 6
CO2 concentrations mean ocean pH levels would begin to recover, while stabilization of atmospheric 7
greenhouse gas concentrations would result in continued warming, see Section 1.2.6). Sea level would 8
continue to rise after temperatures stabilize (Kopp et al., 2016), but at substantially lower rates than 9
would be expected under a continued warming scenario. The requirement that CO2 emissions must 10
reach zero to stabilise GMST also provides a simple method of taking stock of progress towards a 11
temperature goal: a minimum requirement for limiting future warming to 0.5°C without overshoot is 12
that CO2 emissions must fall, on average, by 20% of their present value, or about 8 GtCO2, for every 13
tenth of a degree of warming from now on. This statement is independent of scenario, because it 14
simply states the reductions required to reach net zero before temperatures have risen by more than 15
0.5°C above present–day. 16
17
18
1.2.4.2 Pathways temporarily exceeding 1.5°C 19
20
Under this category, GMST rises above 1.5°C before peaking and declining, either converging on 21
1.5°C or continuing to fall. Drawing temperatures down requires either negative global CO2 emissions 22
(net anthropogenic removal of CO2) or sustained reduction of net non–CO2 climate forcing. The 23
amount of cooling that can be achieved without active anthropogenic CO2 removal is limited because 24
most anthropogenic climate forcers cannot be reduced below zero. Hence the feasibility and 25
availability of large–scale CO2 removal limits accessible rates and amounts of temperature decline. In 26
this report, overshoot pathways are referred to as 1.5°C–consistent, but qualified by the amount, 27
duration and timing of the temperature overshoot, which can have a substantial impact on sea level 28
rise and many irreversible climate change impacts such as coral reef loss, ice–sheet loss and species 29
extinctions. 30
31
32
1.2.4.3 Pathways permanently exceeding 1.5°C 33
34
Under this category, 1.5°C is reached and GMST then continues to warm. An important sub–category 35
of continued warming pathways are pathways associated with ‘current policies’ scenarios, in which 36
existing climate mitigation policies and commitments are extrapolated into the future, or ‘no policies’ 37
scenarios, in which no climate mitigation policies are assumed at all. CO2 concentrations and sea level 38
would be very different when temperatures reach 1.5°C on a continued warming pathway than when 39
on a stabilisation pathway, which has important implications for many impacts. 40
41
42
a) b) 43
Second Order Draft Chapter 1 IPCC SR1.5
Do Not Cite, Quote or Distribute 1-26 Total pages: 78
c) d) 1
e) f) 2
g) h) 3
4
[Figure 1.5 aims to be an interactive animated figure in the final product of this Special Report. A 5
draft animation is available to download with this chapter for review 6
(SR15_SOD_Chapter1_Figure1.5_animation.mp4). Still images from the animation have been 7
provided here for the printed version of the SOD.] 8
9 Figure 1.5: Dynamic illustration of the relationship between global temperatures, emissions and impacts. 10
Sequence (a) shows that temperature pathways remaining below 1.5°C require annual CO2 11 emissions (red), including the impact of non–CO2 forcing discussed in 1.2.4.5, to decline to zero, 12 meaning cumulative CO2 emissions (black) stabilize, before the temperature threshold is reached. 13 Sequence (b) shows that stabilising GMST means declining atmospheric CO2 concentrations but 14 continued change in cumulative impact variables such as sea level rise. Sequence (c) shows that 15 delaying initiating emission reductions means that much faster reductions would be required to 16 remain below 1.5°C and that 1.5°C with associated impacts is reached earlier. Sequence (d) shows 17 that pathways temporarily exceeding 1.5°C allow slower or delayed emission reductions but 18 require net CO2 removal after 2050 and imply higher sea levels in 2100. Sequence (e) contrasts 19 conditions when GMST reaches 1.5°C for the first and second time in such an ‘overshoot’ 20 pathway, showing emissions and atmospheric concentrations of CO2 are higher as temperature 21 warm past 1.5°C while sea level is higher when temperatures return to 1.5°C after overshooting. 22 Sequence (f) shows that pathways remaining below 2°C but exceeding 1.5°C allow higher 23 cumulative CO2 emissions but still require annual emissions to be reduced to zero to stabilise 24
Second Order Draft Chapter 1 IPCC SR1.5
Do Not Cite, Quote or Distribute 1-27 Total pages: 78
temperatures and cause substantially higher sea level rise by 2100. Sequence (g) shows that 1 pathways permanently exceeding 1.5°C are associated with stable or increasing emissions and 2 continually accelerating sea level rise. Temperatures anchored to 0.87°C above pre–industrial in 3 2010; emissions–temperature relationship computed using a representative value (1.6°C) of the 4 Transient Climate Response (TCR) with a simple climate model (Millar et al., 2017b; Myhre et 5 al., 2013); cumulative impact variable represented by sea–level–rise computed using a semi–6 empirical model (Kopp et al., 2016). Figure will provide a link to allow reviewers to view the 7 dynamic illustration that will be embedded in electronic versions of the final report. 8
9
10
1.2.4.4 Impacts at 1.5°C warming associated with different pathways 11
12
Impacts that occur when GMST first rises past 1.5°C under a continued warming or overshoot 13
pathway may be very different from those on a 1.5°C temperature stabilization pathway, since surface 14
temperature is not in equilibrium with atmospheric composition. In particular, CO2 concentrations 15
will be higher, as well as sea level and, potentially, mean precipitation (Pendergrass et al., 2015) will 16
both be lower as temperature warms past 1.5°C than they will be as temperature stabilises at 1.5°C. 17
These differences could lead to very different impacts on agriculture, some forms of extreme weather 18
(Baker et al., 2017), and marine and terrestrial ecosystems (James et al., 2017; Mitchell et al., 2016, 19
Box 3.1). Sea level would be substantially higher when temperatures return to 1.5°C following an 20
overshoot than when temperatures reach 1.5°C on a pathway that remains below 1.5°C before then. 21
Hence it is important to specify the pathway in discussing impacts of 1.5°C of warming. 22
23
24
1.2.4.5 Framing cumulative budgets for CO2 and non–CO2 climate forcing using AGWP 25
26
The AR5 noted that there is a simple, near–linear relationship between cumulative CO2 emissions and 27
CO2–induced warming (Allen et al., 2009; Matthews et al., 2009; Zickfeld et al., 2009), characterised 28
by the Transient Climate Response to Emissions (TCRE). This makes possible the notion of a 29
“cumulative carbon budget” consistent with a given level of warming: warming over a given time–30
period is equal to cumulative CO2 emissions over that period multiplied by the TCRE plus any 31
warming caused by non–CO2 climate forcing over that period. Under ambitious mitigation scenarios 32
requires a metric, highlighting the need to consider the implications of the choice of metric and time 8
horizon. 9
10
Issues arise with GWP, GTP and similar metrics when comparing the temperature effects of 11
emissions of SLCFs with a long–lived gas such as carbon dioxide(Smith et al., 2012). The warming 12
from long–lived greenhouse gases increases cumulatively with each tonne emitted (i.e. with the 13
emissions “stock”), while on timescales longer than their lifetimes, the warming or cooling from 14
SLCFs is determined by their annual emission rates (or “flow”). Hence a single tonne avoided 15
emission of a long–lived gas like CO2 has a similar impact on future global mean surface temperature 16
(GMST) over a broad range of timescales as a permanent reduction in the rate of emission of an SLCF 17
like methane (Allen et al., 2016; Lauder et al., 2013; Shine et al., 2005). GWP and GTP, 18
conventionally applied, equate a single tonne of CO2 with a single tonne of emissions of an SLCF, not 19
a change in SLCF emission rate, and hence typically understate the impact of SLCF emissions on 20
GMST on short timescales, and overstate their impact on long timescales. 21
22
Ambitious mitigation scenarios addressing 1.5°C must address both long timescales (temperature 23
stabilisation) and short timescales (rapid emission reductions over decades) simultaneously, posing a 24
challenge for conventional metrics. The usage of the GWP metric can be modified to address this 25
problem approximately by equating a sustained one–tonne–per–year reduction in the emission rate of 26
an SLCF with the (one–off) avoided emission of GWPH × H tonnes of CO2, where GWPH is the value 27
of that SLCF’s GWP for a time–horizon H (Allen et al., 2016). Both of these have a similar impact on 28
GMST over a broad range of timescales. However, this revised usage (denoted GWP* in Fuglestvedt 29
et al. (2017) and Allen et al. (2017)) would require a modified policy framework to allow different 30
treatment of long–lived and short–lived gases. The Absolute Global Warming Potential of CO2 31
(AGWP; Shine et al., 2005) may also be used to relate cumulative CO2 emissions and non–CO2 32
climate forcing in the context of cumulative CO2 emission budgets (see Section 1.2.4.5 & Section 33
2.2). 34
35
The “stock versus flow” distinction between long–lived gases and SLCFs also affects the definition of 36
emissions “balance”, if interpreted in terms of temperature stabilisation. Achieving a stable GMST 37
requires near–zero net emissions of long–lived greenhouse gases (CO2 and gases with lifetimes of a 38
century or more, such as nitrous oxide) and near–constant net emissions of SLCFs. This may require 39
compensating for residual emissions of long–lived gases with negative CO2 emissions (active CO2 40
removal) as technologies for removing nitrous oxide and ozone depleting halocarbons from the 41
atmosphere remain speculative (de Richter et al., 2017). Compensating for residual CO2 emissions 42
with continually falling emissions of SLCFs would not be possible, since it is unfeasible to reduce the 43
rate of emission of most SLCFs below zero (with the possible exception of methane – see (Boucher 44
and Folberth, 2010; de Richter et al., 2017). Hence if substantial SLCF emissions continue, stable 45
GMST does not correspond to net zero aggregate CO2–equivalent emissions measured by GWP100, 46
although it does correspond to net zero emissions aggregated using GWP* (Cross–Chapter Box 1.2, 47
Figure 1). Persistent net zero CO2–equivalent emissions aggregated using GWP100 would result in a 48
steady decline of GMST, while other conventional metrics such as GTP also yield declining GMST, 49
albeit at a slower rate (Fuglestvedt et al., 2017). Whatever metric is used to relate emissions of 50
different greenhouse gases, achieving stable GMST below the Paris Agreement’s thresholds requires 51
both near–zero net emissions of long–lived greenhouse gases and deep reductions in warming SLCFs 52
(Chapter 2). 53
Second Order Draft Chapter 1 IPCC SR1.5
Do Not Cite, Quote or Distribute 1-31 Total pages: 78
1
It may be desirable to consider more than longer–term GMST in the definition of metrics (Deuber et 2
al., 2013; Johansson, 2012; Myhre et al., 2013; Tol et al., 2012). Climate impacts can arise from both 3
magnitude and rate of climate change, and from other variables such as precipitation, which can also 4
be considered in metric definition (Shine et al., 2015). Even if GMST is stabilised, sea–level rise and 5
associated impacts will continue to increase (Sterner et al., 2014), while impacts that depend on CO2 6
concentrations such as ocean acidification may begin to reverse. Other climate impacts may persist as 7
well if adaptation options are limited (Chapter 3). All of these could be included in the definition of 8
the climate metric. From an economic perspective, climate metrics should reflect the ratio of marginal 9
economic damages from different GHGs if they are used to determine their exchange ratio under a 10
multi–gas greenhouse gas regulation (Deuber et al., 2013; Kolstad et al., 2014; Tol et al., 2012). 11
Under the assumption of climate damages that increase gradually with increasing temperature, this 12
approach yields the Global Damage Potential (Hammitt et al., 1996; Kandlikar, 1995, 1996; Tol, 13
1999). Another economic metric, the Global Cost Potential is defined as the price ratio that minimizes 14
the economic costs of maintaining the temperature limit (Manne and Richels, 2001). Studies have 15
found that the effect of metric choice on the median costs of maintaining temperatures below 2°C 16
tends to be modest because all feasible mitigation options are needed (Harmsen et al., 2016; Strefler et 17
al., 2014), implying that a range of metrics might be suitable from a global economic perspective. 18
Metric choice can nevertheless substantially affect carbon prices and consequent mitigation decisions 19
on a regional or sectoral level (see Chapter 2). 20
21
Emissions can interact with other dimensions of sustainable development (see Chapters 4 and 5). In 22
particular, early action on some SLCFs (including actions that may warm the climate such as reducing 23
SO2 emissions) may have considerable societal co–benefits such as reduced air pollution and 24
improved public health with associated economic benefits (OECD, 2016; Shindell et al., 2016). 25
Valuation of broadly defined social costs is another emission metric that attempts to account for many 26
of these additional non–climate factors along with climate–related impacts (Sarofim et al., 2017; 27
Shindell, 2015; Shindell et al., 2017). For any given sector and/or state it may also be more or less 28
economically viable or socially acceptable to target mitigation of particular forcers over CO2 29
mitigation or vice versa. While they do not, therefore, dictate policy decisions, emission metrics can 30
still provide useful guidance to clarify the implications of such decisions for future GMST. 31
32
33 34 Cross–Chapter Box 1.2, Figure 1: (a) Aggregate emissions of well–mixed greenhouse gases (WMGHGs) 35 under the RCP2.6 mitigation scenario expressed as CO2–equivalent using GWP100 (red); GTP100 (green) and 36 GWP* (blue). Aggregate CO2–equivalent missions fall more rapidly under GWP* than either of the other 37 metrics, primarily because falling methane emissions are equated with negative CO2 emissions under GWP*, as 38 only active CO2 removal would have the same impact on radiative forcing and GMST as a reduction in methane 39 emission rates. (b) Cumulative emissions of WMGHG under the three metrics in panel (a) (red, blue and green 40 & left hand axis) and resulting warming (black line & right hand axis) calculated using a simple climate–41 carbon–cycle model (Millar et al., 2017b). The temperature response is closely correlated with cumulative 42 WMGHG emissions aggregated using GWP*, but correlated with neither emission rate nor cumulative CO2–43 equivalent emissions aggregated using GWP or GTP: these traditional metrics are adequate for representing 44
1900 1950 2000 2050 2100Year
-20
0
20
40
60
Em
issio
ns (
GtC
O2-e
/ye
ar)
a) Annual RCP2.6 WMGHG emissions
GWP100
GTP100
GWP*
Year of "net zero" emissions:
1900 1950 2000 2050 2100Year
-1
0
1
2
3
4
5
6
Em
issio
ns (
TtC
O2-e
)
b) Cumulative WMGHG emissions and
Year of peak warming:
& temperature response (black)
0
1
2
Warm
ing
(oC
)
Second Order Draft Chapter 1 IPCC SR1.5
Do Not Cite, Quote or Distribute 1-32 Total pages: 78
impact on GMST on specific single time horizons but unrepresentative of the temperature impacts of combined 1 emissions of long–lived gases and SLCFs over multiple time horizons. 2 3
4
1.2.6 Definitions of warming commitment 5
6
A central question of this report is whether limiting global mean temperature increase to 1.5°C above 7
pre–industrial is ‘feasible’ (Cross–Chapter Box 1.3). The feasibility of this temperature goal will 8
depend on the warming ‘commitment’ that arises due to inertia in the geophysical climate system, but 9
also due to technological, economic, institutional and behavioural lock–in. 10
11
Geophysical warming commitment is defined as the unavoidable future warming resulting from 12
physical Earth system inertia. Different variants of geophysical warming commitment are discussed in 13
the literature: the ‘constant composition commitment’, which is the remaining warming if 14
atmospheric composition and hence radiative forcing were stabilised at the current level and the ‘zero 15
emissions commitment’, which defines the remaining warming if future anthropogenic emissions of 16
greenhouse gases and aerosol precursors were eliminated (Collins et al., 2013). The constant 17
composition commitment has been used to illustrate inertia in the physical climate system, primarily 18
associated with slow heat uptake by the ocean (Hansen et al., 2005), and has led to the misconception 19
that substantial future warming is inevitable (Matthews and Solomon, 2013). This variant of 20
commitment includes the warming resulting from past emissions, as well as the warming from the 21
declining but non–zero future emissions that are required to maintain a constant atmospheric 22
composition. It is therefore ill–suited to estimate future warming resulting from geophysical inertia 23
alone. 24
25
The zero emissions commitment (ZEC), although based on highly idealised assumptions, allows for a 26
clear separation of the climate system response to past emissions from the effect of future emissions. 27
The magnitude and sign of the ZEC depend on the mix of gases considered because of different 28
atmospheric residence times1 and signs of radiative forcing. For CO2, which has an atmospheric 29
residence time of centuries to millennia (Eby et al., 2009), the multi–century warming commitment 30
from emissions to date ranges from slightly negative (i.e., a slight cooling relative to present–day) to 31
slightly positive (Frölicher and Joos, 2010; Gillett et al., 2011; Lowe et al., 2009; Matthews and 32
Zickfeld, 2012). The warming commitment from past CO2 emissions is close to zero because the 33
warming effect of ocean thermal inertia is approximately balanced by declining radiative forcing due 34
to CO2 uptake by the ocean (Solomon et al., 2009) Figure 1.6, blue solid line). Thus, although the 35
present–day CO2–induced warming is irreversible for millennia, past CO2 emissions do not commit to 36
substantial further warming. 37
38
For greenhouse gases and other warming SLCFs with a short atmospheric residence time (order of 39
decades or less) such as methane (CH4), the ZEC is negative, implying cooling relative to present–day 40
if future emissions of these gases are eliminated (Frölicher and Joos, 2010; Matthews and Zickfeld, 41
2012; Figure 1.6, purple line). This cooling arises from a rapid decline in radiative forcing, which 42
dominates over the warming effect of ocean thermal inertia. Cooling SLCFs (those causing negative 43
radiative forcing) such as sulphate aerosols have a positive ZEC, as elimination of the radiative 44
‘dimming’ effect of aerosols results in rapid warming (Frölicher and Joos, 2010; Matthews and 45
Zickfeld, 2012; Samset and Myhre, 2017; Smith et al., 2018). Estimates of the warming commitment 46
from eliminating aerosol emissions are uncertain due to large uncertainties in aerosol radiative forcing 47
(Myhre et al., 2013). If present–day emissions of GHGs and aerosols (including sulphate, nitrate and 48
carbonaceous aerosols) are eliminated (Figure 1.6, yellow line), GMST rises over the decade 49
immediately following elimination of emissions (Matthews and Zickfeld, 2012; Smith et al., 2018), 50
1FOOTNOTE We here refer to the adjustment time, rather than the turnover time of a gas in the atmosphere. Adjustment
time characterizes the time scale of decay of an instantaneous pulse input of a gas into the atmosphere.
Second Order Draft Chapter 1 IPCC SR1.5
Do Not Cite, Quote or Distribute 1-33 Total pages: 78
driven by the removal of negative aerosol radiative forcing. This initial warming is followed by a 1
gradual cooling driven by the decline in radiative forcing of short–lived GHGs and in year 2100 2
ranges from –0.4°C to 0.25°C relative to present–day (Matthews and Zickfeld, 2012; Mauritsen and 3
Pincus, 2017; Smith et al., 2018) 4
5
Geophysical warming commitment can be thought of as the minimum warming commitment, absent 6
inertia in the socio–economic system. However, existing infrastructure, technologies, policies, 7
institutions, and behavioural and social norms can constrain the rate and magnitude of future GHG 8
emission reductions. These constraints could determine the GHG emissions reductions that are 9
feasible in the near– and medium–term and define the warming commitment resulting from socio–10
economic inertia (referred to as the ‘feasible scenario commitment’; Hare and Meinshausen, 2006). 11
12
Three main types of inertia in the socio and techno–economic system have been identified in the 13
literature: infrastructural and technological, institutional, and behavioural (Davis et al., 2010; Seto et 14
al., 2016; Unruh, 2000). Infrastructural and technological inertia arises from the long lifetime and 15
large investments associated with GHG–emitting infrastructure (Davis et al., 2010; Davis and 16
Socolow, 2014; Fuglestvedt et al., 2017; Pfeiffer et al., 2016). For instance, unless power plants are 17
retrofitted with carbon capture and sequestration (CCS) or operable infrastructure decommissioned 18
before the end of their technical lifetime, existing infrastructure can be expected to contribute CO2 19
emissions and warming for many decades. Davis et al. (2010) estimate 0.2–0.5°C warming in 2060 20
from existing GHG–emitting infrastructure (as of 2009) in energy, transportation, industrial, 21
residential and commercial sectors. Using the same rates of GHG–emitting infrastructure retirement, 22
Smith et al. (2018) estimate a committed warming of –0.2°C to 0.7°C in 2100. The larger range than 23
in Davis et al. (2010) arises due to their consideration of physical climate system uncertainty. 24
25
In contrast to infrastructure and technological inertia, ‘institutional inertia is an intended feature of 26
institutional design, not an unintended by–product of systemic forces’ (Hughes, 2017; Munck af 27
Rosenschöld et al., 2014; Seto et al., 2016; Taylor, 2016). Institutional inertia arises because 28
‘powerful economic, social, and political actors seek to reinforce a status quo that favours their 29
interests against impending change or to create and then stabilise a new, more favourable, status quo’ 30
(Seto et al., 2016). This suggests that overcoming institutional inertia requires efforts on different 31
levels and in various social fields (Hughes, 2017; Munck af Rosenschöld et al., 2014; Seto et al., 32
2016; Taylor, 2016). 33
34
The transition to a low–carbon trajectory is also hampered by behavioural inertia, where the 35
competing concerns and pressures that individuals face in society influence their consumption 36
choices. This creates a self–perpetuating cycle where increasing levels of consumption become 37
normalised (Jackson, 2017; O’Rourke and Lollo, 2015). Habits, risk–aversion and the necessity of 38
collective action to solve the climate change problem (giving the feeling to individuals that they have 39
little control) can lock in carbon–intensive behaviours (Seto et al., 2016). Also, individual behaviour 40
is constrained by the interconnected patterns of social practices that are, in turn, embedded in material 41
arrangements that change only slowly in response to changes in the technological and political 42
environment (Shove et al., 2015). Infrastructure and demand–side solutions and strategies have 43
substantial potential to enable new possibilities to overcome behavioural and habitual barriers 44
(Creutzig et al., 2016). The unavoidable warming from behavioural and institutional inertia has not 45
yet been quantified. 46
47
While social, techno–economic and institutional inertia are difficult to quantify, ‘pure’ geophysical 48
inertia (in the form of the ZEC) is relatively small. Yet there is clearly a profound difference between 49
a state of high emissions and rapid on–going warming and one in which emissions are approaching 50
zero, even though the ZEC in both cases may be small. Leach et al. (2017) introduce a simple way of 51
visualising this ‘trajectory commitment’ (a communication device, not an actual commitment) 52
through the notion of an ‘action timescale’ implied by a given temperature stabilisation goal. This is 53
Second Order Draft Chapter 1 IPCC SR1.5
Do Not Cite, Quote or Distribute 1-34 Total pages: 78
defined as the time GMST would take to reach the target temperature at the current warming rate: if 1
temperatures are now at 1°C and increasing at 0.02°C per year (Haustein et al., 2017) then the action 2
timescale for 1.5°C is 25 years, in that GMST would reach 1.5°C in the early 2040s if the current rate 3
of warming continues. 4
5
More relevant to mitigation, this ‘1.5°C action timescale’ is also the timescale over which the rate of 6
warming would need to fall by 50% under a linear decline over time (or 63% under exponential 7
decline) to limit peak warming to 1.5°C. The rate of CO2–induced warming is proportional to the CO2 8
emission rate (Matthews et al., 2009; Zickfeld et al., 2009), while total non–CO2 warming is 9
approximately proportional to total non–CO2 radiative forcing (Gregory and Forster (2008) and 10
Section 1.2.4.5). Hence both the annual rate of CO2 emissions, and the rate of increase in non–CO2 11
forcing would have to fall by a similar fraction over the same action timescale to be consistent with 12
temperatures remaining below the 1.5°C goal, assuming a steady decline starting immediately. 13
Present rates of CO2 emissions and rates of increase of non–CO2 radiative forcing do not commit to 14
absolute future warming, but they do commit to minimum future reduction rates if specific levels of 15
future warming are to be avoided. 16
17
18 Figure 1.6: Radiative forcing (top) and global mean surface temperature change (bottom) for scenarios with 19
different combinations of greenhouse gas and aerosol precursor emissions reduced to zero in 20 2020. Variables were calculated using a simple climate–carbon cycle model (Millar et al., 2017b) 21
Second Order Draft Chapter 1 IPCC SR1.5
Do Not Cite, Quote or Distribute 1-35 Total pages: 78
with a simple representation of atmospheric chemistry (Smith et al. 2017; Smith et al. 2018). Bars 1 on the right–hand side indicate the median and 5–95% percentiles of a model ensemble generated 2 by taking into account uncertainty in climate sensitivity, transient climate response, effective 3 radiative forcing, ocean heat uptake and carbon cycle response. Dotted blue lines show a 4 hypothetical case where CO2 emissions are reduced linearly to zero over 56 years, with constant 5 non–CO2 forcing, to illustrate the response to idealised linear decline over an action timescale of 6 28 years, chosen to stabilize temperatures at 1.5°C. Dotted blue line in top panel shows that stable 7 temperatures are associated with declining radiative forcing. 8
9
10
Multiple dimensions of impacts at 1.5° C and beyond 11
12
This section discusses the multi–dimensionality of the impacts of climate change at 1.5°C and 13
beyond, to explain in particular why it is not possible to arrive at a single global number comparing 14
impacts at 1.5°C, 2°C or any other level. It also provides context in terms of observed impacts over 15
recent decades, as temperatures have been approaching 1°C. Examples are given to clarify the 16
concepts introduced, but for a detailed assessment of impacts, the reader is referred to Chapter 3 of 17
this report. 18
19
The impacts of climate change throughout the world are projected to be uneven and, in some 20
instances, very localised. Impacts are consequences not only of rising temperatures, sea level and 21
ocean acidification, but also of shifting rainfall patterns and extreme events such as floods, droughts, 22
and heat waves (IPCC, 2014c). Impacts can be direct, for example, coral bleaching due to ocean 23
warming, and indirect, for example, reduced tourism due coral bleaching at a particular site. Impacts 24
can also be a consequence of mitigation (Section 1.3.2.4) as well as remedial options such as solar 25
radiation management (Cross–Chapter Box 4.2 and Section 4.3.9). Impacts of climate change have 26
already been observed across all continents and across the oceans, affecting many sectors including 27
natural and managed ecosystems, urban and rural areas, economic services, human health, livelihoods 28
and poverty, and human security (IPCC, 2014c). Several impacts are now formally attributed to 29
anthropogenic global warming and associated rainfall changes (Cramer et al., 2014; Hansen et al., 30
2016; Rosenzweig et al., 2008), but other forcings play major roles, such as land use change (e.g., 31
Hosonuma et al., 2012) and atmospheric pollution (e.g., tropospheric ozone; Sitch et al., 2007). 32
33
The terms impact and risk are used differently, sometimes interchangeably, and inconsistently within 34
and across disciplines, with different explicit or implicit definitions. The term ‘impacts’ can refer to 35
observed consequences of climate change for human and natural systems; or can be used as a 36
synonym for projected risks. Risk can refer to the probability of a projected change in the climate 37
system; can be defined within a traditional risk management context as probability times 38
consequence; or can be defined as a function of hazard, exposure, and vulnerability (IPCC, 2014c). 39
40
To promote clarity and consistency, this report uses these definitions: 41
Consistent with the definition used in the AR5, impact refers to observed consequences or 42
outcomes (positive or negative) of climate change on human and natural systems; 43
Projected impact refers to the projected consequences of climate change for physical (e.g. air, 44
water, energy) and biogeochemical (e.g. carbon cycle, ecosystems, chemistry) systems where 45
there is high confidence in the change and that other drivers would not alter the projection 46
(e.g. projected impact of climate change on the frequency and intensity of heat waves); and 47
Consistent with the definition used in the AR5, risk or projected risk refers to the 48
projected consequence(s) of climate change for human–influenced systems where 49
drivers of vulnerability and exposure (e.g., demographic change, urbanization 50
pathways, changes in income, progress in research and development) can influence 51
the magnitude and pattern of the projection (e.g., changes in heat–related mortality or 52
crop yields in future decades). 53
54
Second Order Draft Chapter 1 IPCC SR1.5
Do Not Cite, Quote or Distribute 1-36 Total pages: 78
The reference to ‘1.5°C and 2°C above pre–industrial’ is based on the objectives of the Paris 1
Agreement, thus defined in the context of the UNFCCC; but what do we mean when we say ‘impacts 2
of 1.5°C and 2°C’? Differentiating the impacts of 1.5°C from those of 2°C does not imply a scientific 3
statement of safe vs. unsafe conditions of environmental change. An additional 0.5°C (i.e., a 2°C 4
warming world versus 1.5°C) for heat–related extremes in the tropics marks the difference between 5
events at the upper limit of current day natural variability and a new climate regime (Schleussner et 6
al., 2016b). For Mediterranean land ecosystems, an additional 0.5°C is expected to result in changes 7
that are unmatched during the last 10,000 years (Guiot and Cramer, 2016). For this Special Report, 8
‘impacts at 1.5°C’ refers to the projected impacts when the expected global average of near–surface 9
air temperature is 1.5°C above the pre–industrial period (the same principle applies to impacts at 10
2°C). By examining impacts at 1.5°C vs. those at 2°C, this report discusses the avoided impacts by 11
maintaining global temperature increase at or below 1.5°C as compared to 2°C, noting that these also 12
depend on the pathway taken to 1.5°C (see Section 1.2.4 and Cross–Chapter Box 3.2 on 1.5°C 13
warmer worlds). Chapter 3 presents an in–depth analysis of changes in impacts at 1.5°C vs. 2°C and 14
higher levels of warming. 15
16
Observed impacts may be caused by various climate drivers. While formal detection and attribution 17
techniques and numerical models now are commonly used to attribute impacts to a particular level of 18
(anthropogenic) warming (e.g., Hansen and Stone 2016), indigenous and local knowledge can be 19
equally important. Although a region may not be classified as being impacted from a climatological 20
perspective, due to a lack of scientific climate data, local community knowledge of impacts can be 21
equally important in assessing impacts (Brinkman et al., 2016; Kabir et al., 2016). The challenge is 22
that a community’s perception of loss due to the impacts of climate change, is often defined via lived, 23
embodied and place–based experiences, which are felt rather than tangible or empirical, and therefore 24
exceedingly hard to predict (Tschakert et al., 2017). 25
26
Impacts are multi–dimensional; hence, there is no universal metric of total or aggregate impact. While 27
some dimensions of impacts are obvious (space, time, sector), others are less well defined (equity), 28
but are all relevant to society. Attributing observed impacts as well as assessing risks for future 29
impacts requires information about both, the amount of physical change in the environment 30
(temperature, rainfall, extreme events), and the sensitivities and possible thresholds of resilience in 31
impacted systems, which differ widely from one system to another and which may be non–linear. 32
33
34
1.3.1 Physical Dimensions of Impacts 35
36
1.3.1.1 Spatial and temporal distribution of impacts 37
38
The spatial and temporal distributions of impacts are key considerations in understanding what 1.5°C 39
impacts mean for people. In the context of this assessment, local consequences of global warming at 40
1.5°C and 2°C are assessed (Chapter 3). Many regions experience higher than average rates of 41
warming and some are already now 1.5°C warmer with respect to the pre–industrial period (Figure 42
1.3). For example, some parts of Africa are warming much faster than others (Déqué et al., 2016; 43
Niang et al., 2014). Temperature and precipitation changes may differ substantially for different 44
seasons. At global warming of 1.5°C, some seasons will be substantially warmer than 1.5°C above 45
pre–industrial (Seneviratne et al., 2016). Therefore, local/regional impacts of a global mean warming 46
of 1.5°C will differ from those of local warming by 1.5°C. The “warming experience at 1.5°C” in this 47
report will be that of local climate change (temperature, rainfall and other changes) at the time when 48
global average temperatures, as defined in Section 1.2.1, reach 1.5°C above pre–industrial. 49
50
51
52
Second Order Draft Chapter 1 IPCC SR1.5
Do Not Cite, Quote or Distribute 1-37 Total pages: 78
1.3.1.2 Implications of 1.5°C for extreme events and associated impacts 1
2
For many regions, an increase in global mean temperature by 1.5°C or 2°C implies substantial 3
increases in the occurrence and/or intensity of some extreme events (Fischer and Knutti, 2015; 4
Karmalkar and Bradley, 2017; King et al., 2017), generating different impacts (see Chapter 3). In cold 5
regions, warming may also imply decreased occurrence of some extremes, however, these changes 6
could still imply increased risks, due to warm anomalies affecting cold–adapted systems (Seneviratne 7
et al., 2012). 8
9
Changes in most extreme events in 1.5°C versus 2°C warming worlds are likely to be region specific. 10
An example is changes in extreme precipitation in the mid–latitudes, where high–precipitation events 11
are common, versus tropical regions, where precipitation is less variable, with higher total 12
precipitation but fewer extremes. Li et al. (2017) show that at mid–latitude locations in South 13
America, there is a relatively modest, almost monotonic increase in the probability of heavy 14
precipitation when comparing historical climate to 1.5°C and 2°C warming worlds. For tropical 15
locations, they show that there is a much larger decrease in the intensity of heavy–precipitation when 16
comparing historical climate to a 1.5°C warming world, but very little change between historical 17
climate and a 2°C warming world, indicating a non–monotonic response. Hence, changes in 18
frequency of some extremes may not only be of the opposite sign in different regions, but scale 19
differently from 1.5°C warming worlds to 2°C warming worlds, and the magnitude of the change can 20
vary markedly. 21
22
23
1.3.1.3 Non–temperature related impacts 24
25
Although the focus of this special report is on 1.5°C global warming, it is important to note that many 26
impacts do not depend on warming alone. For example, changes in rainfall affect the hydrological 27
cycle and water availability (Schewe et al., 2014). Several impacts depend on atmospheric 28
composition, for example, increasing atmospheric carbon dioxide levels leading to ocean acidification 29
(Hoegh–Guldberg et al., 2007). Other impacts are driven by changes in ocean heat content, for 30
example the destabilization of coastal ice–sheets and sea–level rise (Bindoff et al., 2007; Chen et al., 31
2017), whereas impacts due to heatwaves depend directly on ambient air or ocean temperature 32
(Matthews et al., 2017; Meehl and Tebaldi, 2004). Impacts may also be triggered by combinations of 33
these factors, including ‘impact cascades’, that is through secondary consequences of changed 34
systems. Changes in agricultural water availability caused by upstream changes in glacier volume are 35
a typical example. Recent studies also identify compound events (e.g., droughts and heat waves), that 36
is, when impacts are induced by the combination of several climate events (AghaKouchak et al., 37
2014; Le Quéré et al., 2016; Leonard et al., 2014; Martius et al., 2016; Zscheischler and Seneviratne, 38
2017). 39
40
41
1.3.1.4 Probability, uncertainty and non–linearity of impacts 42
43
Uncertainties in projections of future climate change come from a variety of different sources, 44
including the assumptions made regarding future emission pathways (Moss et al., 2010), the inherent 45
limitations and assumptions of the climate models used for the projections, for example, their 46
limitations in simulating regional climate variability (James et al., 2017), downscaling methods 47
(Ekström et al., 2015), and the uncertainties in the impact models (e.g., Asseng et al., 2013). The 48
trajectory of climate change also affects uncertainty with respect to impacts. For example, the impacts 49
of overshooting 1.5°C and stabilization at a later stage, compared to stabilization at 1.5°C without 50
overshoot may differ in magnitude (Schleussner et al., 2017). Additionally, the capacity of some 51
ecosystems to recover after an overshoot may not be well known (assessed in detail in Chapter 3). 52
53
Second Order Draft Chapter 1 IPCC SR1.5
Do Not Cite, Quote or Distribute 1-38 Total pages: 78
The IPCC (2014) and World Bank (2013) underscored the non–linearity of projected risks and 1
impacts as temperature rises from 2°C to 4°C of warming, particularly in relation to water availability, 2
heat extremes, bleaching of coral reefs, and more. Recent studies (James et al., 2017; Schleussner et 3
al., 2016a) assess the impacts of 1.5°C versus 2°C warming, with the same message of non–linearity. 4
For some extremes, non–linearity of impacts may ensue when using threshold–based indices such as 5
those for extreme temperature events as a result of dry soils amplifying hot temperature extremes 6
(Whan et al., 2015) and for projected abrupt changes in rainfall, as a response to future increases in 7
temperature (Schewe and Levermann, 2017). 8
9
10
1.3.2 Dimensions of Ecosystem Impacts 11
12
1.3.2.1 Sensitivity of organisms and ecosystems to climate change 13
14
Impacts of climate change on natural and managed ecosystems can imply loss or increase in growth, 15
biomass or diversity at the level of species populations, landscapes or entire biomes. They occur in 16
addition to the natural variation in growth, ecosystem dynamics, disturbance, succession and other 17
processes, rendering attribution of impacts at lower levels of warming difficult in certain situations. 18
The same degree of warming can be lethal during some phase of the life of an organism and irrelevant 19
during another. Many ecosystems (notably forests) undergo long–term successional processes 20
characterised by varying levels of resilience to environmental change over time, including the 21
possibility of abrupt changes, for example as a consequence of unusual drought events (Settele et al., 22
2014). 23
24
Organisms and ecosystems may adapt to environmental change to a certain degree, for example., 25
through changes in physiology, ecosystem structure, species composition or evolution. Large–scale 26
shifts in ecosystems may cause important feedbacks, for example, in terms of changing water and 27
carbon fluxes through impacted ecosystems – these can amplify or dampen atmospheric change at 28
regional to continental scale. For example, of particular concern, is the response of most of the world's 29
forest ecosystems and many seagrass ecosystems, all of which play key roles as carbon sinks (Marbà 30
et al., 2015; Settele et al., 2014). 31
32
33
1.3.2.2 Drivers of ecosystem impacts 34
35
Mean temperature and (for land ecosystems) precipitation are the main drivers of ecosystem 36
processes, any change in them will at some point change the ecosystem. In addition, other 37
environmental variables, such as the frequency or intensity of extreme weather events such as storms, 38
floods or droughts, also play a major role (Seneviratne et al., 2012). Marine ecosystems are also 39
affected by ocean acidification caused by increasing atmospheric CO2 concentrations (e.g., Hoegh–40
Guldberg et al., 2007 and see Section 1.3.1.3). In addition to the combination of these drivers of 41
change, human use (agriculture, forestry, fisheries) or other direct human impacts (urbanization, 42
pollution) play a major role which can even dominate over change in climate (e.g., Hosonuma et al. 43
2012). Quantification of ecosystem impacts, and their attribution to climate change is therefore 44
particularly challenging, notably at moderate levels of warming (Settele et al., 2014). 45
46
47
1.3.2.3 Resilience and irreversibility 48
49
The resilience of ecosystems, that is, their ability to resist to change, or to recover after a disturbance, 50
may change, and often decline, in a non–linear way. An example are reef ecosystems, with some 51
studies suggesting that reefs will change, rather than disappear entirely, and particular species 52
showing greater tolerance to coral bleaching than others (Pörtner et al., 2014). A key issue is therefore 53
Second Order Draft Chapter 1 IPCC SR1.5
Do Not Cite, Quote or Distribute 1-39 Total pages: 78
whether ecosystems such as coral reefs survive an overshoot scenario, and to what extent would they 1
be able to recover after stabilization at 1.5°C or higher (see Box 3.6). 2
3
4
1.3.2.4 Impacts of climate change mitigation efforts on ecosystems 5
6
Some ambitious efforts to constrain atmospheric greenhouse gas concentrations may themselves 7
impact ecosystems. In particular, changes in land use, potentially required for massively enhanced 8
production of biofuels (either as simple replacement of fossil fuels, or as part of Bioenergy with 9
Carbon Capture and Storage (BECCS)) will impact all other land ecosystems through competition for 10
land (e.g., Creutzig 2016). Depending on earlier use, transformation of land area to biofuel plantations 11
is likely to reduce the availability of other services from these areas, including food provisioning and 12
storage of carbon in soils (for estimates of potentially affected land area, see Box 3.10). 13
14
15
1.3.3 Human dimensions of impacts including vulnerability and adaptive capacity 16
17
There is increasing evidence that climate change is having observable and often severely negative 18
effects on people, especially where climate–sensitive biophysical conditions and 19
socioeconomic/political constraints on adaptive capacities combine to create high vulnerabilities 20
(IPCC, 2012c, 2014c; World Bank, 2013). The character and severity of impacts depend not only on 21
the hazards (e.g. changed climate averages and extremes) but also on the vulnerabilities of different 22
communities, and their exposure to climate threats. The impacts of 1.5°C global warming will vary 23
temporally and spatially as different parts of the globe warm unevenly (Ebi et al., 2016). These will 24
affect a range of natural and human systems such as natural resources development and provisions 25
capacities, coastal zones, agricultural production systems, infrastructure systems, the built 26
environment, human health and other socio–economic systems (Rosenzweig et al., 2017). 27
28
Adaptive capacity to a 1.5°C warming world will vary markedly for individual sectors and across 29
sectors such as water supply, public health, infrastructure, ecosystems and food supply. For example, 30
density and risk exposure, infrastructure vulnerability and resilience, governance and institutional 31
capacity all drive different impacts across a range of human settlement types (Dasgupta et al., 2014; 32
Revi et al., 2014; Rosenzweig et al., 2015). Additionally, the adaptive capacity of communities and 33
human settlements in both rural and urban areas, especially in highly populated regions, poses several 34
equity, social justice and sustainable development issues. Vulnerabilities due to gender (Arora–35
Jonsson, 2011; Resurrección, 2013), age, level of education and culture among others, act as 36
compounding factors. 37
38 Climate change already disproportionately affects the most vulnerable segments of society, in both 39
urban and rural areas (IPCC, 2014d; Rosenzweig et al., 2015; World Bank, 2013). These populations, 40
communities, and institutions often lack adaptive capacity to increased climate risk and to new or 41
emerging risks. Climate change is also projected to slow down economic growth and make poverty 42
reduction more difficult (Arent et al., 2014), a substantial threat to the sustainable development of 43
most of the vulnerable countries. Furthermore, differences in vulnerability and exposure to climate 44
change arise from non–climatic factors and from multi–dimensional inequalities, which are often a 45
result of uneven development processes, leading to different risks from climate change (Olsson et al., 46
2014). 47
48
49
Second Order Draft Chapter 1 IPCC SR1.5
Do Not Cite, Quote or Distribute 1-40 Total pages: 78
1.5°C in the context of strengthening the global response to the threat of climate change, 1
sustainable development, and efforts to eradicate poverty, with consideration for ethics 2
and equity 3
4
The connection between the enabling conditions for limiting global warming to 1.5°C and ambitions 5
of UN sustainable development goals are complex and multifaceted. Climate mitigation–adaptation 6
linkages, synergies and trade–offs are important when considering opportunities for sustainable 7
development. The IPCC AR5 acknowledged that ‘adaptation and mitigation have the potential to both 8
contribute to and impede sustainable development, and sustainable development strategies and 9
choices have the potential to both contribute to and impede climate change responses’ (Denton et al., 10
2014). Climate mitigation and adaptation measures and actions can reflect and enforce specific 11
patterns of development and governance that differ amongst the world’s regions. This report also 12
assesses where limited adaptation and mitigation capacity, limits to adaptation and mitigation, and 13
conditions of mal–adaptation and mal–mitigation are present. This section details the framing of 14
various implementation options, enabling conditions (for more discussion see Cross–Chapter Box 1.3 15
on feasibility2), capacities and types of knowledge and their availability (Blicharska et al., 2017) that 16
can allow institutions, communities and societies at large to respond to the 1.5°C challenge in the 17
context of sustainable development, as well as integrating other direct relevant international 18
agreements such as the Sendai framework for disaster risk reduction. Equity and ethics are recognised 19
as issues of paramount importance in reducing vulnerability and eradicating poverty. 20
21
22
1.4.1 Equity, rights and responsibilities 23
24
Equity and ethics are important framing elements of this report. Climate change raises a set of equity 25
and ethical issues. For example, poverty and inequity are worsened by climate change and constitute 26
barriers to achieving sustainable development (O’ Brien et al., 2012). As indicated by Stern (2014), 27
climate change poses a problem of risk management on an immense scale. The consequences of 28
business–as–usual significantly threaten human security in a variety of ways, including the possible 29
displacement of hundreds of millions of people, which in turn may contribute to prolonged conflict 30
(Adger et al., 2014; Ionesco et al., 2016). Risks on this scale disproportionately affect the poor and 31
disenfranchised, raising ethical concerns about the distribution of climate change impacts and the 32
responsibility for its occurrence and scale (Reckien et al., 2017). A focus on rights and responsibilities 33
help to clarify the root causes of climate risks, and assist in their distribution and management. 34
35
The principle of equity is a central hinge of climate response efforts across geographies and 36
generations (Kolstad et al., 2014). The Paris Agreement mentions the principle of equity on five 37
separate occasions, and the preamble in particular provides several examples of matters that fall 38
within the broad ambit of ethics and equity, including sustainable development, poverty eradication, 39
and human rights.3 As IPCC AR5 made clear, these various elements are best understood as mutually 40
supportive and co–achievable within the context of climate action (Fleurbaey et al., 2014b), and are 41
underpinned by various other international hard and soft law instruments (Klein et al., 2014). Success 42
in the effort to mitigate sufficiently to achieve, and to adapt to, a 1.5°C warming world, at the global 43
as well as sub–national levels will depend on a shared capacity to marshal accumulated experience in 44
2FOOTNOTE The term, as used in this report, does not directly incorporate concepts of nested uncertainty
across its multiple dimensions. Instead, the term is used to refer to assessments of the possibility of a particular
outcome given a set of other assumptions. 3FOOTNOTE Internationally protected human rights include rights to life, self-determination, non-
discrimination, public participation, ‘adequate food’ and housing, water and sanitation, the ‘highest available
standard of physical and mental health’, education, and ‘the benefits of scientific progress’. Widely ratified
human rights treaties relevant to climate change include the International Covenant on Civil and Political
Rights, the International Covenant on Economic Social and Cultural Rights, and the UN Convention on the
Rights of the Child (ratified by all but one of the world’s states).
Second Order Draft Chapter 1 IPCC SR1.5
Do Not Cite, Quote or Distribute 1-41 Total pages: 78
applying these instruments to achieve development, climate, and human rights objectives together 1
(Shue, 2014). 2
3
As also noted in IPCC AR5, the principle of equity invokes notions of fairness and justice, comprising 4
both procedural justice (i.e. participation in decision making) and distributive justice (i.e. how the 5
costs and benefits of climate actions are distributed) (Kolstad et al., 2014; Reckien et al., 2017; 6
Savaresi, 2016). Concerns regarding equity are central to the debates about mitigation, adaptation and 7
climate governance as they open up opportunities to discuss who must cut emissions, who must pay 8
for pollution, who has benefitted most, and who has the capability to respond (Ajibade, 2016; Reckien 9
et al., 2017; Schroeder et al., 2012; Caney, 2005). Hence, equity offers a useful organizing framework 10
for understanding the asymmetry between the distributions of benefits and costs in relation to climate 11
change (Aaheim et al., 2016; Schleussner et al., 2016a). 12
Four key asymmetries in approaching the 1.5°C target have been noted by scholars, all foreshadowed 13
in the UNFCCC (Ajibade, 2016; Harlan et al., 2015; Okereke, 2010; Reckien et al., 2017; Savaresi, 14
2016). The first is the asymmetry in contributions to the problem. Shue (2013) argues that while 15
industrialization has benefitted humanity generally, the benefits have been unevenly distributed and 16
those who benefited most historically have also contributed most to the current climate problem and 17
so bear greater responsibility. The second asymmetry concerns differential impact; it is exacerbated 18
because the worst impacts tend to fall on those least responsible for the problem. Conditions of 19
climate disruption leading to forced migration provide an acute example of this asymmetry (Ionesco 20
et al., 2016). Intergenerational equity also warrants consideration here. The third point of connection 21
in the climate–justice nexus is asymmetry in the power to take decisions regarding solutions and 22
response strategies. Powerful actors and stakeholders have greater influence on setting the climate 23
action agenda to their advantage. Fourth there is an asymmetry in future–response capacity: some 24
states and places are at risk of being left behind as the world progresses to a low–carbon economy 25
(Fleurbaey et al., 2014b; Shue, 2014). 26
Klinsky and Winkler (2014) argue that responsibility is differentiable with regard to a ‘trio’ of climate 27
equity challenges: inequality of climate impacts, of development status, and of responsibility. They 28
suggest ‘operationalizing’ equity by including a notion of ‘capabilities’ in addressing domestic 29
climate policies in the context of carbon constraints and climate impacts. A number of scholars have 30
suggested that human rights provide a robust framework for such operationalization, since they 31
about as likely as not (33–66%), likely (>66%), very likely (>90%), extremely likely (>95%) to 29
virtually certain (>99%). These terms are normally only applied to findings associated with high or 30
very high confidence. Where findings are based on frequencies within model ensembles, calibrated 31
uncertainty language is not used to communicate those frequencies unless these are assessed (with 32
other lines of evidence) to correspond to actual probabilities of outcomes (frequency of occurrence 33
within a model ensemble does not correspond actual probability of occurrence unless the ensemble is 34
judged to capture and represent the full range of relevant uncertainties). Figures and text normally use 35
5–95% confidence intervals for observable quantities and the 5–95% frequency interval for ranges of 36
model ensembles. 37
38
39
1.6.3 Challenges in the context of this Special Report 40
41
Three specific challenges arise in the treatment of uncertainty and risk in this report. 42
43
First, the timeline on which this report is being prepared and the current state of the scientific 44
literature on 1.5°C mean that findings based on multiple lines of robust evidence for which 45
quantitative probabilistic results can be expressed may be very few, and those that can be made may 46
not be the most policy–relevant. This introduces a particular challenge for the current assessment: in 47
AR5, whenever a likelihood assessment was given, it could be assumed that it was associated with 48
high or very high confidence, and hence this was not stated. Although allowed by the Uncertainty 49
Guidance, double–qualified expressions that combine both likelihood and confidence language may 50
be difficult to understand (e.g., “very likely (medium confidence)”). To avoid such double–qualified 51
statements, many key findings are expressed in this report using confidence qualifiers alone – but this 52
Second Order Draft Chapter 1 IPCC SR1.5
Do Not Cite, Quote or Distribute 1-56 Total pages: 78
should not be interpreted as implying they are less robust or policy–relevant than statements using 1
likelihood qualifiers. 2
3
Second, many of the most important findings of this Special Report are highly conditional precisely 4
because they refer to ambitious mitigation scenarios. The risks associated with 1.5°C of global 5
warming (meaning risks conditioned on the assumption that global temperatures are at 1.5°C) may be 6
very different from the risks associated with a scenario that has an even chance of remaining below 7
1.5°C. In the second case, risks also need to allow for a substantial chance of warming exceeding 2°C 8
because of uncertainty in the global temperature response. Conditional probabilities often depend 9
strongly on how conditions are specified, such as how temperature goals are met, whether through 10
early emission reductions, greater reliance on negative emissions following an overshoot, or later 11
reductions coupled with a low climate response. Hence whether a certain risk is deemed likely or very 12
likely at 1.5°C may depend strongly on how 1.5°C is specified, whereas a statement that a certain risk 13
may be substantially higher at 2°C relative to 1.5°C may be much more robust. 14
15
Third, the traditional application of probabilistic language in IPCC reports applies to relatively 16
passive systems, such as the projected response of the climate system to a specific emissions scenario. 17
Achieving ambitious mitigation goals will require active, goal–directed efforts aiming explicitly for 18
specific outcomes and incorporating new information as it becomes available. The focus of 19
uncertainty shifts from the climate outcome itself to the level of mitigation effort that may be required 20
to achieve it. Probabilistic statements about human decisions, which may in turn be informed by these 21
statements, are always problematic, but they may also be unnecessary: in the context of robust 22
decision–making, many near–term policies that are needed to keep open the option of achieving 1.5°C 23
may be the same, regardless of the actual probability that the goal will be met. 24
25
26
Storyline of the report 27
28
The storyline of this IPCC Special Report on 1.5° C, as illustrated in Figure 1.7, includes a set of 29
interconnected assessment components. Taken together, these develop a story line of limiting the 30
global temperature increase to 1.5°C above pre–industrial levels and addressing associated impacts 31
and adaptation opportunities while being inclusive of SDGs–related conditions for poverty 32
eradication, equity and ethics. 33
34
At a time of unequivocal and rapid warming, the report’s initial position emerges from the long–term 35
temperature goal of the Paris Agreement; the strengthening the global response to the threat of climate 36
change by pursuing efforts to limit warming to 1.5°C through reducing emissions to restore balance 37
between sources and sinks of greenhouse gases. The assessment focuses first, in Chapter 1, on 38
defining the character of the key report element – 1.5°C itself, and how 1.5°C is defined and 39
understood, what is the current amount of climate change to date, and the present trajectory of change. 40
41
Next, in Chapter 2, the assessment explores the enabling conditions of a 1.5°C warmer world, the 42
feasibility of limiting warming to 1.5°C and the associated pathways. All pathways begin now, and 43
involve rapid and unprecedented societal transformation, in an Anthropocene already experiencing 44
extraordinary technological, social and environmental changes. An important framing device for this 45
report is the recognition that choices that determine emissions pathways, whether ambitious 46
mitigation or ‘no policy’ scenarios, do not occur independent of these other changes and are, in fact, 47
highly interdependent. Technology choice, for example, has significant impact on how future 48
emissions are understood and experienced. 49
50
While the emission pathways present key thematic elements of possible futures, projected impacts 51
that emerge with a 1.5°C warmer world and beyond also are dominant narrative threads of the report. 52
The assessment examines the diverse and uneven human, economic and ecological impacts of a 53
Second Order Draft Chapter 1 IPCC SR1.5
Do Not Cite, Quote or Distribute 1-57 Total pages: 78
global warming of 1.5°C that will be felt within, and last at least, a generation. Projected impacts will 1
have a variety of complex spatial, temporal, and system–level manifestations. Central to the 2
assessment is the reporting of opportunities for and limits to adaptation, potential impacts avoided 3
through limiting warming to 1.5°C and comparing impacts at 1.5°C and 2°C of global warming. 4
5
With better understanding of emission pathways and impacts, response options emerge next in the 6
account, in Chapter 4. Attention is directed to exploring questions of implementation and of profound 7
transformation within a highly inter–dependent world. Emission pathways, in particular, are broken 8
down into a set of specific questions and answers. The role of technological choices, institutional 9
capacity and large–scale global scale trends like urbanization are assessed. Discussion of enabling 10
conditions and feasibility help set the stage. 11
12
The storyline is resolved in Chapter 5 through the vehicle of climate resilient development pathways, 13
developed to define the links between the trajectory towards 1.5°C, associated impacts, emissions 14
pathways and the context of transformation. The report focuses on identifying opportunities and 15
challenges, and implications for ethics and equity, for communities, institutions, countries and the 16
world to transition to climate resilient development pathways. Progress along these pathways will 17
involve learning, adjustment, and reflexivity to maximize the benefits of pursuing climate stabilisation 18
at 1.5°C and the goals of sustainable development. 19
20
21 22
Figure 1.7: Placeholder schematic storyline figure for the rest of the report. 23
24
25
26
Second Order Draft Chapter 1 IPCC SR1.5
Do Not Cite, Quote or Distribute 1-58 Total pages: 78
FAQ 1.1: Why are we talking about 1.5°C? 1
2
In recognition of the fact that climate change already poses a rising risk in many parts of the world , 3
the Paris Agreement aimed to hold temperatures to “well below 2°C”, with efforts to limit the 4
increase to 1.5°C. Recognising limits to scientific knowledge available at the time the Agreement was 5
signed, the UNFCCC invited the IPCC to publish a Special Report on 1.5°C global warming. In 6
particular, countries of the world needed more information on the impacts of 1.5°C warming, global 7
greenhouse gas emission pathways available to achieve 1.5°C, and how transitioning to a 1.5°C 8
world ties in with global efforts to strengthen sustainable development and eradicate poverty, with 9
consideration of ethics and equity. 10
11
At the 21st Conference of the Parties (COP21) in December 2015, government representatives from 12
196 countries negotiated the Paris Agreement. This agreement, the first of its kind, aimed to 13
strengthen the global response to the threat of climate change by holding global temperature rise to 14
“well below 2°C” above pre–industrial levels, and to pursue efforts to limit this increase to 1.5°C. 15
16
Before COP21, there had been little focus on global warming of 1.5°C in the scientific world. In an 17
effort to address this, the United Nations Framework Convention on Climate Change (UNFCCC) 18
invited the IPCC to publish a Special Report on global warming of 1.5°C above pre–industrial levels. 19
The request was that the report, known as SR1.5°C, should not only assess what a 1.5°C warmer 20
world would look like but also the different pathways available to achieve 1.5°C. The Special Report 21
also looks at the wide–ranging implications of those different pathways and what actions would be 22
necessary to transition to a 1.5°C world while promoting sustainable development and efforts to 23
eradicate poverty. 24
25
The mention of 1.5°C in the Paris Agreement recognises that the impacts of climate change are 26
already being felt in many parts of the world and that as the temperature rises, so do associated risks. 27
The probability of extreme weather events and irreversible changes increases rapidly at higher 28
warming levels. Compared to present day, warming of 1.5°C will also exacerbate other global risks, 29
such as the degradation of ecosystems, food insecurity, disease outbreaks, and lack of access to fresh 30
water. The risks posed by global warming of 1.5°C are greater than present day but substantially 31
lower than at 2°C. 32
33
Ethics and equity are essential to understanding the ambition of the Paris Agreement. An asymmetry 34
in vulnerability to climate change means that the impacts of warming levels beyond 1.5°C could fall 35
disproportionately on poor and vulnerable people, and those least responsible for the problem. The 36
combination of increasing exposure and limited capacity to adapt to climate change impacts can 37
amplify the risks posed by 1.5°C and 2°C of warming, particularly for developing countries in the 38
tropics. 39
40
41 [Figure suggestion: A general schematic that shows the different factors that need to be considered 42
when looking at 1.5°C? Impacts, differences compared to other temps, knock–on effect, synergies and 43
trade–offs.] 44
45
46
FAQ 1.2: How close are we to 1.5°C? 47
48
Human–induced warming has already reached about 1°C above preindustrial levels at the time of 49
writing of this report. By the decade 2006–2015, human activity had warmed the world by 0.87°C 50
(±0.1°C) compared preindustrial times (1850–1900). If the current warming rate continues, scientists 51
expect the world would reach human–induced global warming of 1.5°C in the 2040s, but this could be 52
earlier if emissions increase and warming continues to accelerate. 53
Second Order Draft Chapter 1 IPCC SR1.5
Do Not Cite, Quote or Distribute 1-59 Total pages: 78
1
2
Under the 2015 Paris Agreement, countries agreed to cut greenhouse gas emissions to hold the rise in 3
global average temperature to ‘well below 2°C’ above pre–industrial levels, and to pursue efforts to 4
limit the increase to 1.5°C. While the overall intention is clear, the Paris Agreement does not specify 5
precisely what is meant by ‘global average temperature’, or what period in history should be 6
considered ‘pre–industrial’. To answer the question of how close are we to 1.5°C of warming already, 7
scientists need to first define what both of these terms mean. 8
9
In principle, ‘pre–industrial levels’ could refer to any period of time before the start of the industrial 10
revolution, but fewer direct observations exist the further back in time you go. Defining a 11
“preindustrial” reference period is a compromise between the reliability of the data and how 12
representative it is of truly preindustrial times. Some preindustrial periods are cooler than others for 13
purely natural reasons. 14
15
The definition of the pre–industrial reference period, along with the method used to estimate global 16
average temperature, can make a couple of tenths of a degree difference to estimates of historical 17
warming. While this may not affect the big picture of how human activity is influencing the climate, a 18
few tenths of a degree becomes important once we are considering a global temperature limit that is 19
just half a degree above where we are now. 20
21
The Special Report on 1.5°C uses the reference period 1850 to 1900 to represent pre–industrial 22
conditions. This is the earliest period with near–global observations, and any warming experienced 23
before 1850 is partly compensated for by volcanic activity in the 1880s. The period 1850–1900 was 24
also the reference period used in the IPCC 5th Assessment Report (AR5), which provided the 25
scientific context of the negotiations leading up to the Paris Agreement, including that the world was 26
already experiencing the impacts of 0.85°C of warming above pre–industrial conditions. 27
28
Once scientists have decided on the definition of ‘pre–industrial’, the next step is to calculate the 29
amount of warming at any given time relative to that reference period. The amount of warming is, in 30
turn, defined as the change in the combined average temperature over land and the oceans. 31
32
Scientists don’t usually compare conditions between single years since natural variability can cause 33
temperatures to fluctuate considerably either side of the long term warming trend. For example, 2015 34
and 2016 were both substantially warmer than 1°C, but also affected by the strong El Niño event that 35
took place at that time. Instead, scientists compare the average global temperature over at least a 36
decade, correcting for the impact of natural factors that can affect the climate for short periods of 37
time, such as volcanic eruptions. 38
39
By the decade 2006–2015, human activity had already raised global average temperature by 0.87°C 40
(±0.1°C), relative to 1850–1900. This means an additional 0.63°C (±0.1°C) would reach global 41
warming of 1.5°C relative to 1850–1900. The recent rate of increase of 0.2°C per decade, suggests 42
human–induced warming reached 1°C around 2017 and would reach 1.5°C above preindustrial levels 43
in the 2040s. 1.5°C could be reached earlier if emissions increase and warming continues to 44
accelerate. 45
46
While the change in global average temperature tells scientists about the rate at which the planet is 47
changing, looking far more closely at specific regions and countries reveals some important details. 48
Most land regions are warming faster than the global average, for example. This means that warming 49
in many regions already exceeds 1.5°C. Over a fifth of the global population live in regions that have 50
already experienced more than 1.5°C of warming in at least one season. 51
52
53
Second Order Draft Chapter 1 IPCC SR1.5
Do Not Cite, Quote or Distribute 1-60 Total pages: 78
[Figure suggestion: Simple schematic with time on x–axis and global average temperature on y–axis, 1
highlighting relative positions of pre–industrial reference level, where we are now and 1.5°C.] 2
3
4 5
Second Order Draft Chapter 1 IPCC SR1.5
Do Not Cite, Quote or Distribute 1-61 Total pages: 78
References 1 2 Aaheim, A., Wei, T., and Romstad, B. (2016). Conflicts of economic interests by limiting global warming to 3
+3°C. Mitig. Adapt. Strateg. Glob. Chang., 1–18. doi:10.1007/s11027-016-9718-8. 4 ADB (2013). Moving From Risk to Resilience. Available at: https://www.adb.org/publications/moving-risk-5
resilience [Accessed December 13, 2017]. 6 Adger, W. N., Pulhin, J. M., Barnett, J., Dabelko, G. D., Hovelsrud, G. K., Levy, M., et al. (2014). “Human 7
Security,” in Climate Change 2014: Impacts, Adaptation, and Vulnerability. Part A: Global and Sectoral 8 Aspects. Contribution of Working Group II to the Fifth Assessment Report of the Intergovernmental Panel 9 on Climate Change, eds. C. B. Field, V. R. Barros, D. J. Dokken, K. J. Mach, M. D. Mastrandrea, T. E. 10 Bilir, et al. (Cambridge, UK, and New York, NY, USA: Cambridge University Press), 755–791. 11 doi:10.1017/CBO9781107415379.017. 12
Admiraal, A. K., Hof, A. F., den Elzen, M. G. J., and van Vuuren, D. P. (2016). Costs and benefits of 13 differences in the timing of greenhouse gas emission reductions. Mitig. Adapt. Strateg. Glob. Chang. 21, 14 1165–1179. doi:10.1007/s11027-015-9641-4. 15
Agard, J., and Schipper, E. L. (2014). “Annex II: Glossary,” in Climate Change 2014: Impacts, Adaptation and 16 Vulnerability. Contribution of Working Group II to the Fifth Assessment Report of the Intergovernmental 17 Panel on Climate Change, eds. C. B. Field, V. R. Barros, D. J. Dokken, K. J. Mach, M. D. Mastrandrea, 18 T. E. Bilir, et al. (Cambridge, UK, and New York, NY, USA: Cambridge University Press), 1757–1776. 19
AghaKouchak, A., Cheng, L., Mazdiyasni, O., and Farahmand, A. (2014). Global warming and changes in risk 20 of concurrent climate extremes: Insights from the 2014 California drought. Geophys. Res. Lett. 41, 8847–21 8852. doi:10.1002/2014GL062308. 22
Ajibade, I. (2016). Distributive justice and human rights in climate policy: the long road to Paris. J. Sustain. 23 Dev. Law Policy 7, 65. doi:10.4314/jsdlp.v7i2.4. 24
Albert, S., Bronen, R., Tooler, N., Leon, J., Yee, D., Ash, J., et al. (2017). Heading for the hills: climate-driven 25 community relocations in the Solomon Islands and Alaska provide insight for a 1.5 °C future. Reg. 26 Environ. Chang., 1–12. doi:10.1007/s10113-017-1256-8. 27
Allen, M. R., Frame, D. J., Huntingford, C., Jones, C. D., Lowe, J. A., Meinshausen, M., et al. (2009). Warming 28 caused by cumulative carbon emissions towards the trillionth tonne. Nature 458, 1163–1166. 29 doi:10.1038/nature08019. 30
Allen, M. R., Fuglestvedt, J. S., Shine, K. P., Reisinger, A., Pierrehumbert, R. T., and Forster, P. M. (2016). 31 New use of global warming potentials to compare cumulative and short-lived climate pollutants. Nat. 32 Clim. Chang. 6, 1–5. doi:10.1038/nclimate2998. 33
Allen, M. R., Shine, K. P., Fuglestvedt, J. S., Millar, R. J., Frame, D. J., and Macey, A. H. (2017). Quantifying 34 the impact of climate change agreements covering cumulative and short-lived climate pollutants. Nature 35 in press. 36
Andrews-Speed, P. (2016). Applying institutional theory to the low-carbon energy transition. Energy Res. Soc. 37 Sci. 13, 216–225. doi:10.1016/j.erss.2015.12.011. 38
Antwi-agyei, P., Fraser, E. D. G., Dougill, A. J., Stringer, L. C., and Simelton, E. (2012). Mapping the 39 vulnerability of crop production to drought in Ghana using rainfall , yield and socioeconomic data. Appl. 40 Geogr. 32, 324–334. doi:10.1016/j.apgeog.2011.06.010. 41
Archer, D., and Brovkin, V. (2008). The millennial atmospheric lifetime of anthropogenic CO2. Clim. Change 42 90, 283–297. doi:10.1007/s10584-008-9413-1. 43
Arent, D. J., Tol, R. S. J., Faust, E., Hella, J. P., Kumar, S., Strzepek, K. M., et al. (2014). “Key economic 44 sectors and services,” in Climate Change 2014: Impacts, Adaptation, and Vulnerability. Part A: Global 45 and Sectoral Aspects. Contribution of Working Group II to the Fifth Assessment Report of the 46 Intergovernmental Panel of Climate Change, eds. C. B. Field, V. R. Barros, D. J. Dokken, K. J. Mach, M. 47 D. Mastrandrea, T. E. Bilir, et al. (Cambridge, United Kingdom and New York, NY, USA: Cambridge 48 University Press), 659–708. 49
Arora-Jonsson, S. (2011). Virtue and vulnerability: Discourses on women, gender and climate change. Glob. 50 Environ. Chang. 21, 744–751. doi:10.1016/j.gloenvcha.2011.01.005. 51
Asseng, S., Ewert, F., Rosenzweig, C., Jones, J. W., Hatfield, J. L., Ruane, A. C., et al. (2013). Uncertainty in 52 simulating wheat yields under climate change. Nat. Clim. Chang. 3, 827–832. doi:10.1038/nclimate1916. 53
Bäckstrand, K., Kuyper, J. W., Linnér, B.-O., and Lövbrand, E. (2017). Non-state actors in global climate 54 governance: from Copenhagen to Paris and beyond. Env. Polit. 26, 561–579. 55 doi:10.1080/09644016.2017.1327485. 56
Baker, H. S., Karoly, D. J., Millar, R. J., Beyerle, U., Guillod, B. P., Mitchell, D., et al. (2017). The impact of 57 CO2 concentration at 1.5C global warming on climate extremes. Nature submitted. 58
Second Order Draft Chapter 1 IPCC SR1.5
Do Not Cite, Quote or Distribute 1-62 Total pages: 78
Barnett, J., Graham, S., Mortreux, C., Fincher, R., Waters, E., and Hurlimann, A. (2014). A local coastal 1 adaptation pathway. Nat. Clim. Chang. 4, 1103–1108. doi:10.1038/nclimate2383. 2
Bauer, N., Calvin, K., Emmerling, J., Fricko, O., Fujimori, S., Hilaire, J., et al. (2017). Shared Socio-Economic 3 Pathways of the Energy Sector - Quantifying the Narratives. Glob. Environ. Chang. 42, 316–330. 4 doi:10.1016/j.gloenvcha.2016.07.006. 5
Biermann, F., Bai, X., Bondre, N., Broadgate, W., Arthur Chen, C. T., Dube, O. P., et al. (2016). Down to 6 Earth: Contextualizing the Anthropocene. Glob. Environ. Chang. 39, 341–350. 7 doi:10.1016/j.gloenvcha.2015.11.004. 8
Bindoff, N. L., Stott, P. A., AchutaRao, K. M., Allen, M. R., Gillett, N., Gutzler, D., et al. (2013). “Detection 9 and Attribution of Climate Change: from Global to Regional,” in Climate Change 2013: The Physical 10 Science Basis. Contribution of Working Group I to the Fifth Assessment Report of the Intergovernmental 11 Panel on Climate Change, eds. T. F. Stocker, D. Qin, G.-K. Plattner, M. Tignor, S. K. Allen, J. Boschung, 12 et al. (Cambridge, UK and New York, NY, USA: Cambridge University Press), 426–488. 13
Bindoff, N., Willebrand, J., Artale, V., Cazenave, A., Gregory, J., Gulev, S., et al. (2007). Observations: 14 Oceanic Climate Change and Sea Level. Clim. Chang. 2007 Phys. Sci. Basis. Contrib. Work. Gr. I to 15 Fourth Assess. Rep. Intergov. Panel Clim. Chang. 16
Birkmann, J., Welle, T., Solecki, W., Lwasa, S., and Garschagen, M. (2016). Boost resilience of small and mid-17 sized cities. Nature 537, 605–608. doi:10.1038/537605a. 18
Blicharska, M., Smithers, R. J., Kuchler, M., Agrawal, G. K., Gutiérrez, J. M., Hassanali, A., et al. (2017). Steps 19 to overcome the North–South divide in research relevant to climate change policy and practice. Nat. Clim. 20 Chang. 7, 21–27. doi:10.1038/nclimate3163. 21
Boden, T. A., Marland, G., and Andres, R. J. (2015). Global, Regional, and National Fossil-Fuel CO2 22 Emissions. Carbon Dioxide Inf. Anal. Center, Oak Ridge Natl. Lab. US Dep. Energy, Oak Ridge, Tenn., 23 USA doi 10. doi:10.3334/CDIAC/00001_V2010. 24
Bodirsky, B. L., Popp, A., Weindl, I., Dietrich, J. P., Rolinski, S., Scheiffele, L., et al. (2012). N2O emissions 25 from the global agricultural nitrogen cycle-current state and future scenarios. Biogeosciences 9, 4169–26 4197. doi:10.5194/bg-9-4169-2012. 27
Boucher, O., and Folberth, G. A. (2010). New Directions: Atmospheric methane removal as a way to mitigate 28 climate change? Atmos. Environ. 44, 3343–3345. doi:10.1016/j.atmosenv.2010.04.032. 29
Bowerman, N. H. A., Frame, D. J., Huntingford, C., Lowe, J. A., Smith, S. M., and Allen, M. R. (2013). The 30 role of short-lived climate pollutants in meeting temperature goals. Nat. Clim. Chang. 3, 1021–1024. 31 doi:10.1038/nclimate2034. 32
Brinkman, T. J., Hansen, W. D., Chapin, F. S., Kofinas, G., BurnSilver, S., and Rupp, T. S. (2016). Arctic 33 communities perceive climate impacts on access as a critical challenge to availability of subsistence 34 resources. Clim. Change 139, 413–427. doi:10.1007/s10584-016-1819-6. 35
Brondizio, E. S., O’Brien, K., Bai, X., Biermann, F., Steffen, W., Berkhout, F., et al. (2016). Re-conceptualizing 36 the Anthropocene: A call for collaboration. Glob. Environ. Chang. 39, 318–327. 37 doi:10.1016/j.gloenvcha.2016.02.006. 38
Busby, J. (2016). After Paris: Good enough climate governance. Curr. Hist. 15, 3–9. Available at: 39 http://www.currenthistory.com/Busby_CurrentHistory.pdf [Accessed April 7, 2017]. 40
Campbell, B. M., Vermeulen, S. J., Aggarwal, P. K., Corner-Dolloff, C., Girvetz, E., Loboguerrero, A. M., et al. 41 (2016). Reducing risks to food security from climate change. Glob. Food Sec., 0–1. 42 doi:10.1016/j.gfs.2016.06.002. 43
Campos Garcia, A., Ramirez Cortes, F., Dickson, E., Rubiano Vargas, D. M., Diaz, C. G., Costa, C. R., et al. 44 (2011). Analysis of disaster risk management in Colombia a contribution to the creation of public policies. 45 Available at: http://documents.worldbank.org/curated/en/658361468018050201/Main-report [Accessed 46 December 13, 2017]. 47
Caney, S. (2005). Cosmopolitan Justice, Responsibility, and Global Climate Change. Leiden J. Int. Law 18, 48 747–75. doi:10.1017/S0922156505002992. 49
Caney, S. (2010). Climate change and the duties of the advantaged. Crit. Rev. Int. Soc. Polit. Philos. 13, 203–50 228. doi:10.1080/13698230903326331. 51
Capstick, S. B., and Pidgeon, N. F. (2014). Public perception of cold weather events as evidence for and against 52 climate change. Clim. Change 122, 695–708. doi:10.1007/s10584-013-1003-1. 53
Carmichael, J. T., Brulle, R. J., and Huxster, J. K. (2017). The great divide: understanding the role of media and 54 other drivers of the partisan divide in public concern over climate change in the USA, 2001–2014. Clim. 55 Change 141, 599–612. doi:10.1007/s10584-017-1908-1. 56
Castree, N. (2015). Changing the Anthropo(s)cene: Geographers, global environmental change and the politics 57 of knowledge. Dialogues Hum. Geogr. 5, 301–316. doi:10.1177/2043820615613216. 58
Cedervall Lauta, K., and Rytter, J. E. (2016). A landslide on a mudslide? Natural hazards and the right to life 59
Second Order Draft Chapter 1 IPCC SR1.5
Do Not Cite, Quote or Distribute 1-63 Total pages: 78
under the European Convention on Human Rights. J. Hum. Rights Environ. 7, 111–131. 1 doi:10.4337/jhre.2016.01.05. 2
Chen, X., Zhang, X., Church, J. A., Watson, C. S., King, M. A., Monselesan, D., et al. (2017). The increasing 3 rate of global mean sea-level rise during 1993-2014. Nat. Clim. Chang. 7, 492–495. 4 doi:10.1038/nclimate3325. 5
Christensen, J. H., Kumar, K. K., Aldria, E., An, S.-I., Cavalcanti, I. F. a., Castro, M. De, et al. (2013). “Climate 6 Phenomena and their Relevance for Future Regional Climate Change Supplementary Material,” in 7 Climate Change 2013: The Physical Science Basis. Contribution of Working Group I to the Fifth 8 Assessment Report of the Intergovernmental Panel on Climate Change, eds. T. F. Stocker, D. Qin, G. K. 9 Plattner, M. Tignor, S. K. Allen, J. Boschung, et al. (Cambridge: Cambridge University Press), 62. 10 doi:10.1017/CBO9781107415324.028. 11
Chu, E., Anguelovski, I., and Carmin, J. (2016). Inclusive approaches to urban climate adaptation planning and 12 implementation in the Global South. Clim. Policy 16, 372–392. doi:10.1080/14693062.2015.1019822. 13
Clarke, L. E., Jiang, K., Akimoto, K., Babiker, M., Blanford, G., Fisher-Vanden, K., et al. (2014). “Assessing 14 transformation pathways,” in Climate Change 2014: Mitigation of Climate Change. Contribution of 15 Working Group III to the Fifth Assessment Report of the Intergovernmental Panel on Climate Change, 16 eds. O. Edenhofer, R. Pichs-Madruga, Y. Sokona, E. Farahani, S. Kadner, K. Seyboth, et al. (Cambridge, 17 UK, and New York, NY, USA: Cambridge University Press), 413–510. 18
Climate Change 2014: Synthesis Report. Contribution of Working Groups I, II and III to the Fifth Assessment 19 Report of the Intergovernmental Panel on Climate Change (2014). 20
Collins, M., Knutti, R., Arblaster, J., Dufresne, J.-L., Fichefet, T., Friedlingstein, P., et al. (2013). “Long-term 21 Climate Change: Projections, Commitments and Irreversibility,” in Climate Change 2013: The Physical 22 Science Basis. Contribution of Working Group I to the Fifth Assessment Report of the Intergovernmental 23 Panel on Climate Change, eds. T. F. Stocker, D. Qin, G.-K. Plattner, M. Tignor, S. K. Allen, J. Boschung, 24 et al. (Cambridge, UK and New York, NY, USA), 1029–1136. doi:10.1017/CBO9781107415324.024. 25
Cooper, J., and Sheets, P. (2012). Surviving Sudden Environmental Change: Answers From Archaeology. 26 Boulder, CO: University Press of Colorado Available at: 27 http://site.ebrary.com/lib/sunysb/docDetail.action?docID=10556756. 28
Coopman, A., Osborn, D., Ullah, F., Auckland, E., and Long, G. (2016). Seeing the whole: Implementing the 29 SDGs in an Integrated and Coherent Way. 30
Corner, A., and Clarke, J. (2016). Talking climate - from research to practice in public engagement. Oxford: 31 Palgrave Available at: http://climateoutreach.org/new-book-talking-32 climate/%5Cnpapers3://publication/uuid/A47EEFAC-0E86-4070-99FF-71E2DAE59C2F. 33
Cowtan, K., Hausfather, Z., Hawkins, E., Jacobs, P., Mann, M. E., Miller, S. K., et al. (2015). Robust 34 comparison of climate models with observations using blended land air and ocean sea surface 35 temperatures. Geophys. Res. Lett. 42, 6526–6534. doi:10.1002/2015GL064888. 36
Cowtan, K., and Way, R. G. (2014). Coverage bias in the HadCRUT4 temperature series and its impact on 37 recent temperature trends. Q. J. R. Meteorol. Soc. 140, 1935–1944. doi:10.1002/qj.2297. 38
Cramer, W., Yohe, G. W., Auffhammer, M., Huggel, C., Molau, U., Dias, M. A. F. da S., et al. (2014). 39 “Detection and attribution of observed impacts,” in In: Climate Change 2014: Impacts, Adaptation, and 40 Vulnerability. Part A: Global and Sectoral Aspects. Contribution of Working Group II to the Fifth 41 Assessment Report of the Intergovernmental Panel on Climate Change, eds. C. B. Field, V. R. Barros, D. 42 J. Dokken, K. J. Mach, M. D. Mastrandrea, T. E. Bilir, et al. (Cambridge University Press), 979–1037. 43
Crespo Cuaresma, J. (2017). Income projections for climate change research: A framework based on human 44 capital dynamics. Glob. Environ. Chang. 42, 226–236. doi:10.1016/j.gloenvcha.2015.02.012. 45
Creutzig, F. (2016). Economic and ecological views on climate change mitigation with bioenergy and negative 46 emissions. GCB Bioenergy 8, 4–10. doi:10.1111/gcbb.12235. 47
Creutzig, F., Fernandez, B., Haberl, H., Khosla, R., Mulugetta, Y., and Seto, K. C. (2016). Beyond Technology: 48 Demand-Side Solutions for Climate Change Mitigation. Annu. Rev. Environ. Resour. 41, 173–198. 49 doi:10.1146/annurev-environ-110615-085428. 50
Crutzen, P. J. (2002). Geology of mankind. Nature 415, 23. doi:10.1038/415023a. 51 Crutzen, P. J. (2006). Albedo Enhancement by Stratospheric Sulfur Injections: A Contribution to Resolve a 52
Policy Dilemma? Clim. Change 77, 211. doi:10.1007/s10584-006-9101-y. 53 Crutzen, P. J., and Stoermer, E. F. (2000). The Anthropocene. IGBP [International Geosphere-biosph. 54
Program. Newsl. 41, No page numers given. 55 Czerniewicz, L., Goodier, S., and Morrell, R. (2017). Southern knowledge online? Climate change research 56
discoverability and communication practices. Information, Commun. Soc. 20, 386–405. 57 doi:10.1080/1369118X.2016.1168473. 58
Dasgupta, P., Morton, J. ., Dodman, D., Karapinar, B., Meza, F., Rivera-Ferre, M. ., et al. (2014). “Rural areas,” 59
Second Order Draft Chapter 1 IPCC SR1.5
Do Not Cite, Quote or Distribute 1-64 Total pages: 78
in Climate Change 2014: Impacts, Adaptation, and Vulnerability. Part A: Global and Sectoral Aspects. 1 Contribution of Working Group II to the Fifth Assessment Report of the Intergovernmental Panel on 2 Climate Change (Cambridge, UK and New York, NY , USA: Cambridge University Press), 613–657. 3
Dasgupta, P., Sahay, S., Prakash, A., and Lutz, A. Cost Effective Adaptation to Flood Events: A case study of 4 sanitation in the Hindu Kush Himalayas. World Dev. submitted. 5
Davin, E. L., Seneviratne, S. I., Ciais, P., Olioso, A., and Wang, T. (2014). Preferential cooling of hot extremes 6 from cropland albedo management. Proc. Natl. Acad. Sci. 111, 9757–9761. 7 doi:10.1073/pnas.1317323111. 8
Davis, S. J., Caldeira, K., and Matthews, H. D. (2010). Future CO2 Emissions and Climate Change from 9 Existing Energy Infrastructure. Science (80-. ). 329, 1330–1333. doi:10.1126/science.1188566. 10
Davis, S. J., and Socolow, R. H. (2014). Commitment accounting of CO2 emissions. Environ. Res. Lett. 9, 11 84018. doi:10.1088/1748-9326/9/8/084018. 12
de Richter, R., Ming, T., Davies, P., Liu, W., and Caillol, S. (2017). Removal of non-CO2 greenhouse gases by 13 large-scale atmospheric solar photocatalysis. Prog. Energy Combust. Sci. 60, 68–96. 14 doi:10.1016/j.pecs.2017.01.001. 15
Delanty, G., and Mota, A. (2017). Governing the Anthropocene. Eur. J. Soc. Theory 20, 9–38. 16 doi:10.1177/1368431016668535. 17
Dellink, R., Chateau, J., Lanzi, E., and Magné, B. (2017). Long-term economic growth projections in the Shared 18 Socioeconomic Pathways. Glob. Environ. Chang. 42, 200–214. doi:10.1016/j.gloenvcha.2015.06.004. 19
Denton, F., Wilbanks, T. J., Abeysinghe, A. C., Burton, I., Gao, Q., Lemos, M. C., et al. (2014). “Climate-20 Resilient Pathways: Adaptation, Mitigation, and Sustainable Development,” in Climate Change 2014: 21 Impacts, Adaptation, and Vulnerability. Part A: Global and Sectoral Aspects. Contribution of Working 22 Group II to the Fifth Assessment Report of the Intergovernmental Panel on Climate Change, eds. C. B. 23 Field, V. R. Barros, D. J. Dokken, K. J. Mach, M. D. Mastrandrea, T. E. Bilir, et al. (Cambridge, UK and 24 New York, NY, USA: Cambridge University Press), 1101–1131. doi:10.1017/CBO9781107415379.025. 25
Déqué, M., Calmanti, S., Christensen, O. B., Dell Aquila, A., Maule, C. F., Haensler, A., et al. (2016). A multi-26 model climate response over tropical Africa at +2°C. Clim. Serv. doi:10.1016/j.cliser.2016.06.002. 27
Deser, C., Knutti, R., Solomon, S., and Phillips, A. S. (2012). Communication of the Role of Natural Variability 28 in Future North American Climate. Nat. Clim. Chang. 2, 775–779. doi:10.1038/nclimate1562. 29
Deuber, O., Luderer, G., and Edenhofer, O. (2013). Physico-economic evaluation of climate metrics: A 30 conceptual framework. Environ. Sci. Policy 29, 37–45. doi:10.1016/j.envsci.2013.01.018. 31
Dietz, S., Groom, B., and Pizer, W. A. (2016). Weighing the Costs and Benefits of Climate Change to Our 32 Children. Child. Clim. Chang. 26, 133–155. 33
Dlugokencky, E., and Tans, P. (2016). NOAA/ESRL Global Monitoring Division - Global Greenhouse Gas 34 Reference Network. 35
Dryzek, J. S. (2016). Institutions for the Anthropocene: Governance in a Changing Earth System. Br. J. Polit. 36 Sci. 46, 937–956. doi:10.1017/S0007123414000453. 37
Dryzek, J. S., and Pickering, J. (2017). Deliberation as a catalyst for reflexive environmental governance. Ecol. 38 Econ. 131, 353–360. doi:10.1016/j.ecolecon.2016.09.011. 39
Ebi, K. L., Hallegatte, S., Kram, T., Arnell, N. W., Carter, T. R., Edmonds, J., et al. (2014). A new scenario 40 framework for climate change research: Background, process, and future directions. Clim. Change 122, 41 363–372. doi:10.1007/s10584-013-0912-3. 42
Ebi, K. L., Ziska, L. H., and Yohe, G. W. (2016). The shape of impacts to come: lessons and opportunities for 43 adaptation from uneven increases in global and regional temperatures. Clim. Change 139, 341–349. 44 doi:10.1007/s10584-016-1816-9. 45
Eby, M., Zickfeld, K., Montenegro, A., Archer, D., Meissner, K. J., and Weaver, A. J. (2009). Lifetime of 46 anthropogenic climate change: Millennial time scales of potential CO2 and surface temperature 47 perturbations. J. Clim. 22, 2501–2511. doi:10.1175/2008JCLI2554.1. 48
Edwards, M. R., McNerney, J., and Trancik, J. E. (2016). Testing emissions equivalency metrics against climate 49 policy goals. Environ. Sci. Policy 66, 191–198. doi:10.1016/J.ENVSCI.2016.08.013. 50
Ekholm, T., Lindroos, T. J., and Savolainen, I. (2013). Robustness of climate metrics under climate policy 51 ambiguity. Environ. Sci. Policy 31, 44–52. doi:10.1016/j.envsci.2013.03.006. 52
Ekström, M., Grose, M. R., and Whetton, P. H. (2015). An appraisal of downscaling methods used in climate 53 change research. Wiley Interdiscip. Rev. Clim. Chang. 6, 301–319. doi:10.1002/wcc.339. 54
England, M. H., Mcgregor, S., Spence, P., Meehl, G. A., Timmermann, A., Cai, W., et al. (2014). Recent 55 intensification of wind-driven circulation in the Pacific and the ongoing warming hiatus. Nat. Clim. 56 Chang. 4, 222–227. doi:10.1038/nclimate2106. 57
EPA (1990). Global Anthropogenic Non-CO2 Greenhouse Gas Emissions: 1990 -2030. 58 Eriksen, S. H., and Brien, K. O. (2007). Vulnerability , poverty and the need for sustainable adaptation 59
Second Order Draft Chapter 1 IPCC SR1.5
Do Not Cite, Quote or Distribute 1-65 Total pages: 78
measures. Clim. Policy 7, 337–352. 1 Estrada, F., Perron, P., and Martínez-López, B. (2013). Statistically derived contributions of diverse human 2
influences to twentieth-century temperature changes. Nat. Geosci. 6, 1050–1055. doi:10.1038/ngeo1999. 3 Etminan, M., Myhre, G., Highwood, E. J., and Shine, K. P. (2016). Radiative forcing of carbon dioxide, 4
methane, and nitrous oxide: A significant revision of the methane radiative forcing. Geophys. Res. Lett. 5 43, 12,614-12,623. doi:10.1002/2016GL071930. 6
Falkner, R. (2016). The Paris Agreement and the new logic of international climate politics. Int. Aff. 92, 1107–7 1125. doi:10.1111/1468-2346.12708. 8
FAO, IFAD, and WFP (2015). The State of Food Insecurity in the World: Meeting the 2015 international 9 hunger targets: taking stock of uneven progress. 10
Fazey, I., Wise, R. M., Lyon, C., Câmpeanu, C., Moug, P., and Davies, T. E. (2016). Past and future adaptation 11 pathways. Clim. Dev. 8, 26–44. doi:10.1080/17565529.2014.989192. 12
Field, C. B., Barros, V. R., Mach, K. J., Mastrandrea, M. D., Aalst, M. van, Adger, W. N., et al. (2014). 13 “Technical Summary,” in Climate Change 2014: Impacts, Adaptation, and Vulnerability. Part A: Global 14 and Sectoral Aspects. Contribution of Working Group II to the Fifth Assessment Report of the 15 Intergovernmental Panel on Climate Change, eds. C. B. Field, V. R. Barros, D. J. Dokken, K. J. Mach, M. 16 D. Mastrandrea, T. E. Bilir, et al. (Cambridge, UK and New York, NY, USA: Cambridge University 17 Press), 35–94. 18
Fischer, E. M., and Knutti, R. (2015). Anthropogenic contribution to global occurrence of heavy-precipitation 19 and high-temperature extremes. Nat. Clim. Chang. 5, 560–564. doi:10.1038/nclimate2617. 20
Fleurbaey, M., Kartha, S., Bolwig, S., Chee, Y. L., Chen, Y., Corbera, E., et al. (2014a). “Sustainable 21 development and equity,” in Climate Change 2014: Mitigation of Climate Change. Contribution of 22 Working Group III to the Fifth Assessment Report of the Intergovernmental Panel on Climate Change, 23 eds. O. Edenhofer, R. Pichs-Madruga, Y. Sokona, E. Farahani, S. Kadner, K. Seyboth, et al. (Cambridge, 24 UK and New York, NY, USA.: Cambridge University Press), 283–350. Available at: 25 https://www.ipcc.ch/pdf/assessment-report/ar5/wg3/ipcc_wg3_ar5_full.pdf. 26
Fleurbaey, M., Kartha, S., Bolwig, S., Chee, Y. L., Chen, Y., Corbera, E., et al. (2014b). “Sustainable 27 Development and Equity,” in Climate Change 2014: Mitigation of climate change. Contribution of 28 Working Group III to the Fifth Assessment Report of the Intergovernmental Panel on Climate Change, 29 eds. O. Edenhofer, R. Pichs-Madruga, Y. Sokona, E. Farahani, S. Kadner, K. Seyboth, et al. (Cambridge, 30 UK and New York, NY, USA: Cambridge University Press), 283–350. 31 doi:10.1017/CBO9781107415416.010. 32
Flynn, M., Ford, J. D., Pearce, T., and Harper, S. L. (2018). Participatory scenario planning and climate change 33 impacts, adaptation and vulnerability research in the Arctic. Environ. Sci. Policy 79, 45–53. 34 doi:10.1016/J.ENVSCI.2017.10.012. 35
Forino, G., Von Meding, J., Brewer, G., and Van Niekerk, D. (2017). Climate Change Adaptation and Disaster 36 Risk reduction integration: Strategies, Policies, and Plans in three Australian Local Governments. Int. J. 37 Disaster Risk Reduct. 24, 100–108. doi:10.1016/j.ijdrr.2017.05.021. 38
Fortes, P., Alvarenga, A., Seixas, J., and Rodrigues, S. (2015). Long-term energy scenarios: Bridging the gap 39 between socio-economic storylines and energy modeling. Technol. Forecast. Soc. Change 91, 161–178. 40 doi:10.1016/j.techfore.2014.02.006. 41
Foster, G., and Rahmstorf, S. (2011). Global temperature evolution 1979–2010. Environ. Res. Lett. 6, 44022. 42 doi:10.1088/1748-9326/6/4/044022. 43
Frölicher, T. L., and Joos, F. (2010). Reversible and irreversible impacts of greenhouse gas emissions in multi-44 century projections with the NCAR global coupled carbon cycle-climate model. Clim. Dyn. 35, 1439–45 1459. doi:10.1007/s00382-009-0727-0. 46
Fuglestvedt, J., Rogelj, J., Millar, R., Allen, M., Boucher, O., Forster, P., et al. (2017). Implications of possible 47 interpretations of “greenhouse gas balance” in the Paris Agreement. Philos. Trans. R. Soc. A Math. Phys. 48 Eng. Sci. 49
Fuss, S., Jones, C. D., Kraxner, F., Peters, G. P., Smith, P., Tavoni, M., et al. (2016). Research priorities for 50 negative emissions. Environ. Res. Lett. 11. doi:10.1088/1748-9326/11/11/115007. 51
Gillett, N. P., Arora, V. K., Zickfeld, K., Marshall, S. J., and Merryfield, W. J. (2011). Ongoing climate change 52 following a complete cessation of carbon dioxide emissions. Nat. Geosci. 4, 83–87. 53 doi:10.1038/ngeo1047. 54
Giorgi, F., and Gutowski, W. J. (2015). Regional Dynamical Downscaling and the CORDEX Initiative. Annu. 55 Rev. Environ. Resour. 40, 467–490. doi:10.1146/annurev-environ-102014-021217. 56
Gradstein, F. M., Ogg, J. G., Schmitz, M. D., Ogg, G. M., Gradstein, F. M., and All, A. (2012). The Geologic 57 Time Scale 2012. doi:10.1016/B978-0-444-59425-9.01001-5. 58
Gregory, J. M., and Forster, P. M. (2008). Transient climate response estimated from radiative forcing and 59
Second Order Draft Chapter 1 IPCC SR1.5
Do Not Cite, Quote or Distribute 1-66 Total pages: 78
observed temperature change. J. Geophys. Res. Atmos. 113. doi:10.1029/2008JD010405. 1 Guiot, J., and Cramer, W. (2016). Climate change: The 2015 Paris Agreement thresholds and Mediterranean 2
basin ecosystems. Science (80-. ). 354, 4528–4532. doi:10.1126/science.aah5015. 3 Hammitt, J. K., Jain, A. K., Adams, J. L., and Wuebbles, D. J. (1996). A welfare-based index for assessing 4
environmental effects of greenhouse-gas emissions. Nature 381, 301–303. doi:10.1038/381301a0. 5 Hansen, G., and Cramer, W. (2015). Global distribution of observed climate change impacts. Nat. Clim. Chang. 6
5, 182–185. doi:10.1038/nclimate2529. 7 Hansen, G., and Stone, D. (2016). Assessing the observed impact of anthropogenic climate change. Nat. Clim. 8
Chang. 6, 532–537. doi:10.1038/nclimate2896. 9 Hansen, G., Stone, D., Auffhammer, M., Huggel, C., and Cramer, W. (2016). Linking local impacts to changes 10
in climate: a guide to attribution. Reg. Environ. Chang. 16, 527–541. doi:10.1007/s10113-015-0760-y. 11 Hansen, J., Nazarenko, L., Ruedy, R., Sato, M., Willis, J., Del Genio, A., et al. (2005). Earth’s energy 12
imbalance: confirmation and implications. Science (80-. ). 308, 1431–1435. doi:10.1126/science.1110252. 13 Hansen, J., Ruedy, R., Sato, M., and Lo, K. (2010a). Global surface temperature change. Rev. Geophys. 48, 14
RG4004. doi:10.1029/2010RG000345. 15 Hansen, J., Ruedy, R., Sato, M., and Lo, K. (2010b). Global Surface Temperature Change. Rev. Geophys. 48, 16
RG4004. doi:10.1029/2010RG000345. 17 Hare, B., and Meinshausen, M. (2006). How much warming are we committed to and how much can be 18
avoided? Clim. Change 75, 111–149. doi:10.1007/s10584-005-9027-9. 19 Harlan, S. L., Pellow, D. N., Roberts, T. J., Bell, S. E., Holt, W. G., and Nagel, J. (2015). “Climate Justice and 20
Inequality,” in Climate Change and Society: Sociological Perspectives, eds. R. E. Dunlap and R. J. Brulle 21 (Oxford University Press), 127. 22
Harmsen, M. J. H. M., van den Berg, M., Krey, V., Luderer, G., Marcucci, A., Strefler, J., et al. (2016). How 23 climate metrics affect global mitigation strategies and costs: a multi-model study. Clim. Change 136, 203–24 216. doi:10.1007/s10584-016-1603-7. 25
Harrington, C. (2016). The Ends of the World: International Relations and the Anthropocene. Millenn. J. Int. 26 Stud. 44, 478–498. doi:10.1177/0305829816638745. 27
Haustein, K., Allen, M. R., Forster, P. M., Otto, F. E. L., Mitchell, D. M., Matthews, H. D., et al. (2017). A real-28 time Global Warming Index. Sci. Rep. 7, 15417. doi:10.1038/s41598-017-14828-5. 29
Hawkins, E., Ortega, P., Suckling, E., Schurer, A., Hegerl, G., Jones, P., et al. (2017). Estimating changes in 30 global temperature since the pre-industrial period. Bull. Am. Meteorol. Soc., BAMS-D-16-0007.1. 31 doi:10.1175/BAMS-D-16-0007.1. 32
Heard, B. P., Brook, B. W., Wigley, T. M. L., and Bradshaw, C. J. A. (2017). Burden of proof: A 33 comprehensive review of the feasibility of 100% renewable-electricity systems. Renew. Sustain. Energy 34 Rev. 76, 1122–1133. doi:10.1016/j.rser.2017.03.114. 35
Heede, R. (2014). Tracing anthropogenic carbon dioxide and methane emissions to fossil fuel and cement 36 producers, 1854–2010. Clim. Change 122, 229–241. doi:10.1007/s10584-013-0986-y. 37
Hegerl, G. C., Zwiers, F. W., Braconnot, P., Gillett, N. P., Luo, Y., Marengo Orsini, J. A., et al. (2007). 38 “Understanding and Attributing Climate Change,” in Climate Change 2007: The Physical Science Basis. 39 Contribution of Working Group I to the Fourth Assessment Report of the Intergovernmental Panel on 40 Climate Change, eds. S. Solomon, D. Qin, M. Manning, Z. Chen, M. Marquis, K. B. Averyt, et al. 41 (Cambridge, UK and New York, NY, USA: Cambridge University Press), 663–745. 42
Herzog, H. J. (2001). Peer Reviewed: What Future for Carbon Capture and Sequestration? Environ. Sci. 43 Technol. 35, 148A–153A. doi:10.1021/es012307j. 44
Hildingsson, R., and Johansson, B. (2016). Governing low-carbon energy transitions in sustainable ways: 45 Potential synergies and conflicts between climate and environmental policy objectives. Energy Policy 88, 46 245–252. doi:10.1016/j.enpol.2015.10.029. 47
Hirsch, A. L., Wilhelm, M., Davin, E. L., Thiery, W., and Seneviratne, S. I. (2017). Can climate-effective land 48 management reduce regional warming? J. Geophys. Res. Atmos. 122, 2269–2288. 49 doi:10.1002/2016JD026125. 50
Hoegh-Guldberg, O., Mumby, P. J., Hooten, A. J., Steneck, R. S., Greenfield, P., Gomez, E., et al. (2007). Coral 51 Reefs Under Rapid Climate Change and Ocean Acidification. Science (80-. ). 318, 1737 LP-1742. 52 doi:10.1126/science.1152509. 53
Honegger, M., and Reiner, D. (2017). The political economy of negative emissions technologies: consequences 54 for international policy design. Clim. Policy. 55
Hosonuma, N., Herold, M., Sy, V. De, Fries, R. S. De, Brockhaus, M., Verchot, L., et al. (2012). An assessment 56 of deforestation and forest degradation drivers in developing countries. Environ. Res. Lett. 7, 44009. 57 Available at: http://stacks.iop.org/1748-9326/7/i=4/a=044009. 58
Hsiang, S., Kopp, R., Jina, A., Rising, J., Delgado, M., Mohan, S., et al. (2017). Estimating economic damage 59
Second Order Draft Chapter 1 IPCC SR1.5
Do Not Cite, Quote or Distribute 1-67 Total pages: 78
from climate change in the United States. Science (80-. ). 356, 1362–1369. doi:10.1126/science.aal4369. 1 Hughes, S. (2017). The Politics of Urban Climate Change Policy: Toward a Research Agenda. Urban Aff. Rev., 2
1–19. doi:10.1177/1078087416649756. 3 Humphreys, S. ed. (2010). Human Rights and Climate Change. Cambridge: Cambridge University Press. 4 Humphreys, S. (2017). Climate, Technology, Justice. in Protecting the Environment for Future Generations: 5
Principles and Actors in International Environmental Law, ed. A. Proelss (Berlin: Erich Schmidt Verlag). 6 Huntingford, C., Yang, H., Harper, A., Cox, P. M., Gedney, N., Burke, E. J., et al. (2017). Flexible parameter-7
sparse global temperature time profiles that stabilise at 1.5 and 2.0°C. Earth Syst. Dyn. 8, 617–626. 8 doi:10.5194/esd-8-617-2017. 9
IBA (2014). Achieving Justice and Human Rights in an Era of Climate Disruption. London, UK Available at: 10 https://www.ibanet.org/PresidentialTaskForceClimateChangeJustice2014Report.aspx [Accessed July 23, 11 2017]. 12
ICHRP (2008). Climate Change and Human Rights: A Rough Guide. doi:10.1057/dev.2008.35. 13 Ionesco, D., Mokhnacheva, D., and Gemenne, F. (2016). Atlas de Migrations Environnmentales. Presses de 14
Sciences Po. 15 IPCC (2000). Special Report on Emissions Scenarios: A Special Report of Working Group III of the 16
Intergovernmental Panel on Climate Change. , eds. N. Nakićenović and R. Swart Cambridge, UK. 17 IPCC (2004). Describing Scientific Uncertainties in Climate Change to Support Analysis of Risk and of 18
Options. , eds. M. Manning, M. Petit, D. Easterling, J. Murphy, A. Patwardhan, H.-H. Rogner, et al. 19 Available at: https://www.ipcc.ch/pdf/supporting-material/ipcc-workshop-2004-may.pdf [Accessed April 20 5, 2017]. 21
IPCC (2005). Guidance Notes for Lead Authors of the IPCC Fourth Assessment Report on Addressing 22 Uncertainties. Available at: http://www.ipcc-wg2.awi.de/guidancepaper/uncertainty-guidance-note.pdf 23 [Accessed April 5, 2017]. 24
IPCC (2012a). Managing the Risks of Extreme Events and Disasters to Advance Climate Change Adaptation. A 25 Special Report of Working Groups I and II of the Intergovernmental Panel on Climate Change (IPCC). , 26 eds. C. B. Field, V. Barros, T. F. Stocker, D. Qin, D. J. Dokken, K. L. Ebi, et al. Cambridge, UK and New 27 York, NY, USA: Cambridge University Press. 28
IPCC (2012b). Meeting Report of the Intergovernmental Panel on Climate Change Expert Meeting on 29 Geoengineering. , eds. O. Edenhofer, R. Pichs-Madruga, Y. Sokona, C. Field, V. Barros, T. F. Stocker, et 30 al. Potsdam, Germany: IPCC Working Group III Technical Support Unit, Potsdam Institute for Climate 31 Impact Research Available at: http://www.ipcc.ch/pdf/supporting-32 material/EM_GeoE_Meeting_Report_final.pdf. 33
IPCC (2012c). “Summary for Policymakers,” in Managing the Risks of Extreme Events and Disasters to 34 Advance Climate Change Adaptation, eds. C. B. Field, V. R. Barros, T. F. Stocker, D. Qin, D. J. Dokken, 35 K. L. Ebi, et al. (Cambridge, UK and New York, NY, USA: Cambridge University Press), 1–20. 36 Available at: papers2://publication/uuid/41AD43FB-2529-4ACD-AD33-4C2D0AB4A0F3. 37
IPCC (2013). “Summary for Policymakers,” in Climate Change 2013: The Physical Science Basis. Contribution 38 of Working Group I to the Fifth Assessment Report of the Intergovernmental Panel on Climate Change, 39 eds. T. F. Stocker, D. Qin, G. K. Plattner, M. Tignor, S. K. Allen, J. Boschung, et al. (Cambridge, UK, and 40 New York, NY, USA: Cambridge University Press), 33. doi:10.1017/CBO9781107415324. 41
IPCC (2014a). Climate Change 2014: Mitigation of Climate Change. Contribution of Working Group III to the 42 Fifth Assessment Report of the Intergovernmental Panel on Climate Change. , eds. O. Edenhofer, R. 43 Pichs-Madruga, Y. Sokona, E. Farahani, S. Kadner, K. Seyboth, et al. Cambridge, UK and New York, 44 NY, USA: Cambridge Univeristy Press. 45
IPCC (2014b). “Climate Change 2014 Synthesis Report,” in Contribution of Working Groups I, II and III to the 46 Fifth Assessment Report of the Intergovernmental Panel on Climate Change, eds. Core Writing Team, R. 47 K. Pachauri, and L. A. Meyer, 1–112. doi:10.1017/CBO9781107415324. 48
IPCC (2014c). “Summary for Policymakers,” in Climate Change 2014: Impacts, Adaptation, and Vulnerability. 49 Part A: Global and Sectoral Aspects. Contribution of Working Group II to the Fifth Assessment Report of 50 the Intergovernmental Panel on Climate Change, eds. C. B. Field, V. R. Barros, D. J. Dokken, K. J. 51 Mach, M. D. Mastrandrea, T. E. Bilir, et al. (Cambridge, Cambridge, UK, and New York, NY, USA: 52 Cambridge University Press), 1–32. 53
IPCC (2014d). “Summary for Policymakers,” in Climate Change 2014 Synthesis Report. Contribution of 54 Working Groups I, II and III to the Fifth Assessment Report of the Intergovernmental Panel on Climate 55 Change, eds. Core Writing Team, R. K. Pachauri, and L. A. Meyer, 2–34. 56 doi:10.1017/CBO9781107415324. 57
IPCC (2014e). “Summary for Policymakers,” in Climate Change 2014: Mitigation of Climate Change. 58 Contribution of Working Group III to the Fifth Assessment Report of the Intergovernmental Panel on 59
Second Order Draft Chapter 1 IPCC SR1.5
Do Not Cite, Quote or Distribute 1-68 Total pages: 78
Climate Change, eds. O. Edenhofer, R. Pichs-Madruga, Y. Sokona, E. Farahani, S. Kadner, K. Seyboth, et 1 al. (Cambridge, UK, and New York, NY, USA: Cambridge University Press), 1–30. 2 doi:10.1017/CBO9781107415324. 3
Irvine, P. J., Ridgwell, A., and Lunt, D. J. (2011). Climatic effects of surface albedo geoengineering. J. 4 Geophys. Res. Atmos. 116, n/a--n/a. doi:10.1029/2011JD016281. 5
Iyer, G., Hultman, N., Eom, J., McJeon, H., Patel, P., and Clarke, L. (2015). Diffusion of low-carbon 6 technologies and the feasibility of long-term climate targets. Technol. Forecast. Soc. Change 90, 103–118. 7 doi:10.1016/J.TECHFORE.2013.08.025. 8
Jackson, R. B., Canadell, J. G., Le Quéré, C., Andrew, R. M., Korsbakken, J. I., Peters, G. P., et al. (2015). 9 Reaching peak emissions. Nat. Clim. Chang. 6, 7–10. doi:10.1038/nclimate2892. 10
Jackson, T. (2017). Prosperity without growth. 2nd ed. London: Taylor & Francis Group. 11 Jacob, D., and Solman No Title. submitted. 12 Jacobson, M. Z. (2010). Short-term effects of controlling fossil-fuel soot, biofuel soot and gases, and methane 13
on climate, Arctic ice, and air pollution health. J. Geophys. Res. Atmos. 115, D14209. 14 doi:10.1029/2009JD013795. 15
Jacobson, M. Z., Delucchi, M. A., Bazouin, G., Bauer, Z. A. F., Heavey, C. C., Fisher, E., et al. (2015). 100% 16 clean and renewable wind, water, and sunlight (WWS) all-sector energy roadmaps for the 50 United 17 States. Energy Environ. Sci. 8, 2093–2117. doi:10.1039/C5EE01283J. 18
James, R., Washington, R., Schleussner, C.-F., Rogelj, J., and Conway, D. (2017). Characterizing half-a-degree 19 difference: a review of methods for identifying regional climate responses to global warming targets. 20 Wiley Interdiscip. Rev. Clim. Chang. 8, e457--n/a. doi:10.1002/wcc.457. 21
Jenkins, S., Millar, R. J., Leach, N., and Allen, M. R. (2017). Framing climate goals in terms of cumulative 22 CO2-forcing-equivalent emissions. Geophys. Res. Lett. submitted. 23
Jiang, L., and O’Neill, B. C. (2017). Global urbanization projections for the Shared Socioeconomic Pathways. 24 Glob. Environ. Chang. 42, 193–199. doi:10.1016/j.gloenvcha.2015.03.008. 25
Johansson, D. J. A. A. (2012). Economics- and physical-based metrics for comparing greenhouse gases. Clim. 26 Change 110, 123–141. doi:10.1007/s10584-011-0072-2. 27
Jones, P. (2016). The reliability of global and hemispheric surface temperature records. Adv. Atmos. Sci. 33, 28 269–282. doi:10.1007/s00376-015-5194-4. 29
JRC (2011). Global Emissions EDGAR v4.2. Available at: http://edgar.jrc.ec.europa.eu/. 30 Kabir, M. I., Rahman, M. B., Smith, W., Lusha, M. A. F., Azim, S., and Milton, A. H. (2016). Knowledge and 31
perception about climate change and human health: findings from a baseline survey among vulnerable 32 communities in Bangladesh. BMC Public Health 16, 266. doi:10.1186/s12889-016-2930-3. 33
Kainuma, M., Pandey, R., Masui, T., and Nishioka, S. (2017). Methodologies for leapfrogging to low carbon 34 and sustainable development in Asia. J. Renew. Sustain. Energy 9. doi:10.1063/1.4978469. 35
Kandlikar, M. (1995). The relative role of trace gas emissions in greenhouse abatement policies. Energy Policy 36 23, 879–883. doi:10.1016/0301-4215(95)00108-U. 37
Kandlikar, M. (1996). Indices for comparing greenhouse gas emissions: Integrating science and economics. 38 Energy Econ. 18, 265–281. doi:10.1016/S0140-9883(96)00021-7. 39
Karl, T. R., Arguez, A., Huang, B., Lawrimore, J. H., McMahon, J. R., Menne, M. J., et al. (2015). Possible 40 artifacts of data biases in the recent global surface warming hiatus. Science (80-. ). 348, 1469–1472. 41 doi:10.1126/science.aaa5632. 42
Karmalkar, A. V, and Bradley, R. S. (2017). Consequences of Global Warming of 1.5°C and 2°C for Regional 43 Temperature and Precipitation Changes in the Contiguous United States. PLoS One 12, e0168697. 44 doi:10.1371/journal.pone.0168697. 45
Kates, R. W., Colten, C. E., Laska, S., and Leatherman, S. P. (2006). Reconstruction of New Orleans after 46 Hurricane Katrina: A research perspective. Proc. Natl. Acad. Sci. 103, 14653–14660. 47 doi:10.1073/pnas.0605726103. 48
Kates, R. W., Travis, W. R., and Wilbanks, T. J. (2012). Transformational adaptation when incremental 49 adaptations to climate change are insufficient. Proc. Natl. Acad. Sci. 109, 7156–7161. 50 doi:10.1073/pnas.1115521109. 51
Kerr, R. A. (2013). Humans Fueled Global Warming Millennia Ago. Science (80-. ). 342, 918–918. 52 doi:10.1126/science.342.6161.918. 53
King, A. D., Karoly, D. J., and Henley, B. J. (2017). Australian climate extremes at 1.5°C and 2°C of global 54 warming. Nat. Clim. Chang. 7, 412–416. doi:10.1038/nclimate3296. 55
Kirtman, B., Adedoyin, A., and Bindoff, N. (2013). “Near-term Climate Change: Projections and 56 Predictability,” in Climate Change 2013: The Physical Science Basis. Contribution of Working Group I to 57 the Fifth Assessment Report of the Intergovernmental Panel on Climate Change, eds. T. F. Stocker, D. 58 Qin, G.-K. Plattner, M. Tignor, S. K. Allen, J. Boschung, et al. (Cambridge, UK and New York, NY, 59
Second Order Draft Chapter 1 IPCC SR1.5
Do Not Cite, Quote or Distribute 1-69 Total pages: 78
USA: Cambridge University Press), 953–1028. doi:10.1017/CBO9781107415324.023. 1 Kivimaa, P., Hildén, M., Huitema, D., Jordan, A., and Newig, J. (2017). Experiments in climate governance – a 2
systematic review of research on energy and built environment transitions. J. Clean. Prod., 1–13. 3 doi:10.1016/j.jclepro.2017.01.027. 4
Klein, R. J. T., Midgley, G. F., Preston, B. L., Alam, M., Berkhout, F. G. H., Dow, K., et al. (2014). “Adaptation 5 opportunities, constraints, and limits,” in Climate Change 2014: Impacts, Adaptation, and Vulnerability. 6 Part A: Global and Sectoral Aspects. Contribution of Working Group II to the Fifth Assessment Report of 7 the Intergovernmental Panel of Climate Change, eds. C. B. Field, V. R. Barros, D. J. Dokken, K. J. Mach, 8 M. D. Mastrandrea, T. E. Bilir, et al. (Cambridge, UK and New York, NY, USA: Cambridge University 9 Press), 899–943. 10
Klinsky, S., and Winkler, H. (2014). Equity, sustainable development and climate policy. Clim. Policy 14, 122–11 147. doi:10.1080/14693062.2014.849452. 12
Knox, J. H. (2015). “Human Rights Principles and Climate Change,” in Oxford Handbook of International 13 Climate Change Law, eds. C. Carlarne, K. R. Gray, and R. Tarasofsky (Oxford: Oxford University Press). 14
Knutti, R., and Sedláček, J. (2012). Robustness and uncertainties in the new CMIP5 climate model projections. 15 Nat. Clim. Chang. 3, 369–373. doi:10.1038/nclimate1716. 16
Kolstad, C., Urama, K., Broome, J., Bruvoll, A., Olvera, M. C., Fullerton, D., et al. (2014). “Social, Economic, 17 and Ethical Concepts and Methods,” in Climate Change 2014: Mitigation of Climate Change. 18 Contribution of Working Group III to the Fifth Assessment Report of the Inter- governmental Panel on 19 Climate Changegovernmental Panel on Climate Change, eds. O. Edenhofer, R. Pichs-Madruga, Y. 20 Sokona, E. Farahani, S. Kadner, K. Seyboth, et al. (Cambridge, UK and New York, NY, USA: Cambridge 21 University Press), 207–282. 22
Kopp, R. E., Kemp, A. C., Bittermann, K., Horton, B. P., Donnelly, J. P., Gehrels, W. R., et al. (2016). 23 Temperature-driven global sea-level variability in the Common Era. Proc. Natl. Acad. Sci. 113, 1–8. 24 doi:10.1073/pnas.1517056113. 25
Kosaka, Y., and Xie, S. P. (2013). Recent global-warming hiatus tied to equatorial Pacific surface cooling. 26 Nature 501, 403–407. doi:10.1038/nature12534. 27
Kriegler, E., Edmonds, J., Hallegatte, S., Ebi, K. L., Kram, T., Riahi, K., et al. (2014). A new scenario 28 framework for climate change research: The concept of shared climate policy assumptions. Clim. Change 29 122, 401–414. doi:10.1007/s10584-013-0971-5. 30
Kriegler, E., O’Neill, B. C., Hallegatte, S., Kram, T., Lempert, R. J., Moss, R. H., et al. (2012). The need for and 31 use of socio-economic scenarios for climate change analysis: A new approach based on shared socio-32 economic pathways. Glob. Environ. Chang. 22, 807–822. doi:10.1016/j.gloenvcha.2012.05.005. 33
Lamarque, J. F., Kyle, P. P., Meinshausen, M., Riahi, K., Smith, S. J., van Vuuren, D. P., et al. (2011). Global 34 and regional evolution of short-lived radiatively-active gases and aerosols in the Representative 35 Concentration Pathways. Clim. Change 109, 191–212. doi:10.1007/s10584-011-0155-0. 36
Landauer, M., Juhola, S., and Söderholm, M. (2015). Inter-relationships between adaptation and mitigation: a 37 systematic literature review. Clim. Change 131, 505–517. doi:10.1007/s10584-015-1395-1. 38
Latham, J., Rasch, P., Chen, C.-C., Kettles, L., Gadian, A., Gettelman, A., et al. (2008). Global temperature 39 stabilization via controlled albedo enhancement of low-level maritime clouds. Philos. Trans. R. Soc. 40 London A Math. Phys. Eng. Sci. 366, 3969–3987. doi:10.1098/rsta.2008.0137. 41
Lauder, A. R., Enting, I. G., Carter, J. O., Clisby, N., Cowie, A. L., Henry, B. K., et al. (2013). Offsetting 42 methane emissions - An alternative to emission equivalence metrics. Int. J. Greenh. Gas Control 12, 419–43 429. doi:10.1016/j.ijggc.2012.11.028. 44
Leach, N. J., Millar, R. J., Haustein, K., Jenkins, S., Graham, E., and Allen, M. R. (2017). Current level and rate 45 of warming determine emissions budgets under ambitious mitigation. Nat. Geosci. submitted. 46
Leal Filho, W., Morgan, E. A., Godoy, E. S., Azeiteiro, U. M., Bacelar-Nicolau, P., Veiga Ávila, L., et al. 47 (2018). Implementing climate change research at universities: Barriers, potential and actions. J. Clean. 48 Prod. 170, 269–277. doi:10.1016/j.jclepro.2017.09.105. 49
Le Quéré, C., Andrew, R. M., Canadell, J. G., Sitch, S., Ivar Korsbakken, J., Peters, G. P., et al. (2016). Global 50 Carbon Budget 2016. Earth Syst. Sci. Data 8, 605–649. doi:10.5194/essd-8-605-2016. 51
Le Quéré, C., Andrew, R. M., Friedlingstein, P., Sitch, S., Pongratz, J., Manning, A. C., et al. (2017). Global 52 Carbon Budget 2017. Earth Syst. Sci. Data Discuss., 1–79. doi:10.5194/essd-2017-123. 53
Le Treut, H., Somerville, R., Cubasch, U., Ding, Y., Mauritzen, C., Mokssit, A., et al. (2007). “Historical 54 Overview of Climate Change,” in Climate Change 2007: The Physical Science Basis. Contribution of 55 Working Group I to the Fourth Assessment Report of the Intergovernmental Panel on Climate Change, 56 eds. S. Solomon, D. Qin, M. Manning, Z. Chen, M. Marquis, K. B. Averyt, et al. (Cambridge, UK and 57 New York, NY, USA: Cambridge University Press), 93–128. Available at: 58 https://www.ipcc.ch/pdf/assessment-report/ar4/wg1/ar4-wg1-chapter1.pdf. 59
Second Order Draft Chapter 1 IPCC SR1.5
Do Not Cite, Quote or Distribute 1-70 Total pages: 78
Leggett, J., Pepper, W. J., Swart, R. J., Edmonds, J., Meira Filho, L. G., Mintzer, I., et al. (1992). “Emissions 1 scenarios for the IPCC: an update,” in Climate change 1992: The Supplementary Report to the IPCC 2 Scientific Assessment, eds. J. T. Houghton, B. A. Callander, and S. K. Varney (Cambridge, United 3 Kingdom and New York, NY, USA: Cambridge University Press), 69–95. Available at: 4 http://books.google.com/books?hl=en&lr=&ie=UTF-5 8&id=6ERV_5M4wRsC&oi=fnd&pg=PA69&dq=Emissions+Scenarios+for+IPCC:+An+Update&ots=jrI6 Ydshkr-&sig=AxrGc1fPN2e0KIc84qGWevW6S8o. 7
Leichenko, R., and Silva, J. A. (2014). Climate change and poverty: Vulnerability, impacts, and alleviation 8 strategies. Wiley Interdiscip. Rev. Clim. Chang. 5, 539–556. doi:10.1002/wcc.287. 9
Leimbach, M., Kriegler, E., Roming, N., and Schwanitz, J. (2017). Future growth patterns of world regions – A 10 GDP scenario approach. Glob. Environ. Chang. 42, 215–225. doi:10.1016/j.gloenvcha.2015.02.005. 11
Leonard, M., Westra, S., Phatak, A., Lambert, M., van den Hurk, B., McInnes, K., et al. (2014). A compound 12 event framework for understanding extreme impacts. Wiley Interdiscip. Rev. Clim. Chang. 5, 113–128. 13 doi:10.1002/wcc.252. 14
Leung, D. Y. C., Caramanna, G., and Maroto-Valer, M. M. (2014). An overview of current status of carbon 15 dioxide capture and storage technologies. Renew. Sustain. Energy Rev. 39, 426–443. 16 doi:10.1016/j.rser.2014.07.093. 17
Li, S., Otto, F. E. L., Haustein, K., and Harrington, L. (2017). The tales of the Amazons in 1.5C and 2C warmer 18 worlds. Environ. Res. Lett. under revi. 19
Loftus, P. J., Cohen, A. M., Long, J. C. S., and Jenkins, J. D. (2015). A critical review of global decarbonization 20 scenarios: What do they tell us about feasibility? Wiley Interdiscip. Rev. Clim. Chang. 6, 93–112. 21 doi:10.1002/wcc.324. 22
Lövbrand, E., Beck, S., Chilvers, J., Forsyth, T., Hedrén, J., Hulme, M., et al. (2015). Who speaks for the future 23 of Earth? How critical social science can extend the conversation on the Anthropocene. Glob. Environ. 24 Chang. 32, 211–218. doi:10.1016/j.gloenvcha.2015.03.012. 25
Lövbrand, E., Hjerpe, M., and Linnér, B.-O. (2017). Making climate governance global: how UN climate 26 summitry comes to matter in a complex climate regime. Env. Polit. 26, 580–599. 27 doi:10.1080/09644016.2017.1319019. 28
Lowe, J. A., Huntingford, C., Raper, S. C. B., Jones, C. D., Liddicoat, S. K., and Gohar, L. K. (2009). How 29 difficult is it to recover from dangerous levels of global warming? Environ. Res. Lett. 4, 14012. 30 doi:10.1088/1748-9326/4/1/014012. 31
Manne, A. S., and Richels, R. G. (2001). An alternative approach to establishing trade-offs among greenhouse 32 gases. Nature 410, 675–677. doi:10.1038/35070541. 33
Manning, M., and Reisinger, A. (2011). Broader perspectives for comparing different greenhouse gases. Philos. 34 Trans. R. Soc. A Math. Phys. Eng. Sci. 369, 1891–1905. doi:10.1098/rsta.2010.0349. 35
Marbà, N., Arias-Ortiz, A., Masqué, P., Kendrick, G. A., Mazarrasa, I., Bastyan, G. R., et al. (2015). Impact of 36 seagrass loss and subsequent revegetation on carbon sequestration and stocks. J. Ecol. 103, 296–302. 37 doi:10.1111/1365-2745.12370. 38
Marcott, S. A., Bauska, T. K., Buizert, C., Steig, E. J., Rosen, J. L., Cuffey, K. M., et al. (2014). Centennial-39 scale changes in the global carbon cycle during the last deglaciation. Nature 514, 616–619. 40 doi:10.1038/nature13799. 41
Marcott, S. A., Shakun, J. D., Clark, P. U., and Mix, A. C. (2013). A reconstruction of regional and global 42 temperature for the past 11,300 years. Science (80-. ). 339, 1198–201. doi:10.1126/science.1228026. 43
Marsicek, J., Shuman, B. N., Bartlein, P. J., Shafer, S. L., and Brewer, S. (2017). Reconciling divergent trends 44 and millennial variations in Holocene temperatures. Nature in press. 45
Martius, O., Pfahl, S., and Chevalier, C. (2016). A global quantification of compound precipitation and wind 46 extremes. Geophys. Res. Lett. 43, 7709–7717. doi:10.1002/2016GL070017. 47
Mastrandrea, M. D., Mach, K. J., Plattner, G.-K., Edenhofer, O., Stocker, T. F., Field, C. B., et al. (2011). The 48 IPCC AR5 guidance note on consistent treatment of uncertainties: a common approach across the working 49 groups. Clim. Change 108, 675–691. doi:10.1007/s10584-011-0178-6. 50
Matthews, H. D., and Caldeira, K. (2008). Stabilizing climate requires near-zero emissions. Geophys. Res. Lett. 51 35, L04705. doi:10.1029/2007GL032388. 52
Matthews, H. D., Gillett, N. P., Stott, P. a, and Zickfeld, K. (2009). The proportionality of global warming to 53 cumulative carbon emissions. Nature 459, 829–32. doi:10.1038/nature08047. 54
Matthews, H. D., Landry, J.-S., Partanen, A.-I., Allen, M., Eby, M., Forster, P. M., et al. (2017a). Estimating 55 Carbon Budgets for Ambitious Climate Targets. Curr. Clim. Chang. Reports 3, 69–77. 56 doi:10.1007/s40641-017-0055-0. 57
Matthews, H. D., and Solomon, S. (2013). Irreversible Does Not Mean Unavoidable. Science (80-. ). 340, 438–58 439. doi:10.1126/science.1236372. 59
Second Order Draft Chapter 1 IPCC SR1.5
Do Not Cite, Quote or Distribute 1-71 Total pages: 78
Matthews, H. D., and Zickfeld, K. (2012). Climate response to zeroed emissions of greenhouse gases and 1 aerosols. Nat. Clim. Chang. 2, 338–341. doi:10.1038/nclimate1424. 2
Matthews, T. K. R., Wilby, R. L., and Murphy, C. (2017b). Communicating the deadly consequences of global 3 warming for human heat stress. Proc. Natl. Acad. Sci. 114, 3861–3866. doi:10.1073/pnas.1617526114. 4
Mauritsen, T., and Pincus, R. (2017). Committed warming inferred from observations. Nat. Clim. Chang. 2, 1–5 5. doi:10.1038/nclimate3357. 6
McAlpine, C. A., Seabrook, L. M., Ryan, J. G., Feeney, B. J., Ripple, W. J., Ehrlich, A. H., et al. (2015). 7 Transformational change: Creating a safe operating space for humanity. Ecol. Soc. 20. doi:10.5751/ES-8 07181-200156. 9
Medhaug, I., Stolpe, M. B., Fischer, E. M., and Knutti, R. (2017). Reconciling controversies about the “global 10 warming hiatus.” Nature 545, 41–47. doi:10.1038/nature22315. 11
Meehl, G. A., and Tebaldi, C. (2004). More Intense, More Frequent, and Longer Lasting Heat Waves in the 21st 12 Century. Science (80-. ). 305, 994–997. doi:10.1126/science.1098704. 13
Millar, R. J., Fuglestvedt, J. S., Friedlingstein, P., Rogelj, J., Grubb, M. J., Matthews, H. D., et al. (2017a). 14 Emission budgets and pathways consistent with limiting warming to 1.5°C. Nat. Geosci. 10, 741–747. 15 doi:10.1038/NGEO3031. 16
Millar, R. J., Nicholls, Z. R., Friedlingstein, P., and Allen, M. R. (2017b). A modified impulse-response 17 representation of the global near-surface air temperature and atmospheric concentration response to 18 carbon dioxide emissions. Atmos. Chem. Phys. 17, 7213–7228. doi:10.5194/acp-17-7213-2017. 19
Mimura, N., Pulwarty, R. S., Duc, D. M., Elshinnawy, I., Redsteer, M. H., Huang, H.-Q., et al. (2014). 20 “Adaptation planning and implementation,” in Climate Change 2014: Impacts, Adaptation, and 21 Vulnerability. Part A: Global and Sectoral Aspects. Contribution of Working Group II to the Fifth 22 Assessment Report of the Intergovernmental Panel of Climate Change, eds. C. B. Field, V. R. Barros, D. 23 J. Dokken, K. J. Mach, M. D. Mastrandrea, T. E. Bilir, et al. (Cambridge, UK and New York, NY, USA: 24 Cambridge University Press), 869–898. 25
Minx, J. C., Lamb, W. F., Callaghan, M. W., Bornmann, L., and Fuss, S. (2017). Fast growing research on 26 negative emissions. Environ. Res. Lett. 12. doi:10.1088/1748-9326/aa5ee5. 27
Mitchell, D., AchutaRao, K., Allen, M., Bethke, I., Forster, P., Fuglestvedt, J., et al. (2016). Half a degree 28 Additional warming, Projections, Prognosis and Impacts (HAPPI): Background and Experimental Design. 29 Geosci. Model Dev. Discuss., 1–17. doi:10.5194/gmd-2016-203. 30
Miyan, M. A. (2015). Droughts in Asian Least Developed Countries: Vulnerability and sustainability. Weather 31 Clim. Extrem. 7, 8–23. doi:10.1016/J.WACE.2014.06.003. 32
Morgan, J., and Northrop, E. (2017). Will the Paris Agreement accelerate the pace of change? Wiley Interdiscip. 33 Rev. Clim. Chang., e471. doi:10.1002/wcc.471. 34
Morice, C. P., Kennedy, J. J., Rayner, N. A., and Jones, P. D. (2012). Quantifying uncertainties in global and 35 regional temperature change using an ensemble of observational estimates: The HadCRUT4 data set. J. 36 Geophys. Res. Atmos. 117. doi:10.1029/2011JD017187. 37
Morita, T., Robinson, J., Adegbulugbe, A., Alcamo, J., Herbert, D., La Rovere, E. L., et al. (2001). “Greenhouse 38 Gas Emission Mitigation Scenarios and Implications,” in Climate Change 2001: Mitigation. Contribution 39 of Working Group III to the Third Assessment Report of the Intergovernmental Panel on Climate Change, 40 ed. J. P. B. Metz, O. Davidson, R. Swart (Cambridge: Cambridge University Press), 115–164. 41
Moss, R. H., Edmonds, J. A., Hibbard, K. A., Manning, M. R., Rose, S. K., van Vuuren, D. P., et al. (2010). The 42 next generation of scenarios for climate change research and assessment. Nature 463, 747–756. 43 doi:10.1038/nature08823. 44
Moss, R. H., and Schneider, S. H. (2000). Uncertainties in the IPCC TAR: Recommendations to lead authors for 45 more consistent assessment and reporting. Available at: 46 http://citeseerx.ist.psu.edu/viewdoc/download?doi=10.1.1.399.6290&rep=rep1&type=pdf [Accessed April 47 5, 2017]. 48
Mueller, B., and Seneviratne, S. I. (2014). Systematic land climate and evapotranspiration biases in CMIP5 49 simulations. Geophys. Res. Lett. 41, 128–134. doi:10.1002/2013GL058055. 50
Munck af Rosenschöld, J., Rozema, J. G., and Frye-Levine, L. A. (2014). Institutional inertia and climate 51 change: a review of the new institutionalist literature. Wiley Interdiscip. Rev. Clim. Chang. 5, 639–648. 52 doi:10.1002/wcc.292. 53
Myhre, G., Shindell, D., Bréon, F., Collins, W., Fuglestvedt, J., Huang, J., et al. (2013). “Anthropogenic and 54 natural radiative forcing,” in Climate Change 2013: The Physical Science Basis. Contribution of Working 55 Group I to the Fifth Assessment Report of the Intergovernmental Panel on Climate Change, eds. T. F. 56 Stocker, D. Qin, G.-K. Plattner, M. Tignor, S. K. Allen, J. Boschung, et al. (Cambridge, UK and New 57 York, NY, USA: Cambridge University Press), 658–740. doi:0.1017/CBO9781107415324.018. 58
Mysiak, J., Surminski, S., Thieken, A., Mechler, R., and Aerts, J. (2016). Brief communication: Sendai 59
Second Order Draft Chapter 1 IPCC SR1.5
Do Not Cite, Quote or Distribute 1-72 Total pages: 78
framework for disaster risk reduction - Success or warning sign for Paris? Nat. Hazards Earth Syst. Sci. 1 16, 2189–2193. doi:10.5194/nhess-16-2189-2016. 2
Niang, I., Ruppel, O. C., Abdrabo, M. A., Essel, A., Lennard, C., J, P., et al. (2014). “Africa,” in Climate 3 Change 2014: Impacts, Adaptation, and Vulnerability. Part B: Regional Aspects. Contribution of Working 4 Group II to the Fifth Assessment Report of the Intergovernmental Panel on Climate Change, eds. C. B. 5 Field, V. R. Barros, D. J. Dokken, K. J. Mach, M. D. Mastrandrea, T. E. Bilir, et al. (Cambridge, UK, and 6 New York, NY, USA: Cambridge University Press), 1199–1265. 7
Nilsson, M., Griggs, D., and Visbeck, M. (2016). Map the interactions between Sustainable Development Goals. 8 Nature 534, 320–322. doi:10.1038/534320a. 9
Nilsson, M., Nilsson, L. J., Hildingsson, R., Stripple, J., and Eikeland, P. O. (2011). The missing link: Bringing 10 institutions and politics into energy future studies. Futures 43, 1117–1128. 11 doi:10.1016/j.futures.2011.07.010. 12
O’ Brien, K., Pelling, M., Patwardhan, A., Hallegatte, S., Maskrey, A., Oki, T., et al. (2012). “Toward a 13 sustainable and resilient future,” in Managing the Risks of Extreme Events and Disasters to Advance 14 Climate Change Adaptation. A Special Report of Working Groups I and II of the Intergovernmental Panel 15 on Climate Change (IPCC), eds. C. B. Field, V. Barros, T. F. Stocker, D. Qin, D. J. Dokken, K. L. Ebi, et 16 al. (Cambridge, UK and New York, NY, USA: Cambridge University Press), 437–486. 17 doi:10.1017/CBO9781139177245.011. 18
O’Brien, K., and Selboe, E. (2015). “Social transformation. The real adaptive challenge,” in The adaptive 19 challenge of climate change, eds. K. OBrien and E. Selboe (Cambridge: Cambridge University Press), 20 311–323. doi:10.1017/CBO9781139149389.018. 21
O’Neill, B. C., Kriegler, E., Ebi, K. L., Kemp-Benedict, E., Riahi, K., Rothman, D. S., et al. (2017). The roads 22 ahead: Narratives for shared socioeconomic pathways describing world futures in the 21st century. Glob. 23 Environ. Chang. 42, 169–180. doi:10.1016/j.gloenvcha.2015.01.004. 24
O’Neill, B. C., Kriegler, E., Riahi, K., Ebi, K. L., Hallegatte, S., Carter, T. R., et al. (2014). A new scenario 25 framework for climate change research: The concept of shared socioeconomic pathways. Clim. Change 26 122, 387–400. doi:10.1007/s10584-013-0905-2. 27
O’Neill, B. C., Tebaldi, C., Van Vuuren, D. P., Eyring, V., Friedlingstein, P., Hurtt, G., et al. (2016). The 28 Scenario Model Intercomparison Project (ScenarioMIP) for CMIP6. Geosci. Model Dev. 9, 3461–3482. 29 doi:10.5194/gmd-9-3461-2016. 30
O’Rourke, D., and Lollo, N. (2015). Transforming Consumption: From Decoupling, to Behavior Change, to 31 System Changes for Sustainable Consumption. Annu. Rev. Environ. Resour. doi:10.1146/annurev-32 environ-102014-021224. 33
OECD (2016). The OECD supporting action on climate change. Available at: 34 https://www.oecd.org/environment/cc/The-OECD-supporting-action-on-climate-change.pdf [Accessed 35 July 21, 2017]. 36
OHCHR (2009). Report of the Office of the United Nations High Commissioner for Human Rights on the 37 relationship between climate change and human rights. doi:10.1093/jhuman/hup009. 38
OHCHR (2015). Submission of the Office of the High Commissioner for Human Rights to the 21st Conference 39 of the Parties to the United Nations Framework Convention on Climate Change. 40
Okereke, C. (2010). Climate justice and the international regime. Wiley Interdiscip. Rev. Clim. Chang. 1, 462–41 474. doi:10.1002/wcc.52. 42
Olsson, L., Opondo, P., Tschakert, Agrawal, A., Eriksen, S. H. H., Ma, S., et al. (2014). “Livelihoods and 43 poverty,” in Climate Change 2014: Impacts, Adaptation, and Vulnerability. Part A: Global and Sectoral 44 Aspects. Contribution of Working Group II to the Fifth Assessment Report of the Intergovernmental Panel 45 of Climate Change, eds. C. B. Field, V. R. Barros, D. J. Dokken, K. J. Mach, M. D. Mastrandrea, T. E. 46 Bilir, et al. (Cambridge, UK and New York, NY, USA: Cambridge University Press), 793–832. 47
Olsson, P., Moore, M.-L., Westley, F. R., and McCarthy, D. D. P. (2017). The concept of the Anthropocene as a 48 game-changer: a new context for social innovation and transformations to sustainability. Ecol. Soc. 22, 31. 49 doi:10.5751/ES-09310-220231. 50
Oppenheimer, M., Campos, M., Warren, R., Birkmann, J., Luber, G., O’Neill, B., et al. (2014). “Emergent Risks 51 and Key Vulnerabilities,” in Climate Change 2014: Impacts, Adaptation, and Vulnerability. Part A: 52 Global and Sectoral Aspects. Contribution of Working Group II to the Fifth Assessment Report of the 53 Intergovernmental Panel on Climate Change, eds. C. B. Field, V. R. Barros, D. J. Dokken, K. J. Mach, M. 54 D. Mastrandrea, T. E. Bilir, et al. (Cambridge, UK, and New York, NY, USA: Cambridge University 55 Press), 1039–1099. doi:10.1017/CBO9781107415379. 56
Otto, F. E. L., Frame, D. J., Otto, A., and Allen, M. R. (2015). Embracing uncertainty in climate change policy. 57 Nat. Clim. Chang. 5, 1–5. doi:10.1038/nclimate2716. 58
Palsson, G., Szerszynski, B., Sörlin, S., Marks, J., Avril, B., Crumley, C., et al. (2013). Reconceptualizing the 59
Second Order Draft Chapter 1 IPCC SR1.5
Do Not Cite, Quote or Distribute 1-73 Total pages: 78
“Anthropos” in the Anthropocene: Integrating the social sciences and humanities in global environmental 1 change research. Environ. Sci. Policy 28, 3–13. doi:10.1016/j.envsci.2012.11.004. 2
Pattberg, P., and Zelli, F. (2016). Environmental politics and governance in the anthropocene: Institutions and 3 legitimacy in a complex world. , eds. P. Pattberg and F. Zelli doi:10.4324/9781315697468. 4
Patterson, J., Schulz, K., Vervoort, J., van der Hel, S., Widerberg, O., Adler, C., et al. (2017). Exploring the 5 governance and politics of transformations towards sustainability. Environ. Innov. Soc. Transitions 24, 1–6 16. doi:10.1016/j.eist.2016.09.001. 7
Pelling, M. (2011). Adaptation to Climate Change: From Resilience to Transformation. Oxford: Oxford 8 University Press. 9
Pelling, M., O’Brien, K., and Matyas, D. (2015). Adaptation and transformation. Clim. Change 133, 113–127. 10 doi:10.1007/s10584-014-1303-0. 11
Pendergrass, A. G., Lehner, F., Sanderson, B. M., and Xu, Y. (2015). Does extreme precipitation intensity 12 depend on the emissions scenario? Geophys. Res. Lett. 42, 8767–8774. doi:10.1002/2015GL065854. 13
Peters, G. P., Marland, G., Le Quéré, C., Boden, T., Canadell, J. G., and Raupach, M. R. (2011). Rapid growth 14 in CO2 emissions after the 2008–2009 global financial crisis. Nat. Clim. Chang. 2, 2–4. 15 doi:10.1038/nclimate1332. 16
Pfeiffer, A., Millar, R., Hepburn, C., and Beinhocker, E. (2016). The “2°C capital stock” for electricity 17 generation: Committed cumulative carbon emissions from the electricity generation sector and the 18 transition to a green economy. Appl. Energy 179, 1395–1408. doi:10.1016/j.apenergy.2016.02.093. 19
Popp, A., Calvin, K., Fujimori, S., Havlik, P., Humpenöder, F., Stehfest, E., et al. (2017). Land-use futures in 20 the shared socio-economic pathways. Glob. Environ. Chang. 42, 331–345. 21 doi:10.1016/j.gloenvcha.2016.10.002. 22
Pörtner, H.-O., Karl, D., Boyd, P. W., Cheung, W., Lluch-Cota, S. E., Nojiri, Y., et al. (2014). “Ocean systems,” 23 in Climate Change 2014: Impacts, Adaptation, and Vulnerability. Part A: Global and Sectoral Aspects. 24 Contribution of Working Group II to the Fifth Assessment Report of the Intergovernmental Panel of 25 Climate Change, eds. C. B. Field, V. R. Barros, D. J. Dokken, K. J. Mach, M. D. Mastrandrea, T. E. Bilir, 26 et al. (Cambridge, United Kingdom and New York, NY, USA: Cambridge University Press), 411–484. 27
Rao, S., Klimont, Z., Smith, S. J., Van Dingenen, R., Dentener, F., Bouwman, L., et al. (2017). Future air 28 pollution in the Shared Socio-economic Pathways. Glob. Environ. Chang. 42, 346–358. 29 doi:10.1016/j.gloenvcha.2016.05.012. 30
Rao, S., Pachauri, S., Dentener, F., Kinney, P., Klimont, Z., Riahi, K., et al. (2013). Better air for better health: 31 Forging synergies in policies for energy access, climate change and air pollution. Glob. Environ. Chang. 32 23, 1122–1130. doi:10.1016/j.gloenvcha.2013.05.003. 33
Rasch, P. J., Tilmes, S., Turco, R. P., Robock, A., Oman, L., Chen, C.-C., et al. (2008). An overview of 34 geoengineering of climate using stratospheric sulphate aerosols. Philos. Trans. R. Soc. A Math. Phys. Eng. 35 Sci. 366, 4007–4037. doi:10.1098/rsta.2008.0131. 36
Reckien, D., Creutzig, F., Fernandez, B., Lwasa, S., Tovar-restrepo, M., and Satterthwaite, D. (2017). Climate 37 change, equity and the Sustainable Development Goals: an urban perspective. Environ. Urban. 29, 159–38 182. doi:10.1177/0956247816677778. 39
Reisinger, A., Havlik, P., Riahi, K., Vliet, O., Obersteiner, M., and Herrero, M. (2012). Implications of 40 alternative metrics for global mitigation costs and greenhouse gas emissions from agriculture. Clim. 41 Change, 1–14. doi:10.1007/s10584-012-0593-3. 42
Reisinger, A., Kitching, R. L., Chiew, F., Hughes, L., Newton, P. C. D., Schuster, S. S., et al. (2014). 43 “Australasia,” in Climate Change 2014: Impacts, Adaptation, and Vulnerability. Part B: Regional 44 Aspects. Contribution of Working Group II to the Fifth Assessment Report of the Intergovernmental Panel 45 of Climate Change, eds. V. R. Barros, C. B. Field, D. J. Dokken, M. D. Mastrandrea, K. J. Mach, T. E. 46 Bilir, et al. (Cambridge, United Kingdom and New York, NY, USA: Cambridge University Press), 1371–47 1438. 48
Resurrección, B. P. (2013). Persistent women and environment linkages in climate change and sustainable 49 development agendas. Womens. Stud. Int. Forum 40, 33–43. doi:10.1016/j.wsif.2013.03.011. 50
Revi, A., Satterthwaite, D. E., Aragón-Durand, F., Corfee-Morlot, J., Kiunsi, R., Pelling, M., et al. (2014). 51 “Urban areas,” in Climate Change 2014: Impacts, Adaptation, and Vulnerability. Part A: Global and 52 Sectoral Aspects. Contribution of Working Group II to the Fifth Assessment Report of the 53 Intergovernmental Panel on Climate Change, eds. C. B. Field, V. R. Barros, D. J. Dokken, K. J. Mach, M. 54 D. Mastrandrea, T. E. Bilir, et al. (Cambridge, UK, and New York, NY, USA: Cambridge University 55 Press), 535–612. 56
Rhodes, R. H., Brook, E. J., McConnell, J. R., Blunier, T., Sime, L. C., Faïn, X., et al. (2017). Atmospheric 57 methane variability: Centennial-scale signals in the Last Glacial Period. Global Biogeochem. Cycles 31, 58 575–590. doi:10.1002/2016GB005570. 59
Second Order Draft Chapter 1 IPCC SR1.5
Do Not Cite, Quote or Distribute 1-74 Total pages: 78
Riahi, K., van Vuuren, D. P., Kriegler, E., Edmonds, J., O’Neill, B. C., Fujimori, S., et al. (2017). The Shared 1 Socioeconomic Pathways and their energy, land use, and greenhouse gas emissions implications: An 2 overview. Glob. Environ. Chang. 42, 153–168. doi:10.1016/j.gloenvcha.2016.05.009. 3
Richardson, M., Cowtan, K., Hawkins, E., and Stolpe, M. B. (2016). Reconciled climate response estimates 4 from climate models and the energy budget of Earth. Nat. Clim. Chang. 6, 931–935. 5
Richardson, M., Cowtan, K., and Millar, R. J. (2017). Global temperature definition affects achievement of 6 long-term climate goals. Environ. Res. Lett. submitted. 7
Robinson, J. B. (1982). Energy backcasting A proposed method of policy analysis. Energy Policy 10, 337–344. 8 doi:10.1016/0301-4215(82)90048-9. 9
Robinson, J. B. (1990). Futures under glass: A recipe for people who hate to predict. Futures 22, 820–842. 10 doi:10.1016/0016-3287(90)90018-D. 11
Rockström, J., Schellnhuber, H. J., Hoskins, B., Ramanathan, V., Schlosser, P., Brasseur, G. P., et al. (2016). 12 The world’s biggest gamble. Earth’s Futur. 4, 465–470. doi:10.1002/2016EF000392. 13
Rockström, J., Steffen, W., Noone, K., Persson, Å., Chapin, F. S., Lambin, E. F., et al. (2009). A safe operating 14 space for humanity. Nature 461, 472–475. doi:10.1038/461472a. 15
Rogelj, J., Elzen, M. Den, Fransen, T., Fekete, H., Winkler, H., Schaeffer, R., et al. (2016). Paris Agreement 16 climate proposals need boost to keep warming well below 2°C. Nat. Clim. Chang. 534, 631–639. 17 doi:10.1038/nature18307. 18
Rogelj, J., Luderer, G., Pietzcker, R. C., Kriegler, E., Schaeffer, M., Krey, V., et al. (2015). Energy system 19 transformations for limiting end-of-century warming to below 1.5 °C. Nat. Clim. Chang. 5, 519–527. 20 doi:10.1038/nclimate2572. 21
Rogelj, J., Popp, A., Calvin, K. V, Al., E., Luderer, G., Emmerling, J., et al. (2017). Transition pathways 22 towards limiting climate change below 1.5°C. Nat. Clim. Chang. submitted. 23
Rohde, R., Muller, R., Jacobsen, R., Perlmutter, S., Rosenfeld, A., Wurtele, J., et al. (2013). Berkeley Earth 24 Temperature Averaging Process. Geoinformatics Geostatistics An Overv. 1, 1–13. doi:10.4172/2327-25 4581.1000103. 26
Rose, S. K., Richels, R., Blanford, G., and Rutherford, T. (2017). The Paris Agreement and next steps in 27 limiting global warming. Clim. Change 142, 255–270. doi:10.1007/s10584-017-1935-y. 28
Rosenbloom, D. (2017). Pathways: An emerging concept for the theory and governance of low-carbon 29 transitions. Glob. Environ. Chang. 43, 37–50. doi:10.1016/j.gloenvcha.2016.12.011. 30
Rosenzweig, C., Arnell, N. W., Ebi, K. L., Lotze-Campen, H., Raes, F., Rapley, C., et al. (2017). Assessing 31 inter-sectoral climate change risks: the role of ISIMIP. Environ. Res. Lett. 12, 10301. Available at: 32 http://stacks.iop.org/1748-9326/12/i=1/a=010301. 33
Rosenzweig, C., Karoly, D., Vicarelli, M., Neofotis, P., Wu, Q., Casassa, G., et al. (2008). Attributing physical 34 and biological impacts to anthropogenic climate change. Nature 453, 353–357. doi:10.1038/nature06937. 35
Rosenzweig, C., Solecki, W., Romeo-Lankao, P., Shagun, M., Dhakal, S., and Ali Ibrahim, S. eds. (2018). 36 Climate Change and Cities: Second Assessment Report of the Urban Climate Change Research Network. 37 Cambridge, United Kingdom and New York, NY, USA: Cambridge University Press. 38
Rosenzweig, C., Solecki, W., Romero-Lankao, P., Mehrotra, S., Dhakal, S., Bowman, et al. (2015). ARC3.2 39 Summary for City Leaders. New York, NY, USA Available at: http://uccrn.org/arc3-2/. 40
Saikawa, E., Prinn, R. G., Dlugokencky, E., Ishijima, K., Dutton, G. S., Hall, B. D., et al. (2014). Global and 41 regional emissions estimates for N2O. Atmos. Chem. Phys. 14, 4617–4641. doi:10.5194/acp-14-4617-42 2014. 43
Samir, K., and Lutz, W. (2017). The human core of the shared socioeconomic pathways: Population scenarios 44 by age, sex and level of education for all countries to 2100. Glob. Environ. Chang. 42, 181–192. 45 doi:10.1016/j.gloenvcha.2014.06.004. 46
Samset, B. H., and Myhre, G. (2017). Committed warming and the role of anthropogenic aerosols. Sci. Rep., 1–47 21. 48
Sarofim, M. C., Waldhoff, S. T., and Anenberg, S. C. (2017). Valuing the Ozone-Related Health Benefits of 49 Methane Emission Controls. Environ. Resour. Econ. 66, 45–63. doi:10.1007/s10640-015-9937-6. 50
Saunois, M., Bousquet, P., Poulter, B., Peregon, A., Ciais, P., Canadell, J. G., et al. (2016a). The global methane 51 budget 2000-2012. Earth Syst. Sci. Data 8, 697–751. doi:10.5194/essd-8-697-2016. 52
Saunois, M., Jackson, R. B., Bousquet, P., Poulter, B., and Canadell, J. G. (2016b). The growing role of 53 methane in anthropogenic climate change. Environ. Res. Lett. 11, 120207. doi:10.1088/1748-54 9326/11/12/120207. 55
Savaresi, A. (2016). The Paris Agreement: a new beginning? J. Energy Nat. Resour. Law 34, 16–26. 56 doi:10.1080/02646811.2016.1133983. 57
Schäfer, S., Lawrence, M., Stelzer, H., Born, W., Low, S., Aaheim, A., et al. (2015). The European 58 Transdisciplinary Assessment of Climate Engineering (EuTRACE): Removing Greenhouse Gases from 59
Second Order Draft Chapter 1 IPCC SR1.5
Do Not Cite, Quote or Distribute 1-75 Total pages: 78
the Atmosphere and Reflecting Sunlight away from Earth. Available at: 1 http://pubman.mpdl.mpg.de/pubman/item/escidoc:2478948:2/component/escidoc:2478947/rz_150715_eut2 race_digital.pdf. 3
Schewe, J., Heinke, J., Gerten, D., Haddeland, I., Arnell, N. W., Clark, D. B., et al. (2014). Multimodel 4 assessment of water scarcity under climate change. Proc. Natl. Acad. Sci. 111, 3245–3250. Available at: 5 http://www.pnas.org/content/111/9/3245.abstract. 6
Schewe, J., and Levermann, A. (2017). Non-linear intensification of Sahel rainfall as a possible dynamic 7 response to future warming. Earth Syst. Dyn. 8, 495–505. doi:10.5194/esd-8-495-2017. 8
Schleussner, C.-F. F., Lissner, T. K., Fischer, E. M., Wohland, J., Perrette, M. M., Golly, A., et al. (2016a). 9 Differential climate impacts for policy relevant limits to global warming: the case of 1.5°C and 2°C. Earth 10 Syst. Dyn. 7, 327–351. doi:10.5194/esd-7-327-2016. 11
Schleussner, C.-F., Pfleiderer, P., and Fischer, E. M. (2017). In the observational record half a degree matters. 12 Nat. Clim. Chang. 7, 460–462. doi:10.1038/nclimate3320. 13
Schleussner, C. F., Lissner, T. K., Fischer, E. M., Wohland, J., Perrette, M., Golly, A., et al. (2016b). 14 Differential climate impacts for policy-relevant limits to global warming: The case of 1.5 °c and 2 °c. 15 Earth Syst. Dyn. 7, 327–351. doi:10.5194/esd-7-327-2016. 16
Schroeder, H., Boykoff, M. T., and Spiers, L. (2012). Equity and state representations in climate negotiations. 17 Nat. Clim. Chang. 2, 834–836. doi:10.1038/nclimate1742. 18
Schubert, D. K. J., Thuß, S., and Möst, D. (2015). Does political and social feasibility matter in energy 19 scenarios? Energy Res. Soc. Sci. 7, 43–54. doi:10.1016/j.erss.2015.03.003. 20
Schurer, A. P., Mann, M. E., Hawkins, E., Tett, S. F. B., and Hegerl, G. C. (2017). Importance of the pre-21 industrial baseline for likelihood of exceeding Paris goals. Nat. Clim. Chang. doi:10.1038/nclimate3345. 22
Seneviratne, S. I., Donat, M. G., Pitman, A. J., Knutti, R., and Wilby, R. L. (2016). Allowable CO2 emissions 23 based on regional and impact-related climate targets. Nature 529, 477–483. doi:10.1038/nature16542. 24
Seneviratne, S. I., Nicholls, N., Easterling, D., Goodess, C. M., Kanae, S., Kossin, J., et al. (2012). “Changes in 25 climate extremes and their impacts on the natural physical environment,” in Managing the Risks of 26 Extreme Events and Disasters to Advance Climate Change Adaptation. A Special Report of Working 27 Groups I and II of the Intergovernmental Panel on Climate Change (IPCC), eds. C. B. Field, V. Barros, 28 T. F. Stocker, D. Qin, D. J. Dokken, K. L. Ebi, et al. (Cambridge, UK and New York, NY, USA: 29 Cambridge University Press), 109–230. 30
Seneviratne, S. I., Phipps, S. J., Pitman, A. J., Hirsch, A. L., Davin, E. L., Donat, M. G., et al. (2017). Land 31 radiative management as contributor to regional-scale climate adaptation and mitigation. Nat. Geosci. 32 submitted. 33
Seto, K. C., Davis, S. J., Mitchell, R. B., Stokes, E. C., Unruh, G., and Ürge-Vorsatz, D. (2016). Carbon Lock-34 In: Types, Causes, and Policy Implications. Annu. Rev. Environ. Resour. 41, 425–452. 35 doi:10.1146/annurev-environ-110615-085934. 36
Settele, J., Scholes, R., Betts, R., Bunn, S., Leadley, P., Nepstad, D., et al. (2014). “Terrestrial and inland water 37 systems. In: Climate Change 2014: Impacts, Adaptation, and Vulnerability.,” in Part A: Global and 38 Sectoral Aspects. Contribution of Working Group II to the Fifth Assessment Report of the 39 Intergovernmental Panel on Climate Change, eds. C. B. Field, V. R. Barros, D. J. Dokken, K. J. Mach, M. 40 D. Mastrandrea, T. E. Bilir, et al. (Cambridge University Press), 271–359. 41
Shiferaw, B., Tesfaye, K., Kassie, M., Abate, T., Prasanna, B. M., and Menkir, A. (2014). Managing 42 vulnerability to drought and enhancing livelihood resilience in sub-Saharan Africa: Technological, 43 institutional and policy options. Weather Clim. Extrem. 3, 67–79. doi:10.1016/J.WACE.2014.04.004. 44
Shindell, D. T. (2015). The social cost of atmospheric release. Clim. Change 130, 313–326. 45 doi:10.1007/s10584-015-1343-0. 46
Shindell, D. T., Fuglestvedt, J. S., and Collins, W. J. (2017). The social cost of methane: theory and 47 applications. Faraday Discuss. 6, 773. doi:10.1039/C7FD00009J. 48
Shindell, D. T., Lee, Y., and Faluvegi, G. (2016). Climate and health impacts of US emissions reductions 49 consistent with 2C. Nat. Clim. Chang. 6, 503–509. 50
Shine, K. P., Allan, R. P., Collins, W. J., and Fuglestvedt, J. S. (2015). Metrics for linking emissions of gases 51 and aerosols to global precipitation changes. Earth Syst. Dyn. 6, 525–540. doi:10.5194/esd-6-525-2015. 52
Shine, K. P., Fuglestvedt, J. S., Hailemariam, K., and Stuber, N. (2005). Alternatives to the Global Warming 53 Potential for comparing climate impacts of emissions of greenhouse gases. Clim. Change 68, 281–302. 54 doi:10.1007/s10584-005-1146-9. 55
Shove, E., and Walker, G. (2007). CAUTION! Transitions ahead: Politics, practice, and sustainable transition 56 management. Environ. Plan. A 39, 763–770. doi:10.1068/a39310. 57
Shove, E., Watson, M., and Spurling, N. (2015). Conceptualizing connections. Eur. J. Soc. Theory. 58 doi:10.1177/1368431015579964. 59
Second Order Draft Chapter 1 IPCC SR1.5
Do Not Cite, Quote or Distribute 1-76 Total pages: 78
Shue, H. (2013). Climate Hope: Implementing the Exit Strategy. Chic. J. Int. Law 13, 381. Available at: 1 http://www.questia.com/library/journal/1P3-2897486951/climate-hope-implementing-the-exit-2 strategy%5Cnfiles/328/climate-hope-implementing-the-exit-strategy.html. 3
Shue, H. (2014). Climate Justice: Vulnerability and Protection. 4 Sitch, S., Cox, P. M., Collins, W. J., and Huntingford, C. (2007). Indirect radiative forcing of climate change 5
through ozone effects on the land-carbon sink. Nature 448, 791. Available at: 10.1038/nature06059. 6 Smith, C. J., Forster, P. M., Allen, M., Fuglestvedt, J., Millar, R., Rogelj, J., et al. (2018). 1.5°C - Are we there 7
yet? Env. Res. Lett. submitted. 8 Smith, C. J., Forster, P. M., Allen, M., Leach, N., Millar, R. J., Passerello, G. A., et al. (2017). FAIR v1.1: A 9
simple emissions-based impulse response and carbon cycle model. Geosci. Model Dev. Discuss., 1–45. 10 doi:10.5194/gmd-2017-266. 11
Smith, S. J., Karas, J., Edmonds, J., Eom, J., and Mizrahi, A. (2013). Sensitivity of multi-gas climate policy to 12 emission metrics. Clim. Change 117, 663–675. doi:10.1007/s10584-012-0565-7. 13
Smith, S. J., and Rasch, P. J. (2013). The long-term policy context for solar radiation management. Clim. 14 Change 121, 487–497. doi:10.1007/s10584-012-0577-3. 15
Smith, S. M., Lowe, J. a., Bowerman, N. H. a., Gohar, L. K., Huntingford, C., and Allen, M. R. (2012). 16 Equivalence of greenhouse-gas emissions for peak temperature limits. Nat. Clim. Chang. 2, 535–538. 17 doi:10.1038/nclimate1496. 18
Söderholm, P., Hildingsson, R., Johansson, B., Khan, J., and Wilhelmsson, F. (2011). Governing the transition 19 to low-carbon futures: A critical survey of energy scenarios for 2050. Futures 43, 1105–1116. 20 doi:10.1016/j.futures.2011.07.009. 21
Solecki, W., Pelling, M., and Garschagen, M. (2017). Transitions between risk management regimes in cities. 22 Ecol. Soc. 22, art38. doi:10.5751/ES-09102-220238. 23
Solomon, S., Plattner, G.-K. G., Knutti, R., and Friedlingstein, P. (2009). Irreversible climate change due to 24 carbon dioxide emissions. Proc. Natl. Acad. Sci. U. S. A. 106, 1704–9. doi:10.1073/pnas.0812721106. 25
Somanathan, E., Sterner, T., Sugiyama, T., Chimanikire, D., Dubash, N. K. K., Essandoh-Yeddu, J., et al. 26 (2014). “National and Sub-national Policies and Institutions,” in Climate Change 2014: Mitigation of 27 Climate Change. Contribution of Working Group III to the Fifth Assessment Report of the 28 Intergovernmental Panel on Climate Change, eds. O. Edenhofer, R. Pichs-Madruga, Y. Sokona, E. 29 Farahani, S. Kadner, K. Seyboth, et al. (Cambridge, UK, and New York, NY, USA: Cambridge University 30 Press). 31
Sovacool, B. K., Linnér, B.-O., and Goodsite, M. E. (2015). The political economy of climate adaptation. Nat. 32 Clim. Chang. 5, 616–618. doi:10.1038/nclimate2665. 33
Stechow, C. von, Minx, J. C., Riahi, K., Jewell, J., McCollum, D. L., Callaghan, M. W., et al. (2016). 2°C and 34 the SDGs: United they stand, divided they fall? Environ. Res. Lett. 11, 34022. doi:10.1088/1748-35 9326/11/3/034022. 36
Steffen, W., Leinfelder, R., Zalasiewicz, J., Waters, C. N., Williams, M., Summerhayes, C., et al. (2016). 37 Stratigraphic and Earth System approaches to defining the Anthropocene. Earth’s Futur. 4, 324–345. 38 doi:10.1002/2016EF000379. 39
Steffen, W., Richardson, K., Rockstrom, J., Cornell, S. E., Fetzer, I., Bennett, E. M., et al. (2015). Planetary 40 boundaries: Guiding human development on a changing planet. Science (80-. ). 347, 1259855–1259855. 41 doi:10.1126/science.1259855. 42
Stern, N. (2014). Ethics, Equity and the Economics of Climate Change Paper 1: Science and Philosophy. Econ. 43 Philos. 30, 397–444. doi:10.1017/S0266267114000297. 44
Sterner, E., Johansson, D. J. A., and Azar, C. (2014). Emission metrics and sea level rise. Clim. Change 127, 45 335–351. doi:10.1007/s10584-014-1258-1. 46
Stocker, T. F., Dahe, Q., Plattner, G.-K., Alexander, L. V., Allen, S. K., Bindoff, N. L., et al. (2013). “Technical 47 Summary,” in Climate Change 2013: The Physical Science Basis. Contribution of Working Group I to the 48 Fifth Assessment Report of the Intergovernmental Panel on Climate Change, eds. T. F. Stocker, D. Qin, 49 G.-K. Plattner, M. Tignor, S. K. Allen, J. Boschung, et al. (Cambridge, UK and New York, NY, USA: 50 Cambridge University Press), 33–115. doi:10.1017/ CBO9781107415324.005. 51
Stone, D., Auffhammer, M., Carey, M., Hansen, G., Huggel, C., Cramer, W., et al. (2013). The challenge to 52 detect and attribute effects of climate change on human and natural systems. Clim. Change 121, 381–395. 53 doi:10.1007/s10584-013-0873-6. 54
Strefler, J., Luderer, G., Aboumahboub, T., and Kriegler, E. (2014). Economic impacts of alternative 55 greenhouse gas emission metrics: a model-based assessment. Clim. Change 125, 319–331. 56 doi:10.1007/s10584-014-1188-y. 57
Taylor, A. (2016). Institutional inertia in a changing climate Climate adaptation planning in Cape Town, South 58 Africa. Int. J. Clim. Chang. Strateg. Manag. 8, 194–211. doi:10.1108/IJCCSM-03-2014-0033. 59
Second Order Draft Chapter 1 IPCC SR1.5
Do Not Cite, Quote or Distribute 1-77 Total pages: 78
Taylor, K. E., Stouffer, R. J., and Meehl, G. A. (2012). An overview of CMIP5 and the experiment design. Bull. 1 Am. Meteorol. Soc. 93, 485–498. doi:10.1175/BAMS-D-11-00094.1. 2
The Royal Society (2009). Geoengineering the climate: science, governance and uncertainty. 3 doi:10.1007/s10098-010-0287-3. 4
Thompson, R. L., Chevallier, F., Crotwell, A. M., Dutton, G., Langenfelds, R. L., Prinn, R. G., et al. (2014). 5 Nitrous oxide emissions 1999 to 2009 from a global atmospheric inversion. Atmos. Chem. Phys. 14, 6 1801–1817. doi:10.5194/acp-14-1801-2014. 7
Tol, R. S. J. (1999). The marginal costs of greenhouse gas emissions. Energy J. 20, 61–81. 8 Tol, R. S. J., Berntsen, T. K., O’Neill, B. C., Fuglestvedt, and Keith, P. S. (2012). A unifying framework for 9
metrics for aggregating the climate effect of different emissions. Environ. Res. Lett. 7, 44006. Available 10 at: http://stacks.iop.org/1748-9326/7/i=4/a=044006. 11
Tschakert, P., Barnett, J., Ellis, N., Lawrence, C., Tuana, N., New, M., et al. (2017). Climate change and loss, as 12 if people mattered: values, places, and experiences. Wiley Interdiscip. Rev. Clim. Chang. 8, e476--n/a. 13 doi:10.1002/wcc.476. 14
Tschakert, P., van Oort, B., St. Clair, A. L., and LaMadrid, A. (2013). Inequality and transformation analyses: a 15 complementary lens for addressing vulnerability to climate change. Clim. Dev. 5, 340–350. 16 doi:10.1080/17565529.2013.828583. 17
Turnheim, B., Berkhout, F., Geels, F., Hof, A., McMeekin, A., Nykvist, B., et al. (2015). Evaluating 18 sustainability transitions pathways: Bridging analytical approaches to address governance challenges. 19 Glob. Environ. Chang. 35, 239–253. doi:10.1016/j.gloenvcha.2015.08.010. 20
Uittenbroek, C. J., Janssen-Jansen, L. B., and Runhaar, H. A. C. (2013). Mainstreaming climate adaptation into 21 urban planning: Overcoming barriers, seizing opportunities and evaluating the results in two Dutch case 22 studies. Reg. Environ. Chang. 13, 399–411. doi:10.1007/s10113-012-0348-8. 23
UN (2015). World Population Prospects - Population Division - United Nations. Available at: 24 https://esa.un.org/unpd/wpp/. 25
UN General Assembly (2015). Transforming our world: the 2030 Agenda for Sustainable Development. 26 Available at: http://unctad.org/meetings/es/SessionalDocuments/ares70d1_es.pdf. 27
UNDP (2016). Human Development Report 2016: Human Development for Everyone. New York, NY, USA 28 Available at: http://hdr.undp.org. 29
UNFCCC (2016). Aggregate effect of the intended nationally determined contributions: an update. 30 doi:10.1093/iclqaj/24.3.577. 31
UNHRC (2016). Human Rights Council Resolution 32/33, Human Rights and Climate Change. 32 UNISDR (2015). Sendai Framework for Disaster Risk Reduction 2015 - 2030. doi:A/CONF.224/CRP.1. 33 UNRISD (2016). Policy innovations for transformative change. Implementing the 2030 agenda for sustainable 34
development. Geneva Available at: 35 http://www.unrisd.org/80256B42004CCC77/(httpInfoFiles)/2D9B6E61A43A7E87C125804F003285F5/$f36 ile/Flagship2016_FullReport.pdf. 37
Unruh, G. (2000). Understanding carbon lock-in. Energy Policy 28, 817–830. doi:10.1016/S0301-38 4215(00)00070-7. 39
van Oldenborgh, G. J., van der Wiel, K., Sebastian, A., Singh, R., Arrighi, J., Otto, F., et al. (2017). Attribution 40 of extreme rainfall from Hurricane Harvey, August 2017. Environ. Res. Lett. 12, 124009. Available at: 41 http://stacks.iop.org/1748-9326/12/i=12/a=124009. 42
van Vuuren, D. P., Edmonds, J., Kainuma, M., Riahi, K., Thomson, A., Hibbard, K., et al. (2011). The 43 representative concentration pathways: An overview. Clim. Change 109, 5–31. doi:10.1007/s10584-011-44 0148-z. 45
van Vuuren, D. P., Kriegler, E., O’Neill, B. C., Ebi, K. L., Riahi, K., Carter, T. R., et al. (2014). A new scenario 46 framework for Climate Change Research: Scenario matrix architecture. Clim. Change 122, 373–386. 47 doi:10.1007/s10584-013-0906-1. 48
Vautard, R., Gobiet, A., Sobolowski, S., Kjellström, E., Stegehuis, A., Watkiss, P., et al. (2014). The European 49 climate under a 2°C global warming. Environ. Res. Lett. 9. doi:10.1088/1748-9326/9/3/034006. 50
Vose, R. S., Arndt, D., Banzon, V. F., Easterling, D. R., Gleason, B., Huang, B., et al. (2012). NOAA’s merged 51 land-ocean surface temperature analysis. Bull. Am. Meteorol. Soc. 93, 1677–1685. doi:10.1175/BAMS-D-52 11-00241.1. 53
Voski, A. (2016). The Role of Climate Change in Armed Conflicts across the Developing World and in the 54 Ongoing Syrian War. Carlet. Rev. Int. Aff. 3, 120–141. 55
Warszawski, L., Frieler, K., Huber, V., Piontek, F., Serdeczny, O., and Schewe, J. (2014). The Inter-Sectoral 56 Impact Model Intercomparison Project (ISI-MIP): project framework. Proc. Natl. Acad. Sci. U. S. A. 111, 57 3228–32. doi:10.1073/pnas.1312330110. 58
Waters, C. N., Zalasiewicz, J., Summerhayes, C., Barnosky, A. D., Poirier, C., Ga uszka, A., et al. (2016). The 59
Second Order Draft Chapter 1 IPCC SR1.5
Do Not Cite, Quote or Distribute 1-78 Total pages: 78
Anthropocene is functionally and stratigraphically distinct from the Holocene. Science (80-. ). 351, 1 aad2622-aad2622. doi:10.1126/science.aad2622. 2
WCED (1987). Our Common Future. doi:10.2307/2621529. 3 Weyant, J. P., de la Chesnaye, F. C., and Blanford, G. J. (2006). Overview of EMF-21: Multigas Mitigation and 4
Climate Policy. Energy J. 27, 1–32. 5 Whan, K., Zscheischler, J., Orth, R., Shongwe, M., Rahimi, M., Asare, E. O., et al. (2015). Impact of soil 6
moisture on extreme maximum temperatures in Europe. Weather Clim. Extrem. 9, 57–67. 7 doi:10.1016/j.wace.2015.05.001. 8
Whitmarsh, L., O’Neill, S., and Lorenzoni, I. (2011). Engaging the public with climate change : behaviour 9 change and communication. Earthscan Available at: 10 https://www.aps.org/units/fps/newsletters/201201/schroeder.cfm [Accessed December 13, 2017]. 11
Wigley, T. M. L. (1998). The Kyoto Protocol: CO2, CH4 and climate implications. Geophys. Res. Lett. 25, 12 2285–2288. doi:10.1029/98gl01855. 13
Wise, R. M., Fazey, I., Stafford Smith, M., Park, S. E., Eakin, H. C., Archer Van Garderen, E. R. M., et al. 14 (2014). Reconceptualising adaptation to climate change as part of pathways of change and response. Glob. 15 Environ. Chang. 28, 325–336. doi:10.1016/j.gloenvcha.2013.12.002. 16
WMO (2015). The State of Greenhouse Gases in the Atmosphere Based on Global Observations through 2014. 17 WMO Greenh. Gas Bull. No. 11, 1–4. 18 doi:http://www.wmo.int/pages/prog/arep/gaw/ghg/documents/GHG_bull_6en.pdf. 19
Wolf, J., Asrar, G. R., and West, T. O. (2017). Revised methane emissions factors and spatially distributed 20 annual carbon fluxes for global livestock. Carbon Balance Manag. 12, 16. doi:10.1186/s13021-017-0084-21 y. 22
Wolff, E. W. (2011). Greenhouse gases in the Earth system: a palaeoclimate perspective. Philos. Trans. R. Soc. 23 A Math. Phys. Eng. Sci. 369, 2133–2147. doi:10.1098/rsta.2010.0225. 24
World Bank (2013). Turn Down the Heat: Climate Extremes, Regional Impacts, and the Case for Resilience. 25 Zalasiewicz, J., Waters, C., Wolfe, A., Barnosky, A., Cearreta, A., Edgeworth, M., et al. (2017). Making the 26
case for a formal Anthropocene Epoch: an analysis of ongoing critiques. Newsletters Stratigr. 50, 205–27 226. doi:10.1127/nos/2017/0385. 28
Zickfeld, K., Eby, M., Matthews, H. D., and Weaver, A. J. (2009). Setting cumulative emissions targets to 29 reduce the risk of dangerous climate change. Proc. Natl. Acad. Sci. U. S. A. 106, 16129–16134. 30 doi:10.1073/pnas.0805800106. 31
Zscheischler, J., and Seneviratne, S. I. (2017). Dependence of drivers affects risks associated with compound 32 events. Sci. Adv. 3. doi:10.1126/sciadv.1700263. 33