A new seismic hazard analysis using FOSM algorithms J.P. Wang a , Yih-Min Wu b,n a Dept of Civil & Environmental Eng., HKUST, Kowloon, Hong Kong b Dept of Geosciences, National Taiwan University, Taipei, Taiwan article info Article history: Received 10 October 2012 Received in revised form 25 July 2014 Accepted 8 October 2014 Available online 28 October 2014 Keywords: FOSM algorithms Seismic hazard assessment Strong ground motion Taiwan abstract From recent lessons, it is evident that earthquake prediction is immature and impractical as of now. Under the circumstances, seismic hazard analysis is considered a more practical approach for earthquake hazard mitigation, by estimating the annual rate of earthquake ground motions (or seismic hazard) based on seismicity and other geological evidences. Like other earthquake studies for the high-seismicity region around Taiwan, this study aims to conduct a new seismic hazard assessment for the region using the well-established FOSM (first-order second-moment) algorithm, on the record of 55,000 earthquakes observed in the past 110 years. The new seismic hazard analysis from a different perspective showsthat the annual rate for earthquake-induced PGA to exceed the current design value (i.e., 0.23g) in two major cities in Taiwan should be relatively low, with it no greater than 0.0006 per year. Besides, the FOSM estimates were found very close to those with Monte Carlo Simulation (MCS), mainly because the skewness of the three random variables (i.e., earthquake magnitude, location, and model error) considered in the probabilistic analysis is not very large. & 2014 Elsevier Ltd. All rights reserved. 1. Introduction Since it is challenging to predict an earthquake’s magnitude, location and time, seismic hazard analysis is considered a more practical engineering solution for earthquake hazard mitigation [1]. But before introducing the analysis, it is worth clarifying the definition of seismic hazard in the first place: Rather than casualty or economic loss induced by earthquakes, seismic hazard refers to the annual rate of earthquake ground motions, such as an estimate of PGA 40.1g ¼ 0.01 per year. In other words, seismic hazard analysis aims to develop a site-specific earthquake-resistant design based on earthquake data (e.g., seismicity) around a site. Nowadays, Deterministic Seismic Hazard Analysis (DSHA) and Probabilistic Seismic Hazard Analysis (PSHA) are the two repre- sentative approaches, with many case studies reported in the last few decades [2–5]. On the other hand, new seismic hazard assessments were also reported recently [6–8]. For example, based on earthquake intensity data in the last 500 years, Liu et al. [6] quantified seismic hazards in North China from a different per- spective than the conventional PSHA and DSHA. The region around Taiwan is known for high seismicity. In average, more than two thousand earthquakes with magnitude greater than 3.0 are occurring around this region. Under the circumstances, a variety of earthquake studies for the region were conducted, including seismic hazard assessments [2,3], earthquake early warning [9,10], active fault investigation [11,12], and earth- quake risk assessment [13]. As a result, the key scope of this study is to perform a new seismic hazard assessment for this high-seismicity region, using the FOSM algorithm to estimate the annual rate of earthquake motions with the statistics of major earthquakes in the past 110 years. Not only was the new FOSM seismic hazard assessment proved as robust as that with MCS, but the results of the case study are valuable to earthquake-resistant designs in Taiwan. This paper in the following is organized with an overview of probabilistic analysis, the seismicity around Taiwan, and local ground motion models, followed by the case studies for two major cities in Taiwan. In addition, the seismic hazard estimates from the FOSM computations were compared to those from MCS, showing the two are almost the same, mainly attributed to the low skewness of input random variables (i.e., earthquake magnitude, location, and motion attenuation) considered in this probabilistic analysis. 2. Probabilistic analysis Unlike deterministic analysis, usually the analytical solution of a probabilistic analysis is difficult to develop. As a result, several algorithms were developed to solve a probabilistic analysis, Contents lists available at ScienceDirect journal homepage: www.elsevier.com/locate/soildyn Soil Dynamics and Earthquake Engineering http://dx.doi.org/10.1016/j.soildyn.2014.10.006 0267-7261/& 2014 Elsevier Ltd. All rights reserved. n Corresponding author. E-mail addresses: [email protected](J.P. Wang), [email protected](Y.-M. Wu). Soil Dynamics and Earthquake Engineering 67 (2014) 251–256
Transcript
A new seismic hazard analysis using FOSM algorithms
J.P. Wang a, Yih-Min Wu b,n
a Dept of Civil & Environmental Eng., HKUST, Kowloon, Hong Kongb Dept of Geosciences, National Taiwan University, Taipei, Taiwan
a r t i c l e i n f o
Article history:Received 10 October 2012Received in revised form25 July 2014Accepted 8 October 2014Available online 28 October 2014
From recent lessons, it is evident that earthquake prediction is immature and impractical as of now.Under the circumstances, seismic hazard analysis is considered a more practical approach for earthquakehazard mitigation, by estimating the annual rate of earthquake ground motions (or seismic hazard)based on seismicity and other geological evidences. Like other earthquake studies for the high-seismicityregion around Taiwan, this study aims to conduct a new seismic hazard assessment for the region usingthe well-established FOSM (first-order second-moment) algorithm, on the record of 55,000 earthquakesobserved in the past 110 years. The new seismic hazard analysis from a different perspective shows thatthe annual rate for earthquake-induced PGA to exceed the current design value (i.e., 0.23g) in two majorcities in Taiwan should be relatively low, with it no greater than 0.0006 per year. Besides, the FOSMestimates were found very close to those with Monte Carlo Simulation (MCS), mainly because theskewness of the three random variables (i.e., earthquake magnitude, location, and model error)considered in the probabilistic analysis is not very large.
& 2014 Elsevier Ltd. All rights reserved.
1. Introduction
Since it is challenging to predict an earthquake’s magnitude,location and time, seismic hazard analysis is considered a morepractical engineering solution for earthquake hazard mitigation[1]. But before introducing the analysis, it is worth clarifying thedefinition of seismic hazard in the first place: Rather than casualtyor economic loss induced by earthquakes, seismic hazard refers tothe annual rate of earthquake ground motions, such as an estimateof PGA40.1g¼0.01 per year. In other words, seismic hazardanalysis aims to develop a site-specific earthquake-resistantdesign based on earthquake data (e.g., seismicity) around a site.Nowadays, Deterministic Seismic Hazard Analysis (DSHA) andProbabilistic Seismic Hazard Analysis (PSHA) are the two repre-sentative approaches, with many case studies reported in the lastfew decades [2–5]. On the other hand, new seismic hazardassessments were also reported recently [6–8]. For example, basedon earthquake intensity data in the last 500 years, Liu et al. [6]quantified seismic hazards in North China from a different per-spective than the conventional PSHA and DSHA.
The region around Taiwan is known for high seismicity. Inaverage, more than two thousand earthquakes with magnitudegreater than 3.0 are occurring around this region. Under the
circumstances, a variety of earthquake studies for the region wereconducted, including seismic hazard assessments [2,3], earthquakeearly warning [9,10], active fault investigation [11,12], and earth-quake risk assessment [13].
As a result, the key scope of this study is to perform a newseismic hazard assessment for this high-seismicity region, usingthe FOSM algorithm to estimate the annual rate of earthquakemotions with the statistics of major earthquakes in the past 110years. Not only was the new FOSM seismic hazard assessmentproved as robust as that with MCS, but the results of the case studyare valuable to earthquake-resistant designs in Taiwan.
This paper in the following is organized with an overview ofprobabilistic analysis, the seismicity around Taiwan, and localground motion models, followed by the case studies for two majorcities in Taiwan. In addition, the seismic hazard estimates from theFOSM computations were compared to those from MCS, showingthe two are almost the same, mainly attributed to the lowskewness of input random variables (i.e., earthquake magnitude,location, and motion attenuation) considered in this probabilisticanalysis.
2. Probabilistic analysis
Unlike deterministic analysis, usually the analytical solution ofa probabilistic analysis is difficult to develop. As a result, severalalgorithms were developed to solve a probabilistic analysis,
Contents lists available at ScienceDirect
journal homepage: www.elsevier.com/locate/soildyn
Soil Dynamics and Earthquake Engineering
http://dx.doi.org/10.1016/j.soildyn.2014.10.0060267-7261/& 2014 Elsevier Ltd. All rights reserved.
including MCS, FOSM, and PEM (Point Estimate Method), amongothers [14]. Understandably, each algorithm has its own advan-tages and disadvantages. For example, although MCS is considereda more reliable method, its enormous computation process makesit impractical when the performance function is too complex.On the other hand, although FOSM and PEM disregarding theinformation about a variable’s probability distribution are morecomputationally efficient than MCS, the key limitation in the twoalgorithms is their accuracy, especially when input variablesconsidered in the probabilistic analysis are highly skewed orasymmetrical [14].
2.1. The FOSM algorithm
First-order second-moment or FOSM is a well-establishedalgorithm for probabilistic analysis, derived on the basis of theTaylor expansion. Therefore, “first-order” implicates that the termsup to the first order of a Taylor expansion are only retained in thecalculation; on the other hand, since variance is the second momentof a random variable in statistics, “second-moment” means thatFOSM aims to compute the variance of a target variable to quantifythe uncertainty of a problem.
As a result, given the performance function denoted as Y ¼ f ðXisÞ,where Xis are input random variables, the mean value of Y (denotedas E[Y]) can be approximated as follows based on the FOSM algo-rithm [14]:
E Y½ � ¼ f E X1½ �; E X2½ �;…; E Xn½ �� � ð1Þ
Understandably, E Xi½ � is the mean value of Xi, the input data of aprobabilistic analysis.
On the other hand, based on the FOSM algorithm, the varianceof Y (denoted as V[Y]) can be approximated as follows [14]:
V ½Y� ¼ ∑n
i ¼ 1
∂Y∂Xi
� �2
V ½Xi�( )
þ2 ∑n
i ¼ 1∑n
j ¼ 1
∂Y∂Xi
∂Y∂Xj
C½Xi;Xj�� �
; for io j
ð2Þwhere V ½Xi� is the variance of Xi, and C½Xi;Xj� is the covariancebetween Xi and Xj. (Like mean values, both are the input data ofthe probabilistic analysis.) In addition, ð∂Y=∂XiÞ denotes the deri-vative of Y against Xi at the mean value of Xi. Note that when any oftwo input variables in a probabilistic analysis are consideredindependent of each other (covariance¼0), the variance of Y canbe calculated as follows in a FOSM analysis [14]:
V ½Y� ¼ ∑n
i ¼ 1
∂Y∂Xi
� �2
V ½Xi�( )
ð3Þ
In summary, Eqs. (1)–(3) present the key algorithms of theFOSM probabilistic analysis, which is derived from the Taylorexpansion on the performance function Y ¼ f ðXisÞ.
2.2. Monte Carlo simulation or MCS
MCS is considered a more reliable method for performing aprobabilistic analysis [14], commonly used in a variety of studies[15–17]. For a performance function Y ¼ f ðXisÞ, the algorithm ofMCS is to generate random values of Xis based on their probabilitydistribution observed, then substituting them into the functionY ¼ f ðXisÞ to obtain a random Y value. With the calculationrepeated for a number of times, the mean value, standard devia-tion, and other statistics of Y can be estimated based on a series ofY values generated with MCS [14].
Although the algorithm of MCS is relatively simple, it involves anenormous computation because of the iterative randomization.
Therefore, when the performance function Y ¼ f ðXisÞ is complex,say it takes “one day” to calculate Y given Xis, MCS then becomes lessof a practical method to solve the probabilistic analysis, with the“one-day” calculation needed to repeat for a number of times [18].
3. Seismicity around Taiwan and ground motion model
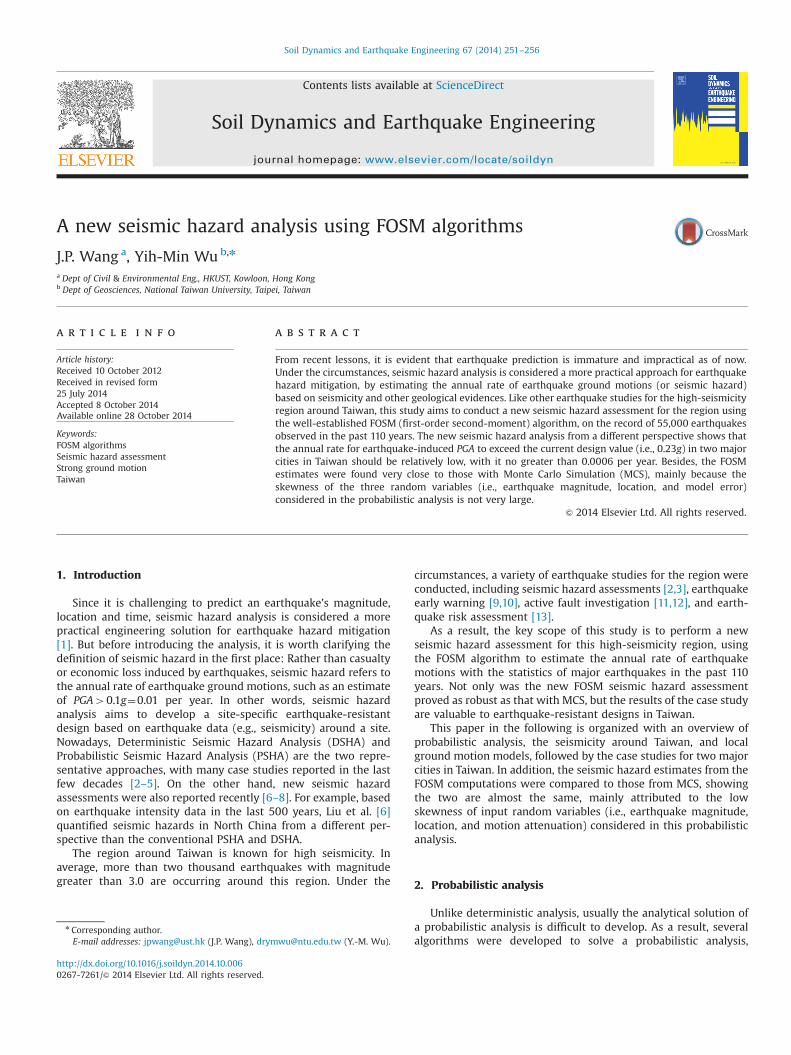
Fig. 1 shows the locations of more than 55,000 main shocks withMLZ3.0 (local magnitude) around Taiwan since 1900. Note that thisearthquake catalog has been studied and used in a few earthquakestudies for Taiwan. For example, a statistical study on the data foundthat the magnitude of major earthquakes around Taiwan should be arandom variable following the Gamma distribution or lognormaldistribution [19]. Besides, a seismic hazard analysis derived from theseismicity was also reported, a new methodology different from theconventional PSHA and DSHA [7].
The key features of the catalog were summarized as follows.First, the raw data provided by the Central Weather Bureau Taiwanwere subjected to a double-link declustering procedure [20] toremove dependent shocks. As a result, the catalog only containsthe main shocks around Taiwan since 1900. Second, analysesshowed that the MLZ3.0 data in the catalog are not completeuntil year 1978, but for MLZ5.5 earthquakes, the data arecomplete since 1900 [19].
As any seismic hazard assessment, ground motion models arethe performance function of such an analysis. Generally speaking,ground motion models are an empirical relationship characteriz-ing the correlation between earthquake ground motion (e.g., PGA)and earthquake magnitude and source-to-site distance combined.In Taiwan, several ground motion models were developed withearthquake data around the region [21,22], and used in recentseismic hazard assessments [2,3,21]. In the following seismichazard analysis, we also adopted a local ground motion modelthat was frequently used in earthquake analyses for Taiwan[2,3,21], as follows:
where Mw is moment magnitude, D is the source-to-site distancein km, and ε is the model error following the normal distributionwith mean¼0 and standard deviation¼0.577.
Since earthquake magnitudes were in different units adoptedby the earthquake catalog (in ML) and the ground motion model(in Mw), a conversion relationship is also needed for this study.Similarly, a local conversion model developed with the earthquakedata around Taiwan was used in this study [23]:
ML ¼ 4:53� lnðMwÞ�2:09 ð5Þ
4. FOSM seismic hazard assessment
As other seismic hazard assessments, only major earthquakesare considered in the analysis, given that small and moderateevents are unlikely to cause structure damages. On the other hand,an earthquake, even a large one, that occurs very far from a site isunlikely to cause damage at the site either. As a result, in this studywe employed 5.5 Mw and 200 km as the threshold values fordefining a major earthquake, following recent seismic hazardassessments for Taiwan [3,7].
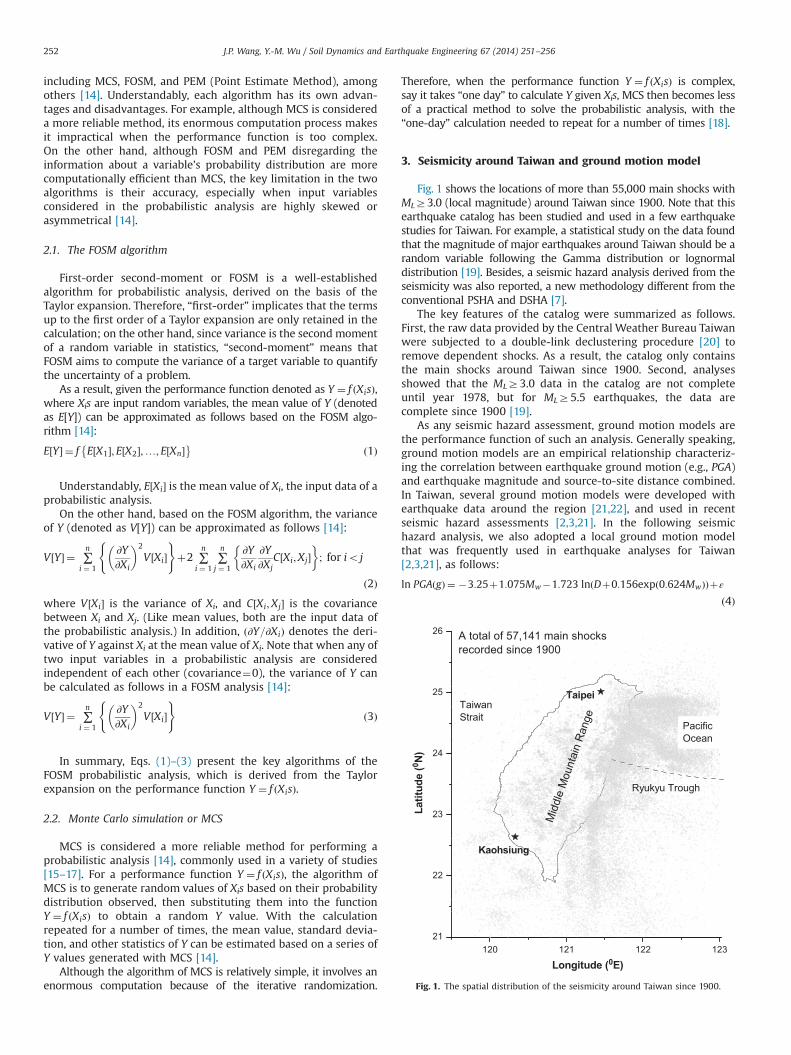
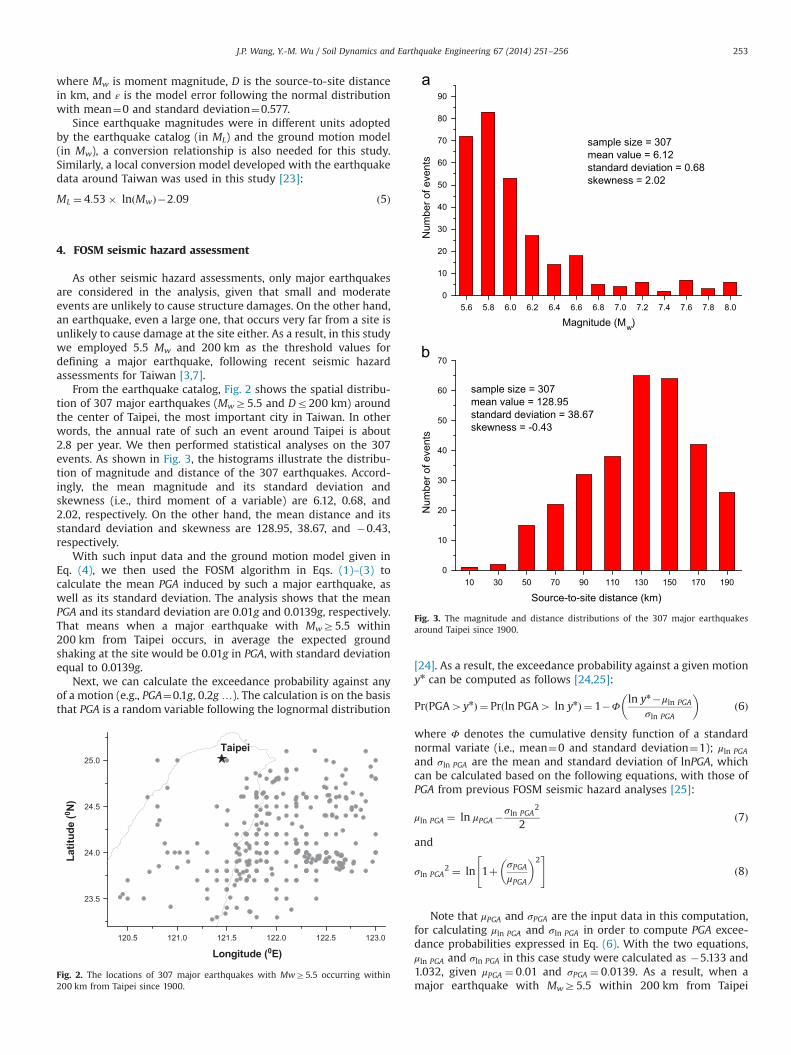
From the earthquake catalog, Fig. 2 shows the spatial distribu-tion of 307 major earthquakes (MwZ5.5 and Dr200 km) aroundthe center of Taipei, the most important city in Taiwan. In otherwords, the annual rate of such an event around Taipei is about2.8 per year. We then performed statistical analyses on the 307events. As shown in Fig. 3, the histograms illustrate the distribu-tion of magnitude and distance of the 307 earthquakes. Accord-ingly, the mean magnitude and its standard deviation andskewness (i.e., third moment of a variable) are 6.12, 0.68, and2.02, respectively. On the other hand, the mean distance and itsstandard deviation and skewness are 128.95, 38.67, and �0.43,respectively.
With such input data and the ground motion model given inEq. (4), we then used the FOSM algorithm in Eqs. (1)–(3) tocalculate the mean PGA induced by such a major earthquake, aswell as its standard deviation. The analysis shows that the meanPGA and its standard deviation are 0.01g and 0.0139g, respectively.That means when a major earthquake with MwZ5.5 within200 km from Taipei occurs, in average the expected groundshaking at the site would be 0.01g in PGA, with standard deviationequal to 0.0139g.
Next, we can calculate the exceedance probability against anyof a motion (e.g., PGA¼0.1g, 0.2g…). The calculation is on the basisthat PGA is a random variable following the lognormal distribution
[24]. As a result, the exceedance probability against a given motionyn can be computed as follows [24,25]:
PrðPGA4ynÞ ¼ Prðln PGA4 ln ynÞ ¼ 1�Φln yn�μln PGA
σln PGA
� �ð6Þ
where Φ denotes the cumulative density function of a standardnormal variate (i.e., mean¼0 and standard deviation¼1); μln PGA
and σln PGA are the mean and standard deviation of lnPGA, whichcan be calculated based on the following equations, with those ofPGA from previous FOSM seismic hazard analyses [25]:
μln PGA ¼ ln μPGA�σln PGA
2
2ð7Þ
and
σln PGA2 ¼ ln 1þ σPGA
μPGA
� �2" #
ð8Þ
Note that μPGA and σPGA are the input data in this computation,for calculating μln PGA and σln PGA in order to compute PGA excee-dance probabilities expressed in Eq. (6). With the two equations,μln PGA and σln PGA in this case study were calculated as �5.133 and1.032, given μPGA ¼ 0:01 and σPGA ¼ 0:0139. As a result, when amajor earthquake with MwZ5.5 within 200 km from Taipei
120.5 121.0 121.5 122.0 122.5 123.0
23.5
24.0
24.5
25.0Taipei
Latit
ude
(0 N)
Longitude (0E)
Fig. 2. The locations of 307 major earthquakes with MwZ5.5 occurring within200 km from Taipei since 1900.
occurs, for example, there is a 0.02% probability for PGA to exceed0.23g at the study site, based on the mean PGA and its standarddeviation estimated with the statistics of such major earthquakesoccurring in the past 110 years.
Following the framework of PSHA, we then estimated theannual rate of PGA of exceedance, denoted as λðPGA4ynÞ, bytaking the annual earthquake rate into account [24]:
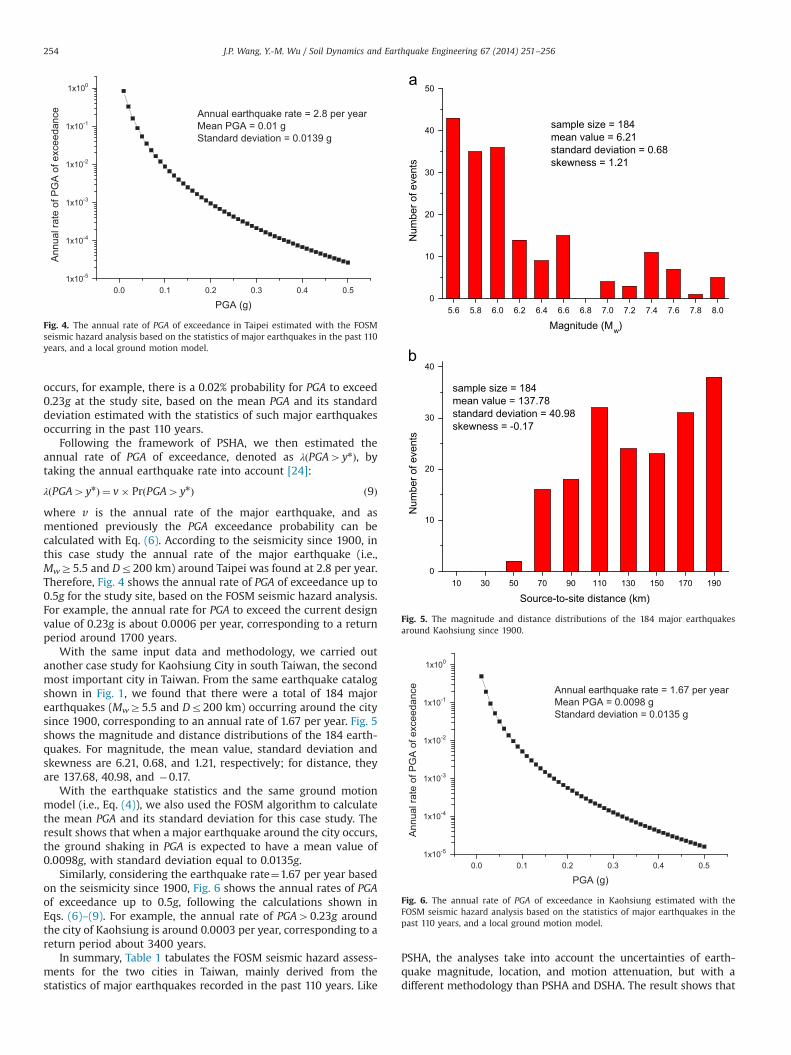
λðPGA4ynÞ ¼ v� PrðPGA4ynÞ ð9Þwhere v is the annual rate of the major earthquake, and asmentioned previously the PGA exceedance probability can becalculated with Eq. (6). According to the seismicity since 1900, inthis case study the annual rate of the major earthquake (i.e.,MwZ5.5 and Dr200 km) around Taipei was found at 2.8 per year.Therefore, Fig. 4 shows the annual rate of PGA of exceedance up to0.5g for the study site, based on the FOSM seismic hazard analysis.For example, the annual rate for PGA to exceed the current designvalue of 0.23g is about 0.0006 per year, corresponding to a returnperiod around 1700 years.
With the same input data and methodology, we carried outanother case study for Kaohsiung City in south Taiwan, the secondmost important city in Taiwan. From the same earthquake catalogshown in Fig. 1, we found that there were a total of 184 majorearthquakes (MwZ5.5 and Dr200 km) occurring around the citysince 1900, corresponding to an annual rate of 1.67 per year. Fig. 5shows the magnitude and distance distributions of the 184 earth-quakes. For magnitude, the mean value, standard deviation andskewness are 6.21, 0.68, and 1.21, respectively; for distance, theyare 137.68, 40.98, and �0.17.
With the earthquake statistics and the same ground motionmodel (i.e., Eq. (4)), we also used the FOSM algorithm to calculatethe mean PGA and its standard deviation for this case study. Theresult shows that when a major earthquake around the city occurs,the ground shaking in PGA is expected to have a mean value of0.0098g, with standard deviation equal to 0.0135g.
Similarly, considering the earthquake rate¼1.67 per year basedon the seismicity since 1900, Fig. 6 shows the annual rates of PGAof exceedance up to 0.5g, following the calculations shown inEqs. (6)–(9). For example, the annual rate of PGA40.23g aroundthe city of Kaohsiung is around 0.0003 per year, corresponding to areturn period about 3400 years.
In summary, Table 1 tabulates the FOSM seismic hazard assess-ments for the two cities in Taiwan, mainly derived from thestatistics of major earthquakes recorded in the past 110 years. Like
PSHA, the analyses take into account the uncertainties of earth-quake magnitude, location, and motion attenuation, but with adifferent methodology than PSHA and DSHA. The result shows that
0.0 0.1 0.2 0.3 0.4 0.51x10⁻⁵
1x10⁻⁴
1x10⁻³
1x10⁻²
1x10⁻¹
1x100
Annual earthquake rate = 2.8 per yearMean PGA = 0.01 gStandard deviation = 0.0139 g
Ann
ual r
ate
of P
GA
of e
xcee
danc
e
PGA (g)
Fig. 4. The annual rate of PGA of exceedance in Taipei estimated with the FOSMseismic hazard analysis based on the statistics of major earthquakes in the past 110years, and a local ground motion model.
Fig. 5. The magnitude and distance distributions of the 184 major earthquakesaround Kaohsiung since 1900.
0.0 0.1 0.2 0.3 0.4 0.51x10⁻⁵
1x10⁻⁴
1x10⁻³
1x10⁻²
1x10⁻¹
1x100
Annual earthquake rate = 1.67 per yearMean PGA = 0.0098 gStandard deviation = 0.0135 g
Ann
ual r
ate
of P
GA
of e
xcee
danc
e
PGA (g)
Fig. 6. The annual rate of PGA of exceedance in Kaohsiung estimated with theFOSM seismic hazard analysis based on the statistics of major earthquakes in thepast 110 years, and a local ground motion model.
the annual rates for PGA to exceed the current design value (i.e.,0.23g) in the two cities are no greater than 0.0006 per year,implicating that the current earthquake-resistant designs imple-mented in the cities should be robust with reasonable conservatism.
5. Discussions
5.1. How reliable the FOSM estimates?
As mentioned previously, unlike MCS, FOSM probabilisticanalyses do not fully utilize the statistics of input variables, sothat the FOSM estimates might not be very accurate especiallywhen input variables are highly skewed or asymmetrical [14].However, there is no guidance how to judge whether the FOSMalgorithm should be adopted for a specific problem. Therefore, inorder to evaluate the accuracy of the FOSM results of the study, weperformed MCS on the same problem and made a comparisonbetween the two.
The MCS calculations of the study are summarized as follows.As any MCS, the first step is to generate random input parameters(here are magnitudes, distances, and model errors) based on theirprobability distribution. For example, for generating a randomearthquake magnitude, the histogram shown in Fig. 3a would bebased on.
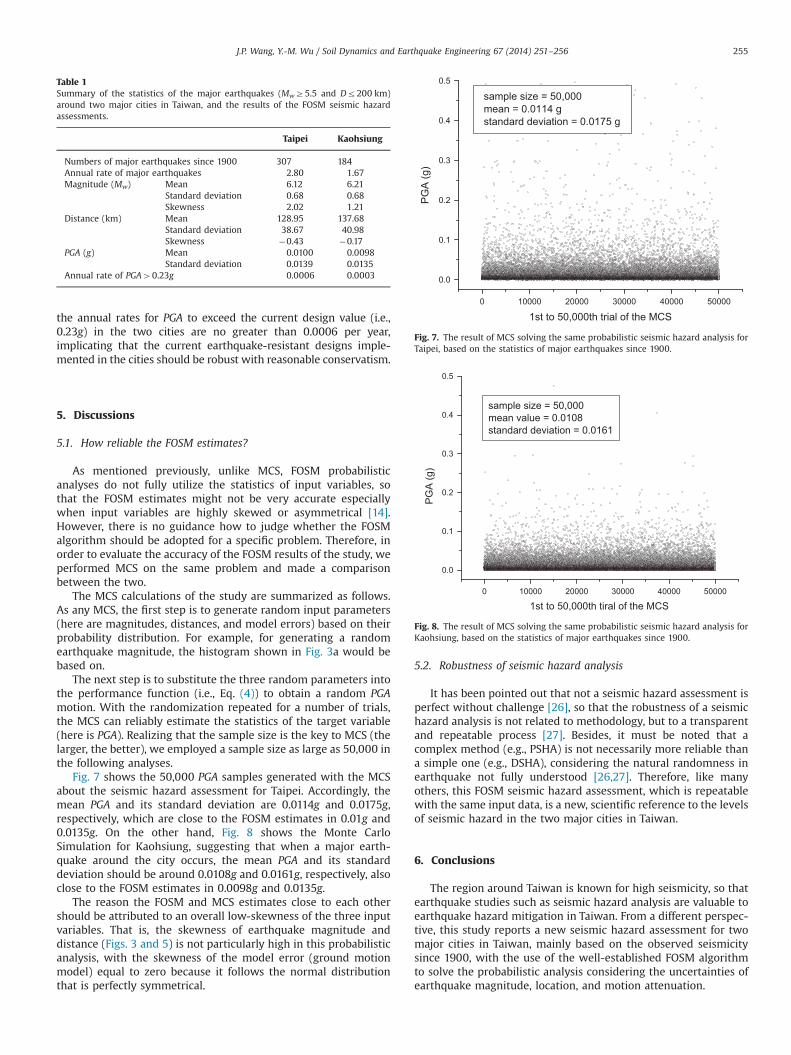
The next step is to substitute the three random parameters intothe performance function (i.e., Eq. (4)) to obtain a random PGAmotion. With the randomization repeated for a number of trials,the MCS can reliably estimate the statistics of the target variable(here is PGA). Realizing that the sample size is the key to MCS (thelarger, the better), we employed a sample size as large as 50,000 inthe following analyses.
Fig. 7 shows the 50,000 PGA samples generated with the MCSabout the seismic hazard assessment for Taipei. Accordingly, themean PGA and its standard deviation are 0.0114g and 0.0175g,respectively, which are close to the FOSM estimates in 0.01g and0.0135g. On the other hand, Fig. 8 shows the Monte CarloSimulation for Kaohsiung, suggesting that when a major earth-quake around the city occurs, the mean PGA and its standarddeviation should be around 0.0108g and 0.0161g, respectively, alsoclose to the FOSM estimates in 0.0098g and 0.0135g.
The reason the FOSM and MCS estimates close to each othershould be attributed to an overall low-skewness of the three inputvariables. That is, the skewness of earthquake magnitude anddistance (Figs. 3 and 5) is not particularly high in this probabilisticanalysis, with the skewness of the model error (ground motionmodel) equal to zero because it follows the normal distributionthat is perfectly symmetrical.
5.2. Robustness of seismic hazard analysis
It has been pointed out that not a seismic hazard assessment isperfect without challenge [26], so that the robustness of a seismichazard analysis is not related to methodology, but to a transparentand repeatable process [27]. Besides, it must be noted that acomplex method (e.g., PSHA) is not necessarily more reliable thana simple one (e.g., DSHA), considering the natural randomness inearthquake not fully understood [26,27]. Therefore, like manyothers, this FOSM seismic hazard assessment, which is repeatablewith the same input data, is a new, scientific reference to the levelsof seismic hazard in the two major cities in Taiwan.
6. Conclusions
The region around Taiwan is known for high seismicity, so thatearthquake studies such as seismic hazard analysis are valuable toearthquake hazard mitigation in Taiwan. From a different perspec-tive, this study reports a new seismic hazard assessment for twomajor cities in Taiwan, mainly based on the observed seismicitysince 1900, with the use of the well-established FOSM algorithmto solve the probabilistic analysis considering the uncertainties ofearthquake magnitude, location, and motion attenuation.
Table 1Summary of the statistics of the major earthquakes (MwZ5.5 and Dr200 km)around two major cities in Taiwan, and the results of the FOSM seismic hazardassessments.
Taipei Kaohsiung
Numbers of major earthquakes since 1900 307 184Annual rate of major earthquakes 2.80 1.67Magnitude (Mw) Mean 6.12 6.21
Standard deviation 0.68 0.68Skewness 2.02 1.21
Distance (km) Mean 128.95 137.68Standard deviation 38.67 40.98Skewness �0.43 �0.17
PGA (g) Mean 0.0100 0.0098Standard deviation 0.0139 0.0135
Fig. 7. The result of MCS solving the same probabilistic seismic hazard analysis forTaipei, based on the statistics of major earthquakes since 1900.
0 10000 20000 30000 40000 50000
0.0
0.1
0.2
0.3
0.4
0.5
sample size = 50,000mean value = 0.0108standard deviation = 0.0161
PG
A (g
)
1st to 50,000th tiral of the MCS
Fig. 8. The result of MCS solving the same probabilistic seismic hazard analysis forKaohsiung, based on the statistics of major earthquakes since 1900.
The result shows that the annual rate for earthquake-inducedPGA to exceed the current design value (i.e., 0.23g) is relatively low,with it equal to 0.0006 and 0.0003 per year around Taipei andKaohsiung, respectively. As a result, from the record of the seismicitysince 1900, the new seismic hazard assessment from a differentperspective than PSHA and DSHA provides a new, scientific refer-ence to the levels of seismic hazard in the two cities, and offers somesupport to the robustness of the current earthquake-resistant designimplemented in Taiwan.
Acknowledgements
We appreciate the valuable comments of the Editor andReviewers, making this submission much improved in so manyaspects. We are also thankful for the kind support from the CentralWeather Bureau Taiwan for providing us their earthquake database.
References
[1] Geller RJ, Jackson DD, Kagan YY, Mulargia F. Earthquake cannot be predicted.Science 1997;275:1616.
[2] Wang JP, Huang D, Yang Z. The deterministic seismic hazard map for Taiwandeveloped using an in-house Excel-based program. Comput Geosci 2012;48:111–6.
[3] Wang JP, Huang D, Cheng CT, Shao KS, Wu YC, Chang CW. Seismic hazardanalysis for Taipei City including deaggregation, design spectra, and timehistory with Excel applications. Comput Geosci 2013;52:146–54.
[4] Moratto L, Orlecka-Sikora B, Costa G, Suhadolc P, Papaioannou C, PapazachosCB. A deterministic seismic hazard analysis for shallow earthquakes in Greece.Tectonophysics 2007;442:66–82.
[5] Roshan AD, Basu PC. Application of PSHA in low seismic region: a case studyon NPP site in peninsular India. Nucl Eng Des 2010;240:3443–54.
[6] Liu J, Wang Z, Xie F, Lv Y. Seismic hazard assessment for greater North Chinafrom historical intensity observations. Eng Geol 2013;164:117–30.
[7] Wang JP, Brant L, Wu YM, Taheri H. Probability-based PGA estimations usingthe double-lognormal distribution: including site-specific seismic hazardanalysis for four sites in Taiwan. Soil Dyn Earthquake Eng 2012;42:177–83.
[8] Panza GF, Irikura K, Peresan A, Wang Z, Saragoni R. Advanced seismic hazardassessment. Pure Appl Geophys 2011;168:1–9.
[9] Hsiao NC, Wu YM, Zhao L, Chen DY, Huang WT, Kuo KH, Shin TC, Leu PL. A newprototype system for earthquake early warning in Taiwan. Soil Dyn Earth-quake Eng 2011;31:201–8.
[10] Wu YM, Kanamori H. Development of an earthquake early warning systemusing real-time strong motion signals. Sensors 2008;8:1–9.
[11] Huang SY, Rubin CM, Chen YG, Liu HC. Prehistoric earthquakes along theShanchiao fault, Taipei Basin, northern Taiwan. J Asian Earth Sci 2007;31:265–76.
[12] Lin CW, Hsu CY, Yu TD. The Chiuhsiungken fault: a candidate to trigger ahazardous earthquake in western Taiwan 2007;30:390–402.
[13] Wang JP, Wu MH. Risk assessments on active faults in Taiwan. Bull Eng GeolEnviron (In-Press) http://dx.doi.org/%2010.1007/s10064-014-0600-1.
[15] Moghaddasia M, Cubrinovskia M, Chaseb JG, Pampanina S, Carra A. Effectssoil–foundation–structure interaction on seismic structural response viarobust Monte Carlo simulation. Eng Struct 2011;33:1338–47.
[16] Wang JP, Lin CW, Taheri H, Chen WS. Impact of fault parameter uncertaintieson earthquake recurrence probability by Monte Carlo simulation—an examplein central Taiwan. Eng Geol 2012;126:67–74.
[17] Yazdani A, Shahpari A, Salimi MR. The use of Monte-Carlo simulations inseismic hazard analysis in Tehran and surrounding areas. Int J Eng Trans C:Aspects 2012;25:159–66.
[18] Wang JP, Yang Z, Huang D. New pole-searching algorithm with applications toprobabilistic circular slope stability assessment. Comput Geosci 2013;51:83–9.
[19] Wang JP, Chan CH, Wu YM. The distribution of annual maximum earthquakemagnitude around Taiwan and its application in the estimation of catastrophicearthquake recurrence probability. Nat Hazard 2011;59:553–70.
[20] Wu YM, Chiao LY. Seismic quiescence before the 1999 Chi-Chi, Taiwan Mw
7.6 earthquake. Bull Seismol Soc Am 2006;96:321–7.[21] Cheng CT, Chiou SJ, Lee CT, Tsai YB. Study on probabilistic seismic hazard maps
of Taiwan after Chi–Chi earthquake. J Geoeng 2007;2:19–28.[22] Lin PS, Lee CT, Cheng CT, Sung CH. Response spectra attenuation relations for
shallow crustal earthquake in Taiwan. Eng Geol 2011;121:150–64.[23] Wu YM, Shin TC, Chang CH. Near real-time mapping of peak ground
acceleration and peak ground velocity following a strong earthquake. BullSeismol Soc Am 2001;91:1218–28.
[24] Kramer SL. Geotechnical earthquake engineering. New Jersey: Prentice HallInc.; 1996; 117–33.
[25] Ang HS, Tang W. Probability concepts in engineering: emphasis on applica-tions to civil and environmental engineering. New Jersey: John Wiley & Sons,Inc; 2007; 172–9.
[26] Mualchin L. Seismic hazard analysis for critical infrastructures in California.Eng Geol 2005;79:177–84.