1 Business Proprietary * Solar Resource CUF Assessment * Land Site Assessment * PV Plant Operation Assessment Akash Founder, INDIS, LLC B. Tech (IIT B), MS (USA), MBA (USA) [email protected]/ +91 9718112443 (India) Salt Lake City, UT (USA) / New Delhi (India) www.indisllc.com // www.akashcleantech.com
INDIS Solar CUF Model more accurate than most other available models
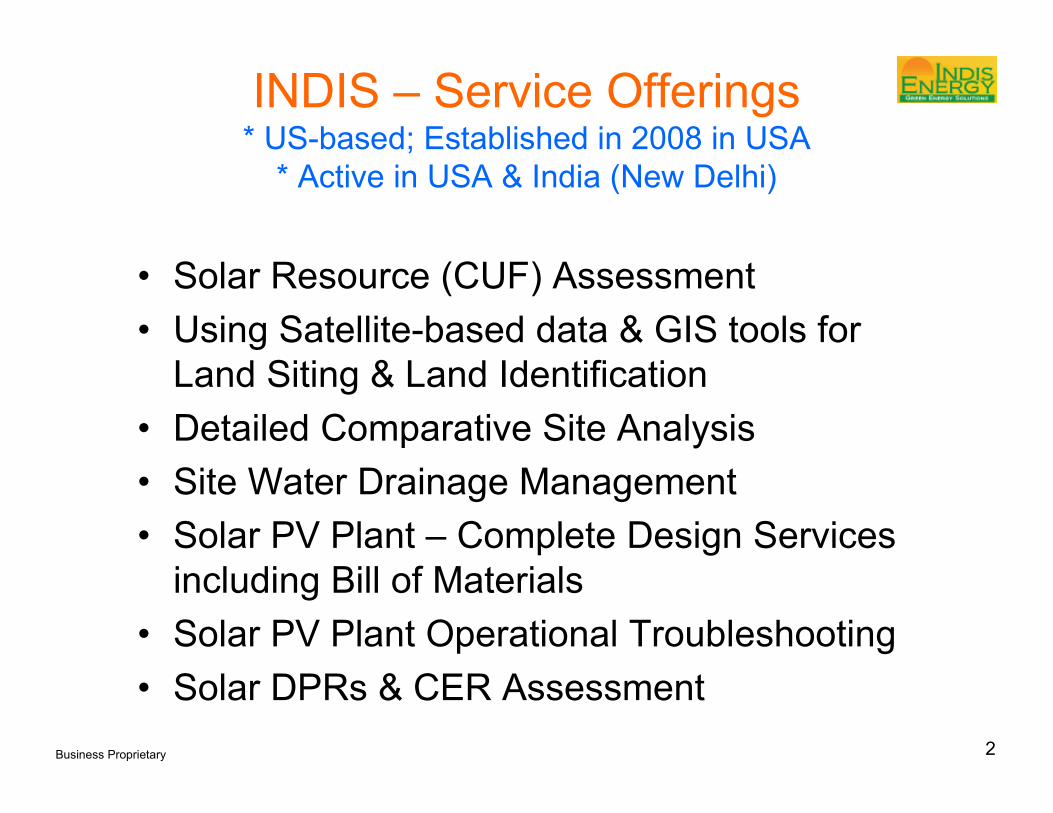
INDIS Solar CUF Model vs. Other Models
• Orissa & West Bengal have very similar solar irradiation profile
• INDIS Solar CUF Model can be used to accurately estimate Average
Annual CUF for all 30 Districts in Odisha
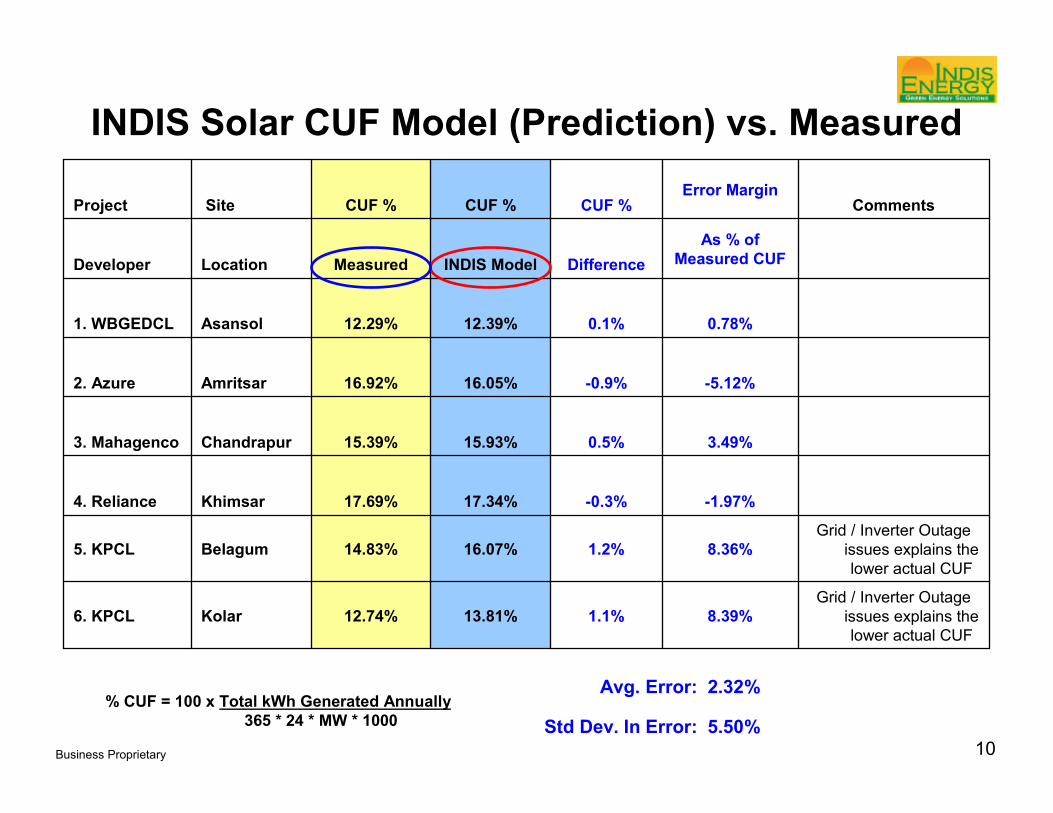
WBGEDCL / Asansol 1 MW Solar PV Project - Measured (Actual) CUF vs. Predicted
CUF from various Sources [PR = 0.75**]
15.0% 15.1%
16.0% 15.8%15.5%
12.39%12.29%
10%
11%
12%
13%
14%
15%
16%
17%
Measured /
Actual
INDIS CUF
Model
Model 1 -
RETScreen
Model 2 -
HOMER
NREL
Radiation
Map *
Solar GIS * 3Tier *
% CUF
* Estimates based on radiation map –
minor inaccuracies can be expected
** PR = Performance Ratio = PV System Derating Factor
15Business Proprietary
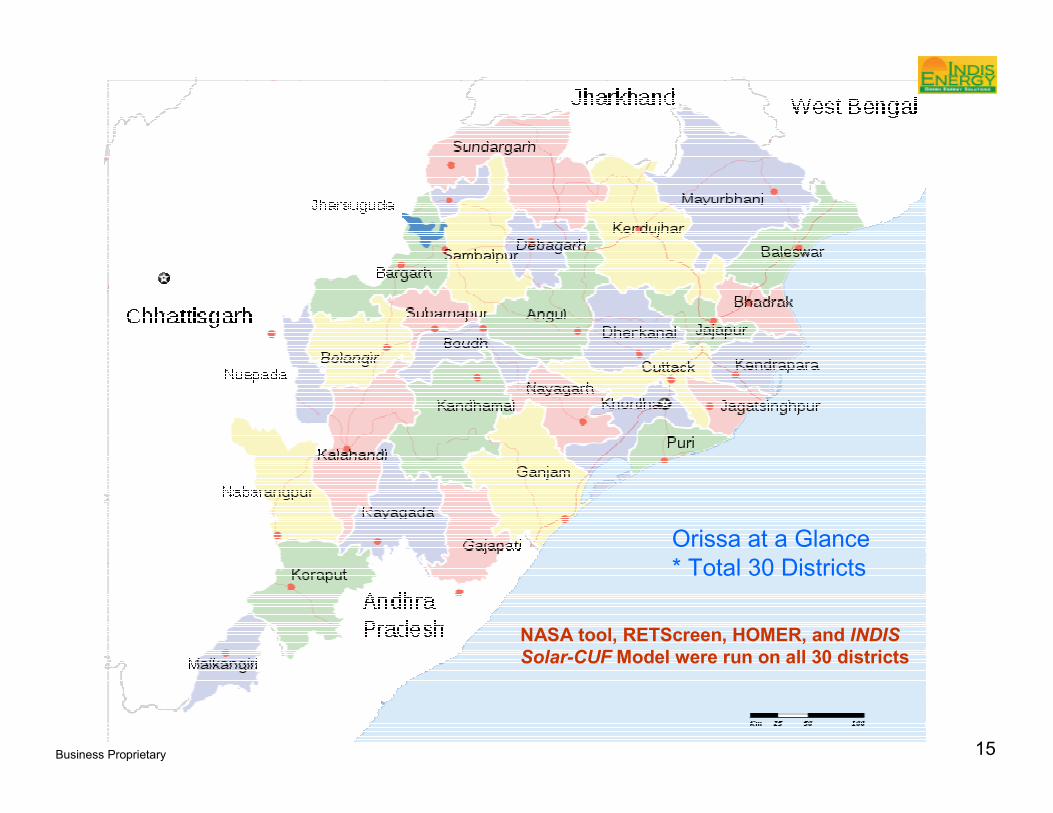
Orissa at a Glance
* Total 30 Districts
NASA tool, RETScreen, HOMER, and INDIS
Solar-CUF Model were run on all 30 districts
16Business Proprietary
Using Conventional Tools to Rank Top 5
Districts for Solar PV Output or Annual CUF
21.88%20.75%20.73%20.75%Bolangir5
21.88%20.75%N/A20.75%Kalahandi4
21.88%20.75%N/A20.75%Sonepur3
21.98%20.85%N/A20.84%Nuapada2
22.00%20.86%20.83%20.86%Malkangiri1
NASA Tool
With Tilt
HOMER
Horizontal Surface
RETScreen
Horizontal Surface
NASA Tool
Horizontal Surface
District in
Odisha
Rank
Annual Average CUF at Performance Ratio = 1.00 for Horizontal Surface &
Tilted Surface (without any Temperature Derating)
• NASA Tool / RET Screen / HOMER � all yield the same top 5 districts
• The % difference in Avg. Annual CUF between the top 5 districts is only 0.55%; top 2
districts are virtually identical (<0.09%) (i.e. within the measurement error)
• A Project Developer might decide to put a power plant in any of these five districts given
the very narrow range of CUF values
• However, doing this will be a costly mistake since the estimated CUF values will be lower
by as much as 4% (or Rs. 1 crore in NPV Loss in Nuapada) or 20% lower (in Kalahandi),
according to the INDIS Solar CUF Model
17Business Proprietary
Top 5 Districts for Solar PV Output or Annual CUF
Using Solar-CUF Model Developed by INDIS
-3.71%
-3.08%
-1.22%
-1.22%
(baseline reference)
% Reduction in
CUF Relative to the
Top Rank
Loss of Rs 93 Lac in
NPV (25 yr)
Loss of Rs 78 Lac in
NPV (25 yr)
Loss of Rs 30 Lac in
NPV (25 yr)
Loss of Rs 30 Lac in
NPV (25 yr)
- Baseline Reference -
Impact on Revenue for
a 5 MW Plant at Rs.
7.50 / kWh bid price
17.76%
[at PR=0.81, CUF = 14.39%]
17.87%
[at PR=0.81, CUF = 14.47%]
18.22%
[at PR=0.81, CUF = 14.76%]
18.22%
[at PR=0.81, CUF = 14.76%]
18.44%
[at PR=0.81, CUF = 14.94%]
Average Annual CUF for an Actual Solar PV
Plant at Performance Ratio = 1.00 (without
any Temperature Derating)
Nuapada
Gajapati
Sundergarh
Puri
Malkangiri
District
Location
5
4
3
2
1
Rank
• Other tools like NASA, RETScreen or Homer are predicting ~22% [@ PR=1] & 17.8% [@ PR=0.81]
• 16% lower CUF predicted using INDIS Solar-CUF Model compared to other Models
• 3 new districts become a contender for the top 5 spots in the INDIS CUF Model
18Business Proprietary
Top 5 Districts for Solar PV Output or Annual CUF
Using INDIS Solar CUF Model after Temp Correction
Loss of Rs 1.2 Crore in NPV (25 yr)
Loss of Rs 1.1 Crore in NPV (25 yr)
Loss of Rs 86 Lac in NPV (25 yr)
Loss of Rs 55 Lac in NPV (25 yr)
- Baseline -
Impact on Revenue for a 5 MW
Plant at Rs. 7.50 / kWh bid
-5.0%
-4.5%
-3.5%
-2.3%
(baseline reference)
% Reduction in Avg. Annual CUF
relative to the Top Rank (after
Temp-Deration)
Rank 5: Gajapati
Rank 4: Nuapada
Rank 3: Puri
Rank 2: Sundergarh
Rank 1. Malkangiri
District
Location
Relative Rankings Change between Top 5 Districts after factoring in the Local Temperature effect
(this was calculated by factoring in typical Tmax, Tmin, Humidity, and Wind Speed trends for each District)
• % Difference in CUF between the Districts increase when local temp trend is factored
• Sundergarh moves to 2nd rank, replacing Puri to the 3rd rank, when local weather conditions are
factored into the derating calculations
• Difference between 1st Rank (Malkangiri) and 2nd Rank (Puri) widens – Loss of Rs 55 Lac in NPV
(25 yr) vs. Rs 30 Lac
19Business Proprietary
1
2
5
3
4
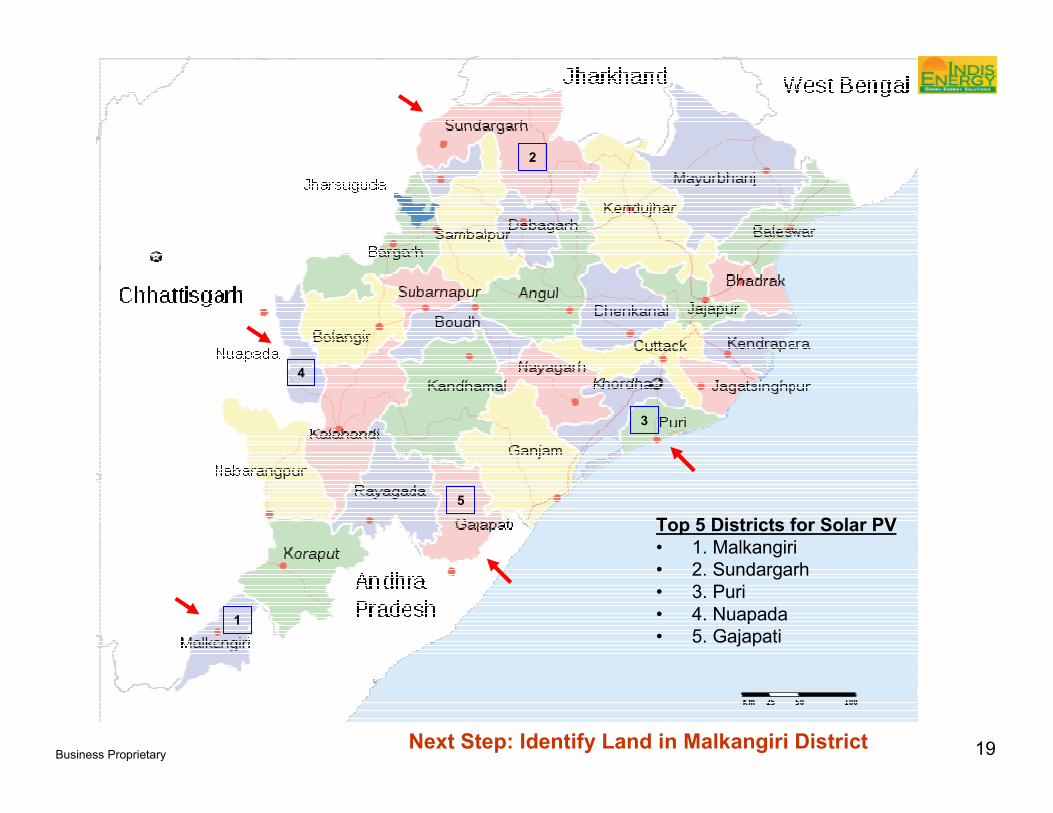
Top 5 Districts for Solar PV
• 1. Malkangiri
• 2. Sundargarh
• 3. Puri
• 4. Nuapada
• 5. Gajapati
Next Step: Identify Land in Malkangiri District
20Business Proprietary
Economic Consequences of Solar PV Plant
at Different District Locations
194 KW / MWRs 14.31 Lac per Year1.254991Bolangir7
194 KW / MWRs 14.31 Lac per Year1.254991Sonepur6
192 KW / MWRs 14.18 Lac per Year1.25720Gajapati5
Rs 17.44 Lac per Year
Rs 13.75 Lac per Year
Rs 13.01 Lac per Year
Rs 12.01 Lac per Year
Rs 10.27 Lac per Year
Penalty Per Year (up
to 2017) Due to
Generation Shortfall
(Bid Price: Rs
7.5/kWh) *
246 KW / MW
185 KW / MW
173 KW / MW
158 KW / MW
132 KW / MW
Additional KW per MW *that has to be Installed to
Generate the Minimum
Generation Target of
1.4976 MU/MW/Yr &
Avoid any Penalty
1.201963
1.264565
1.277086
1.294025
1.323485
At PR = 0.81, Estimated
Avg. Annual
MU/MW/Year
[Minimum Specified in
Odisha Tender: 1.4976
MU/MW/Yr] *
Kalahandi
Nuapada
Puri
Sundergarh
Malkangiri
District
13
4
3
2
1
Rank
*
Economic Consequences of Choosing the Wrong District
(using NASA/RETScreen/HOMER tools):
1. Loss in Tariff-based Revenue; and/or
2. Generation Shortfall Penalty; and/or
3. Additional KW per MW to be installed (Higher CapEx)
* Based on INDIS Solar CUF Model
Nuapada is ranked #2 in NASA, RETScreen, and HOMER.
But, as per INDIS Solar CUF Model, it is ranked #4 and will
generate 4.5% less kWh per MW or Rs 1.1 crore loss in
NPV (25 yr) + yearly penalty of Rs. 13.75 lac until 2017.
21Business Proprietary
Conclusion
• INDIS Solar CUF Model is relatively more accurate than other models �highly relevant for States which have a good Monsoon effect (Kerala, Tamil Nadu, Karnataka, A.P, M.P, U.P, Maharashtra, Goa, Chattisgarh, Orissa, Jharkhand, Bihar, Himachal Pradesh, Punjab, Haryana, Uttarakhand)
• Can be used to accurately rank the top districts to locate a Solar Project
• Variations in annual kWh generation / CUF within a District can be expected due to localized weather patterns – A more accurate estimation of CUF is required after the exact Latitude & Longitude of the actual Site is known
• Economic consequences of choosing a wrong site location: Tariff revenue + Penalty + CapEx� can be >Rs 1 crore
22Business Proprietary
2. Land Identification / Availability[ Where is the Land Available Within the Top Ranked District ? ]
23Business Proprietary
Table I: List of Individual Land-related Attributes
(included in GIS Solution)
Solar Radiation Data (kWh / m2 / day)1
Seismic Zone Map 6
Rainfall / Humidity
Temperature / Wind
Local Climate Patterns5
Grid & Substation Maps 4
Economic Activity (Agriculture / Industry)
Water Bodies
Wasteland
Village
Forest
Local Land Use Patterns3
Contours
Aspect, Orientation, Shape
Elevation
Slope
Land Topography2
List of Individual Site-related Attributes in GIS Analysis
State & District
Administrative Boundary13
Water Bodies & Accessibility12
Railway Lines11
Local Roads
State Highways
National Highways
Roads & Accessibility10
Drought & Aridity Patterns (broad level)9
Soil Map (broad level)8
Any major industrial activity
Aerosols and/or SO4
Pollution Level Map (broad level)7
List of Individual Site-related Attributes in GIS Analysis
24Business Proprietary
ContourSatellite Data Shadow Analysis Slope Aspect
Soil Map
Irradiation Data
Soiling Tendency
Pollution
Forest Fires
Land Use Pattern Water AccessRoad Grid Water Drainage
Use Satellite Data to Identify, Quantify & Rank Various Land Options by
Analyzing Over 20 Different Factors
Zone 2
Zone 3
Zone 3
Site
Seismic Zones Rainfall Patterns
CUTFILL
Cut-Fill Analysis Power Evacuation
25Business Proprietary
INDIS has developed a GIS-based Land risk assessment & Site selection tool to help identity the most optimal Solar Land Sites
within a State or a District. This tool can also be used for Site Identification, Site Planning, Site Leveling, Power Evacuation, and
Water Management.
Factors*: Road; Grid; Water; Local Land
Use Pattern; Land Topography (Slope,
Aspect, Contour); Soil Properties; Soiling
Probability, Local Climate (Temp, Rainfall,
Wind); Local Pollution Levels (industries,
aerosol, SO4); Radiation (optional)
Goa - Solar Site Favorability Index Map
Resolution: 30m
Scale: 1 cm = 400 m
* Business Proprietary
Zoom
in
Beta Version
Favorability Index
Higher (Red) is Better
Goa State MapSite Identified for 20 MW PV Plant
Using Satellite – GIS to Identify Best Land Sites Over a Very Large Area
Example Case Study in Goa
26Business Proprietary
Malkangiri District
Top District (1st Rank)
Potential Cheap Land
Areas for Solar PV Projects
Figures & Areas not to Scale
• Analysis based on preliminary analysis of Satellite-Derived Data
2. Land Identification / Availability
in Malkangiri District in Odisha
• Positive Impact on CapEx, OpEx & Tariff-based Revenue: NPV savings of Rs.
25 lac per MW – Rs 50 lac per MW is estimated by using this detailed approach
27Business Proprietary
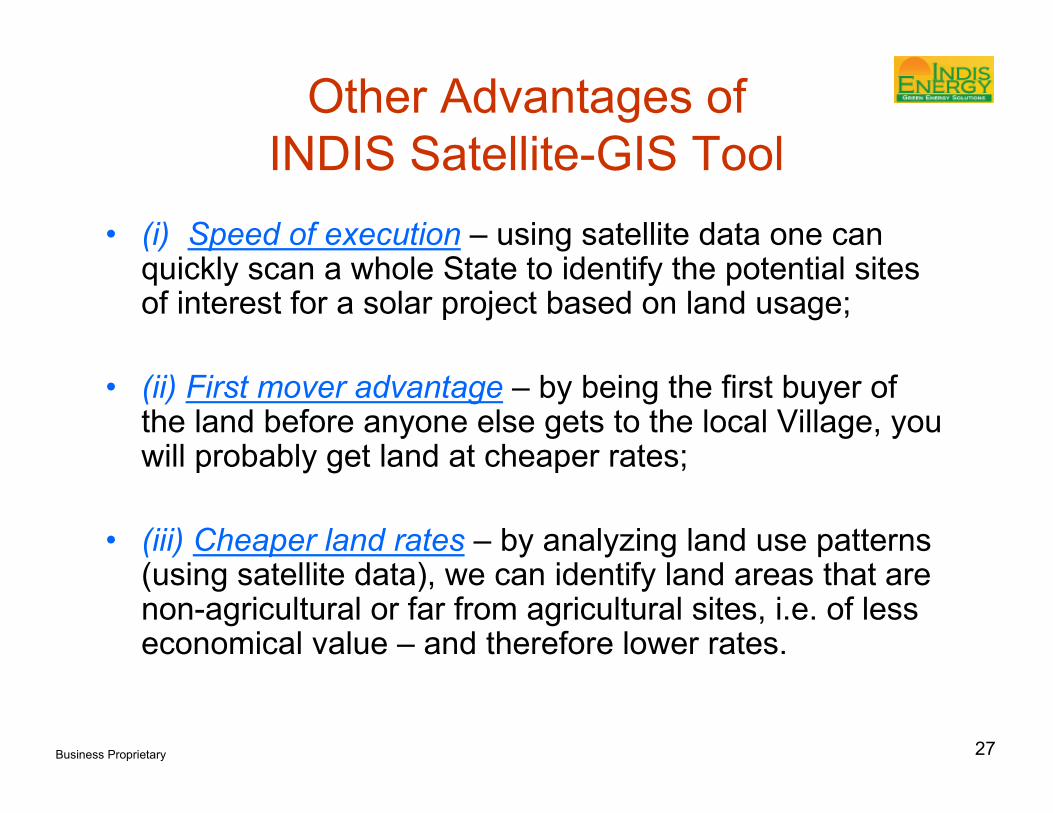
Other Advantages of
INDIS Satellite-GIS Tool
• (i) Speed of execution – using satellite data one can quickly scan a whole State to identify the potential sites of interest for a solar project based on land usage;
• (ii) First mover advantage – by being the first buyer of the land before anyone else gets to the local Village, you will probably get land at cheaper rates;
• (iii) Cheaper land rates – by analyzing land use patterns (using satellite data), we can identify land areas that are non-agricultural or far from agricultural sites, i.e. of less economical value – and therefore lower rates.