Vol-6 Issue-6 2020 IJARIIE-ISSN(O)-2395-4396 13111 www.ijariie.com 502 STUDY ON ELECTRICAL POWER CONSUMPTION STATUS OF JUTE MILL SATYA NARAYAN BAG PRINCIPAL AMS COLLEGE OF POLYTECHNIC, KOLKATA AND MRS. CHANDRIMA SINHA ROY ASSISTANT PROFESSOR EMINENT COLLEGE OF MANAGEMENT AND TECHNOLOGY, KOLKATA ABSTRACT: Electrical power consumption status of Bally Jute Company Ltd, Bally, Howrah, was studied. It was found that, 93.02 % Electrical power was consumed /day for production area of finished goods and 6.95 % power was consumed in other than production area. It was found that, spinning department is responsible for 37.75 % share of power consumption /day, followed by weaving department having share of power consumption /day was 19.04 %. Other major department of power consumption is Batching [14.29%], Winding [5.75 %], preparing [5.67 %], and Press [3.27 %]. It was observed that 19 watt LED tube light was replaced by conventional tube light which has given power shaving to the unit. There are statistically significant differences between actual unit consumed / M. Ton/day in winter and summer session. Strong positive co relationship exists between total per day production in spinning and weaving department and actual unit consumed / M.Ton /day. KEY WORDS: Spinning, weaving, Power, Production, Co relationship, Significant
Transcript
Vol-6 Issue-6 2020 IJARIIE-ISSN(O)-2395-4396
13111 www.ijariie.com 502
STUDY ON ELECTRICAL POWER CONSUMPTION STATUS OF JUTE MILL
SATYA NARAYAN BAG
PRINCIPAL
AMS COLLEGE OF POLYTECHNIC, KOLKATA
AND
MRS. CHANDRIMA SINHA ROY
ASSISTANT PROFESSOR
EMINENT COLLEGE OF MANAGEMENT AND TECHNOLOGY, KOLKATA
ABSTRACT: Electrical power consumption status of Bally Jute Company Ltd, Bally, Howrah, was studied. It was found that, 93.02 %
Electrical power was consumed /day for production area of finished goods and 6.95 % power was consumed in other than production area. It
was found that, spinning department is responsible for 37.75 % share of power consumption /day, followed by weaving department having share
of power consumption /day was 19.04 %. Other major department of power consumption is Batching [14.29%], Winding [5.75 %], preparing
[5.67 %], and Press [3.27 %]. It was observed that 19 watt LED tube light was replaced by conventional tube light which has given power
shaving to the unit. There are statistically significant differences between actual unit consumed / M. Ton/day in winter and summer session.
Strong positive co relationship exists between total per day production in spinning and weaving department and actual unit consumed / M.Ton
/day.
KEY WORDS: Spinning, weaving, Power, Production, Co relationship, Significant
Vol-6 Issue-6 2020 IJARIIE-ISSN(O)-2395-4396
13111 www.ijariie.com 503
INTRODUCTION:
Jute industries are found to be energy-intensive compared to other industries. Here a large number of orthodox machineries are running. Less
automation of machineries and processing created a burden of industry. A large amount of money is becoming wastage due to power which is
given higher conversion cost from raw jute to finished goods. But no extensive research has been done on such industries in the past to reduce
the energy cost and the total input cost. This paper highlights some energy consumption status of various department and finding out the major
electrical power consumption department. The study gives economic benefit to the Jute mills to find out the necessary measures to reduce
electrical power consumption cost, which is now urgent to reduce the manufacturing cost. Jute industry in India is a vital industry. A large
number of people are engaged from cultivation of plant to manufacturing of finished goods. Due to low modernization in processing of finished
goods electrical power cost is very high in Jute industry. Man power is also shortage in Jute mills due to dusty environment inside the mill and
heavy noise from the machines. Due to these reasons workers are not showing interest in working at Jute mills, which compel mill management
to deploy more automated machines. The owner of the Mills are now concentrated on Modernization of machineries for manufacturing quality
of finished goods. The modernization of machineries and up gradation of technological develop machineries are now given lower electrical
power consumption and lower wastage of electrical power.
STUDY AREA:
Bally Jute Company Ltd. Bally, Howrah is a pioneer Jute industry in West Bengal. Nearly 3500 employees are directly related with such
industry. Jute Yarn, fabrics, bags, carpets etc. are the major finished products of such industry. A large number of orthodox machineries are
running in this unit. As a result high electrical power is consumed each day for conversion of raw Jute to finished goods. The unit has various
departments. The power consumption status of various department and respective machineries are the main objectives of this study. The study
helps us to identify the high power consumption machineries and necessary corrective measures to reduce it.
RESEARCH OBJECTIVES:
The objectives of the Research study are stated below:
To study the power consumption status of the entire Mill .
To identify the major power consumption department of the mill.
To find out the relationship between day wise total production and total unit consumed /day
Vol-6 Issue-6 2020 IJARIIE-ISSN(O)-2395-4396
13111 www.ijariie.com 504
RESEARCH METHODOLOGY:
Electrical engineering department of the organization regularly maintain the data sheet of no. of machines running in various department , power
consumption of departmental , production of spinning and weaving department , power consumption of other than production areas. We have
studied the data sheet from computer generated report. So, the study is based on company’s own data of different month. The computer
generated report is available on each day. Based on the computer generated report , study is conducted on the data available . Statistical analysis
and discussion is taken on the basis of statistical analysis. Regression equation is set up between the day wise total production of spinning and
weaving and total unit consumed in production area. Pearson’s correlation coefficient is calculated on total spinning weaving production and
total unit consumed /day due to production. Positive correlation ship is observed between the two parameters. Data obtained the electrical power
consumed in winter and summer seasons are found to be significantly difference. It is found that electrical power consumed in winter seasons are
significantly different and lower than summer season.
LITERATURE REVIEW:
The Indian government has already been selected the energy sector in industry as a priority sector & stressed the need of efficient use of energy
in industry. Most of the state governments in India have made energy audits mandatory for large scale energy consuming industries. So in
industrial sectors the energy saving practices is gaining importance of the realization that „energy saved is energy produced & that too at
economical cost‟. The author shares the experiences regarding some of the energy saving measures of jute mill situated in West Bengal. The
effect of such measures was realized through reduction of cost in respect of energy [1].
This study investigates the electricity consumption and emissions of jute product manufacture stages at Rajshahi Jute mill in Bangladesh.
Electricity consumption and emissions at various production stages were estimated. The energy inefficient stages and potential improvement
solutions were also investigated to further improve the product manufacture to be an energy efficient way. The result showed that 50% electricity
consumption observed in spinning process. The electricity required per day is 28,604 kWh and per ton jute product is 1,345 kWh. Two possible
alternative improvement options namely weaving and winding process were investigated. The study showed that daily 3,076 kWh electricity
consumptions could be possible to reduce which is 11% of daily total electricity consumption in the Jute mill. The environmental analysis
showed that about 1.92 ton CO2 emissions per day can be reduced using the alternative improvement options. The analysis of economic benefit
showed that the operating cost could be possible to reduced BDT 27,684 per day and BDT 1,318 per ton production of Jute goods. Hence,
government can take suggestions from this study to reduce the energy consumption of Jute industry in Bangladesh [2]
Vol-6 Issue-6 2020 IJARIIE-ISSN(O)-2395-4396
13111 www.ijariie.com 505
Energy efficiency improvement and energy saving are major industrial concerns now-a-days. This paper mainly aims at focusing key issues for
reducing energy wastage and subsequent reduction of excessive energy consumption due to inefficient machinery and unplanned electrical
system. In order to improve the energy consumption pattern, particularly jute processing industry of Bangladesh is considered as case study;
several energy saving scopes and way of improvement have been identified. The objective is to addresses utilization strategy through
mathematical analysis to maximize machine efficiency leads to greater production, financial profit by reduction of energy bill as well as trapping
carbon emission. In addition, to attain the target of improving energy efficiency of Bangladesh Government’s Sustainable Development Goal
(SDG), this strategy can contribute by decarbonizing industrial operation and supply chains thorough improved energy efficiency. Also tend to
reduce the carbon footprint of jute products, services and processes. This leads to setting ambitious emissions reductions targets in line with
development of green industry; also scaling up potential investment scope as Clean Development Mechanism (CDM) projects in the
development of innovative low-carbon products and service [3].
RESULTS AND DISCUSSION:
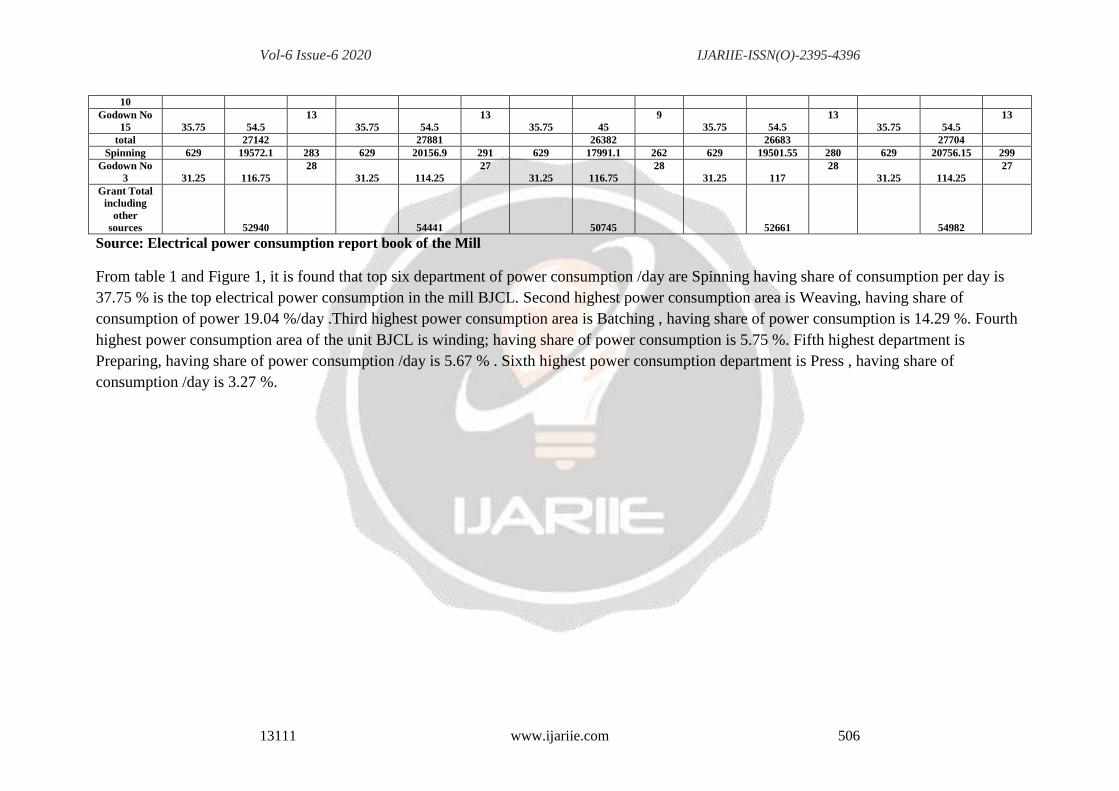
Table 1 : Power Consumption in various Department of Jute Mill
Source: Electrical power consumption report book of the Mill
From table 1 and Figure 1, it is found that top six department of power consumption /day are Spinning having share of consumption per day is
37.75 % is the top electrical power consumption in the mill BJCL. Second highest power consumption area is Weaving, having share of
consumption of power 19.04 %/day .Third highest power consumption area is Batching , having share of power consumption is 14.29 %. Fourth
highest power consumption area of the unit BJCL is winding; having share of power consumption is 5.75 %. Fifth highest department is
Preparing, having share of power consumption /day is 5.67 % . Sixth highest power consumption department is Press , having share of
consumption /day is 3.27 %.
Vol-6 Issue-6 2020 IJARIIE-ISSN(O)-2395-4396
13111 www.ijariie.com 507
Figure 1 : Share of electrical Power Consumption at various department of BJCL in first week of March 2020
We know that the conventional type tube light sets are draw more current then LED tube light set. So we are studying on this matter and replace conventional set by LED
tube light set. The tube light sets are taken 0.40 kW per set. Approx. 1500 pcs. Tube light sets are installed in mill area.
Total consumption in one hour = 0.40 X 1500 = 600 kWh
For one day = 600 X 12 = 7200 kWh (considering 12 hrs. running)
For one month = 7200 X 30 = 216000 Units
After implementation of 18 watt LED tube light,
Total consumption in one hour = 0.18 X 1500 = 270 kWh
For one day = 270 X 12 = 3240 kWh (considering 12 hrs. running)
Total Production 3525 3754 3707 3515 3442 3323 3550 3545.143 6.98%
G.Total
Production 49242 50502 48738 50430 52278 51738 52920 50835.43
Source: Electrical power consumption report book of the Mill
Table 2 explained the various areas consumption pattern of electrical power from 1.3.20 to 7.3.20.It is found that other than spinning , spinning and new shed
has major consumption .These three areas covered 93.02 % of total per day consumption. Other than spinning and new shed indicates weaving department ,
both conventional and shuttle loom department.
Vol-6 Issue-6 2020 IJARIIE-ISSN(O)-2395-4396
13111 www.ijariie.com 509
Figure 2 Percentage share of Electric power consumption from 1.3.20 to 7.3.20
From figure 2 , it is found that power consumption due to production activities were 93.02 % and 6.98 % was due to other than production activities. Other
than production activities are different godown, main offices, canteen, staff mess, mill lightening, labour colony etc. So, production activities are consuming
major share of power in each day as studied from 7 days data from the 1st week of March 2020.From the 6.98 % share of other than production line, it is
found that from figure 2,, water service pump has been consumed 37.8 % , followed by worker colony lightening having share of 27.16 % of total other than
production activities. Boiler consumed nearly 11.36 % and Mill lightening consumed 8.36 % of the total other than production activities consumption of the
mill.
% of Share of Power consumption from 1.3.20 to 7.3.20.
power consumption related toproduction [93.02%]
other than production [6.98 %]
Vol-6 Issue-6 2020 IJARIIE-ISSN(O)-2395-4396
13111 www.ijariie.com 510
Figure 3 : Power consumption in other than production details from 1.3.20 to 7.3.20
Table3 : Electrical Power Consumed in the different day of December 2019 and March 2019
Source : Electrical power consumption report book of the Mill
Table 4,indicates the various department , number of machines installed and HP installed capacity .The table indicates the HP of Electrical power having
higher than 100 HP.There are 25 areas where more than 100 HP are installed .Spinning and Weaving areas are the areas where higher number of machines are
installed . As a result higher installed capacity of HP .
Table 5 Statistical Analysis
Subject to be tested T value [two tailed ] P value Results of significance Remarks
Actual unit /per M.Ton
/dayin December 19 and
March 20 has significance
Differences=H0
The t-value is -2.42064 The p-value is .022229 The result is significant at p
< .05.
H0 = rejected . There is
significance difference
between Actual unit
consumed /M Ton /day in
Winter and Summer season
i.e., in The month of
December 19 and March 20
Total unit Consumed/day in
the month of December 19
and March 20 has
significance difference = H0
The t-value is -2.42081 The p-value is .02222. The result is significant at p
< .05.
H0 = rejected . There is
significance difference
between Total unit consumed
/day in Winter and Summer
season i.e., in The month of
December 19 and March 20
Table 6 : Regression Analysis
Subject to be compaired
1.12.19 to 15.12.19 1.3.20 to 16.3.20 Remarks
[X]=Actual unit /per
M.Ton
And [Y]=Total
ŷ = 0.30629X + 41.4193 regression
equation
the regression equation for Y is:
ŷ = 0.33007X + 95.04212
Sum of X = 6928.4
Positive correlation exists between total per
day production in spinning and weaving
section and actual unit consumed /M.Ton
Vol-6 Issue-6 2020 IJARIIE-ISSN(O)-2395-4396
13111 www.ijariie.com 513
Production in MT/day
Sum of X = 6675.5
Sum of Y = 2665.902
Mean X = 445.0333
Mean Y = 177.7268
Sum of squares (SSX) = 1467.7635
Sum of products (SP) = 449.5555
Regression Equation = ŷ = bX + a
b = SP/SSX = 449.56/1467.76 =
0.30629
a = MY - bMX = 177.73 -
(0.31*445.03) = 41.4193
The value of R is 0.2836.
Although technically a positive
correlation, the relationship between
your variables is weak (nb. the nearer
the value is to zero, the weaker the
relationship).
he value of R2, the coefficient of
determination, is 0.0804.
he P-Value is .305685. The result is
not significant at p < .05.
Sum of Y = 3712.476
Mean X = 461.8933
Mean Y = 247.4984
Sum of squares (SSX) = 8719.8929
Sum of products (SP) = 2878.159
Regression Equation = ŷ = bX + a
b = SP/SSX = 2878.16/8719.89 =
0.33007
a = MY - bMX = 247.5 -
(0.33*461.89) = 95.04212
ŷ = 0.33007X + 95.04212
The value of R is 0.8447.
This is a strong positive correlation,
which means that high X variable
scores go with high Y variable scores
(and vice versa). he value of R2, the
coefficient of determination, is 0.7135.
The P-Value is .000074. The result is
significant at p < .05.
/day. Now the relationship is true in both
the time frame in the time frame of 1.3.20
to 16.3.20 the R value is 0.8447 which is
positive and strong correlation ship exist
with value of R2 is 0.7135. The relationship
is statistically significant at 95 %
confidence level. Whereas in the time
period of 1.12.19 to 15.12.20 two
parameters are positively correlated but
statistically not significant.
Both the cases regression equation can be
obtained.
Total unit
Consumed=[X]
Total Production in
MT/day=[Y]
the regression equation for Y is:
ŷ = 0.00287X + 41.46619
Sum of X = 712741
Sum of Y = 2665.902
Mean X = 47516.0667
Mean Y = 177.7268
Sum of squares (SSX) =
16735412.9333
Sum of products (SP) = 47991.7172
Regression Equation = ŷ = bX + a
b = SP/SSX = 47991.72/16735412.93
= 0.00287
the regression equation for Y is:
ŷ = 0.00384X - 8.35222
Sum of X = 739746
Sum of Y = 2712.476
Mean X = 49316.4
Mean Y = 180.8317
Sum of squares (SSX) = 99410673.6
Sum of products (SP) = 381351.9336
Regression Equation = ŷ = bX + a
b = SP/SSX = 381351.93/99410673.6
= 0.00384
a = MY - bMX = 180.83 - (0*49316.4)
Total production in spinning and weaving
areas/day is positively correlated with total
unit of electrical power consumed. The
value of R correlation coefficient is 0.844 ,
which indicates strong positive correlation
exist between the two parameters. Value of
R2 is 0.7135 with p values indicating the
positive relationship is statistically
significant at 95 % confidence level. But in
the period of 1.12.20 to 15.12.20, thew
value of R is 0.28 indicates weak positive
correlation ship exist between the two
Vol-6 Issue-6 2020 IJARIIE-ISSN(O)-2395-4396
13111 www.ijariie.com 514
a = MY - bMX = 177.73 -
(0*47516.07) = 41.46619
ŷ = 0.00287X + 41.46619
The value of R is 0.2835.
lthough technically a positive
correlation, the relationship between
your variables is weak (nb. the nearer
the value is to zero, the weaker the
relationship).
The value of R2, the coefficient of
determination, is 0.0804.
The P-Value is .305863. The result is
not significant at p < .05.
= -8.35222
ŷ = 0.00384X - 8.35222
The value of R is 0.844
This is a strong positive correlation,
which means that high X variable
scores go with high Y variable scores
(and vice versa).
The value of R2, the coefficient of
determination, is 0.7135.
The P-Value is .000074. The result is
significant at p < .05.
parameters.
Both the time frame regression equation
can be obtained.
CONCLUSIONS:
The present study gives a clear idea about the electrical power consumption status of Jute Industry. From the study it is found that, Spinning,
Weaving, Batching and Winding are the major department which contributes more than 75 % power consumption /day. Management is now
concentrated to reduce the power consumption in such department. Top Management is now installing more S4 and Victor modern weaving
machines which consumed less power than conventional shuttle loom. The modern shuttle loom also gives higher productivity and fault free
fabric which accepted customers. High variation of power consumption in summer session compare to winter session and less power
consumption in winter session indicating that Management should concentrate on summer session for control measures on power consumption
.High variation of power consumption pattern in summer seasons indicates, variation in machines running in such time due to absentees of
machine operator . This gives variation is productivity in day wise which is not desirable. Regression equation of total spinning weaving
production in M. Ton and total electrical unit consumed helps us to identify the unit consumed for desired level of production and corrective
measures to reduce the manufacturing cost.
Vol-6 Issue-6 2020 IJARIIE-ISSN(O)-2395-4396
13111 www.ijariie.com 515
REFERENCE:
[1]. Chanda R S .[ October 2014], On Energy Auditing: An Experience With A Jute Mill , International Journal on Recent and Innovation
Trends in Computing and Communication ISSN: 2321-8169,Volume: 2 Issue: 10 .
[2]. Uddina S, Masud M H and Mandal S, [December 2015 ], Assessment of Energy Consumption and Emissions of Jute Mill Production Line
in Bangladesh, International Conference on Mechanical Engineering 2015, Dhaka, Bangladesh, https://www.researchgate.net.
[3]. Sharif S E , Khan M S and Tayab A F ,[2016], Energy Efficiency Improvement Scopes Analysis in the Jute Processing Industry of
Bangladesh, European Journal of Advances in Engineering and Technology, 3(10): 5-10.
[4]. Dhayaneswaran Y & Ashokkumar L ,[ august 2013], A Study on Energy Conservation in Textile Industry, Journal of The Institution of
Engineers (India): Series B volume 94, pages53–60.
[5]. Shambhu V B,[2016], Energy use Pattern and Economic Analysis of Jute Fibre Production in India a case study for West Bengal,
Agricultural Mechanization In Asia, Africa, And Latin America , Vol.47 No.4.
[6]. Ray B K and Reddy B S ,[ June 2008], Understanding industrial energy use: Physical energy intensity changes in Indian manufacturing
sector, Indira Gandhi Institute of Development Research, Mumbai, http://www.igidr.ac.in/pdf/publication.
[7]. Khude P,[2017], A Review on Energy Management in Textile Industry, Innovative Energy & Research, Vol 6(2): 169.
[8]. Sharif S E , Khan M S , Tayab A F ,[2016], Energy Efficiency Improvement Scopes Analysis in the Jute Pro- cessing Industry of