28
1 August 8, 2006 © TAP 2006 The Impact of Self-Service on Customer Loyalty SpeechTEK by John Goodman, Vice Chairman
| Date post: | 01-Jan-2016 |
| Category: |
Documents |
| Upload: | vanessa-sharp |
| View: | 213 times |
| Download: | 0 times |
1
August 8, 2006
© TAP 2006
The Impact of Self-Service on Customer Loyalty
SpeechTEK
by John Goodman, Vice Chairman
2© TARP 2006
Agenda
Key Questions: What are the key benefits of customer self-serve? What are the downsides? How do you decide which transactions to allocate to self serve How do you measure the impact
Who is TARP? Customer behavior, expectations, and preferences Quantifying the impact Key actions to make voice driven self-service effective
3© TARP 2006
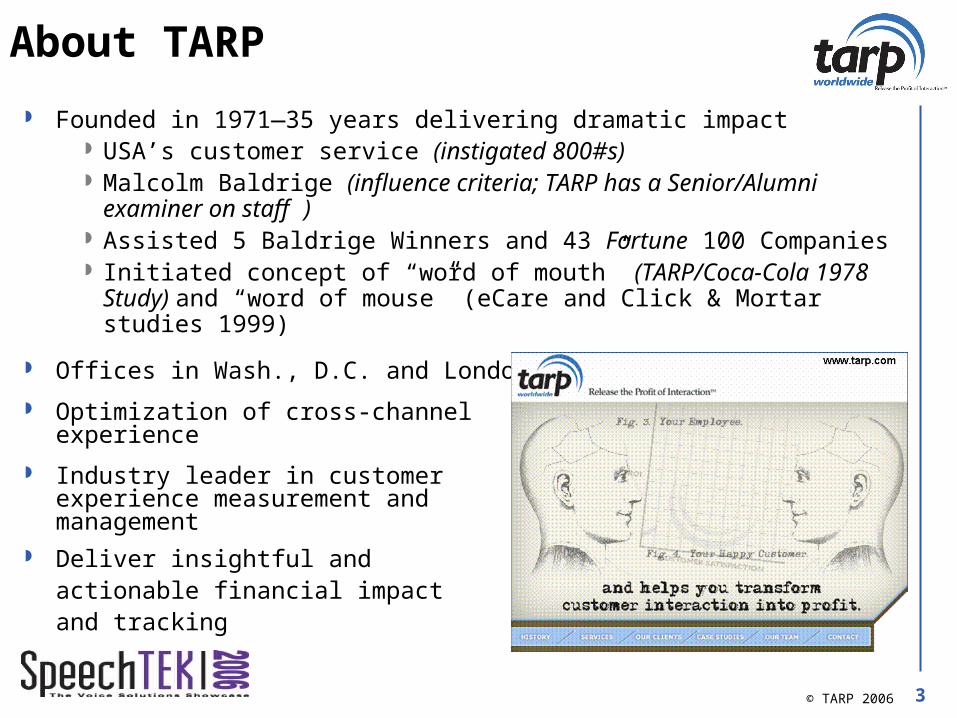
About TARP
Founded in 1971—35 years delivering dramatic impact USA’s customer service (instigated 800#s) Malcolm Baldrige (influence criteria; TARP has a Senior/Alumni
examiner on staff ) Assisted 5 Baldrige Winners and 43 Fortune 100 Companies Initiated concept of “word of mouth” (TARP/Coca-Cola 1978 Study) and
“word of mouse” (eCare and Click & Mortar studies 1999)
Offices in Wash., D.C. and London
Optimization of cross-channel experience
Industry leader in customer experience measurement and management
Deliver insightful and actionable financial impact and tracking
4© TARP 2006
The Key Issue
YOU CAN’T SAVE YOURSELF INTO PROSPERITY!
ONLY SAVE MONEY WHEN YOU CAN’T MAKE MORE MONEY!
5© TARP 2006
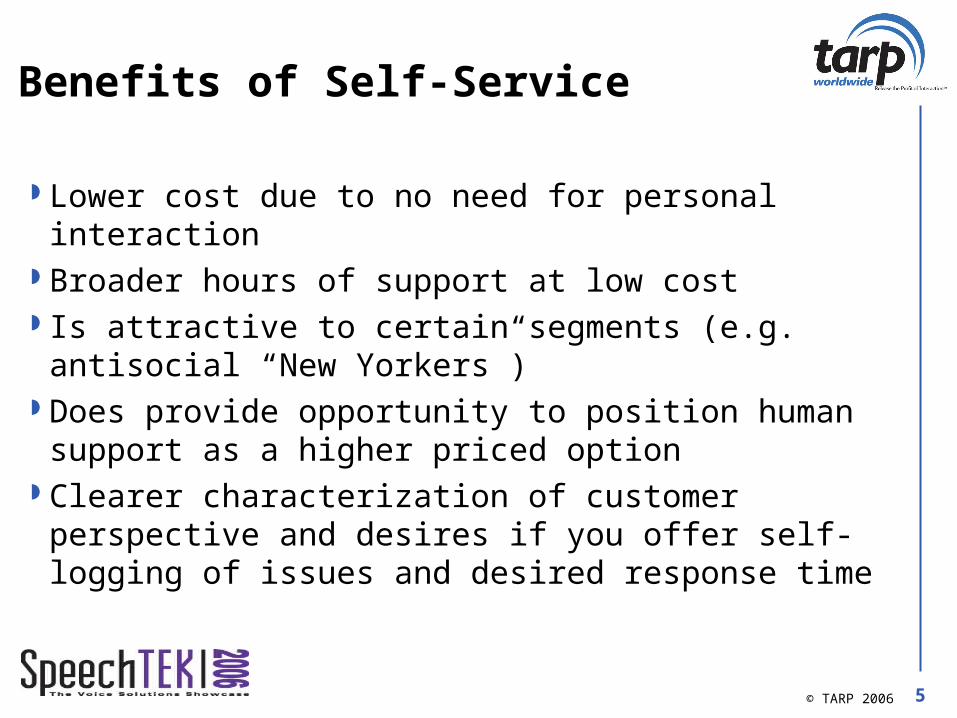
Benefits of Self-Service
Lower cost due to no need for personal interaction Broader hours of support at low cost Is attractive to certain segments (e.g. antisocial “New
Yorkers”) Does provide opportunity to position human support as a
higher priced option Clearer characterization of customer perspective and
desires if you offer self-logging of issues and desired response time
6© TARP 2006
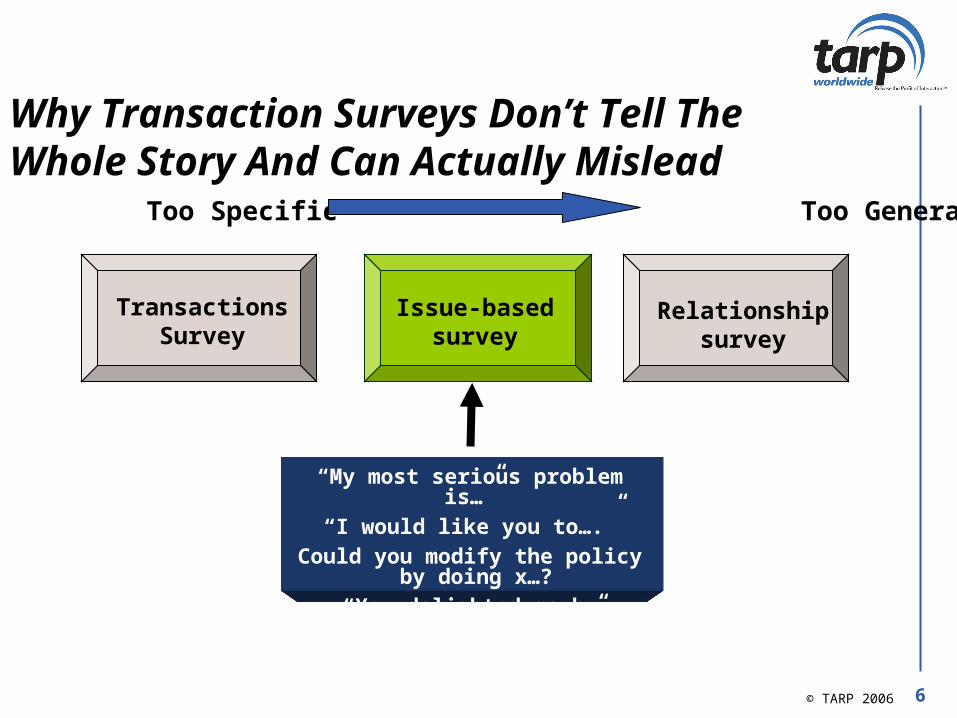
Why Transaction Surveys Don’t Tell The Whole Story And Can Actually Mislead
Too Specific Too General
Relationship survey
Issue-based survey
Transactions Survey
“My most serious problem is…”
“I would like you to….”
Could you modify the policy by doing x…?
“You delighted me by breaking the rules…”
7© TARP 2006
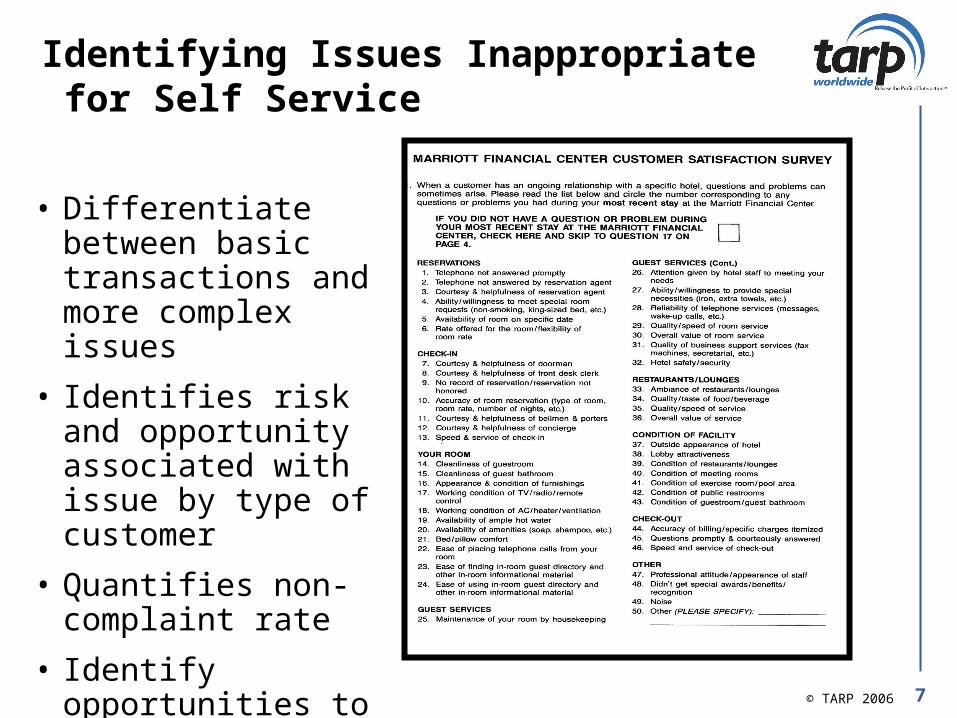
Identifying Issues Inappropriate for Self Service
• Differentiate between basic transactions and more complex issues
• Identifies risk and opportunity associated with issue by type of customer
• Quantifies non-complaint rate
• Identify opportunities to delight customers
8© TARP 2006
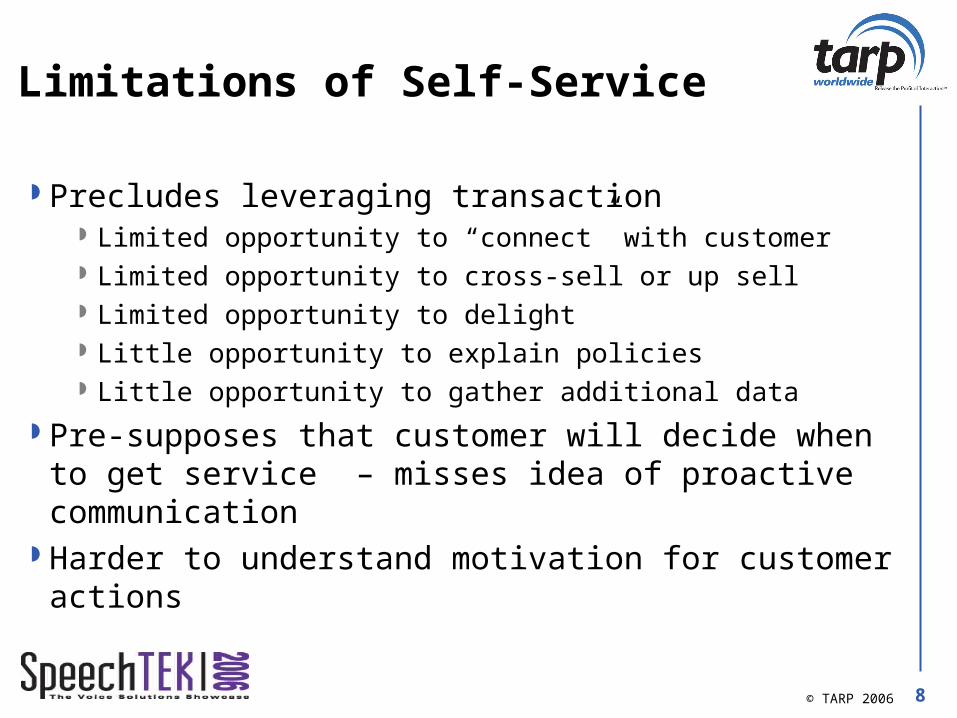
Limitations of Self-Service
Precludes leveraging transaction Limited opportunity to “connect” with customer Limited opportunity to cross-sell or up sell Limited opportunity to delight Little opportunity to explain policies Little opportunity to gather additional data
Pre-supposes that customer will decide when to get service – misses idea of proactive communication
Harder to understand motivation for customer actions
9© TARP 2006
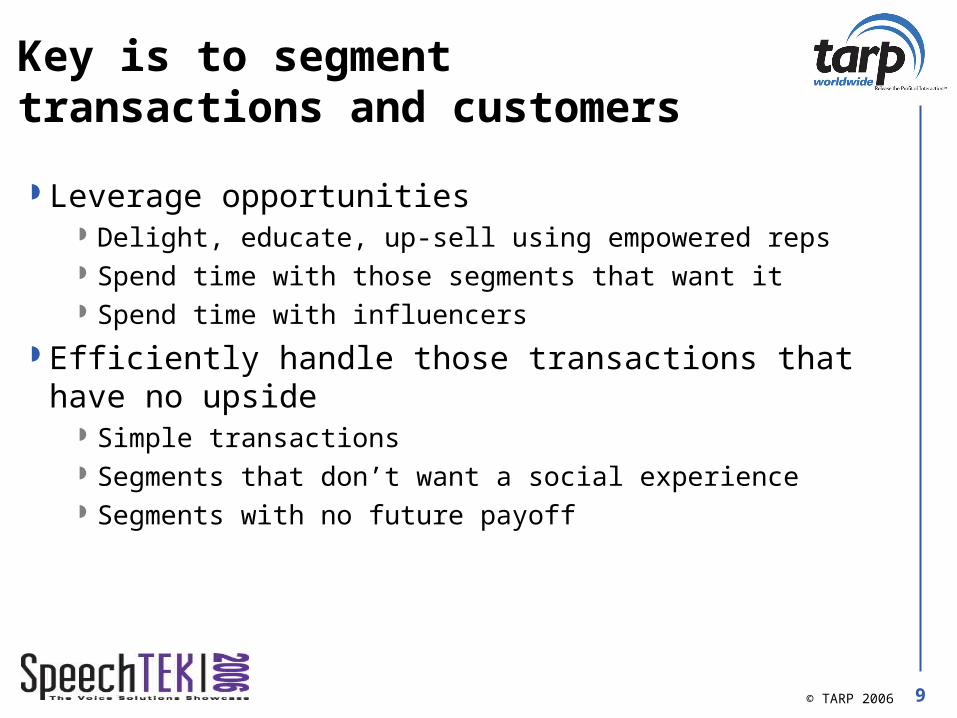
Key is to segment transactions and customers
Leverage opportunities Delight, educate, up-sell using empowered reps Spend time with those segments that want it Spend time with influencers
Efficiently handle those transactions that have no upside Simple transactions Segments that don’t want a social experience Segments with no future payoff
10© TARP 2006
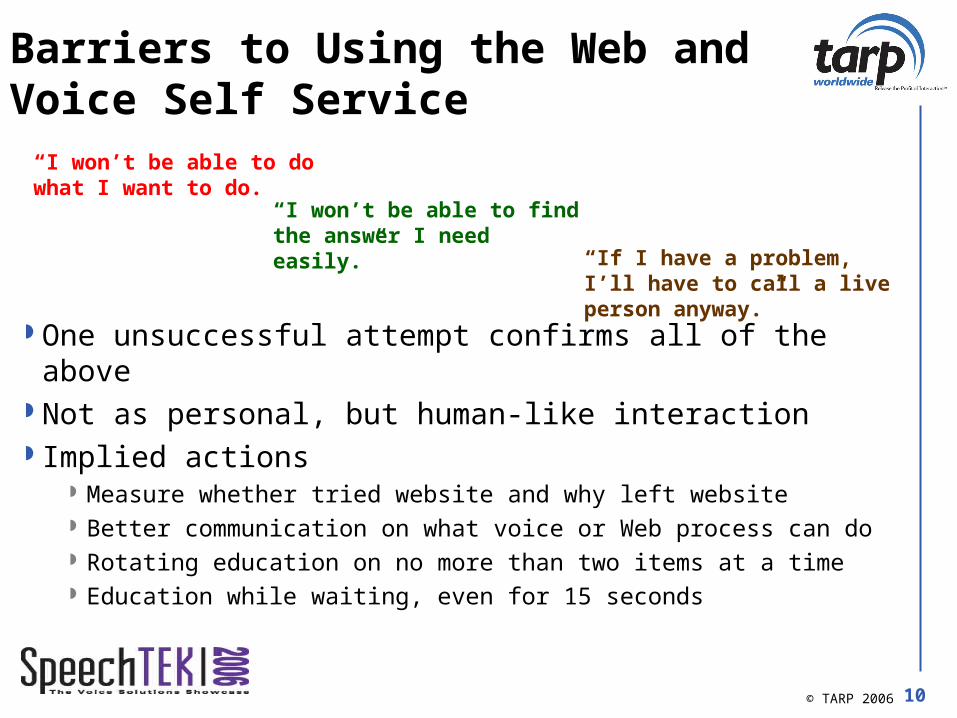
Barriers to Using the Web and Voice Self Service
One unsuccessful attempt confirms all of the above Not as personal, but human-like interaction Implied actions
Measure whether tried website and why left website Better communication on what voice or Web process can do Rotating education on no more than two items at a time Education while waiting, even for 15 seconds
“I won’t be able to do what I want to do.
“I won’t be able to find the answer I need easily.”
“If I have a problem, I’ll have to call a live person anyway.”
11© TARP 2006
Customer Behaviors Impacting The Bottom Line
12© TARP 2006
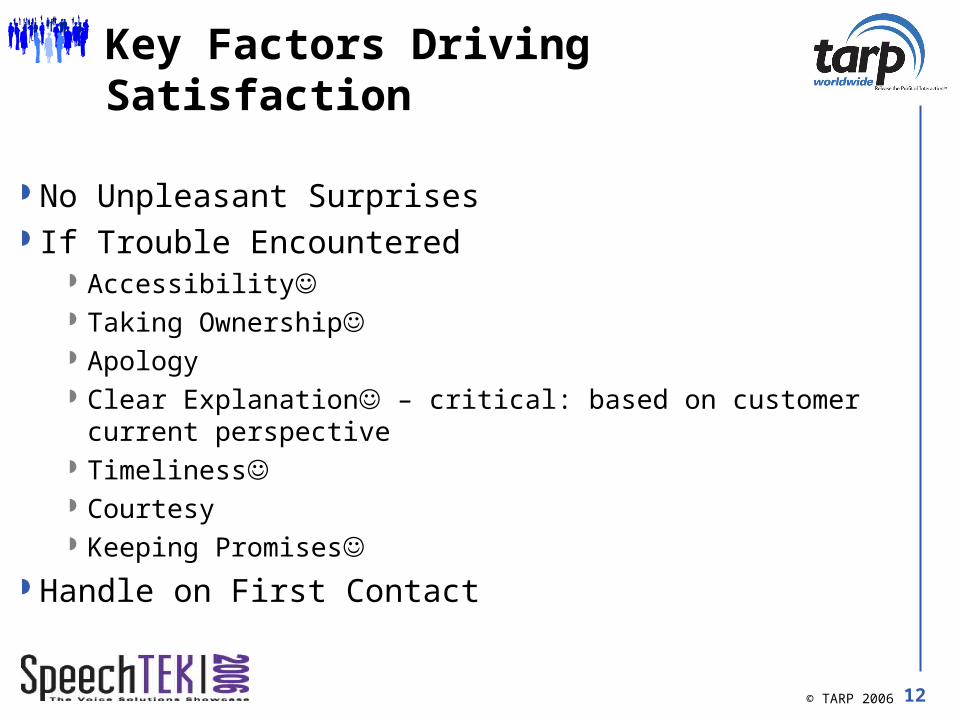
Key Factors Driving Satisfaction
No Unpleasant Surprises If Trouble Encountered
Accessibility☺ Taking Ownership☺ Apology Clear Explanation☺ – critical: based on customer current perspective Timeliness☺ Courtesy Keeping Promises☺
Handle on First Contact
13© TARP 2006
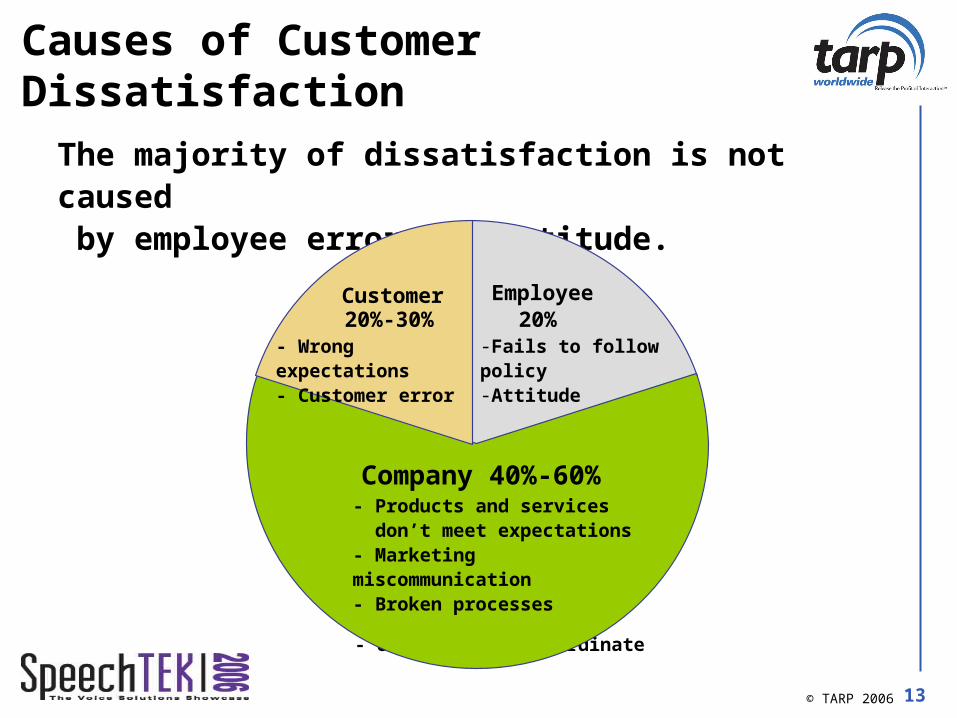
Causes of Customer Dissatisfaction
- Products and services don’t meet expectations-Marketing miscommunication- System fails- Units fail to coordinate
- Fails to follow policy
The majority of dissatisfaction is not caused by employee errors or attitude.
Customer20%-30%
Company 40%-60%
Employee 20%
- Wrong expectations- Customer error
-Fails to follow policy-Attitude
- Products and services don’t meet expectations- Marketing miscommunication- Broken processes
14© TARP 2006
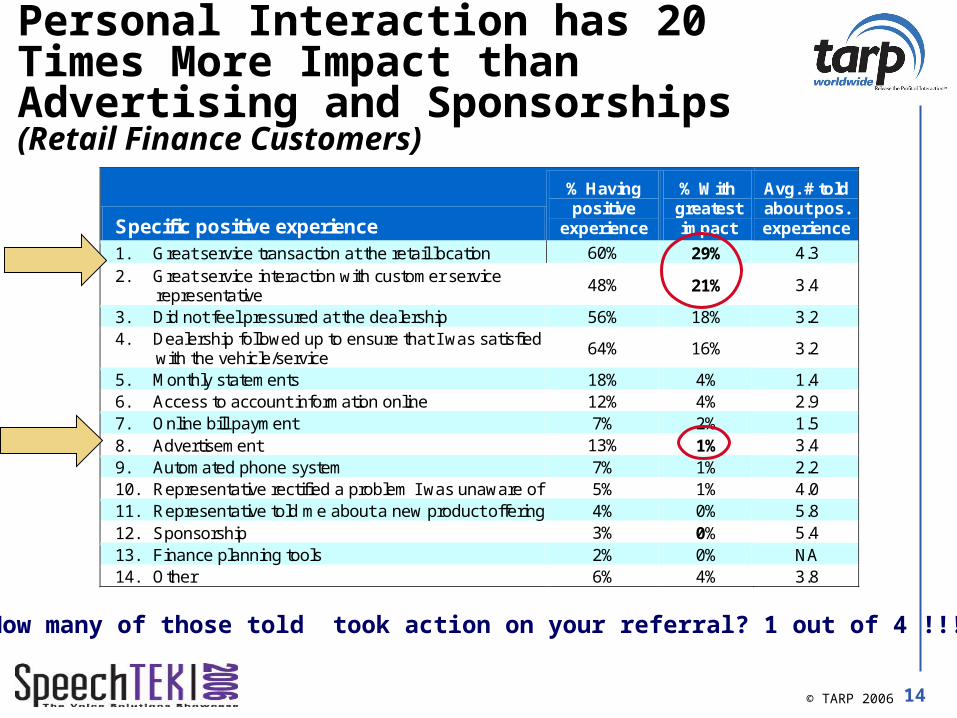
Personal Interaction has 20 Times More Impact than Advertising and Sponsorships (Retail Finance Customers)
Specific positive experience
% Having positive
experience
% With greatest impact
Avg. # told about pos. experience
1. Great service transaction at the retail location 60% 29% 4.3 2. Great service interaction with customer service
representative 48% 21% 3.4
3. Did not feel pressured at the dealership 56% 18% 3.2 4. Dealership followed up to ensure that I was satisfied
with the vehicle/service 64% 16% 3.2
5. Monthly statements 18% 4% 1.4 6. Access to account information online 12% 4% 2.9 7. Online bill payment 7% 2% 1.5 8. Advertisement 13% 1% 3.4 9. Automated phone system 7% 1% 2.2 10. Representative rectified a problem I was unaware of 5% 1% 4.0 11. Representative told me about a new product offering 4% 0% 5.8 12. Sponsorship 3% 0% 5.4 13. Finance planning tools 2% 0% NA 14. Other 6% 4% 3.8
How many of those told took action on your referral? 1 out of 4 !!!
15© TARP 2006
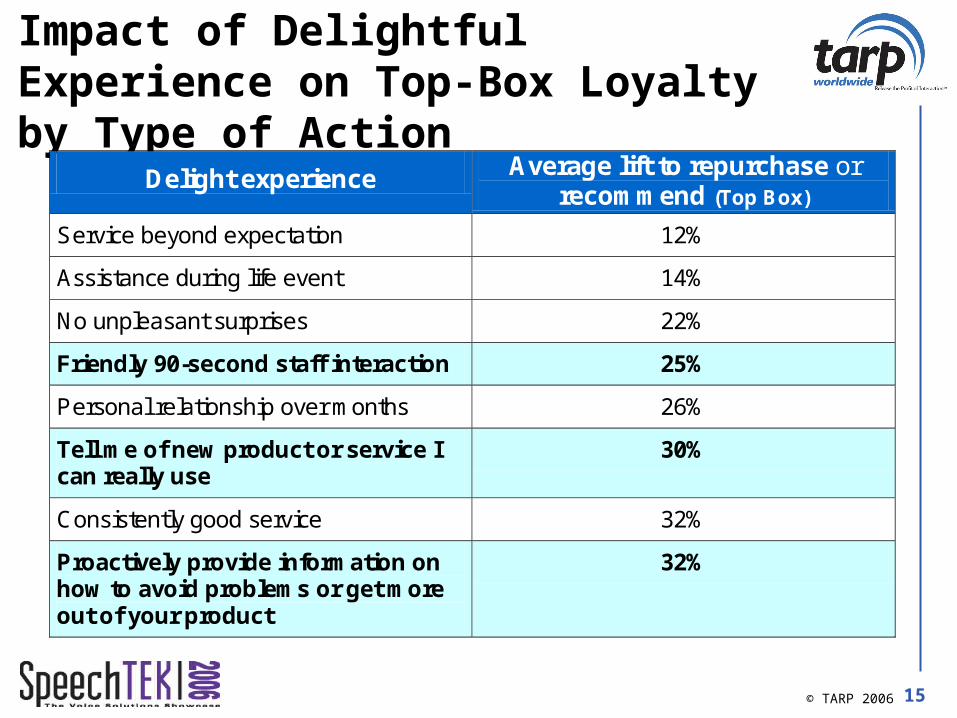
Impact of Delightful Experience on Top-Box Loyalty by Type of Action
Delight experience Average lift to repurchase or recommend (Top Box)
Service beyond expectation 12%
Assistance during life event 14%
No unpleasant surprises 22%
Friendly 90-second staff interaction 25%
Personal relationship over months 26%
Tell me of new product or service I can really use
30%
Consistently good service 32%
Proactively provide information on how to avoid problems or get more out of your product
32%

16© TARP 2006
Problems Raise Sensitivity to Price
10%
22%
46%
74%
0%
10%
20%
30%
40%
50%
60%
70%
80%
90%
No problems 1 problem 2 to 5 problems 6 problems ormore
% D
i ss
ati s
fied
wit
h p
r ice
or
f ees
Percent of customers dissatisfied with price rises with number of problems.
17© TARP 2006
Calculating The Impact of Customer Experience on Revenue
18© TARP 2006
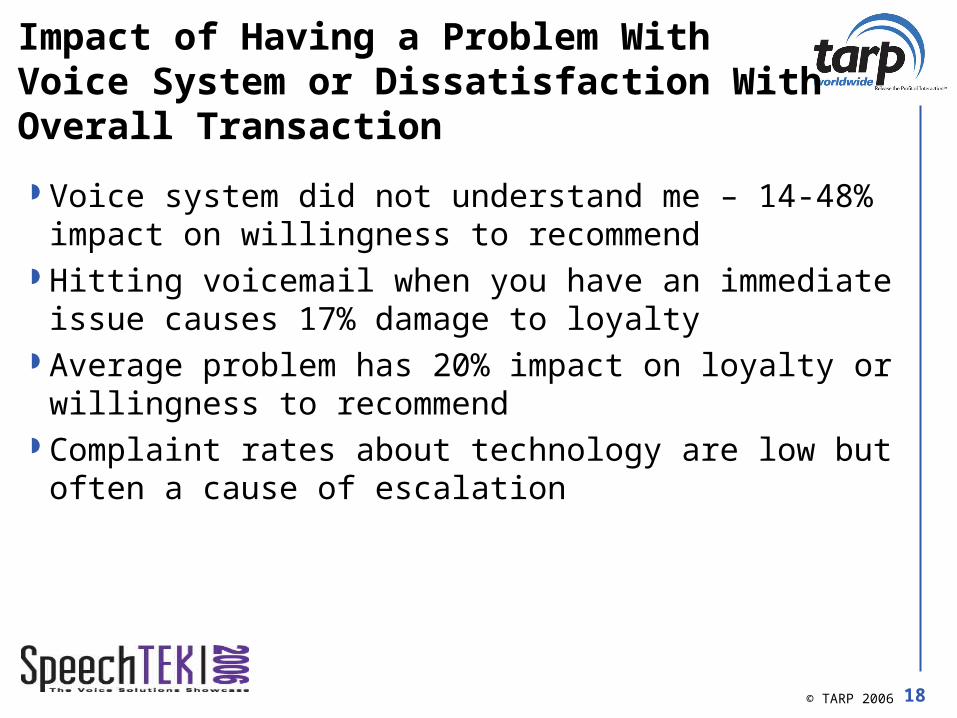
Impact of Having a Problem With Voice System or Dissatisfaction With Overall Transaction
Voice system did not understand me – 14-48% impact on willingness to recommend
Hitting voicemail when you have an immediate issue causes 17% damage to loyalty
Average problem has 20% impact on loyalty or willingness to recommend
Complaint rates about technology are low but often a cause of escalation
19© TARP 2006
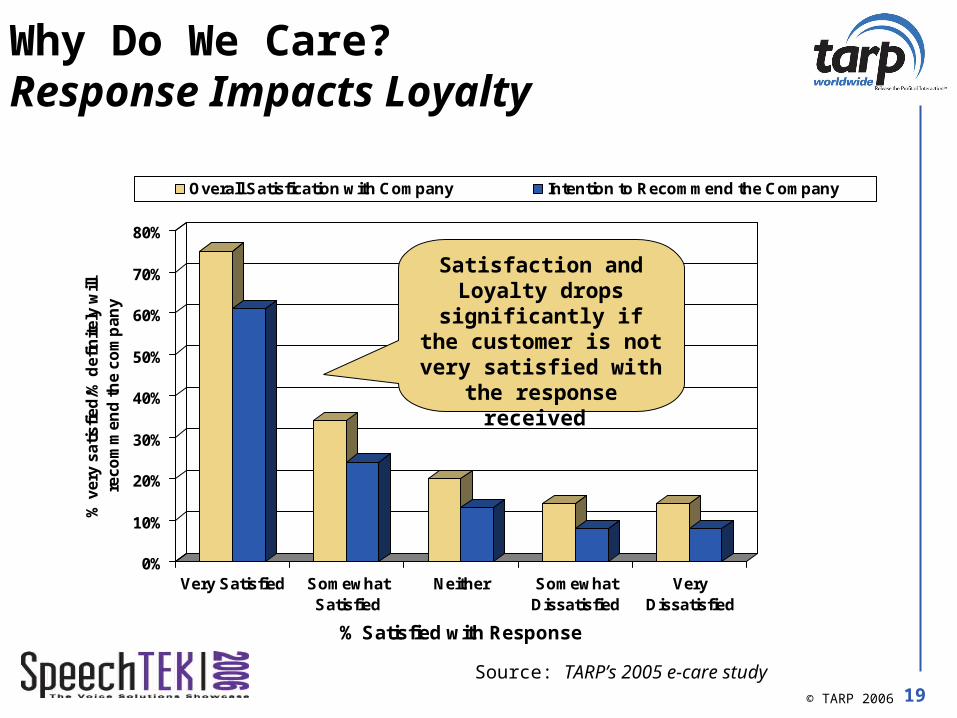
Why Do We Care?Response Impacts Loyalty
0%
10%
20%
30%
40%
50%
60%
70%
80%
% v
ery
sa
tis
fie
d/%
de
fin
ite
ly w
ill
rec
om
me
nd
th
e c
om
pa
ny
Very Satisfied SomewhatSatisfied
Neither SomewhatDissatisfied
VeryDissatisfied
% Satisfied with Response
Overall Satisfication with Company Intention to Recommend the Company
Satisfaction and Loyalty drops significantly if the
customer is not very satisfied with the
response received
Source: TARP’s 2005 e-care study
20© TARP 2006
=
=
=
=
x xx
=
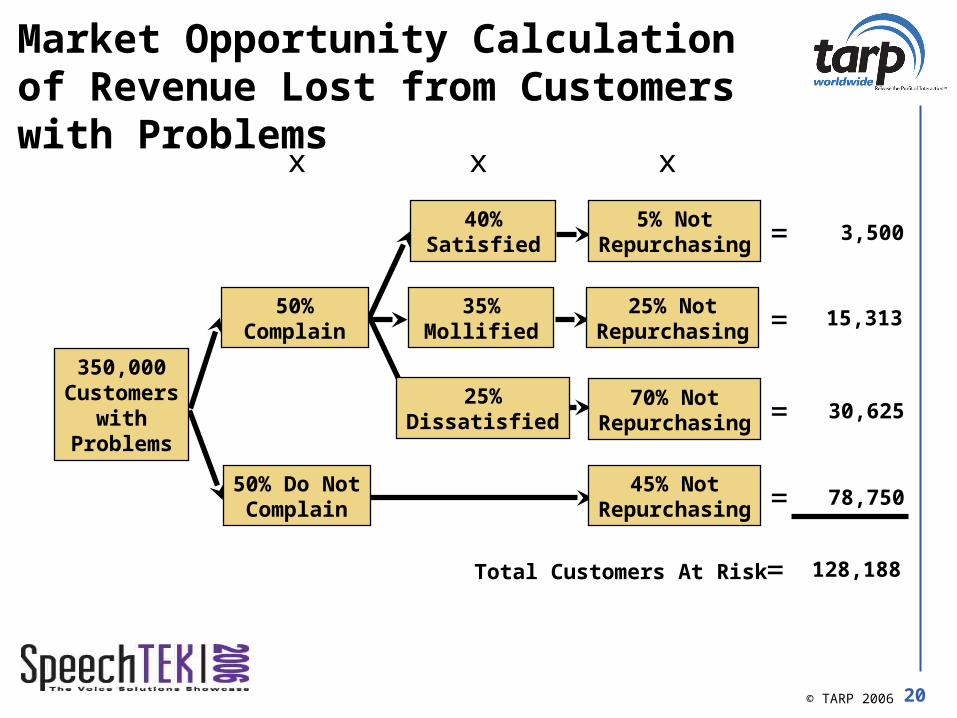
3,500
15,313
30,625
78,750
128,188Total Customers At Risk
350,000Customers
withProblems
25%Dissatisfied
70% NotRepurchasing
45% NotRepurchasing
40%Satisfied
5% NotRepurchasing
50% Do NotComplain
50%Complain
35%Mollified
25% NotRepurchasing
Market Opportunity Calculation of Revenue Lost from Customers with Problems

21© TARP 2006
Why Do We Care?Response Impacts Word of Mouth/Mouse
0
0.5
1
1.5
2
2.5
3
3.5
Av
era
ge
nu
mb
er
of
pe
op
le t
old
ab
ou
t c
on
tac
t e
xp
eri
en
ce
Completely Satisfied withResponse
Mollified Dissatisfied withResponse
Number of people told online Number of people told offline
Source: TARP’s 2005 e-care study
22© TARP 2006
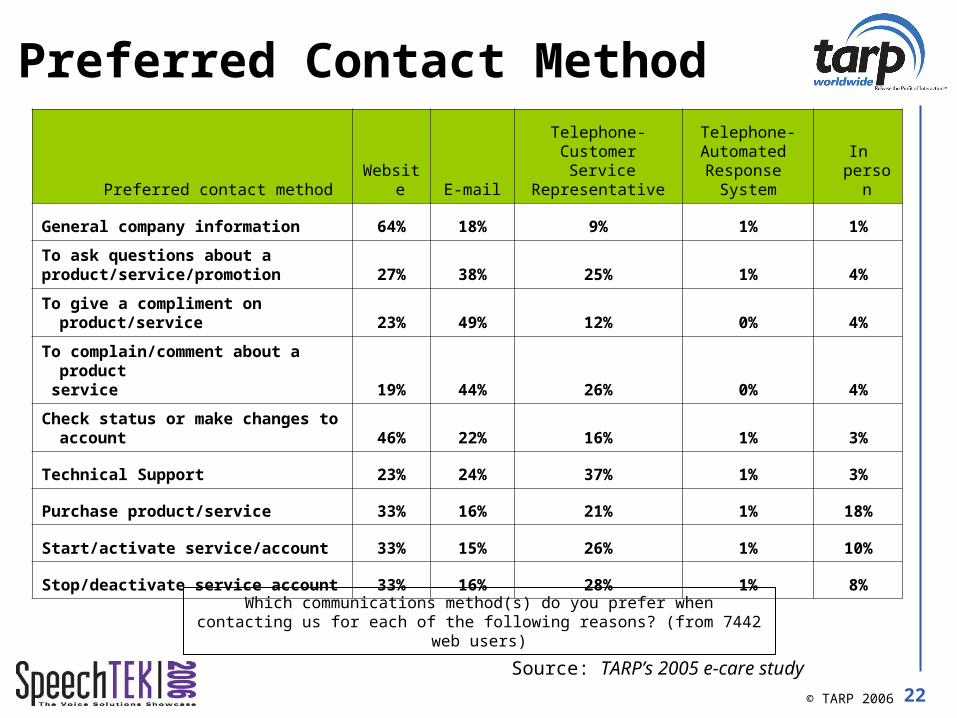
Preferred Contact Method
Preferred contact method Website E-mail
Telephone-Customer Service
Representative
Telephone-Automated Response
System In person
General company information 64% 18% 9% 1% 1%
To ask questions about a product/service/promotion 27% 38% 25% 1% 4%
To give a compliment on product/service 23% 49% 12% 0% 4%
To complain/comment about a product service 19% 44% 26% 0% 4%
Check status or make changes to account 46% 22% 16% 1% 3%
Technical Support 23% 24% 37% 1% 3%
Purchase product/service 33% 16% 21% 1% 18%
Start/activate service/account 33% 15% 26% 1% 10%
Stop/deactivate service account 33% 16% 28% 1% 8%
Which communications method(s) do you prefer when contacting us for each of the following reasons? (from 7442 web users)
Source: TARP’s 2005 e-care study
23© TARP 2006
Recommendations
24© TARP 2006
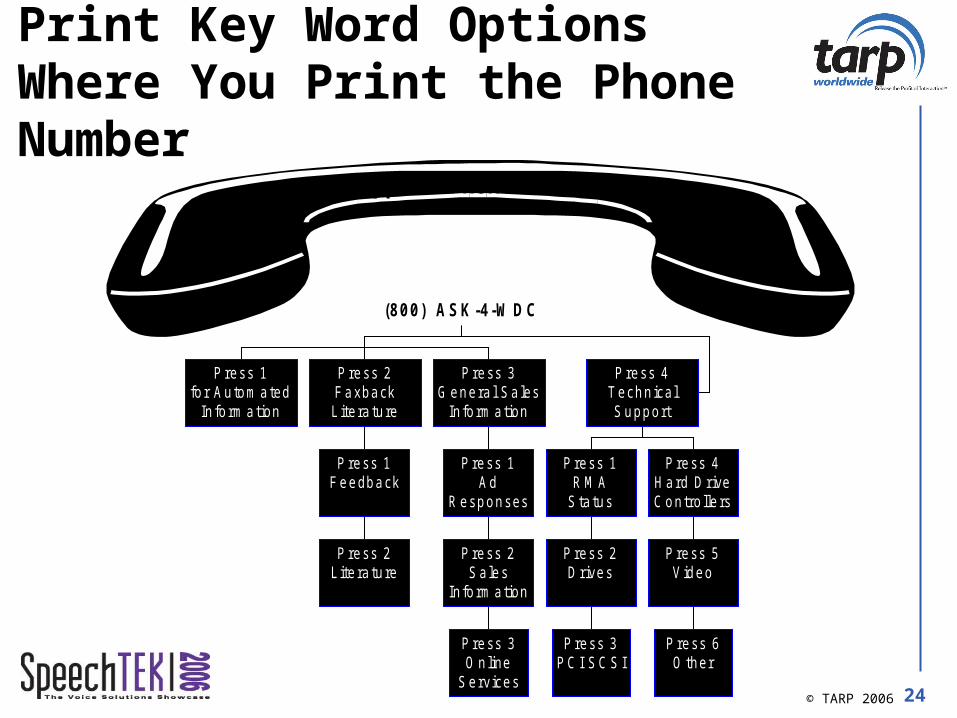
P ress 1fo r A u tom a ted
In fo rm a tion
P ress 2L ite ra tu re
P ress 1F eedback
P ress 2F axbackL ite ra tu re
P ress 3O n line
S e rv ices
P ress 2S a les
In fo rm a tion
P ress 1A d
R esponses
P ress 3G ene ra l S a les
In fo rm a tion
P ress 3P C I S C S I
P ress 2D rives
P ress 1R M A
S ta tus
P ress 6O ther
P ress 5V ideo
P ress 4H a rd D riveC on tro lle rs
P ress 4T echn icalS uppo rt
(800) ASK -4-W D C
Support Phone Matrix
Print Key Word Options Where You Print the Phone Number

25© TARP 2006
Measure Effectiveness by Type of Transaction by Channel
Transaction which is biggest opportunity for improvement
Problem reports % Recommend Opt Out Rate %
Routine order 98 2
Shipment status 91 5
Product return 93 7
Shipping charges 88 14
Backorder status * 67 38
Call center overall average 91 14
Misuse of resources to intensively measure this transaction
26© TARP 2006
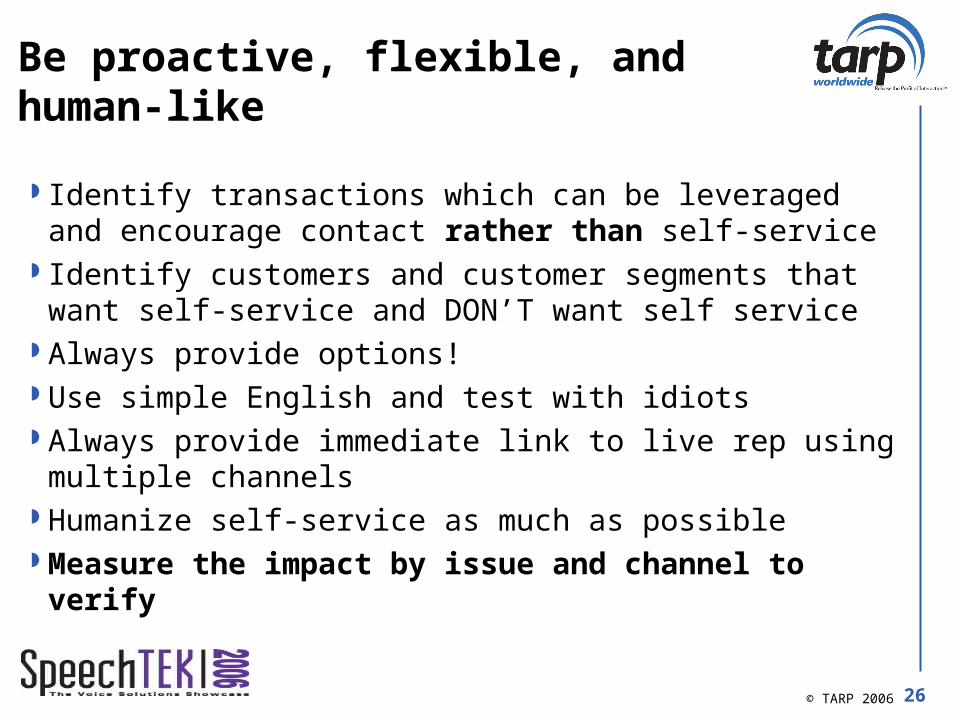
Be proactive, flexible, and human-like
Identify transactions which can be leveraged and encourage contact rather than self-service
Identify customers and customer segments that want self-service and DON’T want self service
Always provide options! Use simple English and test with idiots Always provide immediate link to live rep using multiple
channels Humanize self-service as much as possible Measure the impact by issue and channel to verify
27© TARP 2006
Summary
DO IT RIGHT OR DON’T DO IT!
FOR PAPERS AND ARTICLES: [email protected] or 703-284-9253

28© TARP 2006


![Designing the Conversation [SpeechTek 2016]](https://static.documents.pub/doc/80x56/58728c3c1a28ab36118b53f3/designing-the-conversation-speechtek-2016.jpg)


