25
Text Analytics Teradata & Sabanci University April, 2015
| Date post: | 13-Dec-2015 |
| Category: |
Documents |
| Upload: | charlene-andrews |
| View: | 230 times |
| Download: | 4 times |

Text Analytics
Teradata & Sabanci University
April, 2015
2
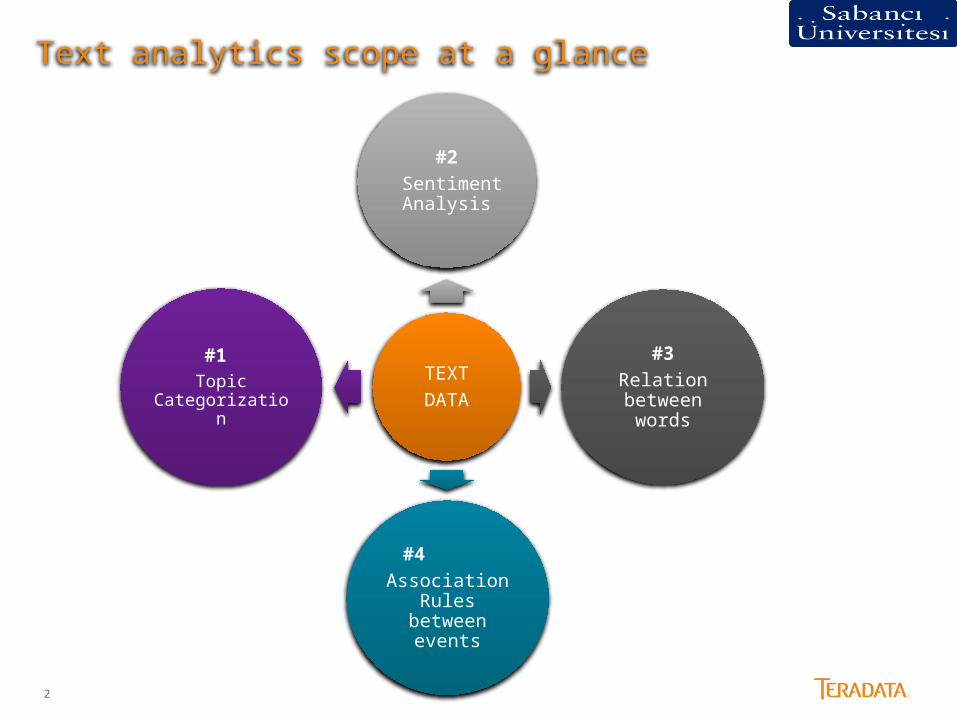
TEXTDATA
#2 Sentiment
Analysis
#3Relation between
words
#4 Association Rules between events
#1 Topic Categorization
Text analytics scope at a glance
3
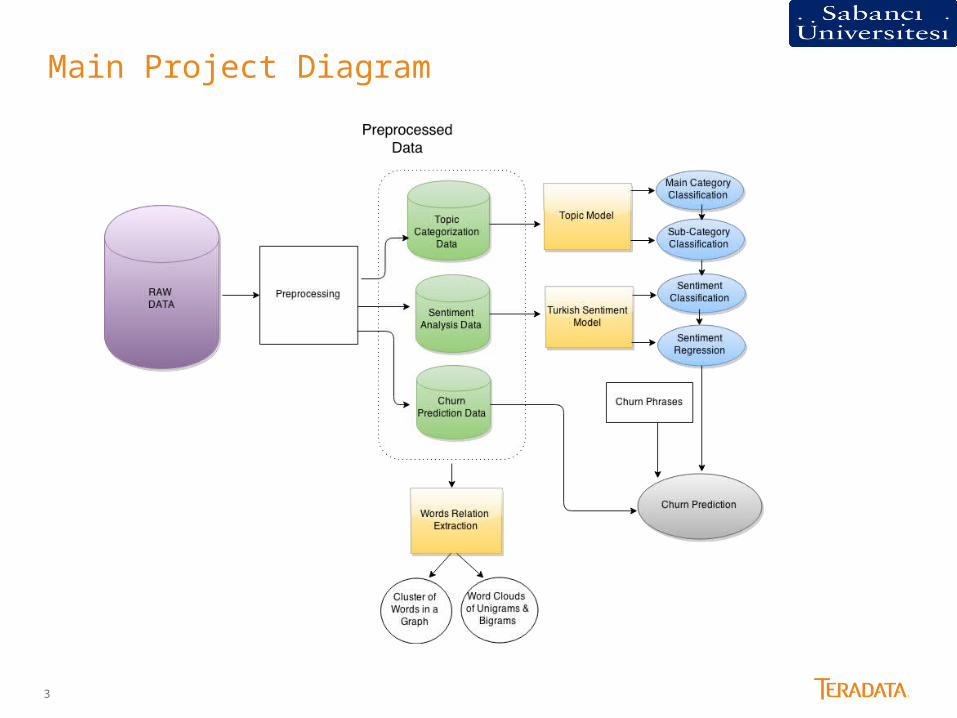
Main Project Diagram

4
#1 Topic Categorization

5
2 Main Categories
Şikayet
Bilgi/İşlem
19 Subcategorie
s
Ürün/Servis
Kampanya/ Paket
.........
Fatura ve Yükleme
Topic Categorization

6
Dimension Reduction◦ Data
◦ High in volume
◦ Noisy
◦ For each category, significant words found (by using Aster tf_idf function)
◦ Project the data into the space of these words:
◦ Decrease the noise
◦ Thus, differentiate the classes better
SAMPLE
Topic Categorization

7
Main Category Classification
We applied Naive Bayes Text Classification
CE660n660l
CE660n660l
CE660n660l
2-class Classification
Correct PredictionIncorrect Prediction
8
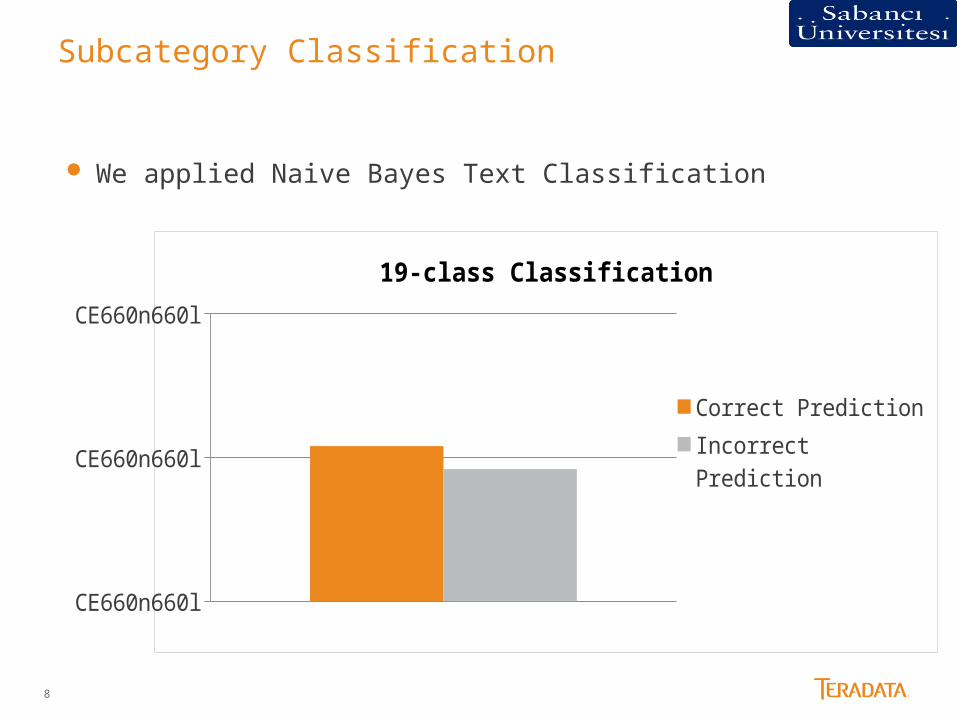
Subcategory Classification
We applied Naive Bayes Text Classification
CE660n660l
CE660n660l
CE660n660l
19-class Classification
Correct PredictionIncorrect Prediction

9
2 Main Categories 19 Subcategories
Topic Categorization

10
#2 Sentiment Analysis

11
Sentiment Classification Model
• Whole dataset is randomly splitted as train and test sets• The model is unbiasedly evaluated on the unseen test set• Aster’s Random Forest Function is available to apply to our Turkish Sentiment Features.
12
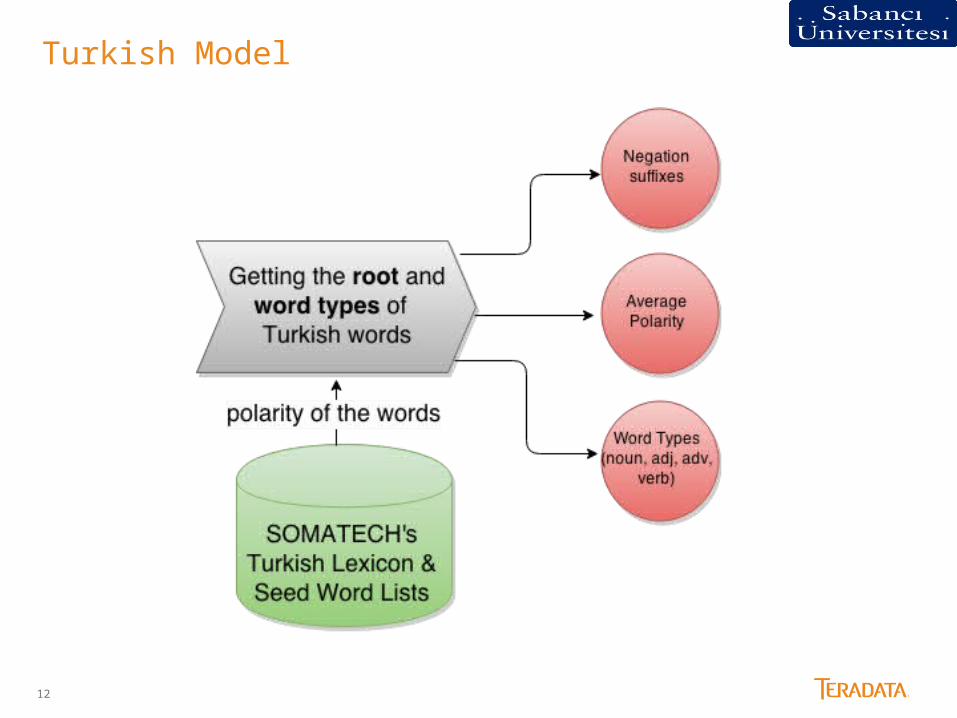
Turkish Model
13
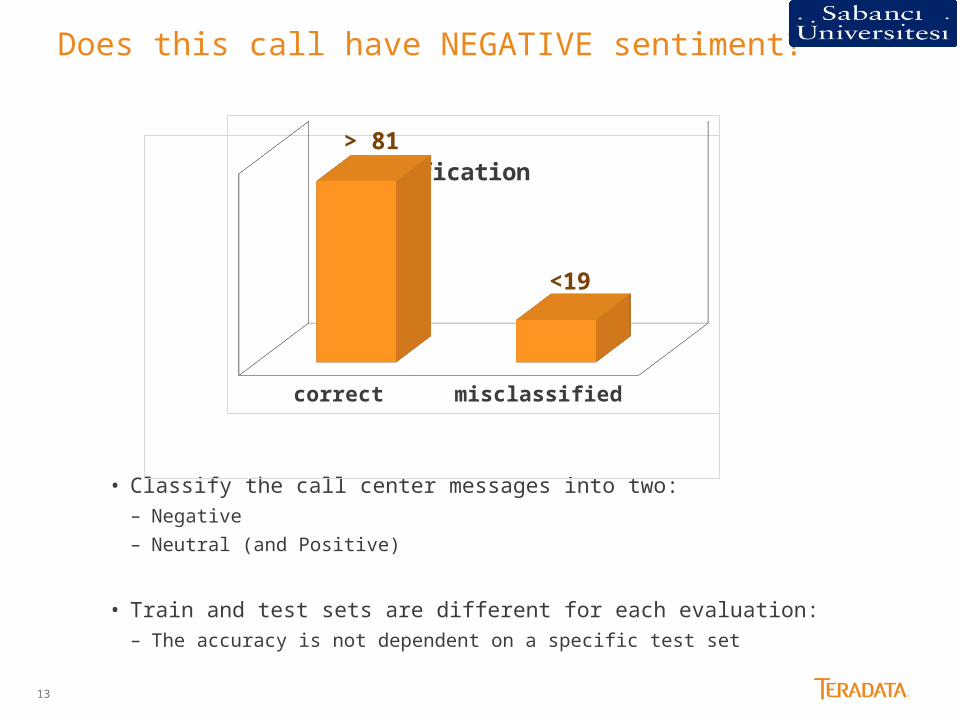
Does this call have NEGATIVE sentiment?
• Classify the call center messages into two:– Negative
– Neutral (and Positive)
• Train and test sets are different for each evaluation:– The accuracy is not dependent on a specific test set
Classification
correct misclassified
> 81
<19

14
Regression Model
• Same dataset used for the sentiment classification
• Output is different; not classes, but real values
• These values scale the negativity of the customers
15
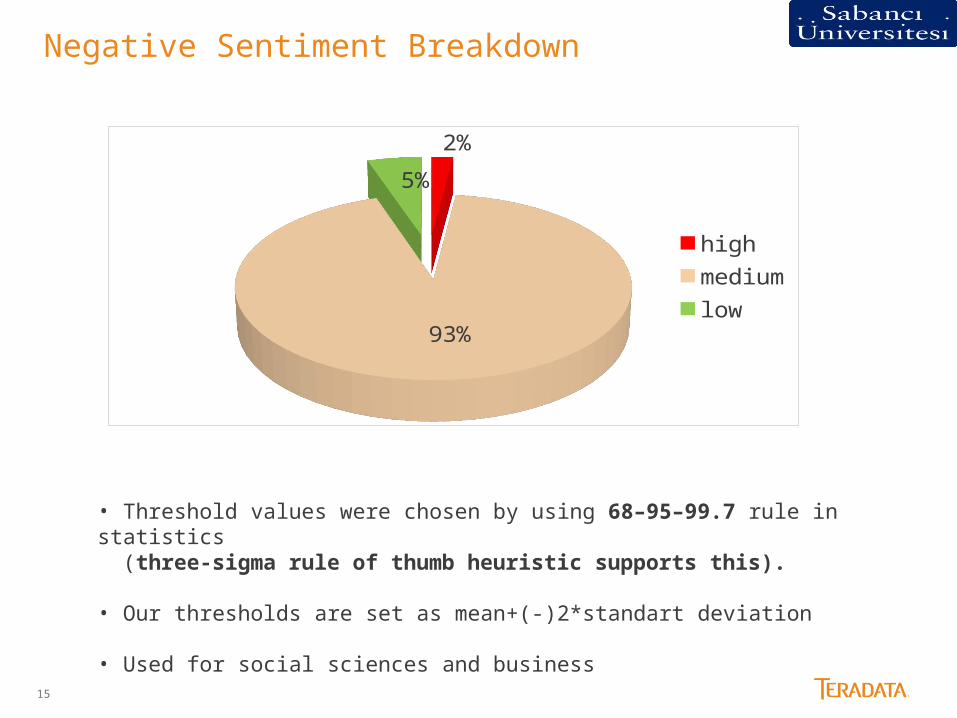
Negative Sentiment Breakdown
2%
93%
5%
highmediumlow
• Threshold values were chosen by using 68–95–99.7 rule in statistics (three-sigma rule of thumb heuristic supports this).
• Our thresholds are set as mean+(-)2*standart deviation
• Used for social sciences and business

16
#3 Relation Extraction

17
Relations between Words
• Relation scores are calculated between words
• It is based on confidence values.– Score(a,b) = confidence(a,b)*confidence(b*a)
Words were filtered:– We selected the words with the highest tf*idf values
Words are clustered in terms of their relations
Clusters are represented in a graph Cfilter (in Aster)function has been applied for this process.

18
Complaining Customers Graph
Selected Cluster

19
Closer Look to the Cluster
The cluster seems to indicate the customers facing internet-related problems
• Connection problem, or• Internet package is not sufficient?
20
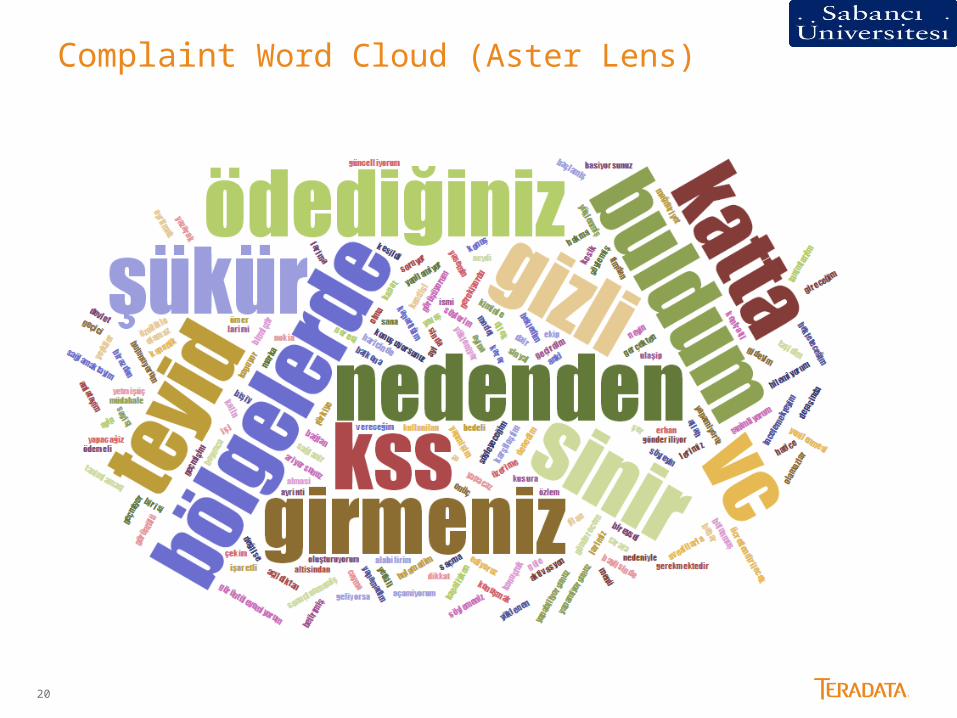
Complaint Word Cloud (Aster Lens)
21
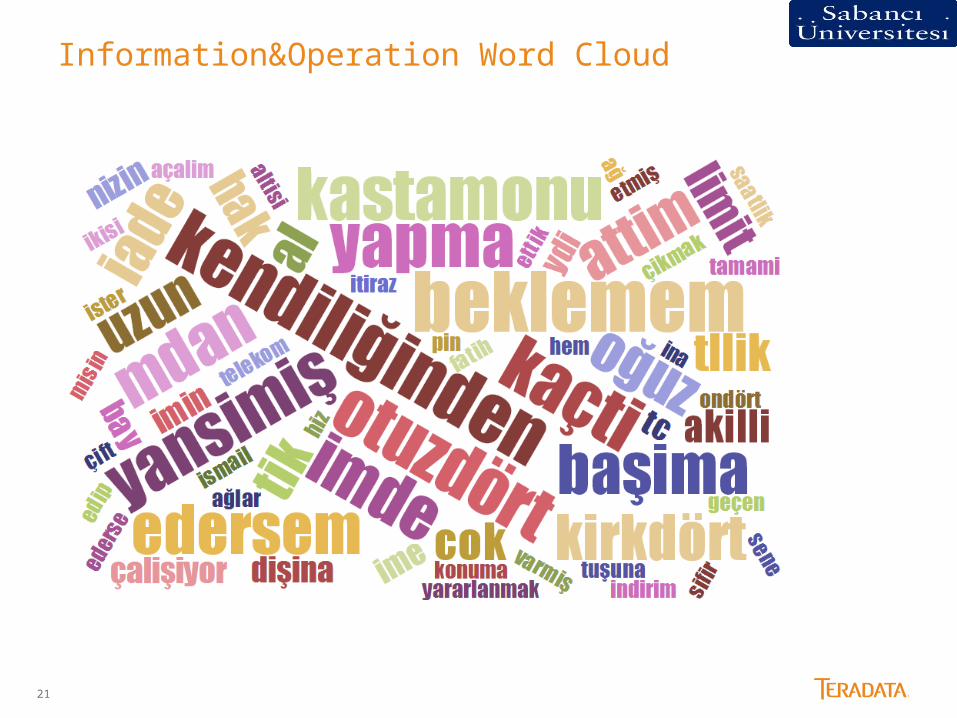
Information&Operation Word Cloud
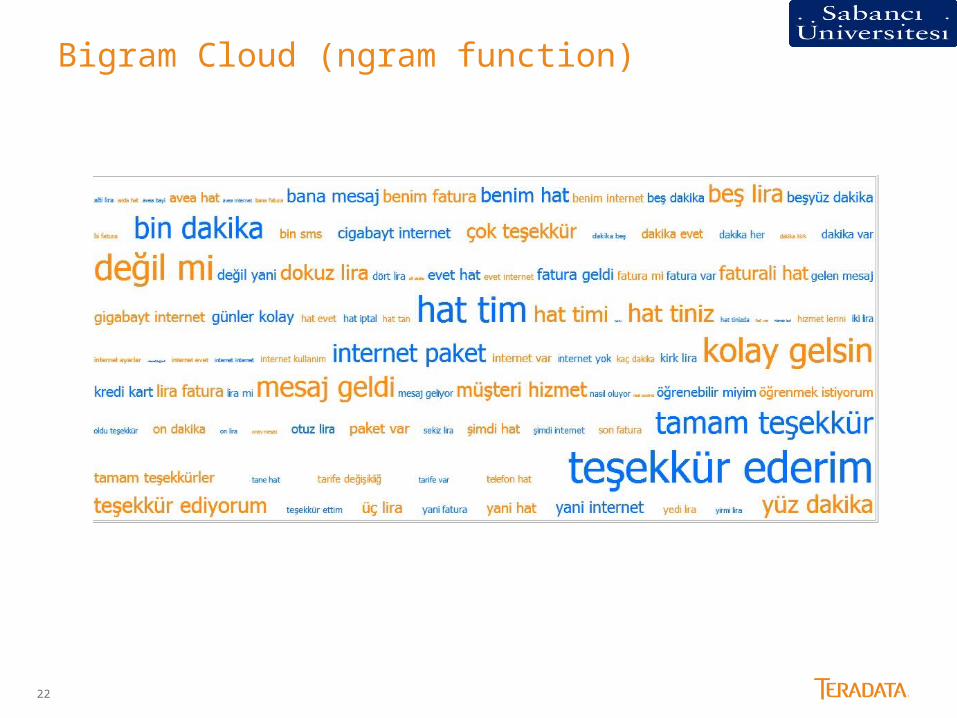
22
Bigram Cloud (ngram function)
23
#4 Association Rules between Events

24
Association Rule Mining
Topic A with a Sentiment score
Topic B with a Sentiment score
Topic C
Confidence(A, B --> C)
25
QUESTIONS


