60

Appendix L
Risk Characterization Results

Appendix L - Risk Characterization Figures
(This text represents the "See additional information on the following page" referred to by each figure)
Key Risk Assumptions and Limitations When using the risk characterization figures, readers should keep in mind that the risk estimates are subject to numerous uncertainties. The risk characterization incorporates all uncertainties associated with the NTI, the dispersion modeling with ASPEN, and the exposure modeling using HAPEM4 that have been described elsewhere. In addition, this section describes further assumptions and limitations within the risk characterization. It is important to understand that the information presented here consists of risk estimates rather than measured risks (such as analyses of the frequency of airplane crashes). These risk estimates are surrounded by substantial uncertainties that arise from a variety of sources, and they should not be confused with actuarial risk data (such as age-mortality tables used by the insurance industry). These uncertainties were addressed by specific assumptions (described in Section 5.4) within the assessment, and this process has created limitations on how the data should be interpreted and used. The following section provides a listing of the major sources of uncertainty in the risk characterization, assumptions that EPA has used to address them, and the limitations thus created. The section also describes specific limitations in the scope of the assessment that were imposed by resource restrictions or by the current state of the science.
All effects 1. Risk estimates were based on 1996 information used to represent a continuous future lifetime
of exposure. Significant emission reductions have occurred since 1996, and more are expected in the future. These reductions were not accounted for in developing lifetime risk estimates.
2. This assessment included only 32 chemicals of the full list of 188 air toxics plus diesel
particulate matter. Although EPA believes that these pollutants are among the most likely to present important health risks, it is possible that other important substances were overlooked.
3. Risk estimates were based on exposure concentrations for the median individual within each
census tract. Some individuals may have substantially different behavior patterns that may cause them to receive exposures that are greater or less. For example, people who spend more time outdoors may have had higher exposures to some pollutants. People who commute may have been exposed to concentrations that varied from those where they live.
4. National-scale bar charts of risk extend only to the 99th percentile in order to avoid
presenting potentially misleading outliers. However, it is important to realize that approximately 2.5 million people resided in areas where estimated exposures were higher than the 99th percentile.
5. EPA's comparison of ASPEN concentration estimates with measured air quality data
suggested that ASPEN may have under-predicted concentrations for some air toxics. This may have resulted in risk estimates that were too low.
6. Risk estimates included only inhalation exposure from modeled outdoor sources of air toxics.
EPA did not consider oral exposures or uptake through the skin. Therefore, these estimates do not account for the full risks posed by certain biocumulative pollutants (e.g., mercury, PCBs, and dioxin).

7. Risk estimates did not include emission sources not in the NTI (e.g., indoor sources), because
appropriate modeling tools and data are not yet available to include them. This may have resulted in underestimates of risks associated with common indoor air pollutants such as formaldehyde and perchloroethylene.
Carcinogens 1. EPA assumed risks associated with different carcinogenic substances were additive in the
absence of evidence suggesting otherwise. To avoid combining information with widely divergent levels of uncertainty, EPA separately aggregated Class A (known) carcinogens and Class B and C (probable and possible) carcinogens.
2. EPA based risk calculations on upper-bound estimates of carcinogenic potency for each
substance. The true potency of each substance is likely to be less, and unlikely to be greater. These upper-bound potency estimates were combined with median exposure estimates. The correct way to read the results is, "The estimated upper-bound cancer risk to an individual with the median exposure in different census tracts. The true risk is likely to be less, but may be greater."
3. Cancer risk estimates were based on whole -life exposure estimates developed by combining
median exposures for each separate age group and pro-rating by the number of years in that group. HAPEM4 systematically produced exposure estimates for children that were lower than for adults in the same area, raising the possibility that exposures, and risks, may have been underestimated for some children.
Non-carcinogens 1. EPA expressed non-cancer hazard associated with individual substances in terms of the
Hazard Quotient (HQ), the ratio between estimated inhalation exposure and the reference concentration. The HQ (1) cannot be translated to a probability that adverse effects will occur, and (2) is unlikely to be proportional to risk. It is especially important to note that an HQ exceeding 1 does not necessarily mean that adverse effects will occur.
2. EPA calculated the aggregate non-cancer hazard for multiple substances in terms of the Target Organ Specific Hazard Index (TOSHI), the sum of HQs for individual air toxics that affect the same organ or organ system. EPA selected the respiratory system, blood, central nervous system, liver/kidney, cardiovascular system, and immune system as target organs on the basis of toxic effects reported for the particular air toxics that were assessed. HQs for multiple pollutants acting on each of these organs were assumed to be additive.
3. EPA's dose-response assessments for non-cancer effects were based on the adverse effect
appearing at the lowest dose (called the "critical effect"). However, many air toxics cause other effects in addition to the critical effect, though usually at higher exposures. This assessment has assumed that adverse effects to any organ systems impacted by a substance occurred at the same exposure as the critical effect. This assumption was protective, and may have resulted in some overestimated TOSHIs.
4. HQ and TOSHI were estimated separately for adults and children. HAPEM4 systematically
produced exposure estimates for children that were lower than for adults in the same area, raising the possibility that exposures, and non-cancer hazards, may have been underestimated for some children.

1996 Risk CharacterizationDistribution of lifetime cancer risk for the US population,
based on 1996 exposure* to major sources.
0.001 0.01 0.1 1 10 100
Arsenic
Benzene
Chromium
Coke Oven Emissions
Nickel
Vinyl Chloride
Acetaldehyde
Acrylonitrile
Beryllium
1,3-Butadiene
Cadmium
Carbon Tetrachloride
Chloroform
1,3-Dichloropropene
Ethylene Dibromide
Ethylene Dichloride
Ethylene Oxide
Formaldehyde
Hexachlorobenzene
Hydrazine
Lead
Methylene Chloride
PCBs
POM (total)
POM (7-PAH)
Propylene Dichloride
Quinoline
1,1,2,2-Tetrachloroethane
Perchloroethylene
Trichloroethylene
Kno
wn
Car
cino
gens
Pro
babl
e or
Pos
sibl
e C
arci
noge
ns
Upper-Bound Lifetime Cancer Risk per Million
.
5 25 50 75 95 99Population Percentile
* Results are based on inhalation exposure to outdoor sources only. Although these results assume continuous exposure to 1996 levels of air toxics over a lifetime, current and planned control programs are expected to substantially reduce these exposures and associated cancer risk for some pollutants. See additional information on the following page.

1996 Risk CharacterizationDistribution of lifetime cancer risk for the US population,
based on 1996 exposure* to area sources.
0.001 0.01 0.1 1 10 100
Arsenic
Benzene
Chromium
Coke Oven Emissions
Nickel
Vinyl Chloride
Acetaldehyde
Acrylonitrile
Beryllium
1,3-Butadiene
Cadmium
Carbon Tetrachloride
Chloroform
1,3-Dichloropropene
Ethylene Dibromide
Ethylene Dichloride
Ethylene Oxide
Formaldehyde
Hexachlorobenzene
Hydrazine
Lead
Methylene Chloride
PCBs
POM (total)
POM (7-PAH)
Propylene Dichloride
Quinoline
1,1,2,2-Tetrachloroethane
Perchloroethylene
Trichloroethylene
Kno
wn
Car
cino
gens
Pro
babl
e or
Pos
sibl
e C
arci
noge
ns
Upper-Bound Lifetime Cancer Risk per Million
5 25 50 75 95 99Population Percentile
* Results are based on inhalation exposure to outdoor sources only. Although these results assume continuous exposure to 1996 levels of air toxics over a lifetime, current and planned control programs are expected to substantially reduce these exposures and associated cancer risk for some pollutants. See additional information on the following page.

1996 Risk CharacterizationDistribution of lifetime cancer risk for the US population,
based on 1996 exposure* to on-road mobile sources.
0.001 0.01 0.1 1 10 100
Arsenic
Benzene
Chromium
Coke Oven Emissions
Nickel
Vinyl Chloride
Acetaldehyde
Acrylonitrile
Beryllium
1,3-Butadiene
Cadmium
Carbon Tetrachloride
Chloroform
1,3-Dichloropropene
Ethylene Dibromide
Ethylene Dichloride
Ethylene Oxide
Formaldehyde
Hexachlorobenzene
Hydrazine
Lead
Methylene Chloride
PCBs
POM (total)
POM (7-PAH)
Propylene Dichloride
Quinoline
1,1,2,2-Tetrachloroethane
Perchloroethylene
Trichloroethylene
Kno
wn
Car
cino
gens
Pro
babl
e or
Pos
sibl
e C
arci
noge
ns
Upper-Bound Lifetime Cancer Risk per Million
5 25 50 75 95 99Population Percentile
* Results are based on inhalation exposure to outdoor sources only. Although these results assume continuous exposure to 1996 levels of air toxics over a lifetime, current and planned control programs are expected to substantially reduce these exposures and associated cancer risk for some pollutants. See additional information on the following page.

1996 Risk CharacterizationDistribution of lifetime cancer risk for the US population, based on 1996 exposure* to mobile non-road sources.
0.001 0.01 0.1 1 10 100
Arsenic
Benzene
Chromium
Coke Oven Emissions
Nickel
Vinyl Chloride
Acetaldehyde
Acrylonitrile
Beryllium
1,3-Butadiene
Cadmium
Carbon Tetrachloride
Chloroform
1,3-Dichloropropene
Ethylene Dibromide
Ethylene Dichloride
Ethylene Oxide
Formaldehyde
Hexachlorobenzene
Hydrazine
Lead
Methylene Chloride
PCBs
POM (total)
POM (7-PAH)
Propylene Dichloride
Quinoline
1,1,2,2-Tetrachloroethane
Perchloroethylene
Trichloroethylene
Kno
wn
Car
cino
gens
Pro
babl
e or
Pos
sibl
e C
arci
noge
ns
Upper-Bound Lifetime Cancer Risk per Million
* Results are based on inhalation exposure to outdoor sources only. Although these results assume continuous exposure to 1996 levels of air toxics over a lifetime, current and planned control programs are expected to substantially reduce these exposures and associated cancer risk for some pollutants. See additional information on the following page.
5 25 50 75 95 99Population Percentile

1996 Risk CharacterizationDistribution of lifetime cancer risk for the US population,
based on 1996 exposure* to background sources.
0.001 0.01 0.1 1 10 100
Arsenic
Benzene
Chromium
Coke Oven Emissions
Nickel
Vinyl Chloride
Acetaldehyde
Acrylonitrile
Beryllium
1,3-Butadiene
Cadmium
Carbon Tetrachloride
Chloroform
1,3-Dichloropropene
Ethylene Dibromide
Ethylene Dichloride
Ethylene Oxide
Formaldehyde
Hexachlorobenzene
Hydrazine
Lead
Methylene Chloride
PCBs
POM (total)
POM (7-PAH)
Propylene Dichloride
Quinoline
1,1,2,2-Tetrachloroethane
Perchloroethylene
Trichloroethylene
Kno
wn
Car
cino
gens
Pro
babl
e or
Pos
sibl
e C
arci
noge
ns
Upper-Bound Lifetime Cancer Risk per Million
* Results are based on inhalation exposure to outdoor sources only. Although these results assume continuous exposure to 1996 levels of air toxics over a lifetime, current and planned control programs are expected to substantially reduce these exposures and associated cancer risk for some pollutants. See additional information on the following page.
5 25 50 75 95 99Population Percentile

1996 Risk CharacterizationDistribution of lifetime cancer risk for the US population, based on 1996
exposure* to all source sectors and background combined.
0.001 0.01 0.1 1 10 100
Arsenic
Benzene
Chromium
Coke Oven Emissions
Nickel
Vinyl Chloride
Acetaldehyde
Acrylonitrile
Beryllium
1,3-Butadiene
Cadmium
Carbon Tetrachloride
Chloroform
1,3-Dichloropropene
Ethylene Dibromide
Ethylene Dichloride
Ethylene Oxide
Formaldehyde
Hexachlorobenzene
Hydrazine
Lead
Methylene Chloride
PCBs
POM (total)
POM (7-PAH)
Propylene Dichloride
Quinoline
1,1,2,2-Tetrachloroethane
Perchloroethylene
Trichloroethylene
Kno
wn
Car
cino
gens
Pro
babl
e or
Pos
sibl
e C
arci
noge
ns
Upper-Bound Lifetime Cancer Risk per Million
5 25 50 75 95 99Population Percentile
* Results are based on inhalation exposure to outdoor sources only. Although these results assume continuous exposure to 1996 levels of air toxics over a lifetime, current and planned control programs are expected to substantially reduce these exposures and associated cancer risk for some pollutants. See additional information on the following page.

1996 Risk CharacterizationDistribution of non-cancer hazard quotient for the US population, based on
1996 exposure* to major sources.
0.00001 0.0001 0.001 0.01 0.1 1 10
Benzene
Beryllium
Cadmium
Chloroform
Chromium
1,3-Dichloropropene
Ethylene Dibromide
Ethylene Dichloride
Ethylene Oxide
Formaldehyde
Hexachlorobenzene
Lead
Mercury
Methylene Chloride
Nickel
Perchloroethylene
Trichloroethylene
Acetaldehyde
Acrolein
Acrylonitrile
Arsenic
1,3-Butadiene
Carbon Tetrachloride
Hydrazine
Manganese
Propylene Dichloride
Vinyl Chloride
Hig
h C
erta
inty
(U
F 1
-100
)Lo
w C
erta
inty
(U
F>
100)
Hazard Quotient (Exposure/RfC)
* Results are based on inhalation exposure to outdoor sources only. Although these results assume continuous exposure to 1996 levels of air toxics over a lifetime, current and planned control programs are expected to substantially reduce these exposures and associated noncancer HQ for some pollutants. See additional information on the following page.
5 25 50 75 95 99Population Percentile

1996 Risk CharacterizationDistribution of non-cancer hazard quotient for the US population, based on
1996 exposure* to area sources.
0.00001 0.0001 0.001 0.01 0.1 1 10
Benzene
Beryllium
Cadmium
Chloroform
Chromium
1,3-Dichloropropene
Ethylene Dibromide
Ethylene Dichloride
Ethylene Oxide
Formaldehyde
Hexachlorobenzene
Lead
Mercury
Methylene Chloride
Nickel
Perchloroethylene
Trichloroethylene
Acetaldehyde
Acrolein
Acrylonitrile
Arsenic
1,3-Butadiene
Carbon Tetrachloride
Hydrazine
Manganese
Propylene Dichloride
Vinyl Chloride
Hig
h C
erta
inty
(U
F 1
-100
)Lo
w C
erta
inty
(U
F>
100)
Hazard Quotient (Exposure/RfC)
* Results are based on inhalation exposure to outdoor sources only. Although these results assume continuous exposure to 1996 levels of air toxics over a lifetime, current and planned control programs are expected to substantially
5 25 50 75 95 99Population Percentile

1996 Risk CharacterizationDistribution of non-cancer hazard quotient for the US population, based on
1996 exposure* to mobile on-road sources.
0.00001 0.0001 0.001 0.01 0.1 1 10
Benzene
Beryllium
Cadmium
Chloroform
Chromium
1,3-Dichloropropene
Ethylene Dibromide
Ethylene Dichloride
Ethylene Oxide
Formaldehyde
Hexachlorobenzene
Lead
Mercury
Methylene Chloride
Nickel
Perchloroethylene
Trichloroethylene
Acetaldehyde
Acrolein
Acrylonitrile
Arsenic
1,3-Butadiene
Carbon Tetrachloride
Hydrazine
Manganese
Propylene Dichloride
Vinyl Chloride
Hig
h C
erta
inty
(U
F 1
-100
)Lo
w C
erta
inty
(U
F>
100)
Hazard Quotient (Exposure/RfC)
* Results are based on inhalation exposure to outdoor sources only. Although these results assume continuous exposure to 1996 levels of air toxics over a lifetime, current and planned control programs are expected to substantially
5 25 50 75 95 99Population Percentile

1996 Risk CharacterizationDistribution of non-cancer hazard quotient for the US population, based on
1996 exposure* to mobile non-road sources.
0.00001 0.0001 0.001 0.01 0.1 1 10
Benzene
Beryllium
Cadmium
Chloroform
Chromium
1,3-Dichloropropene
Ethylene Dibromide
Ethylene Dichloride
Ethylene Oxide
Formaldehyde
Hexachlorobenzene
Lead
Mercury
Methylene Chloride
Nickel
Perchloroethylene
Trichloroethylene
Acetaldehyde
Acrolein
Acrylonitrile
Arsenic
1,3-Butadiene
Carbon Tetrachloride
Hydrazine
Manganese
Propylene Dichloride
Vinyl Chloride
Hig
h C
erta
inty
(U
F 1
-100
)Lo
w C
erta
inty
(U
F>
100)
Hazard Quotient (Exposure/RfC)
* Results are based on inhalation exposure to outdoor sources only. Although these results assume continuous exposure to 1996 levels of air toxics over a lifetime, current and planned control programs are expected to substantially
5 25 50 75 95 99Population Percentile

1996 Risk CharacterizationDistribution of non-cancer hazard quotient for the US population, based on
1996 exposure* to background sources.
0.00001 0.0001 0.001 0.01 0.1 1 10
Benzene
Beryllium
Cadmium
Chloroform
Chromium
1,3-Dichloropropene
Ethylene Dibromide
Ethylene Dichloride
Ethylene Oxide
Formaldehyde
Hexachlorobenzene
Lead
Mercury
Methylene Chloride
Nickel
Perchloroethylene
Trichloroethylene
Acetaldehyde
Acrolein
Acrylonitrile
Arsenic
1,3-Butadiene
Carbon Tetrachloride
Hydrazine
Manganese
Propylene Dichloride
Vinyl Chloride
Hig
h C
erta
inty
(U
F 1
-100
)Lo
w C
erta
inty
(U
F>
100)
Hazard Quotient (Exposure/RfC)
* Results are based on inhalation exposure to outdoor sources only. Although these results assume continuous exposure to 1996 levels of air toxics over a lifetime, current and planned control programs are expected to substantially
5 25 50 75 95 99Population Percentile

1996 Risk CharacterizationDistribution of non-cancer hazard quotient for the US population, based on
1996 exposure* to all source sectors and background combined.
0.00001 0.0001 0.001 0.01 0.1 1 10 100
Benzene
Beryllium
Cadmium
Chloroform
Chromium
1,3-Dichloropropene
Ethylene Dibromide
Ethylene Dichloride
Ethylene Oxide
Formaldehyde
Hexachlorobenzene
Lead
Mercury
Methylene Chloride
Nickel
Perchloroethylene
Trichloroethylene
Acetaldehyde
Acrolein
Acrylonitrile
Arsenic
1,3-Butadiene
Carbon Tetrachloride
Hydrazine
Manganese
Propylene Dichloride
Vinyl Chloride
Hig
h C
erta
inty
(U
F 1
-100
)Lo
w C
erta
inty
(U
F>
100)
Hazard Quotient (Exposure/RfC)
* Results are based on inhalation exposure to outdoor sources only. Although these results assume continuous exposure to 1996 levels of air toxics over a lifetime, current and planned control programs are expected to substantially
5 25 50 75 95 99Population Percentile

0.01 0.1 1 10 100 1000
Arsenic
Benzene
Chromium
Coke Oven Emissions
Nickel
Vinyl Chloride
Acetaldehyde
Acrylonitrile
Beryllium
1,3-Butadiene
Cadmium
Carbon Tetrachloride
Chloroform
1,3-Dichloropropene
Ethylene Dibromide
Ethylene Dichloride
Ethylene Oxide
Formaldehyde
Hexachlorobenzene
Hydrazine
Lead
Methylene Chloride
PCBs
POM (total)
POM (7-PAH)
Propylene Dichloride
Quinoline
1,1,2,2-Tetrachloroethane
Perchloroethylene
Trichloroethylene
Kno
wn
Car
cino
gens
Pro
babl
e or
Pos
sibl
e C
arci
noge
ns
Millions of People
* Results are based on inhalation exposure to outdoor sources only. Although these results assume continuous exposure to 1996
levels of air toxics over a lifetime, current and planned control programs are expected to substantially reduce these exposures and associated cancer risk for some pollutants. See additional information on the following page.
> 100 in 1 Million>10 in 1 Million>1 in 1 Million
Tot
al U
S P
opul
atio
n
1996 Risk Characterization Population whose 1996 exposure* exceeded
set cancer risk levels based on major sources.
0.01 0.1 1 10 100 1000
Arsenic
Benzene
Chromium
Coke Oven Emissions
Nickel
Vinyl Chloride
Acetaldehyde
Acrylonitrile
Beryllium
1,3-Butadiene
Cadmium
Carbon Tetrachloride
Chloroform
1,3-Dichloropropene
Ethylene Dibromide
Ethylene Dichloride
Ethylene Oxide
Formaldehyde
Hexachlorobenzene
Hydrazine
Lead
Methylene Chloride
PCBs
POM (total)
POM (7-PAH)
Propylene Dichloride
Quinoline
1,1,2,2-Tetrachloroethane
Perchloroethylene
Trichloroethylene
Kno
wn
Car
cino
gens
Pro
babl
e or
Pos
sibl
e C
arci
noge
ns
Millions of People
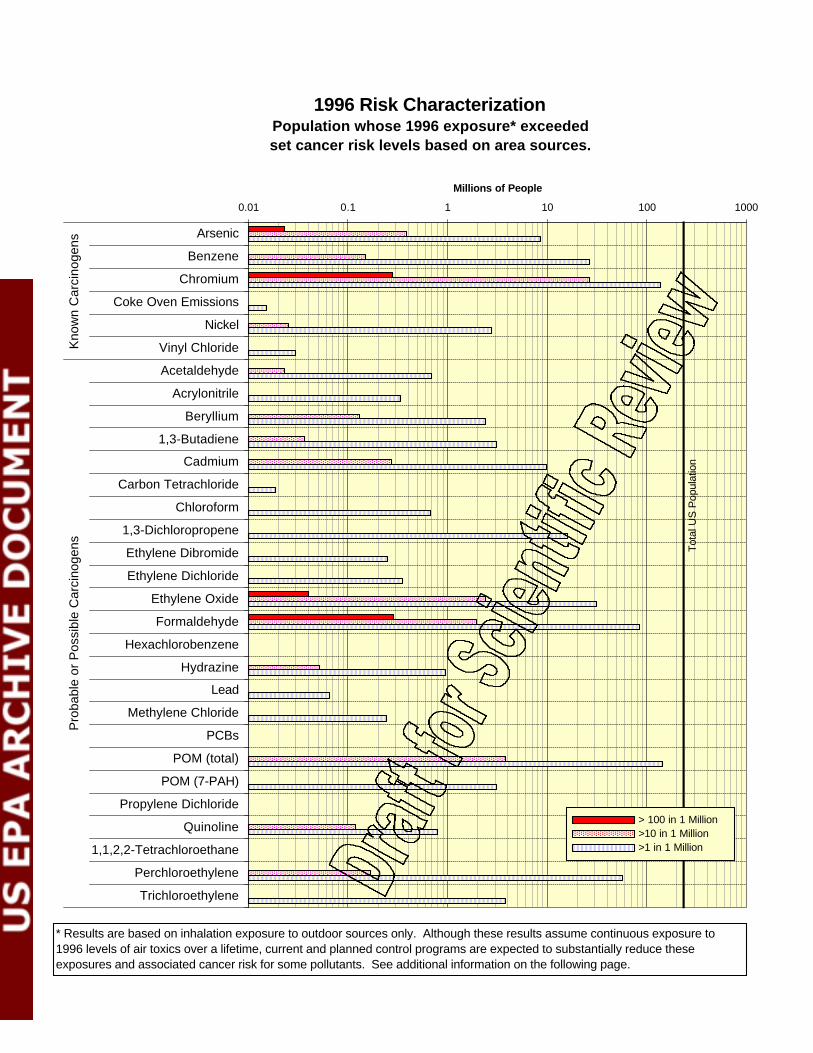
1996 Risk Characterization Population whose 1996 exposure* exceededset cancer risk levels based on area sources.
Tot
al U
S P
opul
atio
n
> 100 in 1 Million>10 in 1 Million>1 in 1 Million
* Results are based on inhalation exposure to outdoor sources only. Although these results assume continuous exposure to 1996 levels of air toxics over a lifetime, current and planned control programs are expected to substantially reduce these exposures and associated cancer risk for some pollutants. See additional information on the following page.

0.01 0.1 1 10 100 1000
Arsenic
Benzene
Chromium
Coke Oven Emissions
Nickel
Vinyl Chloride
Acetaldehyde
Acrylonitrile
Beryllium
1,3-Butadiene
Cadmium
Carbon Tetrachloride
Chloroform
1,3-Dichloropropene
Ethylene Dibromide
Ethylene Dichloride
Ethylene Oxide
Formaldehyde
Hexachlorobenzene
Hydrazine
Lead
Methylene Chloride
PCBs
POM (total)
POM (7-PAH)
Propylene Dichloride
Quinoline
1,1,2,2-Tetrachloroethane
Perchloroethylene
Trichloroethylene
Kno
wn
Car
cino
gens
Pro
babl
e or
Pos
sibl
e C
arci
noge
ns
Millions of People
1996 Risk Characterization Population whose 1996 exposure* exceeded
set cancer risk levels based on on-road mobile sources.
Tot
al U
S P
opul
atio
n
> 100 in 1 Million>10 in 1 Million>1 in 1 Million
* Results are based on inhalation exposure to outdoor sources only. Although these results assume continuous exposure to 1996
levels of air toxics over a lifetime, current and planned control programs are expected to substantially reduce these exposures and associated cancer risk for some pollutants. See additional information on the following page.

0.01 0.1 1 10 100 1000
Arsenic
Benzene
Chromium
Coke Oven Emissions
Nickel
Vinyl Chloride
Acetaldehyde
Acrylonitrile
Beryllium
1,3-Butadiene
Cadmium
Carbon Tetrachloride
Chloroform
1,3-Dichloropropene
Ethylene Dibromide
Ethylene Dichloride
Ethylene Oxide
Formaldehyde
Hexachlorobenzene
Hydrazine
Lead
Methylene Chloride
PCBs
POM (total)
POM (7-PAH)
Propylene Dichloride
Quinoline
1,1,2,2-Tetrachloroethane
Perchloroethylene
Trichloroethylene
Kno
wn
Car
cino
gens
Pro
babl
e or
Pos
sibl
e C
arci
noge
ns
Millions of People
1996 Risk Characterization Population whose 1996 exposure* exceeded
set cancer risk levels based on non-road mobile sources.
Tot
al U
S P
opul
atio
n
> 100 in 1 Million>10 in 1 Million>1 in 1 Million
* Results are based on inhalation exposure to outdoor sources only. Although these results assume continuous exposure to 1996
levels of air toxics over a lifetime, current and planned control programs are expected to substantially reduce these exposures and associated cancer risk for some pollutants. See additional information on the following page.

0.01 0.1 1 10 100 1000
Arsenic
Benzene
Chromium
Coke Oven Emissions
Nickel
Vinyl Chloride
Acetaldehyde
Acrylonitrile
Beryllium
1,3-Butadiene
Cadmium
Carbon Tetrachloride
Chloroform
1,3-Dichloropropene
Ethylene Dibromide
Ethylene Dichloride
Ethylene Oxide
Formaldehyde
Hexachlorobenzene
Hydrazine
Lead
Methylene Chloride
PCBs
POM (total)
POM (7-PAH)
Propylene Dichloride
Quinoline
1,1,2,2-Tetrachloroethane
Perchloroethylene
Trichloroethylene
Kno
wn
Car
cino
gens
Pro
babl
e or
Pos
sibl
e C
arci
noge
ns
Millions of People
Tot
al U
S P
opul
atio
n
1996 Risk Characterization Population whose 1996 exposure* exceeded
set cancer risk levels based on background concentrations.
> 100 in 1 Million>10 in 1 Million>1 in 1 Million
* Results are based on inhalation exposure to outdoor sources only. Although these results assume continuous exposure to 1996
levels of air toxics over a lifetime, current and planned control programs are expected to substantially reduce these exposures and associated cancer risk for some pollutants. See additional information on the following page.

0.01 0.1 1 10 100 1000
Arsenic
Benzene
Chromium
Coke Oven Emissions
Nickel
Vinyl Chloride
Acetaldehyde
Acrylonitrile
Beryllium
1,3-Butadiene
Cadmium
Carbon Tetrachloride
Chloroform
1,3-Dichloropropene
Ethylene Dibromide
Ethylene Dichloride
Ethylene Oxide
Formaldehyde
Hexachlorobenzene
Hydrazine
Lead
Methylene Chloride
PCBs
POM (total)
POM (7-PAH)
Propylene Dichloride
Quinoline
1,1,2,2-Tetrachloroethane
Perchloroethylene
Trichloroethylene
Kno
wn
Car
cino
gens
Pro
babl
e or
Pos
sibl
e C
arci
noge
ns
Millions of People
Tot
al U
S P
opul
atio
n
> 100 in 1 Million>10 in 1 Million>1 in 1 Million
1996 Risk Characterization Population whose 1996 exposure* exceeded set
cancer risk levels based on all source sectors and background.
* Results are based on inhalation exposure to outdoor sources only. Although these results assume continuous exposure to 1996
levels of air toxics over a lifetime, current and planned control programs are expected to substantially reduce these exposures and associated cancer risk for some pollutants. See additional information on the following page.

0.01 0.1 1 10 100 1000
Benzene
Beryllium
Cadmium
Chloroform
Chromium
1,3-Dichloropropene
Ethylene Dibromide
Ethylene Dichloride
Ethylene Oxide
Formaldehyde
Hexachlorobenzene
Lead
Mercury
Methylene Chloride
Nickel
Perchloroethylene
Trichloroethylene
Acetaldehyde
Acrolein
Acrylonitrile
Arsenic
1,3-Butadiene
Carbon Tetrachloride
Hydrazine
Manganese
Propylene Dichloride
Vinyl Chloride
Hig
h C
erta
inty
(U
F 1
-100
)Lo
w C
erta
inty
(U
F>
100)
Millions of Adults
1996 Risk Characterization Adult population whose 1996 exposure* exceeded set hazard quotient levels based on major sources.
* Results are based on inhalation exposure to outdoor sources only. Although these results assume continuous exposure to 1996
levels of air toxics over a lifetime, current and planned control programs are expected to substantially reduce these exposures and associated noncancer HQ for some pollutants. See additional information on the following page.
Tot
al U
S A
dult
Pop
ulat
ion
HQ > 10HQ > 1HQ > 0.1

0.01 0.1 1 10 100 1000
Benzene
Beryllium
Cadmium
Chloroform
Chromium
1,3-Dichloropropene
Ethylene Dibromide
Ethylene Dichloride
Ethylene Oxide
Formaldehyde
Hexachlorobenzene
Lead
Mercury
Methylene Chloride
Nickel
Perchloroethylene
Trichloroethylene
Acetaldehyde
Acrolein
Acrylonitrile
Arsenic
1,3-Butadiene
Carbon Tetrachloride
Hydrazine
Manganese
Propylene Dichloride
Vinyl Chloride
Hig
h C
erta
inty
(U
F 1
-100
)Lo
w C
erta
inty
(U
F>
100)
Millions of Adults
1996 Risk Characterization Adult population whose 1996 exposure* exceeded set hazard quotient levels based on area sources.
* Results are based on inhalation exposure to outdoor sources only. Although these results assume continuous exposure to 1996
levels of air toxics over a lifetime, current and planned control programs are expected to substantially reduce these exposures and associated noncancer HQ for some pollutants. See additional information on the following page.
Tot
al U
S A
dult
Pop
ulat
ion
HQ > 10HQ > 1HQ > 0.1

0.01 0.1 1 10 100 1000
Benzene
Beryllium
Cadmium
Chloroform
Chromium
1,3-Dichloropropene
Ethylene Dibromide
Ethylene Dichloride
Ethylene Oxide
Formaldehyde
Hexachlorobenzene
Lead
Mercury
Methylene Chloride
Nickel
Perchloroethylene
Trichloroethylene
Acetaldehyde
Acrolein
Acrylonitrile
Arsenic
1,3-Butadiene
Carbon Tetrachloride
Hydrazine
Manganese
Propylene Dichloride
Vinyl Chloride
Hig
h C
erta
inty
(U
F 1
-100
)Lo
w C
erta
inty
(U
F>
100)
Millions of Adults
1996 Risk Characterization Adult population whose 1996 exposure* exceeded
set hazard quotient levels based on on-road mobile sources.
* Results are based on inhalation exposure to outdoor sources only. Although these results assume continuous exposure to 1996
levels of air toxics over a lifetime, current and planned control programs are expected to substantially reduce these exposures and associated noncancer HQ for some pollutants. See additional information on the following page.
Tot
al U
S A
dult
Pop
ulat
ion
HQ > 10HQ > 1HQ > 0.1

0.01 0.1 1 10 100 1000
Benzene
Beryllium
Cadmium
Chloroform
Chromium
1,3-Dichloropropene
Ethylene Dibromide
Ethylene Dichloride
Ethylene Oxide
Formaldehyde
Hexachlorobenzene
Lead
Mercury
Methylene Chloride
Nickel
Perchloroethylene
Trichloroethylene
Acetaldehyde
Acrolein
Acrylonitrile
Arsenic
1,3-Butadiene
Carbon Tetrachloride
Hydrazine
Manganese
Propylene Dichloride
Vinyl Chloride
Hig
h C
erta
inty
(U
F 1
-100
)Lo
w C
erta
inty
(U
F>
100)
Millions of Adults
1996 Risk Characterization Adult population whose 1996 exposure* exceeded
set hazard quotient levels based on non-road mobile sources.
* Results are based on inhalation exposure to outdoor sources only. Although these results assume continuous exposure to 1996
levels of air toxics over a lifetime, current and planned control programs are expected to substantially reduce these exposures and associated noncancer HQ for some pollutants. See additional information on the following page.
Tot
al U
S A
dult
Pop
ulat
ion
HQ > 10HQ > 1HQ > 0.1

0.01 0.1 1 10 100 1000
Benzene
Beryllium
Cadmium
Chloroform
Chromium
1,3-Dichloropropene
Ethylene Dibromide
Ethylene Dichloride
Ethylene Oxide
Formaldehyde
Hexachlorobenzene
Lead
Mercury
Methylene Chloride
Nickel
Perchloroethylene
Trichloroethylene
Acetaldehyde
Acrolein
Acrylonitrile
Arsenic
1,3-Butadiene
Carbon Tetrachloride
Hydrazine
Manganese
Propylene Dichloride
Vinyl Chloride
Hig
h C
erta
inty
(U
F 1
-100
)Lo
w C
erta
inty
(U
F>
100)
Millions of Adults
1996 Risk Characterization Adult population whose 1996 exposure* exceeded
set hazard quotient levels based on background concentrations.
* Results are based on inhalation exposure to outdoor sources only. Although these results assume continuous exposure to 1996
levels of air toxics over a lifetime, current and planned control programs are expected to substantially reduce these exposures and associated noncancer HQ for some pollutants. See additional information on the following page.
Tot
al U
S A
dult
Pop
ulat
ion
HQ > 10HQ > 1HQ > 0.1

0.01 0.1 1 10 100 1000
Benzene
Beryllium
Cadmium
Chloroform
Chromium
1,3-Dichloropropene
Ethylene Dibromide
Ethylene Dichloride
Ethylene Oxide
Formaldehyde
Hexachlorobenzene
Lead
Mercury
Methylene Chloride
Nickel
Perchloroethylene
Trichloroethylene
Acetaldehyde
Acrolein
Acrylonitrile
Arsenic
1,3-Butadiene
Carbon Tetrachloride
Hydrazine
Manganese
Propylene Dichloride
Vinyl Chloride
Hig
h C
erta
inty
(U
F 1-
100)
Low
Cer
tain
ty (
UF
>100
)
Millions of Adults
Tot
al U
S A
dult
Pop
ulat
ion
* Results are based on inhalation exposure to outdoor sources only. Although these results assume continuous exposure to 1996
levels of air toxics over a lifetime, current and planned control programs are expected to substantially reduce these exposures and associated noncancer HQ for some pollutants. See additional information on the following page.
1996 Risk Characterization Adult population whose 1996 exposure* exceeded set non-cancer
hazard quotient levels based on all source sectors and background combined.
HQ > 10HQ > 1HQ > 0.1

0.01 0.1 1 10 100 1000
Benzene
Beryllium
Cadmium
Chloroform
Chromium
1,3-Dichloropropene
Ethylene Dibromide
Ethylene Dichloride
Ethylene Oxide
Formaldehyde
Hexachlorobenzene
Lead
Mercury
Methylene Chloride
Nickel
Perchloroethylene
Trichloroethylene
Acetaldehyde
Acrolein
Acrylonitrile
Arsenic
1,3-Butadiene
Carbon Tetrachloride
Hydrazine
Manganese
Propylene Dichloride
Vinyl Chloride
Hig
h C
erta
inty
(U
F 1
-100
)Lo
w C
erta
inty
(U
F>
100)
Millions of Children
1996 Risk Characterization Children population whose 1996 exposure* exceeded
set hazard quotient levels based on major sources.
HQ > 10HQ > 1HQ > 0.1
* Results are based on inhalation exposure to outdoor sources only. Although these results assume continuous exposure to 1996
levels of air toxics over a lifetime, current and planned control programs are expected to substantially reduce these exposures and associated noncancer HQ for some pollutants. See additional information on the following page.
Tot
al U
S C
hild
ren
Pop
ulat
ion

0.01 0.1 1 10 100 1000
Benzene
Beryllium
Cadmium
Chloroform
Chromium
1,3-Dichloropropene
Ethylene Dibromide
Ethylene Dichloride
Ethylene Oxide
Formaldehyde
Hexachlorobenzene
Lead
Mercury
Methylene Chloride
Nickel
Perchloroethylene
Trichloroethylene
Acetaldehyde
Acrolein
Acrylonitrile
Arsenic
1,3-Butadiene
Carbon Tetrachloride
Hydrazine
Manganese
Propylene Dichloride
Vinyl Chloride
Hig
h C
erta
inty
(U
F 1
-100
)Lo
w C
erta
inty
(U
F>
100)
Millions of Children
1996 Risk Characterization Children population whose 1996 exposure* exceeded
set hazard quotient levels based on area sources.
HQ > 10HQ > 1HQ > 0.1
* Results are based on inhalation exposure to outdoor sources only. Although these results assume continuous exposure to 1996 levels of air
toxics over a lifetime, current and planned control programs are expected to substantially reduce these exposures and associated noncancer HQ for some pollutants. See additional information on the following page.
Tot
al U
S C
hild
ren
Pop
ulat
ion

0.01 0.1 1 10 100 1000
Benzene
Beryllium
Cadmium
Chloroform
Chromium
1,3-Dichloropropene
Ethylene Dibromide
Ethylene Dichloride
Ethylene Oxide
Formaldehyde
Hexachlorobenzene
Lead
Mercury
Methylene Chloride
Nickel
Perchloroethylene
Trichloroethylene
Acetaldehyde
Acrolein
Acrylonitrile
Arsenic
1,3-Butadiene
Carbon Tetrachloride
Hydrazine
Manganese
Propylene Dichloride
Vinyl Chloride
Hig
h C
erta
inty
(U
F 1
-100
)Lo
w C
erta
inty
(U
F>
100)
Millions of Children
1996 Risk Characterization Children population whose 1996 exposure* exceeded
set hazard quotient levels based on on-road mobile sources.
HQ > 10HQ > 1HQ > 0.1
* Results are based on inhalation exposure to outdoor sources only. Although these results assume continuous exposure to 1996 levels of air
toxics over a lifetime, current and planned control programs are expected to substantially reduce these exposures and associated noncancer HQ for some pollutants. See additional information on the following page.
Tot
al U
S C
hild
ren
Pop
ulat
ion

0.01 0.1 1 10 100 1000
Benzene
Beryllium
Cadmium
Chloroform
Chromium
1,3-Dichloropropene
Ethylene Dibromide
Ethylene Dichloride
Ethylene Oxide
Formaldehyde
Hexachlorobenzene
Lead
Mercury
Methylene Chloride
Nickel
Perchloroethylene
Trichloroethylene
Acetaldehyde
Acrolein
Acrylonitrile
Arsenic
1,3-Butadiene
Carbon Tetrachloride
Hydrazine
Manganese
Propylene Dichloride
Vinyl Chloride
Hig
h C
erta
inty
(U
F 1
-100
)Lo
w C
erta
inty
(U
F>
100)
Millions of Children
1996 Risk Characterization Children population whose 1996 exposure* exceeded
set hazard quotient levels based on non-road mobile sources.
* Results are based on inhalation exposure to outdoor sources only. Although these results assume continuous exposure to 1996 levels of air
toxics over a lifetime, current and planned control programs are expected to substantially reduce these exposures and associated noncancer HQ for some pollutants. See additional information on the following page.
Tot
al U
S C
hild
ren
Pop
ulat
ion
HQ > 10HQ > 1HQ > 0.1

0.01 0.1 1 10 100 1000
Benzene
Beryllium
Cadmium
Chloroform
Chromium
1,3-Dichloropropene
Ethylene Dibromide
Ethylene Dichloride
Ethylene Oxide
Formaldehyde
Hexachlorobenzene
Lead
Mercury
Methylene Chloride
Nickel
Perchloroethylene
Trichloroethylene
Acetaldehyde
Acrolein
Acrylonitrile
Arsenic
1,3-Butadiene
Carbon Tetrachloride
Hydrazine
Manganese
Propylene Dichloride
Vinyl Chloride
Hig
h C
erta
inty
(U
F 1
-100
)Lo
w C
erta
inty
(U
F>
100)
Millions of Children
1996 Risk Characterization Children population whose 1996 exposure* exceeded
set hazard quotient levels based on background concentrations.
* Results are based on inhalation exposure to outdoor sources only. Although these results assume continuous exposure to 1996
levels of air toxics over a lifetime, current and planned control programs are expected to substantially reduce these exposures and associated noncancer HQ for some pollutants. See additional information on the following page.
Tot
al U
S C
hild
ren
Pop
ulat
ion
HQ > 10HQ > 1HQ > 0.1

0.01 0.1 1 10 100 1000
Benzene
Beryllium
Cadmium
Chloroform
Chromium
1,3-Dichloropropene
Ethylene Dibromide
Ethylene Dichloride
Ethylene Oxide
Formaldehyde
Hexachlorobenzene
Lead
Mercury
Methylene Chloride
Nickel
Perchloroethylene
Trichloroethylene
Acetaldehyde
Acrolein
Acrylonitrile
Arsenic
1,3-Butadiene
Carbon Tetrachloride
Hydrazine
Manganese
Propylene Dichloride
Vinyl Chloride
Hig
h C
erta
inty
(U
F 1
-100
)Lo
w C
erta
inty
(U
F>
100)
Millions of Children
1996 Risk Characterization Children population whose 1996 exposure* exceeded set non-cancer
hazard quotient levels based on all source sectors and background combined.
* Results are based on inhalation exposure to outdoor sources only. Although these results assume continuous exposure to 1996
levels of air toxics over a lifetime, current and planned control programs are expected to substantially reduce these exposures and associated noncancer HQ for some pollutants. See additional information on the following page.
Tot
al U
S C
hild
ren
Pop
ulat
ion
HQ > 10HQ > 1HQ > 0.1

1996 Risk CharacterizationDistribution of lifetime cancer risk for the US population,
based on 1996 exposure* to multiple carcinogens.
0.001 0.01 0.1 1 10 100
Major
Area
Mobile On-Road
Mobile Non-Road
Background
Total
Major
Area
Mobile On-Road
Mobile Non-Road
Background
Total
Kno
wn
Car
cino
gens
Pro
babl
e or
Pos
sibl
e C
arci
noge
ns
Upper-Bound Lifetime Cancer Risk per Million
5 25 50 75 95 99Population Percentile
* Results are based on inhalation exposure to outdoor sources only. Although these results assume continuous exposure to 1996 levels of air toxics over a lifetime, current and planned control programs are expected to substantially reduce these exposures and associated cancer risk for some pollutants. See additional information on the following page.

0.01 0.1 1 10 100 1000
Major
Area
Mobile On-Road
Mobile Non-Road
Background
Total
Major
Area
Mobile On-Road
Mobile Non-Road
Background
Total
Kno
wn
Car
cino
gens
Pro
babl
e or
Pos
sibl
e C
arci
noge
ns
Millions of People
1996 Risk Characterization Population whose 1996 exposure* exceeded
set risk levels of risk for carcinogens combined.
* Results are based on inhalation exposure to outdoor sources only. Although these results assume continuous exposure to 1996 levels of air
toxics over a lifetime, current and planned control programs are expected to substantially reduce these exposures and associated cancer risk for some pollutants. See additional information on the following page.
Tot
al U
S P
opul
atio
n
> 100 in 1 Million>10 in 1 Million>1 in 1 Million

1996 Risk CharacterizationDistribution of non-cancer target organ-specific hazard index (TOSHI) for
effects to the respiratory system, based on 1996 multiple-pollutant exposure* to adults in the US population.
0.001 0.01 0.1 1 10 100
Major
Area
Mobile On-Road
Mobile Non-Road
Background
Total
Major
Area
Mobile On-Road
Mobile Non-Road
Background
Total
Hig
h C
erta
inty
(U
F 1
-100
)Lo
w C
erta
inty
(U
F>
100)
Hazard Quotient (Exposure/RfC)
* Results are based on inhalation exposure to outdoor sources only. Although these results assume continuous exposure to 1996 levels of air toxics over a lifetime, current and planned control programs are expected to substantially reduce these exposures and associated noncancer HQ for some pollutants. See additional information on the following page.
5 25 50 75 95 99Population Percentile

1996 Risk CharacterizationDistribution of non-cancer target organ-specific hazard index (TOSHI) for effects to the blood and blood-forming tissues, based on 1996 multiple-
pollutant exposure* to adults in the US population.
0.001 0.01 0.1 1 10 100
Major
Area
Mobile On-Road
Mobile Non-Road
Background
Total
Major
Area
Mobile On-Road
Mobile Non-Road
Background
Total
Hig
h C
erta
inty
(U
F 1
-100
)Lo
w C
erta
inty
(U
F>
100)
Hazard Quotient (Exposure/RfC)
* Results are based on inhalation exposure to outdoor sources only. Although these results assume continuous exposure to 1996 levels of air toxics over a lifetime, current and planned control programs are expected to substantially reduce these exposures and associated noncancer HQ for some pollutants. See additional information on the following page.
5 25 50 75 95 99Population Percentile

1996 Risk CharacterizationDistribution of non-cancer target organ-specific hazard index (TOSHI) for effects to the central nervous system, based on 1996 multiple-pollutant
exposure* to adults in the US population.
0.001 0.01 0.1 1 10 100
Major
Area
Mobile On-Road
Mobile Non-Road
Background
Total
Major
Area
Mobile On-Road
Mobile Non-Road
Background
Total
Hig
h C
erta
inty
(U
F 1
-100
)Lo
w C
erta
inty
(U
F>
100)
Hazard Quotient (Exposure/RfC)
* Results are based on inhalation exposure to outdoor sources only. Although these results assume continuous exposure to 1996 levels of air toxics over a lifetime, current and planned control programs are expected to substantially reduce these exposures and associated noncancer HQ for some pollutants. See additional information on the following page.
5 25 50 75 95 99Population Percentile

1996 Risk CharacterizationDistribution of non-cancer target organ-specific hazard index (TOSHI) for
effects to the liver or kidney, based on 1996 multiple-pollutant exposure* to adults in the US population.
0.001 0.01 0.1 1 10 100
Major
Area
Mobile On-Road
Mobile Non-Road
Background
Total
Major
Area
Mobile On-Road
Mobile Non-Road
Background
Total
Hig
h C
erta
inty
(U
F 1
-100
)Lo
w C
erta
inty
(U
F>
100)
Hazard Quotient (Exposure/RfC)
* Results are based on inhalation exposure to outdoor sources only. Although these results assume continuous exposure to 1996 levels of air toxics over a lifetime, current and planned control programs are expected to substantially reduce these exposures and associated noncancer HQ for some pollutants. See additional information on the following page.
5 25 50 75 95 99Population Percentile

1996 Risk CharacterizationDistribution of non-cancer target organ-specific hazard index (TOSHI) for
effects to the cardiovascular system, based on 1996 multiple-pollutant exposure* to adults in the US population.
0.001 0.01 0.1 1 10 100
Major
Area
Mobile On-Road
Mobile Non-Road
Background
Total
Major
Area
Mobile On-Road
Mobile Non-Road
Background
Total
Hig
h C
erta
inty
(U
F 1
-100
)Lo
w C
erta
inty
(U
F>
100)
Hazard Quotient (Exposure/RfC)
* Results are based on inhalation exposure to outdoor sources only. Although these results assume continuous exposure to 1996 levels of air toxics over a lifetime, current and planned control programs are expected to substantially reduce these exposures and associated noncancer HQ for some pollutants. See additional information on the following page.
5 25 50 75 95 99Population Percentile

1996 Risk CharacterizationDistribution of non-cancer target organ-specific hazard index (TOSHI) for
effects to the immune system, based on 1996 multiple-pollutant exposure* to adults in the US population.
0.001 0.01 0.1 1 10 100
Major
Area
Mobile On-Road
Mobile Non-Road
Background
Total
Major
Area
Mobile On-Road
Mobile Non-Road
Background
Total
Hig
h C
erta
inty
(U
F 1
-100
)Lo
w C
erta
inty
(U
F>
100)
Hazard Quotient (Exposure/RfC)
* Results are based on inhalation exposure to outdoor sources only. Although these results assume continuous exposure to 1996 levels of air toxics over a lifetime, current and planned control programs are expected to substantially reduce these exposures and associated noncancer HQ for some pollutants. See additional information on the following page.
5 25 50 75 95 99Population Percentile

0.01 0.1 1 10 100 1000
Major
Area
Mobile On-Road
Mobile Non-Road
Background
Total
Major
Area
Mobile On-Road
Mobile Non-Road
Background
Total
Hig
h C
erta
inty
(U
F 1-
100)
Low
Cer
tain
ty (
UF
>100
)
Millions of Adults
1996 Risk Characterization Adults whose 1996 exposure* exceeded set target organ-specific hazard
index (TOSHI) for effects to the respiratory system, based on 1996 multiple-pollutant exposure*.
Tot
al U
S A
dult
Pop
ulat
ion
TOSHI > 10TOSHI > 1.0TOSHI >
* Results are based on inhalation exposure to outdoor sources only. Although these results assume continuous exposure to 1996 levels of air toxics over a lifetime, current and planned control programs are expected to substantially reduce these exposures and associated noncancer HQ for some pollutants. See additional information on the following page.

0.01 0.1 1 10 100 1000
Major
Area
Mobile On-Road
Mobile Non-Road
Background
Total
Major
Area
Mobile On-Road
Mobile Non-Road
Background
Total
Hig
h C
erta
inty
(U
F 1
-100
)Lo
w C
erta
inty
(U
F>
100)
Millions of Adults
1996 Risk Characterization Adults whose 1996 exposure* exceeded set target organ-specific hazard
index (TOSHI) for effects to the blood and blood-forming tissues, based on 1996 multiple-pollutant exposure*.
TOSHI > 10TOSHI > 1.0TOSHI >
Tot
al U
S A
dult
Pop
ulat
ion
* Results are based on inhalation exposure to outdoor sources only. Although these results assume continuous exposure to 1996 levels of air toxics over a lifetime, current and planned control programs are expected to substantially reduce these exposures and associated noncancer HQ for some pollutants. See additional information on the following page.

0.01 0.1 1 10 100 1000
Major
Area
Mobile On-Road
Mobile Non-Road
Background
Total
Major
Area
Mobile On-Road
Mobile Non-Road
Background
Total
Hig
h C
erta
inty
(U
F 1
-100
)Lo
w C
erta
inty
(U
F>
100)
Millions of Adults
1996 Risk Characterization Adults whose 1996 exposure* exceeded set target organ-specific hazard index (TOSHI) for effects to the central nervous system, based on 1996
multiple-pollutant exposure*.
TOSHI > 10TOSHI > 1.0TOSHI >
Tot
al U
S A
dult
Pop
ulat
ion
* Results are based on inhalation exposure to outdoor sources only. Although these results assume continuous exposure to 1996 levels of air toxics over a lifetime, current and planned control programs are expected to substantially reduce these exposures and associated noncancer HQ for some pollutants. See additional information on the following page.

0.01 0.1 1 10 100 1000
Major
Area
Mobile On-Road
Mobile Non-Road
Background
Total
Major
Area
Mobile On-Road
Mobile Non-Road
Background
Total
Hig
h C
erta
inty
(U
F 1
-100
)Lo
w C
erta
inty
(U
F>
100)
Millions of Adults
1996 Risk Characterization Adults whose 1996 exposure* exceeded set target organ-specific hazard index (TOSHI) for effects to the liver or kidney, based on 1996 multiple-
pollutant exposure*.
TOSHI > 10TOSHI > 1.0TOSHI >
Tot
al U
S A
dult
Pop
ulat
ion
* Results are based on inhalation exposure to outdoor sources only. Although these results assume continuous exposure to 1996 levels of air toxics over a lifetime, current and planned control programs are expected to substantially reduce these exposures and associated noncancer HQ for some pollutants. See additional information on the following page.

0.01 0.1 1 10 100 1000
Major
Area
Mobile On-Road
Mobile Non-Road
Background
Total
Major
Area
Mobile On-Road
Mobile Non-Road
Background
Total
Hig
h C
erta
inty
(U
F 1
-100
)Lo
w C
erta
inty
(U
F>
100)
Millions of Adults
1996 Risk Characterization Adults whose 1996 exposure* exceeded set target organ-specific hazard
index (TOSHI) for effects to the cardiovascular system, based on 1996 multiple-pollutant exposure*.
TOSHI > 10TOSHI > 1.0TOSHI >
Tot
al U
S A
dult
Pop
ulat
ion
* Results are based on inhalation exposure to outdoor sources only. Although these results assume continuous exposure to 1996 levels of air toxics over a lifetime, current and planned control programs are expected to substantially reduce these exposures and associated noncancer HQ for some pollutants. See additional information on the following page.

0.01 0.1 1 10 100 1000
Major
Area
Mobile On-Road
Mobile Non-Road
Background
Total
Major
Area
Mobile On-Road
Mobile Non-Road
Background
Total
Hig
h C
erta
inty
(U
F 1
-100
)Lo
w C
erta
inty
(U
F>
100)
Millions of Adults
1996 Risk Characterization Adults whose 1996 exposure* exceeded set target organ-specific hazard index (TOSHI) for effects to the immune system, based on 1996 multiple-
pollutant exposure*.
TOSHI > 10TOSHI > 1.0TOSHI >
Tot
al U
S A
dult
Pop
ulat
ion
* Results are based on inhalation exposure to outdoor sources only. Although these results assume continuous exposure to 1996 levels of air toxics over a lifetime, current and planned control programs are expected to substantially reduce these exposures and associated noncancer HQ for some pollutants. See additional information on the following page.

1996 Risk CharacterizationDistribution of non-cancer target organ-specific hazard index (TOSHI) for
effects to the respiratory system, based on 1996 multiple-pollutant exposure* to children in the US population.
0.001 0.01 0.1 1 10 100
Major
Area
Mobile On-Road
Mobile Non-Road
Background
Total
Major
Area
Mobile On-Road
Mobile Non-Road
Background
Total
Hig
h C
erta
inty
(U
F 1
-100
)Lo
w C
erta
inty
(U
F>
100)
Hazard Quotient (Exposure/RfC)
* Results are based on inhalation exposure to outdoor sources only. Although these results assume continuous exposure to 1996 levels of air toxics over a lifetime, current and planned control programs are expected to substantially reduce these exposures and associated noncancer HQ for some pollutants. See additional information on the following page.
5 25 50 75 95 99Population Percentile

1996 Risk CharacterizationDistribution of non-cancer target organ-specific hazard index (TOSHI) for effects to the blood and blood-forming tissues, based on 1996 multiple-
pollutant exposure* to children in the US population.
0.001 0.01 0.1 1 10 100
Major
Area
Mobile On-Road
Mobile Non-Road
Background
Total
Major
Area
Mobile On-Road
Mobile Non-Road
Background
Total
Hig
h C
erta
inty
(U
F 1
-100
)Lo
w C
erta
inty
(U
F>
100)
Hazard Quotient (Exposure/RfC)
* Results are based on inhalation exposure to outdoor sources only. Although these results assume continuous exposure to 1996 levels of air toxics over a lifetime, current and planned control programs are expected to substantially reduce these exposures and associated noncancer HQ for some pollutants. See additional information on the following page.
5 25 50 75 95 99Population Percentile
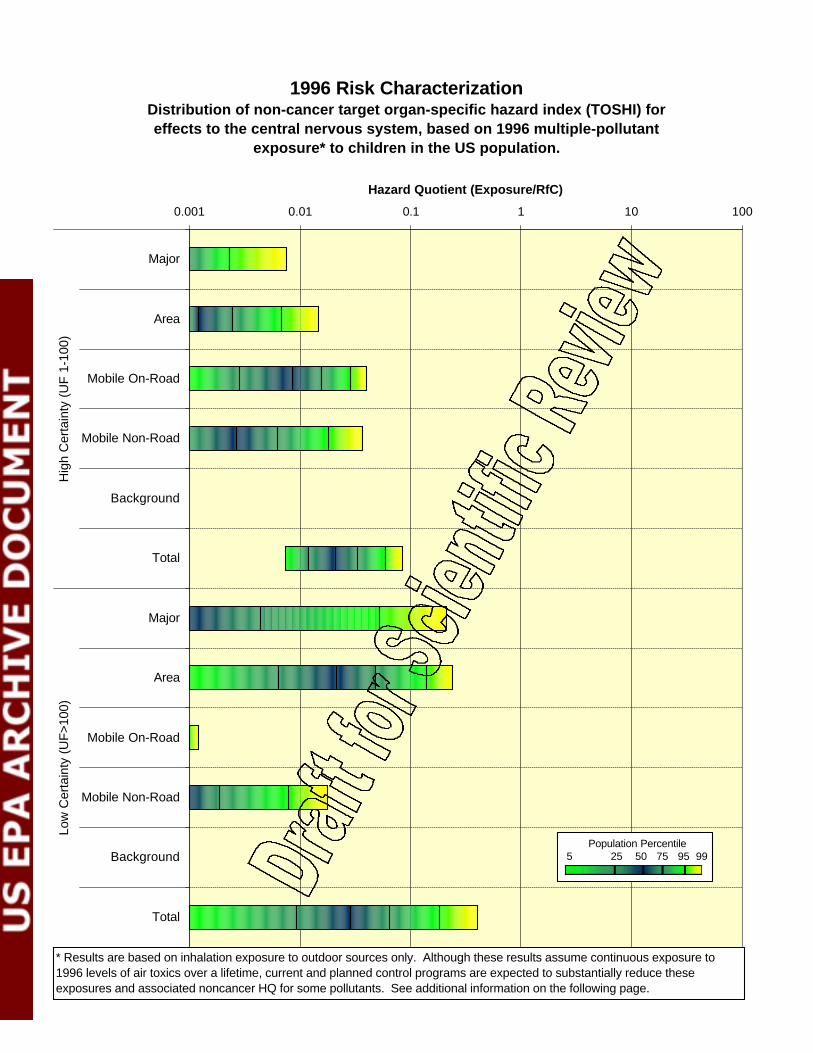
1996 Risk CharacterizationDistribution of non-cancer target organ-specific hazard index (TOSHI) for effects to the central nervous system, based on 1996 multiple-pollutant
exposure* to children in the US population.
0.001 0.01 0.1 1 10 100
Major
Area
Mobile On-Road
Mobile Non-Road
Background
Total
Major
Area
Mobile On-Road
Mobile Non-Road
Background
Total
Hig
h C
erta
inty
(U
F 1
-100
)Lo
w C
erta
inty
(U
F>
100)
Hazard Quotient (Exposure/RfC)
* Results are based on inhalation exposure to outdoor sources only. Although these results assume continuous exposure to 1996 levels of air toxics over a lifetime, current and planned control programs are expected to substantially reduce these exposures and associated noncancer HQ for some pollutants. See additional information on the following page.
5 25 50 75 95 99Population Percentile

1996 Risk CharacterizationDistribution of non-cancer target organ-specific hazard index (TOSHI) for
effects to the liver or kidney, based on 1996 multiple-pollutant exposure* to children in the US population.
0.001 0.01 0.1 1 10 100
Major
Area
Mobile On-Road
Mobile Non-Road
Background
Total
Major
Area
Mobile On-Road
Mobile Non-Road
Background
Total
Hig
h C
erta
inty
(U
F 1
-100
)Lo
w C
erta
inty
(U
F>
100)
Hazard Quotient (Exposure/RfC)
* Results are based on inhalation exposure to outdoor sources only. Although these results assume continuous exposure to 1996 levels of air toxics over a lifetime, current and planned control programs are expected to substantially reduce these exposures and associated noncancer HQ for some pollutants. See additional information on the following page.
5 25 50 75 95 99Population Percentile

1996 Risk CharacterizationDistribution of non-cancer target organ-specific hazard index (TOSHI) for
effects to the cardiovascular system, based on 1996 multiple-pollutant exposure* to children in the US population.
0.001 0.01 0.1 1 10 100
Major
Area
Mobile On-Road
Mobile Non-Road
Background
Total
Major
Area
Mobile On-Road
Mobile Non-Road
Background
Total
Hig
h C
erta
inty
(U
F 1
-100
)Lo
w C
erta
inty
(U
F>
100)
Hazard Quotient (Exposure/RfC)
* Results are based on inhalation exposure to outdoor sources only. Although these results assume continuous exposure to 1996 levels of air toxics over a lifetime, current and planned control programs are expected to substantially reduce these exposures and associated noncancer HQ for some pollutants. See additional information on the following page.
5 25 50 75 95 99Population Percentile

1996 Risk CharacterizationDistribution of non-cancer target organ-specific hazard index (TOSHI) for
effects to the immune system, based on 1996 multiple-pollutant exposure* to children in the US population.
0.001 0.01 0.1 1 10 100
Major
Area
Mobile On-Road
Mobile Non-Road
Background
Total
Major
Area
Mobile On-Road
Mobile Non-Road
Background
Total
Hig
h C
erta
inty
(U
F 1
-100
)Lo
w C
erta
inty
(U
F>
100)
Hazard Quotient (Exposure/RfC)
* Results are based on inhalation exposure to outdoor sources only. Although these results assume continuous exposure to 1996 levels of air toxics over a lifetime, current and planned control programs are expected to substantially reduce these exposures and associated noncancer HQ for some pollutants. See additional information on the following page.
5 25 50 75 95 99Population Percentile

0.01 0.1 1 10 100
Major
Area
Mobile On-Road
Mobile Non-Road
Background
Total
Major
Area
Mobile On-Road
Mobile Non-Road
Background
Total
Hig
h C
erta
inty
(U
F 1-
100)
Low
Cer
tain
ty (
UF
>100
)
Millions of Children
1996 Risk Characterization Children whose 1996 exposure* exceeded set target organ-specific hazard index (TOSHI) for effects to the respiratory system, based on 1996 multiple-
pollutant exposure*.
Tot
al U
S C
hild
Pop
ulat
ion
TOSHI > 10TOSHI > 1.0TOSHI > 0.1
* Results are based on inhalation exposure to outdoor sources only. Although these results assume continuous exposure to 1996 levels of air toxics over a lifetime, current and planned control programs are expected to substantially reduce these exposures and associated noncancer HQ for some pollutants. See additional information on the following page.

0.01 0.1 1 10 100
Major
Area
Mobile On-Road
Mobile Non-Road
Background
Total
Major
Area
Mobile On-Road
Mobile Non-Road
Background
Total
Hig
h C
erta
inty
(U
F 1
-100
)Lo
w C
erta
inty
(U
F>
100)
Millions of Children
1996 Risk Characterization Children whose 1996 exposure* exceeded set target organ-specific hazard index (TOSHI) for effects to the blood and blood-forming tissues, based on
1996 multiple-pollutant exposure*.
Tot
al U
S C
hild
Pop
ulat
ion
TOSHI > 10TOSHI > 1.0TOSHI > 0.1
* Results are based on inhalation exposure to outdoor sources only. Although these results assume continuous exposure to 1996 levels of air toxics over a lifetime, current and planned control programs are expected to substantially reduce these exposures and associated noncancer HQ for some pollutants. See additional information on the following page.

0.01 0.1 1 10 100
Major
Area
Mobile On-Road
Mobile Non-Road
Background
Total
Major
Area
Mobile On-Road
Mobile Non-Road
Background
Total
Hig
h C
erta
inty
(U
F 1
-100
)Lo
w C
erta
inty
(U
F>
100)
Millions of Children
1996 Risk Characterization Children whose 1996 exposure* exceeded set target organ-specific hazard
index (TOSHI) for effects to the central nervous system, based on 1996 multiple-pollutant exposure*.
Tot
al U
S C
hild
Pop
ulat
ion
TOSHI > 10TOSHI > 1.0TOSHI > 0.1
* Results are based on inhalation exposure to outdoor sources only. Although these results assume continuous exposure to 1996 levels of air toxics over a lifetime, current and planned control programs are expected to substantially reduce these exposures and associated noncancer HQ for some pollutants. See additional information on the following page.

0.01 0.1 1 10 100
Major
Area
Mobile On-Road
Mobile Non-Road
Background
Total
Major
Area
Mobile On-Road
Mobile Non-Road
Background
Total
Hig
h C
erta
inty
(U
F 1
-100
)Lo
w C
erta
inty
(U
F>
100)
Millions of Children
1996 Risk Characterization Children whose 1996 exposure* exceeded set target organ-specific hazard
index (TOSHI) for effects to the liver or kidney, based on 1996 multiple-pollutant exposure*.
Tot
al U
S C
hild
Pop
ulat
ion
TOSHI > 10TOSHI > 1.0TOSHI > 0.1
* Results are based on inhalation exposure to outdoor sources only. Although these results assume continuous exposure to 1996 levels of air toxics over a lifetime, current and planned control programs are expected to substantially reduce these exposures and associated noncancer HQ for some pollutants. See additional information on the following page.

0.01 0.1 1 10 100
Major
Area
Mobile On-Road
Mobile Non-Road
Background
Total
Major
Area
Mobile On-Road
Mobile Non-Road
Background
Total
Hig
h C
erta
inty
(U
F 1
-100
)Lo
w C
erta
inty
(U
F>
100)
Millions of Children
1996 Risk Characterization Children whose 1996 exposure* exceeded set target organ-specific hazard
index (TOSHI) for effects to the cardiovascular system, based on 1996 multiple-pollutant exposure*.
Tot
al U
S C
hild
Pop
ulat
ion
TOSHI > 10TOSHI > 1.0TOSHI > 0.1
* Results are based on inhalation exposure to outdoor sources only. Although these results assume continuous exposure to 1996 levels of air toxics over a lifetime, current and planned control programs are expected to substantially reduce these exposures and associated noncancer HQ for some pollutants. See additional information on the following page.

0.01 0.1 1 10 100
Major
Area
Mobile On-Road
Mobile Non-Road
Background
Total
Major
Area
Mobile On-Road
Mobile Non-Road
Background
Total
Hig
h C
erta
inty
(U
F 1
-100
)Lo
w C
erta
inty
(U
F>
100)
Millions of Children
1996 Risk Characterization Children whose 1996 exposure* exceeded set target organ-specific hazard index (TOSHI) for effects to the immune system, based on 1996 multiple-
pollutant exposure*.
Tot
al U
S C
hild
Pop
ulat
ion
TOSHI > 10TOSHI > 1.0TOSHI > 0.1
* Results are based on inhalation exposure to outdoor sources only. Although these results assume continuous exposure to 1996 levels of air toxics over a lifetime, current and planned control programs are expected to substantially reduce these exposures and associated noncancer HQ for some pollutants. See additional information on the following page.


