Chapter Four: Core Theme Planning (Standard 3.B, Assessment (Standard 4.A) and Improvement (Standard 4.B) version 5-10-12 a. Executive Summary of Eligibility Requirements 22 and 23 Eligibility Requirement 22 - Student Achievement: Shoreline Community College identifies and publishes expected student learning outcomes (SLOs) for each of its degree and certificate programs in its college catalog, degree and certificate planning sheets, on Master Course Outlines (MCOs) and on course syllabi. Programs are scheduled to review and update their MCOs at least every three years to ensure that learning outcomes and course topics reflect current practices and expectations of the respective disciplines and programs of study. SCC engages in regular and ongoing assessment to validate student achievement of these learning outcomes. All MCOs are reviewed, updated and entered into an online MCO system. At the academic department level, a variety of methods are used to validate student achievement of learning outcomes for the courses under their jurisdiction. These methods are identified on each MCO as well as on course syllabi. Examples of this include English faculty members meeting to review a standard rubric for successful completion of course objectives and Art, Visual Communications, and Humanities faculty assessing student portfolios collaboratively to ensure successful completion of learning outcomes. Learning outcomes are published to students in course syllabi, imbedded in course assignments, and assumed to be met by successful completion of program and/or degree requirements. Eligibility Requirement 23 - Institutional Effectiveness: On several levels, SCC systematically conducts evaluation, planning and assessments, the results of which effect institutional improvements. At the student level, we periodically survey students via the triennial Community College Survey of Student Engagement (CCSSE), graduate surveys, and through course evaluations; changes in curriculum, learning outcomes, and college procedures result. Students complete evaluations of our learning labs, the library, and other learning activities, results which impact changes. At the course level , assessment entails MCOs approved via scrutiny by the Curriculum Committee and through student course 1
Transcript
Chapter Four: Core Theme Planning (Standard 3.B, Assessment (Standard 4.A) and Improvement (Standard 4.B) version 5-10-12
a. Executive Summary of Eligibility Requirements 22 and 23
Eligibility Requirement 22 - Student Achievement: Shoreline Community College identifies and publishes expected student learning outcomes (SLOs) for each of its degree and certificate programs in its college catalog, degree and certificate planning sheets, on Master Course Outlines (MCOs) and on course syllabi. Programs are scheduled to review and update their MCOs at least every three years to ensure that learning outcomes and course topics reflect current practices and expectations of the respective disciplines and programs of study.
SCC engages in regular and ongoing assessment to validate student achievement of these learning outcomes. All MCOs are reviewed, updated and entered into an online MCO system. At the academic department level, a variety of methods are used to validate student achievement of learning outcomes for the courses under their jurisdiction. These methods are identified on each MCO as well as on course syllabi. Examples of this include English faculty members meeting to review a standard rubric for successful completion of course objectives and Art, Visual Communications, and Humanities faculty assessing student portfolios collaboratively to ensure successful completion of learning outcomes. Learning outcomes are published to students in course syllabi, imbedded in course assignments, and assumed to be met by successful completion of program and/or degree requirements.
Eligibility Requirement 23 - Institutional Effectiveness: On several levels, SCC systematically conducts evaluation, planning and assessments, the results of which effect institutional improvements.
At the student level, we periodically survey students via the triennial Community College Survey of Student Engagement (CCSSE), graduate surveys, and through course evaluations; changes in curriculum, learning outcomes, and college procedures result. Students complete evaluations of our learning labs, the library, and other learning activities, results which impact changes.
At the course level , assessment entails MCOs approved via scrutiny by the Curriculum Committee and through student course evaluations as well as in some cases for Common Courses at the discipline level across the state.
At the program level, Health Occupations programs conduct annual reports and periodical national reviews and accreditation visits from their respective accrediting bodies, professional-technical programs have reviews on a five-year cycle, and all programs complete annual program reviews (Dashboards) with administrative (dean and VPASA reviews). As part of the college’s efforts to assess its ability to maintain programs that are of value, community feedback is also solicited through advisory boards, feedback on student performance in internships and cooperative learning activities, and strategic planning surveys and focus groups.
At the institutional level , the College conducts assessments such as CCSSE, Campus Climate surveys, and Noel Levitz surveys on a three-year cycle. The State Board for Community and Technical Colleges also assesses the college through state reports of FTE allocation, Student Achievement Initiative, and other quarterly and annual reports. Throughout the year, the Board of Trustees receives updates on various aspects of the core theme activities and progress toward meeting objectives through monthly Board Monitoring Reports that provide evidence and progress on achievement of Core Themes.
1
Assessment activities for Student Learning Graduate Survey each year provides some evidence of effectiveness and an assessment tool
needed for analysis by the college. External Program Reviews every 5 years for professional-technical programs. CCSSE every three years for assessment of student engagement, effectiveness, student
satisfaction, and attainment of our General Education Outcomes. CCSSE provides some evidence, among other tools, for assessment of Core Theme Indicators.
Student Achievement Initiative points( SAI) which assess student progress and attainment of Momentum Points through educational milestones to a degree or the tipping point.
Board Monitoring Reports directly relate to Standard 4 on Assessment and contribute to the development of a culture of evidence required by the new standards.
Assessing our learning outcomes and curriculum—our Master Course Outlines and the Student Learning Objectives (SLOs) in them—and how our curriculum directly related to the General Education Outcomes is key to the accreditation process and to assessing if students learn what we say they learn when they complete a course, program, certificate or degree.
Program Dashboards provide an in-depth and data driven assessment tool of academic programs for faculty and administration and which include a feedback loop.
As specified in detail in Standard 3.A, planning and evaluation processes are based on the use of appropriate data to inform decision making. A wide variety of data is collected such as enrollment reports; faculty, staff and student demographics, and student success measures, and are utilized to assess whether the College is meetings its objectives. These efforts include ongoing activities such as biweekly Senior Executive Team (SET) meetings, Dean Team meetings and periodic activities such as monitoring of enrollment on a quarterly basis, and cyclical activities such as strategic planning every five years. In current efforts to update and revise its Strategic Plan, the SPBC has also incorporated Core Theme assessments.
Each spring quarter, now through Dashboards whose data is aligned with Core Themes, the departments and programs provide an analysis of their progress towards meeting their annual goals and Core Themes. Distilled in Board Monitoring Reports and assessment results of CCSSE, Graduate Survey, etc., this information is utilized by the Board of Trustees and administration through their annual summer retreat to determine the extent to which the college is meeting its Core Theme objectives and fulfilling its mission and to propose college priorities for the next year. The Board of Trustees then develops their annual goals and the President’s annual goals in the context of the Core Themes. (3.B)
3.B Core Theme Planning3.B.1 Planning for each core theme is consistent with the institution’s comprehensive plan and
guides the selection of programs and services to ensure they are aligned with and contribute to accomplishment of the core theme’s objectives.
Core Theme Planning consistent with Strategic Plan and contributing to accomplishing Core Theme Objectives: Planning for each Core Theme is consistent with the College’s Strategic Plan. As conveyed in Standard one, the Core Themes and the Board’s Policy Governance Manual were derived from the College’s Strategic Plan. This alignment has encouraged the campus to be intentional regarding Core Theme planning, and to contextualize current and ongoing planning efforts around the Core Themes. Refer to Table 3.A.1 above.
Core Themes are found in major college planning documents. The College adopted the Core Themes in 2009; they were aligned with the Board of Trustees’ Policy Governance Manual which was aligned with the 2007-2012 College’s Strategic Plan. Core Themes, objectives and indicators originally emanated from both of these planning documents in a variety of workshops across campus. They were then presented for review and input to the campus in two all-campus meetings and during our Opening Week sessions. In 2010 and 2011, the Strategic Planning and Budget Committee as well as the Accreditation Oversight Committee (AOC) revised the objectives and indicators for our Year One Self- Evaluation Report. The College then used the existing themes, objectives and indicators in its planning processes and goals. SPBC and deans used them to develop program Dashboards and data aligned with the themes and objectives. In 2011, for their annual goals, the Board of Trustees, President vice presidents and deans contextualized their goals around the core themes. See Figures 2.B, No. 1 (left) and 3.B, No. 2 & 3 below.
Accreditation Coordinating Team: In fall 2011, the AOC morphed into the Accreditation Coordinating Task Force (ACT) who led the charge to gather more campus input to revise the Core Theme indicators as suggested by the NWCCU Year One Self-Evaluation Report received November 2011. A team of two persons was assigned leadership for each objective, and each team worked with the Institutional Effectiveness office and other campus personnel to retrieve and analyze data related to each Core Theme. Revision of the indicators began first by the newly formed ACT and then from review by the entire campus in open campus sessions on core themes.
In early 2012, indicators were reviewed by P/SET, Dean Team, Faculty Senate, and Curriculum Committee. This assured us that additional input came from as many constituencies of the campus as possible. Throughout the year, the Board of Trustees received updates on various aspects of the Core Theme activities and progress toward meeting objectives in a series of Board Monitoring Reports (BMRs). The multitude of indicators and the level of detail in each demonstrate a high level of campus interactions from a wide variety of departments, programs and personnel across the institution.
Members of ACT all followed similar protocols: Reviewing existing data related to objectives and indicators. (January 2011-Spring 2012) Clarifying and re-defining the core theme indicators to be meaningful, assessable and verifiable.
Identifying relevant data to be used to analyze performance and proposing targets for quantitative measures. (Fall 2011 - Winter 2012)
When available, using straight data or a 3-year rolling average to establish a baseline. (Fall 2011, Winter 2012)
Proposing targets on a case by case basis for quantitative measures based on three-year trends or using a modest 1-2% improvement to establish a target if sufficient long-range data were not readily available. (Fall 2011 - Winter 2012)
Providing rationales for the indicators and the targets. (Spring 2011-Spring 2012) Providing initial input about the objectives and indicators for review at several all-campus
sessions. (Winter-Spring 2012) Assessing the performance of the College related to the core theme indicators and objectives
(Winter-Spring 2012) Ultimately taking review to the campus and Board of Trustees for approval of the Core Themes,
objectives, and indicators (Spring 2012). Providing a summary of the performance for each core theme to be reviewed at the annual
administrative retreat (Summer 2012) (3.B)
In addition to Core Theme Planning in the Board of Trustees’ and the President’s annual goals, Core Theme planning is evident, for example, in the development of six instructional task forces for 2010-2011 (See Figure 3B, No 4), in program reviews and in strategic planning and budget processes.
4
Budget and Core Themes: The budget planning process takes into account the costs of various strategies as well as any data verifying that these efforts are actually contributing to the accomplishment of Core Theme objectives. For examples, when the College reviewed data about the effectiveness of the GED Advisor, funds from the Student Achievement Initiative (SAI) were allocated to support that position one more year. Likewise, when the College was awarded a Campus Compact grant, retention data for immigrant ESL students were reviewed, and resources sought to retain the Retention Project Coordinator another year. These efforts directly relate to Core Theme #1, Educational Attainment and Student Success, Objective 1, Indicators 1.2k--1.2n. Similarly, the Retention Project aligned with increasing both access and diversity of our students, Core Theme #4, and also Core Theme #3 Community engagement, Objective 2, Indicator 3.2d. (3.B.2 AND 3.B.3)
Virtualization and Internationalization: From Strategic Planning environmental scans and to meet Core Theme #4, Access and Diversity and Core Theme #5, College Stewardship, two primary College planning priorities developed: virtualization and internationalization of the college. Major efforts have been made in these two areas.
Virtualization: Guided by the College’s Core Theme #2 Program Excellence and Core Theme 4 Access and Diversity, the Virtual College Initiative connects with the institution's Vision for SCC to be a world-class educational leader, not only through its physical campus but also through a virtual delivery model. President Lambert charged the Virtual College Leadership Team to develop and deliver a set of recommendations, in the form of a "blueprint" document, for a Virtual College for SCC by March 1, 2011. He created a Virtual College Implementation Team (VCIT) in April 2011 to begin implementing prioritized areas of the blueprint. It was upon the recommendation of the VCLT to establish the VCIT task force which created workgroups to seek greater input from the campus. In fall 2011, the President held 12 separate meetings with faculty and staff and students from across all programs in the college to share this vision and to get input from the campus.
Internationalization: The second initiative, internationalization of the college, is the result of many planning priorities on the campus including revenue generation for Core Theme #5 College Stewardship, assessment (assessing our general education outcome of Global Awareness) for Core Theme #2 Program Excellence, and to promote Core Theme #4, Access and Diversity for the campus. The VPASA appointed a Campus Internationalization Leadership Team (CILT) to create work teams to make recommendations for internationalizing the curriculum, to integrate domestic and international student communities, to recommend global competence learning opportunities and professional development for campus employees and to promote outreach and engagement in our local communities to foster global awareness. The CILT charging document [need link] identifies how each of these objectives is linked to College Core Themes. The CILT Report was published for the campus in May 2012.
3.B.2 Planning for core theme programs and services guides the selection of contributing components of those programs and services to ensure they are aligned with and contribute to achievement of the goals or intended outcomes of the respective programs and services.
Our entire Transitional Programs/Basic Skills (ESL/ABE/GED) programs addresses several Core Themes and demonstrate contributing components of those programs and services to ensure they are aligned with and contribute to achievement of the goals or intended outcomes of the respective programs and services. Basic Skills students come to us based on Core Theme #3: Community Engagement. We serve disaffected high school dropouts aged 16 to 21 in our Learning Center North (LCN) program housed on campus as well as our Career Education Options (CEO) program for 16 to 20 years old for whom
5
SCC has been highlighted throughout the United States for Integrated Basic Education and Skills Training programs (I-BEST ) programs. Statewide our college has the largest number of successful IBEST programs which include Automotive General Service Technician (GST), Manufacturing/CNC Machinist (CNC), Technology for Professional Careers, and Nursing Assistant Certified (NAC). Recently we were approached by the U.S. Dept. of Health & Human Services to participate in an Innovative Strategies for Increasing Self-Sufficiency (ISIS) Project to study the efficacy of I-Best programs, one which promised strong financial support to the college. Specifically because the random selection protocols inherent in the study excluded support services to students, the College declined to participate. This was a situation in which our core values and Core Themes of Educational Attainment and Student Success and Access and Diversity would have been compromised. It also demonstrates that the College will not participate in programs and services if they do not align with and contribute to the intended outcomes of our programs and services to students.
graduation from their high school is highly unlikely. Basic Skills provides access and diversity, Core Theme #4, for immigrants; nontraditional learners; and diverse people of color, ages, nationalities and ethnic origins to enter the college. Such a population adds to the diversity of students on campus, adding to the diversity brought by other non-native limited English speakers such as our international students. No matter the type of student, however, Basic Skills programs aim for Core Theme #1: Educational and Student Success, and the college has aligned resources to support the programs.
Workforce Programs: Another example of planning for core theme programs and services guiding the selection of contributing components of those programs to ensure they are aligned with and contribute to achievement of the goals of the respective programs and services would be our Workforce Education Programs. Contributing components of Workforce Education programs include:
Supporting Tutoring Services for Core Theme #1: Educational Attainment and Student Success;
Implementing External Program Reviews for Core Theme #2: Program Excellence;
Supporting our Small Business Accelerator program, Job Connections Center and engaging dislocated workers in the community who need to upgrade their skills to qualify for current work opportunities through our Worker Retraining program for Core Theme #3 Community Engagement;
Implementing a Plus 50 Career Builder program and providing support to low income students through implementing the Opportunity Grant program for Core Theme #4: Access and Diversity
And managing a variety of federal and state resources to provide a wide range of programs and services to help make Shoreline Community College workforce and economic development mission a reality for Core Theme #5: College Stewardship.
Basic Skills and Workforce Education are but two samples of the various components of programs supported by the extensive Core Theme planning efforts of the college. Figure 3B, No. 5 also demonstrates that planning and support of various College programs align with our Core Themes
6
Figure 3B, No. 5: SAMPLE CORE THEME PROGRAMS AND SERVICES AND CONTRIBUTING COMPONENTS
7
3.B.3 Core theme planning is informed by the collection of appropriately-defined data that are analyzed and used to evaluate accomplishment of core theme objectives. Planning for programs and services is informed by the collection of appropriately-defined data that are used to evaluate achievement of the goals or intended outcomes of those programs and services.
Instructional Planning/Core Theme Planning/Data Resources: Core Theme planning is evident in most of our instructional planning for the past two years. The Office of Instruction sets plans in a variety of ways: by establishing goals based on the Strategic Plan and Core Themes, by utilizing data and Core Themes to develop instructional priorities, by identifying five-year instructional imperatives, and through planning done in academic divisions, workforce, and instructional and student services programs and departments. Two of the College’s primary initiatives—the Virtualization and Internationalization of the campus noted in the table above—are deeply integrated with and heavily impact instructional and student services plans. The Office of Instruction also established several taskforces to implement its plans: Accreditation, Advising, Articulation & Transfer, Internationalization, and Assessment. (See Figure 3B, No. 4 Instructional Taskforces 2011-12 above). Table 3.A.3.a above summarizes institutional planning, assessments, timelines and data, and Table 3.A.3b summarizes instructional/student services planning, assessments, timelines, and data resources:
Table 3.A.3.b: SCC INSTRUCTIONAL and STUDENT SERVICES PLANNINGINSTRUCTIONAL
PLANNINGASSESSMENTS TIMELINE DATA RESOURCES
International Education Business Plan link
Review and approval by P/SET;International Student Surveys ; meeting financial targets
Annual; ongoing Quarterly surveys of IE students; enrollment data
Division Goals Review by Division Planning Councils, VPASA and Dean Team
Annually Program data, IR website, SAI data
All Instructional Programs/ Departments
Program Dashboards………………FTE targets…………………………………Graduate Survey………………………CCSSE………………………………………
AnnuallyQuarterly/AnnualEvery 3 yearsEvery 3 years
IR website for data: enrollments, FTEs,Instruction , SBCTC Reports incl. SAI
Professional Technical Programs
External Program Reviews………Advisory Committee Reviews…
Every 5 yearsAnnually
External consultantAdvisory Co. Minutes
Advising Plan Review by VPASA and Dean Team; Student/campus surveys
Annually CCSSE, Student/ Campus Surveys
Student Services Council for Advancement of Standards (CAS)
Bi-annually CCSSE, Student Surveys
Workforce (Perkins) Planning
Review by Deans, Office of Instruction, Workforce Board, SBCTC
AnnuallyAnnually
SBCTC data, Perkins Report of Accomplishments
3.B.3 Core theme planning is informed by the collection of appropriately-defined data that are analyzed and used to evaluate accomplishment of core theme objectives. Planning for programs and services is informed by the collection of appropriately-defined data that are used to evaluate achievement of the goals or intended outcomes of those programs and services.
8
3.B.3 Planning Informed by Appropriately–defined Data: Shoreline Community College uses a variety of data to plan for programs and services, some of which has been provided above in Standards 3.B.1 and 3.B.2 and the Tables 3.A.1a and b. In Standard One, the College detailed the rationale behind various indicators and the data that would be used to determine success in these efforts and provide an overview of how this data would be used to determine mission fulfillment. To determine “appropriately defined data,” the College conducted multiple literature reviews and comparison to other institutions to compare its performance to other peer institutions. The Washington State Board of Community and Technical College’s (SBCTC) Student Achievement Initiative (SAI) and Governance Institute for Student Success (GISS) databases provided opportunities for the College to compare performance with other Washington State comprehensive community colleges. Accrediting and certifying agencies for some of our health occupations and automotive programs also provide useful comparative data. Funding sources such as Perkins and the SBCTC provide comparison data and or set benchmarks for performance for their target populations, and SCC has considered these comparisons for appropriate groups.
The process of using data to plan for Core Theme programs and services is new to the institution, but the same data will inform core theme planning. As the past six years of budget reductions has demonstrated, the College conscientiously attempts to make decisions with a backdrop of a variety of data, including campus inputs, comparative data from other peer institutions, and institutional data over time. Specifically, as the College reviews programs and services to be maintained, consolidated, redistributed or cut, institutional data such as available on our Institutional Effectiveness website informed those decisions.
The stated mission of our institutional research office is to support the constituents of Shoreline Community College through provision of credible, decision-relevant information which facilitates excellence in the teaching/learning process, and the overall effectiveness of the institution. Used in some decision making processes, information on the site includes:
SCC Factbook (institutional as well as by program for information about students in programs, retention, age groups by gender, and ethnicity);
Completions (Student program/degree and certificate completions over time since 2004-2005); Institutional Annualized FTEs (from 2004-05)and Institutional Annualized Headcounts since
2006-07; Outcomes Assessment Reports from 1999 to 2007 about specific institutional assessment
projects; Efficiency Model reports by discipline which is an efficiency tool that provides data on the
number of sections, enrollments, total FTEs, number of full-time equivalent faculty, part-time faculty, student: faculty ratios, faculty costs, and costs per FTE.
Dashboards of program review data for Basic Skills, ESL, Transfer and Professional Technical programs and Pilot Dashboard Data
Community College Survey of Student Engagement (CCSSE) which includes detailed data on Key Findings,
o a CCSSE-to-Core Theme Crosswalk that assesses student satisfaction with their coursework and instruction and many student support services,
o Benchmark Summary , o Benchmark Summary by Enrollment Status , o Frequency Distributions ,
9
o Frequency Distributions by Enrollment Status , o Means Summary , o Means Summary by Enrollment Status ,o Results of Special Focus Questions .
Student Achievement Initiative (SAI) which details the College’s student achievement of various momentum or progress points from basic skills levels to developmental to college-level coursework, including math, to the tipping point of receiving a degree.
IPEDS College Reports 2008-2010 --useful to help institutions with comparative data of thousands of postsecondary institutions across the United States.
Washington State Data Book which provides information about state budgets, higher education, degrees, tuition, workforce education and topics relevant to a state community college system.
Other relevant data sources include our Board Monitoring Reports which specifically deal with our Core Theme objectives and indicators as well as enrollment data, program performance (as indicated in external program reviews and dashboards and other data), industry partnerships, community need and potential for community engagement, program excellence and reputation, labor market trends, program mix, required support, impacts of legislative mandates and initiatives whether funded or unfunded, and state, regional and national data related to assessing programs for comparative data. Resource allocation decisions are integral to any program decisions, and cost analyses include, support costs, sustainability, and potential for revenue generation.
While the College President is ultimately responsible for the college’s performance and the integrity of the data used to analyze that performance in all arenas, direct supervision of individuals who gather and manage data is divided among several positions:
The President directly oversees data related to International Education. The Director of international Education reports directly to the college president.
The Vice President for Academic and Student Affairs is responsible for enrollment, educational attainment and student success data. This VP oversees enrollment management, compliance with state and federal reporting requirements; compliance with grant and initiative objectives related to instruction, workforce and student services. Deans, directors of academic and student services and the Assistant Director of the Office of Institutional Effectiveness provide a variety of reports from enrollment data to program analyses.
The Vice President of Human Resources and Legal Affairs manages data on employee demographics, professional development, training and legal issues.
The Chief Advancement Officer oversees the College Foundation and data such as community use of facilities and the Public Information Office.
The Vice President for Administrative Services oversees college finances, including monitoring budgets, capital projects, facilities; operations, and security. Directors of accounting and purchasing services, budget, facilities operations, and security oversee data collection and dissemination for their respective areas. This VP also oversees directors for Enrollment and Financial Aid Services.
Core Theme One: Educational Attainment and Student Success
Helping our diverse student body attain their educational goals and achieve academic success is primary to Shoreline Community College. It is the heart of our mission.
3.B Planning for the Core Theme of Educational Attainment and Student Success
Members of the Accreditation Coordinating Team (ACT) were assigned to refine objectives and develop measurable, verifiable indicators to assess educational attainment and student success with data support from the Office of Institutional Effectiveness. Input from the Board of Trustees, the earlier Accreditation Oversight Committee and the Strategic Planning and Budget Committee also provided input as well as personnel from the respective programs and services identified as essential to this Core Theme objective and indicator. The ACT identified the programs and services that related to the objectives of this core theme, finding and reviewing existing data to ascertain the level of progress in that area, and determining additional information or data (or lack thereof) needed to evaluate performance.
4.A: Analysis for Effectiveness of Core Theme #1: Educational Attainment and Student Success
SCC determined that both Core Theme Objectives were met. Using our four point scale, the ACT and SET rated each of the indicators and determined that we had done fairly well in most indicators, though the data do show our areas of greatest challenge—Basic Skills and math, two of the most persistent challenges in community colleges across the nation. Even with modest targets, the College has struggled helping students attain academic achievement at the rate of progress both they and the state require to maintain consistent funding. As state resources dwindle, programs are impacted, and students may not have the resources to sustain their educational pursuits. Nevertheless, the College has fared well in comparison to peer colleges and to other colleges in the Washington State Board system with some, not all, of these indicators.
Core Theme One was expressed by two objectives and 21 indicators. Some of the indicators are even further detailed to demonstrate the component programs, services and data from which targets were established. There are 4 indicators and 4 sub-indicators or measures for the first objective 1.1 and 17 indicators and 23 sub-indicators for Objective 1.2. Because Objective 1.2 is about the high rates of success and completion for all our students, we have spent a great deal of time and effort developing the indicators and sub-indicators. There are four sub-indicators for two categories: All Students and Basic Skills and three each for Transfer, Professional-Technical and Developmental.
4.B Suggestions for Improvement for Core Theme #1: Educational Attainment and Student Success
The College expects that the October 2012 Comprehensive review and visit by the NWCCU will prescribe specific suggestions regarding objectives and indicators for our Core Themes, given that this was SCC’s first experience with all the new standards condensed into one comprehensive report. For Core Theme One, it was evident to all concerned that the data collected and presented was new to the campus, and in some cases information about the student performance was not available for all programs and for all students. While the objective was to increase persistence of all students, we found data on various subgroups to make our judgments. Subgroup data as such may
11
not have provided what was needed for such a broad objective. Further analysis may be required beyond first-time students, first-time students of color, veterans, international, and fully online students. Objective 1.1 may well need to be refined.
Objective 1.2 posed further questions as the SAI initiative at the state level is being recalibrated. In addition, as SAI is a performance funding strategy as well as a student assessment strategy, when our enrollment dips, so do our achievement of momentum points, thus skewing students’ rates of success and progress. As the SBCTC system adopts its new Student Management System (CTC LINK project), improved data about transfer and student success at baccalaureate institutions should be forthcoming.
College efforts to track students’ employment once they leave the institution are underway. More emphasis is on keeping those connections to our students in an electronic way through our virtualization of the campus is underway. More emphasis is on keeping those connections to our students through the electronic virtualization of the campus.
Objective 1.1 : The College increases persistence rates of all students.Indicator Baseline Target Outcome
1.1a Retention rate as compared to peer institutionsUsing IPEDS Data Feedback Reports (DFR), and their ‘automatic’ comparison group: FT Retention countsDFR college: 2007 2008 2009 2010 2011SCC: 60% 61% 65% 72% 65%Comparison Group: 67% 58% 60% 57% 60%(Retention rates are measured from fall of first enrollment to following fall.)
60% or7%
lower
>3% points
difference
65% or5%
higher
MET1.1b Three-year average persistence rates of all first-time students with
transfer intent measured fall to fall (65%, 61%, 62%) students of color (African American 65%, Asian 61%, Hispanic 56%) all first-time veteran students (33%, 50%, 64%) all first-time international students (65%, 76%, 76%) students in exclusively online programs. (Accounting 46%, HIIM
71%, Purchasing 33%)
59%
59%56%72%50%
60%
59%57%72%52%
60%
57%57%75%52%
MET1.1c Persistence rate from initial fall quarter to winter quarter2006-07: 92%; 2007-08: 93%; 2008-09: 94%; 2009-10: 95%
93%(4 year Avg.)
>90% 88%
MET1.1d Percentage of students designated as Early Leavers2007: 47%; 2008: 43%; 2009: 41%; 2010: 38%; 2011: 39%Data source: Data Link Outcomes Assessment (DLOA)
43.6% <40% 39%
MET
OVERALL ANALYSIS: (4.A.): 4 of 4 Targets: METSCC has maintained a strong history of student persistence from their initial fall quarter to their winter quarter. We dropped below 90% for the first time in 5 years. Our belief is that the ongoing budget cuts which has on the honed resulted in staff cuts and affected students’ ability to attend/afford college.
The College monitors persistence through 4 quarters including fall-to-fall using first-time student cohorts for fall 2007, 2008, and 2009. We used the 3-year rolling average in some cases to establish the baseline and to make target projections based on trends. As well as students overall, these indicators help us
12
assess persistence of our students of color, veteran, international, and online students in their transfer studies as they pursue their educational goals. Data on these subgroups inform our main objective to increase persistence for all students. Targets were determined by current college efforts to either maintain or improve persistence through enhanced advising, coding, degree audit implementation, and a new Veterans’ Center and new programming. Maintaining our current percentages is reasonable as the current fluctuating job market keeps many students in school as reduced financial aid and resources for students in a dire economy force them to leave.
The data show our persistence fall to fall for all transfer intent students last year is about 60% and our overall retention rate about 65% or 5% higher than peer colleges. Our IPEDS Report shows that our persistence rate dropped between this year and last, but that our retention rate is still ahead of our comparison group. In truth, we would like to improve in persistence for some cohorts per the targets we set for ourselves, knowing that maintaining percentages is not the same as increasing persistence rates. Our targets were deliberately modest. Compared to our IPEDS comparison group, we are doing quite well (though the gap has closed).
RESULTING ACTIONS (4.B): Cross training for Student Services staff has been implemented, including training in Financial
Aid, a huge block to many students to persist in their studies. These staffers are typically the frontline contacts for most students and now can offer more services to all student cohorts.
The College is implementing Degree Audit software and providing training for faculty. Our Veterans Grant and new Veterans Center has allowed for the addition of a temporary full-
time veterans’ counselor/advisor, a Campus Veterans Education Team (CVET), development of a Student Veterans Organization (club), new processes in reviewing military transcriptions prior to entry, and participation on the Prior Learning Assessment work group.
The College is instituting new advising strategies and encouraging more faculty to provide more advising for students during their office hours.
eAdvising is growing. A small team of faculty regular assists with responses to students. The College has an active Students of Color caucus that provides forums for Courageous
Conversations. Recently one of these occurred college-wide and is being discussed on faculty list serves. Such promotion helps other faculty and staff help students persist in their studies.
Math and English faculty have calibrated their COMPASS placement test scores with surrounding colleges in the Five Star Consortium. This provides consistency to students and encourages persistence rather than “shopping around” to different colleges.
SUGGESTIONS FOR IMPROVEMENT (4.B): Secure more staff to fully implement Degree Audit. Measure student success in all college online courses. Develop targeted cohorts such as developmental online progress to analyze specific student
progress through online coursework. Compare and contrast online and face-to-face coursework and student progress. Increase mandated Prior Learning credits Create a permanent Veterans Counselor position Develop priority registration procedures for veterans to retain their college eligibility.
Objective 1.2: There are 17 indicators and 23 sub-indicators for this significant indicator.
Objective 1.2: Students display high rates of success and completion in their programs of study.
ALL STUDENTSIndicator Baseline Target Outcome
1.2a Average annual number of Student Achievement Initiative (SAI) points per student over a 3-year period (2007-09) (0.77,0.86,0.84) 0.79 0.81 0.82
MET
1.2b Degrees and Certificates awarded2009-2010: 1,667 awards
2010-2011: 1,783 awards (Per SBCTC Academic Year Reports)
1,667 1,700 1,783 MET
1.2c Amount of college credits earned averaged over 3 years
2007-08 2008-2009 2009-10 2010-1130 credits 31% 29% 30% 34%45 credits 22% 21% 21% 24%(Data from SBCTC Academic Year Reports)
30%21%
31%22%
34%24%MET
1.2d Course Success Rate in online math and English courses pre-college to transfer as compared to SBCTC system rate. (Fall 2010)Success Rates SCC System PreCollege English – writing (Hybrid) 78.8% 68.5%English &101(Hybrid) 76.2% 73.9%English &101 (Online) 68.4% 66.5%English &101(Hybrid) 76.2% 73.9%English& 102 (Hybrid) 73.3% 70.0%English& 102 (Online 71.1% 70.3%
Above numbers are based on what the SBCTC calls “Course Success Rate” which is all credits earned with decimal grade of 2.0 or higher or letter grade of P or S.
System
70.5%English
57.6% math
Target
2%>System
2%>system
SCC
76%English
MET
56%Math
NOT MET
TRANSFER STUDENTSIndicator Baseline Target Outcome
1.2e Number of transfer degrees awarded
2009-2010: 32 AS; 350 DTA; 88 Other
2010-2011: 44 AS; 413 DTA; 60 Other
470 +/- 2% 517MET
14
1.2f Transfer rates: (with or without getting a degree) Transfer rate of students to accredited baccalaureates within 1
year of graduating from the college with a transfer degree Transfer rate to public baccalaureates of SCC students who do
not graduate with transfer degree within 1 year of leaving SCC
Year Xfer with No Degree Xfer with Degree
2006-7: 18.16% 58.39%
2007-8: 25.87% 68.05%
2008-9: 28.71% 71.26%
2009-10: 26.53% 65.65%
58%
18%
62%
21%
66%
27%MET
1.2g Comparative GPA of SCC transfer students with GPA of UW students over a two-year period (2008-2009)
SCC Fall 08: 3.22 Fall 09: 3.19 Fall 10: 3.3 UW Fall 08: 3.19 Fall 10: 3.24 Fall 10: 3.2
Range of .05 points
Range of .04 points
Within range of .04 pointsMET
OVERALL ANALYSIS: 7 of 8 TARGETS METStudents are earning more credits and more SAI points, and more certificates and degrees are being awarded over time. Transfer rates have increased whether or not a student actually gets a transfer DTA or AS-T degree from the college. Data show that rates have been erratic, we think based on the volatile economy and students not having the funds to complete their programs. SAI data show that individual students are making more progress and thus earning more points. How well SCC students compare academically (as indicated by their GPA) with other UW students indicates student success and good preparation for baccalaureate work. Our DTA transfer rate with our baccalaureate institutions has been fluctuating up to 10 percentage points, and we know, in particular, that many Science students are leaving before they get 90 credits (not degrees). Tuition is rising at the colleges and universities and students are transferring sooner if they can. The economy is still volatile.
RESULTING ACTIONS: SCC dropped its Inter American Studies requirement in Fall 2010 which lowered the number of
credits for our DTA and subsequently fostered more transfer as it made our DTA more affordable; students reached the tipping point which increased our SAI momentum points per student.
We created more transfer planning sheets which makes it easier for students to monitor how close they are to completing their degree requirements.
In addition, even though UW changed entrance requirements, our students who do transfer earn a GPA on par with students who start their baccalaureate at the university. Despite severe budget
15
cuts, SCC maintains high standards so our students do as well as UW students. We also established a college-wide Articulation and Transfer Task Force and website as well as an
Advising Task Force and website to highlight to students their transfer options. The College is aiming for more agreements, including online agreements through our Virtual
College Implementation Instructional Task Force.
SUGGESTIONS FOR IMPROVEMENT: To measure transfer and completion more effectively, SCC has encouraged our SBCTC to require
the four- year universities to provide more transfer data to the community colleges. We also will be implementing Degree Audit more fully. Expanding advising training for more faculty: With budget cuts and resignations, the College is
revamping advising, reviewing more commercial products, and planning to improve its advising strategies across the entire college.
More professional development with both full and part-time faculty is planned. In addition, our Virtual College will develop more online articulations which we hope will urge
more students to complete and get their degree and transfer.
1.2h Number of degree and certificate completions of professional-technical students over a three-year period (2007-2009) Avg 834 +/- 2%
8501006MET
1.2i Employment rate of professional-technical students who complete their applied degree/ certificate programs over a three-year period (2007-09) (Target based on economy)
82.5% 77% 79%MET
1.2j Three-year average pass rate of licensure/certification exams scored at or above regional and national averages over a three-year period Dental Hygiene - 2007-2009, for only those taking the certification exam:
24, 24, 23 graduates, respectively. Nursing - % First pass NCLEX-RN tests taken 2X annually April 2007-2009 NAC – 2009- 2011 for only those taking the cert exam post graduation
100%
98%75.9%
95%
98%77%
100%
98%78%MET
OVERALL ANALYSIS: Target Met? YESData above suggest that our professional-technical programs are basically strong, and an increasing number of students are completing their programs. Our targets reflect the market influence. More students stayed in school and completed their degrees and certificates as the unemployment rate in the region and the nation remained extremely weak.
Typically, professional-technical programs are often cohort-based and are more stable than transfer
16
students as a whole. The economy has been disastrous to students seeking employment, and our flexible target reflected this downturn. That 79% of our students were employed in a dire economy is a strong indicator of the effectiveness of our programs and our partnerships with industry. Perkins funds to support workforce students were cut at the state and federal levels.
Please note: The 2010-2011 Annual Report for the SBCTC states that the system estimated employment rate for students completing a professional technical program in 2009-2010 is 72% and that any decrease is reflective of the sustained high unemployment rate during the largest recession in history (p. 44). This will impact our employment rate in future reports.
RESULTING ACTIONS: Several programs in the college added more certificates laddered to degrees. Examples include
VCT and Business. Students see success in steps to our degrees and we found increased progression as more
laddering was strategically done with certificates. The College also emphasized new advising strategies to maintain and increase student progress
with focused advising sessions done by departments and over the summer, more Career Fairs, and the use of small advising sessions in addition to larger more traditional ones.
The College added more certificates which increased the completion rate.
SUGGESTIONS FOR IMPROVEMENT:The College needs to do more intentional tracking of certificates for assessing their effectiveness. The College needs to focus on building closer ties to industry and tracking student employment more deliberately. More intentional tracking of the effectiveness of our small advising sessions all summer long should be done as well as hosting more career fairs for students and employers.
Colleges need more reliable employment tools. For student employment, the tools we use are:
1. A graduate survey, conducted annually
2. WTB database on student placement by program and by college. (www.wtbwa.gov)
3. Instructor information in certain programs where COOP or Internships are strong. E.g., Nursing, Dental Hygiene, HIIM, NAC; Automotive.
Perkins funds need to be restored and even increased so that we would have budget to develop and administer more effective tracking of students to the workforce.
BASIC SKILLS Indicator Baseline Target Outcome1.2k Average SAI momentum points per student per year
Based on program level completions and/or significant gains on the CASAS test over 3 years (2009-2011).
Percent of Basic Skills students who earn SAI points averaged over three years (2009-2011).
3.6
59.25%
3.8
-2% Impacted by loss of
CEO & LCN
3.46
58%MET
1.2l Average GED completion rate over 2 years for students who have taken SCC GED/ABE coursework and passed all 5 tests
215 GED 2009-2010: 52 passed all 5 tests or 24%
264 GED 2010-2011: 60 of them passed all 5 tests or 23%
114 students
24%
52 students
+ or - .02%
-2% Impacted by loss of
CEO & LCN
107 students
23%
60 students
MET
1.2m SCC average percentage of students earning SAI points as compared to SBCTC system average over 3 years
2008-2009: 60% system average 47%
2009-2010: 59% system average 52%
2010-2011: 58% system average 51%
60% SCC47% SBCTC
SCC higher than
system average
58% SCC51% SBCTC
MET
1.2n SCC average for student level completions of the federal basic education program compared to SBCTC system average
Exceed SBCTC
average for student
level completions
Exceed SBCTC
average for student
level completions
SCC 40.43%
SBCTC 34.69%
MET
BASIC SKILLS OVERALL ANALYSIS: 4 of 4 TARGETS METFrom FY 2010 to 2011, the Shoreline basic education program had a reduction of 158 annualized FTES due to changes in the way the College’s enrollments of at-risk youth were reported to the state. The 158 FTEs were equal to about 279 unduplicated heads. Almost all of these students were in the ABE/GED program. Since these students were no longer being reported as ABE/GED students, the Student Achievement Initiative (SAI) points were also lost. The College estimates that 679 SAI points were lost as a direct result
18
of this change in reporting.
SAI points for basic education students are earned, in part, by the number of students who complete federally established proficiency levels measured by the CASAS test. In order to regain some of the lost points, it is essential that the remaining students increase their level completions. Currently Shoreline’s basic education students achieve completions at a rate that is above the state average in 8 of the 11 proficiency levels being measured (See FY 2011 Level Completion chart below.).
The two program levels that are below the statewide average are ESL Levels 5 and 6. An analysis of the causes for this suggest that Shoreline’s emphasis on transitioning these upper level students has result on an over-emphasis on writing skills to the detriment of the reading and listening skills measured by CASAS.
While the data shows a decrease in the GED completions from 2009-10 to 2010-11, there are a number of significant factors that need to be considered when analyzing this report. First, since this data-tracking just started in 2009-10, no trend line or target was previously established, so it is challenging to review the data and ascertain meaningful results for such a limited tracking period. Second, it should be noted that there was a 23% increase in the number of students served in 2010-2011 over the previous school year. This increase meant that instructors had larger class sizes with more underprepared students but no additional resources to assist them. Third, we had more ESL students taking the GED class, and typically this population takes longer to prepare for testing than native speakers.
Finally, it appears due to the economy, more people found themselves unemployable and seeking the GED, increasing the number of low-skilled students in the classroom. In addition, as of December 2011,
19
the GED will be required to receive federal financial aid, and the “ability to benefit” exception will no longer apply – this means that more people, many with low academic skills, will be seeking the GED before taking college level community college classes. These students will require more “wrap-around” services to ensure retention.
RESULTING ACTIONS:The FTE and headcount lost from the change in reporting will likely not be replaced (although it is important to note that the at-risk youth are still being served by the College). Therefore, it is essential that basic education student performance be improved. The three most critical measurements will be:
1. Student level completions as measured by CASAS
2. Student transitions as tracked by SBCTC
3. Percentage of ABE/GED students earning GEDs
Under a program improvement plan submitted to SBCTC recently, several strategies will be implemented to prepare ESL levels 5 and 6 to perform higher on the CASAS Test. The program is reviewing its placement policies.
Several strategic initiatives are under way to sustain or increase Shoreline’s already high rate of basic education student transitions to college level programs.
The GED program advisor is essential in the intake, orientation, and support of our ABE/GED students. Funding for this position has been through a combination of King County and SAI funds. Both sources are not certain for FY 2013.
The GED classroom has been remodeled and is now better equipped as a “smart” classroom that provide instructors with technology to enhance their teaching strategies.
An in-class math tutor has been provided by the campus tutoring center to assist students.
The instructors and advisor are now able to refer students to the HEROES program, a new on-campus mentoring program that will provide tutors and mentors to GED students.
A textbook review was done, and new textbooks are now being used.
The Carnegie math program has been installed in the technology lab for students to access.
20
SUGGESTIONS FOR IMPROVEMENT: Ensure alignment of ESL curriculum with skills measured on CASAS Test. Maintain the full-time GED Advisor position with stable funding. Improve faculty advising efforts so that these students get more individualized attention. Participate in the new and continuing statewide efforts to transform PreCollege education in the
State of Washington. Work with the SBCTC regarding revamping ABE and the new college readiness standards. Work with the Core to College partnership with our local high schools to develop better transitions
from the high school to the college level.
Add in-class writing tutors to assist students with writing skills.
More in-class advising sessions and introduction to campus and community resources
Regular meetings with instructors and advisor to collaborate on classroom activities and review students’ needs.
Instructors and advisors will need training in 2012/2013 to prepare for the new 2014 GED. This test will be quite different and more challenging than past versions.
DEVELOPMENTAL Indicator Baseline Target Outcome
1.2o Pass rates of students in Developmental English
Transfer-intended English 100 passing students who take and pass English 101 within 7 quarters: 2007-8: Fail: 81 Pass: 177 % Pass: 69%
Pass rates of all students in Developmental English (English 080 and 090/Study Skills 100) : 2007-8: Eng 080 – 53% Eng 090 – 66%
Percentage of all transfer-intended English 080 and 090/Study Skills 100 students who pass their initial class and then pass English 101 within 7 quarters.
*This number is low because the full 7 quarters of opportunity
69%
Eng 80 53%Eng 90 66%
52%
37%
70%
Eng 80 55%Eng 90
68%
55%
39%(3 year avg.)
MET
7 qtrs. data not
yet availableEng 80 78%
METEng 90 73%
MET45%*NOT MET
39%MET
21
to pass English 101 has not yet elapsed.
Percentage of developmental English students (starting in English 80 or 90) with transfer intent transitioning to and passing college-level English 101 courses within 7 quarters including summer, 2007-2010.
Fall 2007: 37% Fall 2009: 36%
Fall 2008: 44% Fall 2010: 39%
ANALYSIS:The rates of lowest (English 080) and middle (English 090/Study Skills 100) developmental English students passing English 101 at Shoreline are much better than the national average of 24%--at these two levels, student pass English 101 at a three-year average of 39%. This is 62% higher than the national rate. While a much higher percentage of students pass developmental English classes at Shoreline than in the nation in general, we want to increase further the number of students who move from developmental into college level English. English 100 (highest level) students pass their class at a rate of 78% and pass English 101 at a rate of 68%. This compares favorably with national rates 10-20 percentage points lower.
RESULTING ACTIONS:The English department is working on initiatives to improve retention and pass rates of Developmental English students:
Formalizing the process by which students can “jump” levels based on performance, from English 080 to English 100, or from English 090/Study Skills 100 to English 101.
This involves developing department standards and conducting norming sessions to ensure consistent application of the standards.
Study: Review the possibility of deleting English 080 from the developmental English program. In light of national data that the lower students start and the more developmental classes they are required to take, the less likely they are to persist and enter a college-level transfer program, having students start in a higher class is ideal.
SUGGESTIONS FOR IMPROVEMENT: Pilot: Teach English 100 and 101 in the same classroom where students earn credit for the class whose
learning outcomes they meet. Over the 2012-13 academic year, the department will study the feasibility of deleting English 080 by
22
reviewing English 080 student performance
1.2p Pass rates of students in Developmental Math 2008-9 2009-10 2010-11
Math 060 71% 75% 58%
Math 070 66% 67% 62%
Math 080 57% 65% 66%
Math 099 57% 71% 57%
71%66%57%57%
60%60%60%60%
58% Not Met62% MET66% MET
57% Not MetNOT MET
Rationale: Most all programs of study include a Mathematics requirement. More than 70% of our students initially place into a developmental math course. In order to succeed and complete a program they must pass one of the above classes. Our goal is to keep all pass rates at 60% or better. Target is modest but solid improvement, well above the national average of progress for developmental students.
Indicator Baseline Target Outcome1.2q Percentage of transfer intent students that take and pass Math 99 and also earn QSR credit within a year. (Using fall cohorts for Math 099)Yr A78 A89 A90
Pass 99: 66 82 98
Pass QSR: 53 62 66
%: 80% 76% 67%
80% 76% 67%NOT MET
Rationale: Transfer students must complete a Quantitative Reasoning course to get their degree. Since many begin in developmental mathematics, the above percentage indicates program success.
OVERALL ANALYSIS : 2 of 3 TARGETS METSAI monitors student progress at varying strategic momentum points established by the SBCTC –gaining English proficiency levels, taking college-level English and math classes, etc. With or without SCC students attaining an associate’s degree, transfer rates indicate student success. How well SCC students compare academically (as indicated by their GPA) with other UW students indicates student success and good preparation for baccalaureate working their programs of study, but also in being accepted at a baccalaureate institution.
1.1.2.m: We met our goal of keeping pass rates above 60% in 2 of the 4 developmental classes. Pass rates
23
vary year to year, we may need more years of data to set a realistic goal. We may see the pass rates in Math 99 and 100-level Math classes decline starting spring 2012 because our placement test scores were lowered through an agreement with the five-star consortium.
RESULTING ACTIONS:The Department of Mathematics has been working for many years to improve outcomes of our students. Mathematics serves primarily as a prerequisite to other courses and programs. We have an obligation to other faculty, departments, and other colleges to produce well-prepared math students.
To improve pass rates in Developmental Mathematics, the Mathematics Department has started offering Math 085 and Math 095, which are self-paced individualized courses equivalent to Math 080 and Math 099. We hope these courses allow more students to succeed in Developmental Math. The Math Department also recently developed and updated online versions of Math 080 and 099 to meet the needs of more students.
Over the last several years, we have been focusing on our developmental mathematics program. We have been working hard to improve student outcomes. Here are some of the things we have implemented in the last few years: We broke our Intermediate Algebra into two smaller courses in 2003; that did not have the desired effect of improving student outcomes, so we did not stay with it. We implemented prerequisite enforcement in 2005; students now must show that they are ready for the courses they sign up for. We have noticed an improvement in the preparedness of our students; other departments (English, Chemistry, and more recently Biology) now also enforce prerequisites.
We were involved with the statewide Transition Math project from 2006 through 2009. We worked with Shoreline high schools. We helped draft the College Readiness Standards in Mathematics. We developed a Math Study Skills class in 2006. Unfortunately, that course had such small enrollment that we eventually had to stop offering it. But we still incorporate some of the study skills activities into our regular developmental classes. Also as part of The Math Project grant, we took our first hard look at how the COMPASS test works as a placement tool.
In 2008, we reworked our entire developmental curriculum, from Math 060 through Math 099. We eliminated some topics so we could focus on the few topics that are most important. We made a sequence of courses that step up in difficulty, so our students can gradually move from the gentle pace of the early developmental classes to the fast pace of the college-level courses they will need. We are happy right now with the division of topics among our developmental classes, with the accelerating pace, and
24
with how our students are being prepared for their next step.
SUGGESTIONS FOR IMPROVEMENT: In addition to the SBCTC developing a system that works for all the colleges so that student
progress and data such as GPAs will be available to the colleges from the four year institutions to which they have transferred, SCC needs to develop its own data sharing relationships with the BIs. Students’ progress in specified programs or majors could reveal important information. Possibly joint 2-year/4-year meetings could be developed within departments so that we can more closely align our programs and aid student transition.
We are working on several projects to improve Mathematics pass rates, including modification of our computerized self-paced math courses and a liberal arts or social science pathway through Intermediate Algebra.
We need to restore a full-time tenure-track math faculty position for the director of our Math Learning Center (currently the position is 80% pro-rata)
Increase more computer lab space. Placement continues to be an issue. We need to work to resolve these issues. Full math report to the BOT April 25, 2012
Core Theme Two: Program Excellence
Core Theme Two, Program Excellence was expressed by two objectives and 14 indicators. Some of the indicators are even further detailed to demonstrate the component programs, services and data from which targets were established. Objective 2.1 has 11 indicators and nine sub-indicators, three general, two for academic transfer, three for professional- technical, two for Basic skills and Developmental combined, and one for the library. Objective 2.2 has three indicators and 26 sub-indicators.
2.1 The College develops and maintains standards-based, academically rigorous educational programs.
25
Indicator Baseline Target Outcome2.1a Program and course student learning outcomes (SLOs) assessed by rigorous college processes
About 72.61% of our courses underwent a rigorous review process resulting in new Master Course Outlines (MCOs) signed off by the Vice President of Academic and Student Affairs and put on the state inventory of new courses.
Maintain rigorous processes while completing outcomes work and MCOs.
About 77% of our courses were completed via college processes.
MET
2.1b Number of new or revised courses, degrees and certificates approved by the Curriculum Committee and transferred to the online MCO system
Steady increase in revisions, deletions, and development of new courses
From 228 courses and 34 degree to 436 courses31 degrees, an increase of 208 courses and decrease of 3 degrees
MET
2.1c Timely compliance of Shoreline’s DTA and AS-T degrees with all current WA State and ICRC guidelines and new mandates
General compliance with all recent DTA regulations, including 2010-11 changes in the Communication requirements in the DTA.
Fall 2011 compliance with the new diversity reciprocity mandates and “D” grade requirement of the SBCTC statewide Reciprocity Agreement.
Implemented “D” grade requirement. Fall 2011; full diversity reciprocity compliance in winter 2012 (late 1 quarter)
MET
ANALYSIS: 3 of 3 TARGETS METGenerally SCC’s degrees have met all internal, ICRC and state updates mandated in a timely manner. Approvals by SCC’s Curriculum Committee mean compliance with standards and rigor set by ICRC Guidelines and industry. Approval by the VPASA means compliance with all SBCTC requirements and WA state-mandated changes. (ICRC is the statewide council that oversees the standards required in the DTA and AS degrees and by which all institutions of higher education in the state offers degrees.)
Change to the “D” grade as 1.0 (not the formerly accepted .07) was implemented on time in Fall 2011 so that all degrees awarded had the required student achievement level required in the Umbrella Policy of the ICRC Handbook that all WA State colleges are required to follow. Currently the college has implemented the diversity reciprocity agreement, but we implemented this change one quarter late. Time was needed to train all faculty advisors and develop resources for advising and credential evaluation. Most WA State two-year colleges reported similar timing. We waited until the Articulation and Transfer Council (ATC) prepared appropriate resources to be established on the SBCTC website.
RESULTING ACTIONS: Faculty Senate, Curriculum Committee, Transcript evaluators and the Office of Instruction
26
implemented the “D” grade change immediately through deans, division meetings, faculty list serve announcements, and all campus sessions.
A statewide list serve, notifications and trainings to deans, and preparation of handouts and applicable URLs on the SBCTC website helped clarify the diversity reciprocity agreement and new requirements.
Many discussions about degree changes occurred on the campus and at statewide councils like the ATC and the Instruction Commission to clarify these changes.
SUGGESTIONS FOR IMPROVEMENT:Such fundamental systemic changes to degrees and certificates require more formalized faculty, advisor and student services professional development processes. Training of both new and existing faculty requires new allocation of resources and point persons to disseminate all messages and oversee implementation as more changes are mandated statewide.
2.1d Number of articulation agreements developed in response to baccalaureate institutions’ (BIs’) requirements
Effective 2007In-state: 18Out-of-state: 19
Maintain/review/revise existing agreements. Increase the number of schools with which we have agreements by 2 each year.
We have gained 27 new agreements over 4 years or about 7 each year.Effective Spring 2011 In-state: 41Out-of-state: 23
MET2.1e Annual Dashboard program implementation with feedback loops for program planning
Start year 2010-2011: Program Dashboards implemented and posted on the Institutional Effectiveness website.
60% of program Dashboards implemented, with feedback loops by administrators completed, and results used in future planning.
63% Dashboards completed
MET
TRANSFER ANALYSIS: 2 of 2 TARGETS METTo better assess our academic programs, a new system of program review tools called Dashboards were developed and implemented. Dashboards for each discipline or program are compiled based on a variety of data including FTEs by discipline, completions, ethnic diversity, grade distribution and retention, faculty and student ratios and student successes by modality or time to complete. Dashboards serve as program reviews as to the standards used to evaluate program effectiveness based on indicators such as enrollment, completions, ratios and retention.
RESULTING ACTIONS: An Articulation and Transfer Task Force has been formed to codify our articulation processes
on campus. They developed definitions, a process, and plan for their ongoing work Spring 2012.
More colleges and universities are requesting articulation agreements with the college and with certain programs.
More articulation agreements are being sought by the College to address student requests. The College articulated with WGU, Central Washington University, etc.
27
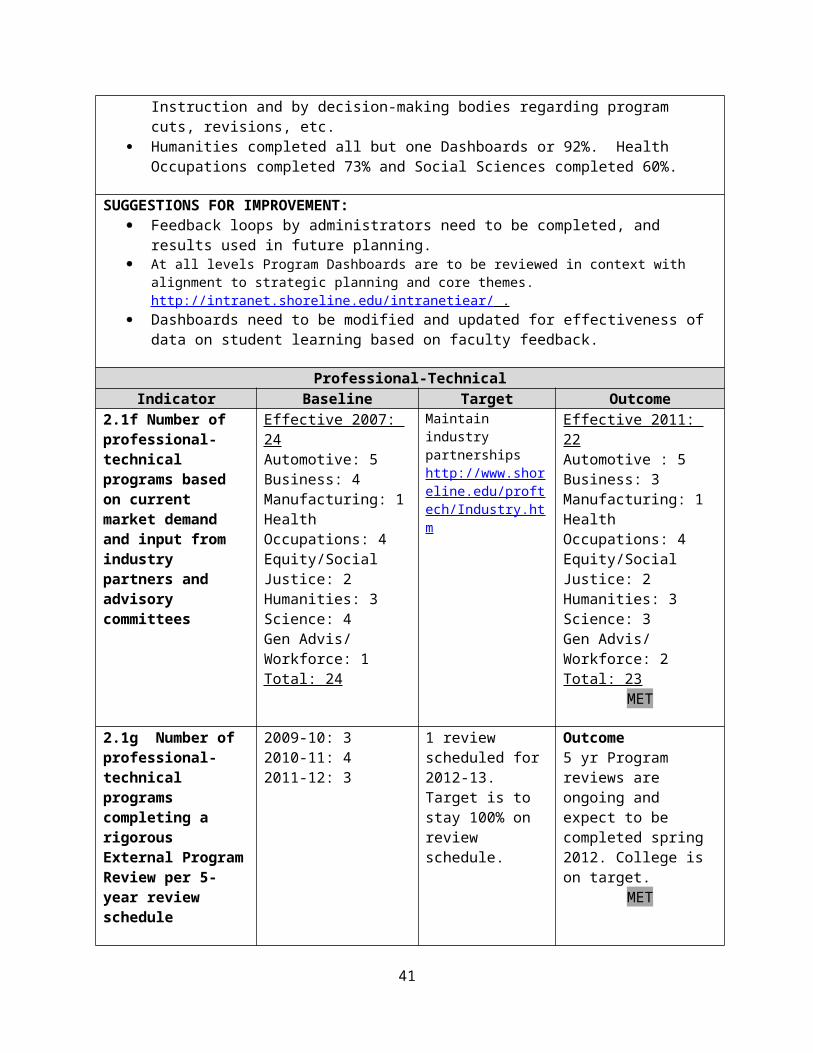
Program Dashboards were reviewed by division deans and Office of Instruction and by decision-making bodies regarding program cuts, revisions, etc.
Humanities completed all but one Dashboards or 92%. Health Occupations completed 73% and Social Sciences completed 60%.
SUGGESTIONS FOR IMPROVEMENT: Feedback loops by administrators need to be completed, and results used in future planning. At all levels Program Dashboards are to be reviewed in context with alignment to strategic planning and
core themes. http://intranet.shoreline.edu/intranetiear/ . Dashboards need to be modified and updated for effectiveness of data on student learning
2.1g Number of professional-technical programs completing a rigorous External Program Review per 5-year review schedule
2009-10: 32010-11: 42011-12: 3
1 review scheduled for 2012-13. Target is to stay 100% on review schedule.
Outcome5 yr Program reviews are ongoing and expect to be completed spring 2012. College is on target.
MET
Indicator Baseline Target Outcome
2.1h Compliance with program accreditation requirements for selected programs
Nursing: WA State Nursing Care Quality Assurance Commission, National League for Nursing AccreditationDental Hygiene: June 2005, American Dental Association Commission on Dental AccreditationMedical Laboratory Technology Program: National Accrediting Agency for clinical Laboratory Sciences.Health Informatics and Information: Management, American Health Information Management AssociationManufacturing/CNC Machinist: National Institute for Metalworking Skills (NIMS) Certification- April 2010Automotive- Honda, GM, Toyota and Chrysler
Sustain 100% compliance with current program accreditation requirements for selected programs.
PROFESSIONAL TECHNICAL ANALYSIS: 3 of 3 TARGETS METSCC is doing well in maintaining its rigorous, standards-based professional technical programs through close ties with industry, five-year (or less) External Program Reviews and sustaining program accreditations and certification processes. Each year with budget cuts, we analyze program sustainability through review processes which require current market data information and current input from industry advisory committees and industry partners who also monitor student learning outcomes to meet current industry standards.
RESULTING ACTIONS: A calendar for scheduling of 5-year External Program Reviews of professional technical
programs was established. Resources will be sustained to maintain the current five-year cycle of program reviews and
program accreditations. The Workforce department weeded out inactive advisory committee members and updated
rosters. Faculty and deans meet to address recommendations made in the External Program Review
process, including recommendations. The VPASA is tracking deans’ and faculty progress on recommendations made in these reviews. A DACUM/Symposium on Digital Media in the Humanities Division was scheduled spring 2012
to maintain close ties with creative arts industries. President Lee Lambert spoke before a U.S. congressional committee in April 2012 on
maintaining closer ties with industry as a key to meeting the skills gap for the American workforce.
SUGGESTIONS FOR IMPROVEMENT: Tracking recommendations from External program reviews needs to be more systematic and
tied to resource allocation, both of college and Workforce resources. Developing new programs based on industry demand and analyses need to aligned more
closely with labor market demand. More systematic labor market demand needs to be established.
Advisory Committee and industry partners need more attention and numbers in some programs.
Budgets should include “minutes takers” for Program Advisory meetings. More resources should be allocated to allow for program faculty certifications and professional
development, including making industry contacts and developing industry partnerships. Cost analyses and program effectiveness measures need to be tightened up to bolster support
for strong professional programs. More resources need to go into keeping in touch with program graduates and with their
employment prospects and job history. The College Foundation is making plans for an Alumni Association for tracking our graduates.
Adult Basic Education and Developmental EducationIndicator Baseline Target Outcome
2.1i Number and percent of basic and developmental education students earning SAI points
AY 2009 710 - 60%AY 2010 759 – 59%
FY 2011 - 58.5%
AY 2011 592 – 58%MET
29
2.1j Compliance with all federal and SBCTC standards and regulations
Curriculum utilized by ABE/GED/ESL programs substantially addresses the WA State Learning Standards and Indicators. General compliance with state-enforced federal guidelines.
Remain in compliance;
pass all audits
In full compliance as assessed 2011 by the SBCTC ABE Onsite Monitoring Report
MET
ABE & DEVELOPMENTAL ANALYSIS: 2 of 2 TARGETS METSCC’s ABE program complies with all state and federal standards, regulations and policies. In 2011, the Shoreline basic skills program was monitored by SBCTC staff who found that the College’s procedures and practices were in full compliance. No changes were recommended or required.
Curriculum utilized by ABE/GED/ESL programs substantially addresses the WA State Learning Standards and Indicators. A representative of the ABE faculty is currently participating in statewide hybrid course designed to train teachers in the use of the new writing standards.
Shoreline’s basic skills student data is accurate and complete. SCC is consistently is among the top five schools in the state in percent of federally reportable basic skills students identified in WABERS and the percent of students who are post-tested by CASAS .
Compliance with WA SBCTC Local ABE onsite Monitoring Report—passed Curriculum utilized by ABE/GED/ESL programs substantially addresses the WA State Learning
Standards and Indicators.
RESULTING ACTION: Of the 12 basic skills program levels tracked by SBCTC for student completions, Shoreline is
above the state average in ten of the areas. The program has undertaken a program improvement project this spring that is designed to boost CASAS scores and completions in the two areas that are below the statewide average.
Members of the College, including the dean of this program, is participating in statewide task force in transforming pre-college education, including basic skills
SUGGESTIONS FOR IMPROVEMENT: Director be 100%, up from previous reduction of 80% to meet budget restrictions More funding for Program chair Stabilize funding GED Advisor position Apply for more grants to support the program and innovation
Library and Information LiteracyIndicator Baseline Target Outcome
2.1k Number of programs collaborating with the library to strengthen our Information Literacy program
English Communication
Studies CEO
2 additional programs
Psychology Chemistry Nursing
MET
OVERALL ANALYSIS: Target: METIn addition to those courses that have embedded a librarian, such as English 101 and Honors, three additional programs are collaborating with the library. Information resources are changing so quickly
30
that an embedded librarian can help subject specialists keep their research skills fresh. Collaboration between librarians and instructional faculty results in up-to-date information literacy skills assignments and learning outcomes.
RESULTING ACTIONS: SCC’s Library has expanded their set of information literacy projects. Currently we have learning guides
for: English 102 (10), Psychology (1), History (2), Marketing (1), the Honors Program (4) and Communications (1). We are exploring even more opportunities to collaborate on designing assignments and/or learning guides.
College librarians use WASSAIL, an open-source software platform for educational assessment, designed primarily for academic libraries, to do pre- and post-testing in the Honors program. We will run pre- and post- testing in all library-run workshops for 3 quarters in a row.
Conversations with English, Communication Studies, Chemistry and Psychology departments occurred regarding building information literacy skills into their assignments and their rubrics.
The Library promoted Noodletools, software that aids in teaching students appropriate reading and writing skills as they apply to incorporating citations, direct quotations, paraphrasing, etc. We monitor the number of instructors who are adopting Noodletools.
A goal is to increase the number of courses that run the Librarian Prescription assignment.
SUGGESTIONS FOR IMPROVEMENT: Adding more programs is essential for students to develop these 21st century skills. Further assignments
in existing collaborations will be initiated as well as developing new guides. Changing information requires more emphasis on finding, evaluating and using information.
All courses assigning research papers will offer the option of using Noodletools. This software teaches students the elements of citation, most especially identifying the source, while de-emphasizing proper placement of punctuation.
Expand the Library staff so that more courses will run the Librarian Prescription assignment, an assignment that requires students to consult with a librarian on a research project.
Most significantly, the Library will use more resources to advocate for teaching and learning of information literacy skills, including meaningful assessment of students’ skills.
2.2 Objective 2.2 has three indicators and 26 sub-indicators, the largest number being participation levels in select student support services.
Objective 2.2: The College provides a rich variety of student support services to enhance excellence in student learning.
IndicatorsBaseline AY 2010
TargetAY 2011
OutcomesAY 2011
2.2a Participation levels in select student learning labs and tutoring servicesThe Writing & Learning Studio (students) NOT MET 990 900 872Math Learning Center (clicks) MET 30,100 30,000 30,400Tutoring Services MET 559 525 540
2.2b Participation levels in select student programsCareer Education Options (CEO) MET 503 500 507Center for Service Learning MET 437 500 778Co-curricular programs 6,553 6,500 6,406Honors Program MET 24 36 43
31
International EducationInternational Student Orientation Program (ISOP) MET 291 275 279Study Abroad Program MET 27 30 40
Learning Center North (LCN) MET 308 325 350Running Start MET 328 325 3452.2c Participation levels in select support servicesAdvising MET 6,363 6,000 6,085Counseling MET 928 500 662Enrollment Services MET 26,795 25,000 25,182Financial Aid
Grants, work-study, loans MET 3,309 3,300 3,467Workforce MET 575 600 756Basic Food Employment & Training (BFET) MET 375 400 551Opportunity Grant MET 291 250 270Work First MET 141 200 283Worker Retraining MET 1,783 1,400 1,407
International EducationInternational Peer Mentor Program MET 436 410 483International Academic Advising MET 2,242 2,000 2,032Immigration Services MET 3,763 3,800 4,090
Multicultural Center & Women's Center MET 3,574 3,500 4,938Services for Students with Disabilities MET 553 600 614Veterans Services MET 401 425 443OVERALL ANALYSIS: 3 Targets and 23 sub-targets: METShoreline Community College provides a wide variety of comprehensive support services, programs, learning centers and tutoring services to enhance excellence in student learning. Student services play a vital role in student learning and student success. The College provides excellent learning assistance to students through its learning labs in the areas of writing and mathematics. The College also provides tutoring services to assist students in numerous courses to enhance student learning. Targets were set using trend data over three years.
Community college students enter through an open door process providing access to higher learning to students who may not otherwise have access to certificate and degree programs. Many students enter requiring financial assistance, academic support, and access to support programs and services in order to succeed.
As state resources have decreased, fewer staff and resources have been available to provide support services at the College, which creates longer wait times, less financial assistance, and fewer programs and services to support students. Although resources have decreased, headcount and full-time equivalent (FTE) have remained strong. This places a strain on the College to serve the same number (in some years more) students with significantly fewer staff and resources. Despite these limitations, the indicators in this report show significant numbers of students serviced by dedicated staff and programs across the College.
The Math Learning Center is clearly a popular resource, with most quarters averaging over 150 visits per day by students seeking MLC services. Students often tell the MLC staff and the Director that they find the MLC to be an excellent resource, instrumental in helping them succeed in their math classes, which is
32
one of the most important reasons they keep returning for help.
Experiential learning promotes excellence in student learning. Many excellent student programs are available to students to apply learning in co-curricular and select programs and activities to achieve a deeper understanding through hands-on experience and support programs. Targets were set using trend data over a three-year period.
While the outcomes for each department exceed the targets, it is important to note that the college’s enrollment dipped from the severe financial crisis, and targets were set in retrospect after some outcomes were available due to the delayed planning process.
RESULTING ACTIONS: The College is deploying limited resources into two primary areas to increase international
student enrollment and support services and enhance eLearning and online support services. Additional staff has been hired to enhance international education efforts. The College is implementing its virtual college initiatives to enhance online learning efforts. Both initiatives seek to increase revenues for the college and enhance support programs and
services. The College will continue to review its organizational structure to determine possible changes
that will enhance student learning and student success. The Math Learning Center (MLC) Director makes efforts to continually improve the level of
service through hiring effective Learning Assistants and providing support and opportunities for them to continually improve their tutoring skills.
SUGGESTIONS FOR IMPROVEMENT: Since state resources are not likely to increase in the near future, the resulting actions will
include further managing existing staff and resources as efficiently as possible and seeking technology solutions to enhance programs and services.
Restore the MLC Director position to full-time, tenure track (instead of the current 80% pro rata temporary position). This would benefit the MLC in several ways, such as allowing the Director more time to work with tutors both individually and in group workshops to further raise their level of skill, and helping the college to retain each Director long-term instead of having a high rate of turnover.
Find ways of increasing funding that do not cost the students additional money to increase the MLC hours of operation and staffing levels.
Collect and record data for other learning labs on campus, such as the Biology/Chemistry Learning Lab and Physics/Engineering Learning Center and sound studios in Music Technology.
Focus on the efficacy of the student support services and programs. The college provides excellent learning assistance to students through its learning laboratories.
The excellence and efficacy of the college’s student learning labs and tutoring services should be demonstrated in the improved academic performance of students who utilize these services.
Core Theme Three: Community Engagement
Core Theme Three Community Engagement is expressed by two objectives and 12 indicators. Some of the indicators are even further detailed to demonstrate the component programs, services and data
33
from which targets were established. There are eight indicators and nine sub-indicators for Objective 3.1 and four indicators and four sub-indicators for Objective 3.2.
Objective 3.1: The College engages the community through partnerships, programs and services to enhance the educational and cultural needs of its diverse community.
Indicator Baseline2008-09
Target Outcome2010-11
3.1a Community partnerships integrated into college programs.Businesses:
BlackBoard Inc. (with SCC) Puget Sound Auto Dealers Association Shoreline-Lake Forest Park Arts Council Chrysler College Automotive Program (CAP) Toyota Technical Education Network (T-TEN) Honda Professional Automotive Career Training (PACT) General Motors Automotive Service Educational Program (ASEP) Pacific Associates (with the Workforce & Continuing Ed. program) TRAC Associates (with the Workforce & Continuing Ed. program) Washington Interactive Network (WIN) Grammy University (with Music Technology program) Snap-On Tools NC3= National Coalition Certification Centers http://www.nc3.net/ NAM=National Assoc. of Manufacturers http://www.nam.org/ Trajal (Hospitality & Tourism Program ) Firebird International Insurance ABODE Homestay USA International
Government Agencies: The City of Shoreline (w/ Small Business Accelerator program) Opportunity, Employment, & Education Ctr., NSCC Depart. of Social and Health Services (w/ Workforce & Cont. Ed.) Office of Refugees & Immigration (w/Workforce & Continuing Ed.) Vehicle Maintenance Management Conference with WSU VISTA/Ameri-Corps Student and Exchange Visitor Program Customs and Border Protection (Dept. of Homeland Security) U.S. Customs and Immigration Services (USCIS) Dept. of State Taipei Cultural Office U.S. Commercial Service Intercollegiate Relations Commission (ICRC) Ministry of Education, China .
Select Organizations integrated into college programs: iSpeak Theater, Seattle Repertory Theatre (with Drama Dept.) Seattle Special Care Dentistry (with the Dental Hygiene program) Northwest Kidney Center (with Dental Hygiene program) WA Interactive Network (w/ Music Tech., VCT & Film programs) Neighborhood House (w/ Workforce & Continuing Ed. Program) Employment Security: Job Connections Ctr. (w/ Workforce & CE) AFL-CIO-The Worker Center (w/ Workforce Development & CE) Audio Engineering Society
PopCap Games with VTC programs Big Fish Games with VTC Programs Shoreline Solar Project (NW Solar Fest) Zinch Consulting in China, PROforma (promotional items vendor for educational fairs) Washington State China Relations Council American Association of Community Colleges (AACC) Center for Global Advancement of Community Colleges (CGACC) Community College International Development (CCID) NAFSA: Association of International Educators Association of Washington International Student Affairs (AWISA) Study Washington Global Washington Washington Community College Consortium of Study Abroad
(WCCCSA), Northwest International Education Association (NIEA) IIE (Institute of International Education) various high school and college partnerships abroad.
Select Educational Organizations: major agreements with SCC Five-Star Consortium (SCC, EdCC, EvCC, LWIT, Cascadia) Number of Learning Center North (LCN) students served……………… Number of Career Education Options (CEO) students served………… Number of College in the High School agreements………………………… WA Tech Prep: Number of Tech Prep articulation agreements……... Campus Compact (Now 2 Service Learning/Mentoring agreements) Shoreline Public Schools High School Transitions Program Community Integration Program (CIP)
50
241/2006390/2006
0X1
Growth 84 CTCs
273/2010503/2010
2612
MET
3.1b Events and programs available for cultural enrichment for the community.
Number of Global Affairs Center programs Number of SCC College Gallery shows Children’s Theater Productions (Drama 226) class
o Number of schools participatingo Number of performances giveno Estimated number of elementary school students
participating Average number of musical events and theatrical programs
available to the community annually in the Little Theatre International Education Week sessions by International
Education Programs
13.58
35
400
21
N/A
159
>36
400
30
N/A
MET
21 MET7
NOT MET
4 MET6 MET
400 MET
34 MET32
sessionsMET
3.1c Annual Dental Clinic services to community members Number of students/patients treated Number students, patients treated w/o health insurance Value of treatments provided
Not available
N/A 48/56535,247
$81,754MET
3.1d Average number of families served at Parent-Child Center
Spindrift magazineo Number of studentso Number of alumnio Number of SCC employeeso Number of community contributors
80
0
10190
2293
47
Growth
Growth
10150 or to
meet demand
Maintain interest & diversity
of contributors
100
4,500MET
11169
MET
2021
43MET
3.1f Number of organizations renting SCC facilities and number of SCC facility rental attendees
Number of organizations renting SCC facilities Number of rental attendees
Not available
6025,000
9630,490
MET
3.1g Non-credit or contract training courses offered for business or professional development Number SCC Small Business Accelerator
workshops/participants Number of 50+ Career Builder classes/students Number of events/people for Dental Hygiene trainings Ajou Automotive Training (2008 – 2011) (# of students) Hospitality & Tourism Program (# of students participating)
81/767
N/AN/A1845
90/800
N/AN/A18+45
81/655
38/2015/650
2045
METRationale:Baseline data for Small Business Accelerator program are only for 2010 and Outcome data were estimated based on the 7 months of data provided for 2011. 50+ Career Builder program data and Dental Hygiene data were first collected in 2011. Dental Hygiene Outcome data is for academic year 2010-2011. Non-credit or contract training courses respond to the needs of businesses and professionals. Our Business Accelerator program provides workshops on a variety of topics to assist local professionals and small businesses and to develop learning or internship opportunities for students and community members.
3.1h Active professional-technical advisory committees and involvement levels of program advisory committee members
36
Number of professional/technical advisory committees Number of industry program advisory committee
members
25304
23 2%
increase
23343MET
OVERALL ANALYSIS: Target: METSome of the data in this section is newly gathered based on meeting the specific Core Theme objective. The College is developing a culture of evidence, and this indicator was not counted prior to the development of the Core Theme objective. The data suggest that the college significantly engages its surrounding community in a wide variety of ways. The fact that it is continuing to do so despite recent economic stresses seems noteworthy. The College has maintained most of its low cost services for the community and has been actively engaged with the community to form more partnerships to withstand the serious economic difficulties of the state for the past few years. More collaborations have been forged with businesses in the community. More collaboration has ensued in spite of consolidations.
RESULTING ACTIONS: In spite of economic analyses suggesting the high expense, the College decided to maintain our
childcare center to assist students and staff. Established 2011 as baseline year for several indicators including 50+ career builder classes and
Dental Hygiene events and patients from the community, etc. The Workforce Office now tracks the number of active members who attend program meetings.
Others have been weeded out after a request to identify their willingness to continue to participate.
The Small Business Accelerator offered free trainings a few years ago and worked with several local businesses; it now works more closely with the City of Shoreline and its Economic Development office.
The College advertises more now about rental of its facilities.
SUGGESTIONS FOR IMPROVEMENT: With some of the indicators, data collection was only recently begun. Collection of additional
data in future years should help indicate whether the indicators and the data supporting them are in fact valid and reliable measures of our Community Engagement Core Theme.
Specific functional/departmental areas of the college who are responsible for specific types of community engagement indicators need to be identified and it is recommended that these targeted areas be primarily responsible for continuing to collect this data.
A standardized data collection form for the accreditation process would also be helpful. With regard to the future tracking of college events offered to the community, it would be
beneficial to create some kind of tracking/categorization feature within the Day at a Glance (DAAG) event tracking system.
3.2 There are four indicators and four sub-indicators for Objective 3.2.
Objective 3.2: The College provides opportunities for employees and students to participate actively and serve within the community.
Indicator Baseline Target Outcome3.2a Percentage of employees engaged in community service (self- No previous 50% 78%
37
reported) data MET
3.2b Number of students who participate and serve within the community Curricularo Number of students servingo Estimated service hours completed
Co-curricularo Number of students servingo Estimated service hours completed
Did not collect data previously N/A 467
6,622
255729MET
Indicator Baseline Target Outcome3.2c Average number of Service Learning classes the College offers annually 20011-2012: 22 (Sum – 1; Fall -7; Winter – 7; Spring -7) 2010-2011: 24 (Sum – 1; Fall – 11; Winter- 6; Spring – 6) 2009-2010: 30 (Sum – 0; Fall- 11; Winter- 9; Spring – 10)
30 Sustain campus interest
22
MET
3.2d Number of student mentors and participants in the HEROES mentoring program
10 mentors3 students
Grow the program.
29 mentors116+
StudentsMET
OVERALL ANALYSIS: 3 of 3 TARGETS METSERVICE LEARNING: Service learning has become a staple initiative on the campus, and more and more faculty are developing courses using a service leaning component.
HEROES: Through support by Campus Compact, the College has developed a specialized student mentoring service learning program called HEROES that engages ESL and GED students in one-on-one and group mentoring activities and service learning. Through efforts of the alumna coordinator, this program is growing in depth and activity. Campus Compact even awarded us another grant to sustain activity level.
RESULTING ACTIONS: The College increased the release time for a faculty service learning coordinator. This year the College engaged in a one-theme approach to Service learning to engage the
campus. The theme was food, and many faculty, students and staff participated. About 44 current ESL and GED students have participated in one or more HEROES club meetings,
one-on-one meetings and/or workshops this quarter and 19 current ESL and GED students have participated in multiple HEROES activities: MLK Food Drive with a team total of 20 volunteer which included 8 community members and 12 SCC students and an Emergency Food Bag service project with 9 HEROES students who volunteered to sort food from the on campus food drive into emergency food bags for students in need.
HEROES program united with the campus theme to bring a united sense of college community. This year we have had 25 official mentors and 28 official participants in the HEROES program. This
is using the AmeriCorps classification where students are seen as being "official students" if they have attended 3+ activities.
All current/very recently transitioned ESL, GED, ABE, and CEO 101 students are classified as "participants," and all students in college courses are classified as "mentors.”
SUGGESTIONS FOR IMPROVEMENT:
38
Find a stable source of funding for the Ameri-Corps positions on campus. Find a stable source of funding for Service Learning on campus. Develop a college-wide committee that supports and reinforces service learning beyond what we
have now, including training and support for part-time faculty.
CORE THEME #4 Access and DiversityCore Theme Four was expressed by two objectives and 14 indicators. Some of the indicators are even further detailed into 29 sub-indicators to demonstrate the component programs, services and data from which targets were established. Objective 4.1 has nine indicators and 21 sub-indicators, and Objective 4.2 has five indicators and eight sub-indicators.
Objective 4.1: The College provides access for diverse populations.Indicators Baseline Target Outcomes
4.1a Total Annual FTEs AY 2010 AY 2011 AY 2011FTEs by Funding Source
State Supported 5,352 5,299 5,182Contract Funded MET 468 500 591Student Funded 76 50 37
FTEs by Purpose for AttendingTransfer MET 2,246 2,226 2,232Workforce 2,318 2,294 2,099Basic Skills/Other MET 788 779 851
FTEs in Selected ProgramsI-BEST MET 195 195 213International Students 755 755 729Worker Retraining MET 367 367 446
39
Running Start MET 151 151 156eLearning (online, hybrid, other) MET 1,296 1,296 1,482Veterans 297 356 443
4.1b Percentage of students receiving need-based Financial Aid 29.2% 30.0% 30.2%MET
4.1c Percentage of students of color (Fall Enrollment)Supplemental data: Fall enrollment 2010 Asian/Pacific Island..............919
Indicator Baseline Target Outcome4.1d Demonstrated engagement and learning opportunities for students, faculty and staff on multicultural/ diversity issues
No certificates, just a 5-credit course requirementSCC started with a 3 or 5-credit multicultural course requirement, modest levels of campus engagement except for strong curriculum transformation goals and mindset. We had a Multicultural Diversity Center and an Intra-American Studies department and various multicultural diversity activities on campus.
Develop at least 2 more courses that meet the multicultural requirement.
Hire more faculty to teach these courses.
Provide more programs and activities to increase the level of staff training for multicultural understanding.
SCC offers 2 certificates in Multicultural Understanding; open student panels each spring to discuss what the courses meant to them; some courageous public conversations student clubs (African American Club, Native American Club, Students of Color Caucus) offer the campus; increased campus trainings for faculty and staff; increased course offerings that meet the multicultural general education requirement; and more courses that broaden multicultural understanding.
MET
OVERALL ANALYSIS:The measure of this is multifold: In the assessment surveys In the open panels done each spring where students discuss what the multicultural understanding
courses meant to them In the courageous conversations the African American Club and others have had on campus In the Students of Color activities on campus
RESULTING ACTIONS: Multicultural course offerings and trainings for college personnel 2009-2011 Development of two multicultural certificates Reorganization of Intra-American Studies into Equity & Social Justice department Hire of 2 new multicultural specialists, one in ESJ and one in Communication Studies. Growth in the number of Drama department presentations around multicultural/diversity and social
40
justice issues Growth in the number of courses that contain multicultural understanding student learning outcomes
to 380 courses or 18.26% of all courses in our online master course outline system Elimination of the three-credit multicultural course Growth in the number of courses that meet our multicultural understanding general education
requirement Faculty Learning Community in Critical Multicultural Understanding; ESJ, Communication Studies, some History
faculty, some deans attend meetings. Annual Retreat Rainbow Lodge, in April 2012..
SUGGESTED IMPROVEMENTS:Equity & Social Justice (ESJ) has been working on research progress to assess multicultural understanding for several years, with many stops and starts.
We started with a long pre/post Survey in Multicultural Understanding and beginning in Fall 2011, wrote a shorter pre/post survey, based on our experiences in previous years with this project.
We developed a protocol and hired a statistician to analyze the quantitative results. At the same time, we added some qualitative questions to the survey. Winter 2012 will be our first batch of data using the new protocol for data from assessment of
for most of the multicultural core courses offered. We worked through the data analysis, eliminated the confounding variables and wrote protocols for
consistent data collection. Then we analyze for significant differences and produce a report for the college.
The Faculty Learning Community’s work will now be to disseminate their findings even further statewide.Indicator Baseline Target Outcome
4.1e Admissions and placement assessments available to diverse students
Number of COMPASS tests administered. 2007-08: 3,285 2008-09: 3,871 2009-10: 4,195 2010-11: 3,894
Number of CASAS appraisal tests and pretests administered. AY 2009 1,184 AY 2010 1,288 AY 2011 1,014 *Adjusting to loss of LCN & CEO counts
Alternative assessments for placement Prior Learning Assessment (PLA)
CLEP Tests
Advanced Placement (AP)exemptions
International Baccalaureate (IB)
3,285
1,184
CPEL Policy
Varies
25 AP
No policy
1% increase
1,000*
Increased number of alternative
assessments
3,894MET
1,014*MET
PLA Policy
Varies
31 APAdopted IB
policy
41
METANALYSIS :The CASAS appraisal and pretests provide access to college programs and services. CASAS is required by all Basic Skills students, immigrants, ESL students. About 200 LCN Students did not take the CASAS test because they were no longer being reported to SBCTC in WABERS. We expected this drop. Our ESL numbers were reduced by a small percentage and thus we administered fewer tests.
COMPASS test is an indicator of new students with intent to enter SCC, but may not be an accurate indicator of students who may be transferring or obtain admission in other ways (SAT, etc). Number of COMPASS test decrease matches decrease in enrollment over same period of time. New SCC students (but not new to higher ed) may be transferring in English or Math classes or test scores via other methods.
The CASAS appraisal and pretests provide access to college programs and services for all Basic Skills students - resident second language speakers and ABE / GED students. CASAS is required by Washington State to meet eligibility for the federal grants supporting Basic Skills programs. It is used as part of the placement process for new students, and measures progress in meeting achievement points. It is used to measure progress in the ORIA grant.
The number of CASAS pre-tests fell in 2011 because LCN students, who were previously coded as Basic Skills and therefore were CASAS tested, were re-coded as contract students supported by the K-12 system.RESULTING ACTIONS:
Compare to decrease in headcount enrollments for analysis. Confirm new students who transfer in courses or testing scores.
SUGGESTIONS FOR IMPROVEMENT: New student testing may not be good indicator for success as we look for transitional ease of
entry. The basic skills program is implementing the new web-based e-CASAS online testing in three
stages.o In FY 2013 the College will pilot the e-CASAS with one I-BEST program.o In FY 2013, the e-CASAS will be used with all entering I-BEST students.o In 2014, all new students will assessed with e-CASAS.o The benefits are that overall Appraisal and Pre-Testing time will be cut in half.
Challenges include reliability of new CASAS product and support and finding enough computers and computer lab space during pre and post-testing periods.
Indicator Baseline Target Outcome4.1f Number of I-BEST programs and student enrollments.
AY 2010Annualized FTE 292General Service Technician 65CNC Machining Cohort 1 58CNC Machining Cohort 2 38Office Technology 45Nursing Assistant 76
Add at least 1 IBEST program and increase FTEs.
AY 2011 & 2012Annualized FTE = 213
Initiated 2 new I-BEST- related programs to increase basic skill student transition.
NOT MET/MET
4.1g Average number of Tech Prep students coming to Shoreline over 3 years (2008-2009)
ANALYSIS: SCC is providing access for online students from a variety of regions. It is part of our Virtual College initiative. Online enrollments will continue to rise with expanded course offerings and ease of technology use improves for both students and faculty. However, the “online” definition continues to be defined in terms for the student and faculty in respect to instruction at the campus and state level. In 2010-2011, we had 3,072 online FTEs. This is an increase of 1,156 FTEs over the baseline or approximately 60% increase in three years’ time (averaging 20% increase each year). For next year our target may be a bit lower.
Target for 2011-12: 3109 online FTEs, which is an increase of 37 FTEs or a little more than 1% increase. The pattern of growth is slowing and has plateaued at the state level and SCC is mimicking that statewide trend. Growth for all of eLearning will be web-enhanced courses.
FTES 2008-09 2009-10 2010-11Online 757 898 935Hybrid 382 378 507All other eLearning 19 20 40Total eLearning 1158 1296 1482Web-enhanced Not counted statewide Not counted statewide 1551
RESULTING ACTIONS: Increased activities to support technology and online learning for faculty and students as
bandwidth is stretched. Financial and time resources have been increased across the campus to support activities for
online courses, course development and expansion.
SUGGESTIONS FOR IMPROVEMENT:To offset a counter balance towards a specialized online community, the College should continue to look at online enrollments for analysis to determine support for maintaining or expanding initiatives, and balance resources towards face-to-face instruction.
OVERALL ANALYSIS: 9 of 9 TARGETS METThis objective demonstrates both strength and weaknesses of the College. We met only 7 of 12 specific enrollment targets, yet we are strong in alternative assessments and placement processes that we used as indicators. Some of our strategic approaches such as I-BEST, Tech Prep, online, and international are strong and show development and growth. Other areas do not. Three out of the 4 programs are consistently enrolled to capacity and have waiting lists. Completion rates are high. Job placements, particularly in our machining program IBEST are very high, particularly with Boeing in the region.
Veteran student enrollment is an indicator of potential increased access for veterans to the college. Veterans also provide diversity to our student population. It is expected that our new Veterans Center will increase this access and diversity to the college. Definitions: 1) The Centers of Excellence for Veteran Student Success (CEVSS) grant defines a student veteran as any person who has served in the military and not received a dishonorable discharge.
43
2) The Veterans Program Office serves student veterans by that definition and also serves active duty military students, dependents (as defined by the Veterans Administration) and spouses on military scholarships. 2007-10 is based on average of 4 years.
Data here suggests that the two primary college initiatives—globalization and virtualization are right on track. Online enrollments and the variety of how they are tabulated demonstrate that this is a stable and growing means of access for students.
RESULTING ACTIONS: To accommodate the growing need for CASAS testing, we hired an Assessment Specialist in 2008
who focuses strictly on administering CASAS appraisal and pretests. She has maintained some of the highest percentages of post-tested students in the state system.
CASAS: Implemented Converted to online web- based test which should increase access. It shortened the process for students and combined the appraisal and the pretest together.
It now allows us to administer test in any computer lab. Test has become adaptive and will also shorten time to placement. The program set up a new testing lab near the Transitional Programs Office.
SUGGESTIONS FOR IMPROVEMENT: The program will start making the Testing Center facility with more computers available for
larger group testing. The goal for next year is to test all IBEST students (including the appraisal) and test using the
web-based version of the test, reducing time to placement. This time allows for us to incorporate a broader orientation to students. The importance of the CASAS test will be reinforced with ESL faculty this year and next to
hopefully align better with state learning standards and assessment measures.
4.2 Objective 4.2 has five indicators and eight sub-indicators.
Objective 4.2: The college recruits, employs and develops a diverse college workforce.
4.2c Gender proportion of all College employeesAs of Fall 2012, per IPEDS, the College has 231 male employees and 353 female employees. Their respective race/genders are:
Quarter SCC System Gender Difference Male Female Male Female SCC System MeasureFall 2008 39.5% 60.5% 42% 58.0% 21% 16% 5%Fall 2009 37.7% 62.3% 42.3% 57.3% 25% 15% 10%Fall 2010 40.7% 59.3% 42% 58.0% 19% 16% 3%
Baseline
21%
Target
16% or <5%
Difference from
system average
Outcome
19%
MET
OVERALL ANALYSIS:Demographic workforce data for employees of color is one significant indicator of our status in developing and sustaining a diverse workforce. The system average for employees of color is a relevant comparator because of the substantial similarity among all Community and Technical Colleges for qualified faculty, staff, and administrators. Our local work force profile data compared to the System average for these specific populations indicates we are exceeding the system average.
RESULTING ACTIONS: The College will continue to follow its established recruitment practices that promote diversity
among qualified candidates for employment. We continue to monitor employee demographic profiles and other relevant workforce data to
assess the development of our workforce diversity in relation to the communities we serve.
SUGGESTIONS FOR IMPROVEMENT:Sustaining and developing a diverse workforce requires continuous process improvement, and we will proceed to refine and develop relevant indicators for analysis of this important objective. The College will also continue to develop improved procedures for collecting and analyzing relevant workforce data to analyze. This will include determining specific and relevant statistical measures to evaluate our current workforce profile and determine substantive objectives for future recruitment and workforce development.
4.2d Financial resources for employee professional development (participation levels, and number of ongoing training activities)Faculty: Amount from the Faculty pools on faculty trainings
Full-time faculty: 2009-10: $1,970 of $8,000 6 served
Part-time faculty: 2009-10: $13,600 of $19,500 55 served
Baseline
$8,000
6 FT
46 PT(AVG.)
Target
$8,000
8 FT
50 PT
Outcome
2010-11: $727 of $14,000 6 served
2010-11: $5,945 of $25,400 38 served
45
Staff: 2009-10: $4,546 of $6,500 or 70% expended
Administrators: Average number of annual college-sponsored training sessions:2010-2011: 6 training sessions for Operations (admin.)
# of ongoing training sessions for faculty, staff & admin.
64%
6
Varies by topic/dept.
65%
8
Some consistency
2010-11: $3,756 of $6,500 or 58% spent
2011-2012: 7 Operations and supervisor trainings
ConsistencyMET
4.2e Number and percentage of staff performance evaluations completed annually
*Faculty evaluation deferrals are made for the following reasons: resignation, medical and other leaves of absences, sabbatical, assignment of administrative or special project duties.
13%
12%
83%
80%
80%
60%
8%NOT MET
15%NOT MET
63%MET
OVERALL ANALYSIS: 4 of 5 TARGETS METThe amount of money spent may not be proportionate to professional development outcomes for all staff. Full-time faculty are granted a set amount of money regardless of additional funding available in pool. While financial resources are available, time is also critical to the analysis. Sufficient time or the timing of applicable professional development is significant. Teaching loads, staffing and workload may dictate the amount of time for professional development for faculty.
Annual classified and administrative employee evaluations require significant improvement. To achieve this, the President now requires that administrators will ensure that a minimum of 80% of those evaluations are current within two years, with substantial progress demonstrated in the interim. For administrative evaluations, a minimum of 90% must be current within two years.
RESULTING ACTIONS: The College encourages professional development for all employees.
46
The College is increasing training opportunities using emergent technology and traditional methods.
Training outcomes and employee satisfaction with training are routinely evaluated by assessment forms, observation, and surveys.
Additional training is under development to support updated processes, new systems technology, and new applications such as Degree Audit.
SUGGESTIONS FOR IMPROVEMENT: Sustain current professional development opportunities and funding appropriate for all
employees. Develop training to support emergent technological developments, the College Website and new
applications and programs such as Degree Audit, etc. Strategies for achieving evaluation objectives for all employees will be
o (1) review of evaluation training with administrators, ando (2) formal performance expectations for all administrators regarding completing timely
evaluations, with explicit consequences for noncompliance.
CORE THEME 5 College StewardshipCore Theme Five was expressed by two objectives and 10 indicators. Some of the indicators are even further detailed to demonstrate the component programs, services and data from which targets were established. Objective 5.1 has six indicators and five sub-indicators. Objective 5.2 has four indicators and eight sub-indicators.
Objective 5.1: The College manages and monitors its financial resources available for student learning and success.
*In addition there was one time contract revenue of $226,023
Baseline
$130K$166K$ 60K$ 22K(-$24K)
Target
$150$166K$ 70K$ 25Kflat K
Outcome
(See notes*)
NOT MET
OVERALL ANALYSIS: 5 of 6 TARGETS MET5.1a & 5.1bThe Board of Trustees approves on an annual basis the College budget. The budget always reflects a balance of anticipated revenues and projected expenses. The Board then receives budget status reports and updates throughout the year. Meeting annual budget projections is an effective indicator of financial viability. The college has consistently performed within its targeted range with respect to operating budgets, despite the tenuous economic climate and annual reductions in state financial resources. The larger variance in expenditures in 2010/2011 is a product of prudent budget management demonstrated campus-wide. Conservative budget and fiscal policies, procedures and controls have worked to keep spending under control. In addition, budget and spending data are readily available to administrators, deans and directors, thus facilitating timely monitoring and rapid response when needed.
RESULTING ACTIONS:
48
As budgets have diminished, the college has had to stretch existing resources and reduce services. Currently, SCC is devising future strategies to adapt to changing conditions. While the administration anticipates budget reductions to ebb at some point, it does not anticipate funding restoration to previous levels.
Given the current financial condition of the state, the college must seek alternative sources of funding in the coming years.
As its emphasis on fundraising has yielded inconsistent results, the college is currently investigating ways to build its capacity to secure grants and contracts (federal and other).
At the present time the administration is moving forward to hire a person dedicated to grant writing, in the hopes that this new addition will increase revenues from these sources over the next 2-3 years.
The college also recently introduced a mechanism by which faculty, directors and others across campus can introduce and then implement new ideas and revenue-generating strategies.
To date, several programs have been introduced and are under consideration.
5.2 Objective 5.2 has four indicators and nine sub-indicators.
5.2: The College manages its facilities, technologies, and infrastructure to maximize studentlearning and success.
Indicator Baseline Target Outcome5.2a Availability and usage rates of technologies that enhance teaching and learning
Number of classes (sections) with Blackboard LMS available Percent of total sections Number of classes (sections) using Tegrity lecture capture Percent of total sections
2008-09
1,77790%
00%
All100%1005%
1,969100%1297%
MET5.2b Availability of rooms with mediated technology
Total number of rooms with mediated technology Percentage of rooms with mediated technology
o Percentage of rooms with Tier 1o Percentage of rooms with Tier 2o Percentage of rooms with Tier 3
11280%43%34%3%
Increase and
improve on all
levels.
11582%44%35%3%
MET5.2c Rate and cycle of technology replacements or upgrades including hardware and software
MET5.2d Completion rate of facility repairs and improvements identified and funded from the Facility Condition Survey (Repair A capital funds)
Baseline
100%
Target
>95%
Outcome
100%
49
2007-2009 biennium: 19 projects funded, 19 completed 2009-2011 biennium: 9 projects funded, 9 completed 2011-2013 biennium: 10 projects funded, in process to
complete—only first year of the bienniumNOTE: Two projects are on hold and a request may be needed to re-purpose these funds so that projects in progress are fully funded, as cost estimates from completed design phase do not match funding presently allocated.
MET
ANALYSIS: 4 of 4 TARGETS METThe Facility Condition Survey, conducted every two years by a firm contracted through SBCTC, provides a key report that identifies facility deficiencies. The primary focus of these assessments is to identify Repair A deficiencies that can be funded by the State Legislature in the next biennium for “replace in kind” projects that are intended to keep the buildings/facilities properly maintained, especially where student services and student learning spaces are located. Repair A project examples include and are not limited to a new roof/ roof repairs, new HVAC system or new HVAC equipment, and addressing structural issues. The deficiencies and proposed improvements are presented to PSET and SET for input because funding is never fully adequate to meet the identified needs. As a result, first priority is given to improving spaces that serve students. The VP of Administrative Services and the Director of Facilities & Capital Projects, with the approval of the VP of Academic and Student Affairs, determine the scheduling of projects.
The College Master Plan was started in 2008 and is nearing completion. It became a new and important guide to identify buildings where specific projects should be assigned to them. For example, you don’t want to spend capital funds on a building you intend to replace in 10 years or less. Over the last four years, the college has placed a high importance on spending capital funds to improve student spaces (classrooms and student services), keep the facilities properly maintained, address ADA issues, and address safety and health issues related to the condition of our facilities.
All of these factors have sometimes made it necessary for the College to request the repurposing of some Repair A and Minor Works capital funding, which was approved by the Office of Financial Management (OFM). The key reasons to re-purpose capital funds have been to support the Master Plan, fully fund the highest priority projects, and to do everything possible to achieve the College’s longer range goal of constructing new Allied Health and Science replacement buildings.
Technology on the campus in this time of innovation and change has maintained a schedule consistent with industry best practices for the useful life of the equipment.
RESULTING ACTIONS:Hard copies of the Facility Condition Survey Report are kept by the Director of Facilities & Capital Projects.The Facilities/Capital Projects Website (http://intranet.shoreline.edu/Intranetfacilities/) is accessible to the college community and provides detailed information concerning capital projects, building standards and other facilities-related information.
For our Technical Services (TSS) some actions have been: Completing a Technology Survey to the campus in April 2012. Replacement cycle tied to technology Implementing a new campus technology fee that assures the timely replacement of all
instructional computers, equipment and student labs. A number of labs had not been funded by any dedicated resource fees. The math, ESL TWLS and biology labs are now funded with dedicated resource,
50
Smart classrooms, which had never had a seen replacement budget, now have some budget based on the new technology fee.
We virtualized our server room: Instead of 230 servers, we will have 8 “sliced” multi-purpose servers. Each server now runs multiple servers on the same computer to give us some “fail-over” to provide automatic restart in case of failures.
SUGGESTIONS FOR IMPROVEMENT: On April 16, 2012, the College sent their 2013–2015 Request for Capital Funding to the SBCTC for
consideration. It includes nine Repair A projects related to roof replacements/repairs and HVAC improvements.
Also, we requested a Minor Works project to improve the 3000 building, which has student spaces that could be far better utilized and made more inviting to students.
Technology Support Services (TSS) made requests to hire more skilled technical personnel such as a senior level technician and an additional programmer
Requests were made for additional funds to maintain a steady replacement cycle for faculty and staff computers.
We are starting to provide laptops for faculty which are typically more expensive than desktop computers Develop and procure a budget for IPADS and other technologies used frequently by college