IGCSE Geography Fieldwork Guidance Booklet Contents IGCSE Geography General Background Information Page 2 IGCSE Geography Fieldwork Background Page 3 Sections to be completed; Title page Page 4 Contents page Page 4 Introduction Page 5 Methodology Page 6 Actual methods Page 6 Evaluation of Methodology Page 7 Environmental quality survey results Page 8 Analysis of environmental quality survey results Page 10 Questionnaire results Page 9-10 Analysis of questionnaire results Page 10 Land use maps Page 11 Land use results Page 12 Land use analysis Page 13 Secondary evidence Page 13 Evaluation Page 14 Conclusion Page 15 Glossary Page 16 References Page 16 General Presentation guidelines Page 16 Notes section Page 17 1 | Page
Transcript
IGCSE Geography Fieldwork Guidance Booklet
Contents
IGCSE Geography General Background Information Page 2IGCSE Geography Fieldwork Background Page 3
Sections to be completed;
Title page Page 4 Contents page Page 4 Introduction Page 5 Methodology Page 6 Actual methods Page 6 Evaluation of Methodology Page 7 Environmental quality survey results Page 8 Analysis of environmental quality survey results Page 10 Questionnaire results Page 9-10 Analysis of questionnaire results Page 10 Land use maps Page 11 Land use results Page 12 Land use analysis Page 13 Secondary evidence Page 13 Evaluation Page 14 Conclusion Page 15 Glossary Page 16 References Page 16 General Presentation guidelines Page 16 Notes section Page 17
1 | P a g e
IGCSE Geography Fieldwork Guidance Booklet
IGCSE Geography General Background Information
How will you be assessed?
The fieldwork is marked out of 60 and amounts to 27.5% of your final IGCSE grade.
You will also have two examination papers;
Paper number
How long and how many marks?
What’s in the paper? What’s the % of the total marks?
Paper 1 1 hour 45 minutes(75 marks)
You must answer three questions from six, one from each theme. There are two questions on each theme.
45%
Paper 2 1 hour 30 minutes(60 marks)
The questions test your skills in interpreting and understanding geographical information including maps. You answer all the questions
27.5%
Paper 3 Coursework
You will devise a hypothesis which you then investigate. You will be given marks in five different areas. Each area is marked out of 12.
Skill 1: Knowledge with understanding
You will be assessed on how well you understand the geographical ideas of the investigation. You will describe the aims of the investigation and explain these using geographical terms.
Skill 2: Observation and data collection
You will be marked on how well you carried out your data collection. You must also show ideas of your own about data collection which go beyond those your teacher told you about.
Skill 3: Organisation and presentation of the results
You will also be marked on how you organised and presented your data, (e.g. put it into graphs or display it on maps). Better presentations are more varied.
Skill 4: Analysis and interpretation
You need to write down what your data means. You need to both describe the patterns that you find in the data and explain the reasons for the patterns.
Skill 5: Conclusions and evaluation
You will be assessed on how well you are able to conclude the investigation. Did you prove your hypothesis? What data or evidence did you find to support your concluding decisions? You will be marked on how you criticise and evaluate your data collection methods. You should also suggest better ways of collecting the information for a future investigation.
IGCSE Geography Fieldwork Background
This fieldwork requires you to investigate the following question;
2 | P a g e
IGCSE Geography Fieldwork Guidance Booklet
“Is tourism in Douglas at Stage 5 (decline) of the Butler Model of Tourist Area Evolution?”
This question will be the centre of your fieldwork, when you are collecting the information on your trip, investigating secondary evidence, analysing results to ultimately come to a conclusion and produce an answer.
You will have been given a fieldwork booklet, which you will use on your fieldwork trip.
Sections to be completed
You will need to have the following things included in your fieldwork, in this order (you will be given a checklist so that you can tick each one as you complete it)
3 | P a g e
You will complete all four pages while you are out in Douglas. There will be some guidelines on what you need to do which will help you on the day.
There will be maps provided in the booklet of the four sections of the prom, with 8 different points.
You will stop at each point and carry out an environmental quality survey which is present on the first page of the booklet.
As you move along you will also fill in the land use of the buildings onto your maps.
Finally on page two there will be a questionnaire for you to use. You must ask 3 different people and gain for your results.
Look after this booklet, as it will be your main source of information in our investigation and write up.
This will be under ‘Skill 2: observation and data collection’ when your fieldwork is being marked.
IGCSE Geography Fieldwork Guidance Booklet
1. Title page
This will be the first thing the examiner sees, so make a good impression.
Make sure you put the title of your investigation on the front cover, your name, candidate number and centre number. You could also place an image of Douglas there too, (something that relates to the investigation).
2. Contents page
This is just simply a list of all the named pages in your fieldwork document with a page number beside it. The contents page for this document will be a helpful example for you to use when creating your own.
3. Introduction
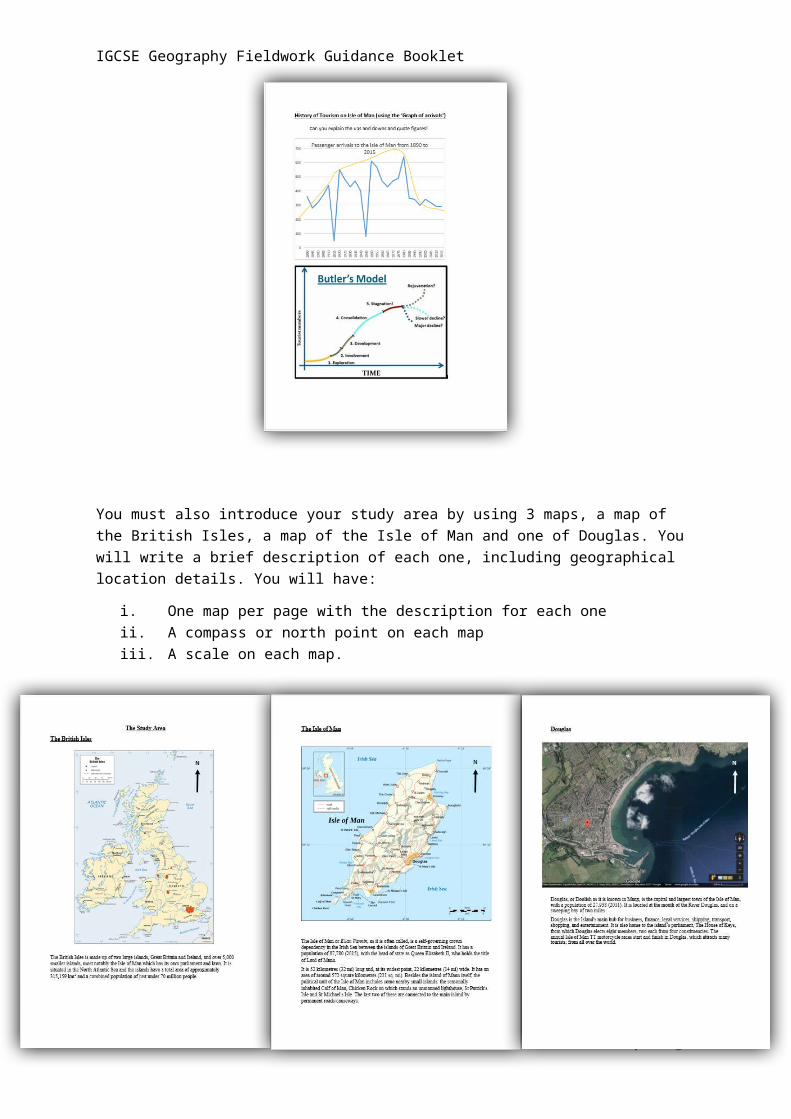
You will be required to show some background knowledge and information regarding your study area, for example some historical information about the history of Douglas as a tourist destination. The use of the Butler Model and a tourist arrival graph would be required to show this historical information.
4 | P a g e
IGCSE Geography Fieldwork Guidance Booklet
You must also introduce your study area by using 3 maps, a map of the British Isles, a map of the Isle of Man and one of Douglas. You will write a brief description of each one, including geographical location details. You will have:
i. One map per page with the description for each oneii. A compass or north point on each mapiii. A scale on each map.
4. Methodology
5 | P a g e
IGCSE Geography Fieldwork Guidance Booklet
Here, you will write about what you need to do to collect the necessary information for your investigation. There will be three methods which you must carry out;
i. Questionnaireii. Environmental Quality (Bi-Polar) Surveyiii. Land use survey
You will write what each method is and why it will be useful for your investigation.
5. Actual methods
This section is slightly more accurate, here you will be required to explain your three methods, step by step, so how you will gather the necessary information. The following guidance will help you to structure your methodology.
i. Questionnaire section Where did you interview people? What time?How did you approach them? What questions were asked?Who in your group did what?
ii. Bi - polar survey sectionWhere did you conduct the surveys?How did you carry out the two parts of the survey? - General environmental quality on on-shore area (maintenance) and general environmental quality on on-shore area (appearance)Why did you conduct this survey?
iii. Land use sectionHow did you know what the land use was? – did you create a key?How exactly did you record your land use?Why did you do it that way? Remember exactly which level (floor) did you look at – was it all ground floor?
6. Evaluation of Methodology
6 | P a g e
IGCSE Geography Fieldwork Guidance Booklet
In this section you will be given the opportunity to evaluate – determine how useful, appropriate and good the quality of your results were in trying to answer your fieldwork study question, “Is tourism in Douglas at stage 5 (decline) of the Butler Model of Tourist Area Evolution?”
You should discuss in class and with a partner the following questions before you start.
i. How effective were the data collection methods? ii. How could it be improved?
iii. What other info might have been useful?iv. Any health and safety issues?v. How accurate was the collected data?
vi. How issues about the data collection and accuracy might have affected your results?
Then discuss the reliability of your methods and your evaluation of them. Could you have done things differently, for example;
i. Collected your data at different time day/week? Would it have given you a clearer picture to help you answer your question?
ii. Would using another/different sites have given you clearer results?iii. Would the time of day or weather conditions reduce your numbers of people/tourists
you could interview?iv. If building work was occurring, might it have affected your results?v. Was the range of data too narrow? Should it have been broadened out to get a more
accurate picture?
You will use this table for your evaluation. Complete each column and do so in detail.
7 | P a g e
IGCSE Geography Fieldwork Guidance Booklet
7. Environmental quality survey results
Once you have collected the results for each of the 8 points, we will combine them as set of group results. This set of group results will be presented in a table, which you will include in your fieldwork.
You will then create a graph for each of the 8 points, you stopped at. This will be a bi polar graph in the form of a bar chart, showing both the attractiveness and maintenance on the same graph.
8. Analysis of environmental quality survey results
You now need to write an analysis for your results. You will have made general comments about each graph in the section before.
As a guidance for structure you should be trying to find answers to the following types of questions;
What was the highest scoring area for attractiveness and maintenance? Why was that/were they the highest scoring area(s)? What evidence do you have for this? What was the lowest scoring area for attractiveness and maintenance? Why was that/were they the lowest scoring area(s)? What evidence do you have for this?
9. Questionnaire results
8 | P a g e
When presenting your results, you will have two graphs per page.
You will also include the matching results table for each graph too, (it is up to you how you place it on the sheet).
You will also be required to briefly describe each graph, as shown here;
What does the graph show, (overall trend/pattern)?
Highest score/lowest score and why that might be the case?
Any anomalies in the results?
Leave most of you explanation and detail for the analysis of the results, in the next section.
IGCSE Geography Fieldwork Guidance Booklet
As we did for the environmental quality results, we will combine the questionnaire results as set of group results. This set of group results will be presented on a document, as shown below, which you will include in your fieldwork.
Next you will show these results as graphs and write a short description for each one, as you did for the environmental quality section.
9 | P a g e
When presenting your results, you will have two graphs per page.
You will also include the matching results table for each graph too, (it is up to you how you place it on the sheet).
You will also be required to briefly describe each graph, as shown here;
What does the graph show, (overall trend/pattern)?
Highest score/lowest score and why that might be the case?
Any anomalies in the results?
Leave most of your explanation and detail for the analysis of the results, in the next section.
IGCSE Geography Fieldwork Guidance Booklet
10. Analysis of questionnaire results
10. Analysis of questionnaire results
You now need to write an analysis for your results. You will have made general comments about each graph in the section before.
As a guidance for structure you should be trying to find answers to the following types of questions;
What was the most common answer for each question? Why was that the most common answer? What evidence do you have for this? What was the least common answer for each question? Why was that the least common answer? What evidence do you have for this? Was there any anomalies? Why might that have been?
10 | P a g e
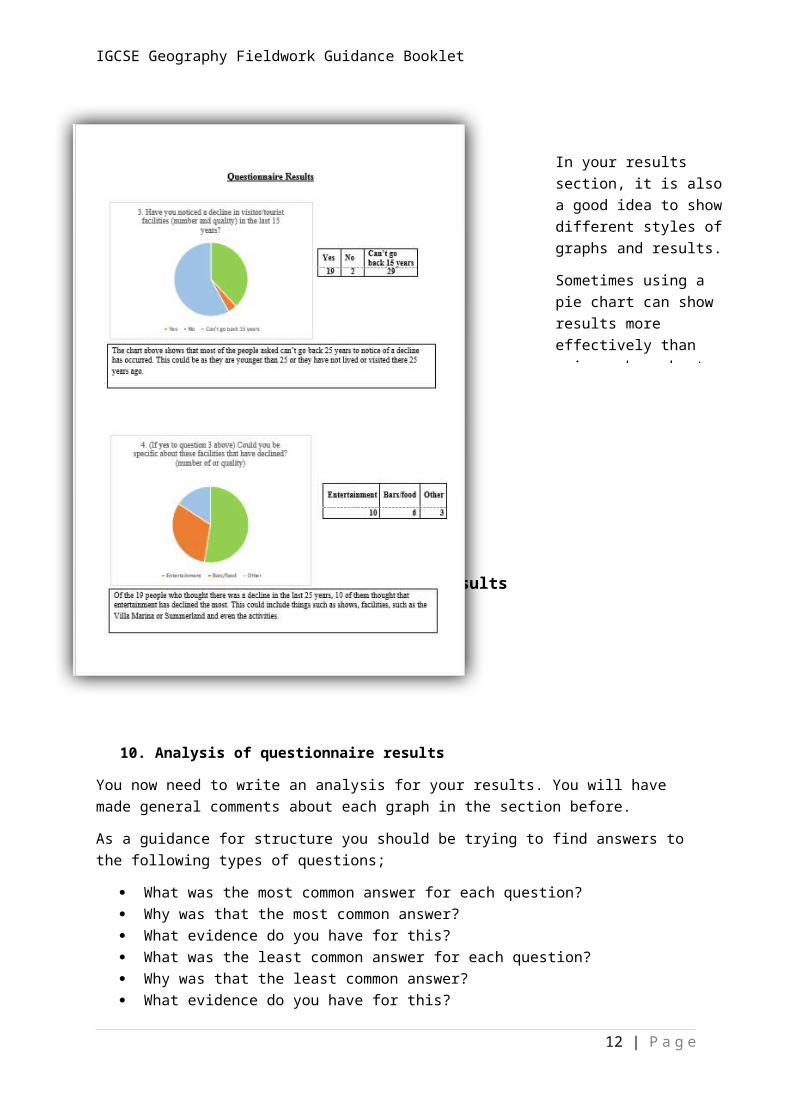
In your results section, it is also a good idea to show different styles of graphs and results.
Sometimes using a pie chart can show results more effectively than using a bar chart for example, question 3 and 4 shown to the right.
IGCSE Geography Fieldwork Guidance Booklet
11. Land use maps
You will be given land use maps for 1971 and also 2017 for your coursework.
For 2017, it will be up to you to collect all the information you need on the day of your coursework.
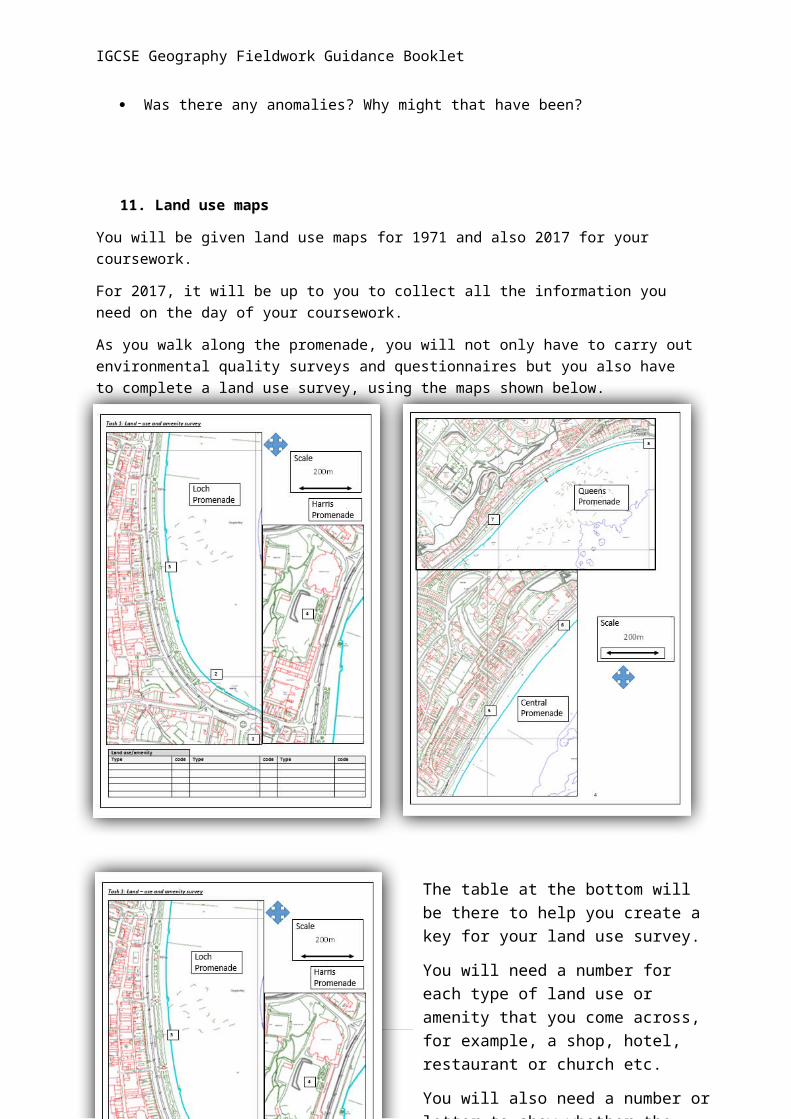
As you walk along the promenade, you will not only have to carry out environmental quality surveys and questionnaires but you also have to complete a land use survey, using the maps shown below.
11 | P a g e
The table at the bottom will be there to help you create a key for your land use survey.
You will need a number for each type of land use or amenity that you come across, for example, a shop, hotel, restaurant or church etc.
You will also need a number or letter to show whether the building is used by one of the following;
Tourist Local Both
The table below shows an example of how it could be completed.
IGCSE Geography Fieldwork Guidance Booklet
Land use/amenityType code Type code Type codeShop 1 Bar/pub 6 Tourist THotel 2 Place of worship 7 Local LB&B 3 Entertainment 8 Both BApartments/flats 4 Car park 9Restaurant 5 Services (e.g.
Bank/Post office/Doctors)
10
12. Land use results
The land use information you collect on the day of your fieldwork will then be transferred to an A2 land use map for 2017, clearly showing the types of land use, using your key or adding a colour coordinated key to it.
The 1971 land use map will be provided to you in the form of an A3 map. It would be wise to use the same key for both maps, to help with continuity and presentation of your work.
13. Land use analysis
In this section you will analyse all of your findings from the land use survey for 2017 and your 1971 map.
Below shows you a table for the 1971 land use, it shows you the types of facilities/amenities and how many of them were used by tourists, locals and both groups. You will need to create one like this for your 2017 land use findings.
12 | P a g e
Ref: Published by Douglas Corporation in ‘Tourist Brochure 1971’
Villa Marina Royal Hall / Gaiety Theatre/ Manx Museum
Loch Promenade Information bureauHorse tram terminus54 Hotels/guest houses
1 x Government offices
Strand Cinema/Picture House/Head Post office/Regal cinema/Strand cinema/Snooker club
133 9 21
IGCSE Geography Fieldwork Guidance Booklet
You must then represent your information on pie charts;
One for the type of land use, e.g. tourist, local and both One for the specific land use, e.g. the types of buildings/facilities
Once you have done this you must analyse each one, by firstly focusing on the general land use, (tourist, local and both) and then linking it together with the more specific land use, for example, ‘In 1971 the majority of the land was used by tourists, with little being used by both. This suggests that in 1971 tourism was still very popular on the Isle of Man and in Douglas in particular.
By looking at the specific land use for 1971, we can see that this is true as the majority of the land use was hotel and B&Bs, with only 8 properties actually being use for apartments owned by local people.’
14. Secondary Evidence
The content of this section will vary according to what you research. There is census information about jobs and there are graphs of arrivals available from the government. It is up to you to follow the same type of layout as for all the other sections.
13 | P a g e
Make sure your land use results and analysis are presented appropriately.
Pie charts are the best for this particular analysis, however you need to make sure that each sector of it is clear and labelled with a key format.
You must also make sure that you have included the results tables too.
You may want to have each pie chart and table on separate pages to display your results together, but you still need to ensure you are analysing them.
IGCSE Geography Fieldwork Guidance Booklet
15. Evaluation
The purpose of an evaluation is to reflect and assess the value of your investigation. At this stage you will already have completed an evaluation for your methodology in some detail so you should already know the reliability of your methods. This final evaluation will act as an extension of that.
You should think about your evaluation in three different parts;
Next you will evaluate the accuracy of your results. For this part of the evaluation read your evaluation of your methodology;
If your data collection was inaccurate this would affect your results which in turn would make your conclusions invalid-OK?
Are there any anomalies (strange results) that you can’t explain? Are your conclusions valid even if you only took a small sample? How could you extend your investigation? What could you develop further?
Finally you will also need to decide on the validity of your investigation;
Is what you have found out reliable? Can your data be trusted? Did the study go well or could it have been improved? Think about-your methods, the reliability of your conclusions
16. Conclusion
14 | P a g e
Evaluation
Reliability of Methods
Validity of Conclusions
Accuracy of Results
IGCSE Geography Fieldwork Guidance Booklet
This section is crucial to succeeding in your fieldwork, as it links all of your findings together from the original fieldwork investigation question;
“Is tourism in Douglas at stage 5 (decline) of the Butler Model of Tourist Area Evolution?”
So, what you are trying to do in your conclusion is answer this question. Where you think Douglas is on the Butler model and what is your proof of this conclusion? (Primary and secondary sources).
As you have done in your methodology and evaluation you should focus your conclusion on each of the sections. Below will remind you of the methods and the questions provided will help you to structure your conclusion;
Questionnaire
1. If Douglas was to fit in with your expectations we would get answers and opinions from people that showed Douglas was not as good as UK or other resorts people had visited. What did they actually show overall?
2. Now go through each question result and interpret what it means – one question at a time. Do any of the responses relate to stage 6 (decline)?
3. Would you overall conclude that Douglas is in Stage 6 based on these results?
Bi-polar Survey (environmental quality survey)
1. What did you expect the promenade to be like and why? What were they like actually and why were they like this?
2. Your results may have shown a trend which was? 3. Maybe no trend but some places were possibly very attractive and well maintained and
some places were very run down. Why do you think this was? 4. Because many of your results were quite high it could mean two different things – think
what this might mean.5. Our results may be quite confusing. Does it give us any clear evidence for Stage 6 decline?
Land use
1. In 2016 did you expect the buildings to be mostly used for residential purposes? Are there only a few hotels and tourist only land uses?
2. What does your land use pie chart for 2016 show for locals vs. tourists?3. What does the pie chart for 1971 show in comparison? Have the proportions of locals vs.
tourists changed? 4. There is probably a difference between the two so does this help us prove Douglas is in
Stage 6 (decline) How about the number of hotels? Has this gone up or down in the last 46 years? Does this help prove your theory of stage 6 decline?
Glossary
15 | P a g e
IGCSE Geography Fieldwork Guidance Booklet
This section will include all the key terms you have used throughout your fieldwork. For each key term you must find the geographical definition of it and write it down.
References
If you have sources secondary evidence or research which you have included in your fieldwork, you include what it was and where you sourced it from, for example if it was a book or document state;
the book/document title the author the year it was published the page and chapter you got it from
If you are using a website you need to state;
the name of the site the link to the site or area of the site you have used
Fieldwork collection booklet
This is the booklet that you used on your fieldwork trip. It is extremely important and it must be included with your fieldwork documentation, so keep it safe and don’t forgot to include it.
General presentation guidelines
Layout of the fieldwork
You are restricted to 2000 words. You must present it in a way that helps you to follow the guideline word count. Ask your teacher if you are not sure how to keep the word count down.
Font
Use Microsoft Word in the font, ‘Times New Roman’, size 12. You may use size 14 for the headings, as well as putting them in bold writing or underlining them.
Pictures, tables and charts
All pictures and tables must be formatted correctly and placed appropriately on your work.
When creating a bar or pie chart use Excel. Once it is complete copy and paste the necessary work into your Word Document. Save the Excel document as you may need it more than once.
Important!
Finally, make sure that you save all of your work as you go through this fieldwork.
It is important that you save it in an organised way on the school system, by creating a, ‘Geography Fieldwork Folder’, so that it can be found easily each time you work on it.
Back up all of your work on a memory stick, or google docs, then you can also work on it at home.