Planting Date, Yield, and Nitrogen Management for Strawberries in the Coastal Plain of Virginia By Ursula Tankard Deitch Major Project/ Report submitted to the faculty of Virginia Polytechnic Institute and State University in partial fulfillment of the requirements for the degree of Online Master of Agricultural and Life Sciences In Environmental Sciences Mark Reiter, Chair Steve Rideout Zachary Easton Gregory Welbaum
Transcript
Planting Date, Yield, and Nitrogen Management for Strawberries in the Coastal
Plain of Virginia
By
Ursula Tankard Deitch
Major Project/ Report submitted to the faculty of Virginia Polytechnic Institute and State University in
partial fulfillment of the requirements for the degree ofOnline Master of Agricultural and Life Sciences
InEnvironmental Sciences
Mark Reiter, ChairSteve Rideout
Zachary EastonGregory Welbaum
April 18, 2016Eastern Shore Agricultural Research and Extension Center
Painter, VA
Planting Date, Yield, and Nitrogen Management for Strawberries in the
Coastal Plain of Virginia
Abstract
Fresh market strawberry (Fragaria × ananassa) availability in mid to late -April signals the
beginning of locally available fresh fruit and vegetables for the mid-Atlantic region. Of the 290
acres of fresh market strawberries grown in Virginia annually, the majority are produced in the
coastal plain of Virginia using intensely managed annual hill production systems. The objective
of this study was to evaluate the potential yield of strawberries, determine how yield
components change with planting date and cultivar, and assess the fertility management
techniques recommended by Virginia Cooperative Extension’s Commercial Vegetable
Production Guide for strawberries. June-bearing cultivars ‘Camarosa’ and ‘Chandler’ were
grown in Painter, Virginia during the 2012-2013 season. Three planting dates (Sept. 21, 28, and
Oct. 5) were assessed while evaluating the cultivars performance. Petiole nitrate-N readings
and leaf tissue were collected at initial flower and mid-flower to evaluate the accepted
fertigation recommendations. The cultivar trial yielded between 7,205 – 21,393 lbs./acre.
Overall, ‘Camarosa’ yielded highest with the early planting date (Sept. 21; 21,393 lbs./acre). As
the planting dates moved later into the fall, ‘Camarosa’ lost yield while the yield for ‘Chandler’
remained constant and averaged 9,705 lbs./acre. Harvest pick data also indicated that
‘Camarosa’ out performs ‘Chandler’ both early and late in the season for berry number and
yield. Petiole nitrate-N and leaf tissue data suggested that excess N fertilization leads to lower
yields. In conclusion, strawberry cultivar ‘Camarosa’ should be a standard for farmer’s in the
ii
mid-Atlantic and planted late to mid-September while continuously monitoring and adjusting N
fertility as needed.
iii
Table of Contents
Abstract.......................................................................................................................................... ii
Table of Contents.......................................................................................................................... iv
List of Tables................................................................................................................................. v
List of Figures................................................................................................................................ vi
Table 1. Plant yield for a planting date (PD) × cultivar interaction for plasticulture strawberries grown on sandy loam soils in the mid-Atlantic..................................................................12
Table 2. Total number of strawberries harvested per harvest date for plasticulture strawberries grown on sandy loam soils in the mid-Atlantic..................................................................13
Table 3. Yield of strawberries per harvest date for plasticulture strawberries grown on sandy loam soils in the mid-Atlantic............................................................................................14
Table 4. Average weight of strawberries per harvest for plasticulture strawberries grown on sandy loam soils in the mid-Atlantic..................................................................................15
Table 5. Weight per berry for a planting date (PD) × cultivar interaction for plasticulture strawberries grown on sandy loam soils in the mid-Atlantic.............................................15
Table 6. Leaf tissue nutrient concentrations at mid-flower for sandy loam soils in the mid-Atlantic.............................................................................................................................. 16
Table 7. Petiole nitrate reading #2 – A planting date (PD) × cultivar interaction for plasticulture strawberries grown on sandy loam soils in the mid-Atlantic.............................................16
v
List of Figures
Figure 1. Mid-Atlantic coastal plain of the United States comprised mainly of sandy loam soils in the temperate zone..................................................................................................................... 17
Figure 2. Annual hill production system of strawberries on sandy loam soils.............................18
Figure 3. Petiole nitrate levels collected at initial flower on 2 May 2013 and at mid-flower on 9 May 2013 in Painter, VA in relation to strawberry yield over all three planting dates................19
Figure 4. Leaf % N collected at initial flower on 2 May 2013 in Painter, VA as it relates to strawberry yield...........................................................................................................................20
Figure 5. Leaf % S collected at initial flower on 2 May 2013 in Painter, VA as it relates to strawberry yield...........................................................................................................................21
Figure 6. Petiole nitrate levels at initial flower on 2 May 2013 in Painter, VA in relation to leaf % N concentrations from the same date.........................................................................................22
vi
Introduction
In Virginia approximately 290 acres of fresh market strawberries (Fragaria × ananassa)
are grown annually (US Dept. Agriculture, 2012). This equates to nearly $4.466 million dollars
in farm gate value each year from strawberry sales in Virginia (US Dept. Agriculture, 2012). The
majority of strawberry production occurs in the coastal plain of Virginia (Fig. 1) and is locally
marketed. Sales by pick-your-own, pre-pick, roadside stands, and farmer markets’ occur over a
5-week period and kick off the summer small fruit and vegetable season. The peak harvest
months in Virginia are late April, May, and early June.
Soils in the coastal plain of Virginia are predominately sandy loams (~65% sand, 25% silt,
and 10% clay in the 0-6-inch horizon) (USDA-NRCS, 2016), and coarser textured soils have a
greater propensity to leach nutrients like nitrogen (N) and sulfur (S) compared to finer textured
soils with greater concentrations of silt and clay (Zotarelli et al., 2007). It was also
demonstrated that phosphorus (P) may leach in sandy loam systems after a P saturation point is
reached (Han, 2015). As a result, sandy loam soils have important environmental and crop
production implications for freshwater and saltwater systems; which is especially important
due to small fruit production being located in the Chesapeake Bay Watershed.
In the eastern United States, strawberries traditionally were grown in the matted-row
production system where strawberry plugs are set in the spring, and crowns develop
throughout the summer giving rise to runner plants that fill in the beds. Fruit is first harvested
in the spring of the second year and plants are typically left in the ground for several seasons
(Fernandez, 2001). Matted-row systems continue to be of significance in areas removed from
the seaboard and at higher elevations (Hokanson, 2000). However, the annual hill production
7
system (Fig. 2), which was developed in California, is the most commonly used system by
strawberry growers in the coastal plain of the mid-Atlantic. The hill system is also referred to as
“strawberry plasticulture” in which strawberry transplants (fresh-dug or plugs) are planted in
early fall in double rows on fumigated raised beds that are covered with black plastic mulch at
plant densities of ≈ 17,400 plants/acre (Poling, 1993). The fall planted transplants are then
harvested the following spring and are most commonly fruited only one year (Hokanson, 2000).
Double drip tubing is typically buried 1 to 2 inches deep under the plastic mulch. The annual
hill system provides a degree of weed and pest control through the combination of plastic
mulch and soil fumigation. Other important advantages to the annual hill production system
over the previously used matted row culture, include earlier and longer harvests, cleaner fruit,
the potential to control water penetration, ability to fertigate through the drip irrigation
system, and increased quality and yields (Pattison and Wolf, 2007; Poling, 2004).
Commercial strawberry production requires intensive and precise fertilization. Fertilizer
applications through drip irrigation (fertigation), under the annual hill production system,
allows for the precise timing and uniform distribution of fertilizer nutrients. Fertigation can
reduce fertilizer usages and minimize groundwater pollution by applying fertilizer where and
when the plant needs the nutrient. About 50% of the N (60-75 lbs. N/acre), 50% of the K, and all
of the recommended P is applied pre-plant in the fall prior to laying plastic mulch, with the
remaining N and K being applied in the spring in a 1:1 ratio through the drip irrigation system
(Poling, 1993). These pre-plant fertilizer applications of N and K supply early nutrition to the
plant in the fall and early winter when mid-Atlantic growers typically do not run their drip
irrigation systems (Poling, 1993). In the spring, drip irrigation applications begin at green-up
8
and continue through harvest. The current N recommendation for strawberries in an annual
hill production system in Florida is for daily injections between 0.30 and 0.76 lbs. N per acre per
day, depending on the phenological stage of the crop, with a maximum of 152 lbs. N per acre
during the season (Hochmuth and Albregts, 1994; Hochmuth et al., 1996). Strawberries grown
in the mid-Atlantic region follow a similar N fertilization regimen with a maximum of 120 lbs. N
per acre recommended for sandy loam soils in an annual hill system (Wilson, et al. 2012), with
60 lbs. of N applied in the fall at bed formation and the remainder applied through drip in the
spring.
Collecting petiole samples, starting at green up, and analyzing nitrate-N concentrations
is the most accurate methodology for determining fertilizer amounts throughout the growing
season. A petiole nitrate meter can be used to monitor the nitrate-N concentrations and the
fertigation schedule can be altered based on nitrate sufficiency levels (Hartz, 1996). Values
between 600 and 800 ppm nitrate-N when plants resume spring growth and prior to bloom,
falling to 300 to 500 ppm during bloom and 200 to 500 ppm during harvest are considered
sufficient (Demchak, 2012). Florida recommended petiole nitrate-N concentrations of 600-800
ppm at first harvest (DeValerio, et al. 2003). While North Carolina recommended petiole
nitrate-N concentrations between 3,000 -5,000 ppm at first harvest (Hicks, 2015). Plant tissue N
sufficiency ranges for strawberries are 3-4% (Bryson, et al. 2014).
Inorganic N fertilizers are commonly used for small fruit production and either contain
nitrate or the fertilizer N source eventually becomes nitrate due to natural microbial activity
(Bottoms, et al. 2013). Nitrate is soluble in water and is weakly retained by the soil due to the
soils low anion exchange capacity. Nitrate, therefore, moves through the soil at virtually the
9
same speed as water. If the proper amount of N fertilizer and proper irrigation regimes are
used for crop production, the chances of N leaching is reduced. A study by Bruggeman et al.
(1995) suggested that more than 63% of the shallow wells at a depth of 75 feet or less, in
Northampton County on the Eastern Shore of Virginia, contain nitrate-N concentrations above
natural background levels of 0.2 ppm. Nitrate-N levels above the assumed natural background
concentration were defined as nitrate detection. The average concentration of the 131
sampled shallow wells was almost 5 ppm. Nitrate-N concentrations above the EPA’s lifetime
Health Advisory Levels (HALs) of 10 ppm were found in 17% of sampled shallow wells. If proper
irrigation regimes are used, N leaching is reduced keeping soluble fertilizer in the plants’
effective root zone of 6 inches (Gärdenäsa, 2005). Therefore, reducing nutrient leaching by
utilizing appropriate fertilization and irrigation programs is a desired practice for strawberry
production and supports the current best management practice efforts for the state.
The popularity of the annual hill production system in the southeastern United States
and portions of the Atlantic seaboard are influencing the cultivar picture. Commercially grown
cultivars in North Carolina and the mid-Atlantic are June bearers (NC Cooperative Extension,
2012). Presently, strawberry growers are using cultivars developed in the University of
California, Davis, program, ‘Chandler’ and ‘Camarosa’, or from the University of Florida
program, ‘Sweet Charlie’ (Hokanson et al., 2000). These three cultivars have been selected for
acceptable yield and marketability in North Carolina and the mid-Atlantic, extending the
harvest season over a six-week period, but, in cooler-than-average spring temperatures, the
harvest can last 2 months (Poling, 1993). ‘Chandler’ is the standard cultivar for u-pick producers
because of its high yield compared to other plasticulture cultivars, cold hardiness, and because
10
it is well liked by consumers for its good flavor, fruit size and attractive red fruit color (NC
Cooperative Extension, 2012). ‘Camarosa’, a newer cultivar on the market, has very large firm
fruit and has superior shelf-life and handling characteristics compared to ‘Chandler’. However,
‘Camarosa’ is not as cold hardy as ‘Chandler’, leading to yield issues in colder parts of the mid-
Atlantic region. In the warmer winter areas of North Carolina, ‘Camarosa’ production now
surpasses ‘Chandler’ in acreage (NC Cooperative Extension, 2012).
The objective of this study was to evaluate planting date’s impact on yield from cultivars
‘Camarosa’ and ‘Chandler’ utilizing an annual hill production system. Additionally, fertilization
management was also analyzed in response to overall yield and fruit quality parameters.
Materials and Methods
A field experiment was conducted during the 2012-2013 growing season. The
experimental site was located at the Virginia Tech Eastern Shore Agricultural Research and
Extension Center (AREC) in Painter, VA. The soil was a Bojac sandy loam (course-loamy, mixed,
thermic Typic Hapludults) that consisted of 65% sand, 25% silt, and 10% clay in the 0-6-inch
horizon (USDA-NRCS, 2016). The study was arranged in a factorial arrangement of 2 cultivars
and 3 planting dates in a randomized complete block design with four replications.
Plug transplants of June-bearing ‘Chandler’ and ‘Camarosa’ varieties were obtained
from an Ontario, Canada nursery. Transplanting occurred on Sept. 21, 28 and Oct. 5, 2012.
Plants were set through methyl bromide fumigated, black polyethylene mulch on a standard 2
row raised bed spaced 16 inches on center. In the field setting, polyethylene beds were spaced
on 5-ft. row centers with double line drip irrigation installed under the mulch. Drip irrigation
was used to meet plants’ water and fertilizer requirements. The Virginia Commercial Vegetable
11
Production Recommendations (Wilson, et. al. 2012) were followed for water, fertilizer, and pest
management throughout the season. Each plot contained 40 plants, with the center 20 plants
being designated for fresh fruit harvest and plant sampling. Fruit with at least 75% red color
was harvested, graded, counted and weighed twice weekly from 14 May 2013 through the 3
June 2013 for a total of 7 harvests. Marketable fruit were considered free of rot, well-shaped,
and weighing 8 g or more per fruit.
On 2 May 2013 at first flower and 9 May 2013 at mid-flower, during active growing
daylight hours, 10 plant petioles were collected from the most fully expanded, mature, trifoliate
leaves to measure petiole nitrates. Petiole nitrate-N readings were analyzed using a LAQUA
Twin Nitrate Meter (Spectrum Technologies, Aurora, IL). Whole leaf samples of the most-
recent, fully expanded trifoliate leaf from 10 plants in each plot were also collected at mid-
flower (9 May 2013), dried at 130°F, mini-ground to pass a 0.425 mm sieve, and analyzed using
a Elementar Vario EL Cube (Hanau, Germany) for leaf % N, % carbon (C) and leaf % S using dry
combustion techniques (Elementar, 2016).
Statistical analysis of the data was conducted using analysis of variance procedures
(PROC GLM) (SAS Institute, 2016) to determine the effect of planting date and N concentrations
as they related to strawberry cultivar. Mean separations were conducted using Fisher’s
protected least significance difference (LSD) test at the 10% significance level. Linear and non-
linear regression analysis was used to compare leaf tissue and petiole N concentrations to yield
and to compare N tissue comparison methodologies.
Results and Discussion
12
Overall marketable strawberry fruit yield varied between 7,205 and 21,393 lbs./acre;
which is typical for mid-Atlantic producers with averaged marketable yields of 20,000
lbs./acre (Poling, 1993). A significant difference was noted with a planting date × cultivar
interaction (p = 0.0064). ‘Camarosa’ yielded higher (21,393 lbs./acre) with the September 21
early planting date as compared to later planting dates and also yielded higher than any
‘Chandler’ planting date (Table 1). The early success of ‘Camarosa’ was also noted in the 2005
Southeast Regional Strawberry Plasticulture Production Guide, where it stated that planting
dates for ‘Camarosa’ are about the same time as ‘Chandler’, but most growers prefer to set this
cultivar at least three days ahead of ‘Chandler’ (Poling et al., 2005). As the planting dates
moved later into the fall, ‘Camarosa’ lost yield while the yield for ‘Chandler’ remained constant
(Table 1). This result is a direct response to the cold hardiness of ‘Chandler’ when compared to
‘Camarosa’.
When putting harvest pick number into the model, the first planting date (Sept. 21) on
the fourth picking yielded the greatest number of berries harvested with ‘Camarosa’ (Table 2).
Therefore, the best option for growers targeting the early season u-pick market would be
‘Camarosa’ at an early planting date (Sept. 21). The early planting date of ‘Camarosa’ would
also be a good choice for extending the u-pick season because it still had a higher number of
berries harvested than ‘Chandler’ for the final harvest on the same Sept. 21 planting date (Table
2). However, if the farmer is going to plant late (Oct. 5), ‘Chandler’ will have more berries later
in the growing season than ‘Camarosa.’
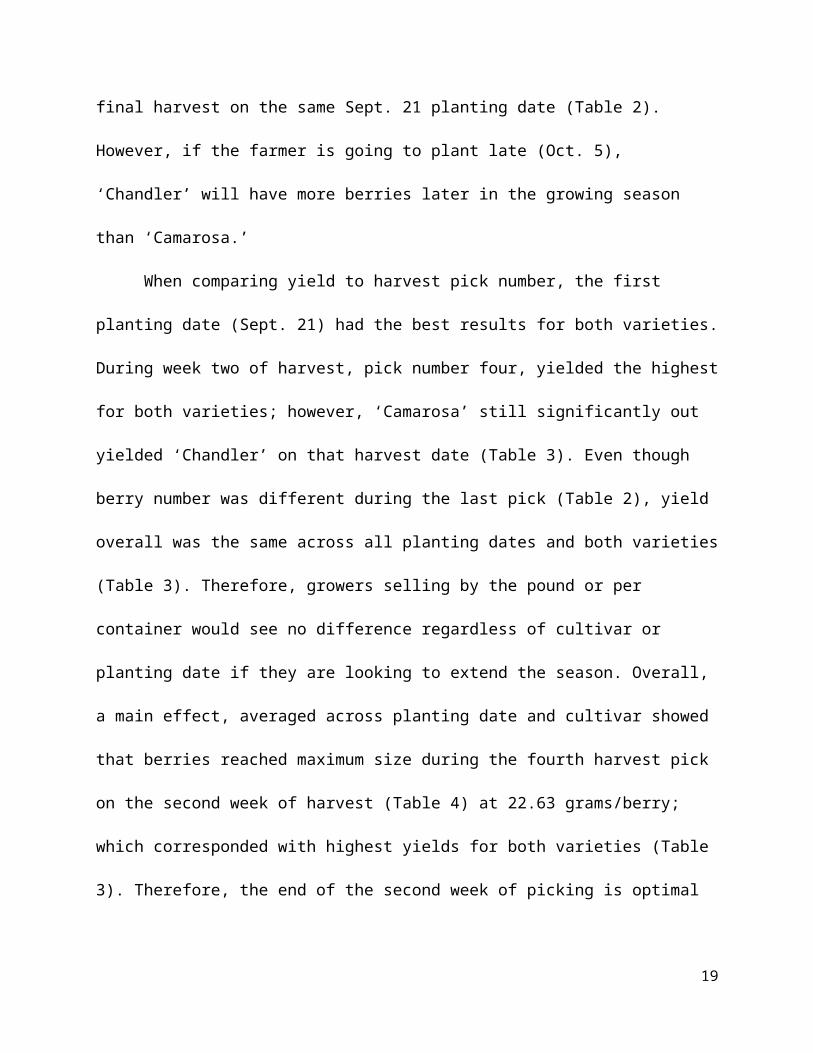
When comparing yield to harvest pick number, the first planting date (Sept. 21) had the
best results for both varieties. During week two of harvest, pick number four, yielded the
13
highest for both varieties; however, ‘Camarosa’ still significantly out yielded ‘Chandler’ on that
harvest date (Table 3). Even though berry number was different during the last pick (Table 2),
yield overall was the same across all planting dates and both varieties (Table 3). Therefore,
growers selling by the pound or per container would see no difference regardless of cultivar or
planting date if they are looking to extend the season. Overall, a main effect, averaged across
planting date and cultivar showed that berries reached maximum size during the fourth harvest
pick on the second week of harvest (Table 4) at 22.63 grams/berry; which corresponded with
highest yields for both varieties (Table 3). Therefore, the end of the second week of picking is
optimal for plasticulture strawberry production systems regardless of planting date or cultivar.
For the planting date × cultivar interaction, ‘Camarosa’ had the largest berries over all
treatments if planted after September 28 (Table 5). Similar to Fernandez et al. (2001) findings,
‘Chandler’ produced statistically smaller berries than ‘Camarosa’. Kays (1998) stated that with
many fruits and vegetables, consumers discriminate based upon size. Larger fruit are generally
preferred and the very small fruit being left unpicked. As an industry standard, when the
average fruit weight on a harvest day falls below 8 g per berry harvests cease (Weber et al.
2005). Although there is a concern regarding fruit size, it was observed that the first planting
date of ‘Camarosa’ had the highest fruit yields, making it a more desirable planting date even
though they were smaller berries. When compared to the berries of ‘Chandler’ on that first
planting date, the berries from ‘Camarosa’ were equivalent in size therefore, ‘Camarosa’ is still
a good cultivar option for growers in the mid-Atlantic. In all cases, the berry sizes were larger
than the minimal 8 g/berry threshold suggested by Weber et al. (2005).
14
Leaf tissue collected at mid-flower had no statistical impact based on cultivar or planting
date. Overall N and S averaged 3.02% and 0.19% at flowering, respectively (Table 6). Currently
accepted strawberry leaf tissue sufficiency ranges for mature leaves from new growth is 2.10-
4.00% N and 0.15 to 0.30% S (Bryson et al., 2014). Therefore, in all cases the ‘typical’ fertility
and irrigation regime utilized according to Virginia Cooperative Extension recommendations
provided sufficient water and fertility for crop needs (Wilson et al. 2012). For the resulting C:N
and N:S ratios, C:N was 15.54 and N:S ratio was 15.61 (Table 6). An elevated N:S (> 18:1) can
lead to poor assimilation of either of these nutrients and often causes yellowing of the leaves
(Hicks et al., 2015). However, we did not experience any visual leaf discoloration in our study.
Petiole nitrate-N readings taken at first flower on 2 May 2013 indicated that a planting
date × cultivar interaction was not significant; however, the planting date main effect was
significant (p = 0.0206). Petiole nitrate-N readings for plants planted on September 21 (PD1;
1,563 ppm) were on average lower when compared to September 28 and October 5 plants
(PD2 and PD3 at 2,238 and 2,688 ppm, respectively; LSD0.10 = 479 ppm). Therefore, plants
planted during the later planting dates had more nitrate-N in the plant’s tissue; which is needed
for berry production. Nitrate-N availability is necessary in the spring during the vegetative and
fruiting period to increase yield as stated by Casteel (2004).
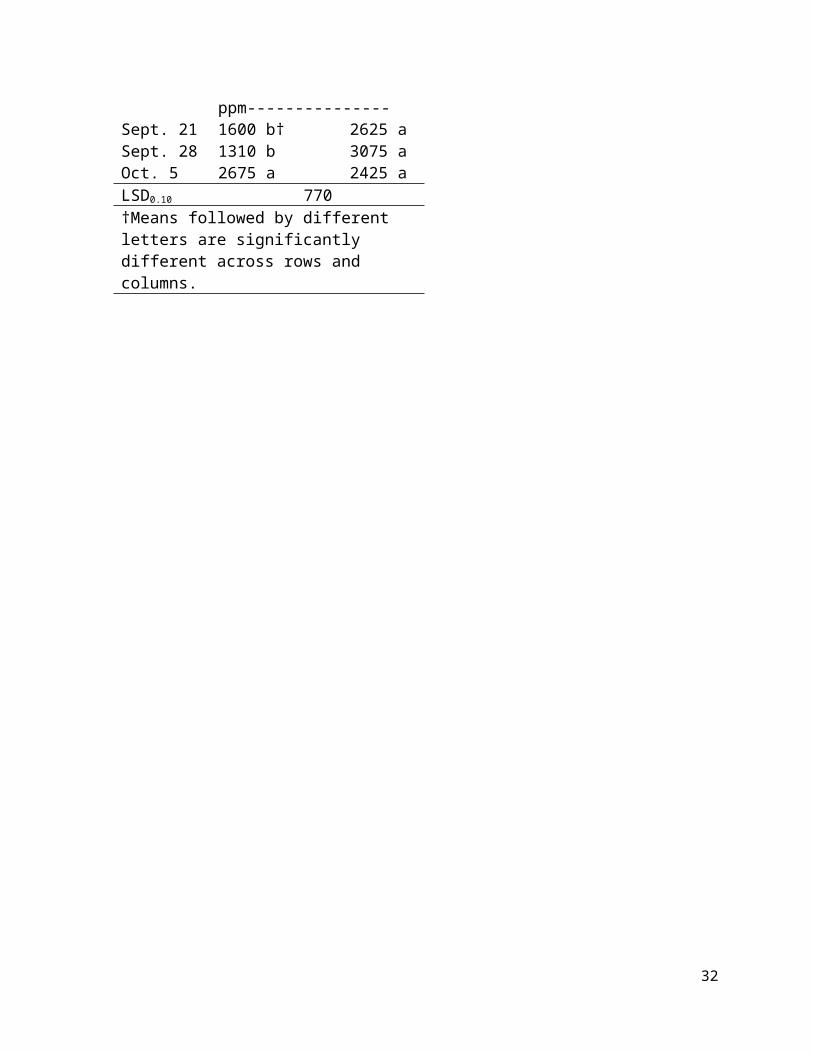
At mid-flower, on 9 May 2013, ‘Camarosa’ had overall lower nitrate-N concentrations
compared to higher concentrations found in ‘Chandler’ (Table 7). We speculate that ‘Chandler’
may overall be a lower yielding cultivar when compared to ‘Camarosa’, since ‘Chandler’ has
higher nitrate-N concentrations at mid-flower than ‘Camarosa’. However, further investigation
of the yield potential of ‘Chandler’, as related to nitrate-N concentrations, compared to
15
‘Camarosa’ is needed. Based on University of Florida’s sufficiency ranges for petiole sap testing
(DeValerio et al. 2003), nitrate-N levels for this study exceeded the sufficiency ranges (at first
harvest 600-800 ppm); therefore, fertigation could have been reduced to apply less overall N
based on petiole nitrate testing. Planting date had no effect on nitrate-N interactions in the
second nitrate-N readings at mid-flower.
A negative linear regression occurred when comparing petiole nitrate-N concentrations
and overall yield at both petiole nitrate samplings (Fig. 3). At our practiced N fertilization
amounts, yield decreased as petiole nitrate-N concentrations increased above the currently
accepted sufficiency range (600-800 ppm) (DeValerio et al. 2003). Higher yielding planting
dates had lower nitrate-N concentrations. Fitting with soil fertility theory, plant and yield
decline occurred when over fertilization occurred. The working curve in Fig. 3 begins higher
than the University of Florida’s recommended nitrate-N concentrations at harvest (DeValerio et
al. 2003) and yields in this study were effectively reduced by 2,082 lbs. strawberries/acre with
each incremental 500 ppm petiole nitrate-N increase (Fig.3). Albregts et al. (1991) had similar
findings stating that, excessive N fertilization rates reduced yields, delayed ripening, and
produced soft fruit. The yield decrease was noticed at nitrate-N concentrations at
approximately 2,000 ppm at mid-flower on the second reading date of 9 May 2013.
All leaf S concentrations were between 0.16 – 0.21% at first pick. The sufficiency range
for leaf % S is 0.19-0.26% at initial harvest (Bryson et al. 2014). Leaf N concentration (Fig. 4)
further supports the theory that excess N could lead to a reduction in yield, similar to petiole
nitrate-N data. Sufficiency levels for leaf N concentrations at initial harvest are between 3-3.5%
(Bryson et al. 2014). Analysis of leaf %N to nitrate-N concentrations from the first sampling at
16
initial flower on 2 May 2013, showed a weak correlation between %N and nitrate-N (Fig. 6). As
the leaf N concentration increased by 0.1%, yield was statistically reduced by 1,562 lbs.
strawberries/acre. Regarding leaf S (Fig. 5), concentrations were adequate and did not cause a
reduction in yield as demonstrated with over applications of N.
Conclusions
Strawberry cultivar ‘Camarosa’ continues to outperform ‘Chandler’ and is an industry
stand out when transplanted in the early fall in the mid-Atlantic coastal plain due to its large,
firm fruit and potential yields. ‘Camarosa’ also provides superior early and late season yields
and berry quantity compared to ‘Chandler’. Regarding strawberry fertility, farmers need to be
cognizant and properly monitor N status throughout the growing season. Nitrogen is a highly
variable nutrient as it moves readily throughout the plant-soil system. A reduction in yield
occurred when excess N was plant available using the current accepted N fertility
recommendations with our yield potential. Overall, accepted N fertility recommendations for
strawberry production in the mid-Atlantic needs more evaluation along with in-season N status
monitoring and measurement.
17
Table 1. Plant yield for a planting date (PD) × cultivar interaction for plasticulture strawberries grown on sandy loam soils in the mid-Atlantic.
CultivarPlanting Date ‘Camarosa’ ‘Chandler’
--------------lbs./acre--------------Sept. 21 21,393 a† 10,270 bcSept. 28 13,016 b 8,398 cOct. 5 7,205 c 10,447 bcLSD0.10 4,116†Means followed by different letters are significantly
different across rows and columns.
18
Table 2. Total number of strawberries harvested per harvest date for plasticulture strawberries grown on sandy loam soils in the mid-Atlantic
Sept. 21 16.8 b† 17.0 bSept. 28 21.5 a 18.1 bOct. 5 22.2 a 17.6 bLSD 0.10 2.5†Means followed by different letters are significantly different across rows and columns.
21
Table 6. Leaf tissue nutrient concentrations at mid-flower for sandy loam soils in the mid-Atlantic
N† C S C:N N:S------------------------------------%------------------------------
Sept. 21 3.02 a 46.26 a 0.198 a 15.50 a 15.26 aSept. 28 3.02 a 46.05 ab 0.192 ab 15.34 a 15.74 aOct. 5 2.90 a 45.61 b 0.184 b 15.79 a 15.82 aLSD0.10 N/A N/A N/A N/A N/A†Sufficiency range = 2.1% (Bryson et al., 2014)
Table 7. Petiole Nitrate Reading at mid-flower – A Planting Date (PD) × cultivar Interaction for plasticulture strawberries grown on sandy loam soils in the mid-Atlantic
Sept. 21 1600 b† 2625 aSept. 28 1310 b 3075 aOct. 5 2675 a 2425 aLSD0.10 770†Means followed by different letters are significantly different across rows and columns.
22
Fig. 1. Mid-Atlantic Coastal Plain of the United States comprised mainly of sandy loam soils in the temperate zone. (Anonymous, 2016).
23
Fig. 2. Annual hill production system of strawberries on sandy loam soil (NC Small fruit and specialty crop IPM, 2010)
24
Figure 3. Petiole nitrate-N concentrations collected first bloom on 2 May 2013 and mid-flower on 9 May 2013 in Painter, VA in relation to strawberry yield over all three planting dates.
500 1000 1500 2000 2500 3000 3500 4000 45000
5000
10000
15000
20000
25000
30000
f(x) = − 4.16316881050642 x + 21301.0478153405R² = 0.359902910830998
f(x) = − 4.59733755235468 x + 21729.9495403003R² = 0.345219186428941
Yield vs. Nitrates
2 May 2013 Nitrate Linear (2 May 2013 Nitrate)9 May 2013 Nitrate Linear (9 May 2013 Nitrate)
Nitrate Levels (ppm)
Yiel
d (lb
s/a)
25
Figure 4. Leaf % N collected at initial flower on 2 May 2013 in Painter, VA as it relates to strawberry yield.
2.5 2.7 2.9 3.1 3.3 3.5 3.70
5000
10000
15000
20000
25000
30000
f(x) = − 15618.2856751557 x + 61036.5663885181R² = 0.252610674166638
Yield vs. Leaf % N
Leaf % N Linear (Leaf % N)
Leaf % N
Yiel
d (lb
s/a)
26
Figure 5. Leaf % S collected at initial flower on 2 May 2013 in Painter, VA as it relates to strawberry yield.
0.15 0.16 0.17 0.18 0.19 0.2 0.21 0.220
5000
10000
15000
20000
25000
30000
f(x) = 17083.0852878464 x + 8595.09372494671R² = 0.0010657517476822
Yield vs. Leaf % S
Leaf % S Linear (Leaf % S)
Leaf % S
Yiel
d (lb
s/a)
27
Figure 6. Petiole nitrate-N concentrations from initial flower on 2 May 2013 in relation to leaf % N levels in Painter, VA.
1000 1500 2000 2500 3000 3500 4000 45002.5
2.7
2.9
3.1
3.3
3.5
3.7
3.9
Leaf % N vs. Nitrate 1
Nitrate 1 Linear (Nitrate 1)
Nitrate 1 (ppm)
Leaf
% N
28
Literature Cited
Albregts, E.E., C.M. Howard, and C.K. Chandler. 1991. Effect of high N rates on fruiting
strawberry. Soil Crop Sci. Soc. 100: 198-200
Anoymous, 2016. Atlantic Coastal Plain. Available at: