Page 1
Physical and Biological Drivers of Longfin Smelt Vertical Distribution
Lenny Grimaldo1 and Fred Feyrer2
1ICF International
620 Folsom St, Suite 200, San Francisco, CA 94107
(415) 677-7185; [email protected]
2California Water Science Center, U.S. Geological Survey
Placer Hall, 6000 J Street, Sacramento, CA 95819
(916) 278-3232; [email protected]
December 19th, 2014
1
Page 2
Introduction and Background
Longfin smelt (Spirinchus thaleichthys) is a small pelagic fish found in estuaries and
coastal waters along the Pacific Coast of North America. In the Upper San Francisco Estuary
(SFE), longfin smelt populations declined in abundance following a crash in lower trophic level
food production associated with the overbite clam invasion of 1987 (Thomson et al. 2010;
Rosenfield and Baxter 2011). Longfin smelt abundance has declined further during an era
known as the Pelagic Organism Decline (POD), which is defined as a period (2002 to present)
where populations of other key pelagic fishes in the upper estuary also declined and have
remained suppressed at record low abundances (Sommer et al. 2007). In 2009, longfin smelt
was listed as a threatened species under the California Endangered Species Act (CDFW 2009).
In 2012, longfin smelt was warranted for listing under the Federal Endangered Species Act (ESA)
but precluded from formal listing at this time due to the need to address higher priority listing
actions.
Longfin smelt exhibits an anadromous life history strategy, although there are some
landlocked populations. Rearing and growth takes place in estuarine and coastal habitats for 2-
3 years before longfin smelt spawn in upstream portions of estuaries. In the SFE, most
spawning takes place in brackish or freshwater during winter from December to March.
Longfin smelt feed on copepods as larvae and primarily on mysids as juveniles and adults. Many
studies have highlighted a positive relationship between the abundance of age longfin smelt
and freshwater flow (Stevens and Miller 1983; Jassby et al. 1995; Kimmerer 2002) but the
mechanisms underlying that relationship remains unclear (Kimmerer et al. 2009).
There are several monitoring programs that sample longfin smelt throughout their life
history in the San Francisco Estuary (Table 1) but only one of those monitoring programs (Smelt
Larval Survey) was designed with the intent to target longfin smelt abundance and distribution.
Although many of these programs collect various life stages of longfin smelt in time and space,
are useful for describing relative changes in abundance, these programs may not fully capture
the abundance, distribution, and habitat use of longfin smelt (Rosenfield and Baxter 2011).
Additionally, gear efficiency studies for longfin smelt have not been conducted for the
monitoring programs so interpretation of relative annual abundances may not fully capture
2
Page 3
observational error that can arise from water quality, total fish abundance, changes in habitat
use, and other factors. Management actions (D-1641, SWP and CVP Export Reductions, etc) for
longfin smelt should be based on the most robust understanding of their distribution,
abundance, and survival rates.
Recent evidence suggests that variability in longfin smelt vertical distribution may affect
the interpretation of data on the spatial distribution and abundance of longfin smelt collected
in long-term monitoring programs (Rosenfield and Baxter 2011). Specifically, the ratio of
longfin smelt catches in midwater versus demersal habitats has decreased through time in
some regions of the SFE (Fig. 1). As both water clarity and station depth increased, the ratio
has shifted to smaller values. These analyses suggest that longfin smelt catches in the surface
trawls (where catches are abundant in the otter trawls) are lower because a) the net does not
sample the same fraction of the water column as it did historically (i.e., the fish are deeper than
the habitat sampled by the net), b) longfin smelt are avoiding the net in clearer waters, or c)
that longfin smelt has shifted its vertical distribution towards deeper water below the coverage
of the Midwater Trawl where turbidity is sufficient to avoid predation and food is more
abundant.
The purpose of this study is to investigate if longfin smelt shift their vertical distribution
under different environmental and biological conditions. Using smelt cam technology, this
study will sample fixed sample depths throughout continuous tidal cycles to ascertain if longfin
smelt are positioning in the water column with respect to light (turbidity and day vs night),
food, or salinity stratification. This study is designed to understand the mechanisms underlying
vertical distribution and to resolve why catches in surface trawls and otter trawls may be
affected by environmental conditions and/or monitoring methods. Further, this study should
help resolve why longfin smelt catches vary in surface and demersal habitats, which can help to
inform about potential biases in the long-term monitoring programs.
Conceptual Model and Goals
Our conceptual model explaining the divergent patterns in longfin smelt catch in otter
trawl and midwater trawl samples from the CDFW Bay Study at site 325 is that longfin smelt are
not evenly distributed vertically in the water column. The conceptual model posits that longfin
3
Page 4
smelt are distributed near the bottom of the water column (Fig. 2). This results in larger
catches in the otter trawl samples than the midwater trawl samples because the otter trawl is
positioned along the bottom of the water column for the entire duration of a tow, while the
midwater trawl is pulled obliquely through the water column and is therefore positioned near
the bottom of the water column for only a short duration of a tow. Therefore, the otter trawl
collects more longfin smelt than the midwater trawl because it is towed for a longer duration
through longfin smelt habitat (i.e, turbid water) than is the midwater trawl. Thus, the primary
objective of this study is to determine the vertical distribution of longfin smelt. This will be
done by sampling for longfin smelt at fixed depth strata to confirm or refute the conceptual
model that longfin smelt are distributed near the bottom of the water column (Fig. 3). The
secondary objective of this study is to determine how variability in vertical distribution
influences observations and inferences from the CDFW Bay Study in order to improve
interpretations of longfin smelt spatial structure and abundance generated from the CDFW Bay
Study.
If our conceptual model that longfin smelt are not evenly distributed vertically in the
water column is confirmed, the observed patterns may be due to a wide range of related
environmental processes and cues that ultimately control the vertical distribution, including life
stage, tidal currents, salinity and turbidity gradients, ambient light, diel cycle, or food
abundance. Thus, we will need to sample under sufficiently diverse environmental conditions
(particularly, tidal and diel cycles, hydrologic conditions) to distinguish among all of the various
factors that may control vertical distribution. Therefore, we are proposing a 2-year study (Table
1) with intensive field sampling during approximately 2-4 weeks each year to address three key
questions:
(1) Are longfin smelt evenly distributed vertically in the water column?
(2) Does longfin smelt vertical distribution respond to environmental cues, including
gradients in tidal currents, turbidity, salinity and ambient light, diel cycle or food
abundance?
(3) Do longfin smelt need to achieve a threshold age or size before they respond to
environmental cues for vertical distribution?
4
Page 5
Study Design and Sampling Protocols
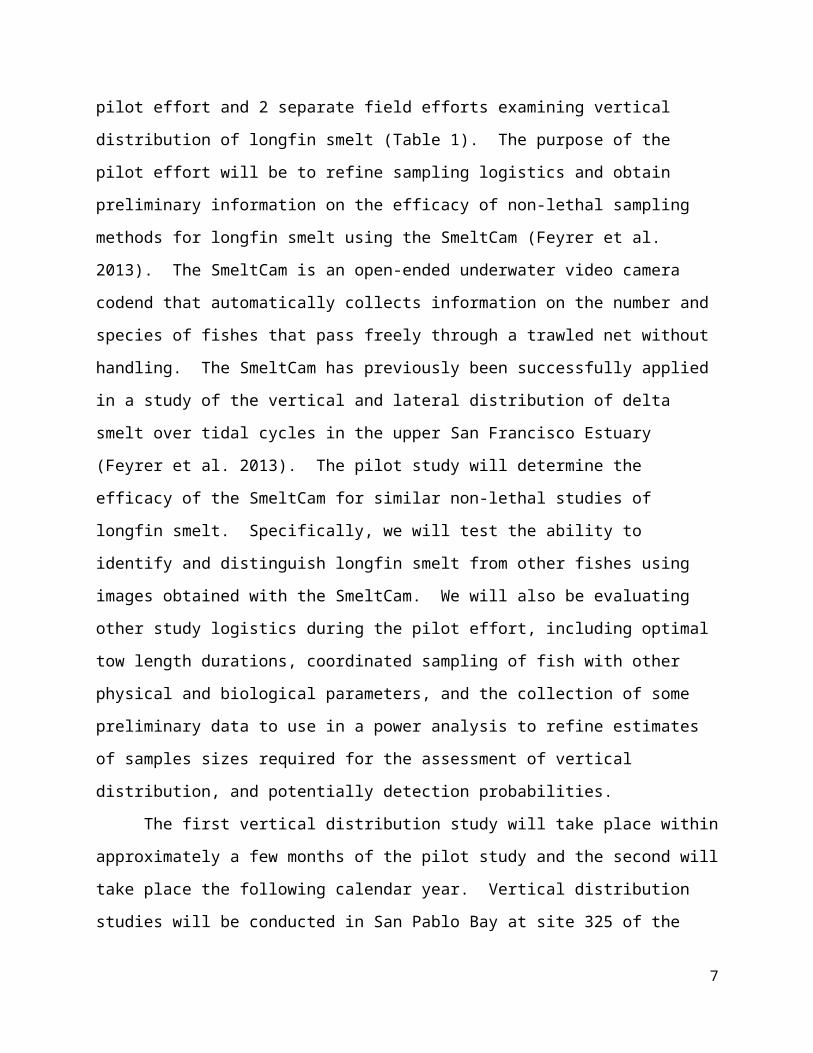
This 2-year study will include three individual elements, 1 pilot effort and 2 separate
field efforts examining vertical distribution of longfin smelt (Table 1). The purpose of the pilot
effort will be to refine sampling logistics and obtain preliminary information on the efficacy of
non-lethal sampling methods for longfin smelt using the SmeltCam (Feyrer et al. 2013). The
SmeltCam is an open-ended underwater video camera codend that automatically collects
information on the number and species of fishes that pass freely through a trawled net without
handling. The SmeltCam has previously been successfully applied in a study of the vertical and
lateral distribution of delta smelt over tidal cycles in the upper San Francisco Estuary (Feyrer et
al. 2013). The pilot study will determine the efficacy of the SmeltCam for similar non-lethal
studies of longfin smelt. Specifically, we will test the ability to identify and distinguish longfin
smelt from other fishes using images obtained with the SmeltCam. We will also be evaluating
other study logistics during the pilot effort, including optimal tow length durations, coordinated
sampling of fish with other physical and biological parameters, and the collection of some
preliminary data to use in a power analysis to refine estimates of samples sizes required for the
assessment of vertical distribution, and potentially detection probabilities.
The first vertical distribution study will take place within approximately a few months of
the pilot study and the second will take place the following calendar year. Vertical distribution
studies will be conducted in San Pablo Bay at site 325 of the CDFW Bay Study (Fig. 4). This site
was chosen because it is where divergent patterns in catch in otter trawl and midwater trawl
samples from the CDFW Bay Study are strongest The site is also located in a key deep (12.3 m),
main center channel location of San Pablo Bay where strong tidal currents generate vertical
structure in physical habitat features important to elucidating vertical distribution of longfin
smelt (Fig. 6). A single fixed site in these studies is sufficient because tidal currents can move
water and fish habitat approximately 10 miles past the site, allowing us to effectively sample
the equivalent of about 20 miles of longitudinal habitat.
The general design of the vertical distribution studies will be to sample physical and
biological parameters approximately every 2 hours for 48 consecutive hours in order to obtain
5
Page 6
consistent data over a full range of tidal and diurnal cycles. All sampling will be conducted
aboard the USGS R/V Turning Tide. Physical measurements will be made with a vertical
acoustic Doppler current profiler (V-ADCP) and a YSI EXO sonde. The V-ADCP will be used to
measure vertical flow structure and the YSI EXO will be used to obtain vertical profiles of water
temperature, turbidity, conductivity, dissolved oxygen concentration, FDOM (surrogate for
dissolved organic carbon), pH, Chlorophyll a fluorescence (surrogate for phytoplankton
biomass) and Phycocyanin (surrogate for blue-green algal biomass). A submersible low light
autoradiometer will be used to measure ambient light. At each sampling interval, physical
condition measurements will be made first and examined in real time in order to determine the
most appropriate vertical spatial structure for sampling fish. Based upon the tidally-averaged
depth of site 325 (12.3 m) and the vertical dimension of the mouth of the midwater trawl (3.6
m), fish density could potentially be measured at 3 or 4 independent depth strata, depending
upon tidal stage. Prevailing physical conditions as measured by the V-ADCP and the YESI EXO
Sonde will determine if the vertical distribution structure of the fish sampling should be
adjusted relative to the maximum number of independent depth strata available to be
sampled.
Fish will be sampled using a midwater trawl with the same dimensions as the one that is
used for the CDFW Bay Study. All fish sampling will be conducted with a midwater trawl
because, unlike an otter trawl, it facilitates sampling at fixed depth strata (Feyrer et al. 2013).
The midwater trawl used by the CDFW Bay Study has a mouth opening of 3.7 m (width) × 3.7 m
(height) with mesh graduated in nine sections from 20.3 cm stretch mesh at the mouth to 1.3
cm stretch mesh at the codend. The CDFW protocol is to tow the midwater trawl obliquely
through that water column for 12 minutes against the current. For this study, we anticipate
also towing the midwater trawl for 12 minutes against the current obliquely through the water
column to obtain a sample representative of what would be collected by the CDFW Bay Study.
This is in addition to towing the midwater trawl for 12 minutes against the current at fixed
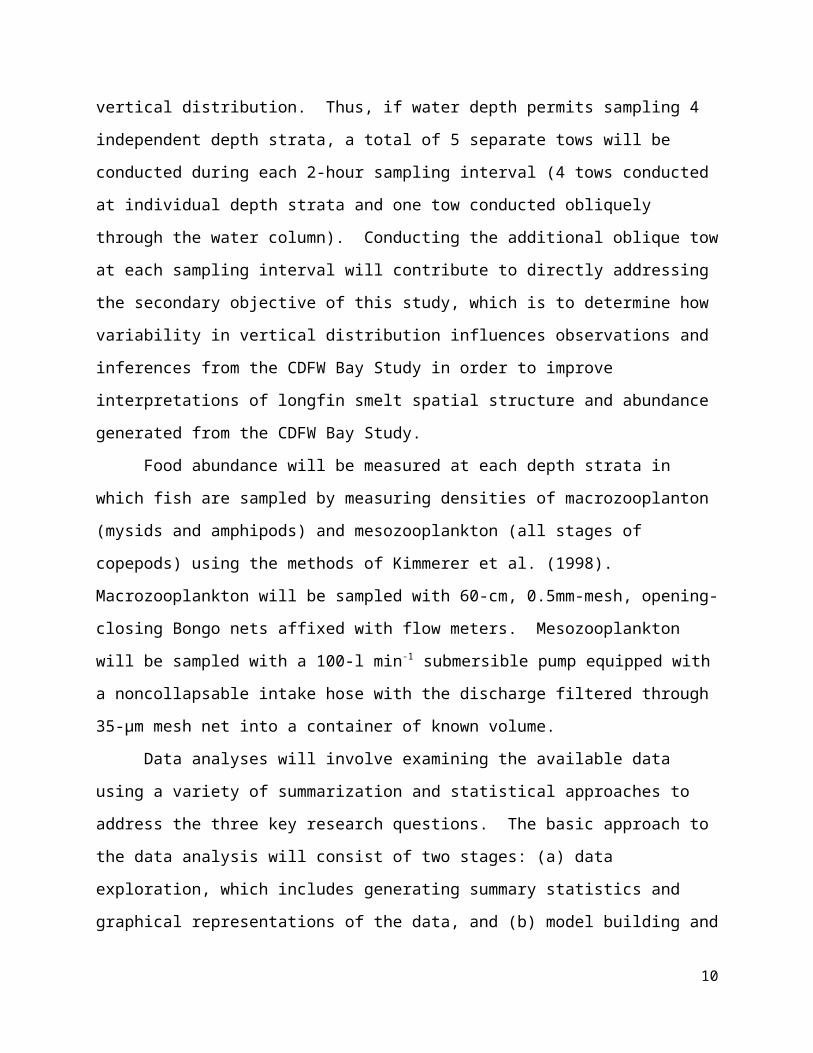
depth strata to evaluate vertical distribution. Thus, if water depth permits sampling 4
independent depth strata, a total of 5 separate tows will be conducted during each 2-hour
sampling interval (4 tows conducted at individual depth strata and one tow conducted
6
Page 7
obliquely through the water column). Conducting the additional oblique tow at each sampling
interval will contribute to directly addressing the secondary objective of this study, which is to
determine how variability in vertical distribution influences observations and inferences from
the CDFW Bay Study in order to improve interpretations of longfin smelt spatial structure and
abundance generated from the CDFW Bay Study.
Food abundance will be measured at each depth strata in which fish are sampled by
measuring densities of macrozooplanton (mysids and amphipods) and mesozooplankton (all
stages of copepods) using the methods of Kimmerer et al. (1998). Macrozooplankton will be
sampled with 60-cm, 0.5mm-mesh, opening-closing Bongo nets affixed with flow meters.
Mesozooplankton will be sampled with a 100-l min-1 submersible pump equipped with a
noncollapsable intake hose with the discharge filtered through 35-µm mesh net into a
container of known volume.
Data analyses will involve examining the available data using a variety of summarization
and statistical approaches to address the three key research questions. The basic approach to
the data analysis will consist of two stages: (a) data exploration, which includes generating
summary statistics and graphical representations of the data, and (b) model building and the
development of statistical tests. The 33 years (1980-2012) of data collected in the CDFW Bay
Study at site 325 indicate that longfin smelt catches are zero-inflated and non-normally
distributed (Fig. 7). Thus, in order to appropriately test hypotheses we may ultimately fit log
linear Poisson models which control for overdispersion (the quasi-Poisson and negative
binomial), or models allowing for excess zeroes (the zero inflated negative binomial) which
control for overdispersion and excess zeroes with the Poisson distribution (Martin et al. 2005).
Model fitting will likely be done using the statistical computing environment R, version 2.15.1,
along with the R package ‘pscl’ (Jackman 2012). To make between model comparisons, we may
calculate AIC values, AIC = 2*k – 2*log(Likelihood), where k = the number of parameters. AIC
simultaneously quantifies goodness of fit, as defined by the likelihood of the data, and model
complexity (as measured by k), and models with the smallest AIC values are considered
preferable.
A preliminary power analysis was conducted with the historical (1980-2012) CDFW Bay
7
Page 8
Study catches of age-0 longfin smelt at site 325 to get a general sense of the sample size
required to reject a basic null hypothesis that there is no treatment level effect across 4
independent depth strata on longfin smelt catch per unit effort (CPUE). CPUE in the CDFW Bay
Study midwater trawl samples is traditionally calculated as the total number of individuals
collected standardized to the total volume of water filtered by the net x10,000. We calculated
CPUE of age-0 longfin smelt for samples at site 325 in the month of June across the history of
the CDFW Bay Study for use in the power analysis, the standard deviation of which = 10. Based
upon the standard deviation of 10, α = 0.05, and potential sample sizes of 24, 48, 96 or 120
replicates, the estimated maximum detectable differences in CPUE units were approximately
12, 8, 6 and 5, respectively (Fig. 8). This can be interpreted as, for example, with 48 replicate
samples (the likely number that will be collected in this study as it is currently envisioned) there
is a 95% probability of detecting a difference of at least 8 CPUE units between the treatment
means. Thus, the null hypothesis that there is no effect of depth would be rejected if there was
a difference of at least 8 CPUE units between treatment means. Although generally
informative, this power analysis should be considered only as a preliminary, conservative
guideline because: (a) it is based on data using oblique tows which may differ in unknown ways
from data that will be collected at specific depth strata, (b) it is based on aggregating 33 years
of historical data which may or may not represent future conditions for the time period when
the study is conducted, (c) the number of depth strata sampled ultimately may differ from 4,
and (d) it considered only a test of the null hypothesis that there is no overall effect of depth
strata on CPUE and therefore does not consider the potential effects of covariates.
ESA Take Considerations
The field work conducted for this study could potentially result in the take of State- and
Federally-listed fish species. The potential take of listed species for this study was estimated
using data from the 33 years (1980-2012) of midwater trawl sampling conducted at site 325 in
the CDFW Bay Study. In the entire history of sampling at site 325 in the CDFW Bay Study, there
have been no green sturgeon, and only a single delta smelt and a single steelhead collected,
thus we do not anticipate collecting any of these species during this study. During this time
8
Page 9
period there have been 4,355 age-0 longfin smelt, 1,925 age-1+ longfin smelt, and 125 juvenile
Chinook salmon (of unknown race) collected at site 325. Thus, we anticipate collecting age-0
and age-1+ longfin smelt (indeed, they are the focus of this study) and also possibly collecting
juvenile Chinook salmon during this study.
The occurrence of age-0 longfin smelt, age-1+ longfin smelt, and juvenile Chinook
salmon in midwater trawl samples at site 325 is highly seasonal (Figs. 9 and 10). We considered
data collected during the month of June to estimate the take of age-0 longfin smelt, age-1+
longfin smelt, and juvenile Chinook salmon for this study. The average number of individuals
collected per tow was as follows: juvenile Chinook salmon =1, age-0 longfin smelt = 76, and age-
1+ longfin smelt = 5. Extrapolating these average values to the approximately 48 tows that we
anticipate conducting in this study results in total estimated take levels as follows: juvenile
Chinook salmon = 96, age-0 longfin smelt = 3,648, age-1+ longfin smelt = 288.
The take of individual longfin smelt and juvenile Chinook salmon during this study is not
expected to affect the status of either species. It should first be noted that the juvenile Chinook
salmon collected during this study are expected to consist primarily of fall- and late-fall run
individuals. Although it is possible that individual juvenile spring-run or winter-run Chinook
salmon could be collected, it is unlikely based upon outmigration timing. To the extent
possible, sampling will be conducted with the SmeltCam affixed to the midwater trawl in order
to maximize the opportunity for non-lethal take. Any individual juvenile Chinook salmon
collected in nets with traditional cod ends will be gently handled and released back to the water
alive. Longfin smelt collected in nets with traditional cod ends will be retained for further
examination in the laboratory at a later time. Potential uses for these individual include
examining their stomach contents for diet characterization, and examining their otoliths to
determine age, growth, natal origin, migration history, as well as numerous other applications.
Overall, the results of this study are expected to provide net benefits to the species by
improving our understanding of their ecology and habitat use that can guide management
decisions and habitat restoration actions.
9
Page 10
Budget
The total budget for this study is $370,680 (see attached USGS and ICF Budget sheets for
details). This includes all labor, equipment, and identification services. This budget estimate
does not include services provided by Sureworks. Sureworks budget might be available through
the existing SFCWA budget. Budget estimates for ICF ($206,878) and USGS ($163,802) are
provided separately because we assume they will go under different contract vehicles.
Longfin smelt vertical distribution studies
Labor TotalsICF International $158,705USGS $127,022staff benefits @ _______% includedTOTAL LABOR $285,727
OPERATING EXPENSESTravel and Per DiemICF $8,173USGS $15,089Boat (Turning Tide) and vehicle rental $16,976EquipmentICF $17,500USGS $4,715Subcontractor (BSA)-Identification services $22,500TOTAL OPERATING EXPENSES $84,953SUBTOTAL LABOR + OPERATING EXPENSES $370,680OVERHEAD @ % (Less Equipment) IncludedGRAND TOTAL $370,680
Deliverables
Deliverables will include at least one manuscript submitted to a peer reviewed journal and, as
requested, presentations at conferences and to representatives, designees and staff of Metropolitan
Water District.
10
Page 11
Literature Cited
Feyrer. F, D. Portz, D. Odom, et al. (2013) SmeltCam: underwater video codend for trawled nets
with an application to the endangered delta smelt. PLoS ONE 8(7): e67829.
doi:10.1371/journal.pone.0067829
Jackman S (2012) pscl: Classes and Methods for R Developed in the Political Science
Computational Laboratory, Stanford University. Department of Political Science, Stanford
University. Stanford, California. R package version 1.04.4. URL http://pscl.stanford.edu/
Jassby, A.D., W.J. Kimmerer, S.G. Monismith, C. Armor, J.E. Cloern, T.M. Powell, J.R. Schubel,
and T.J. Vendlinski. 1995. Isohaline position as a habitat indicator for estuarine populations.
Ecological Applications 5:272–289
Kimmerer, W. J., Burau, J. R., & Bennett, W. A. (1998) Tidally oriented vertical migration and
position maintenance of zooplankton in a temperate estuary. Limnology and Oceanography 43:
1697-1709.
Kimmerer, W.J. 2002. Effects of freshwater flow on abundance of estuarine organisms: physical
effects or trophic linkages. Marine Ecology Progress Series 243:39–55
Kimmerer, W.J., E.S. Gross, and M.L. MacWilliams. 2009. Is the response of estuarine nekton to
freshwater flow in the San Francisco Estuary explained by variation in habitat volume? Estuaries
and Coasts 32:375–389.
Martin TG, Wintle BA, Rhodes JR, Kuhnert PM, Field SA, et al. (2005) Zero tolerance ecology:
improving ecological inference by modelling the source of zero observations. Ecology Letters 8:
1235-1246.
11
Page 12
Rosenfield, J. A., andR. D. Baxter. 2007. Population dynamics and distribution patterns of
longfin smelt in the San Francisco Estuary. Transactions of the American Fisheries Society
136:1577-1592.
Sommer, T., C. Armor, R. Baxter, R. Breuer, L. Brown, M. Chotkowski, S. Culberson, F. Feyrer, M.
Gingras, B. Herbold, W. Kimmerer, A. Mueller-Solger, M. Nobriga, and K. Souza. 2007. The
collapse of pelagic fishes in the upper San Francisco Estuary. Fisheries 32(6):270–277.
Stevens, D. E., and L. W. Miller. 1983. Effects of river flow on abundance of young Chinook
salmon, American shad, longfin smelt, and delta smelt in the Sacramento-San Joaquin River
system. North American Journal of Fisheries Management 3:425–437.
Thomson, J.R., W.J. Kimmerer, L.R. Brown, K.B. Newman, R. Mac Nally, W.A. Bennett, F. Feyrer,
and E. Fleishman. 2010. Bayesian change-point analysis of abundance trends for pelagic fishes
in the upper San Francisco Estuary. Ecological Applications 20:1431–1448.
12
Page 13
Table 1. Fish Monitoring Surveys in the San Francisco Estuary
Survey Life Stage Duration Habitat/Gear Type Location
Fall Midwater Trawl1967-Present
Age 0, Adult Sept-Dec Oblique/ Midwater trawl
San Pablo to Delta
Chipps Island Trawl1976-Present
Age 0, Adult Jan-Dec Oblique/Midwater trawl
Chipps Island
Bay Study1980-Present
Age 0, Adult Jan-Dec Oblique/MidwaterDemersal/Otter Trawl
Estuary wide
Smelt Larval Survey2009-Present
Larvae Jan-Mar Oblique tow/Larval net (505 µ mesh) on sled
San Pablo to Delta
20 mm Survey1995-Present
Larvae, post larvae
Mar-July Oblique tow/ Larval net (1600 µ mesh) on sled
San Pablo to Delta
Townet Survey1959-Present
Post-larvae,Juveniles
May-Aug Oblique tow/Net on sled
San Pablo to Delta
Table 2. Approximate time frame for study elements.
Calendar year Element Approximate timing
2015 Pilot study Late Spring/early Summer 2015
2015 First vertical distribution study Late Summer/early Fall 2015
2016 Second vertical distribution study Summer 2016
13
Page 14
Figure 1. Ratio of Midwater Trawl (MW) to Otter Trawl (OT) longfin smelt CPUE from the Bay Survey from 1980 to 2011. The ratio over time has decreased, suggesting there has been a change in detection, catchability, or habitat use of longfin in the MW trawl over time.
Figure 2. Schematic diagram demonstrating the conceptual model explaining the divergent patterns in longfin smelt catch in otter trawl and midwater trawl samples from the CDFW Bay Study at site 325. The conceptual model posits that longfin smelt are distributed near the channel bottom. This results in larger catches in the otter trawl samples than the midwater trawl samples. This is because the otter trawl is positioned along the channel bottom for the entire duration of a tow, while the midwater trawl is pulled obliquely through the water column and is therefore positioned near the channel bottom where longfin smelt are distributed for only a short duration of tow.
14
Page 16
Figure 3. Schematic diagram demonstrating the sampling strategy that will be employed to test the conceptual model explaining the divergent patterns in longfin smelt catch in otter trawl and midwater trawl samples from the CDFW Bay Study at site 325. The conceptual model posits that longfin smelt are distributed near the channel bottom. This will be tested by sampling for longfin smelt at up to 4 fixed independent depth strata, and also with an oblique tow for direct comparisons to samples representative of the CDFW Bay Study.
16
Page 17
Figure 4. Map of the San Francisco Estuary shown with study sites from the CDFW Bay Study.
Site 325, highlighted in red, is the location where the longfin smelt vertical distribution studies
will be conducted.
17
Page 18
Figure 5. Catch frequency of longfin smelt in the OT and MW by station.
Figure 6. Map showing the bathymetry of San Pablo Bay and that site 325 is located in the deep,
main center channel where strong tidal currents generate vertical structure in physical habitat
features important for elucidating vertical distribution of longfin smelt. Hotter colors indicate
greater depth.
18
Page 20
Figure 7. Frequency histograms of the count of age-0 longfin smelt collected per tow across
months at CDFW Bay Study site 325, 1980-2012. Note that both the vertical and horizontal
axes are truncated and do not show the full range of the data.
20
Page 21
Figure 8. Graphical display of the results of a power analysis testing the null hypothesis that there is no overall treatment effect of 4 independent depth strata on age-0 longfin smelt CPUE. The horizontal dashed line is set to α = 0.05.
21
Page 22
Figure 9. Boxplot representation of the number of longfin smelt collected per tow across
months at CDFW Bay Study site 325, 1980-2012.
22
Page 23
Figure 10. Boxplot representation of the number of juvenile Chinook salmon collected per tow
across months at CDFW Bay Study site 325, 1980-2012.
23