REPORT FROM: STRATEGIC DIRECTOR TO: MANAGEMENT TEAM DATE: 21 ST JULY 2015 Report Author: Marie Mason Tel. No: 01282 661790 E-mail: [email protected]PERFORMANCE INDICATOR (PI) REPORT: 1 ST APRIL – 30 TH JUNE 2015 PURPOSE OF REPORT The report presents Management Team with details of performance for the period 1 st April – 30 th June 2015. RECOMMENDATIONS That Management Team agree: (1) what action is required for the underperforming PIs identified in Appendix 1; (2) to note the work related absence and CO 2 emissions performance for 2014/15 as detailed in Appendix 2; (3) that any strategic issues / trends arising that have caused underperformance have been correctly identified and consider what corrective actions can be put in place; (4) agree to note that the PI Review for 2015/16 is still underway and to submit any proposed deletions / amendments / additions to their PIs along with their Service Plans for 2015/16 (deadline for submission end-July); (5) the performance reporting timetable for the remainder of 2015/16 and ensure that this is shared with all staff involved in the data collection processes for their service and is included in their work programmes / diaries for 2015/16. REASONS FOR RECOMMENDATIONS To ensure that we retain focus on our priorities and deliver good
Transcript
REPORT FROM: STRATEGIC DIRECTOR
TO: MANAGEMENT TEAM
DATE: 21ST JULY 2015
Report Author: Marie MasonTel. No: 01282 661790E-mail: [email protected]
PERFORMANCE INDICATOR (PI) REPORT:1ST APRIL – 30TH JUNE 2015
PURPOSE OF REPORTThe report presents Management Team with details of performance for the period 1st April – 30th June 2015.
RECOMMENDATIONSThat Management Team agree:(1) what action is required for the underperforming PIs identified in Appendix 1;(2) to note the work related absence and CO2 emissions performance for 2014/15 as
detailed in Appendix 2;(3) that any strategic issues / trends arising that have caused underperformance have been
correctly identified and consider what corrective actions can be put in place;(4) agree to note that the PI Review for 2015/16 is still underway and to submit any
proposed deletions / amendments / additions to their PIs along with their Service Plans for 2015/16 (deadline for submission end-July);
(5) the performance reporting timetable for the remainder of 2015/16 and ensure that this is shared with all staff involved in the data collection processes for their service and is included in their work programmes / diaries for 2015/16.
REASONS FOR RECOMMENDATIONSTo ensure that we retain focus on our priorities and deliver good quality, accessible services.
ISSUE
Background
1. As you will know, following the changes introduced by Central Government towards more localised scrutiny of Council performance, we took the opportunity to review our performance management arrangements for 2011/12 onwards.
2. Part of this review was to devise, with services, a revised PI set with a focus on moving towards more productivity based measures of performance. This change has helped us to
establish how things are working more effectively with the resources that we have, and will be used to improve and drive our performance.
3. Managers were also asked to report regular performance information on a timelier basis. This has helped us to see how services are performing more quickly than previous years and allows Management Team to resolve any issues identified more promptly.
4. A review of this PI set takes place at the end of each year. This involves the Performance Management Officer discussing the existing PIs, previous performance and the proposed targets for the forthcoming year with each service group.
5. The PI Review for 2015/16 is still underway due to delays with the Strategic Plan 2015 – 2018 and the subsequent Service Plans for 2015/16.
6. The proposed PI set and targets for 2015/16 are due to be presented to Management Team at a future meeting prior to the Quarter 2 updates deadline of 8th October 2015.
Present Position
General Performance7. With regard to the Quarter 1 PIs, detailed performance information is attached as follows:
- Appendix 1 – contains Corporate PIs that have performed below target for the period 1st April – 30th June 2015. These have been identified as ‘key’ (previously by Management Team) where appropriate in terms of their importance to the services being delivered by the Council. Management Team are asked to focus on this appendix in their discussions.
- Appendix 2 – contains an update on the performance information for CO2 emissions and work related absence during 2014/15 as this was not available in the last report.
- Appendix 3 - contains performance information for all our Corporate PIs and this is provided for your information.
- Appendix 4 – contains PIs that are delivered by Pendle Leisure Trust and have been provided for your information.
- Appendix 5 - contains PIs that are delivered by Liberata on behalf of the Council. A copy of the Partnership Steering Group Report for June 2015 (as presented at their meeting held on 14th July 2015) has been provided for your information.
8. Of our 116 Corporate PIs reported on for the quarter, performance could only be measured against 80. Performance cannot be assessed against 36 PIs because:
- 29 are ‘Data Only’ PIs. This means that targets have not been set either due to the nature of the PI (e.g. monitoring trends), or because they are feeder PIs and are provided in this report for information / context.
- 4 PIs are related to street cleanliness surveys which are not reported in Quarter 1.- 2 PIs have no data to report as no requests for action / works were received /
- 1 PI (TS 14 – Council Tax Arrears collection rate) is undergoing a review of the methodology around data collection processes. This is because the current PI is not providing an accurate and meaningful reflection of the true amount of Council Tax arrears being collected.
2
9. The summary overleaf shows how these 80 PIs have performed during the period April – June 2015. 51 (63.8%) of our PIs are performing on or above target whilst 36.3% are underperforming (24 (30%) are Red and 5 (6.2%) are Amber). The summary from Quarter 1 2014/15 has also been provided as a comparison.
10. It is important to note at this stage that within Covalent: there have been ‘blanket’ variances/thresholds set (1% for Amber and 5% for Red) for
the majority of PIs. Therefore, dependant on how the PI is measured, a very small underperformance can result in the traffic light icon displaying as ‘red’;
the ‘Long Trend’ arrow reported for each PI compares current performance (where possible) by averaging data reported previously.
11. In general performance has slightly improved since the same period last year.
12.Forecasts for 83 PIs were also provided by services on performance towards annual targets. This information indicates that 67 (80.7%) of these PIs are expected to meet or exceed targets set for the year.
13.All the PIs that have underperformed in Quarter 1 against the targets set are detailed within Appendix 1. Of these, 13 are not expected to meet the target set for the year. These have been presented to the respective Directors regarding the performance of these PIs and their comments sought and included in the table, where relevant.
14.Management Team are asked to focus on and identify which of the indicators within Appendix 1 give the most significant concern and agree what action is required.
15.Whilst looking at these PIs it is also important to determine whether there are any underlying strategic issues or trends arising that have caused underperformance and what we can do/are doing to tackle these.
16.Some of the possible underlying strategic issues or trends identified in our previous reports are still apparent this quarter, namely those relating to:
a) waste management where performance remains below target (although it has been acknowledged that the targets are particularly stretching in the absence of investment in waste facilities by the County Council). Waste Services are exploring ways on how we can address the issues of reduced recycling rates; however, the garden waste scheme is also a huge contributory factor in underperformance against the targets set.
b) the timely processing of planning applications. This is still an issue but it has been acknowledged that performance here is not within officer’s control. Officer performance remains above target.
3
c) the timely handling of complaints. This features regularly in our reports; however, the last two quarters have seen the worst performance reported since we began monitoring this activity. To address this a fundamental review of complaints is being undertaken across the Council which will include refresher training in the staff handling of complaints.
Update on 2014/15 annual performance17.The 2014/15 performance data for the PIs contained within this section are subject to time
lags due to complex data collection processes. However, the data not available in the previous performance report has now been collated and is detailed in Appendix 2.
18.The percentage of sickness absence due to work related injury and/or work related ill health (HR 5) has performed on target. The number of days lost due to work related absence has fallen by 183 days during 2014/15. This is mainly due to the marked improvement in work related illness falling from 163 days absence in 2013/14 to just 2 days absence in 2014/15.
19.A separate report providing further analysis of work related absence was presented to Management Team at the 26th May 2015 meeting.
20.With regard to the CO2 emissions PIs (LCP 9a and LCP 9b) performance is mixed. The emissions related to LA building stock has reduced considerably when compared to 2013/14; however, it must be noted that the significant impact on our emissions is mostly due to the rationalisation of our building stock (i.e. transfer of community buildings and toilets).
21.Whilst we have not achieved the target reduction in emissions from LA travel during 2014/15, emissions have been reduced by 1.5% (648 tonnes). The difficulty we are facing is that the more streamlined the fleet becomes the more difficult it is to make any significant progress towards achieving the 4% target.
PI Review for 2015/1622.Please be reminded that the PI Review for 2015/16 is still underway and any proposals for
deletion of, or changes to, existing PIs and requests for new PIs must be submitted to the Performance Management Officer (PMO) along with the finalised Service Plans for 2015/16.
23.Further discussions will then be held with individual services and a further report on the proposed PI Set for 2015/16 will be presented to a future meeting of Management Team.
Future Reporting Procedures and Deadlines24.The PMO would like to remind Management Team of the changes in reporting
arrangements following the disbandment of the Performance Monitoring Panel. An update on a basket of Key PIs (as presented to you at the 7th July 2015 meeting) will be reported to the Executive as part of the Strategic Monitoring Report.
25.Due to the committee timetable, it will be usual practice for the PMO to have to provide this information to Committee Services earlier than previously. Therefore, it is very important that the quarterly update deadlines are met.
26.The Covalent update deadlines for the remainder of 2015/16 are detailed below. These have been set as they have to try to give responsible officers as much time as possible to collate and submit the data whilst enabling the PMO to meet the deadlines of the committee timetable.
27.We ask that Management Team ensure that the relevant members of their services / teams are aware of these dates and the changes in procedures:
4
o Quarter 2 – 12noon, Thursday 8th October 2015o Quarter 3 – 12noon, Friday 15th January 2016o Quarter 4 – 12noon, Wednesday 13th April 2016
28.Also, please be reminded of the importance of ensuring that team members are aware of what happens to the data they collate and provide; where this information is reported and how it is used; along with the thanks of the Performance Management Officer for their help in compiling the performance reports each quarter.
IMPLICATIONS
Policy: The Council has a duty to regularly report on its performance and make this information available to members of the public, staff and councillors.
Financial: None.
Legal: The Council has a duty to regularly report on its performance and make this information available to members of the public, staff and councillors.
Risk Management: Failure to effectively monitor performance and deal with any problems of underperformance could impact upon the Council’s ability to deliver its priorities.
Health and Safety: None.
Sustainability: A number of our current performance measures relate to Sustainability issues.
Community Safety: A number of our current performance measures relate to Community Safety issues.
Equality and Diversity: A number of our current performance measures relate to Equality and Diversity issues.
APPENDICESAppendix 1 – Underperforming PIs for 1st April – 30th June 2015Appendix 2 – Update on Performance Information relating to 2014/15Appendix 3 - Detailed Corporate PI performance information reported for the period 1st April – 30th June 2015Appendix 4 – Pendle Leisure Trust PIs: 1st April – 30th June 2015Appendix 5 - Liberata Partnership Steering Group Report for June 2015
LIST OF BACKGROUND PAPERS- Performance data received from individual services - Supporting commentary received from individual services- Covalent Performance Management Software reports- Partnership Steering Group Report for June 2015
5
Underperforming PI Report: Quarter 1, 2015/16 APPENDIX 1
Key:Status: Performance Against Target / Expected Outcome
This PI is significantly below target.
This PI is slightly below target.
This PI is on target.
Performance for this PI cannot be measured.
Information only PI.
Long Trend: Are we consistently improving?The value of this PI has improved when compared to an average of previous reporting periodsThe value of this PI has not changed when compared to an average of previous reporting periodsThe value of this PI has worsened when compared to an average of previous reporting periods
No comparable performance data is available.
Communications
PI2015/16 Outturn to date
2015/16 Target to
dateStatus
Long Term Trend
Expected Outcome Comments
CT 2 Number of news releases, written statements and letters issued
35 48
News releases: 31. These included making sure residents register to vote, free dog micro chipping, Tour of Britain, Colne Grand Prix and transfer of toilets to Barrowford Parish Council.Statements: 4. These responded to enquiries about rats in Barnoldswick, allegations of postal fraud, why Pendle is an enterprising area and West Craven Area Committee’s budget.Letters: 0. Reduced resources have resulted in less news releases being issued. The annual target will be reviewed during the PI Review which is currently underway.
CT 3a Number of news releases issued supporting partnership themes
5 7
Releases include promoting closer joint working with Lancashire County Council, transfer of public toilets to Barrowford Parish Council, Bradley Big Local and work to manage scrap metal dealers. This PI is measured via activity by external organisations and as such is 'demand-led'. Therefore, the annual target will be reviewed during the PI Review which is currently underway.
6
PI2015/16 Outturn to date
2015/16 Target to
dateStatus
Long Term Trend
Expected Outcome Comments
CT 7 Number of graphic design commissions carried out
30 33Graphic design commissions include Walking Festival booklet, Tour of Britain sponsorship brochure, Vicky Witch Activity boards and Cycle Festival leaflet.
Democratic & Legal Services
PI2015/16 Outturn to date
2015/16 Target to
dateStatus
Long Term Trend
Expected Outcome Comments
DL 2 Standard land charge searches completed in less than 5 days
79.06% 95%
The figure for the % of standard searches replied to within 5 days in the first quarter is low and clearly gives cause for some concern. The level of staff at the County Council who deal with search replies is now causing significant issues. I am therefore now arranging a meeting with the relevant managers at the County Council to resolve these issues.
Directorate
PI2015/16 Outturn to date
2015/16 Target to
dateStatus
Long Term Trend
Expected Outcome Comments
DIR 1 Percentage of complaints handled within timescales
78.5% 100.0% In Quarter 1 2015/16 a total of 228 complaints were received. However of these 14 were still in progress at the end of the quarter and have been excluded from the Q1 reported data. Of the 214 complaints actually resolved a total of 168 (78.5%) were resolved within the target of 15 days. The 214 complaints resolved were dealt with at Stage 1 (210) and Stage 2 (4). The volume of complaints received this period is much lower than reported in the previous quarter (300) but higher than reported in the equivalent period in 2014/15 when only 161 complaints were recorded.
The below target performance is attributable primarily to performance within Environmental Services which accounts for 45 of the 46 complaints that were resolved in excess of the 15 day target. The service accepts that there have been a large number of complaints that have exceeded the 15 day period. However, it was noted when compiling the information that the majority of these were occurring in the early part of the quarter. These reduced later reflecting on the work undertaken to improve the services response times as specified in the Quarter 4 2014/15 performance report.
7
PI2015/16 Outturn to date
2015/16 Target to
dateStatus
Long Term Trend
Expected Outcome Comments
In terms of quantity of complaints for the service they are found to link to the major frontline activities such as refuse collection and recycling collections. These are understandably going to be the highest areas of complaints as they carry out 64,000 collections each week. Work will be undertaken to identify trends within these complaints to see if they can isolate a scheme, service or individual team and take appropriate action to resolve any issues identified.
A fundamental review of complaints is being undertaken across the Council which will include refresher training in the staff handling of complaints.
Across all services a total of 32 compliments were received in the quarter.
Environmental Services
PI2015/16 Outturn to date
2015/16 Target to
dateStatus
Long Term Trend
Expected Outcome Comments
WM 6a s46 - number of examples of proactive work being undertaken to prevent formal action
115 250
Section 46 of the Environmental Protection Act 1990 allows a waste collection authority to specify how waste is to be presented for collection. I.E request an occupier to place waste in receptacles of a kind and number specified. Second 46 Notices are also used to enforce the separation of waste types for recycling and the removal of receptacles from the public highway following there emptying. In June the government decriminalised offences under Section 46 and placed further burdens upon authorities to prove nuisance and detrimental effect to the amenities of the area. In view of the amendments to Section 46 and our uncertainty on how the amendments affected the Authority work in this area was temporarily put on hold whilst we sought external advice.Within quarter 1 Officers wrote to 115 occupiers and following re-inspection have issued 12 Notices resulting in the need for 1 Fixed Penalty Notice to be issued against a resident of the Borough.
WM 8c Percentage of the total tonnage of household waste which has been recycled - Rolling Year %
23.59% 25.50% These figures include estimated tonnages for disposal and recycling for June 2015 as Lancashire County Council (LCC) cannot provide final figures yet and data for quarter 4 of 2014/15 has not yet been confirmed by WasteDataFlow.
The estimated performance of 23.59% is
8
PI2015/16 Outturn to date
2015/16 Target to
dateStatus
Long Term Trend
Expected Outcome Comments
slightly below the annual target of 25.5%. The target was set at a high level in order to try and reflect the challenging targets in the Lancashire Waste Strategy. Performance is very similar to previous quarters and there are no significant changes to report.
WM 8d Percentage of the total tonnage of household waste which have been sent for composting or for treatment by anaerobic digestion - Rolling Year %
8.06% 14.50%
These figures include estimated tonnages for disposal and recycling for June 2015 as Lancashire County Council (LCC) cannot provide final figures yet and data for quarter 4 of 2014/15 has not yet been confirmed by WasteDataFlow.
The estimated performance of 8.06% is below the annual target of 14.5%. The target was set at a high level in order to try and reflect the challenging targets in the Lancashire Waste Strategy. We introduced charges for garden waste collection on 30th June 2014 and we have seen an expected decrease in the amount of garden waste collected for composting by approximately 42% in the 12 months from July 2014 – June 2015 compared to the previous 12 months, a drop of 1836t. The 8% is likely to be the composting rate that we achieve going forward, but we have gained over £160,000 net income per year from approximately 7,600 households subscribing to the new payment scheme.
WM 10a Percentage of household waste sent for reuse, recycling and composting - Rolling Year %
32.10% 40.00%
These figures include estimated tonnages for disposal and recycling for June 2015 as Lancashire County Council (LCC) cannot provide final figures yet and data for quarter 4 of 2014/15 has not yet been confirmed by WasteDataFlow.The estimated performance of 32.10% is below the annual target of 40%. The target was set at a high level in order to try and reflect the challenging targets in the Lancashire Waste Strategy. Please see comments for WM 8c and WM 8d as WM 8d is the main reason why this indicator is also underperforming
WM 12a Unpaid hours of work Pendle benefits from by taking part in the Community Payback Scheme
0 hrs 125 hrs This performance indicator has been included following the authorities agreement with Lancashire Probation Trust in 2012 to provide suitable work placements to offenders living within the Borough of Pendle. During November 2014 we were advised that Sodexo Justice Services with NACRO had been chosen as the preferred bidders for the Cumbria and Lancashire Community Rehabilitation company.
In November 2014 Officers met with the practice manager for community payback
9
PI2015/16 Outturn to date
2015/16 Target to
dateStatus
Long Term Trend
Expected Outcome Comments
for Cumbria and Lancashire. During the meeting officers were further advised that on being awarded the contract a period of mobilisation would take place throughout April 2015. The mobilisation period was likely to continue until June and following its completion it was possible that a re-structure would take place. It is felt that the re-organisation resulted in a lack of attention being placed on the agreement with Pendle which has since been raised with them in the aim of securing community payback workers in the future.
Financial Services
PI2015/16 Outturn to date
2015/16 Target to
dateStatus
Long Term Trend
Expected Outcome Comments
AC 1 Average rate of investment return on surplus funds managed internally
0.54% 0.60%
Investment returns continue to be below target as a result of market conditions and the low interest rate environment. The base rate has remained at 0.5% since March 2009. Whilst the % rate achieved is less than target the absolute cash value achieved in the quarter is above target owing to higher than forecast cash balances. Therefore current indications are that the budget for investment income will be achieved despite the low returns on offer.
AP 4 Percentage of Council Taxpayers paying by Direct Debit
59.39% 63.00%DD payers continue to increase on Council Tax at 0.68% (or 477) higher than this time last year.
AP 5 Percentage of NNDR Ratepayers paying by Direct Debit
54.82% 58.00%Rate of NNDR direct debit payers remains static when compared to this time last year.
Housing, Health & Economic Regeneration
PI2015/16 Outturn to date
2015/16 Target to
dateStatus
Long Term Trend
Expected Outcome Comments
EH 7a Percentage of programmed pollution inspections completed
95.7% 100.0%3 permitted processes were scheduled for inspection in Q1 and all 3 have been completed. This includes the outstanding inspection from the previous quarter.
HI 1 % of Disabled Facility Grant (DFG) enquiries ready for approval within 3 months of initial visit/scheme agreement
88.9% 90.0%
We achieved 89% in this quarter which is just below the target and represents 16 out of the 18 approvals. The two approvals that took longer than three months were more complicated adaptations requiring greater input from other services. I anticipate that we will meet this target.
HN 1 Recording cases 0.92 1.58 The outturn for Q1 is 0.92 (34 cases of
10
PI2015/16 Outturn to date
2015/16 Target to
dateStatus
Long Term Trend
Expected Outcome Comments
where positive action is taken to prevent or relieve homelessness (per 1,000 households)
homelessness prevented). This represents a low quarterly outturn. However, the outturn only includes homelessness prevented by Housing Needs. Statistics were not available by the deadline for Open Door, Pennine Lancashire Mental Health and Housing Project and Pendle Domestic Violence Initiative (PDVI) which would be expected to add a number of additional cases to the out-turn.
Housing Needs preventative work included helping resolve benefits issues which ensured that clients were not evicted, liaison with housing providers to help secure accommodation and use of a bond scheme to help secure accommodation in the private rented sector.
HN 3 Number of nights provided in Bed and Breakfast to homeless applicants
133 53
The out-turn for Q1 is 133 nights, which is quite a high turn-out and means that the overall target for the year of providing less than 350 nights in B&B is more likely to be missed.
There were three particular cases where it was not possible to move the client on from B&B quickly. In two of the cases, although interviews were arranged for alternative supported housing, both clients chose to ignore this opportunity and this delayed move on. In the third case, the clients presented with particularly high needs which meant that many rehousing options were not available in the short-term.
HN 4 Occupancy of the Pendle's Women's Refuge
65.20% 80.00%
The outturn for Q1 is 65.2%, which is a low out-turn and is a slow start towards the overall yearly target.
The Refuge receives significant numbers of referrals but sadly it is not possible to take on many clients due to their presenting needs which are often very high. Whilst all clients are victims of domestic abuse, many also present with a substance / alcohol dependency, significant mental ill-health and/or other substantial needs. Consequently, despite vacancies being available, which are advertised nationally, many referrals have not been successful. The Refuge is not risk averse but has to undertake risk assessments with all potential referrals in terms of whether it is possible to ensure the safety of the client, the safety of existing residents and the safety of staff when deciding whether to accept a referral or not.
HS 6 Number of private sector
24 25 The increased activity in dealing with disrepair complaints has led to an increase
11
PI2015/16 Outturn to date
2015/16 Target to
dateStatus
Long Term Trend
Expected Outcome Comments
dwellings where Category 1 hazards are removed
in the numbers of properties where category one hazards are being removed. Most of the hazards are being removed through informal action. I anticipate that we will meet the target set.
Neighbourhood Services
PI2015/16 Outturn to date
2015/16 Target to
dateStatus
Long Term Trend
Expected Outcome Comments
ESP 9 Percentage of Rights of Way service requests cleared
77% 80%
We are slightly below our target level. This reflects that a number of difficult issues were reported during the relevant period which could not be easily or quickly resolved.
LCP 1 Number of targeted intervention activities completed in response to local issues
24 26
The interventions are referred to the appropriate agencies and organisations and cover a wide range of issues including CCTV footage requests, ASB, and flytipping.
LCP 3 Number of 'Community Champions' identified
0 3
There were no Community champions identified this quarter however moving forward we will look to include community champions from other sections of Neighbourhood Services in future quarters
LCP 6 Percentage of problem profile issues resolved following community street audits (Rolling Cumulative PI)
82.4% 85%
During Quarter 1 12 new issues were recorded and four were removed leaving 38 outstanding. Since the monitoring started 216 issues have been recorded and 178 removed; 82.4% compared with a target of 85%. The change is due to an intensive EVA in Brierfield which included a new area with a number of significant issues.
WM 3 Number of fixed
The annual target has been increased this year to reflect that 2 new members of staff who will be joining the team in September 2015. So although we have not achieved the quarterly target this quarter it is hoped that this will change as we go through the year, especially in quarters 3 and 4.The Council has various powers to issue
Planning, Building Control & Licencing
PI2015/16 Outturn to date
2015/16 Target to
dateStatus
Long Term Trend
Expected Outcome Comments
PBC 5 Percentage of 'Major' planning applications determined within 13 weeks
66.67% 86% The total number of applications determined in the major category for 2014/15 was 18. In the first quarter of 2015/16 there have been 9 determinations of which 6 were within the statutory time limit. The 3 applications that went over the time limit were all
12
PI2015/16 Outturn to date
2015/16 Target to
dateStatus
Long Term Trend
Expected Outcome Comments
proposed new housing developments. The outturn at 66.67% is below target but this is the first quarter.
PBC 6 Percentage of 'Minor' planning applications determined within 8 weeks
76% 87%
The numbers determined in this category are similar to those for the first quarter last year. Of the 50 applications determined 38 were within the statutory time limit. 10 out of the 12 applications over the time limit were determined at Committee. The outturn at 76% is currently below target.
PBC 7 Percentage of 'Other' planning applications determined within 8 weeks
83.08% 92%
The number of applications determined in this category are the same as the first quarter for the previous year. Of the 65 applications 13 were determined at Committee and 8 of these were over the time limit whereas only 3 out of 52 applications determined by officer were over the time limit. The outturn at 83.08% is below target.
Policy & Performance Team
PI2015/16 Outturn to date
2015/16 Target to
dateStatus
Long Term Trend
Expected Outcome Comments
AP 3 Percentage of PIs reported that were activated in Covalent before agreed deadlines
86.47% 92%
The deadline for inputting and activating the PI data for Quarter 1 2015/16 was 12noon on Thursday 9th July 2015. A total of 170 PIs were due for an update by the deadline this quarter with 23 not being updated on time.
13
Update on Annual Performance for 2014/15 APPENDIX 2
Key:Status: Performance Against Target / Expected Outcome
This PI is significantly below target.
This PI is slightly below target.
This PI is on target.
Performance for this PI cannot be measured.
Information only PI.
Long Trend: Are we consistently improving?The value of this PI has improved when compared to an average of previous reporting periodsThe value of this PI has not changed when compared to an average of previous reporting periodsThe value of this PI has worsened when compared to an average of previous reporting periods
No comparable performance data is available.
HR 5 Percentage of sickness absence due to work related injury and/or work related ill health (days absence)
Value Target Status Long Trend
2012/13 21.40% 8.00%
2013/14 20.30% 8.00%
2014/15 7.20% 8.00%
What is Good Performance? Lead Officer
Aim to MinimiseMichelle Molloy - Principal Human Resources / Health & Safety Officer
Supporting CommentaryThe number of days lost due to work related absence has fallen by 183 days in the year.
There is a marked improvement in work related illness, accounting for only 2 days absence. This is an area which is generally impacted by work related stress. In 2013/14 this accounted for 163 days absence form 7 employees.
Work related ill health is addressed via the procedures for long and short term absence and the procedures for dealing with work related stress. Other direct measures are also taken to improve the health and wellbeing of employees, such as the Health & Wellbeing Programme which gives employees the opportunity to take part in a range of wellbeing activities and also provides awareness raising/health promotion on a wide range of topics. There are also indirect measures aimed at improving the health and wellbeing of staff such as flexible working.
In terms of work related injuries, all the absences were for frontline staff in Waste. 5 absences were back related; 2 were injuries wrists; 5 were leg/feet injuries; 2 were shoulder/arm injuries; 2 neck injury; 1 eye injury; and 1 for other reasons.
With regard to addressing work related injuries, one example is staff supervising frontline activities carry out at least one documented inspection on an activity of work each week to ensure safe working practices are understood and being followed.
LCP 9a Carbon dioxide (CO2) emissions reduction from local authority building stock
14
Value Target Status Long Trend2012/13 New for 2013/15
Supporting CommentaryThe 20% reduction (239 tonnes) in CO2 emissions for our LA building stock shows us significantly overachieving against our target. However, it must be noted that this is largely due to the rationalisation of our building stock (i.e. transfer of community buildings and toilets) that has had such a significant impact on our emissions.
LCP 9b Carbon dioxide (CO2) emissions reduction from local authority travelValue Target Status Long Trend
Supporting CommentaryWhilst we have not achieved the target reduction in emissions from LA travel during 2014/15, emissions have been reduced by 1.5% (648 tonnes). The difficulty we are facing is that the more streamlined the fleet becomes the more difficult it is to make any significant progress towards achieving the 4% target. The fleet contract(s) are up for renewal during the next financial year.
15
PI Report 2015/16: APRIL-JUNE 2015 APPENDIX 3
Key:Status: Performance Against Target / Expected Outcome
This PI is significantly below target.
This PI is slightly below target.
This PI is on target.
Performance for this PI cannot be measured.
Information only PI.
Long Trend: Are we consistently improving?The value of this PI has improved when compared to an average of previous reporting periodsThe value of this PI has not changed when compared to an average of previous reporting periodsThe value of this PI has worsened when compared to an average of previous reporting periods
No comparable performance data is available.
CommunicationsPerformance Data Traffic Light: Red 3 Green 3
CT 1 Number of tweets/Facebook updatesValue Target Status Long Trend
2013/14 2646 1500
2014/15 1704 1500
2015/16 485 375
Expected Outcome
What is Good Performance? Lead Officer
Aim to Maximise
Principal Communications Officers - Sarah Lee/Alice Barnett
Supporting CommentaryFacebook likes went up by 126 – from 2770 to 2896 and Twitter followers went up by 336 – from 6471 to 6807.In this quarter we used social media to update people on bin collection days, elections information, launch of Vicky Witch trail, garden waste scheme and love to ride events. We hope to achieve the target for this for the year but our Media and Communications Officer who contributed to a lot of this work has now left and so performance may dip. We will keep an eye on this and reassess next quarter.
CT 2 Number of news releases, written statements and letters issuedValue Target Status Long Trend
2013/14 323 192
2014/15 243 192
2015/16 35 48
Expected Outcome
What is Good Performance? Lead Officer
Aim to Maximise
Principal Communications Officers - Sarah Lee / Alice Barnett
Supporting Commentary
16
News releases: 31. These included making sure residents register to vote, free dog micro chipping, Tour of Britain, Colne Grand Prix and transfer of toilets to Barrowford Parish Council.Statements: 4. These responded to enquiries about rats in Barnoldswick, allegations of postal fraud, why Pendle is an enterprising area and West Craven Area Committee’s budget.Letters: 0. Reduced resources have resulted in less news releases being issued. The annual target will be reviewed during the PI Review which is currently underway.
CT 3a Number of news releases issued supporting partnership themesValue Target Status Long Trend
2013/14 27 16
2014/15 27 26
2015/16 5 7
Expected Outcome
What is Good Performance? Lead Officer
Aim to Maximise
Principal Communications Officers - Sarah Lee / Alice Barnett
Supporting CommentaryReleases include promoting closer joint working with Lancashire County Council, transfer of public toilets to Barrowford Parish Council, Bradley Big Local and work to manage scrap metal dealers. This PI is measured via activity by external organisations and as such is 'demand-led'. Therefore, the annual target will be reviewed during the PI Review which is currently underway.
CT 4a Number of referrals to Pendle Council's website from Facebook or TwitterValue Target Status Long Trend
2013/14 8,151 6,000
2014/15 14,807 8,000
2015/16 9,538 2,000
Expected Outcome
What is Good Performance? Lead Officer
Aim to Maximise
Principal Communications Officers - Sarah Lee / Alice Barnett
Supporting CommentaryFacebook: 8,335 Twitter: 1,203. Due to overachievement of the annual target in quarter 1 this will be reviewed during the PI Review which is currently underway.
CT 6 Number of media opportunities organisedValue Target Status Long Trend
2013/14 68 60
2014/15 42 40
2015/16 10 10
Expected Outcome
What is Good Performance? Lead Officer
Aim to Maximise
Principal Communications Officers - Sarah Lee / Alice Barnett
Supporting CommentaryMedia opportunities this quarter included bowling returning to Alkincoates Park, launch of the Tour of Britain and announcement of Tour of Britain headline sponsor and Artists in Residence at The Shop.
CT 7 Number of graphic design commissions carried outValue Target Status Long Trend
2013/14 165 130
2014/15 194 130
2015/16 30 33
Expected Outcome
What is Good Performance? Lead Officer
Aim to Maximise
Principal Communications Officers - Sarah Lee / Alice Barnett
Supporting CommentaryGraphic design commissions include Walking Festival booklet, Tour of Britain sponsorship brochure, Vicky Witch
17
Activity boards and Cycle Festival leaflet.
Democratic & Legal ServicesPerformance Data Traffic Light: Red 1 Green 1 Data Only 1
DL 2 Standard land charge searches completed in less than 5 daysValue Target Status Long Trend
2013/14 85.1% 99.8%
2014/15 90.52% 95%
2015/16 79.06% 95%
Expected Outcome
What is Good Performance? Lead Officer
Aim to Maximise
Gail Wilcock - Local Land Charges / Insurance Supervisor
Supporting CommentaryThe figure for the % of standard searches replied to within 5 days in the first quarter is low and clearly gives cause for some concern. The level of staff at the County Council who deal with search replies is now causing significant issues. I am therefore now arranging a meeting with the relevant managers at the County Council to resolve these issues.The total number of standard searches in the first quarter of 2015-16 was 191. Replies to 151 of these (79%) were sent out in 5 working days. Replies to 184 of the searches were sent out in 10 working days.
DL 3 Average chargeable hours per FTE fee earner in the Legal Section per yearValue Target Status Long Trend
2013/14 816.4hrs 550.0hrs
2014/15 1266.8hrs 750.0hrs
2015/16 324.3hrs 187.5hrs
Expected Outcome
What is Good Performance? Lead Officer
Aim to Maximise
Richard Townson - Democratic & Legal Services Manager
Supporting CommentaryThe total number of hours worked by staff in the Legal Section for the first quarter as recorded on the Civica case management system was 2270.12. As there are 7 FTE posts in the Legal Section, the average number of chargeable hours worked by each FTE was 324.3.
DL 6 Number of Freedom of Information (FoI) Requests receivedValue Target Status Long Trend
2013/14 547 N/A
2014/15 594 N/A
2015/16 123 N/A
Expected Outcome
What is Good Performance? Lead Officer
N/A Aim to MinimiseSarah Waterworth - Committee Administrator
Supporting CommentaryThe number of FOI requests received for the first quarter of 2015-16 was 123. There are no apparent trends emerging when looking at the requests for information we receive. Some of the information is publicly available already but the requester may not have tried to source the information first. A lot of requests come in regarding business rates which can't be published and generally the date ranges change from one request to another.
DirectoratePerformance Data Traffic Light: Red 1
DIR 1 Percentage of complaints handled within timescales
18
Value Target Status Long Trend
2013/14 92.8% 100.0%
2014/15 86.9% 100.0%
2015/16 78.5% 100.0%
Expected Outcome
What is Good Performance? Lead Officer
Aim to Maximise
Philip Mousdale (Ext: 1634) re Policy; Tracy Turner (Ext: 1603) re Data Collection
Supporting CommentaryIn Quarter 1 2015/16 a total of 228 complaints were received. However of these 14 were still in progress at the end of the quarter and have been excluded from the Q1 reported data. Of the 214 complaints actually resolved a total of 168 (78.5%) were resolved within the target of 15 days. The 214 complaints resolved were dealt with at Stage 1 (210) and Stage 2 (4). The volume of complaints received this period is much lower than reported in the previous quarter (300) but higher than reported in the equivalent period in 2014/15 when only 161 complaints were recorded.
The below target performance is attributable primarily to performance within Environmental Services which accounts for 45 of the 46 complaints that were resolved in excess of the 15 day target. The service accepts that there have been a large number of complaints that have exceeded the 15 day period. However, it was noted when compiling the information that the majority of these were occurring in the early part of the quarter. These reduced later reflecting on the work undertaken to improve the services response times as specified in the Quarter 4 2014/15 performance report.
In terms of quantity of complaints for the service they are found to link to the major frontline activities such as refuse collection and recycling collections. These are understandably going to be the highest areas of complaints as they carry out 64,000 collections each week. Work will be undertaken to identify trends within these complaints to see if they can isolate a scheme, service or individual team and take appropriate action to resolve any issues identified.
A fundamental review of complaints is being undertaken across the Council which will include refresher training in the staff handling of complaints.
Across all services a total of 32 compliments were received in the quarter.
Environmental ServicesPerformance Data Traffic Light: Red 5 Green 9 Data Only 2 Unknown 4
PRS 1a Percentage of minor defects repaired within 48 hours of play area safety inspection
Value Target Status Long Trend
2013/14 90.16% 90.00%
2014/15 88.10% 90.00%
2015/16 100.00% 90.00%
Expected Outcome
What is Good Performance? Lead Officer
Aim to Maximise
Senior Officer (Technical & Community Engagement) & Playground Inspector - Keith Higson
Supporting CommentaryIn quarter 1 we identified and repaired 5 minor defects within 48 hours, work was carried out at the following locations, King George’s fifth park Colne, Alma Avenue Foulridge, Ballgrove Colne and Birley playing fields Earby.
PRS 1b Percentage of urgent defects repaired within 24 hours of play area safety inspection
Value Target Status Long Trend
2013/14 80.00% 80.00%
2014/15 77.61% 82.00%
2015/16 100.00% 82.00%
Expected Outcome
What is Good Performance? Lead Officer
Aim to Maximise
Senior Officer (Technical & Community Engagement) & Playground Inspector - Keith Higson
Supporting Commentary
19
In quarter 1 we identified and repaired 14 urgent defects within 24 hours of inspection. Urgent repairs were undertaken at Lanehouse Lane, Victoria Park, Ballgrove, Harrison Street, Birley playing fields, Lomeshaye Road, Sackville Street Brierfield, King George the fifth park and Barrowford park.
PRS 10a Percentage of total play facility defects caused by vandalism at play facilities replaced or newly developed since April 2006
Value Target Status Long Trend
2013/14 21.82% N/A
2014/15 42.86% N/A
2015/16 68.75% N/A
Expected Outcome
What is Good Performance? Lead Officer
N/A Aim to Minimise
Senior Officer (Technical & Community Engagement) & Playground Inspector - Keith Higson
Supporting CommentaryOf the 16 defects identified during April - June 2015, 11 were caused by vandalism.
PRS 10b Percentage of total play facility defects caused by wear and tear at play facilities replaced or newly developed since April 2006
Value Target Status Long Trend
2013/14 78.18% N/A
2014/15 57.14% N/A
2015/16 31.25% N/A
Expected Outcome
What is Good Performance? Lead Officer
N/A Aim to Minimise
Senior Officer (Technical & Community Engagement) & Playground Inspector - Keith Higson
Supporting CommentaryOf the 16 defects identified during April - June 2015, 5 were as a result of wear and tear.
PRS 17 Percentage of sports fixtures cancelled due to service failureValue Target Status Long Trend
2013/14 0.58% 0.00%
2014/15 0.29% 0.00%
2015/16 0.00% 0.00%
Expected Outcome
What is Good Performance? Lead Officer
Aim to MinimisePrincipal Development Officer, Parks & Recreation - Kieron Roberts
Supporting CommentaryOut of 230 scheduled sports fixtures during the 1st Quarter, 0 fixtures were cancelled as a result of service failure. Quarters 1 and 2 are generally the quietest periods in relation to the usage of our sports pitches. This is due to the fact that during the Summer months football is not played from mid-May until late August and we only have to cater for Cricket matches.
WM 1 Average time in removing fly-tips (excluding non-working days)Value Target Status Long Trend
2013/14 14.20hrs 55.00hrs
2014/15 18.30hrs 25.00hrs
2015/16 7.47hrs 25.00hrs
Expected Outcome
What is Good Performance? Lead Officer
Aim to Minimise David Walker - Waste Services Manager
Supporting CommentaryThe average time taken to remove flytips within the full quarter was 7.5 hours. The reported figure is below the target of 25 hours set for 2015/16 and continues to reflect positively on the actions undertaken by staff to investigate and remove flytipping from the public highway as quickly as possible.
20
In quarter 1 we are reporting an increase in the number of cases dealt with during the monitoring period. The increase in the number of cases may be a by-product of Lancashire County Council’s decision to introduce a permit and pay as you throw scheme for construction and demolition (inert) waste at its Household Waste Recycling Centres.When cross referenced against quarter 4 of 2014/15 we find that we dealt with 230 more cases in Quarter 1 of 2015/16. The numbers being for quarter 4 last year 490, whilst in quarter 1 of this year we report 720. Positively the figure remains lower than reported in Quarter 1 of 2014/15 during which we recorded 934 cases of flytipping being dealt with.
WM 2 Reported number of missed collections not dealt with within 1 working dayValue Target Status Long Trend
2013/14 148 105
2014/15 128 105
2015/16 23 27
Expected Outcome
What is Good Performance? Lead Officer
Aim to Minimise David Walker - Waste Services Manager
Supporting CommentaryThe number of missed collections not dealt with within one working day for quarter 1 is 23; the figure shows an improvement over the previous quarter in which we reported a figure of 37. Additionally when directly compared against quarter 1 in 2014/15 we again are able to report an improving figure. Quarter 1, 2014/15 being 27, quarter 1, 2015/16 being 23.
WM 4a s215 - number of examples of proactive work being undertaken to prevent formal actionValue Target Status Long Trend
2013/14 New for 2014/15
2014/15 971 1100
2015/16 279 275
Expected Outcome
What is Good Performance? Lead Officer
Aim to Maximise
David Walker, Waste Services Manager
Supporting CommentarySection 215 of the Town and Country Planning Act 1990 allows a local authority to serve notice on the owners and occupiers of land requiring the site to be tidied up if the condition is in such a state as to adversely affect the amenity of the neighbourhood.In quarter 1 Officers wrote to 260 owners or occupiers of land which resulted in 84 formal actions being commenced broken down to 77 notices being issued and 7 works in default being carried out.
WM 5a s215 - number of formal actions takenValue Target Status Long Trend
2013/14 New for 2014/15
2014/15 324 808
2015/16 75 75
Expected Outcome
What is Good Performance? Lead Officer
Aim to Minimise David Walker, Waste Services Manager
Supporting CommentarySection 215 of the Town and Country Planning Act 1990 allows a local authority to serve notice on the owners and occupiers of land requiring the site to be tidied up if the condition is in such a state as to adversely affect the amenity of the neighbourhood.In quarter 1 Officers wrote to 260 owners or occupiers of land which resulted in 84 formal actions being commenced broken down to 77 notices being issued and 7 works in default being carried out.
WM 6a s46 - number of examples of proactive work being undertaken to prevent formal actionExpected Outcome
What is Good Performance? Lead Officer
21
Value Target Status Long Trend2013/14 New for 2014/15
2014/15 651 1000
2015/16 115 250
Aim to Maximise
David Walker, Waste Services Manager
Supporting CommentarySection 46 of the Environmental Protection Act 1990 allows a waste collection authority to specify how waste is to be presented for collection. I.E request an occupier to place waste in receptacles of a kind and number specified. Second 46 Notices are also used to enforce the separation of waste types for recycling and the removal of receptacles from the public highway following there emptying. In June the government decriminalised offences under Section 46 and placed further burdens upon authorities to prove nuisance and detrimental effect to the amenities of the area. In view of the amendments to Section 46 and our uncertainty on how the amendments affected the Authority work in this area was temporarily put on hold whilst we sought external advice.Within quarter 1 Officers wrote to 115 occupiers and following re-inspection have issued 12 Notices resulting in the need for 1 Fixed Penalty Notice to be issued against a resident of the Borough.
WM 6b s46 - number of formal actions takenValue Target Status Long Trend
2013/14 New for 2014/15
2014/15 47 60
2015/16 13 13
Expected Outcome
What is Good Performance? Lead Officer
Aim to Minimise David Walker, Waste Services Manager
Supporting CommentarySection 46 of the Environmental Protection Act 1990 allows a waste collection authority to specify how waste is to be presented for collection. I.E request an occupier to place waste in receptacles of a kind and number specified. Second 46 Notices are also used to enforce the separation of waste types for recycling and the removal of receptacles from the public highway following there emptying. In June the government decriminalised offences under Section 46 and placed further burdens upon authorities to prove nuisance and detrimental effect to the amenities of the area. In view of the amendments to Section 46 and our uncertainty on how the amendments affected the Authority work in this area was temporarily put on hold whilst we sought external advice.Within quarter 1 Officers wrote to 115 occupiers and following re-inspection have issued 12 Notices resulting in the need for 1 Fixed Penalty Notice to be issued against a resident of the Borough.
WM 7 Number of s79 notices issuedValue Target Status Long Trend
2013/14 17 26
2014/15 27 20
2015/16 3 5
Expected Outcome
What is Good Performance? Lead Officer
Aim to Minimise David Walker, Waste Services Manager
Supporting CommentarySection 79 of the Public Health Act 1936 allows a local Authority to serve notice where the owner or occupier of land or property has allowed noxious waste to accumulate. Noxious waste for the purposed of this Act is described as being food waste or dog fouling. The Notice gives the owner 24 hours to remove the waste. On failing to react to the notice the Local Authority can remove the waste and recover the costs of any actions taken.Within quarter 1 there were 3 Section 79 Notices issued. Following intervention from the property owners or occupier no works in default were carried out.
WM 8c Percentage of the total tonnage of household waste which has been recycled - Rolling Year %Expected Outcome
What is Good Performance? Lead Officer
22
Value Target Status Long Trend
2013/14 23.67% 25.50%
2014/15 23.08% 25.50%
2015/16 23.59% 25.50%
Aim to Maximise
David Walker - Waste Services Manager
Supporting CommentaryThese figures include estimated tonnages for disposal and recycling for June 2015 as Lancashire County Council (LCC) cannot provide final figures yet and data for quarter 4 of 2014/15 has not yet been confirmed by WasteDataFlow.
The estimated performance of 23.59% is slightly below the annual target of 25.5%. The target was set at a high level in order to try and reflect the challenging targets in the Lancashire Waste Strategy. Performance is very similar to previous quarters and there are no significant changes to report.
WM 8d Percentage of the total tonnage of household waste which have been sent for composting or for treatment by anaerobic digestion - Rolling Year %
Value Target Status Long Trend
2013/14 12.66% 14.50%
2014/15 9.95% 14.50%
2015/16 8.06% 14.50%
Expected Outcome
What is Good Performance? Lead Officer
Aim to Maximise
David Walker - Waste Services Manager
Supporting CommentaryThese figures include estimated tonnages for disposal and recycling for June 2015 as Lancashire County Council (LCC) cannot provide final figures yet and data for quarter 4 of 2014/15 has not yet been confirmed by WasteDataFlow.
The estimated performance of 8.06% is below the annual target of 14.5%. The target was set at a high level in order to try and reflect the challenging targets in the Lancashire Waste Strategy. We introduced charges for garden waste collection on 30th June 2014 and we have seen an expected decrease in the amount of garden waste collected for composting by approximately 42% in the 12 months from July 2014 – June 2015 compared to the previous 12 months, a drop of 1836t. The 8% is likely to be the composting rate that we achieve going forward, but we have gained over £160,000 net income per year from approximately 7,600 households subscribing to the new payment scheme.
WM 10a Percentage of household waste sent for reuse, recycling and composting - Rolling Year %Value Target Status Long Trend
2013/14 36.72% 40.00%
2014/15 33.39% 40.00%
2015/16 32.10% 40.00%
Expected Outcome
What is Good Performance? Lead Officer
Aim to Maximise
David Walker - Waste Services Manager
Supporting CommentaryThese figures include estimated tonnages for disposal and recycling for June 2015 as Lancashire County Council (LCC) cannot provide final figures yet and data for quarter 4 of 2014/15 has not yet been confirmed by WasteDataFlow.The estimated performance of 32.10% is below the annual target of 40%. The target was set at a high level in order to try and reflect the challenging targets in the Lancashire Waste Strategy. Please see comments for WM 8c and WM 8d as WM 8d is the main reason why this indicator is also underperforming
WM 11a Improved street and environmental cleanliness: LitterExpected Outcome
What is Good Performance? Lead Officer
23
Value Target Status Long Trend
2013/14 2% 7%
2014/15 1% 7%
2015/16 N/A 7%
Aim to Minimise David Walker - Waste Services Manager
Supporting CommentaryThe first surveys are currently being undertaken in the wards. The results shall be confirmed at the end of August and reported in Quarter 2.
WM 11b Improved street and environmental cleanliness: DetritusValue Target Status Long Trend
2013/14 5% 11%
2014/15 11% 11%
2015/16 N/A 11%
Expected Outcome
What is Good Performance? Lead Officer
Aim to Minimise David Walker - Waste Services Manager
Supporting CommentaryThe first surveys are currently being undertaken in the wards. The results shall be confirmed at the end of August and reported in Quarter 2.
WM 11c Improved street and environmental cleanliness: GraffitiValue Target Status Long Trend
2013/14 0% 1%
2014/15 0% 1%
2015/16 N/A 1%
Expected Outcome
What is Good Performance? Lead Officer
Aim to Minimise David Walker - Waste Services Manager
Supporting CommentaryThe first surveys are currently being undertaken in the wards. The results shall be confirmed at the end of August and reported in Quarter 2.
WM 11d Improved street and environmental cleanliness: Dog foulingValue Target Status Long Trend
2013/14 0% 1%
2014/15 0% 1%
2015/16 N/A 1%
Expected Outcome
What is Good Performance? Lead Officer
Aim to Minimise David Walker - Waste Services Manager
Supporting CommentaryThe first surveys are currently being undertaken in the wards. The results shall be confirmed at the end of August and reported in Quarter 2.
WM 12a Unpaid hours of work Pendle benefits from by taking part in the Community Payback Scheme
Value Target Status Long Trend
2013/14 991 hrs 1500 hrs
2014/15 491 hrs 1000 hrs
Expected Outcome
What is Good Performance? Lead Officer
Aim to Maximise
David Walker - Waste Services Manager
24
2015/16 0 hrs 125 hrsSupporting CommentaryThis performance indicator has been included following the authorities agreement with Lancashire Probation Trust in 2012 to provide suitable work placements to offenders living within the Borough of Pendle. During November 2014 we were advised that Sodexo Justice Services with NACRO had been chosen as the preferred bidders for the Cumbria and Lancashire Community Rehabilitation company.
In November 2014 Officers met with the practice manager for community payback for Cumbria and Lancashire. During the meeting officers were further advised that on being awarded the contract a period of mobilisation would take place throughout April 2015. The mobilisation period was likely to continue until June and following its completion it was possible that a re-structure would take place.
It is felt that the re-organisation resulted in a lack of attention being placed on the agreement with Pendle which has since been raised with them in the aim of securing community payback workers in the future.
Financial ServicesPerformance Data Traffic Light: Red 3 Green 4 Unknown 1
AC 1 Average rate of investment return on surplus funds managed internallyValue Target Status Long Trend
2013/14 0.87% 0.75%
2014/15 0.60% 0.75%
2015/16 0.54% 0.60%
Expected Outcome
What is Good Performance? Lead Officer
Aim to Maximise
Vince Green - Accountancy Manager
Supporting CommentaryInvestment returns continue to be below target as a result of market conditions and the low interest rate environment. The base rate has remained at 0.5% since March 2009. Whilst the % rate achieved is less than target the absolute cash value achieved in the quarter is above target owing to higher than forecast cash balances. Therefore current indications are that the budget for investment income will be achieved despite the low returns on offer.
AC 2 Percentage of undisputed invoices paid within 30 daysValue Target Status Long Trend
2013/14 98.62% 99.5%
2014/15 99.02% 99.5%
2015/16 98.92% 99.2%
Expected Outcome
What is Good Performance? Lead Officer
Aim to Maximise
Vince Green - Accountancy Manager
Supporting CommentaryOverall performance in the first quarter has been very good at 98.92%. Whilst performance is down slightly if compared to Quarter 1 2014/15 (99.36%), we received over 200 more invoices for payment this year. For the quarter overall a total of 1,938 invoices were received of which 1,917 were paid within the target period of 30 days.
92.6% of all invoices were actually paid within 10 days, with the average number of days for paying these invoices being 8.
AP 1a Productive audit days achieved as a % of all audit daysValue Target Status Long Trend
2013/14 72.58% 62.00%
Expected Outcome
What is Good Performance? Lead Officer
Aim to Audit & Performance
25
2014/15 71.78% 70.00%Maximise Manager - Kevin
Stansfield
Supporting CommentaryPerformance has been maintained above target for the first quarter
AP 1b Non-productive audit days achieved as a % of all audit daysValue Target Status Long Trend
2013/14 27.42% 38.00%
2014/15 28.22% 30.00%
2015/16 29.13% 30.00%
Expected Outcome
What is Good Performance? Lead Officer
Aim to MinimiseAudit & Performance Manager - Kevin Stansfield
Supporting CommentaryPerformance has been maintained below target for first quarter
AP 2 Satisfaction of audit service providedValue Target Status Long Trend
2013/14 92.17% 92.00%
2014/15 90.23% 92.00%
2015/16 100.00% 90.00%
Expected Outcome
What is Good Performance? Lead Officer
Aim to Maximise
Audit & Performance Manager - Kevin Stansfield
Supporting CommentaryOnly one Audit Report has been returned so far this year, so the result is inflated.
AP 4 Percentage of Council Taxpayers paying by Direct DebitValue Target Status Long Trend
2013/14 New for 2014/15
2014/15 62.81% 63.00%
2015/16 59.39% 63.00%
Expected Outcome
What is Good Performance? Lead Officer
Aim to Maximise
Audit & Performance Manager - Kevin Stansfield
Supporting CommentaryDD payers continue to increase on Council Tax at 0.68% (or 477) higher than this time last year.
AP 5 Percentage of NNDR Ratepayers paying by Direct DebitValue Target Status Long Trend
2013/14 New for 2014/15
2014/15 58.02% 53.00%
2015/16 54.82% 58.00%
Expected Outcome
What is Good Performance? Lead Officer
Aim to Maximise
Audit & Performance Manager - Kevin Stansfield
Supporting CommentaryRate of NNDR direct debit payers remains static when compared to this time last year.
TS 14 Percentage of Council Tax Arrears Collected
26
Value Target Status Long Trend2013/14 New for 2014/15
2014/15 22.522% 25.000%
2015/16 N/A 23.000%
Expected Outcome
What is Good Performance? Lead Officer
N/A Aim to Maximise
Audit & Performance Manager - Kevin Stansfield
Supporting CommentaryThe methodology around data collection is being reconsidered as on further scrutiny the figures reported for 2014/15 do not provide an accurate and meaningful reflection of the true amount of Council Tax arrears collected in the period. Due to the work involved it may be another month or two before data can be provided.
Housing, Health & Economic RegenerationPerformance Data Traffic Light: Red 3 Amber 3 Green 18 Data Only 16 Unknown 1
BDS 1 Number of Pendle businesses engaged regarding employment issuesValue Target Status Long Trend
2013/14 175 100
2014/15 350 150
2015/16 28 25
Expected Outcome
What is Good Performance? Lead Officer
Aim to Maximise
Hanna Latty - Business Development Officer
Supporting CommentaryWe have engaged with 28 businesses in this quarter.
BDS 2a Number of new business start-ups supported via the Council's Start-Up ProgrammeValue Target Status Long Trend
2013/14 41 25
2014/15 26 30
2015/16 8 6
Expected Outcome
What is Good Performance? Lead Officer
Aim to Maximise
Hanna Latty - Business Development Officer
Supporting CommentaryEight start-up grants have been paid this quarter to the value of £12,058. Due to the election there has been only one Grants Panel, which took place on email, and included one start-up application which was approved. The next Grants Panel meeting is planned for 15 July 2015.
EH 1 Percentage of Environmental Health Service Requests responded to on targetValue Target Status Long Trend
2013/14 96.4% 98.0%
2014/15 96.9% 98.0%
2015/16 98.8% 97.0%
Expected Outcome
What is Good Performance? Lead Officer
Aim to Maximise
Richard Walsh - Public Health Manager (Pollution)Ext 2004
Supporting CommentaryIn Q1...
The Food, Health & Safety Team dealt with 287 of 288 service requests within target.The Pest Control Team dealt with 512 of 513 requests for service within target.The Environmental Protection team dealt with 323 of 335 within target.
The overall figure for the service was 98.8% of service requests were responded to within the target response
27
time, against a target rate of 97%.
EH 7a Percentage of programmed pollution inspections completedValue Target Status Long Trend
2013/14 100.0% 100.0%
2014/15 95.7% 100.0%
2015/16 100.0% 100.0%
Expected Outcome
What is Good Performance? Lead Officer
Aim to Maximise
Public Health Manager - Neighbourhoods & Pollution Control (Richard Walsh)
Supporting Commentary3 permitted processes were scheduled for inspection in Q1 and all 3 have been completed. This includes the outstanding inspection from the previous quarter.
EH 8 Number of Smoke Free Fixed Penalty Notices issuedValue Target Status Long Trend
2013/14 6 5
2014/15 6 5
2015/16 4 1
Expected Outcome
What is Good Performance? Lead Officer
Aim to Maximise
Public Health Manager - Neighbourhoods & Pollution Control (Richard Walsh)
Supporting Commentary4 Fixed Penalty Notices have been served in Q1. 1 is now being progressed to a prosecution for non-payment.
EH 9 Number of contaminated sites that have been remediated to a 'Suitable for Use' standardValue Target Status Long Trend
2013/14 8 6
2014/15 2 6
2015/16 1 1
Expected Outcome
What is Good Performance? Lead Officer
Aim to Maximise
Public Health Manager - Neighbourhoods & Pollution Control (Richard Walsh)
Supporting CommentaryIn Q1...
We have received 3 phase I reports, all of which have been signed off as satisfactory. We are still awaiting further information for the outstanding report from Q4 last year.We have received just 1 phase II report, which has been signed off.We have received one phase III report which has been signed off as satisfactory.
As such, one brownfield site has been returned to a suitable for use standard in Q1.
EH 9a Contaminated Land: Number of desk top (Phase 1) studies receivedValue Target Status Long Trend
2013/14 8 N/A
2014/15 10 N/A
2015/16 3 N/A
Expected Outcome
What is Good Performance? Lead Officer
N/A Aim to Maximise
Public Health Manager - Neighbourhoods & Pollution Control (Richard Walsh)
EH 9b Contaminated Land: Number of desk top (Phase 1) studies approvedExpected Outcome
What is Good Performance? Lead Officer
28
Value Target Status Long Trend
2013/14 7 N/A
2014/15 8 N/A
2015/16 3 N/A
N/A Aim to Maximise
Public Health Manager - Neighbourhoods & Pollution Control (Richard Walsh)
EH 9c Contaminated Land: Number of intrusive (Phase 2) studies receivedValue Target Status Long Trend
2013/14 10 N/A
2014/15 9 N/A
2015/16 1 N/A
Expected Outcome
What is Good Performance? Lead Officer
N/A Aim to Maximise
Public Health Manager - Neighbourhoods & Pollution Control (Richard Walsh)
EH 9d Contaminated Land: Number of intrusive (Phase 2) studies approvedValue Target Status Long Trend
2013/14 6 N/A
2014/15 7 N/A
2015/16 1 N/A
Expected Outcome
What is Good Performance? Lead Officer
N/A Aim to Maximise
Public Health Manager - Neighbourhoods & Pollution Control (Richard Walsh)
EH 9e Contaminated Land: Number of validation (Phase 3) studies receivedValue Target Status Long Trend
2013/14 7 N/A
2014/15 3 N/A
2015/16 1 N/A
Expected Outcome
What is Good Performance? Lead Officer
N/A Aim to Maximise
Public Health Manager - Neighbourhoods & Pollution Control (Richard Walsh)
EH 10 Percentage of programmed Private Water Supply risk assessments completedValue Target Status Long Trend
2013/14 28.6% 100.0%
2014/15 98.7% 100.0%
2015/16 100.0%
Expected Outcome
What is Good Performance? Lead Officer
Aim to Maximise
Public Health Manager - Neighbourhoods & Pollution Control (Richard Walsh)
Supporting CommentaryNo PWS were scheduled to be risk assessed in Q1.
EH 11 Percentage of programmed Private Water Supply samples takenValue Target Status Long Trend
2013/14 68.3% 100.0%
2014/15 109.5% 100.0%
2015/16 100.0% 100.0%
Expected Outcome
What is Good Performance? Lead Officer
Aim to Maximise
Public Health Manager - Neighbourhoods & Pollution Control (Richard Walsh)
Supporting Commentary3 routine samples were programmed for Q1 and all 3 have been collected.
29
EH 12 Percentage of food premises inspected which scored 0, 1 or 2 in the Food Hygiene Rating Scheme which have been improved to a minimum rating of 3 within 3 months from the date of inspection
Value Target Status Long Trend
2013/14 100% 100%
2014/15 100% 100%
2015/16 100% 100%
Expected Outcome
What is Good Performance? Lead Officer
Aim to Maximise
Public Health Manager - Food Safety & Hygiene and Health & Safety (Stuart Arnott)
Supporting Commentary2 food premises were due to have completed improvements within Q1 and both premises achieved this.
HI 1 % of Disabled Facility Grant (DFG) enquiries ready for approval within 3 months of initial visit/scheme agreement
Value Target Status Long Trend
2013/14 88.9% 90.0%
2014/15 91.5% 90.0%
2015/16 88.9% 90.0%
Expected Outcome
What is Good Performance? Lead Officer
Aim to Maximise
Paul Lloyd - Private Sector Housing Manager
Supporting CommentaryWe achieved 89% in this quarter which is just below the target and represents 16 out of the 18 approvals. The two approvals that took longer than three months were more complicated adaptations requiring greater input from other services. I anticipate that we will meet this target.HI 1(i) Number of Disabled Facility Grants (DFGs) enquiries received that have reached approval
HI 2 % of approved Disabled Facility Grants (DFGs) completed on site within 4 monthsValue Target Status Long Trend
2013/14 88.4% 85.0%
2014/15 83.8% 88.0%
2015/16 88.2% 85.0%
Expected Outcome
What is Good Performance? Lead Officer
Aim to Maximise
Paul Lloyd - Private Sector Housing Manager
Supporting Commentary
30
We have managed to get all but two of our approved grants completed within four months. The two cases that overran were more complex and required the coordination of several specialist installers as well as a general contractor. I anticipate that we will meet this target.
HI 3 Number of people assisted with home energy adviceValue Target Status Long Trend
2013/14 154 150
2014/15 137 150
2015/16 27 25
Expected Outcome
What is Good Performance? Lead Officer
Aim to Maximise
Paul Lloyd - Private Sector Housing Manager
Supporting CommentaryThe numbers of residents asking for energy efficiency advice is always low at this time of year due to the improving weather. However, I anticipate that demand will increase as the year progresses.
HN 1 Recording cases where positive action is taken to prevent or relieve homelessness (per 1,000 households)
Value Target Status Long Trend
2013/14 5.30 6.95
2014/15 6.08 6.00
2015/16 0.92 1.58
Expected Outcome
What is Good Performance? Lead Officer
Aim to Maximise
Wayne Forrest - Housing Needs Manager
Supporting CommentaryThe out-turn for Q1 is 0.92 (34 cases of homelessness prevented). This represents a low quarterly out-turn. However, the out-turn only includes homelessness prevented by Housing Needs. Statistics were not available by the deadline for Open Door, Pennine Lancashire Mental Health and Housing Project and Pendle Domestic Violence Initiative (PDVI) which would be expected to add a number of additional cases to the out-turn.
Housing Needs preventative work included helping resolve benefits issues which ensured that clients were not evicted, liaison with housing providers to help secure accommodation and use of a bond scheme to help secure accommodation in the private rented sector.
HN 2 Proportion of homelessness decisions on which the authority makes a decision and issues written notification to the applicant within 33 working days
Value Target Status Long Trend
2013/14 100.0% 100.0%
2014/15 99.1% 100.0%
2015/16 100.0% 100.0%
Expected Outcome
What is Good Performance? Lead Officer
Aim to Maximise
Wayne Forrest - Housing Needs Manager
Supporting CommentaryThe out-turn for Q1 is 100%. Of the 31 eligible homelessness cases, 31 were completed with 33 working days. This represents an excellent start towards the overall target.
When a homelessness application is opened, Housing Needs staff undertake relevant enquiries. Each case may differ in terms of what information is required. Housing Needs staff are often awaiting responses from the client and external agencies before decisions can be taken, hence some cases can take considerable time, which is outside the control of Housing Needs. Despite this, all attempts are made to ensure a decision is taken as soon as is reasonably practical so the client knows what their options are.
HN 3 Number of nights provided in Bed and Breakfast to homeless applicants
31
Value Target Status Long Trend
2013/14 281 591
2014/15 223 350
2015/16 133 53
Expected Outcome
What is Good Performance? Lead Officer
Aim to MinimiseWayne Forrest - Housing Needs Manager
Supporting CommentaryThe out-turn for Q1 is 133 nights, which is quite a high turn-out and means that the overall target for the year of providing less than 350 nights in B&B is more likely to be missed.
There were three particular cases where it was not possible to move the client on from B&B quickly. In two of the cases, although interviews were arranged for alternative supported housing, both clients chose to ignore this opportunity and this delayed move on. In the third case, the clients presented with particularly high needs which meant that many rehousing options were not available in the short-term.
HN 4 Occupancy of the Pendle's Women's RefugeValue Target Status Long Trend
2013/14 New for 2014/15
2014/15 75.97% 75.00%
2015/16 65.20% 80.00%
Expected Outcome
What is Good Performance? Lead Officer
Aim to Maximise
Wayne Forrest - Housing Needs Manager
Supporting CommentaryThe out-turn for Q1 is 65.2%, which is a low out-turn and is a slow start towards the overall yearly target.
The Refuge receives significant numbers of referrals but sadly it is not possible to take on many clients due to their presenting needs which are often very high. Whilst all clients are victims of domestic abuse, many also present with a substance/alcohol dependency, significant mental ill-health and/or other substantial needs. Consequently, despite vacancies being available, which are advertised nationally, many referrals have not been successful. The Refuge is not risk averse but has to undertake risk assessments with all potential referrals in terms of whether it is possible to ensure the safety of the client, the safety of existing residents and the safety of staff when deciding whether to accept a referral or not.
HS 1 % of illegal eviction complaints responded to within 1 working dayValue Target Status Long Trend
2013/14 100.0% 90.0%
2014/15 93.8% 95.0%
2015/16 100.0% 95.0%
Expected Outcome
What is Good Performance? Lead Officer
Aim to Maximise
Paul Lloyd - Private Sector Housing Manager
Supporting CommentaryWe have been successful in dealing with all illegal eviction complaints within the specified time throughout the quarter.HS 1(i) Number of illegal eviction complaints received
Value Target Status Long Trend
2013/14 23 N/A
2014/15 16 N/A
2015/16 5 N/A
Expected Outcome
What is Good Performance? Lead Officer
N/A Aim to MinimisePaul Lloyd - Private Sector Housing Manager
HS 1(ii) Number of illegal eviction complaints responded to within 1 working day
32
Value Target Status Long Trend
2013/14 23 N/A
2014/15 15 N/A
2015/16 5 N/A
Expected Outcome
What is Good Performance? Lead Officer
N/A Aim to Maximise
Paul Lloyd - Private Sector Housing Manager
HS 2 % of 'no hot water' complaints responded to within 1 working dayValue Target Status Long Trend
2013/14 92.3% 95.0%
2014/15 96.6% 95.0%
2015/16 100.0% 95.0%
Expected Outcome
What is Good Performance? Lead Officer
Aim to Maximise
Paul Lloyd - Private Sector Housing Manager
Supporting CommentaryDue to the changes in working practices and all the technical staff being trained to respond to this type of complaint, we have been able to respond to this relatively high number of complaints within the specified timescale.HS 2(i) Number of 'no hot water' complaints received
Value Target Status Long Trend
2013/14 39 N/A
2014/15 29 N/A
2015/16 8 N/A
Expected Outcome
What is Good Performance? Lead Officer
N/A Aim to MinimisePaul Lloyd - Private Sector Housing Manager
HS 2(ii) Number of 'no hot water' complaints responded to within 1 working dayValue Target Status Long Trend
2013/14 36 N/A
2014/15 28 N/A
2015/16 8 N/A
Expected Outcome
What is Good Performance? Lead Officer
N/A Aim to Maximise
Paul Lloyd - Private Sector Housing Manager
HS 3 % of disrepair complaints responded to within 10 working daysValue Target Status Long Trend
2013/14 70.0% 65.0%
2014/15 24.7% 70.0%
2015/16 100.0% 65.0%
Expected Outcome
What is Good Performance? Lead Officer
Aim to Maximise
Paul Lloyd - Private Sector Housing Manager
Supporting CommentaryOver this quarter we have cleared the backlog of complaints and responded to the relatively low number of complaints within the required time. The exceptionally dry weather has probably had an effect on the numbers of complaints which I anticipate will rise towards the end of the year. However, I anticipate that we will meet the target set.HS 3(i) Number of disrepair complaints received
33
Value Target Status Long Trend
2013/14 150 N/A
2014/15 77 N/A
2015/16 19 N/A
Expected Outcome
What is Good Performance? Lead Officer
N/A Aim to MinimisePaul Lloyd - Private Sector Housing Manager
HS 3(ii) Number of disrepair complaints responded to within 10 working daysValue Target Status Long Trend
2013/14 105 N/A
2014/15 19 N/A
2015/16 19 N/A
Expected Outcome
What is Good Performance? Lead Officer
N/A Aim to Maximise
Paul Lloyd - Private Sector Housing Manager
HS 4 % of empty property complaints responded to within 10 working daysValue Target Status Long Trend
2013/14 66.7% 90.0%
2014/15 78.9% 75.0%
2015/16 100.0% 75.0%
Expected Outcome
What is Good Performance? Lead Officer
Aim to Maximise
Paul Lloyd - Private Sector Housing Manager
Supporting CommentaryOur more proactive approach to empty properties has resulted in the numbers of complaints falling significantly. It has also meant that when we receive a complaint we are able to respond to it quickly. I anticipate that we will meet the target set.HS 4(i) Number of empty property complaints received
Value Target Status Long Trend
2013/14 15 N/A
2014/15 19 N/A
2015/16 3 N/A
Expected Outcome
What is Good Performance? Lead Officer
N/A Aim to MinimisePaul Lloyd - Private Sector Housing Manager
HS 4(ii) Number of empty property complaints responded to within 10 working daysValue Target Status Long Trend
2013/14 10 N/A
2014/15 15 N/A
2015/16 3 N/A
Expected Outcome
What is Good Performance? Lead Officer
N/A Aim to Maximise
Paul Lloyd - Private Sector Housing Manager
HS 5 Number of private sector dwellings that are returned into occupationValue Target Status Long Trend
2013/14 85 85
2014/15 793 510
Expected Outcome
What is Good Performance? Lead Officer
Aim to Maximise
Paul Lloyd - Private Sector Housing Manager
34
2015/16 282 75Supporting CommentaryOnce again the change in procedure for identifying and engaging with owners has resulted in the numbers of empty properties being returned to occupation being high. I do not anticipate a problem in us achieving the target over the rest of the year.
HS 6 Number of private sector dwellings where Category 1 hazards are removedValue Target Status Long Trend
2013/14 101 100
2014/15 102 100
2015/16 24 25
Expected Outcome
What is Good Performance? Lead Officer
Aim to Maximise
Paul Lloyd - Private Sector Housing Manager
Supporting CommentaryThe increased activity in dealing with disrepair complaints has led to an increase in the numbers of properties where category one hazards are being removed. Most of the hazards are being removed through informal action. I anticipate that we will meet the target set.
TC 1 Number of Town Centre businesses paid a Premises Improvement GrantValue Target Status Long Trend
2013/14 18 15
2014/15 20 15
2015/16 3 3
Expected Outcome
What is Good Performance? Lead Officer
Aim to Maximise
Johanna Latty - Town Centres Officer
Supporting CommentaryThree businesses have received funding so far, all of which are based in Colne. The Colne and District Committee allocated funding for two years in 2014, and so this allowed the scheme to continue, whereas other towns had to wait for a funding decision.
A further 12 businesses have been allocated funding, but as of yet have not completed the works.
As funding in certain areas was only confirmed in June, it has no yet been possible to market/advertise the programme. It is anticipated that the number of allocated grants will increase.
TC 2 Number of vacant business properties in town centres brought back into useValue Target Status Long Trend
2013/14 New for 2014/15
2014/15 9 5
2015/16 2 2
Expected Outcome
What is Good Performance? Lead Officer
Aim to Maximise
Johanna Latty - Town Centres Officer
Supporting CommentaryOf the three businesses to receive funding in quarter 1, two have brought vacant buildings back into use. In addition to these two businesses, a further five of the 12 allocated grants are bringing properties back into use.
TR 1 Number of tourism events supported
35
Value Target Status Long Trend
2013/14 5 2
2014/15 2 2
2015/16 0 0
Expected Outcome
What is Good Performance? Lead Officer
Aim to Maximise
Mike Williams - Tourism Officer
Supporting CommentaryThe three events which will be supported are all in quarter 2 (Colne Grand Prix, Pendle Walking Festival and Pendle Cycling Festival).
Neighbourhood ServicesPerformance Data Traffic Light: Red 3 Amber 2 Green 10
BDS 5 Number of beneficiaries who have received trainingValue Target Status Long Trend
2013/14 14 10
2014/15 10 6
2015/16 7 2
Expected Outcome
What is Good Performance? Lead Officer
Aim to Maximise
Philip Mousdale - Deputy Chief Executive
Supporting CommentaryNew starters this quarter have been registered for Level 2 Practical Environmental Skills. There will be no external moderation until later in the year. External moderation is done on an annual basis, but the current beneficiaries have not yet completed any units. Two of the new starters are from Young People's Services.
BDS 5a Amount of income generated via the EAG projectValue Target Status Long Trend
2013/14
2014/15 £40,024.15 £40,000.00
2015/16 £10,022.60 £10,000.00
Expected Outcome
What is Good Performance? Lead Officer
Aim to Maximise
Philip Mousdale - Deputy Chief Executive
Supporting CommentaryThis sum relates to the total labour charges invoiced up to the 30th June 2014
ESP 9 Percentage of Rights of Way service requests clearedValue Target Status Long Trend
2013/14 81% 75%
2014/15 89% 80%
2015/16 77% 80%
Expected Outcome
What is Good Performance? Lead Officer
Aim to Maximise
Tom Partridge - Countryside Access Officer
Supporting CommentaryWe are slightly below our target level. This reflects that a number of difficult issues were reported during the relevant period which could not be easily or quickly resolved.
ESP 18c Engineering Service Area External Fee IncomeExpected Outcome
What is Good Performance? Lead Officer
36
Value Target Status Long Trend2013/14 New for 2014/15
2014/15 £114,603 £108,990
2015/16 £20,877 £20,000
Aim to Maximise
Peter Atkinson - Engineering & Special Projects Manager
Supporting CommentaryThis quarters fees includes part payments for public realm schemes which are nearing completion in Brierfield and also includes Engineering fees for Structural Calculations.The target proposed of £100,910 was set as part of the budget setting process for 2015/16. However, staffing changes in the year may potentially affect this target level and this will form part of the PI Review, which is currently underway, and also revised budget setting in the year to keep the two aligned.
ESP 21 Percentage of cycleway network inspected and maintained in the yearValue Target Status Long Trend
2013/14 100.00% 98.00%
2014/15 100.00% 100.00%
2015/16 100.00% 100.00%
Expected Outcome
What is Good Performance? Lead Officer
Aim to Maximise
Tricia Wilson - Project Co-ordinator
Supporting CommentaryAll the routes were maintained in Q1 as per Engineers instruction to EAG, invoice received from EAG.
ESP 22a Total number of outstanding practical Countryside Access issues identifiedValue Target Status Long Trend
2013/14 53 82
2014/15 44 80
2015/16 47 80
Expected Outcome
What is Good Performance? Lead Officer
Aim to MinimiseCountryside Access Officer (Tom Partridge - ext 1059)
Supporting CommentaryWe have been successful at keeping the number of outstanding issues below our target level.
ESP 22b Total number of outstanding complex Countryside Access issues identifiedValue Target Status Long Trend
2013/14 46 82
2014/15 50 80
2015/16 66 80
Expected Outcome
What is Good Performance? Lead Officer
Aim to MinimiseCountryside Access Officer (Tom Partridge - ext 1059)
Supporting CommentaryWe have been successful at keeping the number of outstanding issues below our target level.
LCP 1 Number of targeted intervention activities completed in response to local issuesValue Target Status Long Trend
2013/14 109 104
2014/15 87 104
2015/16 24 26
Expected Outcome
What is Good Performance? Lead Officer
Aim to Maximise
Principal Localities, Communities & Policy Officer - Geoff Whitehead
37
Supporting CommentaryThe interventions are referred to the appropriate agencies and organisations and cover a wide range of issues including CCTV footage requests, ASB, and flytipping.
LCP 3 Number of 'Community Champions' identifiedValue Target Status Long Trend
2013/14 31 12
2014/15 20 13
2015/16 0 3
Expected Outcome
What is Good Performance? Lead Officer
Aim to Maximise
Principal Localities, Communities & Policy Officer - Geoff Whitehead
Supporting CommentaryThere were no Community champions identified this quarter however moving forward we will look to include community champions from other sections of Neighbourhood Services in future quarters
LCP 6 Percentage of problem profile issues resolved following community street audits (Rolling Cumulative PI)
Value Target Status Long Trend
2013/14 86.6% 33%
2014/15 85.3% 85%
2015/16 82.4% 85%
Expected Outcome
What is Good Performance? Lead Officer
Aim to Maximise
Anti-Social Behaviour Co-ordinator - Tim Horsley
Supporting CommentaryDuring Quarter 1 12 new issues were recorded and four were removed leaving 38 outstanding. Since the monitoring started 216 issues have been recorded and 178 removed; 82.4% compared with a target of 85%. The change is due to an intensive EVA in Brierfield which included a new area with a number of significant issues.
LCP 7a Percentage of high risk ASB victims removed from the high risk registerValue Target Status Long Trend
2013/14 96.00% 85.00%
2014/15 94.28% 90.00%
2015/16 95.41% 90.00%
Expected Outcome
What is Good Performance? Lead Officer
Aim to Maximise
Anti-Social Behaviour Co-ordinator - Tim Horsley
Supporting CommentaryFor this indicator we use the number of victims at risk of harm from ASB recorded since ASBRAC began. Up to the end of June 2015 there have been a total of 414 referrals on to the list and 395 have been removed from the list. The average period on the list is roughly 3.5 months.
ASBRAC meetings were held in April, May and June 2015 with actions assigned to both support and enforcement agencies and the outcomes for victims monitored by the Group. Also, Prevent and Deter meetings were held in April, may and June 2015 with actions assigned to partners and the outcomes for young people monitored by the Group
LCP 8 Number of Community Street Audits (EVAs) completedValue Target Status Long Trend
2013/14 40 40
2014/15 40 40
Expected Outcome
What is Good Performance? Lead Officer
Aim to Maximise
Anti-Social Behaviour Co-ordinator - Tim Horsley
38
2015/16 10 10Supporting CommentaryTen of the eleven scheduled CEVA's were completed during quarter 1 towards the target of 40 for the year. The Horsefield CEVA was postponed due to confusion over the involvement of Environmental Services and will be made up in Quarter 2.
Participants in the CEVA's included Neighbourhood Services and the Police at all CEVA's; Lancashire Fire and Rescue at those in wards they consider priorities; Nelson Town Council; Bradley Residents Association and one PBC Councillor. Environmental Services no longer participate in the walkabout element of the CEVA.
Actions are followed up by the Police; Waste Management and Localities Team with support from Environmental Protection; Housing Standards; United Utilities; LCC Highways and Virgin Media.
There continues to be a significant improvement on issues identified compared with six and seven years ago with some progress continuing to be achieved CEVA on CEVA. These improvements are regularly reported to Nelson, Colne and Brierfield and Reedley Area Committees.
LCP 10 Number of funding applications secured for community initiatives with Localities Team support
Value Target Status Long Trend2013/14 New for 2014/15
2014/15 17 12
2015/16 3 3
Expected Outcome
What is Good Performance? Lead Officer
Aim to Maximise
Principal Localities, Communities & Policy Officer - Geoff Whitehead
Supporting CommentaryThe successful funding applications during quarter 1 were for bids to the Pendle Community Safety Partnership in relation to Lancashire Fire and Rescue Services rural advice scheme; Fishing buddies, supporting youth activity in Pendle and the Domestic Violence Sanctuary Scheme from the Police and Crime Commissioner.
PRS 21 Volunteer time contributed (in hours) to enhancing our parks and green spaces (incs Neighbourhoods from 1/4/15)
Value Target Status Long Trend2013/14 New for 2014/15
2014/15 2159hrs Not Set N/A
2015/16 1073hrs 750hrs
Expected Outcome
What is Good Performance? Lead Officer
Aim to Maximise
Principal Development Officer, Parks & Recreation - Kieron Roberts
Supporting Commentary1073 volunteer hours were recorded April – June 2015. The target from now on will include any voluntary work carried out in our neighbourhoods to reflect the new sections within Neighbourhood Services. Again a significant amount of these hours were undertaken by the Philip Wright Crown Green Bowling Academy on the bowling green and surrounding area at Alkincoats Park in Colne.Two volunteer days were held at Ball Grove Park/LNR to create a woodland footpath and a volunteer day was held in conjunction with the Canal and Rivers Trust to tidy up the canal from Brierfield to Lomeshaye. Other activities included informal and organised litter picking/conservation days at a number of our parks.1073 volunteer hours equates to £6,773.79 (based on national minimum wage of £6.31 for people aged 21 and over).
WM 3 Number of fixed penalty notices (FPNs) issuedValue Target Status Long Trend
2013/14 97 130
2014/15 150 130
Expected Outcome
What is Good Performance? Lead Officer
Aim to Maximise
David Walker, Waste Services Manager
39
2015/16 39 44Supporting CommentaryThe annual target has been increased this year to reflect that 2 new members of staff who will be joining the team in September 2015. So although we have not achieved the quarterly target this quarter it is hoped that this will change as we go through the year, especially in quarters 3 and 4.The Council has various powers to issue Fixed Penalty Notices for offences such as littering and the failure to remove dog fouling. In quarter 1 Officers issued 39 Fixed Penalty Notices, additionally during this period Officers have carried out 16 joint town centre patrols with uniformed PCSO’s and have been involved in approximately 10 Multi Agency Environmental Visual Audits.
Planning, Building Control & LicencingPerformance Data Traffic Light: Red 3 Green 4 Data Only 10
DL 5 Number of Licences issued per FTE per yearValue Target Status Long Trend
2013/14 104.5 80.0
2014/15 80.0 100.0
2015/16 33.9 25.0
Expected Outcome
What is Good Performance? Lead Officer
Aim to Maximise
Richard Townson - Democratic & Legal Services Manager
Supporting CommentaryThe total number of licences issued by the Licensing Section from 1st April to 30th June 2015 was 61 (15 Temporary Event Notices, 5 Premises Licences, 40 Personal Alcohol Licences and 1 Small Society Lottery Licence). As there are 1.8 FTE posts in the Licensing Section, the number of licences issued per FTE was 33.9.
ESP 10a Percentage of new and renewed drivers' licences issued within two working days (new drivers 2 days from passing knowledge test)
Value Target Status Long Trend
2013/14 100.0% 99.0%
2014/15 100.0% 99.0%
2015/16 100.0% 99.0%
Expected Outcome
What is Good Performance? Lead Officer
Aim to Maximise
Jackie Allen - Taxi Licensing Manager
Supporting CommentaryOf 84 applications all were issued within 2 working days during quarter 1.
ESP 17 Percentage of new and renewed operators' licences issued within 8 working daysValue Target Status Long Trend
2013/14 100.0% 97.0%
2014/15 93.3% 98.0%
2015/16 100.0% 98.0%
Expected Outcome
What is Good Performance? Lead Officer
Aim to Maximise
Jackie Allen - Taxi Licensing Manager
Supporting CommentaryOf 9 applications all were issued within 8 working days during quarter 1.
PBC 1a Percentage of all appeals determined in accordance with officer recommendationExpected Outcome
What is Good Performance? Lead Officer
40
Value Target Status Long Trend
2013/14 70.59% 80.00%
2014/15 75.00% 80.00%
2015/16 100.00% 80.00%
Aim to Maximise
Team Leader Service Support, Planning and Building Control (Cath Brierley 1789)
Supporting CommentaryIn the first quarter there were two appeals decisions received. Both were dismissed in accordance with the officer recommendation to refuse. On target at present.PBC 1a(i) Number of all planning application appeals
Value Target Status Long Trend
2013/14 17 N/A
2014/15 12 N/A
2015/16 2 N/A
Expected Outcome
What is Good Performance? Lead Officer
N/A Aim to Maximise
Team Leader Service Support, Planning and Building Control (Cath Brierley 1789)
PBC 1a(ii) Number of planning appeals determined in line with the officer’s recommendationValue Target Status Long Trend
2013/14 12 N/A
2014/15 9 N/A
2015/16 2 N/A
Expected Outcome
What is Good Performance? Lead Officer
N/A Aim to Maximise
Team Leader Service Support, Planning and Building Control (Cath Brierley 1789)
PBC 5 Percentage of 'Major' planning applications determined within 13 weeksValue Target Status Long Trend
2013/14 87.5% 86%
2014/15 72.22% 86%
2015/16 66.67% 86%
Expected Outcome
What is Good Performance? Lead Officer
Aim to Maximise
Neil Watson - Planning and Building Control Manager
Supporting CommentaryThe total number of applications determined in the major category for 2014/15 was 18. In the first quarter of 2015/16 there have been 9 determinations of which 6 were within the statutory time limit. The 3 applications that went over the time limit were all proposed new housing developments. The outturn at 66.67% is below target but this is the first quarter.PBC 5(i) Total number of 'Major' planning applications
Value Target Status Long Trend
2013/14 16 N/A
2014/15 18 N/A
2015/16 9 N/A
Expected Outcome
What is Good Performance? Lead Officer
N/A Aim to Maximise
Neil Watson - Planning and Building Control Manager
PBC 5(ii) Number of 'Major' planning applications determined in 13 weeksValue Target Status Long Trend
2013/14 14 N/A
Expected Outcome
What is Good Performance? Lead Officer
N/A Aim to Neil Watson - Planning
41
2014/15 13 N/AMaximise and Building Control
Manager
PBC 6 Percentage of 'Minor' planning applications determined within 8 weeksValue Target Status Long Trend
2013/14 79.9% 87%
2014/15 81.25% 87%
2015/16 76% 87%
Expected Outcome
What is Good Performance? Lead Officer
Aim to Maximise
Neil Watson - Planning & Building Control Manager
Supporting CommentaryThe numbers determined in this category are similar to those for the first quarter last year. Of the 50 applications determined 38 were within the statutory time limit. 10 out of the 12 applications over the time limit were determined at Committee. The outturn at 76% is currently below target.PBC 6(i) Number of 'Minor' planning applications determined in 8 weeks
Value Target Status Long Trend
2013/14 159 N/A
2014/15 182 N/A
2015/16 38 N/A
Expected Outcome
What is Good Performance? Lead Officer
N/A Aim to Maximise
Neil Watson - Planning and Building Control Manager
PBC 6(ii) Total number of 'Minor' planning applicationsValue Target Status Long Trend
2013/14 199 N/A
2014/15 224 N/A
2015/16 50 N/A
Expected Outcome
What is Good Performance? Lead Officer
N/A Aim to Maximise
Neil Watson - Planning and Building Control Manager
PBC 7 Percentage of 'Other' planning applications determined within 8 weeksValue Target Status Long Trend
2013/14 90.88% 92%
2014/15 89.27% 92%
2015/16 83.08% 92%
Expected Outcome
What is Good Performance? Lead Officer
Aim to Maximise
Neil Watson - Planning & Building Control Manager
Supporting CommentaryThe number of applications determined in this category are the same as the first quarter for the previous year. Of the 65 applications 13 were determined at Committee and 8 of these were over the time limit whereas only 3 out of 52 applications determined by officer were over the time limit. The outturn at 83.08% is below target.PBC 7(i) Total number of 'other' planning applications
Value Target Status Long Trend
2013/14 307 N/A
2014/15 261 N/A
Expected Outcome
What is Good Performance? Lead Officer
N/A Aim to Maximise
Neil Watson - Planning and Building Control Manager
42
2015/16 65 N/A
PBC 7(ii) Number of 'other' planning applications determined in 8 weeksValue Target Status Long Trend
2013/14 279 N/A
2014/15 233 N/A
2015/16 54 N/A
Expected Outcome
What is Good Performance? Lead Officer
N/A Aim to Maximise
Neil Watson - Planning and Building Control Manager
PBC 8a Number of building regulation applications receivedValue Target Status Long Trend
2013/14 424 N/A
2014/15 388 N/A
2015/16 98 N/A
Expected Outcome
What is Good Performance? Lead Officer
N/A Aim to Maximise
Neil Watson - Planning and Building Control Manager
Supporting Commentary98 applications were received in the first quarter whereas 102 application were received in the first quarter of the previous year.
PBC 8b Number of building regulation applications completedValue Target Status Long Trend
2013/14 365 N/A
2014/15 434 N/A
2015/16 78 N/A
Expected Outcome
What is Good Performance? Lead Officer
N/A Aim to Maximise
Neil Watson - Planning and Building Control Manager
Supporting CommentaryThe number of applications completed in the first quarter of 20015/16 is 78. In the first quarter last year 89 applications were completed.
Policy & Performance TeamPerformance Data Traffic Light: Red 1 Unknown 1
AP 3 Percentage of PIs reported that were activated in Covalent before agreed deadlinesValue Target Status Long Trend
2013/14 93.3% 90%
2014/15 86.84% 92%
2015/16 86.47% 92%
Expected Outcome
What is Good Performance? Lead Officer
Aim to Maximise
Performance Management Officer - Marie Mason
Supporting CommentaryThe deadline for inputting and activating the PI data for Quarter 1 2015/16 was 12noon on Thursday 9th July 2015. A total of 170 PIs were due for an update by the deadline this quarter with 23 not being updated on time.
LCP 4a Percentage of requests from Management Team for response on consultations complied with
43
and responded to on timeValue Target Status Long Trend
2013/14 New for 2014/15
2014/15 100.00% 100.00%
2015/16 N/A 100.00%
Expected Outcome
What is Good Performance? Lead Officer
Aim to Maximise
Principal Localities, Communities & Policy Officer - Geoff Whitehead
Supporting CommentaryManagement Team have made no requests for consultations to be responded to during Quarter 1.
44
Pendle Leisure Trust PI Report: APRIL – JUNE 2015 APPENDIX 4Generated on: 13 July 2015
PLT 1 Total number of visits to PLT leisure facilitiesPLT leisure facilities include Inside Spa, Pendle Wavelengths, Pendle Leisure Centre, West Craven Sports Centre, Marsden Park Golf Course, and Seedhill Athletics & Fitness Centre. This measure will also include Nelson & Colne College sports facilities as of Quarter 3 2014/15.
Good Performance? Aim to Maximise
Traffic Light IconShort Term Trend ArrowLong Term Trend ArrowCurrent Value 152,674
Current Target 138,655
Commentary Pendle Wavelengths: April attendance saw a slight increase in usage mainly due to Easter Holidays and swimming. May was very busy due to mid term closure with the pool being very busy and also alot of retention work in the gyms and classes which included training for 3 Peaks and the gym interactions. June has seen a decline In attendance in comparison to the previous year mainly because of Ramadan which moves forward by 11 days each year. This has seen a decline in the Activo usage for gym, swim and classes. Also the 3 female only swim sessions have been affected as they do have a high percentage of our BME customers.
Inside Spa: Good weather conditions have reduced the number of people coming into Spa, but the attendances have increased for the treatments.
Pendle Leisure Centre: Increase on target in May down to a combination of increased hall hires. large bookings for multi activity days (200 Children plus) Sunday low
45
price offer in Swimming Pool for families and Children.
Seedhill: Successful couch to 5k scheme and school bookings increased attendance
West Craven: Lack of group bookings for sports hall has affected the attendances, we have put offers on to increase the number of groups coming in for activities and we are hoping to increase the attendances in coming months.
46
PLT 2 Number of attendees at events held in the ACE Centre and Colne Muni
Good Performance? Aim to Maximise
Traffic Light IconShort Term Trend ArrowLong Term Trend ArrowCurrent Value 33,079
Current Target 31,224
Commentary
The ACE Centres attendances were 7,508 and the Muni's attendances were 4,310.
Events included in the ACE attendances are Cinema Films, Comedy Nights, an evening with Stan Ternent and quiz night.Events included in the Muni attendances are North by North-West Festival, Ballroom Dancing and art events.The ACE Centres attendances were 7,302 and the Muni's attendances were 3,772.
Events included in the ACE attendances are Cinema Films, Comedy Nights and Catch me if you can.Events included in the Muni attendances are Rich Hall, Ballroom Dancing and Borderline.The ACE Centres attendances were 6,930 and the Muni's attendances were 3,257.
Events included in the ACE attendances are Cinema Films, Comedy Nights and Art events.Events included in the Muni attendances are Julian Lloyd Webber, Camerata, Colne Orchestra and Ballroom Dancing.
47
PLT 4 Number of participants attendances in the Healthy Lifestyle Programme (all activities are reliant on external funding)The cessation of the Out and About scheme due to lack of grant funding mid-July 2014 has had a big impact on the numbers of attendees as this scheme accounted for the majority of attendance figures reported previously.
Good Performance? Aim to Maximise
Traffic Light IconShort Term Trend ArrowLong Term Trend ArrowCurrent Value 381
Current Target 356
Commentary203 enrolled/continued with Smoking Cessation, 178 enrolled/continued with Exercise on Referral and Weight Management.
Work is steady with a slight downturn in weight management figure which could be due to competition and also other projects running at the same time.
48
PLT 5 Number of people actively volunteering to provide support in Pendle Leisure Trust activitiesPLT activities include all PLT controlled activity which relies on the support of volunteers. These activities are Sports Development, Live Well and Eat Well, Healthy Lifestyles projects. The Out and About scheme is no longer running (as per mid-2014) which accounted for more than half the figures reported each quarter.
Good Performance? Aim to Maximise
Traffic Light IconShort Term Trend ArrowLong Term Trend ArrowCurrent Value 108
Current Target 75
CommentaryThe volunteers are through the Sports Development scheme.The volunteers are through the Sports Development scheme.The volunteers are through the Sports Development scheme.
49
PLT 6 Total number of membersA 'member' is a person who joins any of the membership schemes offered by the Pendle Leisure Trust.
Good Performance? Aim to Maximise
Traffic Light IconShort Term Trend ArrowLong Term Trend ArrowCurrent Value 3,133
Current Target 3,093
Commentary
Pendle Wavelengths: April and May have been very difficult months with membership sales being tough to achieve mainly due to rumours of a new budget gym coming into the area. Alot of outreach was done and but numbers enquiring were low. We also did several offers to push this. Memberships have been tough in June as most of our Muslim customers took a break from exercise due to the month of Ramadan.
Pendle Leisure Centre: Member levels dropping at PLC. Site not refurbished when the others were combined with the threat of other gyms in the area. This has lead to comments from some renewals about the long term future of PLC.
12 for 9 membership offer helped generate more sales for fully paid members, but we are facing a decline in DD membership in take due to the competition from other local gyms and customer waiting for offers to come out.
50
PLT 6a Current member retention rate (in month)A 'member' is a person who joins any of the membership schemes offered by the Pendle Leisure Trust.
Good Performance? Aim to Maximise
Traffic Light IconShort Term Trend ArrowLong Term Trend ArrowCurrent Value 24.81 months
Current Target 25.51 months
CommentaryThe Fully Paid members retention is 22.86 months and the Direct Debit members retention is 26.67 months.
Staff are using the new retention software to log the customer interaction PLT hope that over the long run it will help increase member loyalty.
51
PLT 7 Amount of feedback received
Good Performance? Aim to Maximise
Traffic Light IconShort Term Trend ArrowLong Term Trend ArrowCurrent Value 52
Current Target 89
Commentary
52
PLT 7(i) Number of complaints received
Good Performance? Aim to Minimise
Traffic Light IconShort Term Trend ArrowLong Term Trend ArrowCurrent Value 5
Current Target
Commentary1 at Pendle Leisure Centre1 at Pendle Wavelengths and 2 at Pendle Leisure Centre1 at West Craven Sports Centre
53
PLT 7(ii) Number of compliments received
Good Performance? Aim to Maximise
Traffic Light IconShort Term Trend ArrowLong Term Trend ArrowCurrent Value 31
Current Target
Commentary1 at Pendle Wavelengths and 2 at Pendle Leisure Centre1 at Pendle Wavelengths, 16 at Pendle Leisure Centre and 2 at the ACE centre.1 at Pendle Leisure Centre and 8 at West Craven Sports Centre
54
PLT 7(iii) Number of suggestions received
Good Performance? Aim to Maximise
Traffic Light IconShort Term Trend ArrowLong Term Trend ArrowCurrent Value 16
Current Target
Commentary1 at Pendle Wavelengths and 7 at Pendle Leisure Centre2 at Pendle Wavelengths and 6 at West Craven Sports Centre
55
PLT 8a Total cost of Pendle Leisure Trust per head of populationThere is a 3wk time lag in the availability of financial data. Therefore, it is accepted that this PI will be reported one month in arrears.
Good Performance? Aim to Minimise
Traffic Light IconShort Term Trend ArrowLong Term Trend ArrowCurrent Value £10.82
Current Target £10.17
Commentary
56
PLT 8b Subsidy per head of population (PBC Grant)
Good Performance? Aim to Minimise
Traffic Light IconShort Term Trend ArrowLong Term Trend ArrowCurrent Value £21.02
Current Target £21.02
Commentary
57
Key:Status: Performance Against Target / Expected Outcome
This PI is significantly below target.
This PI is slightly below target.
This PI is on target.
Performance for this PI can not be measured.
Information only PI.
Long Trend: Are we consistently improving?The value of this PI has improved when compared to an average of previous reporting periodsThe value of this PI has not changed when compared to an average of previous reporting periodsThe value of this PI has worsened when compared to an average of previous reporting periodsNo comparable performance data is available.
58
APPENDIX 5
Partnership Steering Group June Performance (2015/16)
All information contained in this work package is provided in commercial confidence for the sole use of Liberata Limited. The pages of this document shall not be copied published or disclosed wholly or in part to any party without Liberata Limited’s prior permission in writing, and shall be held in safe custody. These obligations shall not apply to information, which is published or becomes known legitimately from some source other than Liberata Limited.
TS 1aPercentage of telephone customers greeted within 40 seconds: in month
61.32% 67.87% 62.25%
TS 1bPercentage of telephone customers greeted within 40 seconds: cumulative
61.32% 64.55% 63.76%
TS 2a Percentage of call abandonment: in month 10.62% 6.32% 9.15%
TS 2bPercentage of call abandonment: cumulative
10.60% 8.55% 8.76%
TS 6aPercentage of telephone enquiries resolved within 15 minutes: in month
97.00% 96.63% 97.49% 97.08%
TS 6bPercentage of telephone enquiries resolved within 15 minutes: cumulative
97.00% 96.60% 97.05% 97.06%
61
Commentary:
June has again been a very busy month for Customer Services, the garden waste subscription scheme has again resulted in a large impact, 24% of all calls offered to Customer Services in June have resulted from Operational Services this is appx 3 times higher than on average. Face to Face services have also seen a large impact due to face to face payments for garden waste, due to the increase in footfall additional resources have been provided to Cash from the Telephony Contact Centre. The continued high volumes of Revenues work is also resulting in an impact on Customer Services 3092 reminders were issued along with 1576 summonses, these high volumes have been ongoing month after month due to the welfare reform changes and more residents now becoming liable to pay Council Tax.
62
1.2 Drop-in Customers
PI Code DescriptionAnnual Target
2015/16Apr
2015May 2015
Jun 2015 Jul 2015 Aug
2015Sep 2015
Oct 2015
Nov 2015
Dec 2015
Jan 2016
Feb 2016
Mar 2016
DI-D Total number of drop-in customers 15,943 13,903 14,594
TS 3a
Percentage of drop-in customers and cash transactions to be seen / handled within 15 minutes: in month
93.50% 87.14% 92.70% 94.00%
TS 3b
Percentage of drop-in customers and cash transactions to be seen / handled within 15 minutes: cumulative
93.50% 87.14% 89.73% 91.13%
TS 4aPercentage of drop-in customers dealt with within 25 minutes: in month
98.00% 95.70% 99.35% 99.28%
TS 4bPercentage of drop-in customers dealt with within 25 minutes: cumulative
98.00% 95.70% 97.40% 98.02%
63
Commentary:
Extra resources from the Telephony Contact Centre have been sent to our Cash Services to help with the increase in footfall resulting from the Garden Waste Subscription customers.
The Revenues and Benefits Enquiries services also have seen a large amount of footfall due to the large volumes of Revenues work since welfare reforms.
64
2. Revenues
PI Code DescriptionAnnual Target
2015/16Apr
2015May 2015
Jun 2015 Jul 2015 Aug
2015Sep 2015
Oct 2015
Nov 2015
Dec 2015
Jan 2016
Feb 2016
Mar 2016
AP 4Percentage of Council Taxpayers paying by Direct Debit
57.53% 58.77% 59.39%
AP 5Percentage of NNDR Ratepayers paying by Direct Debit
48.90% 53.64% 54.82%
BV9 Percentage of Council Tax collected 96.00% 11.42% 20.28% 29.18%
BV9a Profiled expected % of Council Tax Collected
BV9b Performance
BV10Percentage of Non-Domestic Rates Collected
98.00% 10.38% 19.06% 30.33%
BV10a Profiled expected % of NNDR Collected
BV10b Performance
TS 14 Percentage of Council Tax Arrears Collected
Commentary:
65
Collection on both Council Tax and NNDR are above this time last year. Council Tax by 0.17% and NNDR by 1.82%.
66
3. Benefits
PI Code DescriptionAnnual Target
2015/16Apr
2015May 2015
Jun 2015 Jul 2015 Aug
2015Sep 2015
Oct 2015
Nov 2015
Dec 2015
Jan 2016
Feb 2016
Mar 2016
NI 181
Time taken to process Housing Benefit/Council Tax Benefit new claims and change events: in month
7.0 days 9.5 days 5.5 days 7.8 days
NI 181a
Time taken to process Housing Benefit/Council Tax Benefit new claims and change events: cumulative (Right Time)
7.0 days 9.5 days 6.9 days 7.2 days
BV78aSpeed of processing - new HB/CTB claims: in month
21.0 days
20.0 days
19.5 days
19.9 days
BV78a(i)Speed of processing new HB/CTB claims: cumulative
21.0 days
20.0 days
19.8 days
19.8 days
BV78b
Speed of processing changes of circumstances for HB/CTB claims: in month
6.5 days 7.3 days 4.3 days 6.4 days
BV78b(i)
Speed of processing change of circumstances for HB/CTB claims: cumulative
6.5 days 7.3 days 5.3 days 5.6 days
BV79b(i) Percentage of Recoverable Overpayments
83.00% 69.85%
67
PI Code DescriptionAnnual Target
2015/16Apr
2015May 2015
Jun 2015 Jul 2015 Aug
2015Sep 2015
Oct 2015
Nov 2015
Dec 2015
Jan 2016
Feb 2016
Mar 2016
Recovered (HB) that are recovered during period
TS 7aRespond to written letters within 5 days, resolve within 15 days - Total number received
20 16 18
TS 7bRespond to written letters within 5 days, resolve within 15 days: in month (%)
100.00% 93.75% 100.00%
TS 7c
Respond to written letters within 5 days, resolve within 15 days: cumulative performance (%)
100.00% 96.88% 97.92%
TS 9a Claims paid within 14 days: in month 98.00% 98.84% 98.73% 98.59%
Benefits Performance remains excellent. We are receiving an increased number of documents from DWP on UC however there are still a very low number coming off benefits. 93 were received in May however only 12 of these resulted in HB being with drawn.
ITS 1c Total number of Helpdesk calls received 204 225 220
ITS 1dNumber of Helpdesk calls resolved within target times
200 225 203
ITS 1aPercentage of Helpdesk calls resolved within target times: in month
97.00% 98.04% 100.00% 92.27%
ITS 1bPercentage of Helpdesk calls resolved within target times: cumulative
97.00% 98.04% 99.07% 96.76%
ITS 2Availability of servers, networks and applications
99.00% 99.75% 100.00% 98.56%
ITS 3 Availability of networks 99.00% 100.00% 100.00% 100.00%ITS 4 Availability of servers 99.00% 100.00% 100.00% 100.00%
ITS 5 Percentage of downtime (unplanned) 1.00% 0.02% 0.00% 1.44%
Commentary:
Service Performance
71
A number of P1 incidents in June has resulted in not achieving the KPI stats for ITS1,ITS2 and ITS5
Majority of the downtime relates to the Webpay incident on the 24th June resulting in 193 minutes downtime
Projects
IDOX - The project is moving into the 1st phase which is the build of the Infrastructure and subsequent installation of the IDOX software on the 20th July
ATP - Automated payment for Garden waste is scheduled to be complete by the 10th July
WiFi - This is now complete
Customer Satisfaction - Survey was released on the 15th June and the results are due on the 10th July
W2003 - The SQL Cluster is scheduled to be built by the 18th July and completion projected for the end of August
Councillor Email access - Council have decided to use personal email for Councillors to access Council business Trustmarque have advised the Council of the significant risk on security and requested formal acknowledgement that they will underwrite any associated impact of the decision
72
6. Human Resources
PI Code DescriptionAnnual Target
2015/16Apr
2015May 2015
Jun 2015 Jul 2015 Aug
2015Sep 2015
Oct 2015
Nov 2015
Dec 2015
Jan 2016
Feb 2016
Mar 2016
BV12 Working Days Lost Due to Sickness Absence
6.500 days
0.561 days
1.052 days
BV12a Profiled (expected)
Commentary:
The sickness figures for May continue to improve. The monthly figure was 0.491 against a target of 0.542 and the cumulative figure is 1.053 against a target of 1.083.Finalise HR Service PlanPrepare annual learning and development report and corporate equalities reportAgree HR budgets for Modern ApprenticeshipsHealth & Wellbeing - DIY Health checks; Stress band workshops;Quarterly Partnership H&S Team meetingAttend Risk Management Working GroupArrange Council's charity dress down dayRevise H&S Policies and circulate for consultationInterviews for Environmental Crime OfficerReview of apprenticeship and workstart support from LCCSickness monitoring - 3 short term sickness reviews and 1 long term sickness review
73
7. Property Services
PI Code DescriptionAnnual Target
2015/16Apr
2015May 2015
Jun 2015
Jul2015
Aug 2015
Sep 2015
Oct 2015
Nov 2015
Dec 2015
Jan 2016
Feb 2016
Mar 2016
BV156Buildings Accessible to People with a Disability
91.00% Measured annually
PS 1a
Percentage of commercial properties let (cumulative average)
95.00% 95.65% 95.65% 95.65%
PS 2a
Percentage arrears of rent on property portfolio, excluding markets (cumulative average)
10.00% 6.00% 7.39% 6.68%
PS 3Number of vacant stalls - Colne (cumulative average)
14.00 16.40 14.20 15.47
PS 4Number of vacant stalls - Nelson (cumulative average)
a) £159,174.42 excluding market rents had been invoiced at the end of June 2015. This is 56.56% of the target of £281,410 for 2015/16.
b) PS1 There were 4 vacant properties in the Council's commercial portfolio in June – 1 property is under offer. All vacant space is actively marketed including on Rightmove
c) PS2 rent arrears: these have reduced to 5.25%. The Council last year wrote off some of the arrears (historic and untraceable) and in other cases payment planshave been put in place. The Council is aware that the June position includes arrears relating to the lease of Unity Hall, Vernon Street, Nelson. There is a proposal to transfer the building to the Town Council and recently some of the debt has been written off. If the remaining arrears relating to Unity Hall are excluded, the percentage reduces to 4.03Arrears are actively pursued, payment plans arranged and as necessary, arrears referred for legal action
d) Nelson Market arrears in June current tenants’ arrears were 9.12% of the current rental income. The arrears were £15,943.01 (a reduction on the highest level recorded in May 2014 of 16.49% @ £23,471.88); former tenants’ arrears were 8.95% @ £15,648.59 (a reduction on the highest level in October of 11.69% @ £16,637.96).Colne Market in June: current tenants’ arrears were 11.48% @ £9,591.19 (a reduction on the highest level in September of 13.17% @ £11,626.64); former tenants’ arrears were 34.12% @ £28,508.75 (a reduction from the highest level recorded in October of 37.92% @ £33,466.65)Vacant Market Stalls and Markets’ update: At Colne, there were 18 stalls vacant in June with some recent enquiries.At Nelson, there were 38 stalls vacant (including some of the 18 perimeter stalls formerly managed by Pendle Rise and which Liberata is now managing for the Council). Vacant stalls are actively marketed.At Colne Market, internal and external redecorating works are almost complete together lighting. New external signage has been installed. Stone work has been jet washed and the Glass Box has been re-glazed.
e) PS6 disposal receipts:Financial receipts to the end of June including completed IFS sales total £409,696. In month, there were no receipts.The consideration of £424,000 for the sale of land at Clitheroe Road, Brierfield has been delayed beyond 2014/15. The sale of 19/21 Carr Road, Nelson, 23/25 Market Square, and 108 Scotland Road has been re-advertised and offers reported to the Executive.
f) Improvement for Sale(IFS) programme:Property Services is marketing 8 improved properties in Nelson – 1 in Albert Street, 5 in Mosley Street and 2 in Every Street. There are 2 houses under offer 1 on Albert Street and 1 on Every Street.
g) Other Estates projectsCapital accounting: Work is ongoing in Estates and Accountancy on a shared asset register in the Technology Forge software system. This data is required to produce financial information for the Council’s Accounts. This will be an improvement on the two systems formerly operated by Property and AccountancyTransparency Agenda and Digitised mapping: A revised proposal has been issued to complete. An implementation programme is being determined to enablecompliance with Transparency requirements and digitisation of map records by early 2016. Existing data has been submitted for uploading to the Council’s website.
75
DESIGN SERVICES PROJECTS:h) Whitefield Regeneration area: 10-36 Albert Street - refurbishment on schedule with a partial handover of 10-32 was achieved on 31st March with 34-36 to be
handed over within the next two weeks. 20-42 Macleod and 140-150 Every Street schemes completed with additional snagging all complete with the exception of the re rendering of the gable end at No 150 Every Street.
i) Clitheroe Road – New Build project, building regulations and drawings undertaken. j) Design work procurement: Liberata has been advised that all work, which should be procured through Liberata, will be. This is in accordance with the exclusivity clause in the Partnership Contract which requires all design and building professional services work to be procured through Liberata. Some work from area committees which should have been commissioned through Liberata has been carried out by Engineering and Special Projects and this has been discussed with Peter Atkinson.
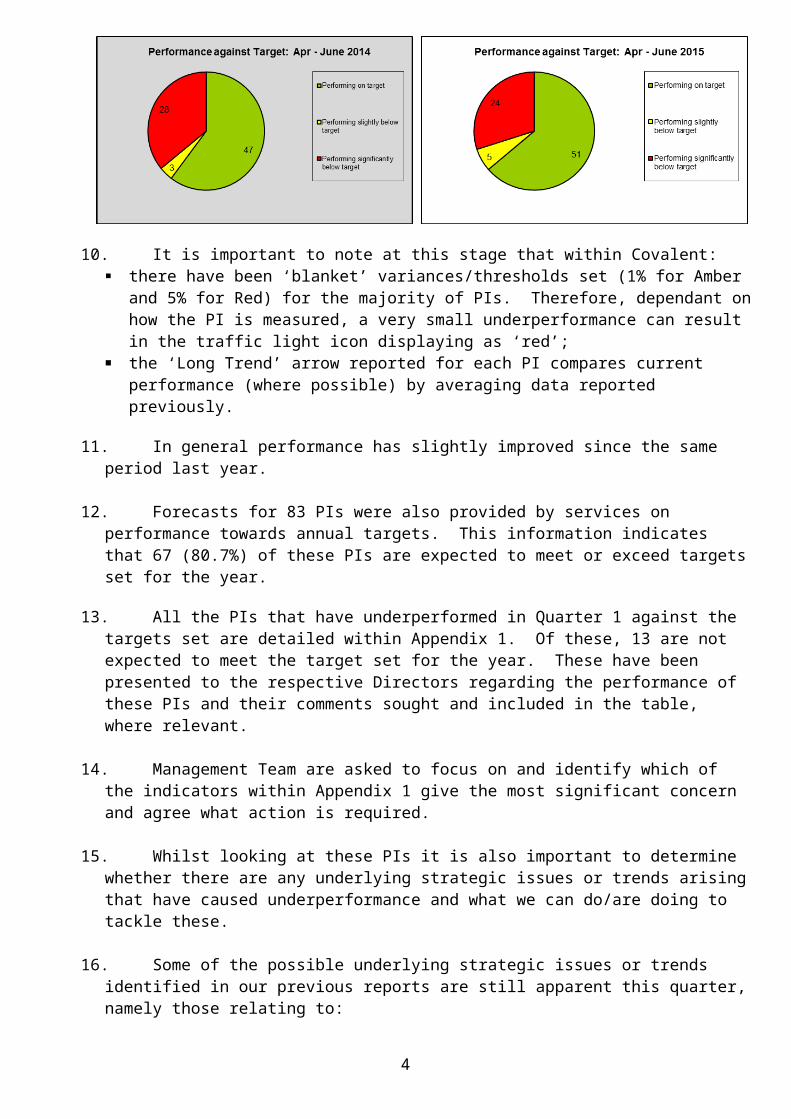
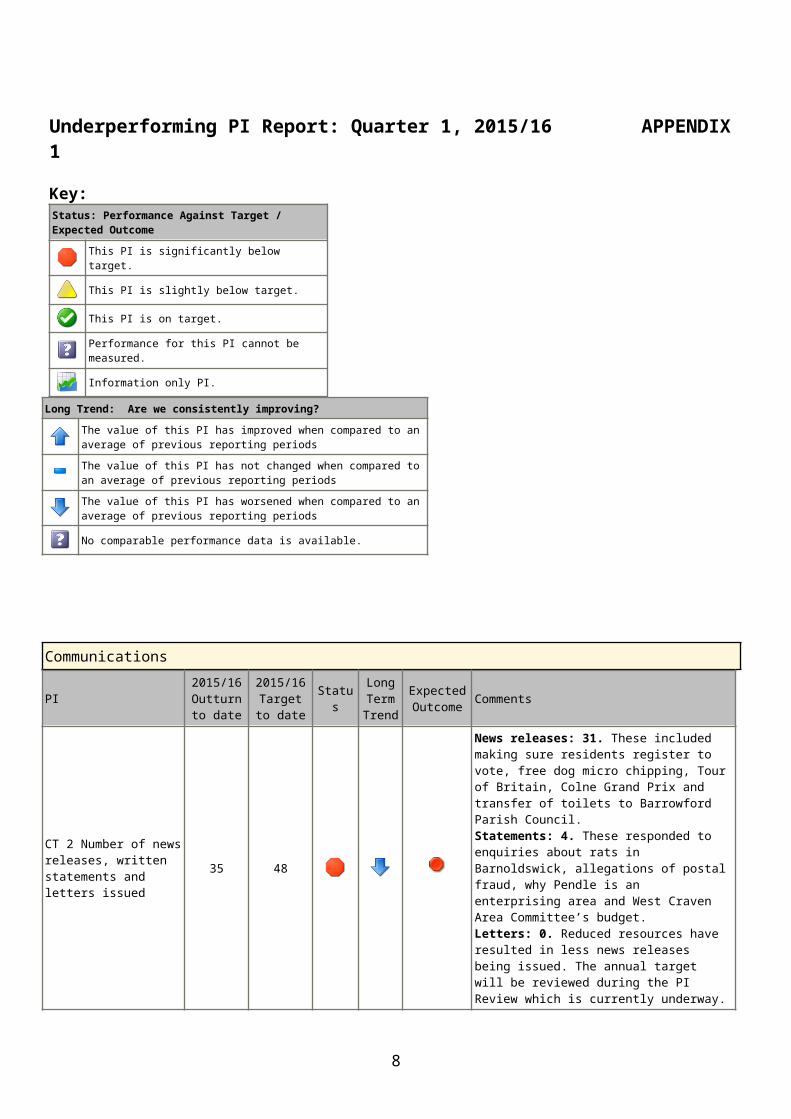
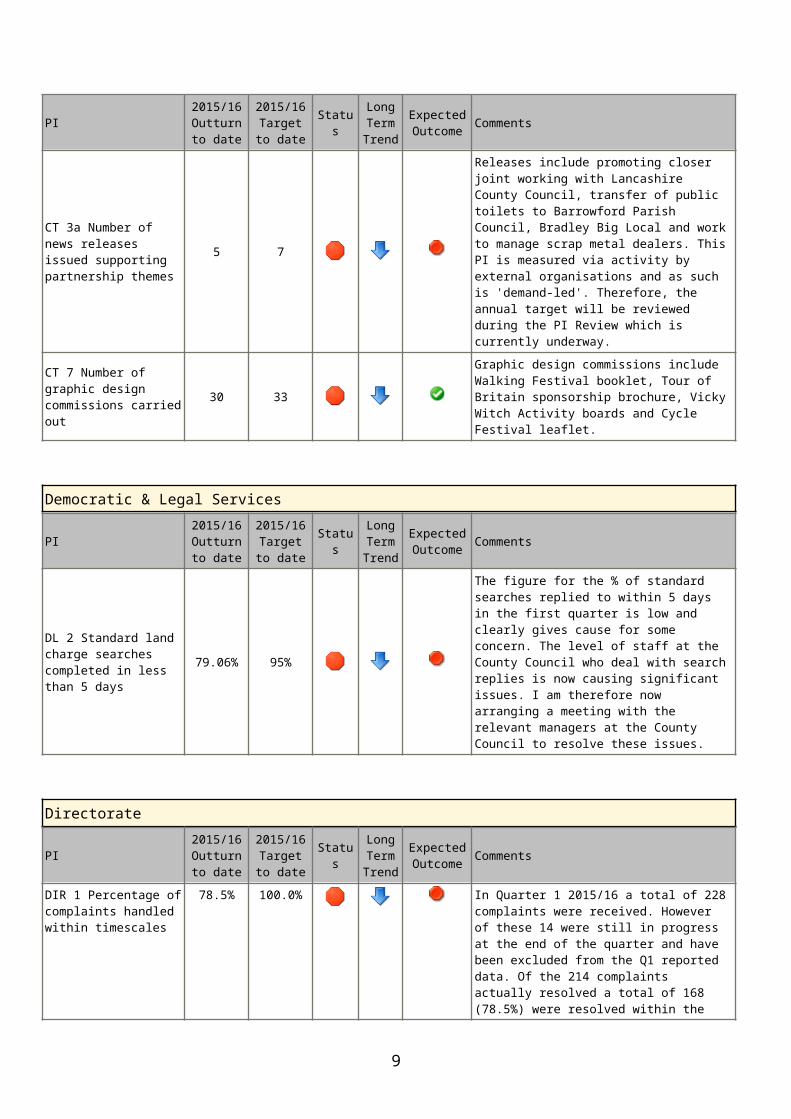
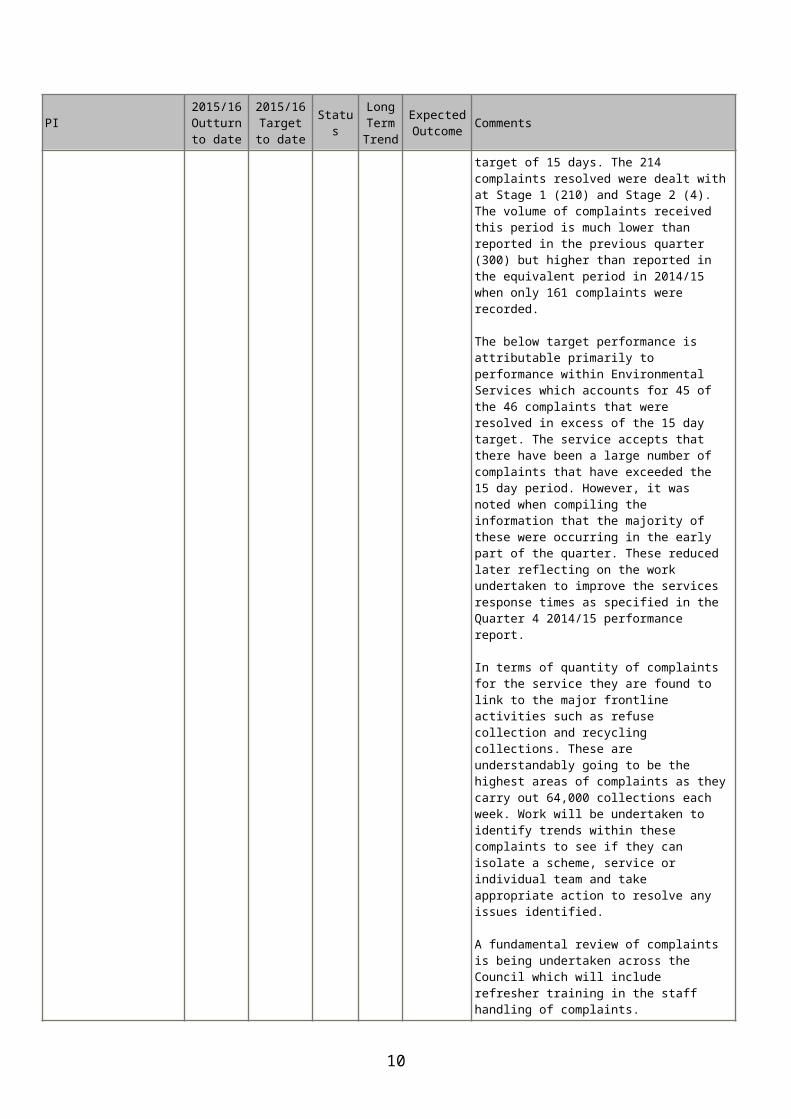
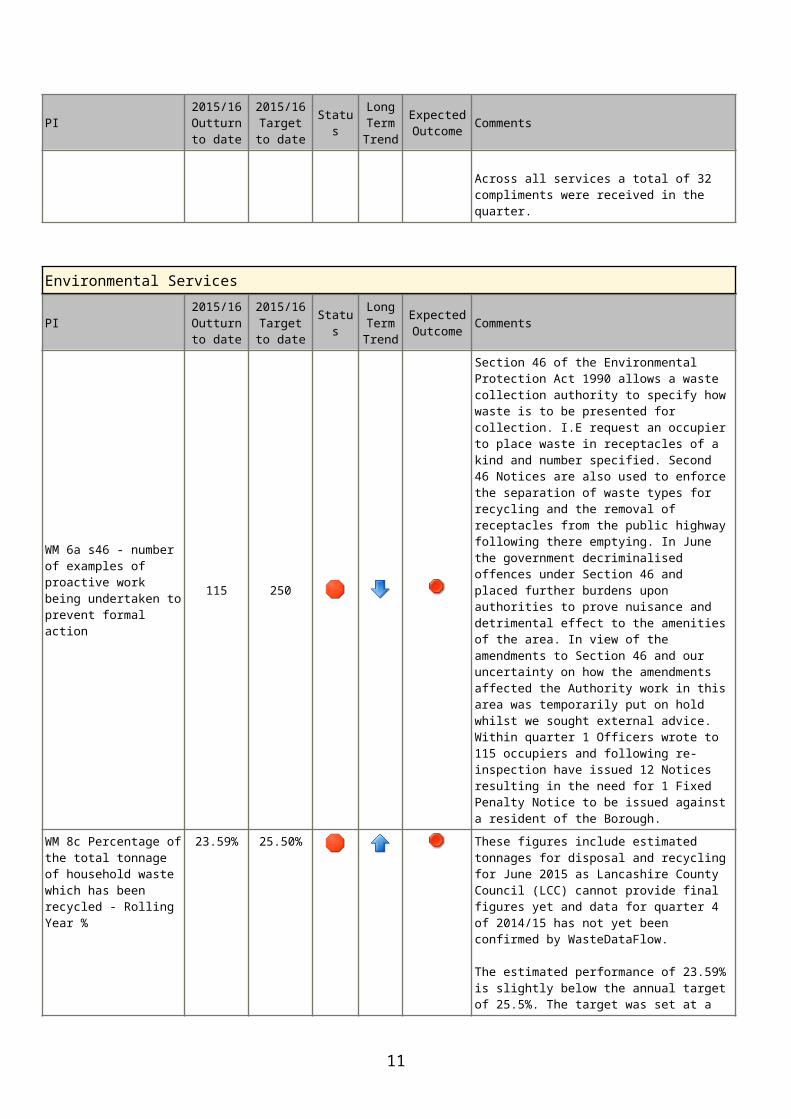
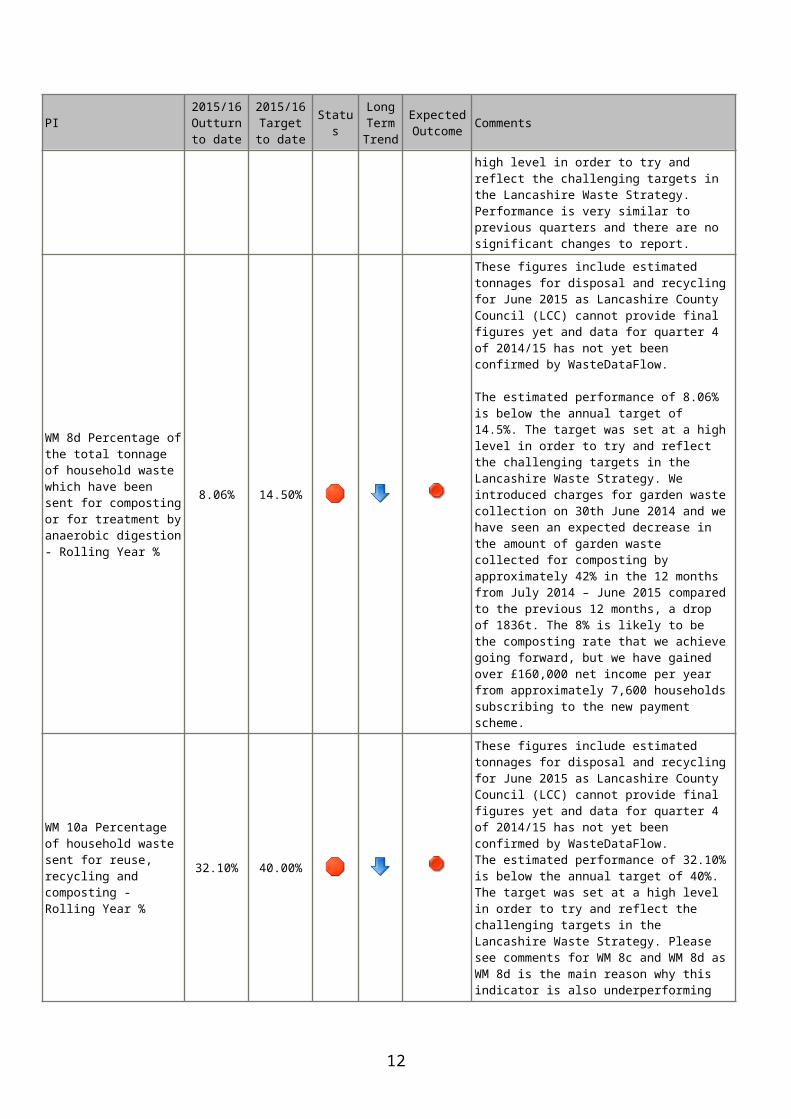
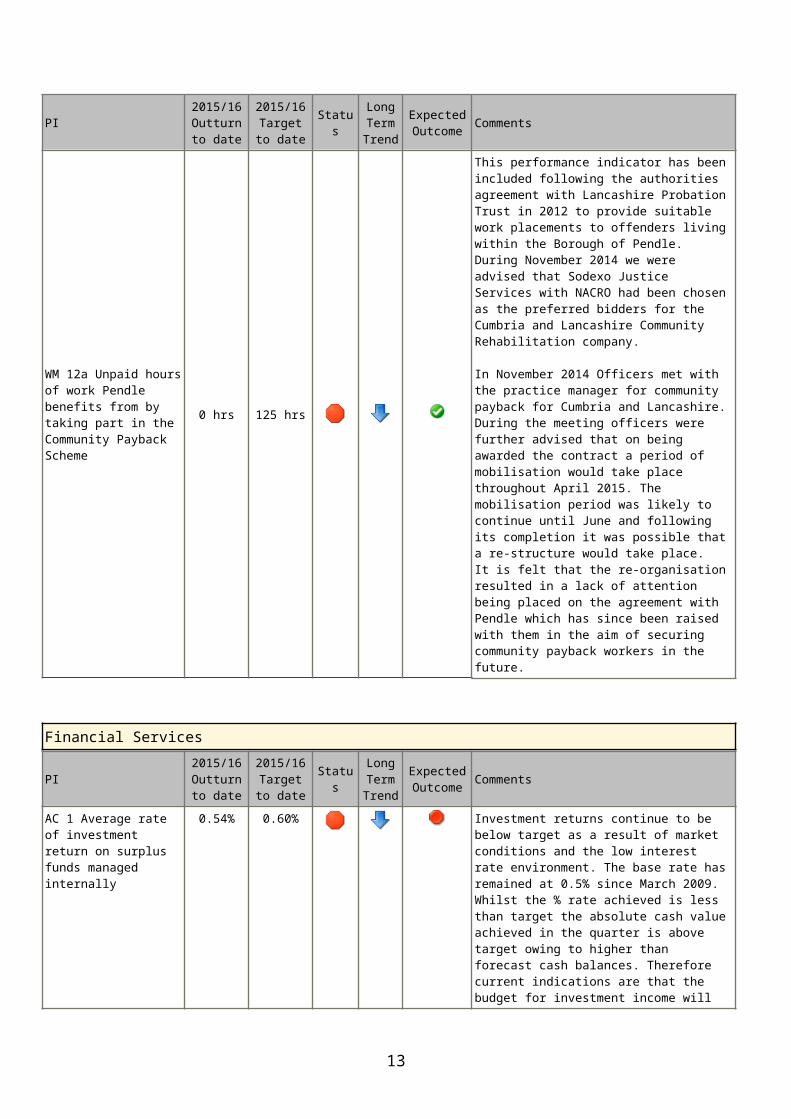
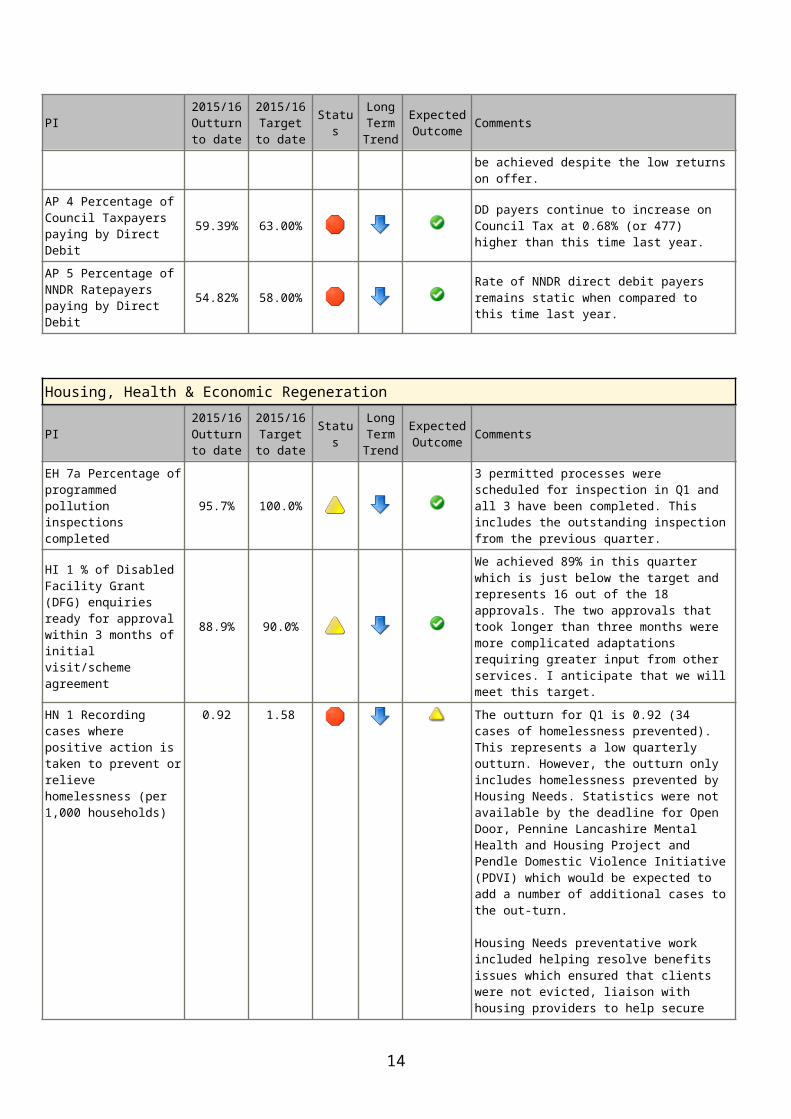
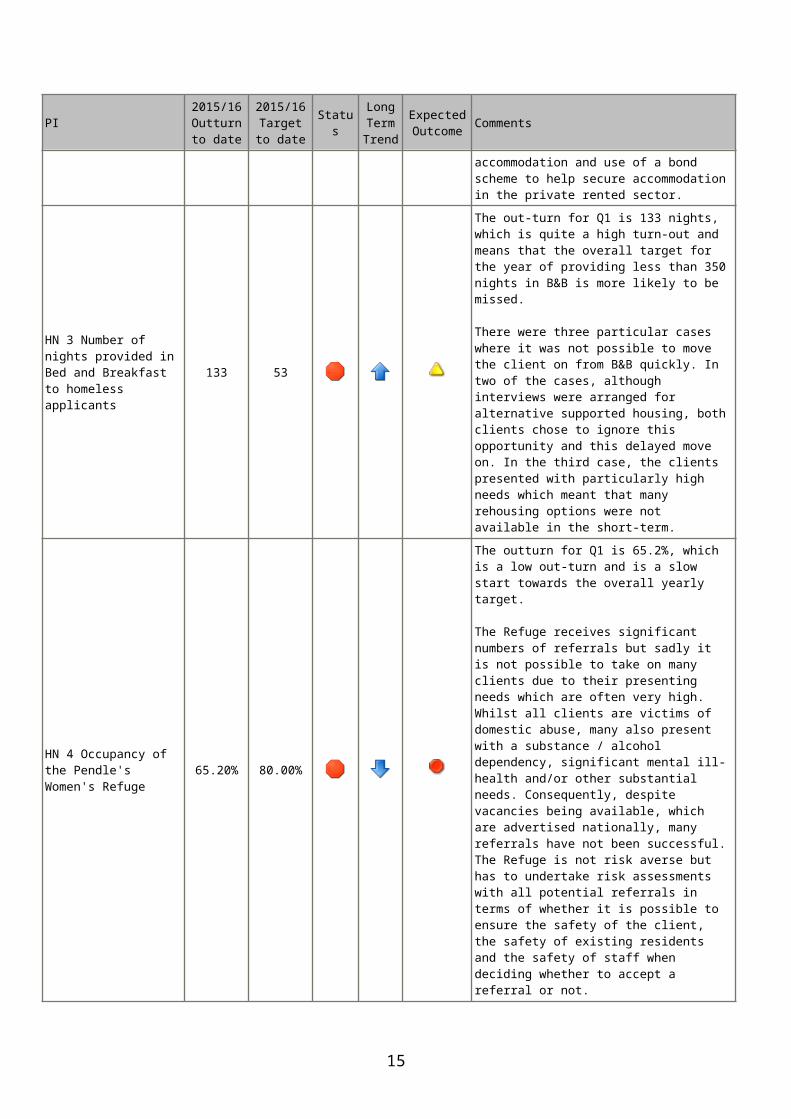
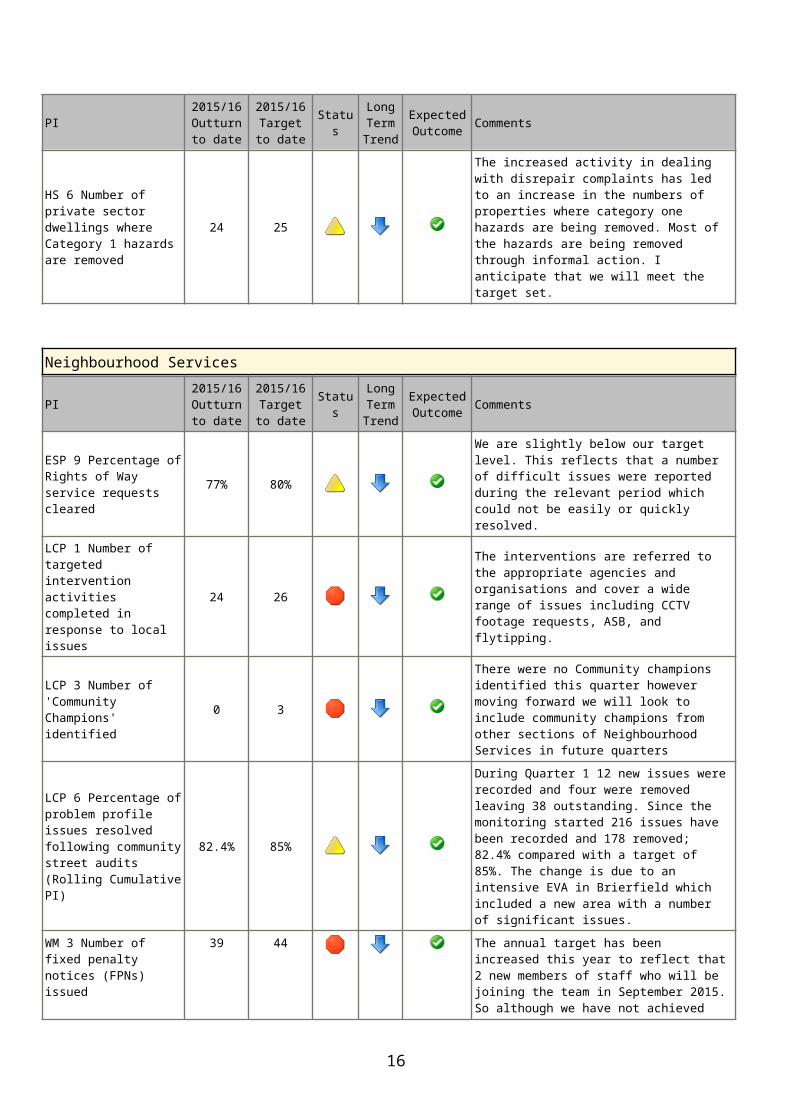
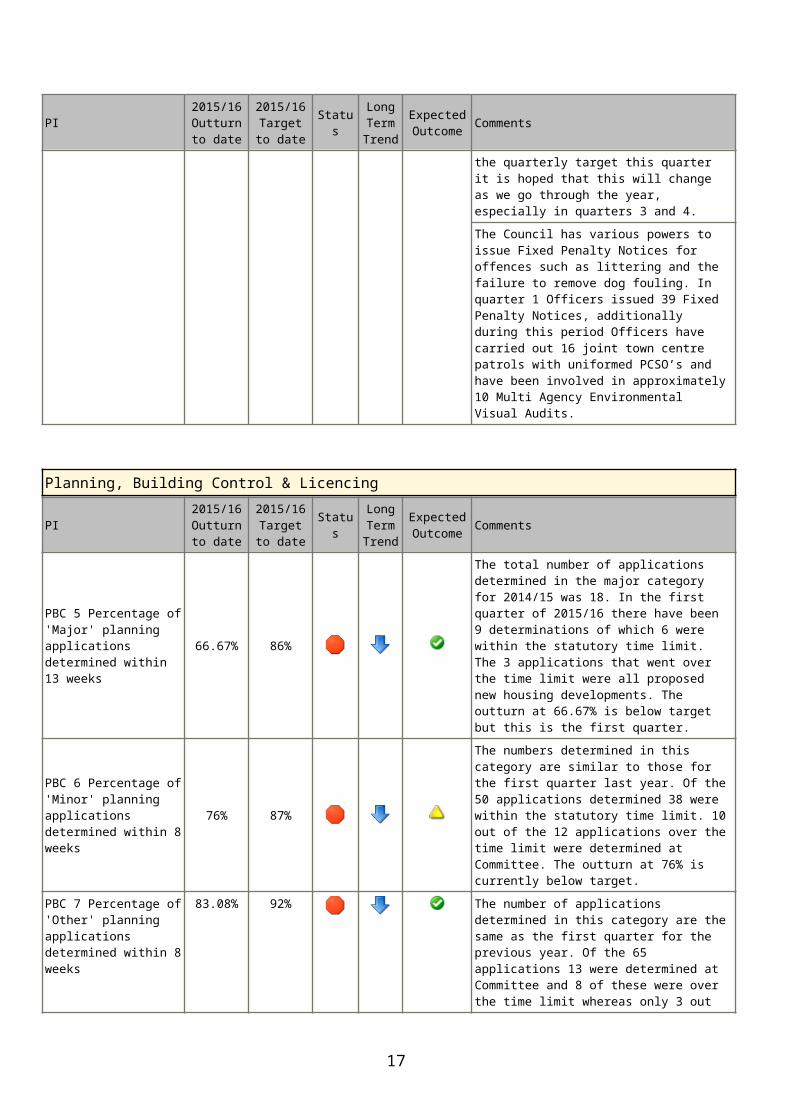
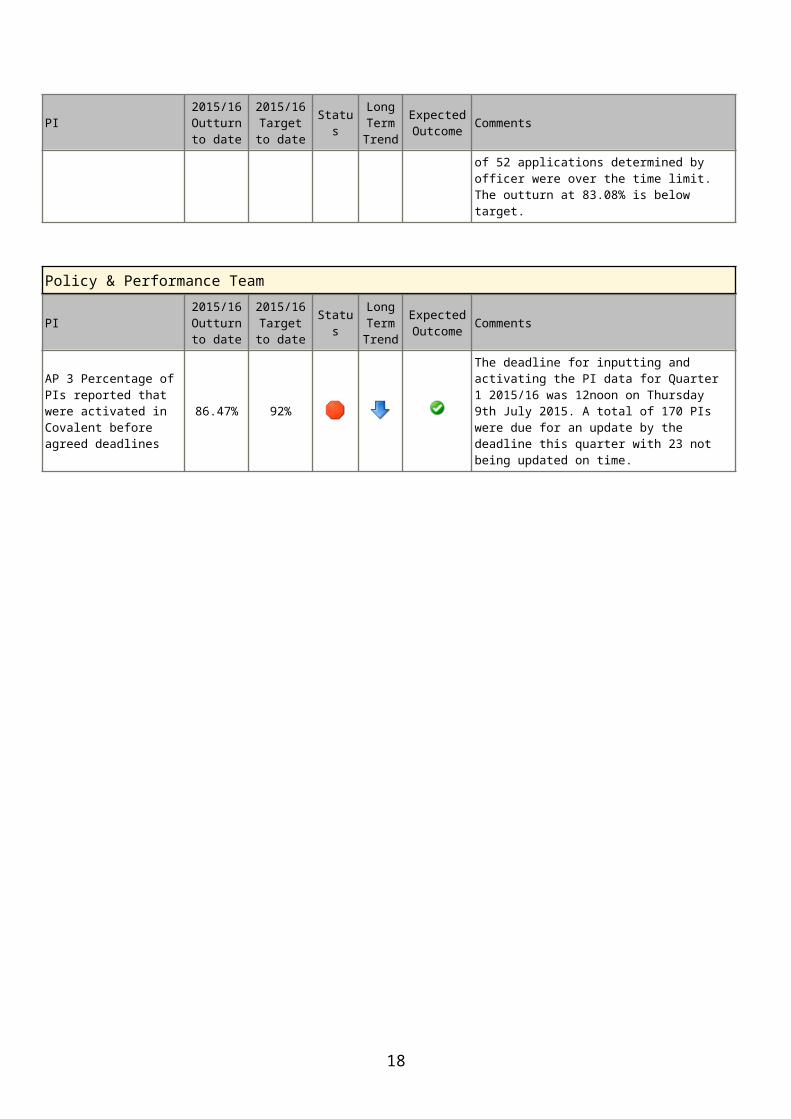
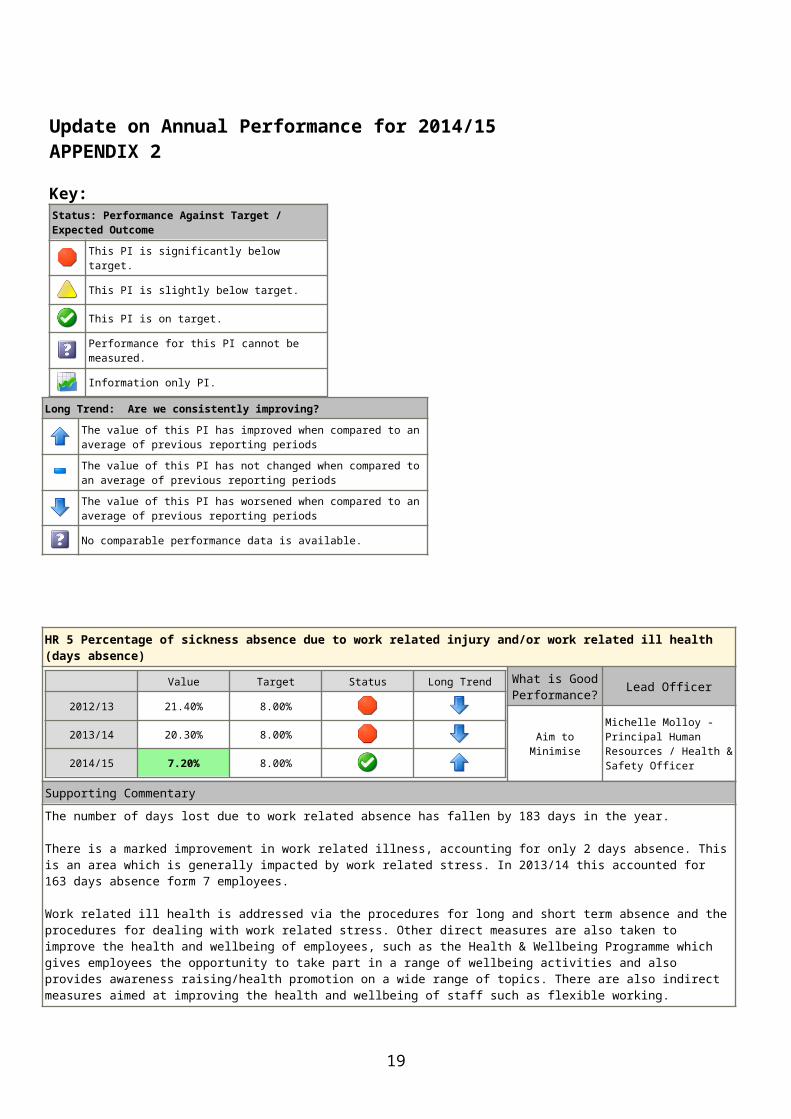
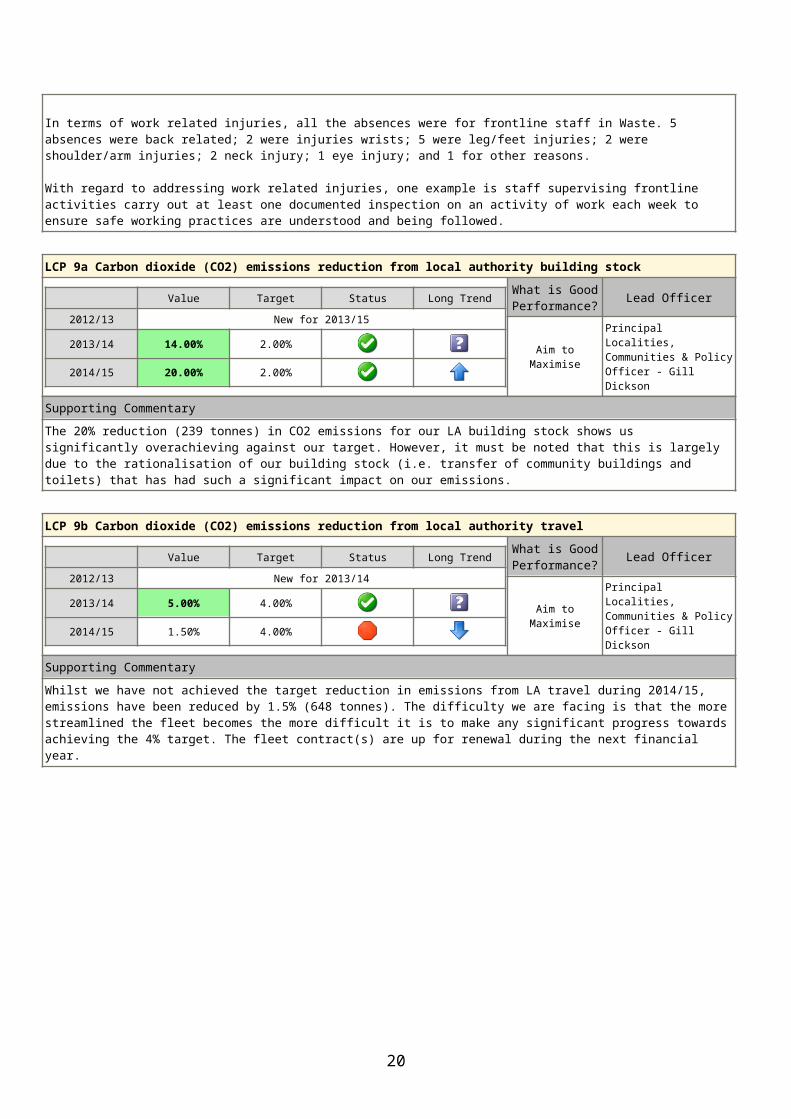
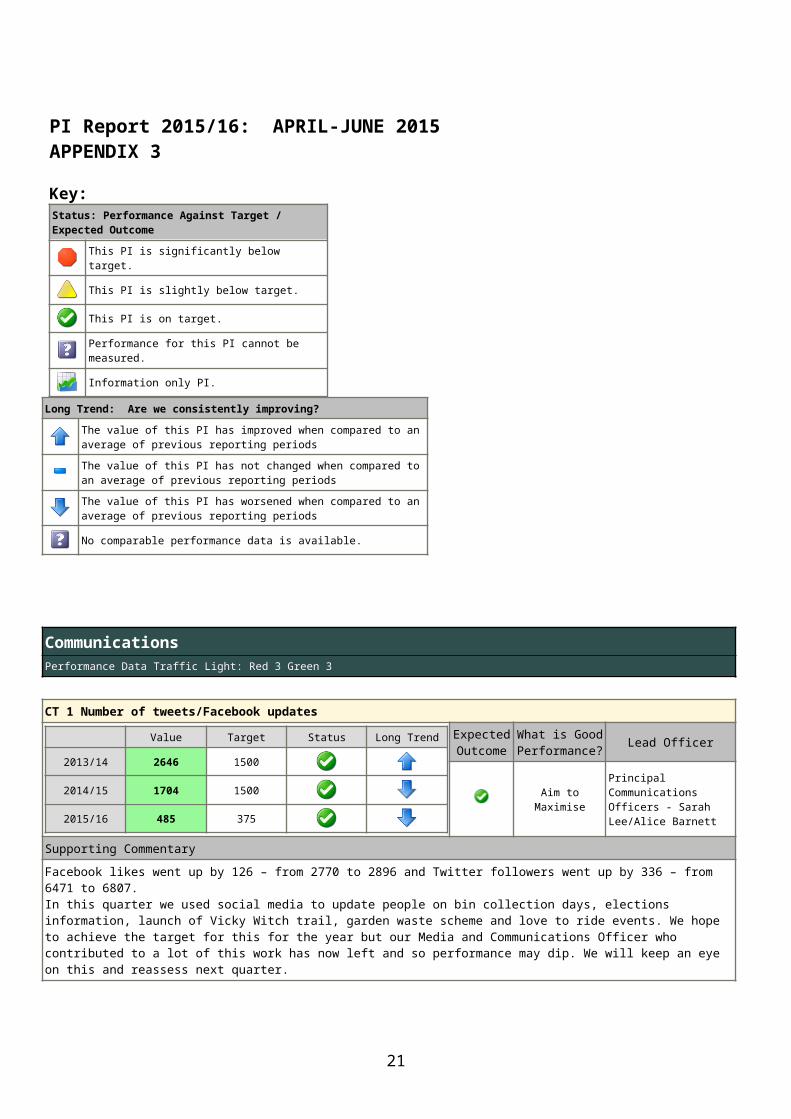
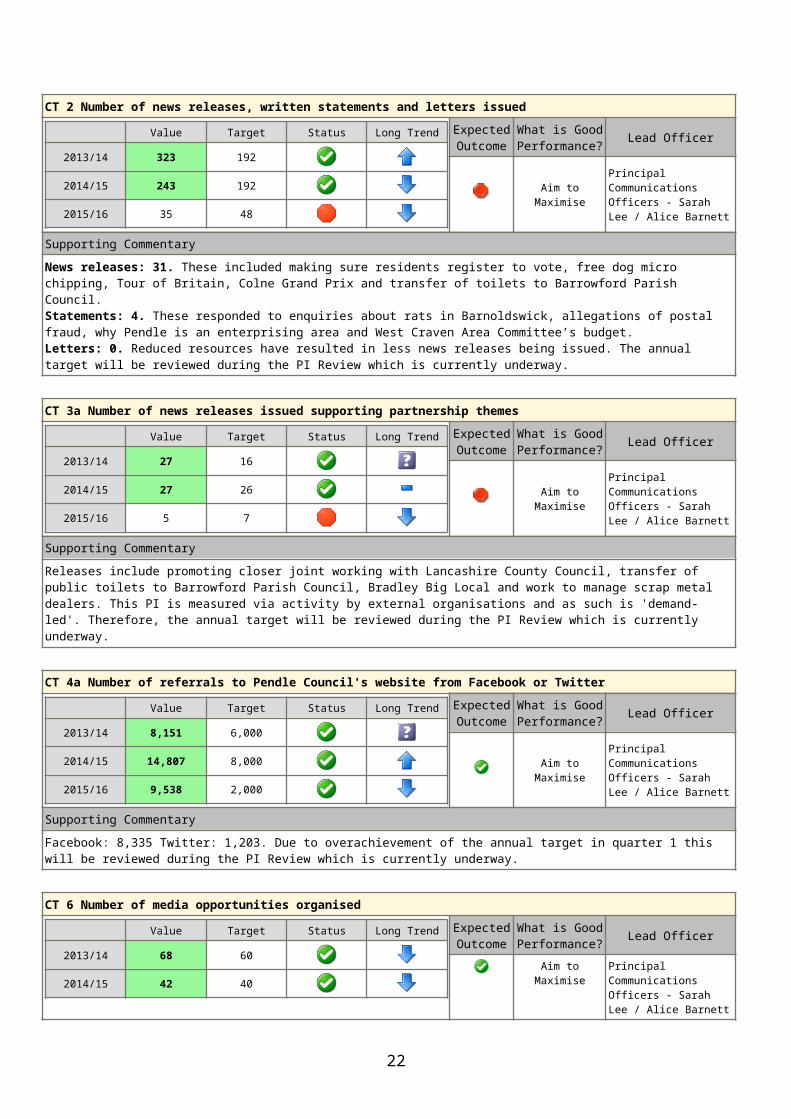
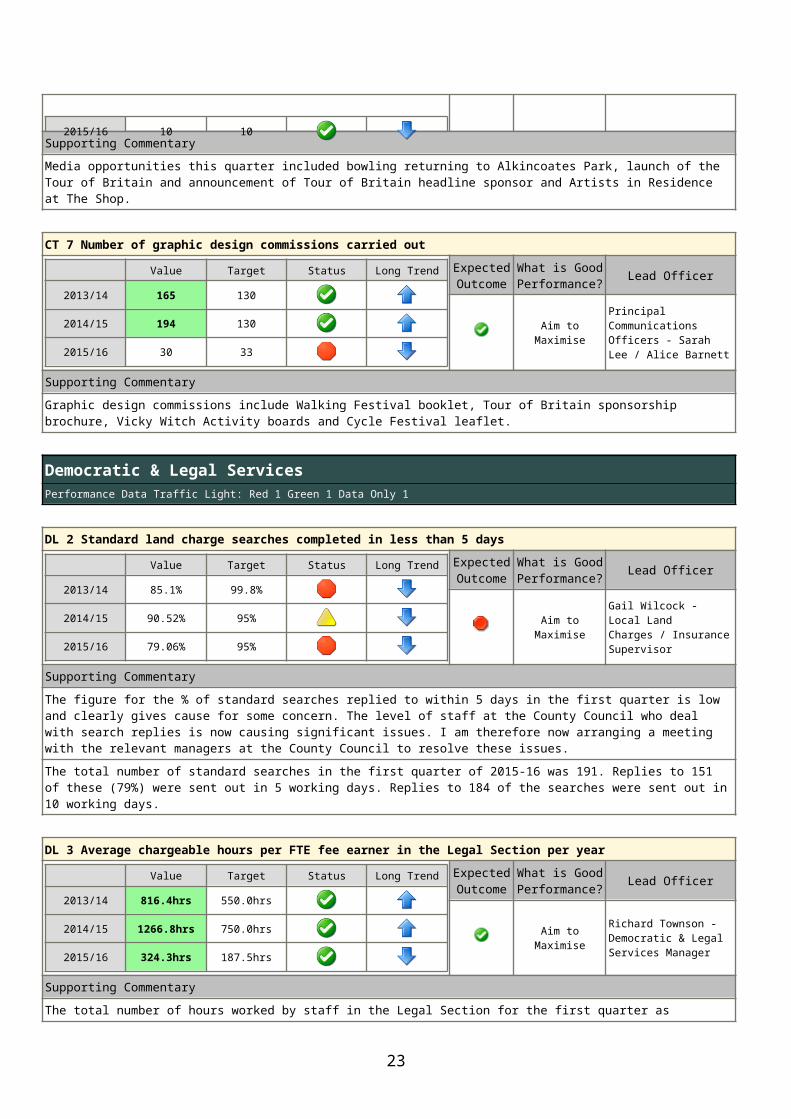
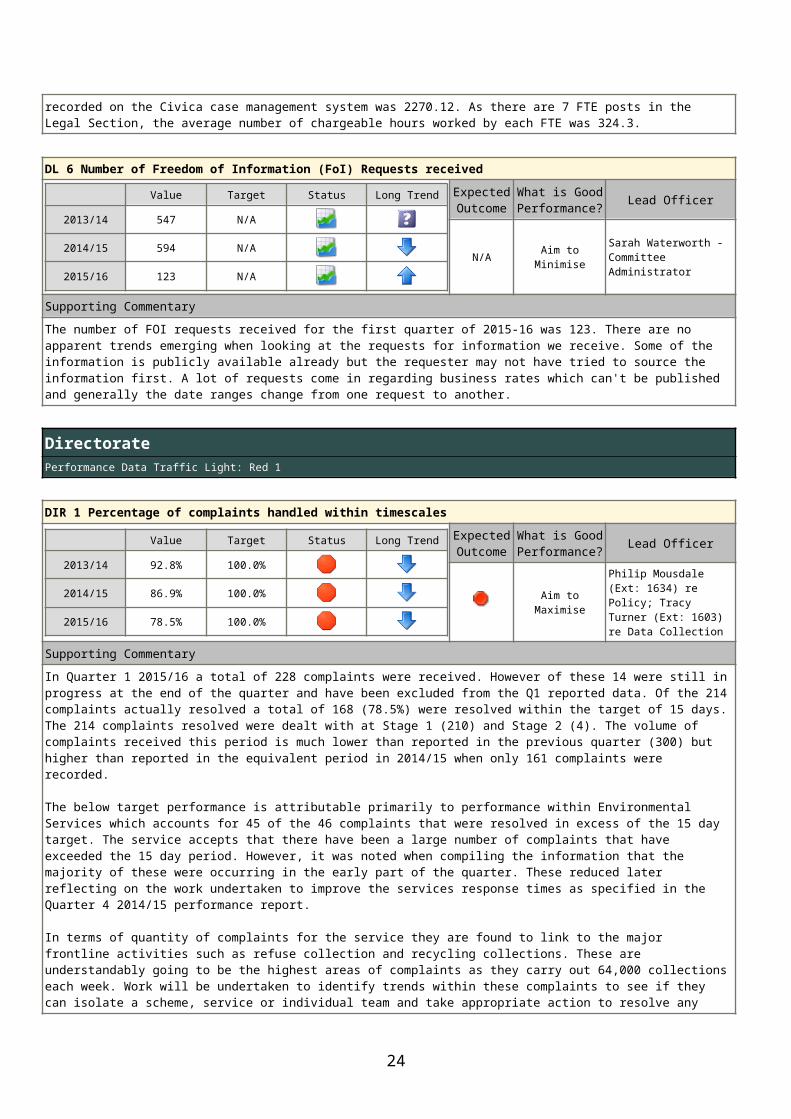
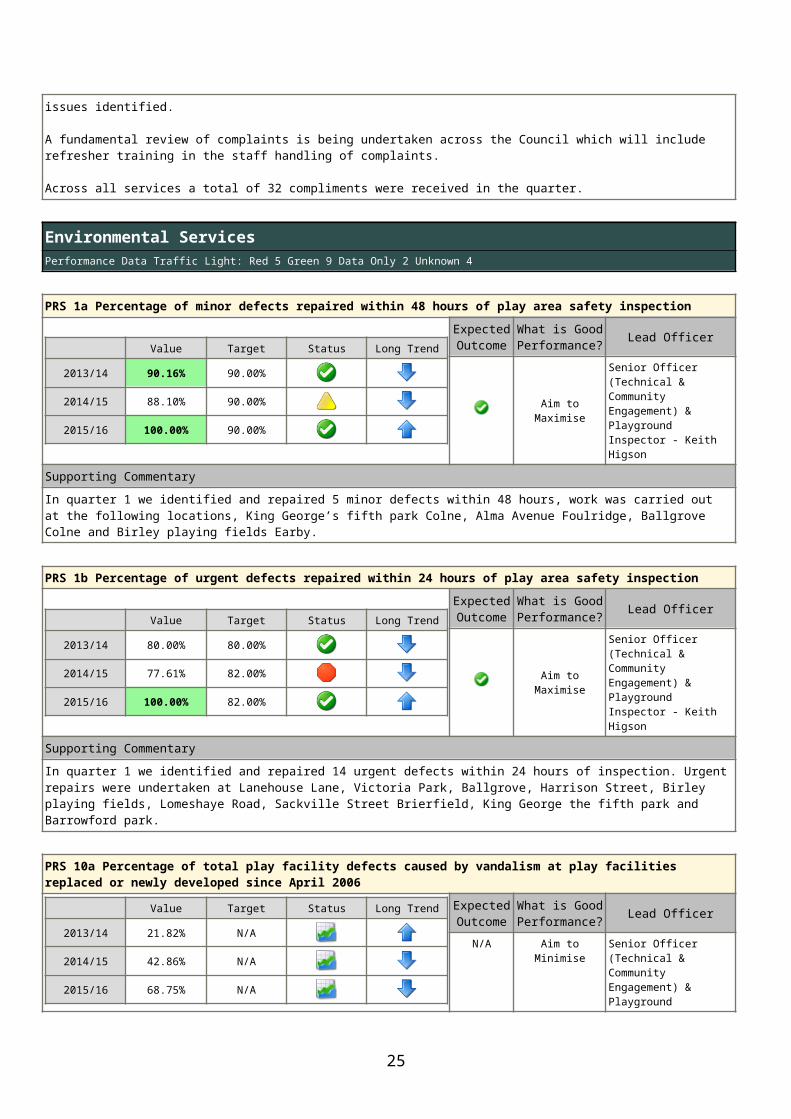
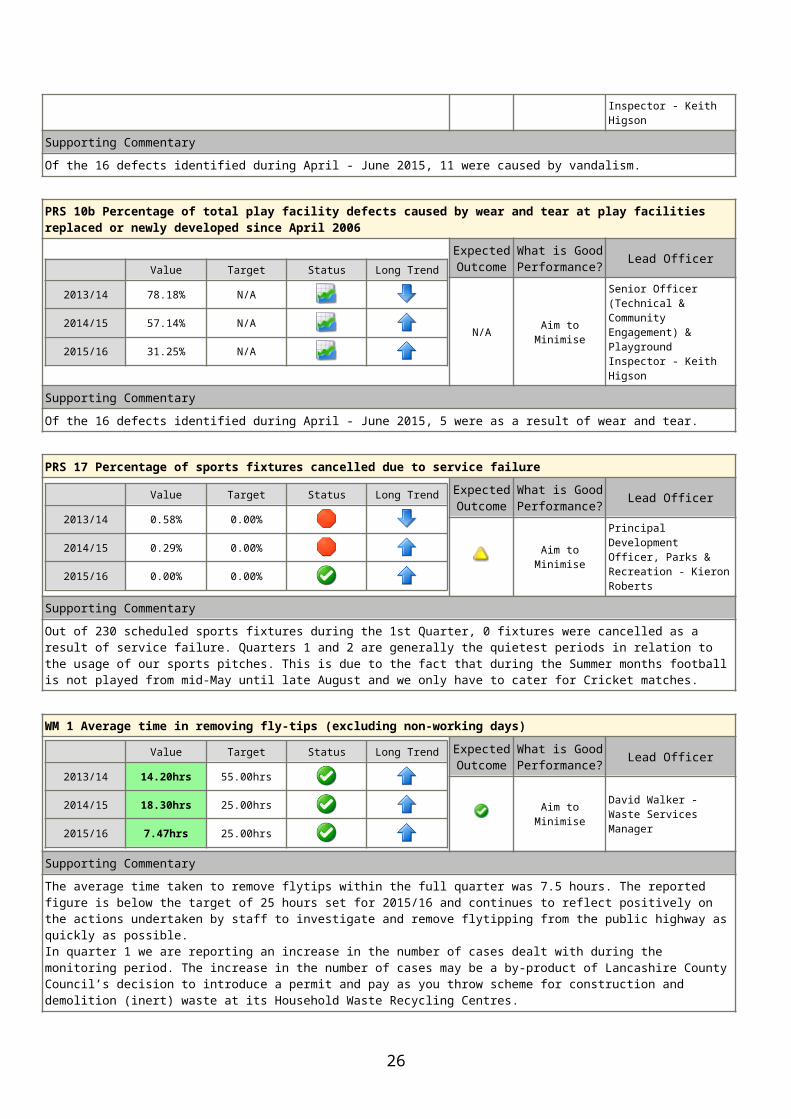
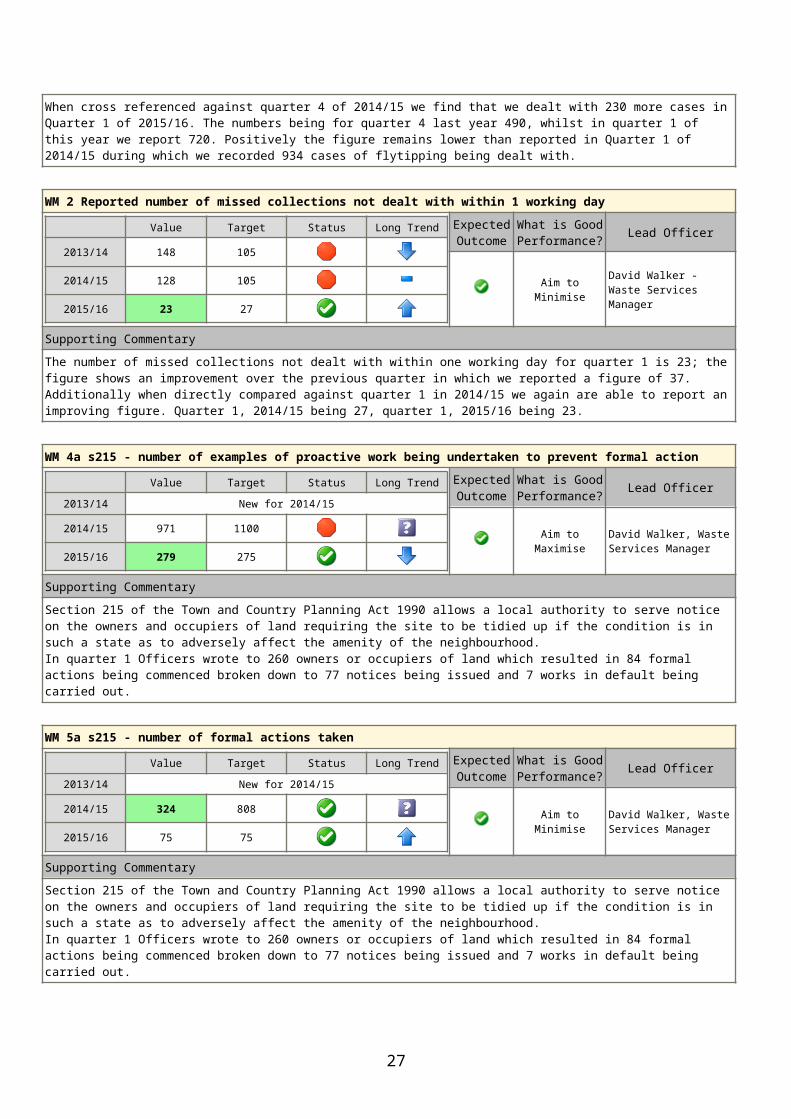
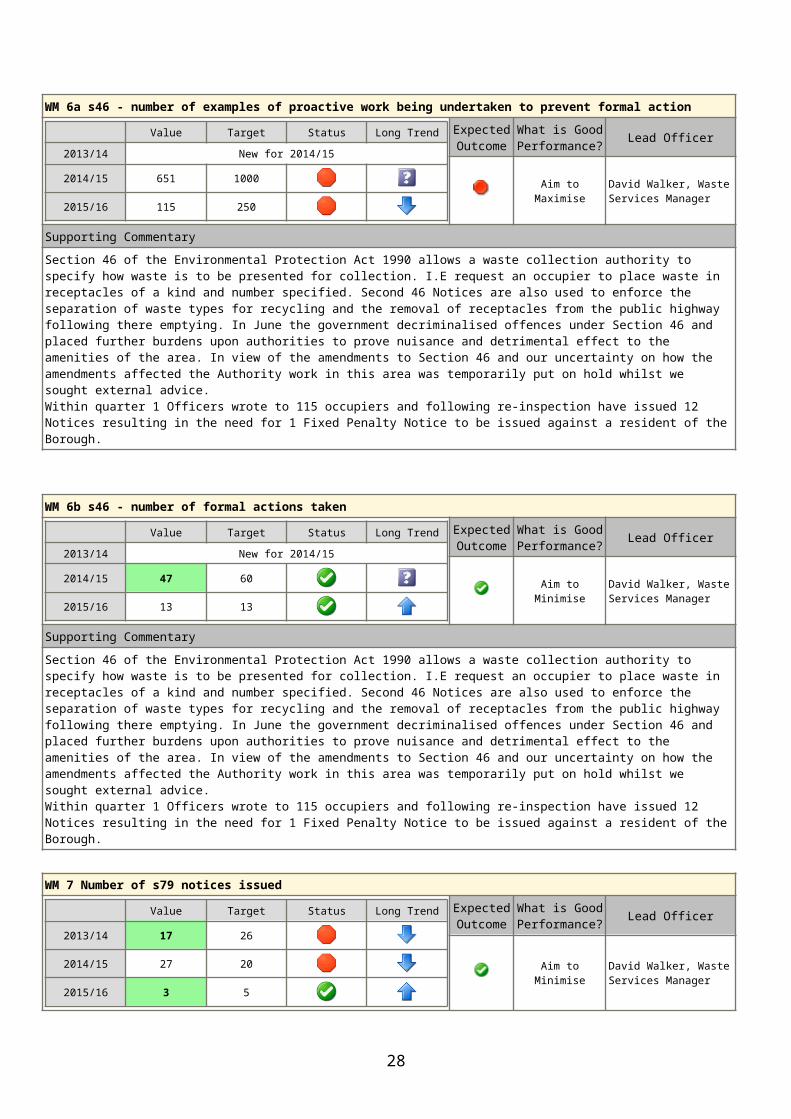
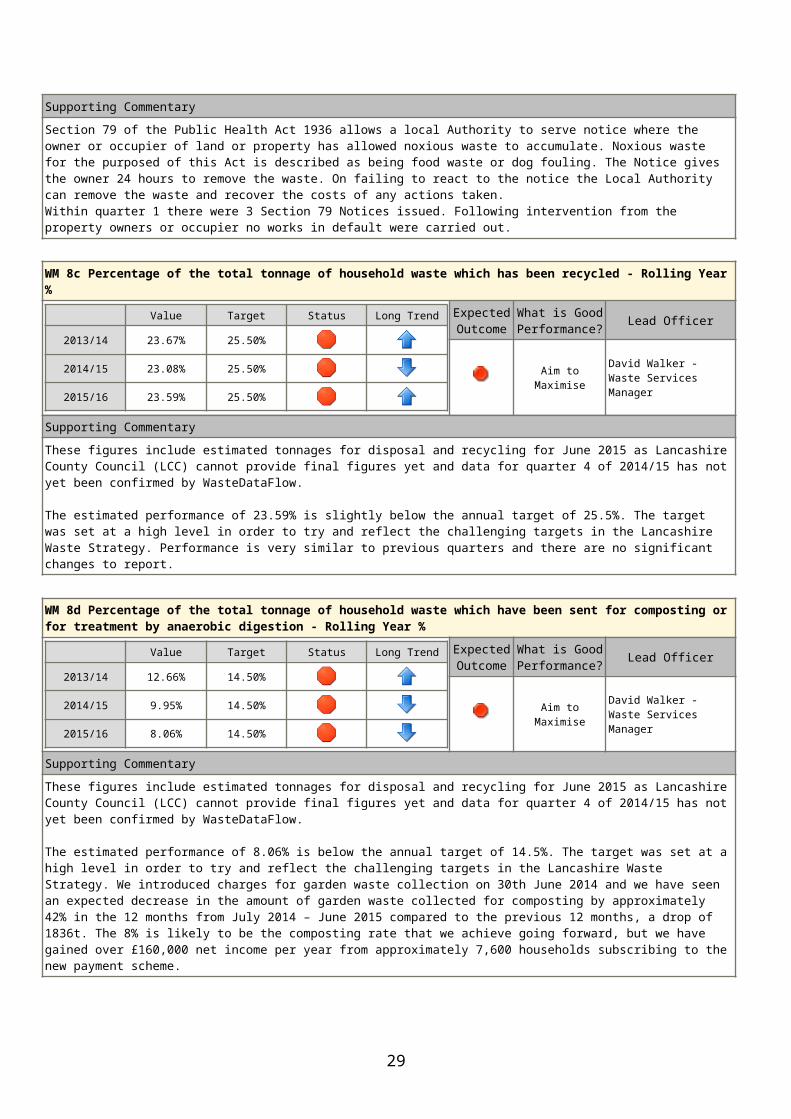
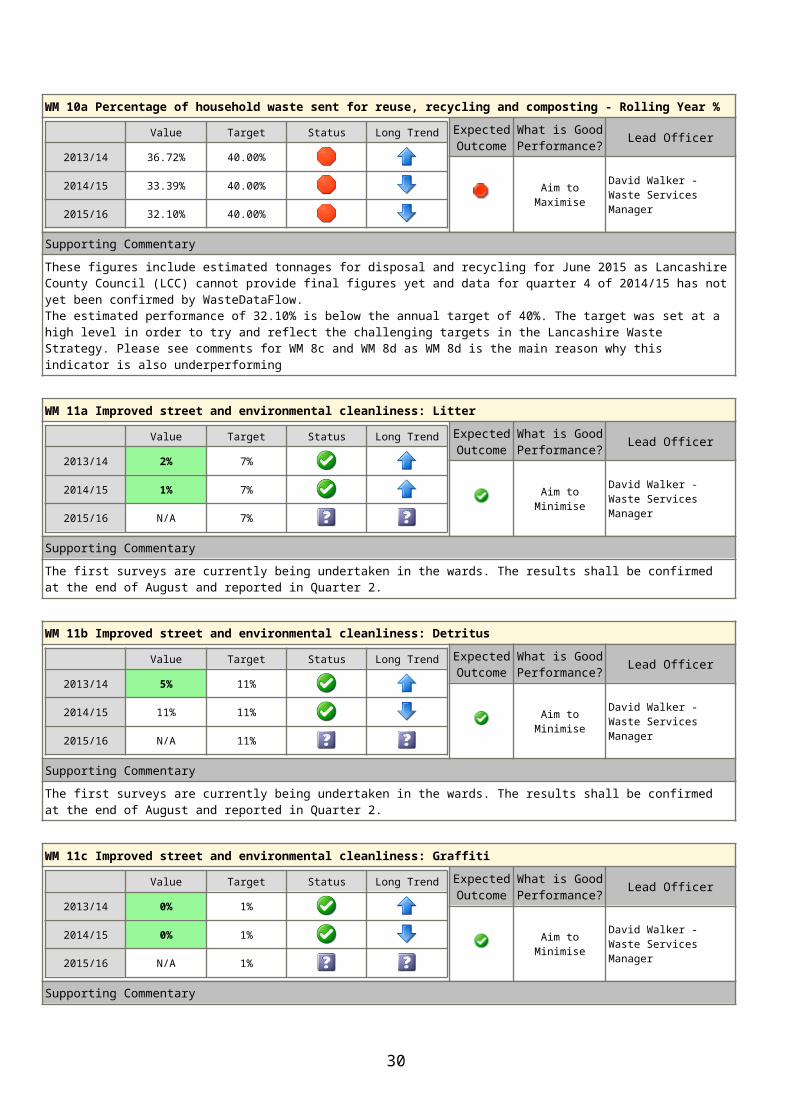
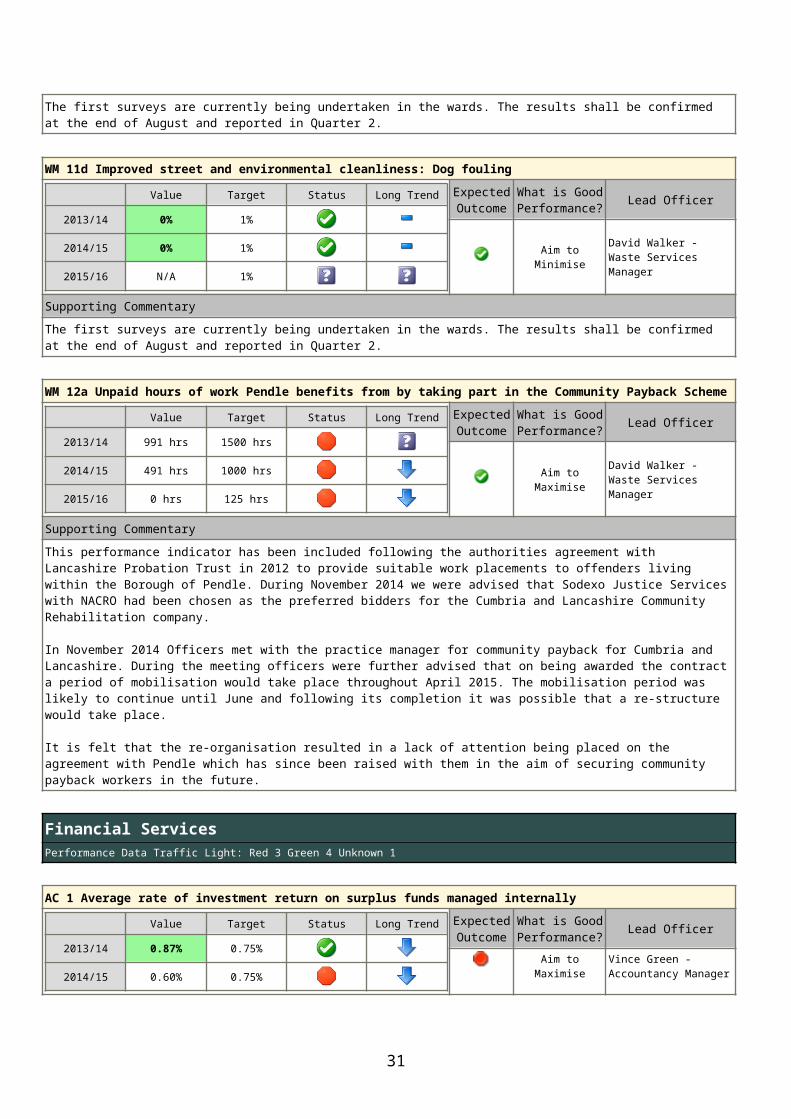
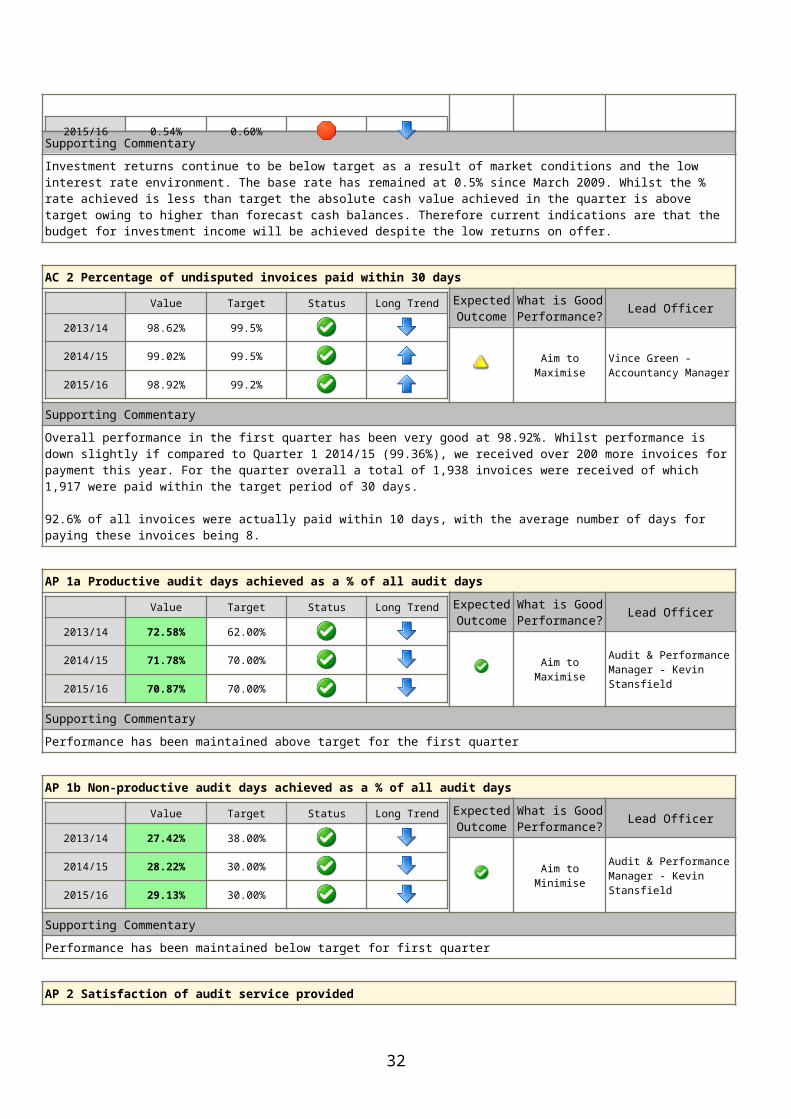
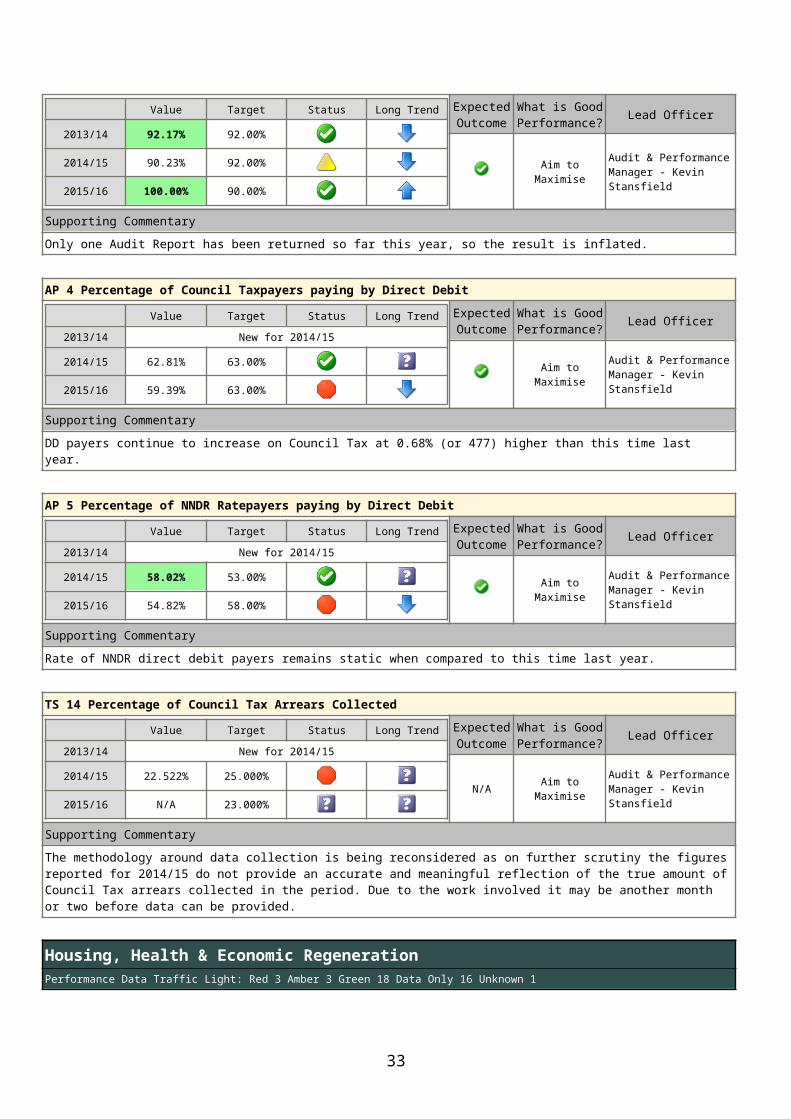
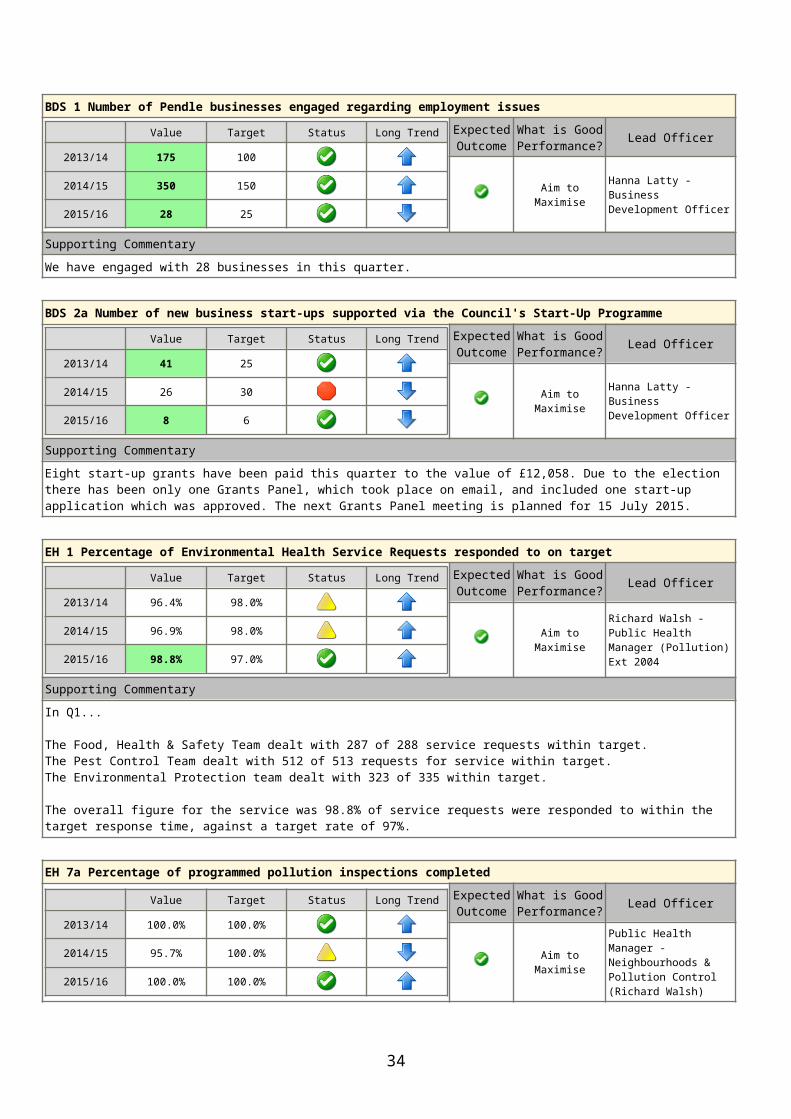
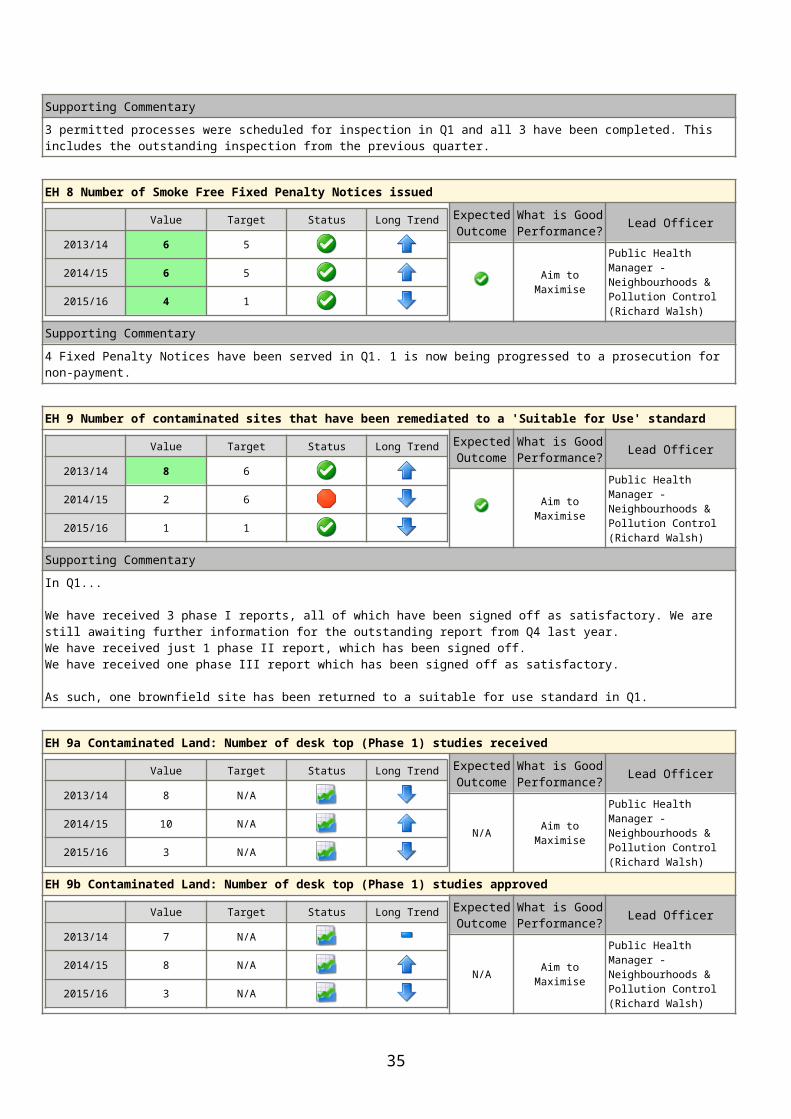
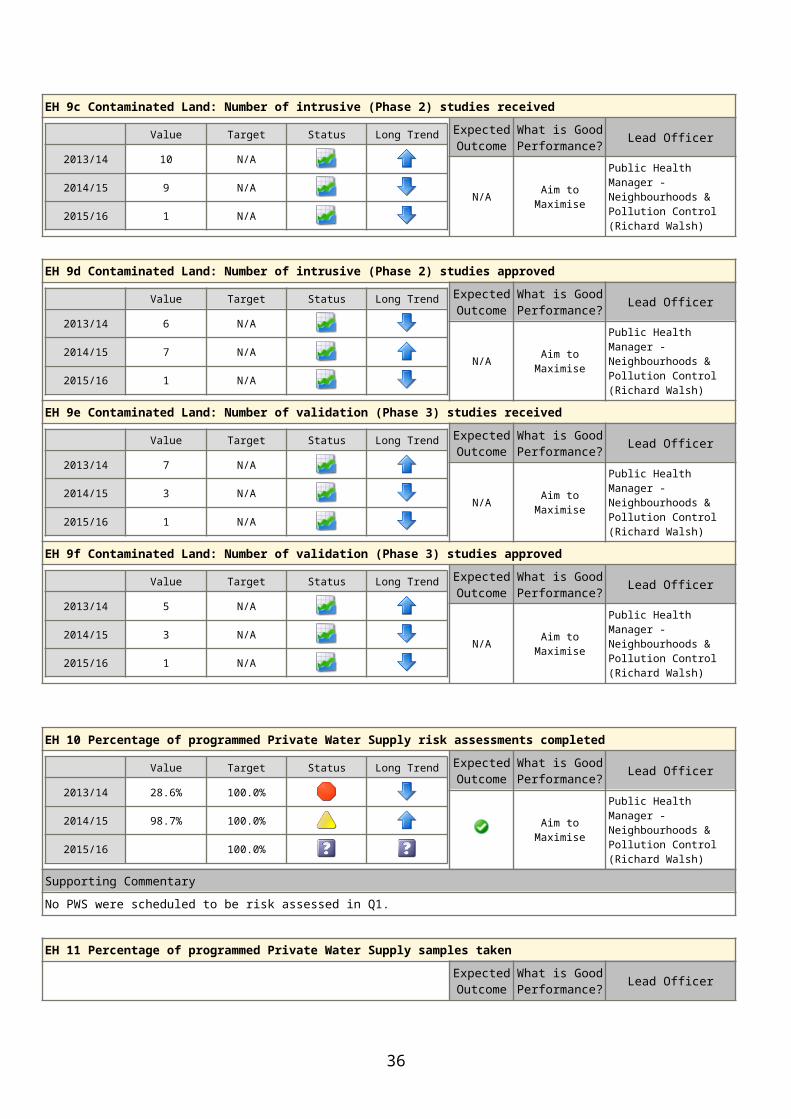
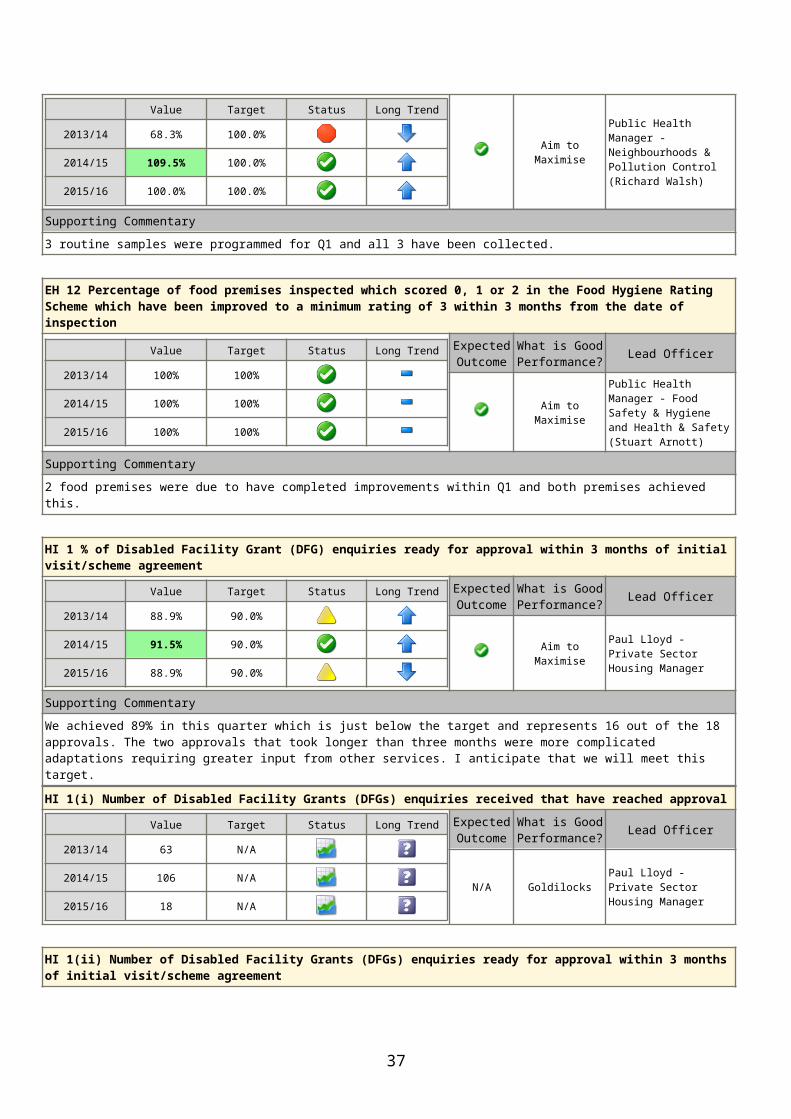
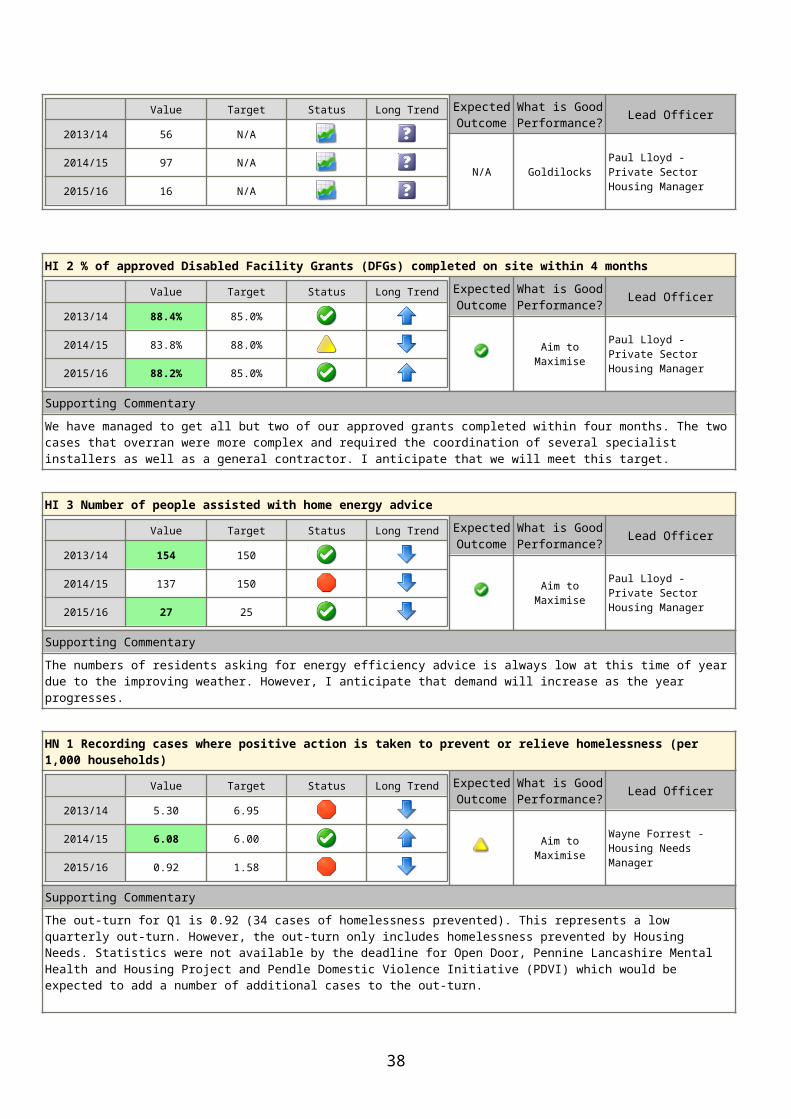
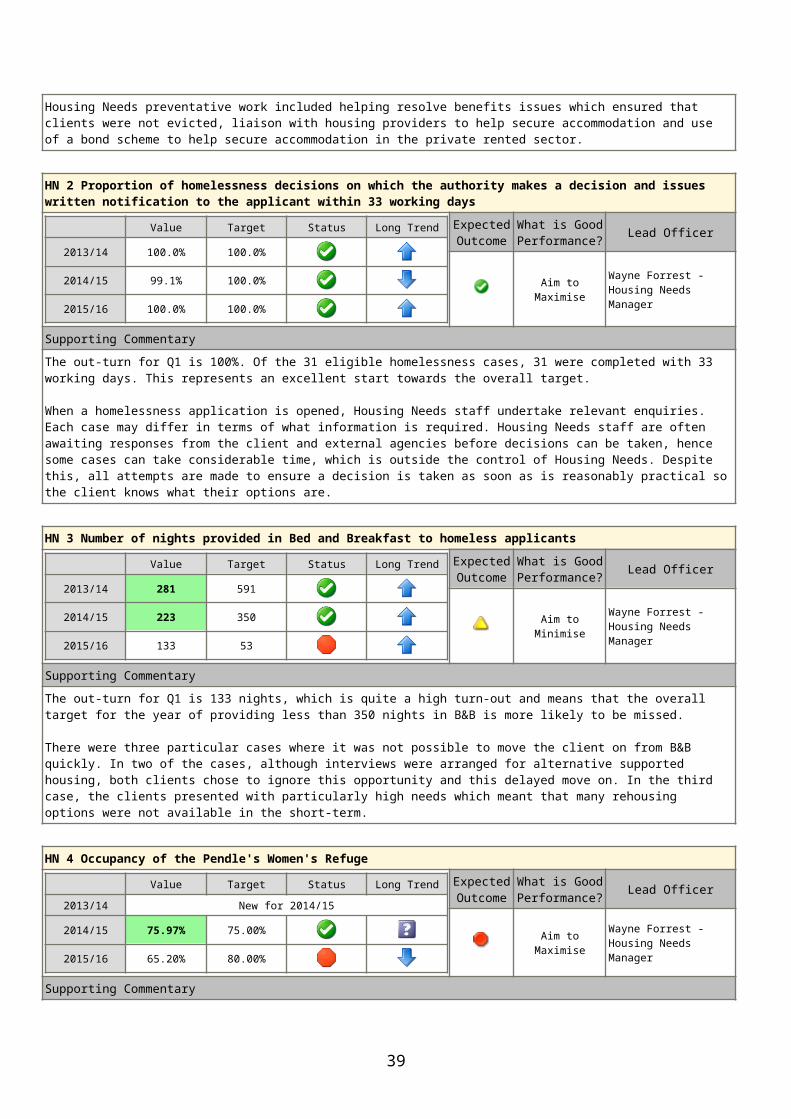
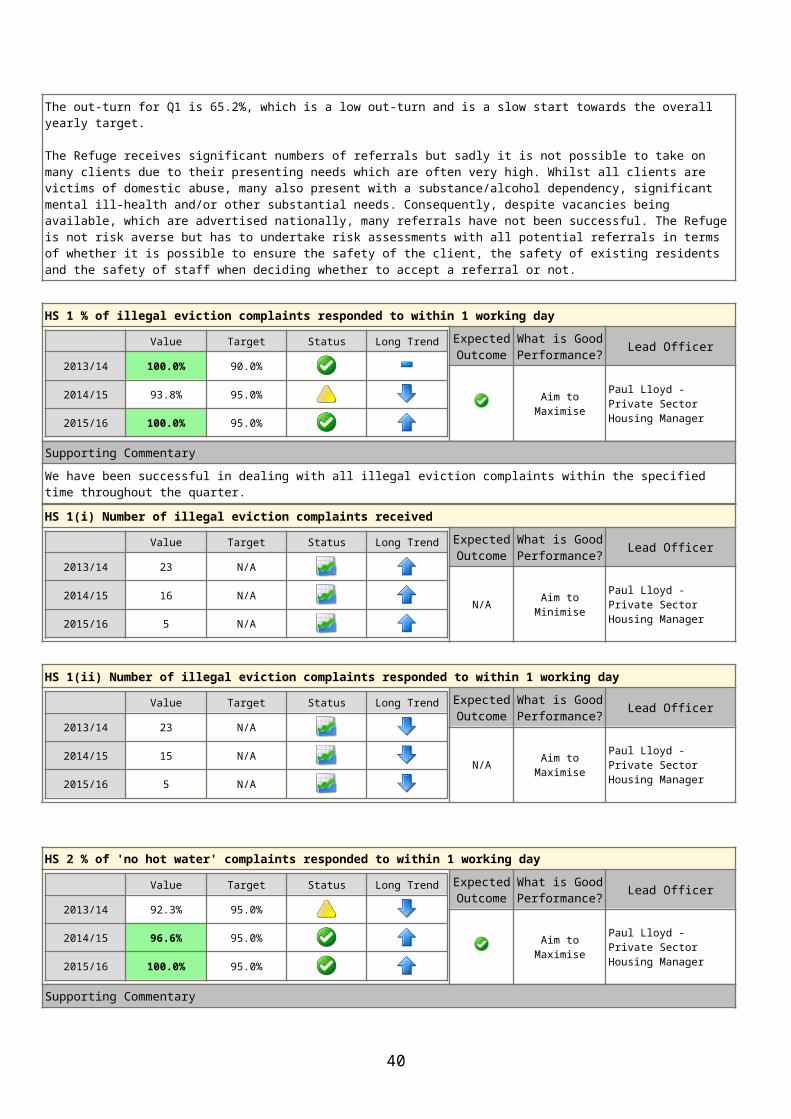
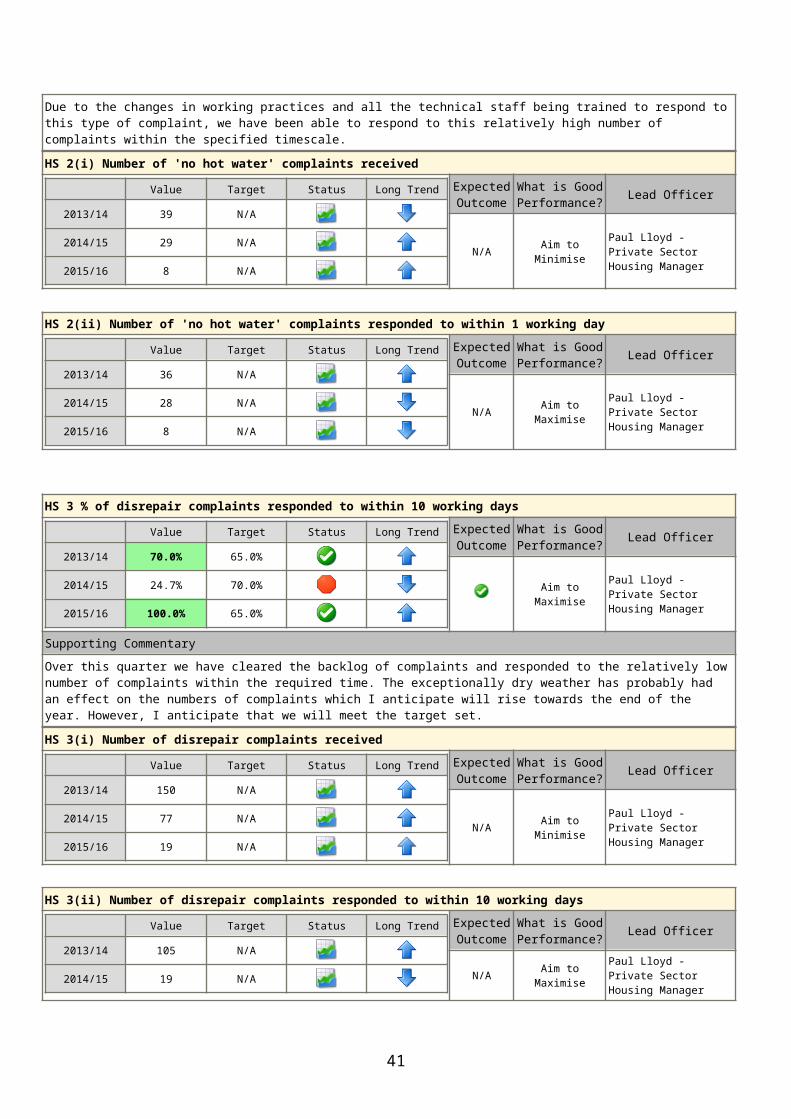
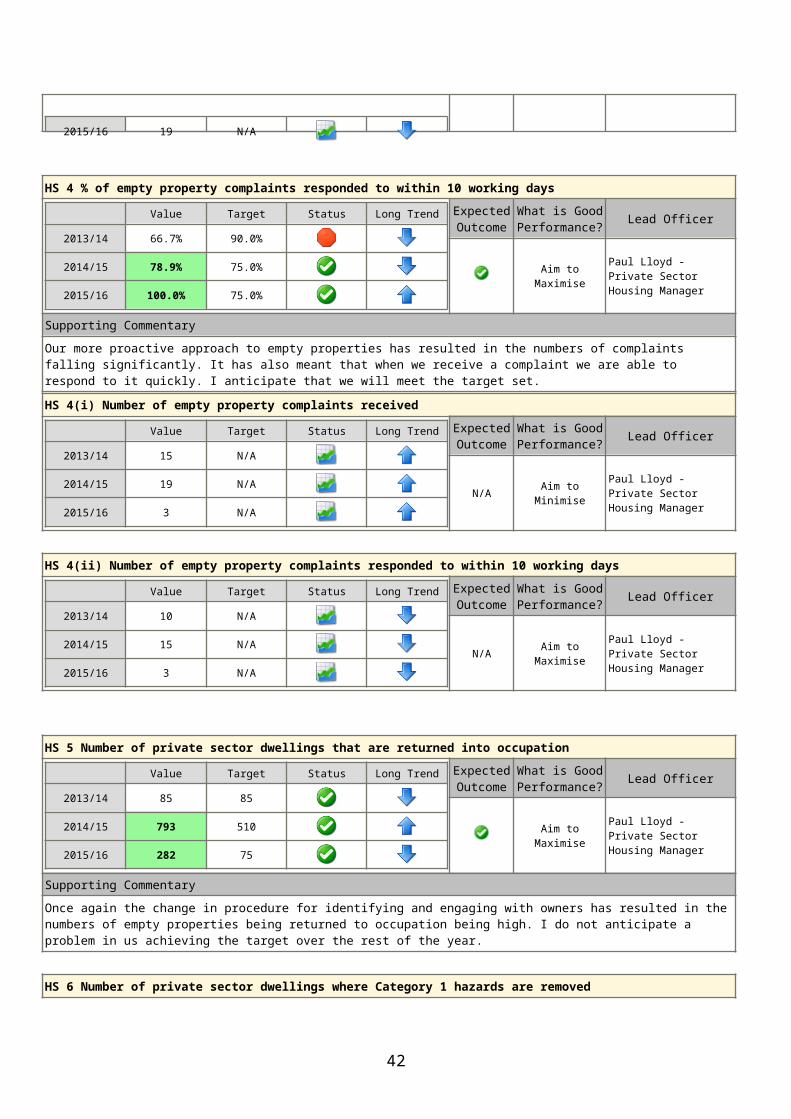
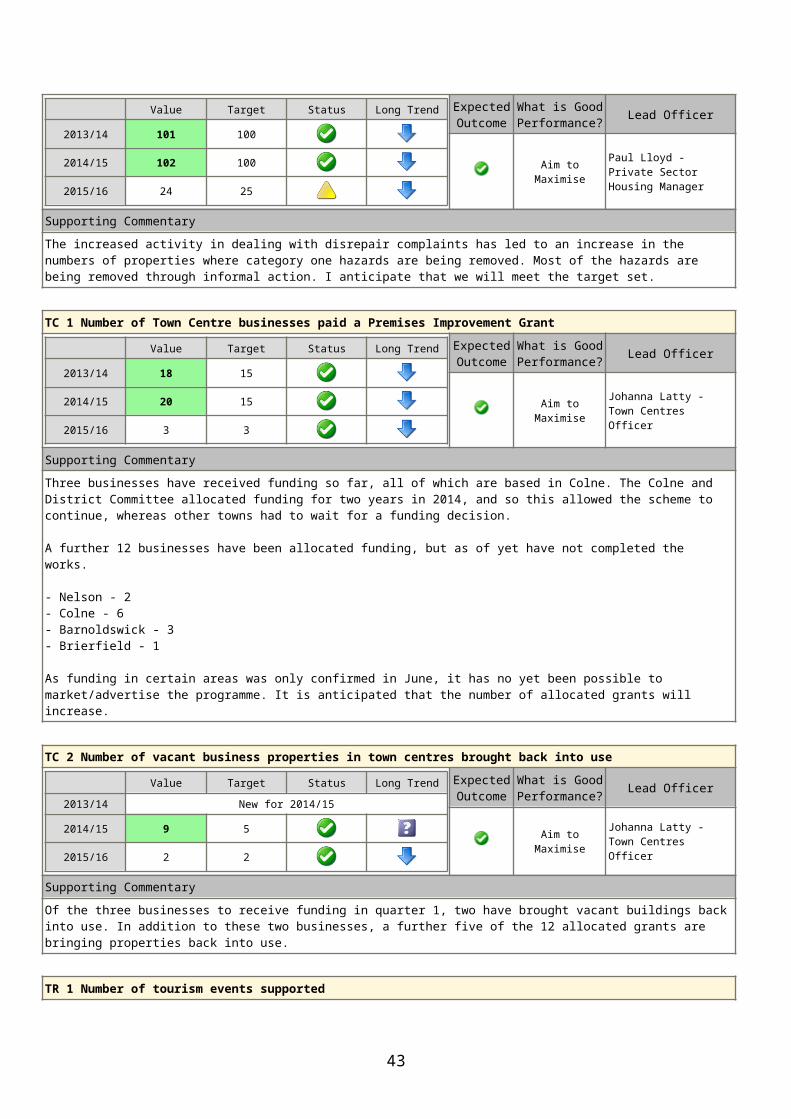
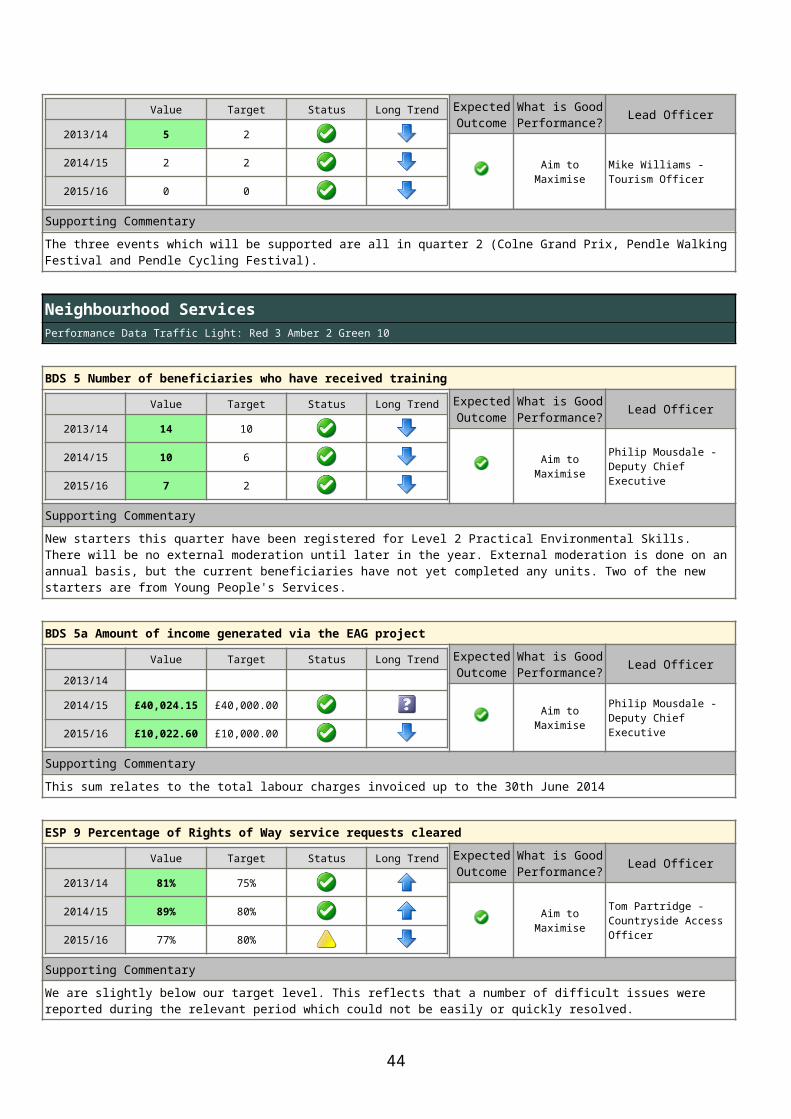
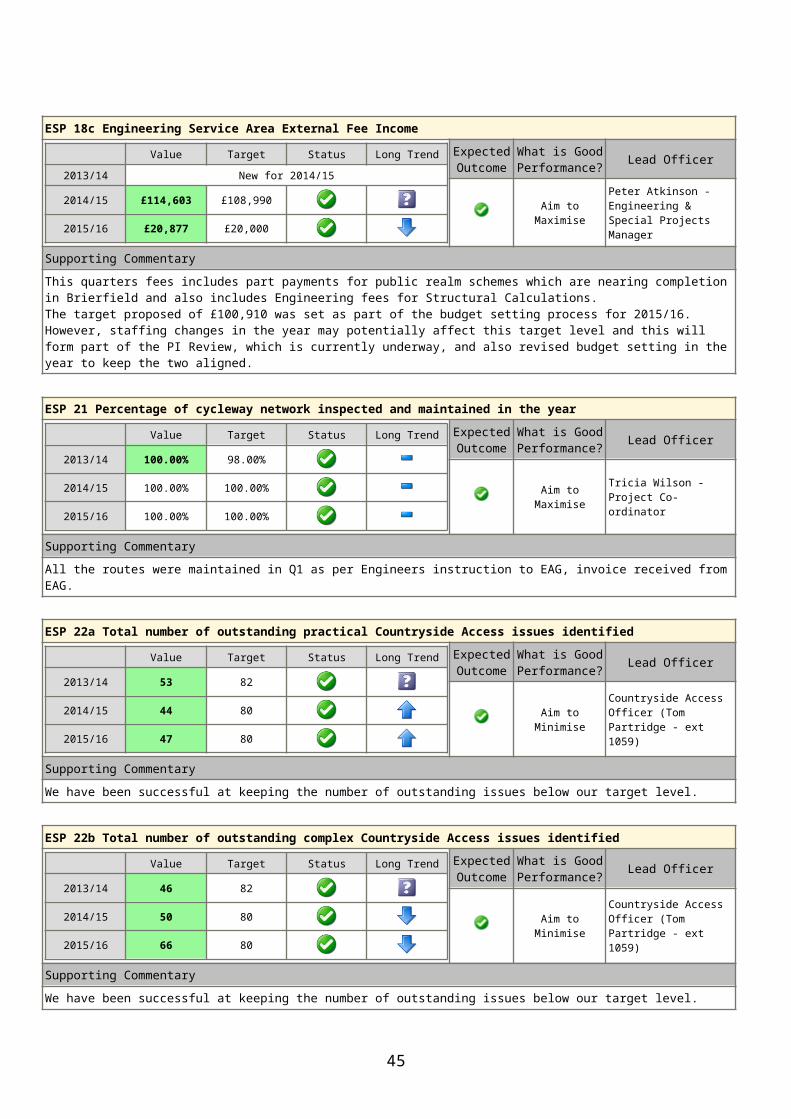
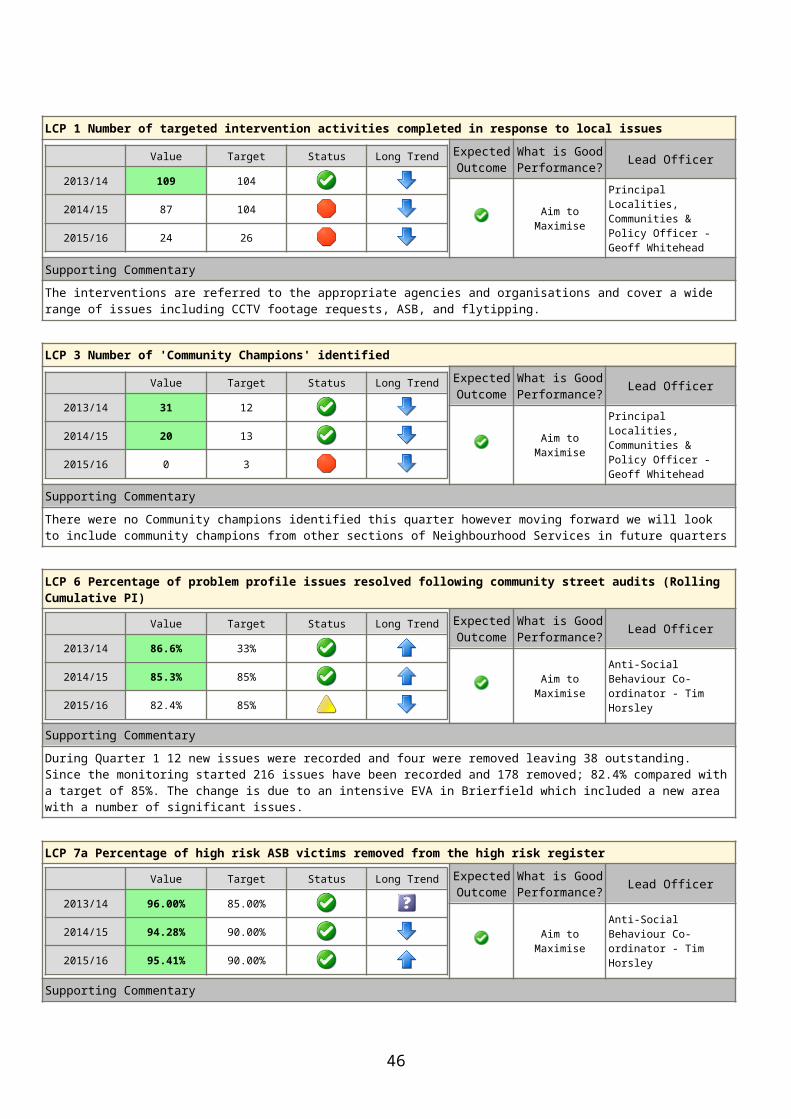
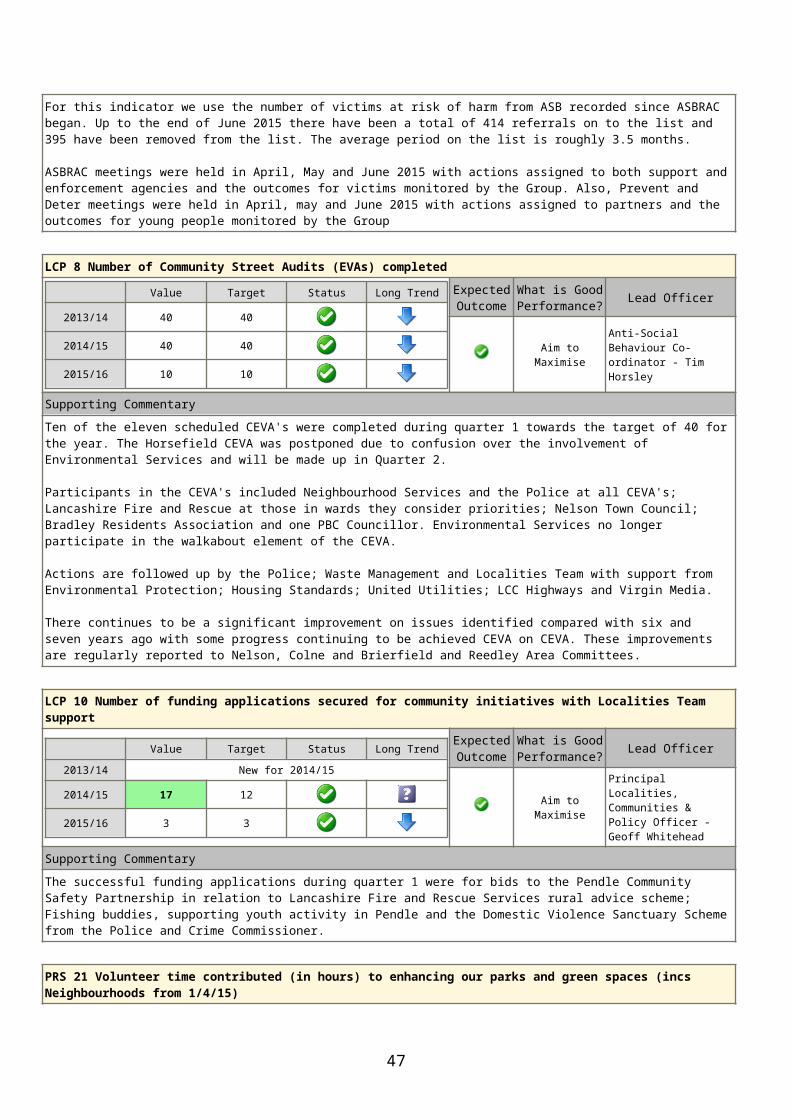
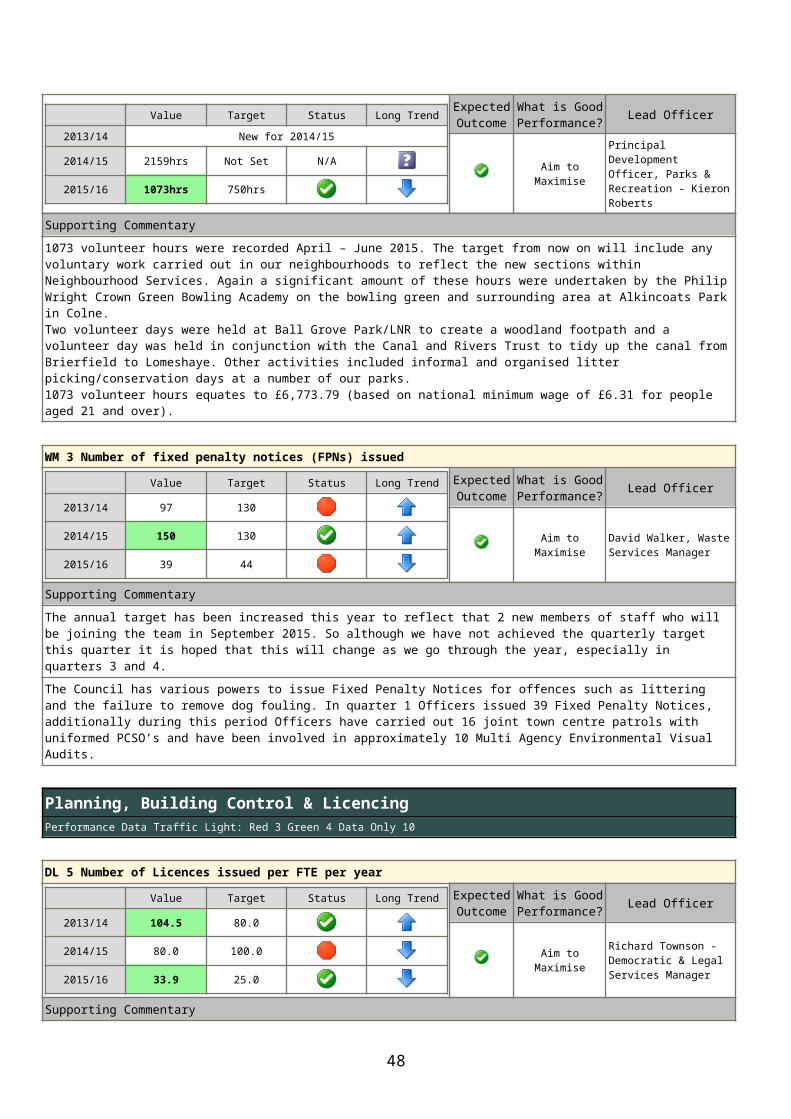
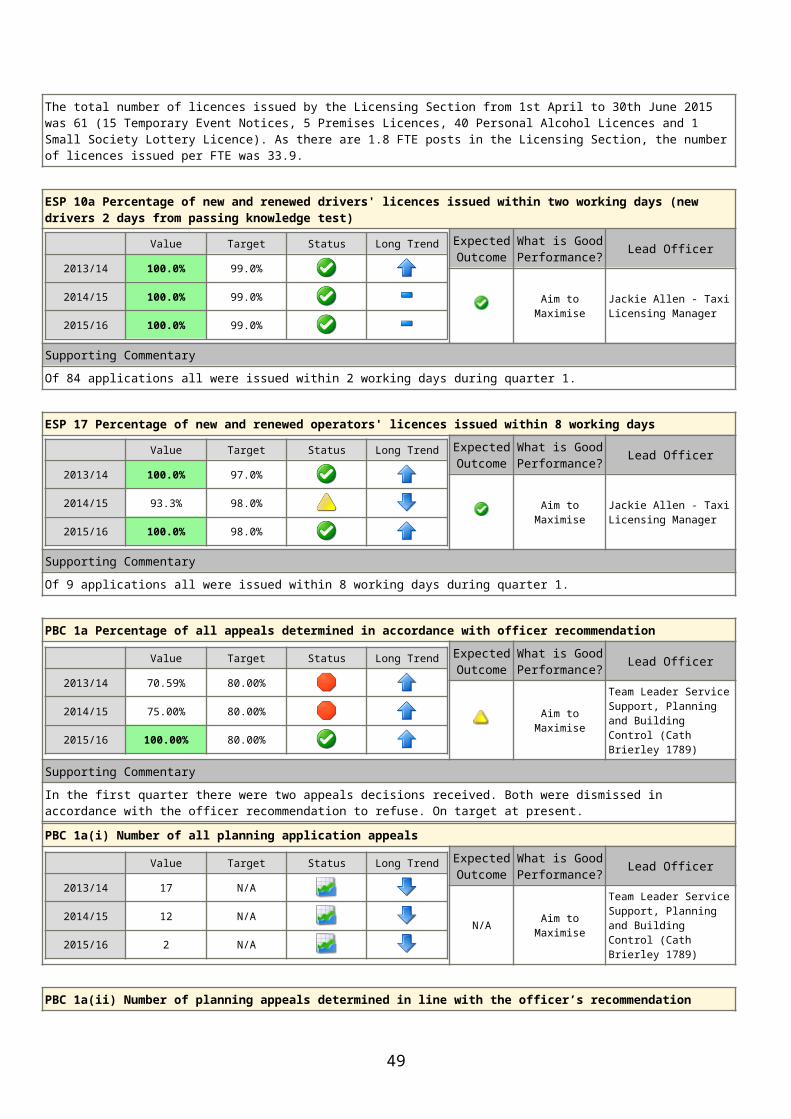
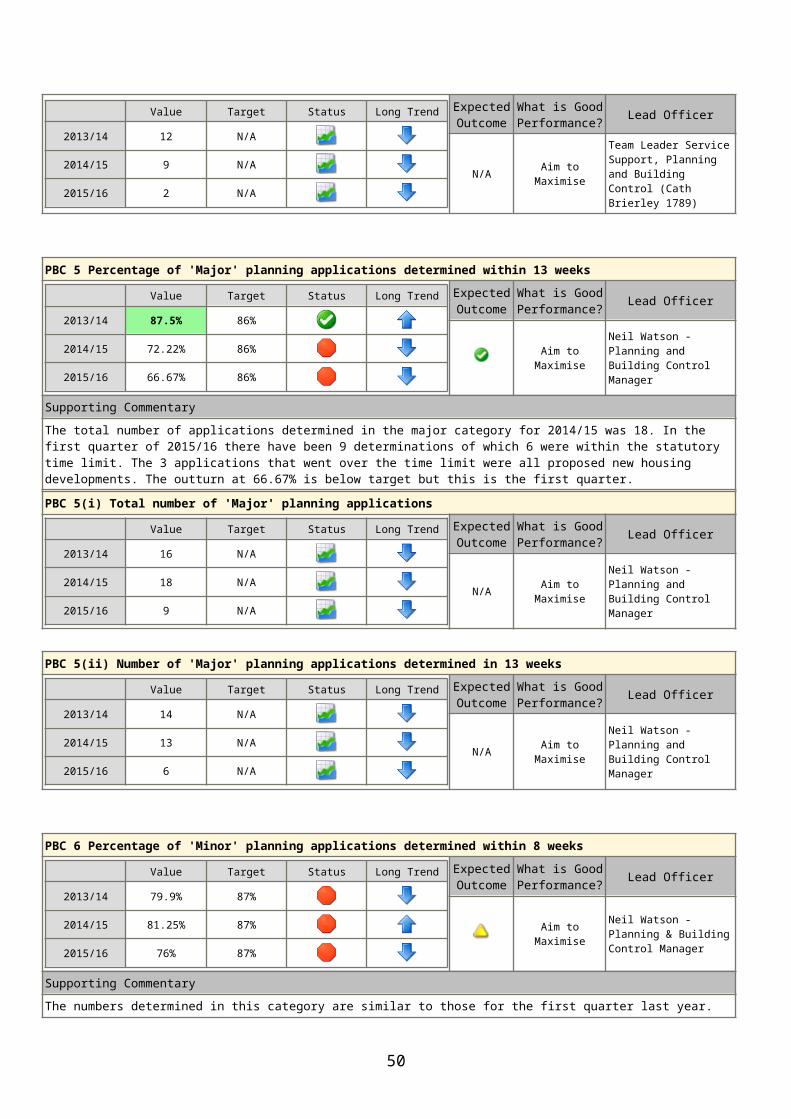
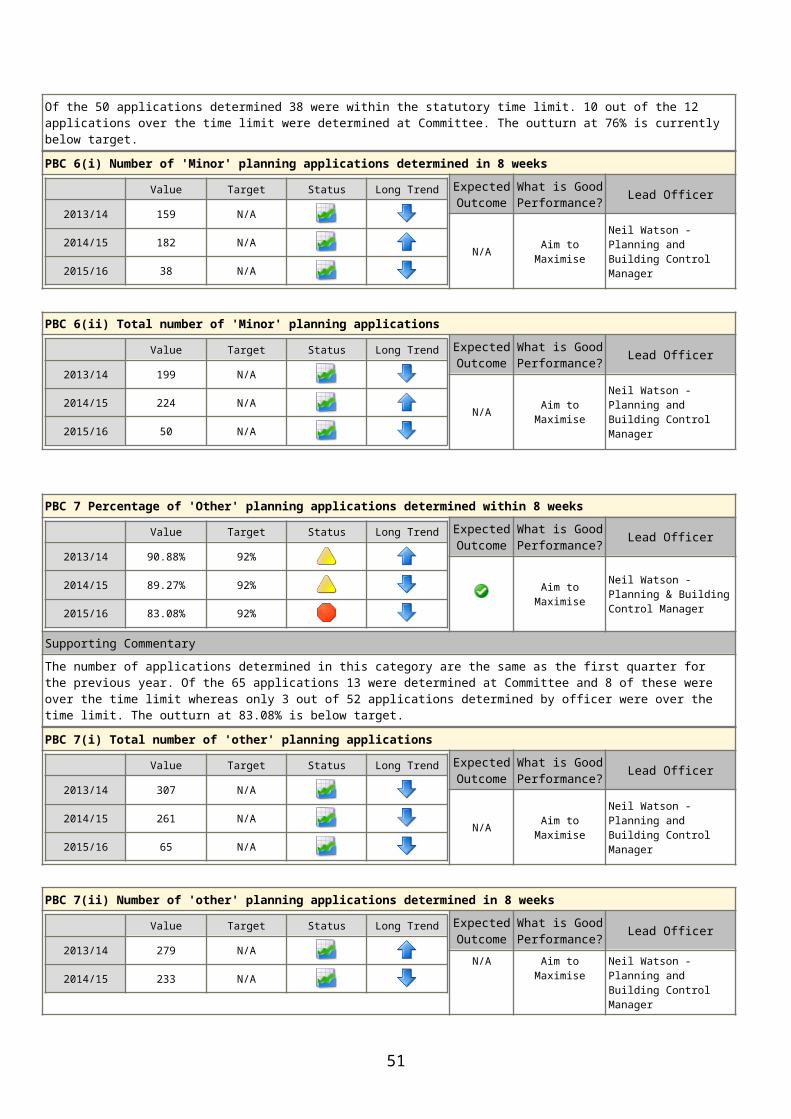
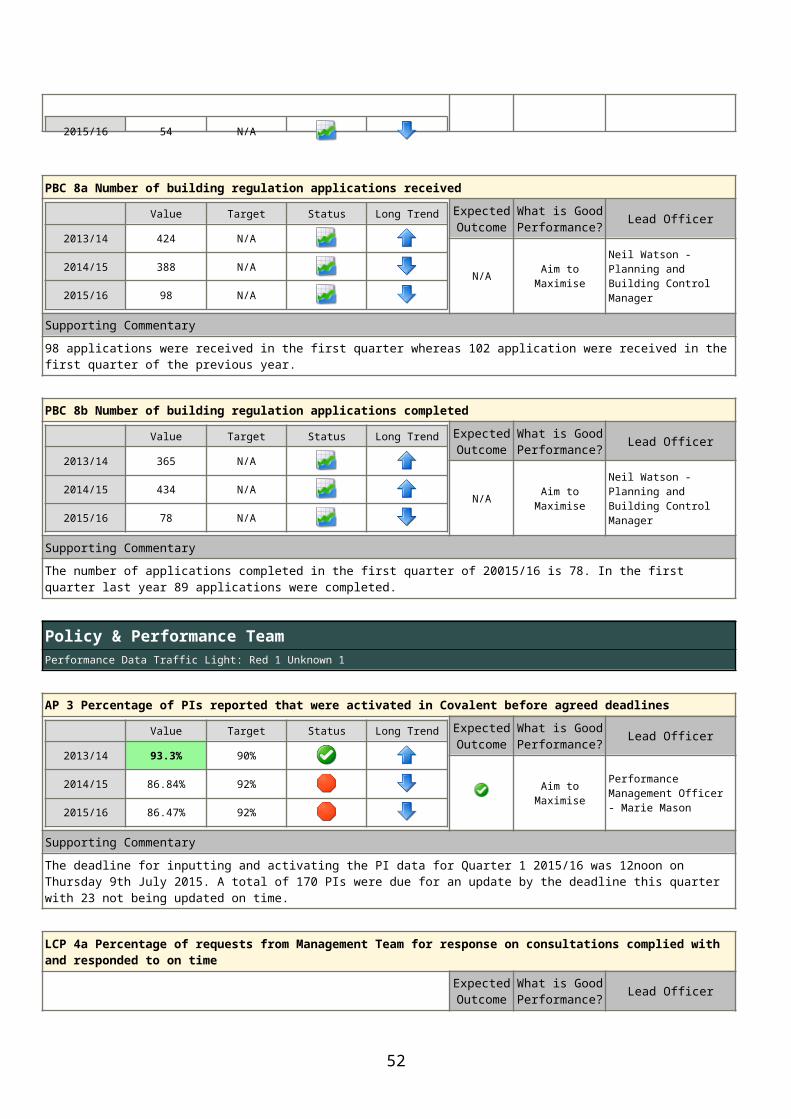

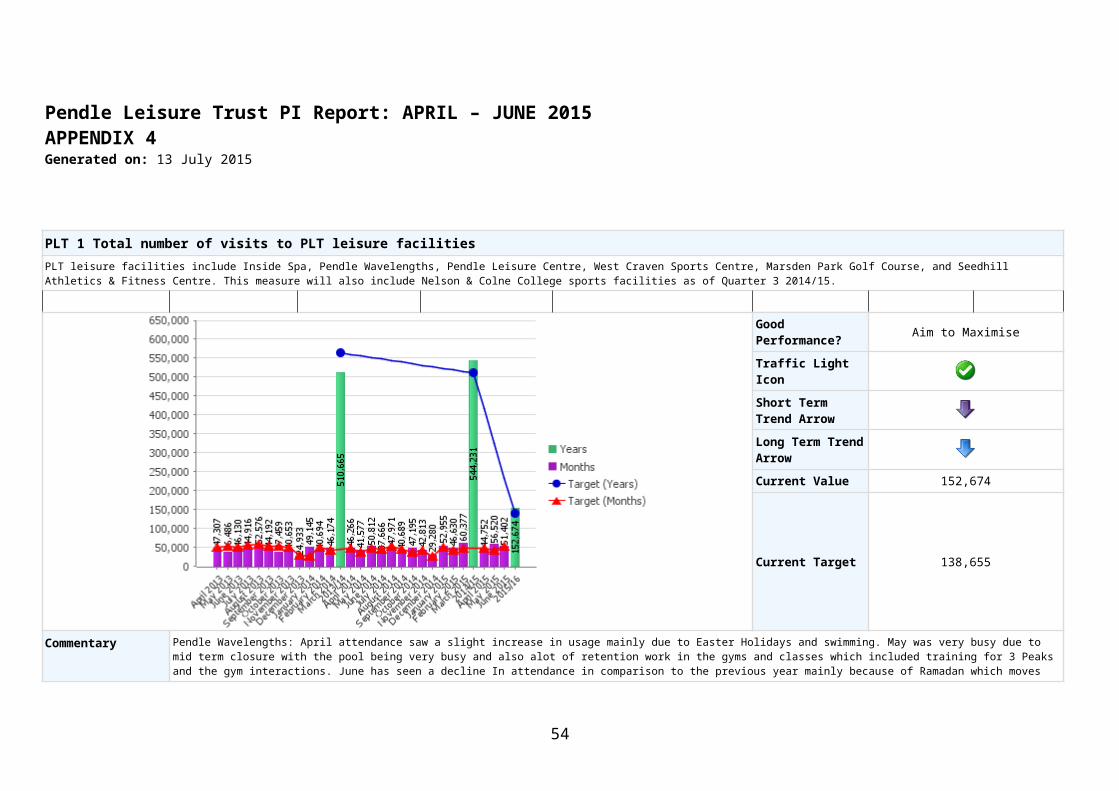
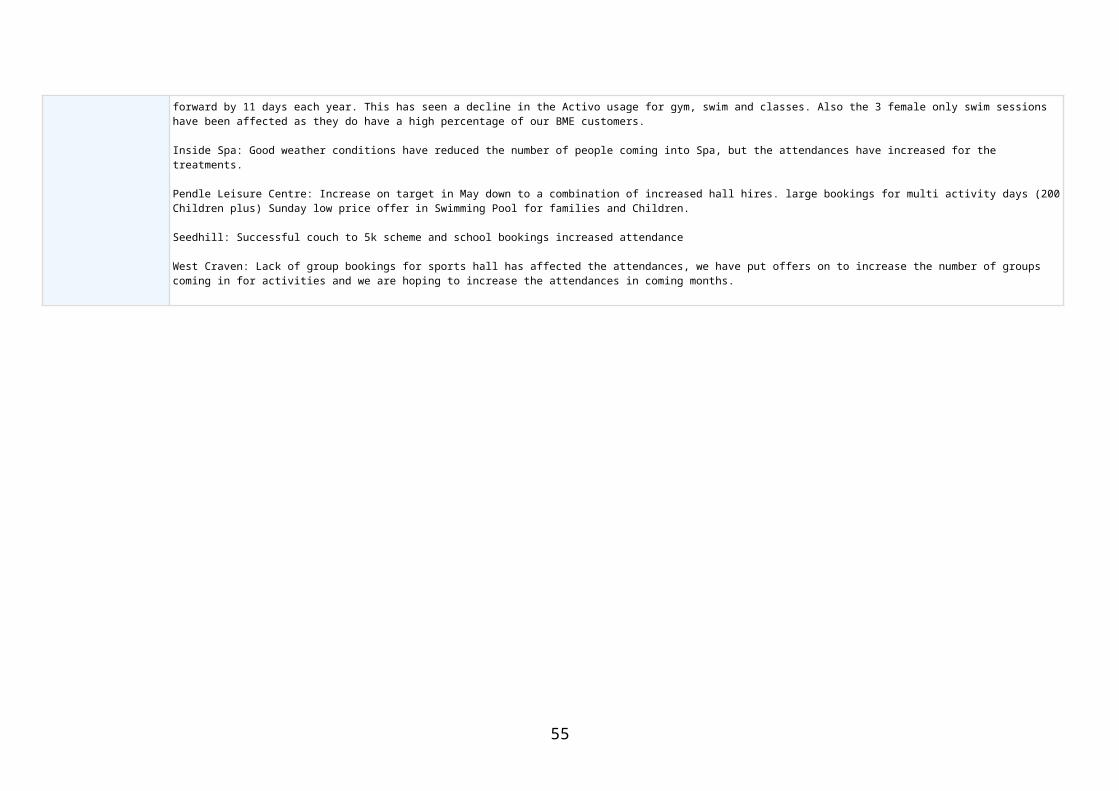
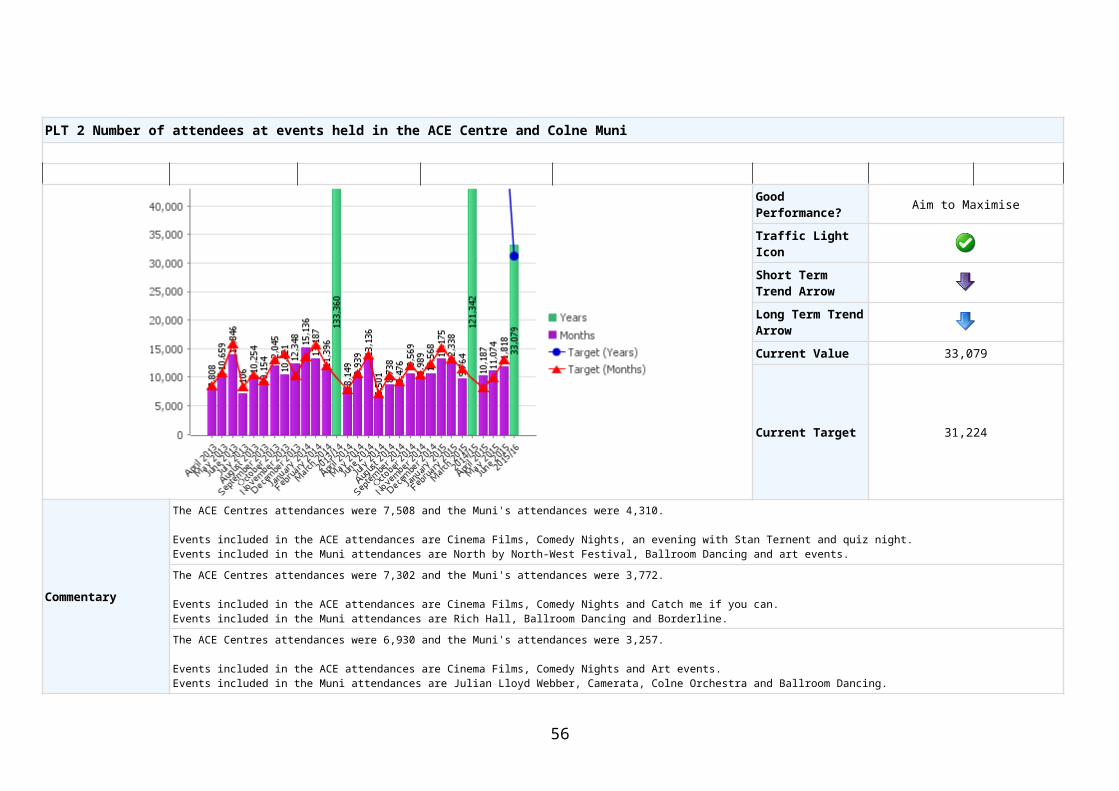

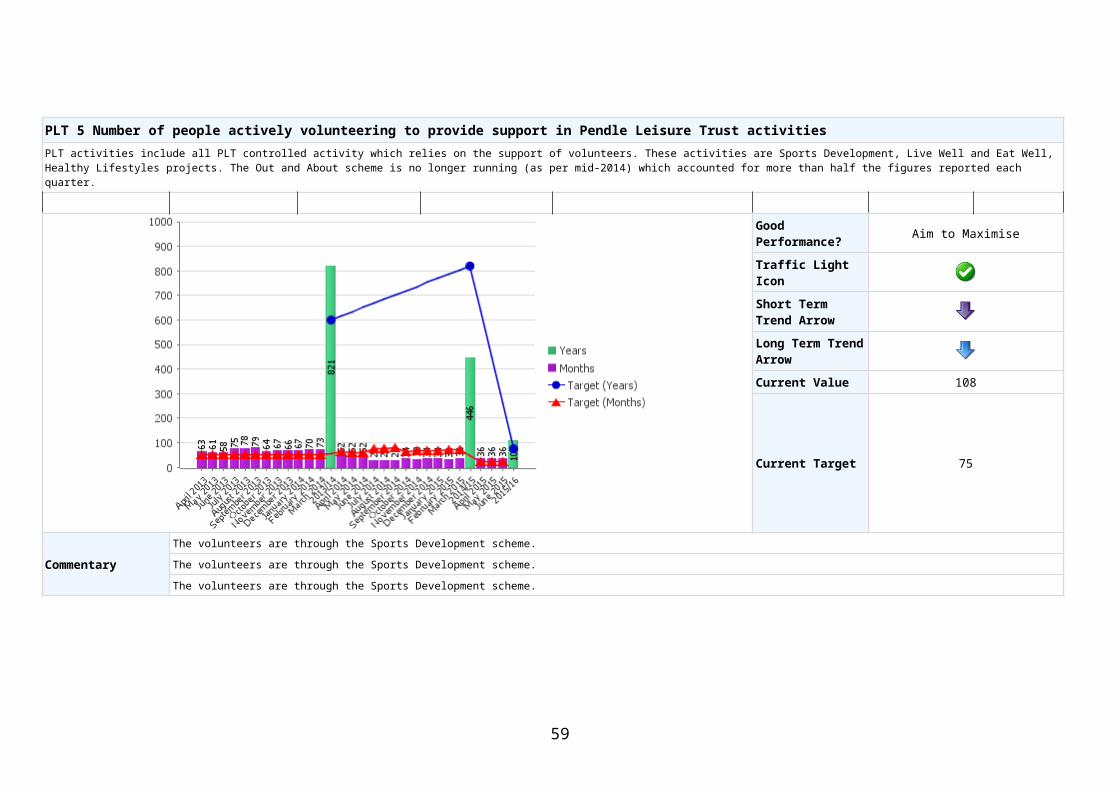
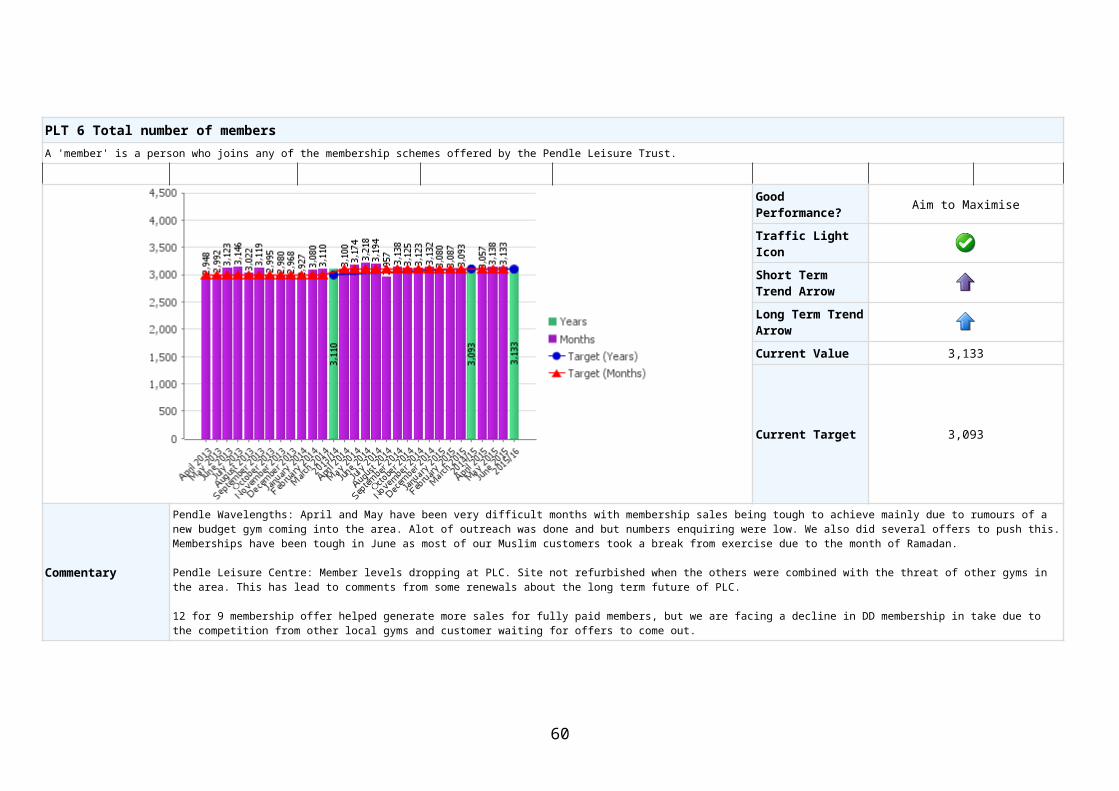
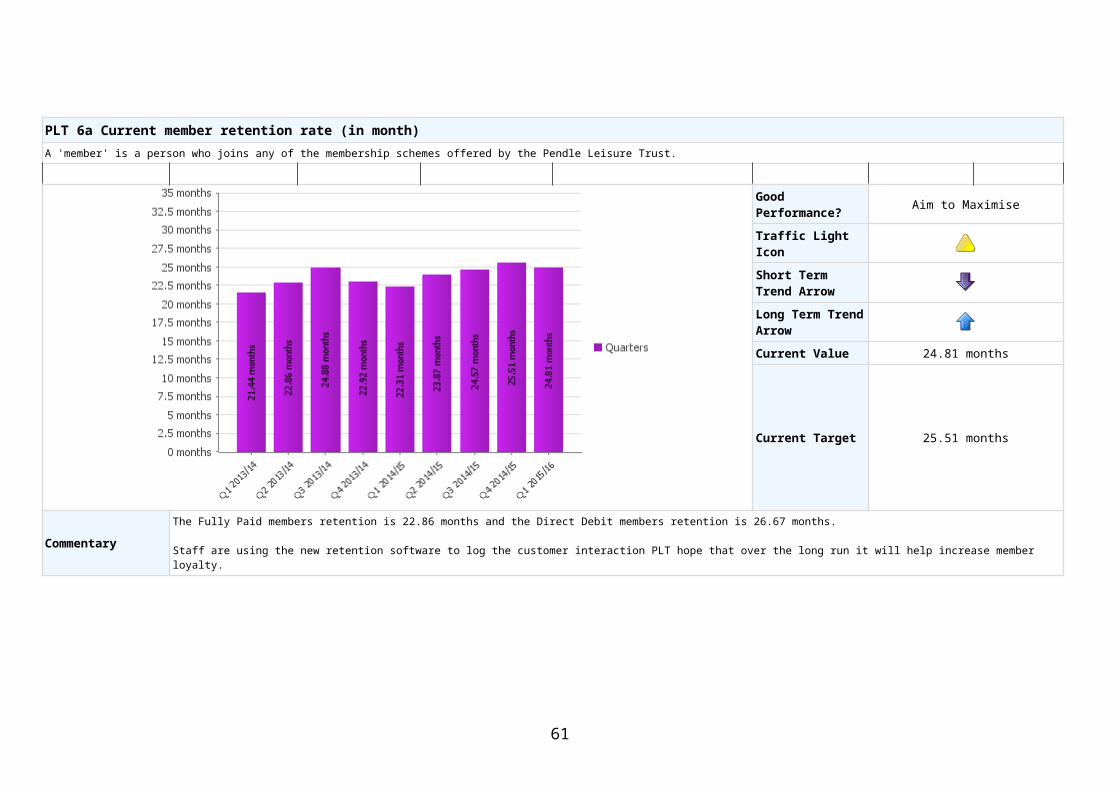
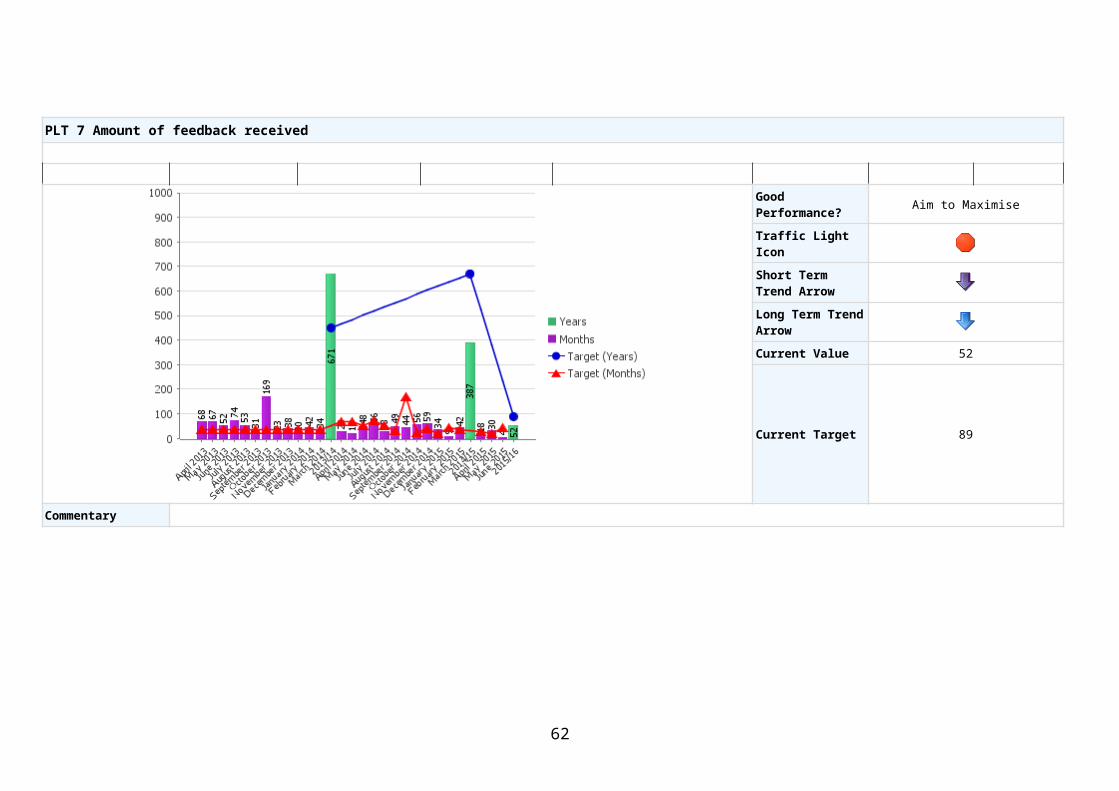
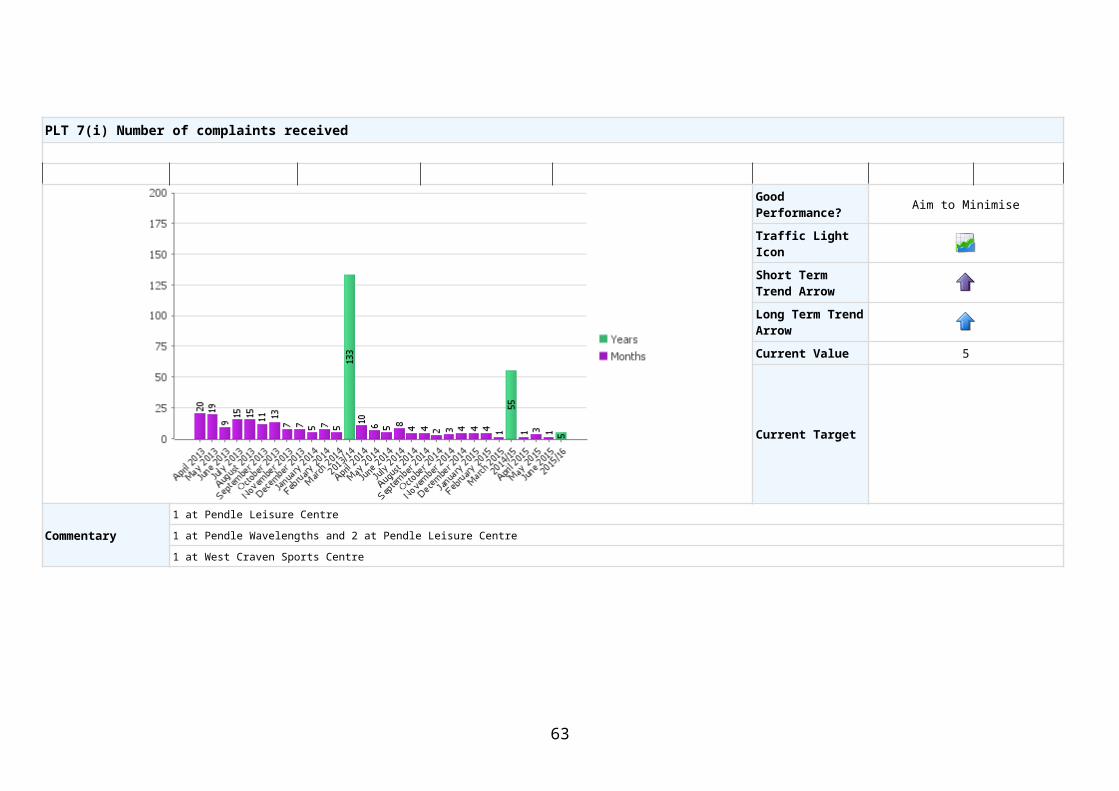
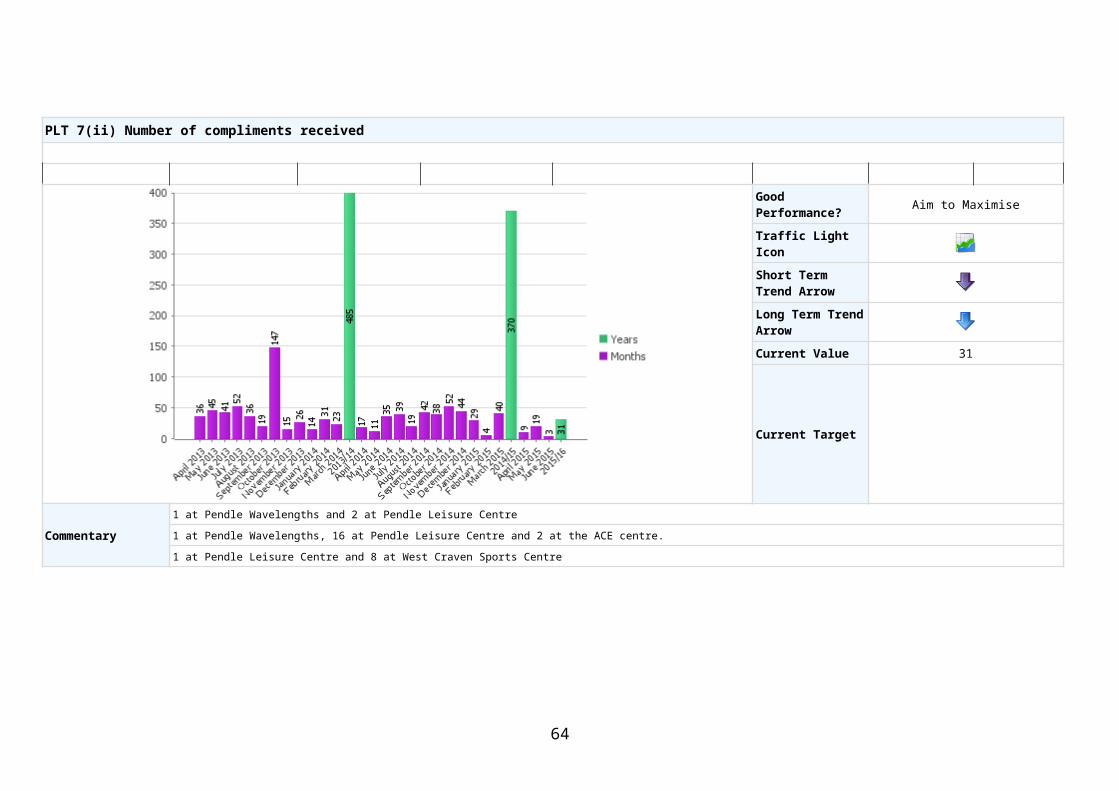
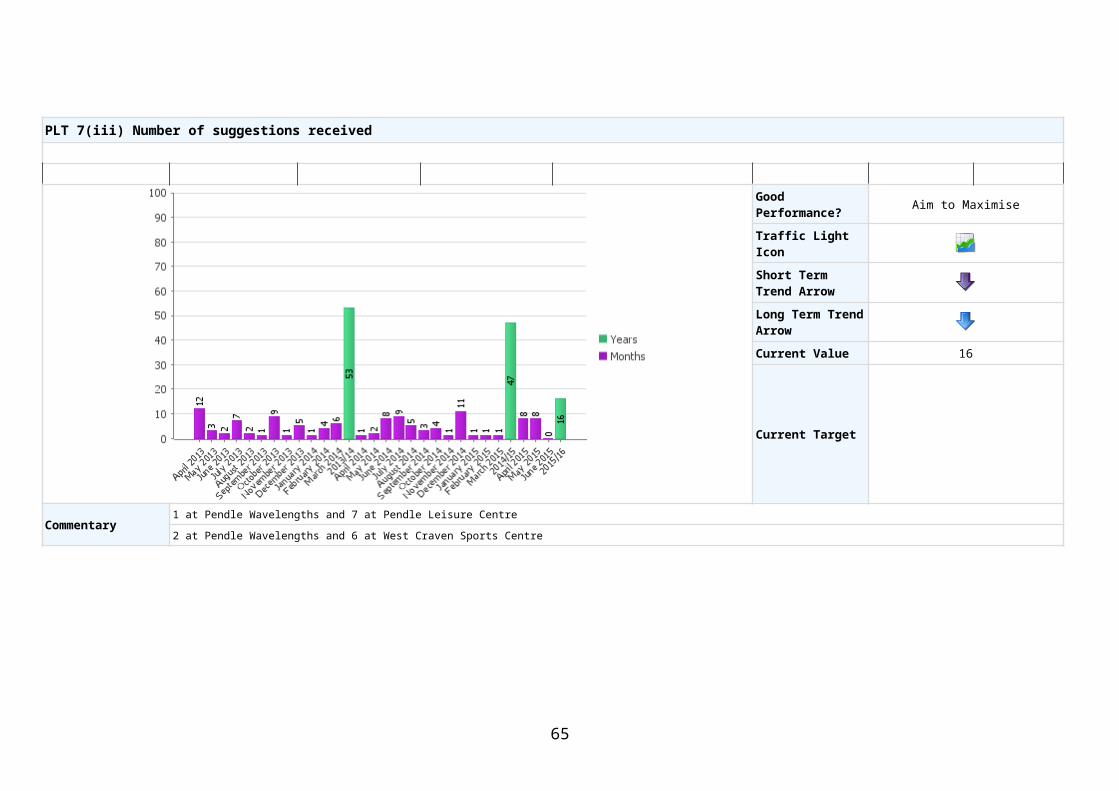
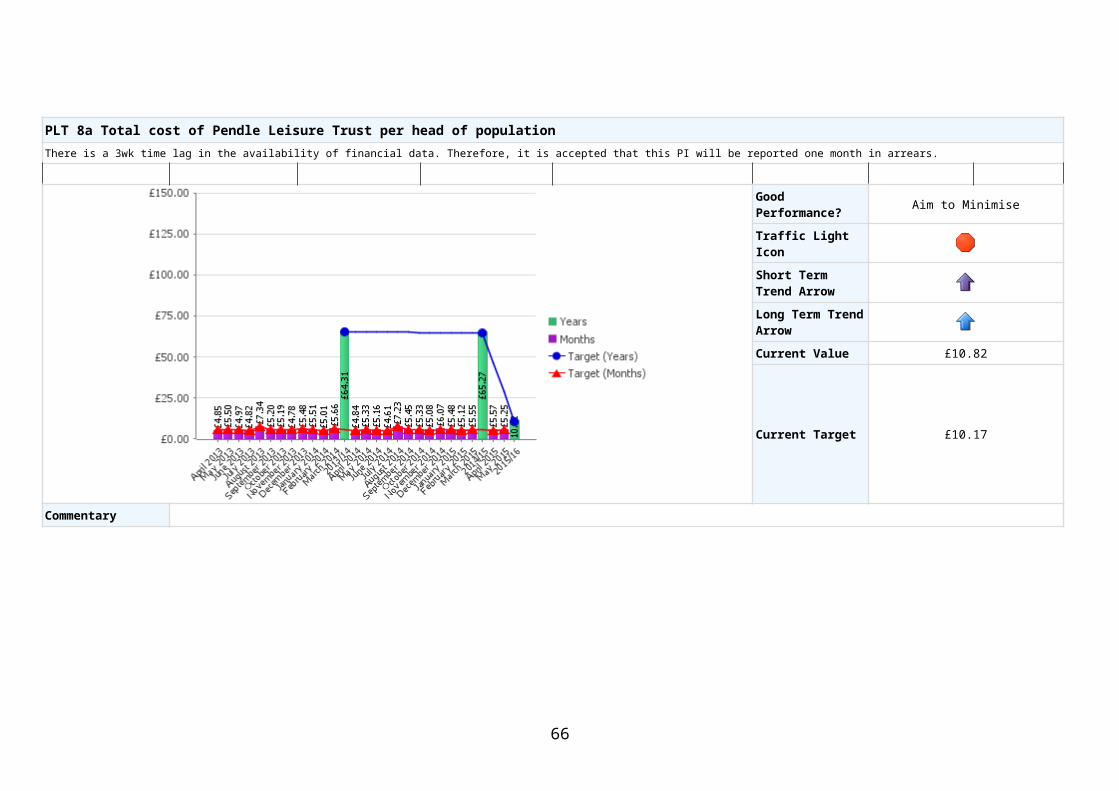
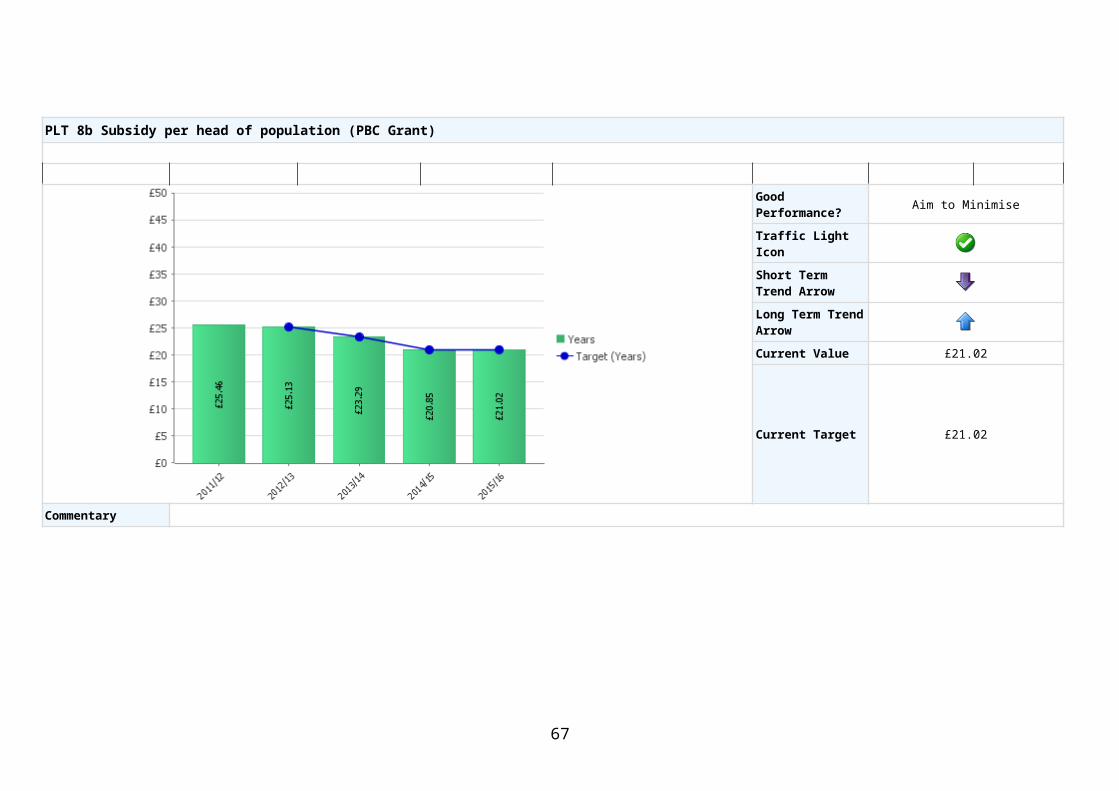
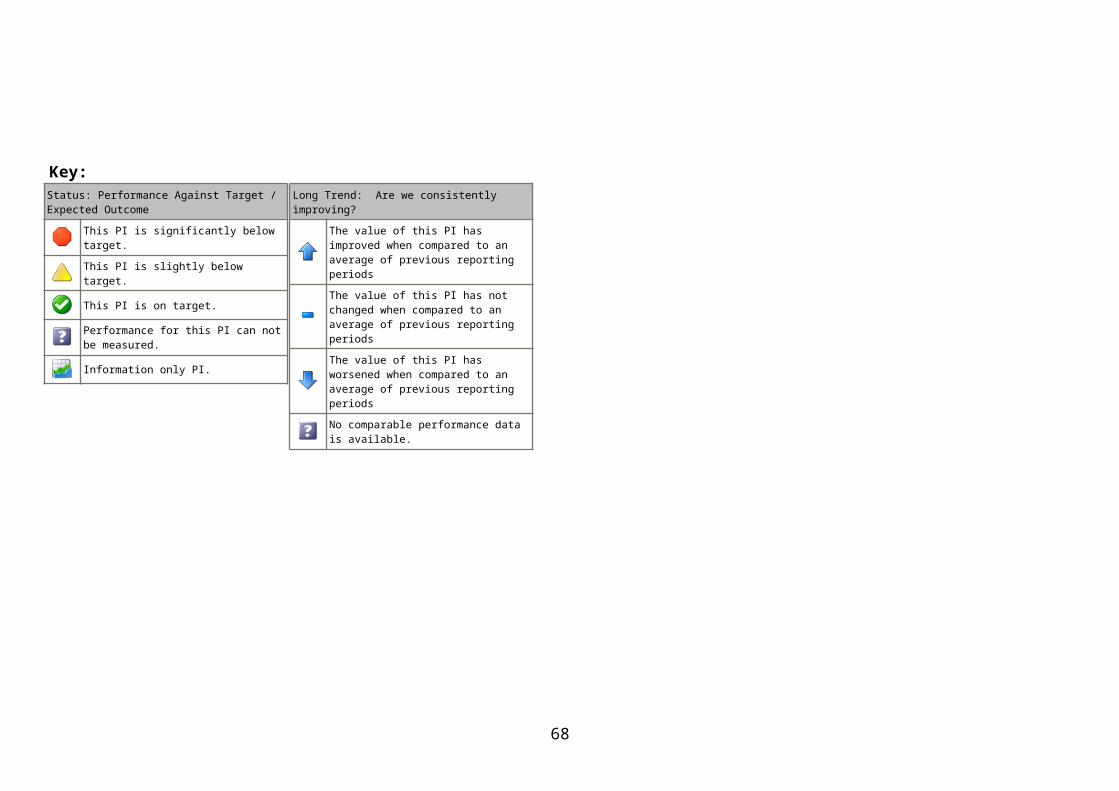

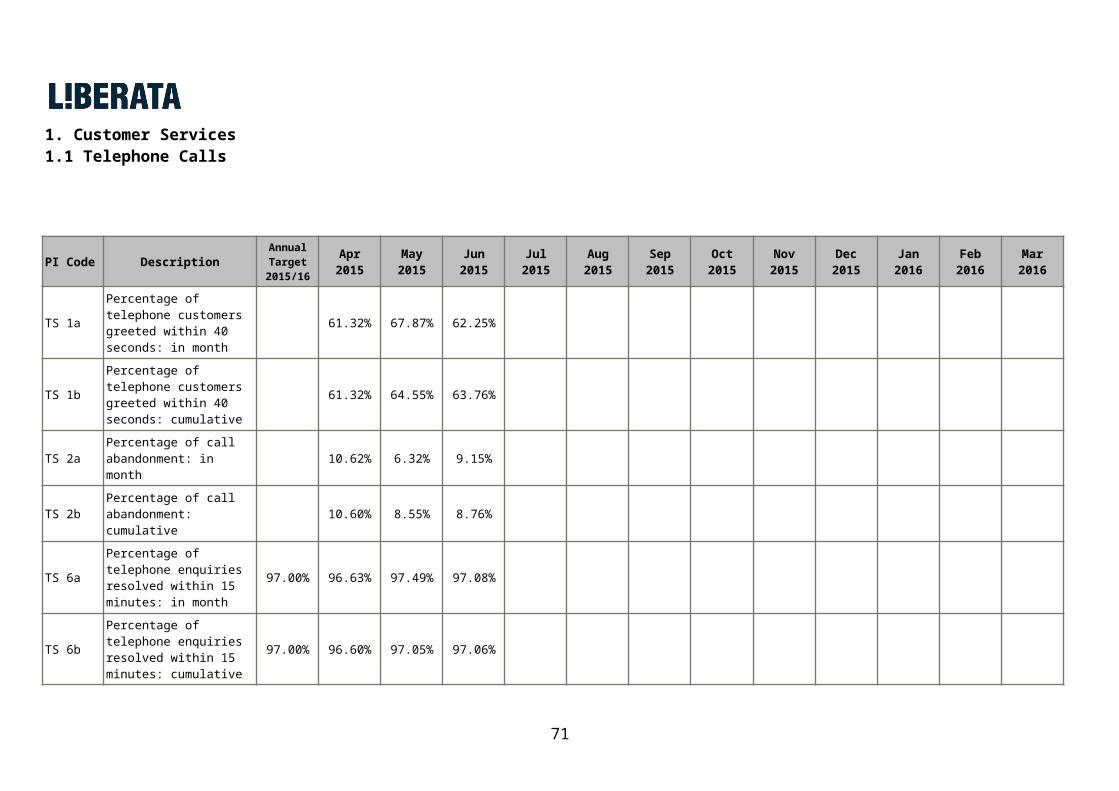

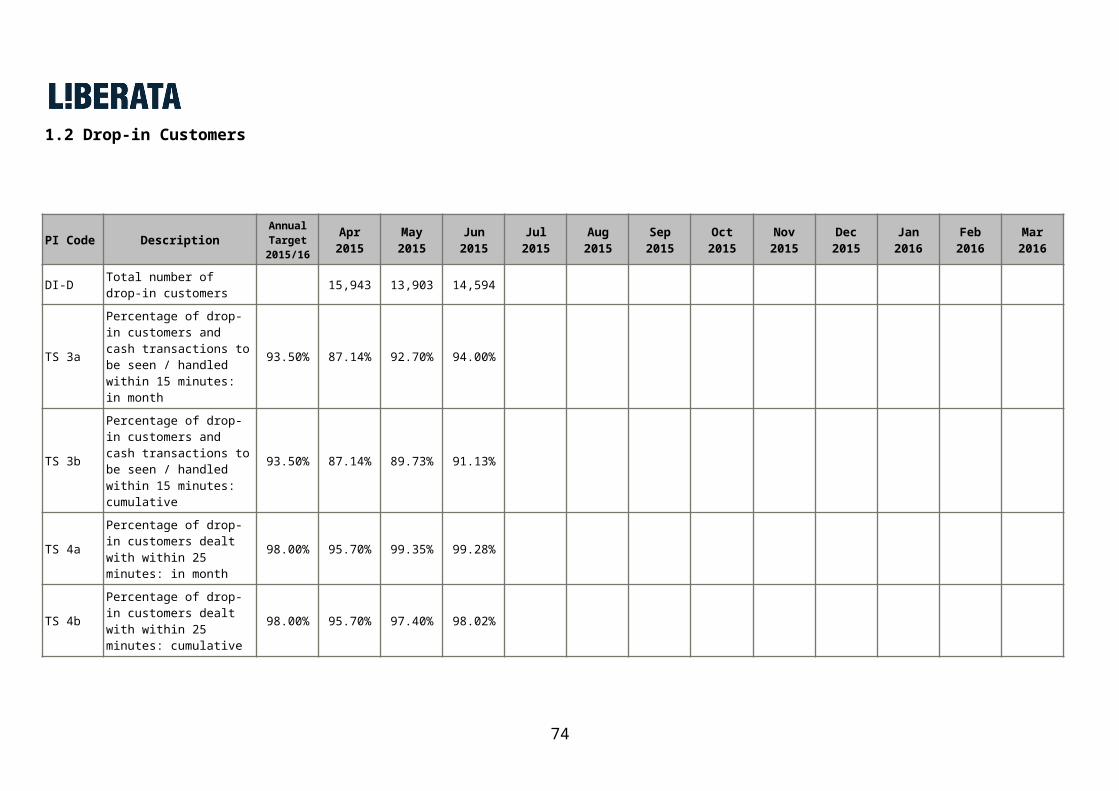


![MACROECONOMICS [Repaired]](https://static.documents.pub/doc/80x56/5881967f1a28ab0d358b69c5/macroeconomics-repaired.jpg)


![Fermilab_Presentation_Filis_Coba [Repaired]](https://static.documents.pub/doc/80x56/58a044de1a28ab39648b4da1/fermilabpresentationfiliscoba-repaired.jpg)
