155
An Investigation into the Reachability of Radio Frequency Identification (RFID) Technologies in Adverse Conditions

An Investigation into the
Reachability of Radio Frequency
Identification (RFID) Technologies
in Adverse Conditions
Christopher Laughlin (B00347135)
BSc. (Hons) Computer Science
Supervisor : Dr. Kevin Curran

University of Ulster

Acknowledgements
I would like to thank my project supervisor, Dr. Kevin Curran, for his support, advice and
guidance throughout the project’s development.
I would also like to thank my family and friends for their continued support over the course
of this project. I would also like to thank the Northern Ireland fire service for their time and
information.
3

Abbreviations
AC Alternating current
AIDC Automation Identification and Data Capture
CCTV Close Circuit Television
CGPM Coference Generate des Poids et Measures
CPS Cycles Per Second
GPS Global Positioning System
GSM Global System for Mobiles
HCI Human Computer Interaction
Hz Hertz
ID Identification
IEC International Electro technical Commission
IEEE Institute of Electrical and Electronic Engineers
RO Read Only
RW Read Write
RAM Random Access Memory
RS Recommended Standard
RFID Radio Frequency Identification
RF Radio Frequency
UML Unified Model Language
UK United Kingdom
WORM Write Once Read Many
4

WPAN Wireless Personal Area Network
ISO International Organisation for Standards
USB Universal Serial Bus
5
Table of Contents
Contents
Acknowledgements....................................................................................................................2
Abbreviations.............................................................................................................................3
Table of Contents.......................................................................................................................5
List of Figures............................................................................................................................9
List of Tables............................................................................................................................11
Abstract....................................................................................................................................12
1 Introduction.......................................................................................................................14
1.2 Aims............................................................................................................................16
2 Location Determination Technology...............................................................................19
2.1 RFID History...............................................................................................................19
2.2 GPS (Global Positioning System)...............................................................................22
2.3 Mobile Cellular Systems............................................................................................23
2.4 Bluetooth........................................................................................................................24
2.5 ZigBee............................................................................................................................25
2.6 Wi-Fi..............................................................................................................................25
2.7 Infrared...........................................................................................................................26
3 RFID Technology..............................................................................................................27
3.1 RFID Tags...................................................................................................................27
3.2 Antennas......................................................................................................................30
3.3 Readers.......................................................................................................................31
3.4 Operating Frequencies...................................................................................................36
3 .5 Reader and Tag Communication...................................................................................37
6

3 .6 Host and Software System............................................................................................38
3 .7 Standards.......................................................................................................................39
4 Requirements Specification and Analysis........................................................................41
4.1 Problem Specification................................................................................................41
4.2 Objectives of System..................................................................................................41
4.2.1 Fire Service scenario...............................................................................................42
4.2.2 Other Application....................................................................................................43
4.3 Design Methodology.................................................................................................43
4.3.2 Iterative / Incremental........................................................................................45
4.3.3 Design Methodology Selection...........................................................................45
4.4 Requirements Specification.......................................................................................46
4.4.1 Functional Requirements....................................................................................46
4.4.1.1 User....................................................................................................................46
4.4.1.2 System................................................................................................................46
4.4.2 Non-Functional Requirements............................................................................47
4.4.3 Software Requirements......................................................................................47
4.4.4 Hardware Requirements.....................................................................................48
5 Design Phase.....................................................................................................................49
5.1 Hardware Components...............................................................................................49
5.1.1 Laptop / Desktop Computer...............................................................................49
5.1.2 Trolley Scan RFID-Radar system....................................................................50
5.2 Software Components................................................................................................51
5.2.1 Microsoft Visual Studio 2008.............................................................................51
5.3 Design considerations....................................................................................................51
5.3.1 User Interface..........................................................................................................52
5.4 HCI Considerations........................................................................................................54
7

5.6 User Cases......................................................................................................................55
5.7 State Diagrams...............................................................................................................59
6 Implementation.................................................................................................................61
6.1 Equipment Connection...................................................................................................61
6.2 Testing............................................................................................................................63
6.3 Scenario Solution Application.......................................................................................67
6.3.1 Program GUI...........................................................................................................67
6.4 Database.........................................................................................................................71
6.4.1 Engine Table...........................................................................................................71
6.4.2 Equipment Table.....................................................................................................72
6.4.3 Station Table...........................................................................................................73
6.4.4 UserDetails Table....................................................................................................74
7 Testing................................................................................................................................76
7.1 Test cases.......................................................................................................................76
7.1.1 Test Case 4 Active and Passive...............................................................................76
7.1.3 Test Case 10 Active /Passive..................................................................................79
7.1.4 Test Case 16.00 – 16.02 Active and Passive...........................................................79
8 Evaluation.........................................................................................................................81
8.1 RFID and its environment..............................................................................................81
8.2 Proposed System Requirements.................................................................................83
8.3 Future Work...............................................................................................................85
9 Conclusion.........................................................................................................................87
10 References.......................................................................................................................89
Appendix A: Test Cases – Active Tags...................................................................................90
Appendix B: Test Cases – Passive tags....................................................................................92
Appendix C: Test Case 4 Map.................................................................................................94
8

Appendix D: Source code........................................................................................................95
9

List of Figures
Figure 1 GPS System...............................................................................................................22
Figure 2 Mobile Phone Tracking System ................................................................................23
Figure 3 Bluetooth Tracking System ......................................................................................25
Figure 4 Active RFID Tag ......................................................................................................27
Figure 5 Passive RFID Tag .....................................................................................................28
Figure 6 Semi-passive RFID tag .............................................................................................29
Figure 7 Serial Port .................................................................................................................34
Figure 8 Stationary RFID Reader ...........................................................................................35
Figure 9 Handheld RFID Reader ............................................................................................36
Figure 10 Modulated Backscatter............................................................................................38
Figure 11 WaterFall Method ...................................................................................................44
Figure 12 Iterative Development Model .................................................................................45
Figure 13 Acer Aspire 5600 with RS232-to-USB Adapter ....................................................49
Figure 14 Trolley Scan RFID-Radar System ..........................................................................50
Figure 15 5uW Stick Tag and 200uW Ecochip Tag................................................................51
Figure 16 RFID System for Fire Service.................................................................................52
Figure 17 Log In Screen...........................................................................................................52
Figure 18 Status Screen............................................................................................................53
Figure 19 Tag Management Screen.........................................................................................54
Figure 20 Case Diagram for Proposed System........................................................................55
Figure 21 State Diagram: User Logging into System..............................................................59
Figure 22 State Diagram: Update Status Screen......................................................................59
Figure 23 State Diagram: Managing Tags...............................................................................60
Figure 24 State Diagram: Setting Application Options...........................................................60
10

Figure 25 Ideal Radio Setup.....................................................................................................61
Figure 26 Testing Application UI............................................................................................64
Figure 27 Main UI Screen: Before User Login........................................................................67
Figure 28 LogIn Screen............................................................................................................68
Figure 29 Main Screen: After Login........................................................................................68
Figure 30 Main Screen: Manage Tags Tab..............................................................................69
Figure 31 Add Tag Dialog.......................................................................................................70
Figure 32 Database Relationships............................................................................................75
Figure 33 Tags Mounted to Cardboard Box............................................................................76
Figure 34 Test Case 10: Water bottle with tag attached..........................................................79
Figure 35 Test Case 16: Active Tag on Foil............................................................................80
Figure 36 Test Case 16: Passive Tag on Foil...........................................................................80
Figure 37 Test Case 16: Tag Wrapped in Foil.........................................................................80
Figure 38 RFID Radar Lab Setup............................................................................................81
11

List of Tables
Table 1 RFID ISO Standards...................................................................................................40
Table 2 Use Case: Open User Interface...................................................................................56
Table 3 Use Case: Add Tag.....................................................................................................56
Table 4 Use Case: Edit Tag.....................................................................................................57
Table 5 Use Case: Remove Tag...............................................................................................57
Table 6 Use Case: Search Tag.................................................................................................58
Table 7 Serial Port Methods.....................................................................................................62
Table 8 Testing application UI details.....................................................................................64
Table 9 Main Screen UI Elements...........................................................................................69
Table 10 Main Screen: Manage Tags Tab UI Elements..........................................................70
Table 11 Engine Database Table..............................................................................................72
Table 12 Equipment Database Table.......................................................................................73
Table 13 Station Database Table..............................................................................................74
Table 14 UserDetails Database table.......................................................................................74
Table 15 Test Case 8: Tag location Details.............................................................................78
Table 16 User Requirements Evaluation..................................................................................84
Table 17 System requirements Evaluation...............................................................................84
Table 18 Non-Functional Requirements Evaluation................................................................85
12

Abstract
Location tracking technology has been around for many years now, and it is advancing all the
time. In the modern world we live in tracking software is everywhere, in some cases the
technology is not even used primary for tracking but can be used to track the movement of a
person or an object. The use of location tracking technology can be applied to industry to
improve many areas such as security, safety and the supply chain. The main reason that
location tracking systems have not be applied across many applications is due to the number
of limitations that restrict the technology. The current limitations that affect location tracking
technologies include accuracy, cost and feasibility.
This report explores the use of RFID technology for location tracked however the most
comply used and most popular location technology is the Global Positioning System (GPS),
this technology has been used worldwide and many devices used some type of GPS
technology as part of their functionality such as mobile phones and portable computers.
Although GPS is the most comply used it also has limitations associated with it, such as not
being able to work at well when indoors.
Radio Frequency Identification (RFID) is mainly used in close proximity identification such
as entering a building using an RFID enabled swipe card. The technology uses readers and
tags to communicate data. Tags come in two types active and passive. Active RFID and
passive RFID tags can be used for tracking goods or people within indoor or outdoor
environments. The accuracy varies from system to system and there are many factors which
influence the accuracy such as doors and electromagnetic interference. The technology works
on the use of modulated radio signals that can transfer data back and forth. RFID has already
been used in many applications such as supply chains and security access, however the
possibilities are endless.
This report investigates the accuracy of one leading RFID indoor tracking system. The first
set of chapter’s investigates the history and background to location technology, how it works
and the limitations of each different technology. The report also explores the suggested
13

scenario of the Northern Ireland fire service, the scenario describes the inventory
management system of the fire service and the issues that affect the current paper based
system. In later chapters a solution for the scenario is described and the different stages of the
design and implantation of the proposed system and any issues that where faced during these
stages is explored in detail.
The final three chapters explore the limitations of the RFID technology and the system that
was developed for the scenario including detail on a number of tests carried out on the
system. Also an evaluation of the system as a whole is provided with a conclusion to give an
overall view of the project and the report.
14

1 Introduction
Location tracking technology has been around for many years now, and it is advancing all the
time. In the modern world we live in tracking software is everywhere, in some cases the
technology is not even used primary for tracking but can be used to track the movement of a
person or an object. Tracking technology can range from Global Position System (GPS)
which is mainly used in navigation systems for cars, phones, boats, planes etc. The GPS
system works perfectly in an outdoors location as it needs direct view with a satellite to get a
signal and give the most accurate information, this can cause issues when tracking is needed
indoors. Another widely known technology is Radio Frequency Identification (RFID) this is
mainly used on small scale tracking. RFID is mainly used for tacking people or items inside
buildings or small areas linked together with a number of buildings. In all probability the
most primitive tracking technology is the use of Closed-circuit television (CCTV). This is the
use of many strategically placed cameras that monitor an area and can track the movement of
people and items in different areas.
In many cases a location tracking system will be installed to track the moment of employees,
stock in a warehouse, patients in a hospital, children in a school, delivery trucks in transit,
taxies in a city, boats at sea, planes in the sky and many more. The evolution of tracking
systems has made it cheap and easy to install a tracking system in a small to large scale
operation. This means it’s that easy that if you wanted you could track you pets in your house
with a simple and cheap system.
Tracking systems on a small scale are being more widely accepted and used in modern day
life. Systems are already in place in many work places where employees must swipe an ID
badge or card before they can enter a room this keeps a track on where they are in a building.
This type of system uses the RFID technology, RFID systems fundamentally consist of four
elements: the RFID tags themselves, the RFID readers, the antennas and choice of radio
characteristics, and the computer network (if any) that is used to connect the readers
15

(Grafinkel and Rosenberg, 2006). The system is relatively easy to set up and has little to
almost no maintenance, the details of RFID systems will be expanded upon in later sections.
RFID tracking technology can be used in many different application, some scenarios include
the tracking of animals. The tracking of animals is most done in the farming industry when
cattle and sheep need to be identified by the framer. Another instance when RFID can be
used is in the manufacturing industry, tags can be attached to items that are moving through
the factory on conveyer belts or being moved around by staff on trucks or forklifts. As the
tags move around the factory floor or the warehouse they pass by readers and the tags can be
then tracked using a database or a similar data storage system. RFID systems are also used in
almost everyone’s day to day life, anyone who works in a secure office, goes to university,
drives a car with an immobiliser, parks in a secure car park, etc. The list of applications that
we use every day and are unaware of is endless. Anyone who works in an office that requires
them to swipe an ID badge or smart card to gain access into areas is using a RFID system.
The tag is in the badge or the card and the readers are the boxes in from of the doors. Once
the tag is read by the reader is determines if the tag has the correct level of permissions
needed to access the area in question. If the tag is gained permission the door, gate, etc will
open. Almost every university uses a student card system where each student carries a student
card and this can enable them access to different resources, in almost every instance the card
contains a RFID chip which is used to grant access to the resources. This student card works
on the same principle as the smart card in the office. The same applies to most of the other
applications in the case of the car; all cars that have a built in immobiliser have a special key
that must be used to start the car’s engine. This key contains an RFID chip and the lock for
the ignition contains a reader, the correct chip must be placed next to the reader in the
ignition before the car engine will start.
The scenario that this report will cover is the fire service and the tracking of the different
pieces of equipment that they use. The scenario is that the fire service is called to out and an
engine is dispatched with all the appropriate equipment for the type of call that they have
received. Examples of calls could be a fire meaning that they would have to bring equipments
to stop a fire such as fire retardant suits, water hose, ladders, axes etc. Sometimes the call
could be a rescue call meaning that the equipment needed would be climbing materials,
ladders, tools for lifting rubble if a building has clasped and tools for removing people from
vehicles. The main problem is that there is so much equipment for each type of call, in some
cases different fire teams are called to the one incident meaning that there is equipment
16

belonging to different stations in the one area and mix over’s can occur in many cases one
team takes back other teams equipment. As much of the equipment that is used is very
expensive it is very hard to replace the equipment.
This is a wide spread issue that affects many different organisations, most affected are “on
call” services such as roadside repair companies or on call mechanics. The problem is that the
main part of the organisation is called out of the office/warehouse/factory/garage and must
take the necessary equipment and return with all the equipment. If items go missing on each
instance they must be replaced, this cost can build up over a period of time and affect the
organisations profits.
1.2 Aims
The main aim of this project is explore and demonstrate location tracking systems in relation
to RFID tag tacking. For the purpose of tracking items on a small scale (i.e. tracking
equipment in a building) a RFID system is the best solution. The main objective of the
project is to create and implement a system that can be used to track fire fighter equipment.
The proposed solution is to create a general purpose system that can be used for the tracking
of the different pieces of equipment that the organisation uses when on call, for this scenario
it will be the different equipment used by the fire service as previously discussed. The
system will be able to identify a number of tags as they pass by the sensor, this will be
implemented in the fire station as a set of RFID reader placed at the main door way in which
the fire engine enters and leaves the station. Each item of equipment will be tagged and the
tag information will be stored on a database or appropriate data storage option. The system
will be able to display to the user the current location of the items e.g. “in” or “out”; this is
then used to ascertain if items have been lost during a call.
The system will be platform independent making sure that the system will run on most
available operating systems, the system will also be organisation independent making sure
that the system will be quickly and easily deployed to any organisation weather is the fire
service, a roadside recovery service or any other call out service provider.
17

The next aim of the project is to test the factors that affect a RFID system, what factors can
interfere with the readers and tags of the system. This aim will test the following properties of
the RFID system under a number of circumstances and environments:
Range
Strength
Reliability
Usability
Performance
Each of the previously mentioned factors will be tested under controlled and managed
environments to insure the highest standard of results. These results will then be used to
improve the current system; this process will be repeated until the system has reached
optimum performance or until the process becomes redundant. This will happen only if the
changes needed to the system are not possible, such as upgrading the equipment or modifying
parts of the scenario that cannot be changed.
1.2 Thesis Overview
Chapter 2 gives an overview of location determination technologies, describing how they
work and their advantages and disadvantages and describes the history of RFID.
Chapter 3 discusses in detail the main components of the RFID technology.
Chapter 4 gives the problem specification and objectives of the system. It also identifies the
functional, non-functional, hardware and software requirements, as well as the design
methodology chosen for this project.
Chapter 5 examines the design phase of the system by discussing the hardware and software
components in detail, the design constraints, HCI guidelines and system architecture. The
chapter also provides UML diagrams to model the system’s main processes.
Chapter 6 describes the implementation phase of the project, how the proposed system was
developed and how the developed system works. The systems interface is discussed and how
18

directions on how to use the system are given. Details on how the system database is
structured and how the database integrates with the application are given.
Chapter 7 describes and documents the different test cases carried out on the RFID system.
Chapter 8 gives a overview of the testing and the progress of the report with evaluations of
the system and the test that were carried out on the system.
Chapter 9 concludes the report and the project with a summary of the data acquired during
the testing.
19

2 Location Determination Technology
There are many reasons that location tracking systems have become a large part of our lives
two of the main reasons are security and safety. Security is the reasoning behind introducing
CCTV into almost every public place in the UK and Ireland. “There are up to 4.2m CCTV
cameras in Britain - about one for every 14 people.” (BBC news, 2006). This shows how the
insecurity of human nature has scared people into trying to track and watch everything
around them. Security has also started a trend in the work place, ID badges and cards can be
seen on almost every office employee in all small to large offices. These are all used for
tracking who is in the office and where they are in the office. The safety aspect to the location
tracking systems are when systems are used to track patients in a hospital, each patient is
fitted with a RFID tag and when they enter an area where patients are prohibited an alarm
will sound. Location tracking software can also be used for the safety of animals in the wild
and also give important information about animals. Some animals are fitted with GPS tags
and these can be used to track them throughout the world, this allows conservationists to
track the animal and prevent them from coming in contact with danger areas. Also the
information from the GPS tracking logs can be used to show animal migration patterns. This
project will mainly use the RFID technology for tracking; however details of GPS and other
location tracking technologies will be described in later section.
2.1 RFID History
Radar was the precursor to RFID, some people who were responsible for the development of
radar where, Heinrich Hertz who was a German physicist who clarified and expanded the
electromagnetic theory of light, he also was awarded with the SI unit hertz (Hz) being
established in his honour by the International Electrotechnical Commission (IEC) in 1930 for
frequency, a measurement of the number of times that a repeated event occurs per unit of
time (also called "cycles per sec" (cps)). It was adopted by the Conférence générale des poids
et mesures (CGPM) in 1964. Heinrich identified and studied the wave –based nature of radio.
One result of the research carried out by Heinrich, was that some radio waves where able to
pass through solid objects while others where reflected by the object. As a result of this
Heinrich was able to develop a technology that could measure the distance the waves had
20

travelled thus giving the distance between him and the object. It wasn’t until the Second
World War before Radar was used on a larger scale. It was during the war that countries
worried about invading army’s travelling at night time or during foggy conditions when they
would not be seen, radar systems where deployed to act as early detection systems. These
systems where implemented by the United States, the United Kingdom, Germany, France,
USSR, Italy and Japan. This technology then leads into the days of RFID.
RFID is part of automated identification and data collection (AIDC) technology that has
become so wildly used in past and modern society. This technology is everywhere in the
scanner at the checkout in a supermarket that reads the barcode from an item and can retrieve
more information on the product that the actual product packaging can give. The magnetic
strip on a credit card or bank card is also an example as it can give information with only a
swipe and even the tags that are attached to electronic items in shops that alert security if the
item has left the store without the tag being deactivated. Any item of technology that
automatically retrieves information or performs an automated process can be classed as an
AIDC technology.
AIDC technologies date back to the 1930’s and 1940’s other types of AIDC technologies
include optical character recognition (ORC) and magnetic ink character recognition (MICR)
however MICR and RFID have become the most popular (Waldner, 2008). RFID technology
has its roots in early military identification systems in the early 1940’s. It was the British that
pioneered RFID during the Second World War; they used the technology to identify their
own aircraft as they flew above. The problem that the British military faced was that the
current radar system that was in use could only detect incoming aircraft however could not
detect if it was a friendly aircraft. The new transponders in the Royal Air Force (RAF) planes
could be used to determine if the plane was allied or enemy. At the same time the Soviet
Union was also developing there AIDC technologies, a Russian inventor Léon Theremin,
developed a covert listing device that retransmitted incident radio waves with audio
information. These radio waves where then put though a diaphragm which altered the shape
of the resonator which modulated the reflected radio frequency. This however was not a
tracking device but was still an evolution on the ACID technology and one step closer to
RFID technology. The next development in RFID technology was in 1948 a white paper was
21

released by Harry Stockman, titled "Communication by Means of Reflected Power". This
white paper delved into the development of RFID technology and how much work would
have to be carried out to get the technology to the stage where it could be easily used. In the
late 1960’s the American government used RFID technology to tag nuclear and other
dangerous martial and monitor its location.
RFID technology has grown to be part of normal life for many people and some without
knowing about it. The toll system that Cardullo proposed has been implemented in many
states in America and in many European countries. It has come under many different names
such as “Etoll” and “E-Z pass” but they all perform the same basic function as the car passes
on the road a camera photographs the car including the registration plate and the RFID reader
scans the tag mounted to the car. The tag is normally mounted to the windscreen or the dash
board. The reader reads the tag information and verifies the registration matches the photo of
the car then bills the appropriate account for the amount of the toll, if the account is not active
or the car was not fitted with a tag the registration is used to bill the driver for the price of the
toll. This system speeds up travel times as there is no need for a toll booth and for drivers to
stop and manually pay a toll. Tags can be read from distances up to 20 meters and at speeds
up to 80km/h (kilometre per hour) this prevents drivers having to slow down and causing
delays in traffic (E-Z pass, 2009). Other applications of RFID technology is the use of smart
cards, or ID cards. These are cards that contain an RFID tag and usually some information on
the front such as a photo and name of the holder. The RFID tag is programmed with their
details and when this is passed by a reader it will validate the details with the system details,
e.g. if a door is locked it will only open for valid tags or for a small array of selected tags.
There are thousands of examples of RFID applications, anywhere were a process needs to be
automated or information needs to be retrieved quickly RFID technology can be used.
22

2.2 GPS (Global Positioning System)
GPS systems are just as popular and widely used as RFID systems. However GSP can be
used for a larger scale tracking system. GPS uses satellites that orbit the earth to provide the
location of a GPS device. This service can be reliably provided in all weather, at any time of
the day and in any position in the world. The GPS system is composed of three major parts
(GPS, 2009):
1. Satellites orbiting the earth
2. Control and monitoring stations on earth
3. GPS receivers
The first part is made up of between 20 and 30 satellites that orbit around the world. There
are a number of control and monitor stations on earth that are placed around the world. The
last part is the receiver this is the device that the user uses to access the GSP signal, this could
be an in car navigation system, mobile phone or a purpose build handheld GSP device for
navigation. The device that user has sends and receives signals from the orbiting satellites
that provide the user with a three-dimensional location (latitude, longitude and altitude) and
in many cases time. This is shown in Figure 1:
GPS has become widely used for many different applications such as navigation for people
and vehicles it is also used for the creation of maps and for surveying of land. The time
function is used in scientific experiments when an accurate time is needed such as earthquake
23
Figure 1 GPS System

studies. Some other uses include disaster relief when people are stranded they can send a GPS
location to the emergency services and this will aid in the rescue.
2.3 Mobile Cellular Systems
Location tracking can also be done with a simple mobile phone, this is done without the use
of a built in GPS receiver. All that is needed from the phone is the ability to send a roaming
signal to the nearest antenna tower. This roaming signal is used in Global System for Mobile
(GSM) systems that can determine the location of the phone using multilateration. This is
when the time taken for the signal to travel between the phone and the antenna is used to give
an estimated location of the phone, thus tracking the user. Figure 2 shows how the mobile
phone system works:
Figure 2 Mobile Phone Tracking System ①
There are three components of the mobile tracking system.
1. The phone signal from the mobile phone, this is sent to the nearest antenna. Signals
are bounced back and forward during a call.
2. The system uses triangulation calculations on the information retrieved from
multilateration.
① http://news.bbc.co.uk/1/hi/technology/4738219.stm
24

3. The last part is when the system uses the results from the triangulation and plots the
geographical location of the mobile phone.
In 2005, this technology was used to track and capture the man responsible for the suicide
bombings in London in earlier that year. The police were able to track him every time he
made a call using the GSM tracking technology. This technology can also be used for
security there are a number of companies that provide tracking solution that involve mobile
phone tracking these include Child Locate② and Mobile Locate③, these companies offer
services where you can use their real time tracking software to track mobile phones.
2.4 Bluetooth Bluetooth location tracking technology is a relatively easy and simple technology that could
be used by any user, as most people have mobile phones all of which come with Bluetooth as
standard. The simplest process of tracking a person or object is turning on your mobile phone
and searching for Bluetooth devices. This will display the devices in close range in most
cases 10 meters. An example if you knew a friend’s mobile phone’s Bluetooth name you
could search for their device using your phone and following them using this as a guide.
Creating a network of sensors would improve this system; this would involve setting up a
network of Bluetooth devices that are constantly searching for Bluetooth devices in range.
The sensors would be places strategically so that the entire area is covered, each sensor then
tracks any discoverable Bluetooth device and records all of the tracked devices and sends the
information back to a central server or machine. The following explains how the tracking
would be implemented. The scenario is of a street 100 meters long in which people needed to
be tracked. As each Bluetooth sensor is just a standard Bluetooth reader and the range of
which is 20 meters five sensors will be needed to cover the street. This means that every 20
meters there will be a new sensor (How Stuff Works, 2009). This type of system was set up
in September of 2007 by a Dutch man who noticed that when he turned on the Bluetooth
adaptor for his PC that he was discovering a lot of Bluetooth devices. He then set out to try
and track these devices by using friends and family he positioned Bluetooth devices in their
homes and connected them to small machines running Linux theses machines would use the
internet to report the data on the devices that were discovered. The set up is illustrated in
Figure 3.
② http://www.childlocate.co.uk③ http://www.mobilelocate.co.uk
25

Figure 3 Bluetooth Tracking System ④
This system is fully implemented and currently up and running, the statistics of the devices
and the sensors can be accessed at http://www.bluetoothtracking.org/.
2.5 ZigBeeZigBee is a specification for a high level set of communication protocols that use low
powered digital radios. This is based on the Institute of Electrical and Electronics Engineers
(IEEE) 802.15.4-2003 standard for wireless networks for personal use, examples of this are
devices in the home that communicate with each other on a short range radio such as wireless
headphones that connect to a speaker or a mobile device, these networks are called wireless
personal area networks (WPANs) the ZigBee technology is designed to be more simpler and
less costly than normal WPANs an example of which was previously mentioned in the last
section on Bluetooth tracking. The ZigBee solution is aimed at RF systems with low amounts
of data(ZigBee Alliance, 2009).
Typical applications for ZigBee technologies are; home entertainment and control systems
such as smart lighting, temperature control, movies and music etc. Home awareness such as
water sensors, energy monitoring, smoke and fire detectors and industrial plants such as
process control, environment management, energy management and industrial device control.
2.6 Wi-Fi Wi-Fi or wireless as its commonly called, is everywhere in most schools, universities, shops
and even town centres it is not surprising that this technology can be used to track object and
people. Every laptop manufactured today has a wireless card installed and is able to connect
to a 802.11 a/b/g/n network, which are plentiful in large cities. The Wi-Fi tacking works on
the same bases of the Bluetooth tracking, every device sends out signals that broadcast its
details. This is normal for the device to connect to a network however in this instance the
signal is received by a special wireless receiver which records the details of the device and
④ http://www.bluetoothtracking.org/
26

the location of the receiver this then can be used for the tracking of the device as it moves
from each Wi-Fi network. Another method of tracking by using Wi-Fi that resembles the
method used in GSM tracking is triangulation, this involves measuring the time that is take
for signals to be sent and revived between three different wireless receivers and the wireless
device. The times are calculated into the distance. The three distances are triangulated which
will then give the position of the wireless device.
2.7 InfraredAnother very basic tracking technology is infrared; this is mainly used for motion detection
and not large or small scale tracking of objects. “Infrared radiation exists in the
electromagnetic spectrum at a wavelength that is longer than visible light. It cannot be seen
but it can be detected.” (Global, 2009). It is this technology that is used for the motion
detection, as objects that generate head also generate infrared radiation. The infrared sensor
sends out a signal that will be blocked by the other object of infrared light, from this the item
can be located and when the item moves the beam of infrared is broken in different sections
this detects the movement. One of the most famous applications of this is in the Nintendo
Wii games console that using this technology to capture the motion of the controllers that are
used for playing games.
27

3 RFID Technology
RFID systems consist of four elements which are the RFID tags that will be tracked, RFID
readers that will detect the tags, antennas and radio and the Computer network used to
connect the readers. Each RFID tag consist of the following items, an antenna, small silicon
chip including a radio receiver, radio modulator that can send signals back to the reader,
internal memory normally a very small amount and most importantly a power supply system
unless the tag is a passive tag. Tags can be active, passive or semi-passive.
3.1 RFID TagsAn active tag is a tag that contains a power supply system that is powered by a battery this
type of tag is shown in Figure 4. The main advantages to having an active tag are the reading
range of the tags. With the power of the battery and a powerful antenna the tag can be read
from up to a distance of 30 meters. The battery power also means that the tag will not need to
constantly be accessing reader and will give a more reliable reading, the most common
application for theses tags are in warehouses where the tag is fitted to pallets and tracked
through the warehouse, the tags are also used in cars for toll systems as the reader in toll
systems are usually at a distance from the car. The disadvantages to active tags are that the
tag can be more bulky after the battery has been fitted.
Figure 4 Active RFID Tag ⑤
⑤ http://electronicdesign.com/Files/29/12208/Figure_02.jpg
28

A passive tag is a tag that does not contain a battery to power it; this type of tag is shown in
Figure 5 in the form of a product label with the RFID chip integrated into the sticker. Instead
it uses the electrical field generated by the reader. The advantages to passive tags are that the
tag can be fitted to smaller object or woven into clothes, in many cases passive tags are used
for smart cards and they can put the tag inside the card without making it thicker
(Finkenzeller, 1999). The absence of the battery as a power source means that the tag will be
cheaper to produce and purchase compared with active tags. The life time of the tag is also
longer than an active tag as the life time of an active tag is dependent on its battery which
will only last a few years before having to be replaced. Passive tags could be used for decades
after being produced. The only disadvantage of using passive tags is the read range, as the tag
has no power supply it cannot be read from a distance. This means that the tag must be close
approximately 2-3 inches from the reader before it will be read. However there are some
applications this can be an advantage as sometime the tag will be in a close range of the read
but the user will only want the tag to be read when they intend the tag to be read. In cases that
a tag is used to pay for petrol at the petrol pump, if the user is close to another pump while
someone else is using the pump they do not want the reader detecting their tag and thus being
charged.
Figure 5 Passive RFID Tag ⑥
In the middle ground between active and passive tags are semi-passive tags (Figure 6). The
semi-passive tags incorporates the advantages from both tags, similar to the active tag the
semi-passive tag contains a battery as a power source however also uses the magnetic field
generated by the reader to send signals back, this is called backscatter. This means that the
readability of the tag will be as reliable as an active tag however be relatively the same size of
a passive tag and will have a longer life as a normal active tag. ⑥ http://www.harlandsimon.co.uk/Images/tagInLabel.jpg
29

Figure 6 Semi-passive RFID tag ⑦
Read Once (RO) tags are single use tags, which can only be writing to once in their life time
(Lahiri, 2005). The data is burned onto the tag at the manufacturing stage in the factory. This
type is also known as factory programmed, the process of programming the tag is done by
burring the fuses on the microchip using a fine-pointed laser beam. This type of tag is only
useful for small applications that do not need the tag customised for their use as this would
not be possible.
A Write Once, Read Many (WORM) tag can be written to once similar to the RO tag;
however the writing process is not carried out by the manufacture. The WORM tag is also
known as a field programmed tag; this is because the tag is programmed by the user when
they need the tag. However the process of writing the tag is very buggy it can be possible to
re-write the tag, though if the tag is written repeatedly then it can be permanently damaged.
“This type of tag offers a good price-to-performance ratio with reasonable data security and is
the most prevalent type of tag used in business today.” (Lahiri, 2005). A read write (RW) tag
can be programmed a large number of times; this is normally in the range of 10,000 and
100,000. The great advantage to using this type of tag is that the data can be written to the tag
for an almost endless number of times by the reader and in the case of an active tag the tag
can re-write itself. The tag can do this by using the flash or Ferroelectric RAM (FRAM)
memory that is fixed to the chip. The flash memory or FRAM is used to store the data every
time the tag is re-written. The main issue with this type of tags is securing the information on
the tag and the cost of producing the tag. This means that this type of tag is not as widely
used as the other tags previously discussed.
⑦ http://www.scienceprog.com/wp-content/uploads/2007i/RFID/active_RFID_tags.jpg
30

The range of sizes of RFID tags is changing all the time and the tags can range from large
security chips and cards to small micro chips. “The smallest tag that has ever been produced
is the Hitachi mu-chip, which is less than 0.4 millimetres (mm) on a side” (Grafinkel,
Rosenberg, 2006). This tag was created for the purpose of being embedded into a piece of
paper and used for tacking documents, the tag can only be read from a distance of a few
centimetres (cm). However if a longer antenna was used with this tag the read range would be
increased however this would increase the size and thus not make it feasible to embed. There
are also other types of smaller tags such as implantable tags which can be the size of a grain
of rice, which are implanted under skin. Like the mu-chip the read range of the implant tag is
very limited however the proposed application of these chips does not call for a long read
range. They are intended to be implanted under the skin of humans; for identification
proposes in high security level areas and could also be used in hospitals for identifying
patient as mix up could be fatal. Is the tag is under the skin it cannot be easily shared or
switched meaning that the identification system would be almost 100% reliable.
3.2 Antennas All tags have an antenna, the antenna is the tags means of acquiring energy from the RFID
reads signal. The antenna is strongly related to the tags ability to operate, without the antenna
the tag would not be able to communicate with the RFID reader. The antenna is attached
directly to the chip. There are endless number types of antennas that can be used with RFID
tags. “The antenna length is directly proportional to the tag’s operating wave length” (Lahiri
2005). Some examples of antennas are:
Dipole: was created by Heinrich Rudolph Hertz 1886 the dipole antenna consists of a
straight electrical conductor such as copper that is broken up at the centre. The total
length of the dipole evaluates to half the wavelength of the used frequency. This is to
optimise the energy transfer between the reader and the tag.
Dual dipole: consists of two dipoles which increases the read orientation of the tag,
meaning that the tag can be placed at different orientations and still have an optimised
read range.
31

Folded dipole: the folded dipole is consisted of multiple conductors where the tips of
the straight conductor are folded back until they are close to the feedpoint of the
antenna. This increases the bandwidth of the standard dipole.
The antenna will always be longer that the length of the tag’s microchip, this means that the
size of the antenna will determine the size of the resulting tag. This is why smaller tags have
a shorter read range than a much larger tags, as the antenna for small tags are short and have a
shorter wavelength. The antenna is one of the most fragile parts of the tag, if the antenna is
bent or cut this can detune or even break the antenna rendering the tag useless. However there
are also ways of modifying existing tag’s antenna to increase the read range.
Antenna are currently made from small thin metal strips normally copper or aluminium
however it has been predicted that advances will be made that will allow antennas to be
printed into the tag itself. The antenna will be printed using an ink containing a light metal
such as copper, carbon or nickel, research has also gone into developing ways to print the
microchip in the same way as the antenna thus being able to print tags just as easily as
printing a barcode onto packaging. This would decrease the time and effort taken to create a
normal tag, and would work out cheaper as there would be little to none parts to be used.
3.3 Readers
The RFID reader can read and write to appropriate RFID tags. The reader is also known as an
interrogator. (Lahiri, 2005) the reader doubles up as a writer as it can modify the data on the
chip. For the reader to be used in the system the tags must first be commissioned, this
involves creating a tag and uniquely associating it with an object. The process of
disassociating the tag is called decommission. Once a tag has been commissioned the reader
can send a radio frequency (RF) energy signal to the tag, to be able read the tag. This process
is called the duty cycle this is repeated many times however it is governed by an international
legal limit.
32

Each reader is built up of the following components:
Transmitter
Receiver
Microprocessor
Memory
Controller (in some instances a external component)
Communication interface
Power
Input/output channel for external sensors, actuators and annunciators (non-
compulsory)
The tags in range of the reader receive their clock cycles and alternating current (AC) power
from the transmitter on the reader this sends both of theses to the antenna of all the tags in the
read range. This is all done in what is called the transceiver unit of the reader, each antenna
on the reader is connected through the transceiver unit some readers can have multiple
antennas. This component also belongs to the transceiver unit of the reader; this component
receives the analogue signal from the tag. The received data is then sent to the reader
microprocessor where is it converted into digital (Finkenzeller, 1999).
It is in the microprocessor component that the reader protocol is implemented to interact with
any tags in the read range. The following processes are carried out in the microprocessor:
Decoding of the analogue signal sent from the receiver
Error checking of the analogue signal sent from the receiver
There also might be custom logic that can carry out filtering or processing of the data from
the receiver. The memory on the reader is used as a backup mechanism, the data stored on the
memory normal consists of the reader’s configuration and a list of all the tag reads that have
been carried out. Meaning that if the connection between the reader and the system is broken
not all the information will be lost. The memory works in a queue like way, it will store the
reads as they happen however once a certain amount have been stored (this will vary between
readers depending on memory size) it will delete the first ones and store the new ones. Just
like the queue the first in will be the first out (deleted) and the last in will be stored. When the
reader is connected to the system each item of tag data will be sent to the system as it read
meaning that the limit will not have any effect over the data reaching the system. However if
33

the connection is lost and the reader continues to read tags the memory limit might be
reached and this means that the first in the queue will pushed out and new data will over write
the tag data. This means that not all the reads will be accessible to the system when the
connection is restored.
The controller component is the connection between the reader and the user or the system.
The controller allows control of the reader’s functions, often the manufacture of the reader
will include this as firmware but in other cases the controller can be packaged as a separate
hardware or software component.
The Communication interface is the component that gives the communication instructions to
the reader, these instructions allow the reader to interact with external entities via a controller,
to transfer its stored data and accept commands and send back the matching response (Lahiri ,
2005). This component can either be situated between a controller and its external entities or
it can be part of the controller. The communication interface of the reader could be a serial as
well as a network interface. The serial interface is the most widespread type of reader
interface, however there are readers that come with network interfaces as standard and can
offer advanced feature such as automatic discovery by an application and built in web servers
that allow the reader to accept commands and display the data from the reader through the
user’s web browser.
Readers can acquire their power from a standard power source from a power cord that is
attached to an appropriate external electrical socket. Similar to tags readers can also be
classified by using criteria, in the case of the reader there are two criteria that the readers can
be sorted by, the first is the communication interface. Using these criteria the reader can be
classified as below:
Serial
Network
The serial reader uses a serial connection for its interface this is done through a serial port
(Figure 7) on the reader, the connection between the reader and the computer is achieved
through either a Recommended Standard 232 (RS-232) or Recommended Standard 485 (RS-
485) connection cable. The cables have a maximum length; RS-232 can only be 50 feet (RS-
232 Specification) in length and the RS-485 can be approximately 4000 feet (RS-485
Specification) in length because of the different voltage that is used with this cable. The
advantages of the serial reader outweigh the cable length issue, the reliability of the serial
34

connection compared with a network connection is far greater and in many cases it is
recommended to use a serial connection as it rules out any dependency on communication
channels or any issues with connection dropping or being broken. However there are also
disadvantages associated with this type of connection. These include the limit on the cable
length as this could be an issue if the system is being used on a large scale on a multi story
building etc. The number of serial ports on host machines is normally limited and this will
mean that a large number of host machines will be needed to connect all the readers.
Firmware updates and maintenance can also be an issue as if there are a large number of host
machines the maintenance team will have to update and maintain each machine. The data-
transmission rate is much lower on the serial connection compared to the network connection
this means that there will be a significant decrease in the performance of the system.
Figure 7 Serial Port ⑧
In the network connection there can be either a wired connection or a wireless connection
between the reader and the computer. In simple terms the reader is a network device and can
be connected to the network like any other device such as a computer. The one advantage to
this type of reader is that there is no limit to the length of the cable that connects the reader to
the computer. This means that the number of host machines will be lower compared to the
serial approach. This also affects the maintenance of the readers as the firmware and other
components can be accessed remotely across the network and they can be updated or changed
remotely. The main disadvantage to this approach is that the connection is not a reliable as
the serial connection, if the connection is broken the back end of the reader cannot be
accessed as a result the system could come to a stop, even if the reader has its internal
memory this will only last for a short network outage, after this short period of time data will
be lost.
⑧ Serial port (http://ergocanada.com/ergo/tips/serial_port.jpg)
35

The next classification type is based on mobility:
Stationary
Handheld
Stationary readers also know as fixed readers, are normally mounted to a wall, portal, or
some appropriate structure in the area where tags will need to be read. The name stationary
does not mean that the reader has to be completely stationary as in some cases the structure
that the reader is attached to could be mobile, such as attaching the reader to a truck or crane.
Stationary reader require external antennas to read tags, in most cases the reader can support
up-to four antennas. The cost of stationary readers is lower than handheld, a model of the
stationary reader is shown in Figure 8, and this type of reader could be mounted to any type
of surface in or outdoors (Finkenzeller, 1999).
Figure 8 Stationary RFID Reader ⑨
The handheld RFID reader is a mobile version of the stationary reader. The reader is operated
through a handheld device, which normally has a built-in antenna. This type of reader is more
expensive and thus not as widely used however as the RFID technology advances more and
more the price of producing these types of reader is becoming lower. An example of a
handheld reader is shown in Figure 9.
⑨ http://www.allproducts.com/manufacture2/pongee/rfid-reader-l.jpg
36

Figure 9 Handheld RFID Reader ⑩
Input/output Channel for External Sensors, Actuators and Annunciators are mainly used for
optimising the performance of the reader, as the reader will not be reading tags constantly. In
most applications tags will only come in contact with the reader at specific times, thus if the
reader was constantly on then it would be a waste of energy. This component provides a
means of turning the reader on or off in reaction to external events, such as attaching a light
or motion sensor to the tag and once the sensor is triggered the reader is set to read any tags
in range.
3.4 Operating Frequencies
The tag and the reader both operate within distinct frequency ranges, each range is associated
with a different application e.g. low-frequency (30 to 300 KHz) devices are typically found in
passive tags and used in short-range applications such as livestock identification. High-
frequencies (3 to 30 KHz) are used most commonly in smart card systems. RFID system
normally operate in the range of 13.56 MHz (Shepard, 2005)
Very high-frequency devices (300 MHz to 2 GHz) are most used in the E-toll systems, these
system normally operate at 900MHz in the US or 2.45GHz in Europe and in some other
places across the world they operate at 5.8GHz.
The pros and cons for the two frequency boundaries and varied but equally matched, the low
frequency systems can operate with minimal power consumption and are inexpensive and
also can read through metallic overlays. However they are sensitive to noise and can only
⑩ http://support.simplyrfid.com/_/rsrc/1232573584034/noxvault/NoxVault-Long-Range-Handheld-RFID-Reader.jpg
37

read at short range. Higher frequency systems require more power especially systems that run
at 1MHz or higher, however can read at a much further distance and are not orientation
sensitive. They can handle larger data transfer however cannot penetrate metal surfaces.
3 .5 Reader and Tag Communication
The communication between the tag and reader depends on the type of tag; the type of
communication could be anyone of the following:
Modulated Backscatter
Transmitter Type
Transponder Type
Modulated backscatter is common between tag and reader and is used with both passive and
semi-active tags. For the process of modulated backscatter the reader sends a continuous
wave (CW) of a RF signal, this signal contains both AC power and clock signal. The wave is
sent to the tag in what is called the carrier frequency, this is the operating frequency of the
reader and the corresponding tag. The next process to take place is called coupling, this is the
process of powering the tag through the RF signal being sent by the reader. The antennas of
both become coils and create a magnetic field, this field then induces a current in the coil of
the tag and the tag is powered (Grafinkel and Rosenberg, 2006).
This process is carried out between the tag and the reader through what is called physical
coupling the power is supplied to the microchip around 1.2 volts are needed to fully energize
the chip in the tag and to be able to read the data stored on the chip. For the process of writing
to the tag the chip needs 2.2 volts from the reader (Lahiri, 2005). The microchip on the tag
modulates the signal into a sequence then into a pattern that represents the data that it is
sending, after modulating the signal it sends it back to the reader. The reader receives the
modulated signal it then decodes the pattern and retrieves the tag data. The main conventions
of the modulated backscatter is that the tag cannot communicate until the reader has sent out
a signal, thus in this method the tag is totally dependent on the reader. Figure 10 is a diagram
showing the process of modulated backscatter; it shows the signal going from the receiver to
the tag and being modulated and then the modulated signal being sent back for decoding.
38

Figure 10 Modulated Backscatter⑪
In transmitter type communication the tag that is used is the active tag, the tag broadcasts its
message to the surrounding environment. This is done regardless if there is a reader in the
area. In this case the tag will always communicate first; as the tag is active it does not require
the power from the receiver and can communicate first.
For transponder type communication a special type of active tag is used, this tag is called a
transponder. This tag acts the same as an active tag is every way bar one, normally the tag is
a in a sleep mode. The tag lies sleeping and at set intervals sends a signal to check if a reader
is trying to access the tag. If no readers are trying to access the tag the tag continues to sleep
and repeats the previous step. If a reader is discovered that is trying to read the data on the tag
the tags wakes up and copies the previously motioned connection type of transmitting its
message to the surroundings environment.
3 .6 Host and Software System
The host and software system is the term used for the software and hardware that is separate
for the RFID system (tags, reader etc). This host and software system is composed of the
following:
Edge interface/system
Middleware
Enterprise back-end interface
Enterprise back end
Edge interface/systems is called this as it is seen to be at the edge of the host and software
system as it is the first part of connection with the RFID system. This component’s main task
is to get the data from the readers and control the readers’ behaviour and control any attached ⑪ http://i.cmpnet.com/rfid-world/2008/07/DobkinFig15.gif
39

actuators and annunciators. This component is where all the details of the interaction with the
reader are kept; this builds a layer of abstraction between the host and software system and
the reader. Meaning that the host and software system can be reused with other supported
reader, this is cost effective as it would be very costly to develop a new system for every type
of reader and RFID system. One way of looking at the component is as it was a super
controller that can be used to interact with any support controller.
The middleware is seen to be everything between the edge interface and the enterprise back-
end interface (Lahiri, 2005). This component provides the core functionality of the system
this includes the following:
Data sharing both inside and outside of an enterprise
Management of the large amount of data produced from the RFID system
Provide the basic components that can be used for implementing the business specific
logic for the system
An open standard that is compatible with a wide range of software systems
A week coupling between the edge interface and the back-end meaning that if a
change is made to one, this will cause minimal effect to the other
The middleware component is integrated with the enterprise back-end through the enterprise
back-end interface; it is this component that contains all the business process integration. As
the middleware is a generic component it needs a customer interface to integrate it with the
enterprise back-end. The enterprise back-end is the complete set of applications that are
needed for the system. The enterprise back-end comprises of the data repository and the
business process engine, in the case of a RFID system this contains the data of all the tagged
objects and this is all send to the middleware.
3 .7 Standards
RFID like most technologies is governed by a number of standards, it important to have
standards for RFID applications as in some cases the data that it being used with the RFID
system is sensitive or very important. Over the last decade work has been carried out to
develop standards for RFID. There are currently standards for the air interface protocol, data
content, conformance and applications of the RFID system. One standards governing body
40

has created standards for the tracking of cattle; this was the International Organization for
Standardisation (IOS). The standards are shown in table 1 (RFID Journal, 2009)
ISO Standard Description
ISO 11784 How the data should be structured on tags used for the tracking of
cattle
ISO 11785 Defines the air interface protocol for RFID systems
ISO 14443 Defines the air interface protocol for payment systems and contactless
smart cards
ISO 15693 Defines the air interface protocol for vicinity cards
ISO 18047 For testing the conformance of RFID tags and readers to a standard
ISO 18046 For testing the performance of RFID tags and readers
Table 1 RFID ISO Standards
41

4 Requirements Specification and Analysis
In this chapter of the Report the project aims that were previously discussed in chapter 1 will
be discussed in detail. This chapter will also describe in detail the objectives of the system
and its functionality. The design methodology that the project will follow is also described
and other suitable methodologies will be discussed. The requirements of the system including
hardware and software that will be used during the development and implementation process
will be defined.
4.1 Problem Specification
For the wired range of location tracking technologies that have been defined in chapter 3
many can be implemented for this current scenario however not all would be the most suited
or most efficient.
Such technologies as GPS and GSM are perfect for large scale outdoors applications such as
tracking vehicles in a city or boats at sea or in the case of GSM tracking people across a
country. These can be perfectly implemented in the large scale applications that they are
already implemented in however they can suffer when used in small scale applications such
as tracking people in a building or tracking objects in a warehouse.
The previously mentioned was the main consideration for proposing RFID tracking to be
used for the current scenario. The RFID system that is proposed meets all the needs of the
needed solution, it must work well in a small scale, it must be low cost for implementation
and maintenance, and it must work in multiple applications and must be user friendly.
4.2 Objectives of System
The objective of this project is to develop a system that demonstrates the use of RFID in the
area of accurate real-time location determination over a small area.
42

4.2.1 Fire Service scenario
The main scenario that the project is addressing is of the Northern Ireland fire service, the
current issue is that the tracking of equipment across the fire server in Northern Ireland can
be very problematic. The current system in place is a written system that involves a member
of staff that is in charge of a fire engine to manually check that all the necessary equipment
needed for each job is present on the engine before it leaves the station. When the engine
returns to the station the member of staff must then manually check that all the equipment
that left the station on the engine is still present on the engine when it returned.
The process of checking the equipment involves looking at equipment and checking if the
serial number (if the item has one) matches with the number that the engine should have, or if
no serial number is present then as piece of coloured tape will be present on the item (each
station uses a different colour). The main issue with this is that the serial numbers can easily
wear away from regular use and in some cases two stations can use the same colour tape
and/or the tape could fall off the item. This means the item cannot be identified, and the
relation between station and item cannot be made.
The exchange or borrowing of equipment is very common in the fire service as some stations
do not stock all the needed items for more rare jobs. This means that equipment will be
passing through other stations and be used on other fire engines regularly. Without a solid
system to identify each item of equipment and the relationship between station and item, mix
ups can happen far too often.
The Northern Ireland fire service is broken down into 4 operational commands area (north,
south, east and west). There are a total of 68 stations across the 4 areas, each of these stations
network together and share services and equipment. The proposed system will need to allow
the networking of all these stations and the sharing of data.
43

The system will be placed at the main entrance and exit of the fire station, the system will
scan each time as fire engine leaves or enters the station. This will detect all the equipment
that is on the engine and will add this information to a database of all the currently tracked
equipment that is associated with the fire engine. The user interface of the system will be a
fully accessible interface that will provide the user with a method of adding tagged items to
the database, editing tagged items on the database and removing tagged items from the
database. The interface will also provide an up-to-date status of each item on the database e.g.
“in” or “out”. There will also be an ability to search for items in the database thus being able
to view the search items details and location status. If items have been flagged as “out” when
an engine has left and not flagged as “in” when the engine returns, this item will be flagged
as missing and a notice will be displayed to the user to draw this to their attention. The
unique ID of each available RFID tag will also be stored in the database and the tag will be
given to one of the tracked subjects. The tag is assigned to that individual in the application.
The tags will be detected by the Trolley Scan system, which will send the location data of any
tags in the monitored area to the system. The system on will be written in C# and will run on
any modern Windows operating system with the .NET 2.0 Framework or higher.
4.2.2 Other Application
The fire service scenario is a common problem in industry, is many large companies’ time,
money and effort can be wasted trying to manage inventory or stock. In many cases the stock
management is done manually which is highly susceptible to human error. The solution of
using RFID tags to track stock could save large amounts of money and time as the system
could be fully automated.
4.3 Design Methodology
Design methodologies are ways of developing a system for a unique situation. This is one of
the fundamentals of software engineering. It accompanies requirement specification
processes, analysis processes, implementation processes and testing processes. The waterfall
and incremental design methodologies are covered in this chapter.
44

4.3.1 Waterfall Methodology
The waterfall model is a software development process that is sequential, as each process
must be complete before the next can be started. The model has its roots in the manufacturing
industry as it was a very reliable model that is easy to follow. Figure 11 shows the seven
stages of the model.
System requirements
Software requirements
Analysis
Program design
Coding
Testing
Operations
Figure 11 WaterFall Method ⑫
The waterfall methodology’s advantage is that it is extremely disciplined. Its specifications
are strongly defined and must be strictly followed if the end product is to be produced to the
highest standard.
⑫ http://www.maxwideman.com/papers/plc-models/1990s.htm
45

The disadvantage of the waterfall model that there can be time delays in the project time line
as one part cannot be started until the previous is finished, in some cases this can mean that
members in the project are left with no work while they wait on other parts of the project
which is a waste of resources.
4.3.2 Iterative / Incremental
The iterative methodology is a software development model that addresses weaknesses of the
waterfall method. In this model the different parts of the project are developed separately and
then integrated during the project timeline. Part of the project time line is designated for
improvements; this is done as mistakes can be built upon as the development was first carried
out Figure 12 shows the cyclical nature of the development model.
Figure 12 Iterative Development Model ⑬
4.3.3 Design Methodology Selection
The development of the project system will follow the waterfall method mainly however will
also integrate some aspects from the iterative method. The requirements specification,
analysis and initial design will be carried using the waterfall model, resulting in detailed
documentation which will be relied upon later in the implantation process. The
implementation and testing phases will follow the iterative method, as any design bugs will
be caught and can be re-designed without having to start from the beginning up.
⑬ http://www.answers.com/topic/iterative-and-incremental-development
46

4.4 Requirements Specification
The requirements for this project are split into two separate areas: functional requirements
and non-functional requirements.
4.4.1 Functional Requirements
The following defines the functional requirements into two classes; requirements for the user
and requirements for the system.
4.4.1.1 User
After loading the program, the user should be able to:
Quit the program
Access the status screen
View a list of tags being tracked by the system
Search for a tag that is being tracked
Add new tags to track
Assign tags to equipment
View and edit information on each tag
Calibrate the RFID reader for the area
View the software help at any time
4.4.1.2 System
The system should:
Run on any machine using the Windows operating system
Track the position of tags in the monitored area using location data provided by the
TrolleyScan system
47
Store information, accessible at any time, on equipment in a database
Associate tag IDs from the RFID-Radar system with tag IDs assigned to objects
4.4.2 Non-Functional Requirements
Accessibility – Each component of the software must be readily accessible and easy
enough to use with minimal training and experience
Time Constraints – The project is to be completed within two semesters (24 Weeks)
Reliability – The system should load at any time and provide reliable information.
Any errors will be handed by the system and not affect the user experience
Performance – The system must load and warn the user if tags have not returned. The
retrieval of information about tags should be instantaneous, if there is a delay then the
system will display a message to the user thus to improve the user experience
Extensibility – The software should be written in such a way as to allow extra
functionality to be added in the future, at any time add-ons and or extensions can be
added to the system to accommodate for different scenarios
Maintainability – Software code must be well-structured, readable and well-
commented to allow for the implementation of extra functionality. This system will
also use external configuration files to insure that no information is hard coded
Scalability – The number of tags tracked by the system within the monitored area
should be limited only by the reader’s input and output capabilities
Efficiency – The software should use as little resources as possible to perform at an
acceptable level
The user interface must conform to HCI standards
4.4.3 Software Requirements
Microsoft Visual Studio 2008/Visual C# Express edition
48

4.4.4 Hardware Requirements
Trolley Scan RFID-Radar System (Reader and Antenna)
RFID Tags
Desktop or Laptop Computer
RS-232 to USB cable
49

5 Design Phase
This chapter discusses the design phase of the project. The functions of each component in
the system, the hardware and software will be outlined.
5.1 Hardware ComponentsThe hardware utilised in the implementation of the system include a laptop/desktop
computer, RFID reader and RFID tags.
5.1.1 Laptop / Desktop Computer
Any laptop or desktop computer running Windows XP or Windows Vista can be used in the
hardware configuration for this system. The machine must have an RS232 (serial) port to
allow the RFID reader to be connected or a USB port if the RS-232 to USB adaptor is used.
A laptop using an RS232-to-USB Adapter, as shown in Figure 13, or a desktop PC will be
used for this system.
Figure 13 Acer Aspire 5600 with RS232-to-USB Adapter ⑭
⑭ http://www.acer-euro.com/
50

5.1.2 Trolley Scan RFID-Radar system
Figure 14 Trolley Scan RFID-Radar System ⑮
The Trolley Scan RFID-Radar system, shown in 14, consists of the following components:
Reader – The reader connects to the computer via an RS232 port. It measures the
signals travelling from transponders and provides an energy field to power the passive
tags. The reader’s processor operational frequency can be set anywhere in the range of
860MHz to 960MHz.
Tags/Transponders – The tags are passive backscatter Ecotag UHF transponders. The
credit-card-sized 200uW EcochipTags have a range of ten metres, while the 5uW
stick tags have a maximum operating range of forty metres. Figure 15 shows these
tags in more detail.
Antenna Array – The antenna array contains one transmit antenna for energising the
passive transponders and one antenna for each receiver, giving a total of three
antennas in the array.
⑮ http://www.rfid-radar.com/introduc.html
51
Antenna
Reader
5uW Stick Tags
200uW EcochipTags
Serial Cable
Coaxial Cables

Figure 15 5uW Stick Tag and 200uW Ecochip Tag
5.2 Software Components
The major software component, running on the either the Microsoft Windows XP or Vista
operating systems, used in the project’s design and implementation is Microsoft Visual
Studio 2008.
5.2.1 Microsoft Visual Studio 2008
Microsoft Visual Studio is a software development tool used for the creation of software
applications on any platform supporting Microsoft’s .NET Framework. Visual Studio 2008
allows development of the four main development languages: Visual C#, Visual Basic.Net,
Visual J# and Visual C++. This project created using the Visual C# language. It uses the
extensive class library made available by Microsoft’s .NET 3.0 Framework to add many
types of functionality, such as networking, graphics and methods to interact with the
Windows operating system.
5.3 Design considerations
When designing the system there is many factors that need to be considered these include the
positioning of the system to obtain maximum performance. For the scenario that this report
addresses the system will need to be placed at the main entrance/exit of the building for the
fire engine.
52

Figure 16 RFID System for Fire Service
Figure 16 shows the layout of the proposed system, the RFID reader will be at each side of
the main entrance/exit and will have the set of three antennas previously mentioned attached
to the reader. Both readers will then attach to a local machine that will be used by the staff in
the station to check the tagged items.
5.3.1 User Interface
The user interface will use tabs for ease of browsing through the different screens. Each tab
will give the user a number of different options and varied information from the database.
There will be three main tabs that the user will be provided with, once they have successfully
logged into the system. The log in screen will follow the design showed in Figure 17.
Figure 17 Log In Screen
53

After the user logs into the system using their personal username and password, they will be
directed to the main system screen. This will contain the company logo which can be changed
using the accompanying configuration files instructions on how to change this will be
supplied in the system manual. The main screen will also contain the tab control; this will
have three following tabs however there will be the ability to add more tabs later if the user
decides to expand the system.
Status
Tags
Settings
The status tab will contain an up-to-date status of the tags that are being monitored by the
system. There will be a section that will show the list of vehicles and their status e.g. “in” or
“out”. There will also be a section that will show a list of tags that have not returned but their
associated vehicle has returned. These tags will be considered missing, along the bottom of
the screen there will be buttons provided options for each section. The user options will
include an update button that will update all the information on the screen; this will also be
done at 10 minute intervals (the reason for the interval is to save on process power as each
update will take up process power). An example of the status screen is shown in Figure 18.
Figure 18 Status Screen
The tag screen will allow the user to add, edit, remove and search for a tag each of these
options will display the tags information. The user can navigate to this screen by clicking on
the tab called “Tags” the user will also be directed here from the status tab if the “View Tag”
button is selected. An example of the tags screen is shown in Figure 19.
54

Figure 19 Tag Management Screen
The last tab is the setting tab this will contain all the options for the user and will allow them
to change many factors of the system such as the time interval for updating the system, the
look and feel of the system, add users to the system etc. They user will also have the ability to
set constrains on the system such as limit the number of tags that can be on the system or
limit the users that can access the system. The options in this screen will reflect the setting
stored on the applications accompanying configuration files. As setting are changed on this
screen the configuration file will be updated thus saving the setting for the next time the
application is started. This screen will be defined later in the design process as many of the
features that will be on this screen will change over the duration of the development process.
The system will use neutral colours such as white and grey, this will help to improve the user
experience for colour blind users or users of vision disabilities.
5.4 HCI Considerations
The proposed system will meet the standard HCI guidelines; the following is the list of the
guidelines that will be followed.
Consistency – The user interface will be consistent across all screens in the system.
There will always be a main menu across the top of the screen and there will always
be a help button that will provide the user with help and the instructions on how to use
the system.
User Experience - The user will not have to navigate through more than three screens
to perform any tasks. All buttons, labels, group boxes, menu items and message boxes
will be clear and understandable by all levels of users.
55

Look and Feel – The user interface will have a consistent theme of colour throughout
the application, this will be a neutral greys and white. The organisation that acquires
the system can request a custom theme/colour scheme. The colour of the system will
be customisable from the settings screen; this will also include the ability to add a
custom image to the application for the organisation logo.
Feedback – The user will receive feedback for every action performed
Error Prevention – The system will validate all user input and disable any inactive
form controls.
5.6 User Cases
The following section defines the user cases/scenarios for the system, these are the different
cases that the user will be faced with or that the user can carry out. All the user cases are
defined in the use case diagram; this is a Unified Modelling Language (UML) diagram that is
a standard across the software engineering discipline. The use case diagram is shown in
Figure 20.
Figure 20 Case Diagram for Proposed System
56

The following are the use case descriptions for the use case diagram in Figure 20.
Use Case Name Open User Interface
Primary Actor User
Data Username/Password
Description The user starts up the application and logins
into the system.
Preconditions None
Post Conditions The application loads and displays the main
screen to the user.
Table 2 Use Case: Open User Interface
Use Case Name Add Tag
Primary Actor User
Data Tag ID, Equipment description, equipment
location
Description The user adds the new tag to the database and
associates the tag with a piece of equipment.
Preconditions The user has loaded the main application can
selected the menu item for adding a new tag.
Post Conditions The new tag and its associated information is
added to the system database and the details
are displayed to the user for verification.
Table 3 Use Case: Add Tag
Use Case Name Edit Tag
Primary Actor User
Data Tag ID or Equipment description
Description The user enterers either the tag ID or the
equipment and is displayed with the tag
information or a list of matching tags if the
description is used. The user then can edit
each item of information that is stored on the
57

tag.
Preconditions The user has loaded the main application can
selected the menu item for editing a tag.
Post Conditions The updated tag information is saved to the
database and the information is displayed to
the user for verification.
Table 4 Use Case: Edit Tag
Use Case Name Remove Tag
Primary Actor User
Data Tag ID or Equipment description
Description The user enters the tag ID or equipment
description and is displayed with information
on the tag or a list of matching tags of the
descriptions is used. The user then can
remove the tag from the database.
Preconditions The user has loaded the main application can
selected the menu item for removing a tag.
Post Conditions The tag and its associated information is
displayed to the user before it is removed
permanently.
Table 5 Use Case: Remove Tag
Use Case Name Search Tag
Primary Actor User
Data Tag ID or Equipment description
Description The user enters the tag ID of equipment
description. The user is then displayed with
the tag information or a list of matches if the
equipment description is used. The user is
then displayed with the following options;
58

edit or remove the tag.
Preconditions The user has loaded the main application can
selected the menu item for searching for a
tag.
Post Conditions The tag and its associated information is
displayed to the user for verification.
Table 6 Use Case: Search Tag
59

5.7 State Diagrams
The following section illustrates the interaction between the user and the system through state
diagrams, state diagrams are a well know UML diagram used to illustrate the processes of the
system.
Figure 21 State Diagram: User Logging into System
Figure 22 State Diagram: Update Status Screen
60

Figure 23 State Diagram: Managing Tags
Figure 24 State Diagram: Setting Application Options
61

6 Implementation In this chapter the implementation stage of the application described in chapter 5. This
chapter will also describe the process of setting up the equipment needed for the application.
6.1 Equipment ConnectionThe first stage when connecting the equipment is to choose the correct location to set up the
RFID Radar equipment. The perfect location for any RFID radar system is to have the
antenna high above the ground, with no obstacle in the radio path of the antenna. Figure 25
shows the ideal position of the antenna.
Figure 25 Ideal Radio Setup
In Figure 25, the antenna is set at a height so that the radio waves have a long path before
they reach an obstruction. This will provide the RFID radar with strong signals and give
accurate readings. Once the antenna is in the optimum place for the location that tags will be
tracked the next step is to set up the antenna with the reader to retrieve data. The first stage is
to connect the reader with a computer. In this case a standard laptop was used to connect with
the reader. The input and output port on the reader is a RS-232 (serial) port. As mentioned in
chapter 5 a standard laptop does not have a RS-232 port thus a USB-to-RS-232 cable must be
used to mimic the RS-232 port on the laptop. Once the connection is made between the
reader and the laptop the reader will shown on the device manager as a “COM” port, the
software that was supplied with the reader using the COM port to communicate with the
reader.
62

One issue that was discovered with the supplied software was that the supplied software for
reading data from the radar assumed that the radar was connected to COM1, as there can a
number of different devices connected to the computer through serial ports there is a large
number of COM ports that the computer can handle. In some cases other devices where
connected to the computer and thus COM1 was taken when the reader connected to the
computer and the reader was given a different port name. This meant that the supplied
software would not work in some cases. This issue was taken into consideration when the
application was developed to interact with the reader.
Once the reader was set to COM1 the supplied software was used to test that the radar was
working and that the data could be retrieved, once this was verified and working a testing
application was developed. The testing application was a simple C# .NET Windows forms
application that used a serial connection to interact with the reader, the serial connection was
established using the SerialPort⑯ class which is part of the System.IO.Ports namespace in
the .Net framework. This class contains a number of different objects and methods that can
be used for the sending and receiving of data from a serial port
Method/Property Implementation
Open(); Opens the port for input and output communication.
Close(); Closes the port.
IsOpen; Boolean value returns true if the port is open, used to
prevent the open command being preformed if the port is
already open.
DataReceived; Event triggered when the program receives data from the
serial port.
ReadExisting(); Reads the data currently held in the port’s received-data
buffer.
WriteLine(String
text);
Sends a String to the equipment connected to the serial
port.
Table 7 Serial Port Methods
⑯ http://msdn.microsoft.com/en-us/library/system.io.ports.serialport.aspx
63

In table 7 the common serial port methods are shown, the most used methods are the open
and close methods as these are used to access the data from the reader. The IsOpen variable is
used to prevent open call to be made on the port when it has already been opened. The
DataReceived event is used in conjunction with a custom event handler to read the data from
the reader, every time the reader obtains data it sends it through the port and the DataRecived
event is triggered. This then triggers the custom event handler that will carry out and action
with the, with the help of the ReadExisting() method. The last method is the WriteLine(String
text) method. This is used to pass information to the reader; the reader being used is set up to
operate different actions some of these commands are shown below:
“ON” – Turns the energising field on and the reader starts to receive data if tags are
present.
“OFF” – Stops the reader from receiving data and turns off the energising field.
“CRN=<x>” – Sets the distance that the radar will use for calibration where x is the
distance in centimetres.
“CALIBRATE” – Calibrates the radar to the predefined distance or if no distance has
been defined then the calibration is carried out to a distance of 9 meters.
These are the most common commands that are used, the majority of the time no commands
will be passed to the radar.
6.2 Testing For the purpose of testing the radar a simple Windows form application was created that
could connect to the COM port, start receiving data, stop receiving data and send data to the
reader. This simple application was used to carry out the test cases that will be defined in
more detail in a later chapter, the application user interface (UI) is shown in Figure 26.
64

6
Figure 26 Testing Application UI
Each of the items highlighted in Figure 26are described in more detail in table 8.
No. Description
1 Allows the user to enter the COM port
number that the reader is currently using.
E.g. “COM2”
2 Allows the user to define the test name, this
will be the name that the test log file will be
saved as.
3 Shows the currently read tags.
4 Shows the currently read tags distance in a
large font to help the user with using from a
distance.
5 Allows the user to input text and send this
text to the radar at any time, e.g. send
commands to the radar.
6 Allows the user to turn the radar on/off
Table 8 Testing application UI details
The code that allows the application to communicate with the serial port is a standard code
used to connect to any device connected on a serial port. To connect the application with the
serial port the port must be defined by creating a serial port object and then defining the port
details the following code illustrates this.
65

Tag IDDistance Angle
private SerialPort _port;
_port = new SerialPort("COM1", 19200, Parity.None, 8, StopBits.One);
The second line of the code shows how the port details are defined the first parameter is the
port name in this case it is COM1 however this could be COM1-256 as total number of COM
ports for most operating systems is 256. The second parameter is the baud rate which is the
number of singling changes or pulses per second of the radar; this is specified in the technical
documentation that came with the radar. The third parameter is the parity this is used as a
error check on the data, ensures that the number of bits with the value one in a set of bits is
even or odd. The forth parameter is the data bits this is range of the data that will be
communicate through the port. The last parameter is the stop bits, this is a character in the
transfer that lets the receiver know that the byte being sent has finished. After the port
connection has been created and defined the next stage is to define the event handler that will
handle the received data. This is done with the help of a customer event handler that is
assigned to the DataReceived event; the code following code shows this.
_port.DataReceived += PortDataReceived;
The code for the customer event handler can be place in the same code file as the declaration
of the serial port. The following code shows the event handler that captures the incoming
data from the reader. private void PortDataReceived(object sender, SerialDataReceivedEventArgs e) { try { _data.Append(_port.ReadExisting()); } catch (Exception ex) { MessageBox.Show(ex.Message, "ERROR", MessageBoxButtons.OK); }
}
The main part of the event handler is that try catch statement, this tries to append the data
from the port to a previously created StringBuilder object. When creating the event handler
the first version called a method that would process the data received however errors
occurred when the code tried to use the data as it was received it would only arrive in slots of
8 bits and not when the radar had complete a read operation on a tag. The data needed to be
in the following format to make it usable:
BBBFL3060^ 60.01 000.0
66

However as the data was appended to the StringBuilder it would only be in 8 bits at a time
e.g. BBBFL306 and the distance and angle data would come in with the second read. The
solution to this was to create a timer that would tick every second (as this was the standard
interval for radio signals from the radar) and on the tick would check if the data in the
StringBuilder was the data for a full read and if it resembled the previous data example. If the
StringBuilder did contain the data for a full read then the data was processed. The following
code shows the validation carried out on the StringBuilder.
private void _timerCheckData_Tick(object sender, EventArgs e) { If(_data.ToString().EndsWith("\n\r"))
The code checks if the StringBuilder ends with “\n\r” as the end of each full read ends with
this. If the data contained in the StringBuilder conforms to this it will then continue on to be
processed and displayed to the user.
When the testing application is used it will print the results from the reader to the screen,
showing the tags being read and the distance and angle of the tags. The application will also
print the information to a text file that will be saved to the user local machine. An example
text file with the application output is shown below:
Test Starting
19/04/2010 13:38:57:
19/04/2010 13:38:58:
19/04/2010 13:38:59:
19/04/2010 13:39:00:
19/04/2010 13:39:01: BBBFL3060^ 60.01 000.0
19/04/2010 13:39:01:
19/04/2010 13:39:02: BBBFL3060^ 59.97 000.0
19/04/2010 13:39:02:
19/04/2010 13:39:03: BBBFL3060^ 60.02 000.0
19/04/2010 13:39:03:
Test Ending
The only change made to the data when it is printed to the file is that the time and date is
appended to start of each read. This is to help with the reading of the data as each second is a
single read from the radar.
67

6.3 Scenario Solution Application
The scenario that is described in pervious chapters is of an automated inventory system, that
can track the status of equipment and engines that belong to the fire service. The final
application was created with C# .NET and used the same principles as the testing application
in respect to connecting to the radar.
6.3.1 Program GUI
The user interface of the application was designed to be very user friendly and easy to
navigate around. There are no sharp colours or bright flashing graphics thus not causing
issues to user with sight disabilities. The system can be used fully with only a keyboard
meaning that the system will conform to accessibility software for physically disabled users.
The main screen that the user is presented with when the system is started is shown in Figure
27.
Figure 27 Main UI Screen: Before User Login
This screen will shown when the user starts the system and has not logged in yet and the UI
elements will not be usable until the user logs in. Once the user selects the “Log In” button
they will be presented with the log in screen shown in Figure 28.
68

Figure 28 LogIn Screen
The user will then enter their allocated username and pass, in the scenario each station is
given one username and password meaning that one the user logs on they are logged in as the
station. Once the user has successful logged in they will be presented with the main screen
with all the UI elements available for use, this is shown in Figure 29.
Figure 29 Main Screen: After Login
Each of the items highlighted in Figure 29 are explained in more detail in Table 9.
No. Description
1 Navigation tags used for navigating through
the different UI tabs of the system
2 ON/OFF button used to turn on/off the radar
3 Alerts list displays any items that have been
flagged as an issue⑰
4 Live radar view shows all the tags that are
currently being read by the radar
5 Logout button allows the user to logout of the
system and thus disabling the UI elements on
⑰ The different alerts and what makes and item become an issue will be covered in detail in later chapters
69
1
3
2
4
5
6
7

the screen
6 Close button allows the user to exit the
application
7 The current station name of the user logged
into the system
Table 9 Main Screen UI Elements
The user will be able to view the current tags being passed through the range radar and also
see any issues with tags from this screen. If there is an issue with a tag or the user needs to
edit, add or remove a tag they can do so from the “Manage Tags” tab. This screen is shown in
Figure 30.
Figure 30 Main Screen: Manage Tags Tab
The items highlighted in Figure 30 are explained in more detail in Table 10.
No. Description
1 Search box that allows the user to search by
item name or tag ID
2 Check box that allows the user to enable the
advanced search options
3 Advanced search options that allow the user
to filter the search by the location, status and
engine No.
4 Data view that displays the search results the
70
1
2
4
35

can select the different records and use the
edit and delete buttons on the selected record
5 Add, edit and delete buttons that allows the
user to add, edit or remove records from the
database. The add and edit buttons will open
a new dialog to perform the task or adding or
editing.
Table 10 Main Screen: Manage Tags Tab UI Elements
If the user selects the add button they will be presented with the add dialog this is shown in
Figure 31. The user will be able to fill out all the needed details on the tag such as:
Name
Tag ID
Station
Status (IN/OUT)
Engine No.
Description (this is not mandatory)
Figure 31 Add Tag Dialog
Once all the mandatory details have been added to the form the user will be able to save the
details to the database. The edit button on the main screen will also open the same dialog
however the details of the tag will be in the provided slots in the form and the user will be
able to edit each of these. Some validation rules have been applied to the form, such as if the
user changes the station of the tag the engine drop down will update to display only the
engines that belong to that station.
71

6.4 Database When the user adds edits or removes tags in the application the changes are written directly to
the database that the application uses. Even when the user starts the radar application the
database is used to check the users login credentials before the can be successfully logged
into the system. The database is made up of the following tables:
Engine
Equipment
Station
User Details
6.4.1 Engine Table
The engine table holds the data on each engine across all the stations, the data that is held is
shown in Table 11.
Name Data
Type
Length Comment
Tag ID Text 9 The RFID tag ID of
the engine
Location Text 20 The current station
that the engine is
located in
RegNumber Text 8 The registration
number of the engine
Status Text 3 The status of the
engine either
IN/OUT
Station Text 7 The station that the
engine belongs to
LastStatusChange Text N/A The last time the
status of the engine
was changed this is
72

used for the
application to stop
errors in the status
updates
Table 11 Engine Database Table
6.4.2 Equipment Table
The equipment table holds information on all the items of equipment across all the engines
and all the stations. The data that is held on the equipment is shown in Table 12
Name Data
Type
Length Comment
Name Text 20 The name of the item
TagID Text 9 The RFID Tag ID of
the item
CurrentLocation Text 7 The current station the
item is located at
Status Text 3 The status of the item
(IN/OUT)
LastStatusChange Date/
Time
N/A The last time the status
of the item was
changed this is used
for the application to
73

stop errors in the status
updates
Description Text 255 A short description of
the item
Engine Text 8 The registration
number of the engine
that the item belongs to
Station Text 7 The station that the
item belongs to
Table 12 Equipment Database Table
6.4.3 Station Table
The station table holds all the information on the different stations that make up the fire
service. The information that the table holds on each is shown in Table 13.
74

Name Data Type Length Comment
StationName Text 20 The name of the station
ReferanceNo Text 7 The reference number of the station
Street Text 20 The street the station is located on
City Text 20 The city the station is located in
Postcode Text 7 The postcode of the station
Tel Text 11 The Telephone number of the station
Email Text 20 The main contact email for the station
Table 13 Station Database Table
6.4.4 UserDetails Table
The UserDetails holds all the details on the different user accounts for the system. The
information that is held on the user account is shown in Table 14.
Name Data Type Length Comment
Username Text 20 The name that the user will use to log into the system
normally the same as the station name
Password Text 20 A password chosen by the manager of the station that
must be greater than 8 character and have at least one
number
Station Text 7 The reference number of the station
Table 14 UserDetails Database table
Each table in the database links together with a foreign key relationship. The relationships are
shown in Figure 32.
75

Figure 32 Database Relationships
76
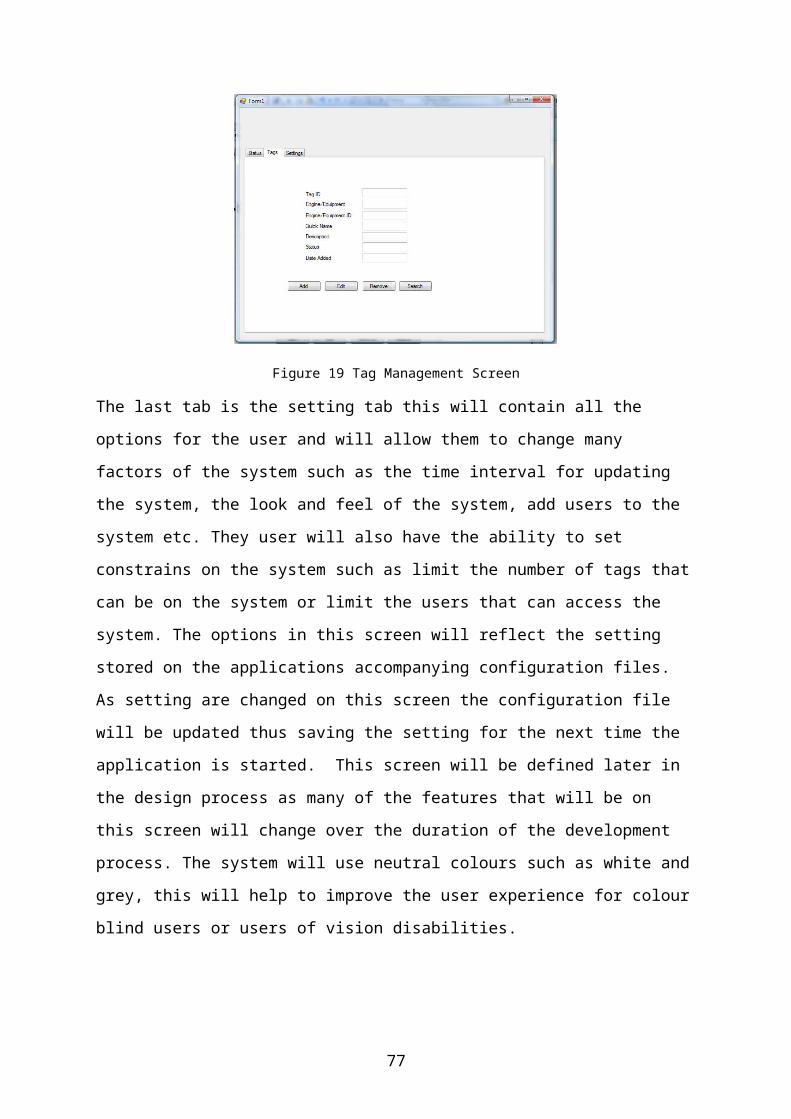
7 Testing In the chapter the testing phase of the project is discussed in detail and the planning of the
testing is outlined. Test cases that were carried out on the system are outlined and the results
are given. The tests were carried out to see how the RFID radar and RFID tags perform under
different environments and how the equipment would perform in a real world scenario.
7.1 Test cases Test cases were created that would test the radar and tags to their limit and expose factors that
can cause the system to fail or lower the performance of the system. The list of test cases for
both passive and active tags are shown in appendix A and B, the next sections will explore
some of the test cases and give more information on how the tag and the radar were affected
by the conditions and how the conditions affected the tag and radar.
7.1.1 Test Case 4 Active and Passive
Test case 4 involves grouping the tags both passive and active together and check if the radar
can read all the tags at the same time. This test tries to discover if the radar can handle stress
by over loading the read area with a large number of tags. For the test to be carried out the
tags where all mounted to a cardboard box, the box would not reflect the radio signal thus
making it the perfect mount. In total 11 tags were used 9 active tags and 2 passive, the tags
are shown in Figure 33.
Figure 33 Tags Mounted to Cardboard Box
77

This box was then moved into range of the radar and the results were logged. The following
is a section of the log.
Test Starting
01/04/2010 12:53:53: BCBBB4685^P 60.08 000.0
01/04/2010 12:53:53: BBBFL3175^ 59.95 024.8
01/04/2010 12:53:53: BBBFL3060^ 59.79 -001.8
01/04/2010 12:53:53: BCBBB4677^P 60.13 000.0
01/04/2010 12:53:53: BCBBB4686^P 59.85 000.0
01/04/2010 12:53:53: BCBBB4684^P 59.99 000.0
01/04/2010 12:53:53: BCBBB4678^P 60.04 000.0
01/04/2010 12:53:53: BCBBB4688^P 60.05 000.0
01/04/2010 12:53:53: BCBBB4680^P 59.94 000.0
01/04/2010 12:53:53: BCBBB4691^ 17.81 010.7
01/04/2010 12:53:53: BCBBB4686^P 59.98 000.0
#### all 11 showing up
01/04/2010 12:53:53: BCBBB4677^P 11.12 000.0
01/04/2010 12:53:53: BCBBB4678^P 03.02 000.0
01/04/2010 12:53:53: BCBBB4688^P 60.07 000.0
01/04/2010 12:53:53: BCBBB4684^ 00.35 020.3
01/04/2010 12:53:53: BCBBB4680^P 00.0 000.0
01/04/2010 12:53:53: BCBBB4682^ 00.10 019.2
01/04/2010 12:53:53:
When the test started all 11 tags where detected and showed on the radars range however as
the test continued some tags dropped out of range. The reason that some of the tags had
dropped out of range could be due to a number of environment factors that will be discussed
in more detail on chapter 8.
7.1.2 Test Case 8 Active
In this test case the active tags where place in different locations in the testing room, some
were placed on desks, chairs, boxes, on the floors and on the roof. The map of the room and
the location of each tag are shown in appendix C. Details of each tag and information on the
tag location is shown in Table 15.
78

No. Tag ID Distance from Radar
(m)
High from the
floor(cm)
1 BCBBB4686 4 74
2 BCBBB4680 6.2 48
3 BCBBB4684 4 70
4 BBBFL3175 1.3 15
5 BBBFL3060 1.3 15
6 BCBBB4691 3.11 74
7 BCBBB4678 5.69 74
8 BCBBB4677 6 74
9 BCBBB4688 4.53 0
10 BCBBB4686 3.20 250
11 BCBBB4682 5.32 70
Table 15 Test Case 8: Tag location Details
The first ten seconds of this test log is checked to see which of the tags are most read. In the
first ten seconds of the test the only tags that had been read were:
BCBBB4684 – 10 reads
BCBBB4691 – 10 reads
BCBBB4688 – 10 reads
BBBFL6030 – 8 reads
BCBBB4682 – 10 reads
During the rest of the test other tags such as BBBFL3175 are read although not to as a high
degree as the previously mentioned tags, as the time progresses the most read tags are
79

BCBBB4691 with the most reads, BCBBB4688 with the second most and BCBBB4684 as
the third most. Using this data an imaginary read zone can be formed, this zone is a place that
tags can be read with the best radio signal.
7.1.3 Test Case 10 Active /Passive
In this test case the tag is attached to a bottle of water, the bottle is opaque however the water
is clear. The bottle with the tag attached is shown in Figure 34. The bottle was then held at a
level height as the radar approx 174cm high from the floor and moved slowly away from the
radar.
Figure 34 Test Case 10: Water bottle with tag attached
In this case the tag was facing away from the radar thus making the radio signal have to travel
through the bottle and the water to reach the tag. The tag was detect by the radar however the
radio signal was very weak and at a distance of 2 meters the tag could no longer be read as
the signal was too weak. The test was also repeated using a clear bottle with and without
paper covering it. When the same test was carried out using a passive tag the results were
very similar results in both cases the signal was very weak and in both cases the signal
dropped.
7.1.4 Test Case 16.00 – 16.02 Active and Passive
80
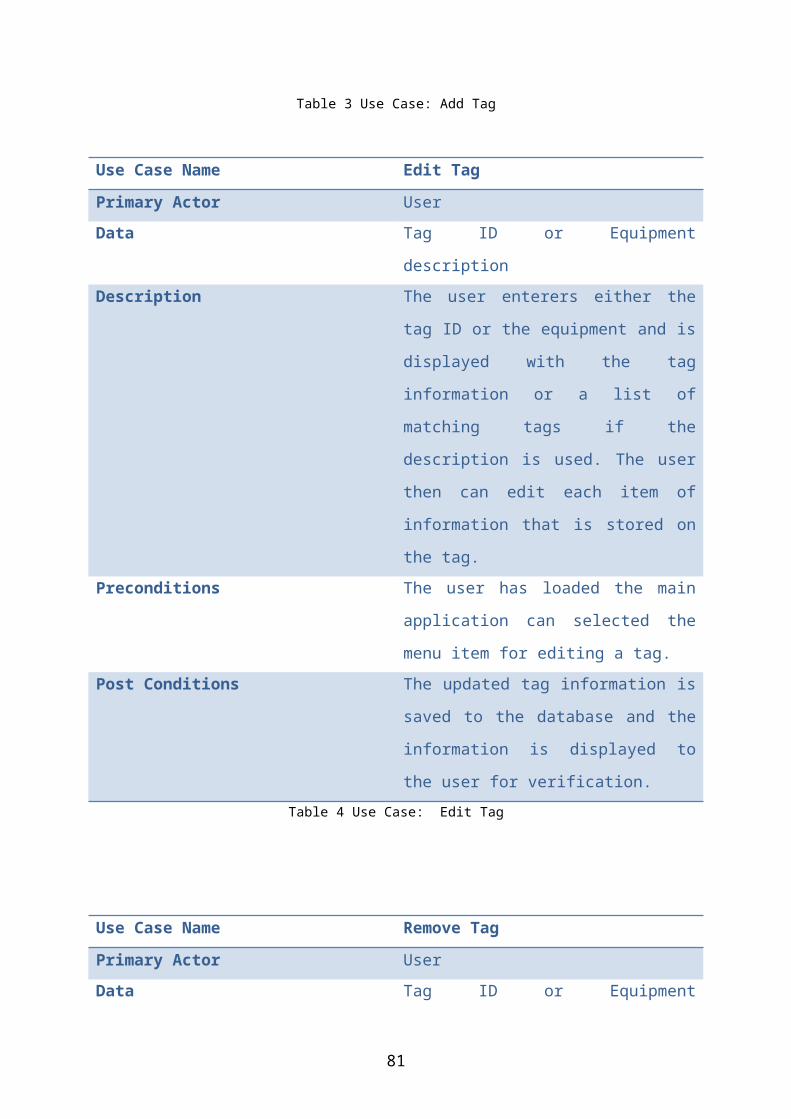
In the test cases of 16.00 till 16.02 the tags and the radar are testing against the signal
blocking ability of aluminium foil. For the tests the tags active and passive are placed in front
of foil with the matt side facing the radar and again with the shiny side of the foil facing the
radar. The last test carried out was to place the tag inside the foil with the shiny side facing
out. The three test sets are shown in Figure 35, Figure 36 and Figure 37.
Figure 35 Test Case 16: Active
Tag on Foil
Figure 36 Test Case 16: Passive
Tag on Foil
Figure 37 Test Case 16: Tag
Wrapped in Foil
The results of the tests show that when the foil is used as an obstruction between the radar
and the tag with the matt side facing, the radar that the tag can still be read (active/passive)
with a weak signal of up to 4 meters. However if the foil is used with the shiny side facing
the radar the results are different, for the active tag the tag could be read but with a very weak
signal and the tag could not be read at a distance of 30cm. For the passive the signal was very
weak again but still getting reads however the tag could not be read at a distance of 15cm.
The final test with the foil was to place the tag inside the foil with the shiny side facing out.
For both active and passive the results were the same, the tag could not be read no matter
what the distance was from the radar.
81

8 Evaluation
This chapter will bring together all the information gathered from the tests explained in the
previous chapter. The information will be used to discuss how the RFID radar and tags can be
effect by their environment and how this affects the overall RFID system. The proposed
software for the previously mentioned scenario will also be evaluated to see whether it met
the functional and non-functional requirements set out in chapter 4.
8.1 RFID and its environment
For the purpose of testing the RFID equipment was set up in a lab, which caused a number of
issues with the equipment. As the lab was an ideal location for a close indoor RFID
application the equipment in use was very sensitive and worked at optimum performance in a
wide open space with either the radar mounted very high above the ground or the ground to
be a soft area such as a field or grass area. The main reason the equipment worked better in a
wide open space was that the radio waves would not have any hard obstacles in their path and
could have a long strong wave to gather accurate data. Due to weather constraints it was not
possible to test the equipment in an area as previously described. This meant that the radar
was set up in a lab as shown in Figure 38.
Figure 38 RFID Radar Lab Setup
82

As the equipment was not in the ideal location some of the results in the testing chapter and
the test case appendix A and B. Cannot be 100% accurate however the fact that the
equipment is still in what can be classes as a real life scenario location the results are still
credible.
In test case 4 the environment variables that can affect the RFID equipment was first tested
and during the test a number of tags dropped in and out of read, this may have been due to the
placement of the radars antenna. As the location with solid floors and walls close by could
have caused the miss reads on the radar. Although the 11 tags showed on the log at the start
some of the tags had the “^P” at the end, meaning that the reader was predicting the location
and reading of the tag based on previous readings. This is a standard practice for the reader
being used when the signal is weak, the reader will predict the location and reading of tags.
The fact that some tags had weak readings showed, that the radar in its current environments
found it hard to detect a large number of tags. This could be due the number of factors such
as the radio signal bouncing off the walls in close proximity and the hard floor and roof. It
could also be caused by the interference of other tags in close proximity each tag had a
distance of 8 centimetres around it.
In test case 8 the tags where placed in different location, however five tags where the most
common read tags. The similarities between the five previously mentioned tags have to be
taken into consideration, the height of BCBBB4684, BCBBB4691 and BCBBB4682 are
close as two are 70cm and one 74cm, this shows that tags at this height have a higher chance
of being read. However this could be contradicted by the BBBFL6030 and BCBBB4688 tags
as they are close to the floor, with one being at floor level and the other at only 15cm high.
The factors that might affect the radio signal can give more information on the findings, the
tags close to the floor did not have hard reflective object in the radio path giving a good
strong radio signal. The same applies to the other tags on a higher level; the two tags at 70cm
high were placed on top of cardboard boxes which don’t reflect radio signal giving a good
radio path and a good radio signal. The only irregularity is with tag BCBBB4691as it was
placed onto of a hard wood table that would be a strong radio reflector however as the tag
was placed at the edge of the table the signal did not have to travel across the table which
would have caused radio path issues.
83

One other environmentally factor that was tested against the radar was water. In test cases 10,
11 and 11.01 the tag was placed on the other side of a water bottle when the clear bottle was
used the radar could get a good strong signal and be able to read the tag at all distances. This
shows that water alone does not disturb the radio wave, however when the radio wave has to
travel through and object that is not transparent the radio signal is affected. This is also
shown in the test with the bottle covered in paper as the radio signal was weak and lost read
at 2 meters. The results of the test when carried out using passives were very similar. This
shows that the water can affect the signal for passive tags, passive tags use the signal from the
radar thus if the signal from the radar has to pass through more obstacles then the signal is
going to be very weak.
The last and most powerful factor tested on the radar was the use of aluminium foil, as this is
widely used to prevent the read of RFID tags. The foil was most effective when used with the
shiny side facing towards the radar, as this will give the most amount of radio wave
reflection. When the tag was placed inside the foil the radar could not read the tag no matter
how close the tag was to the radar. This was due to the foil reflecting all the radio waves back
towards the radar.
8.2 Proposed System Requirements During the development of the proposed system the different system requirements had to be
followed. The goal of the development of the system was to show that system could be
developed that would automate the stock management system for a fire station. The system
had to be easy to use by any member of staff and give better performance and a high standard
of performance than the current system. Table 16, Table 17 and Table 18 all show the system
requirements and that they were satisfied during the development of the system.
84

Requirement Satisfied
Quit the program Yes
Access the status screen Yes
View a list of tags being tracked by the
system
Yes
Search for a tag that is being tracked Yes
Add new tags to track Yes
Assign tags to equipment Yes
View and edit information on each tag Yes
Calibrate the RFID reader for the area Yes
View the software help at any time Yes
Table 16 User Requirements Evaluation
Requirement Satisfie
d
Run on any machine using the Windows operating system Yes
Track the position of tags in the monitored area using location data
provided by the TrolleyScan system
Yes
Store information, accessible at any time, on equipment in a database Yes
Associate tag IDs from the RFID-Radar system with tag IDs assigned
to objects
Yes
Table 17 System requirements Evaluation
Requirement Satisfi
ed
Accessibility – Each component of the software must be readily accessible
and easy enough to use with minimal training and experience
Yes
Time Constraints – The project is to be completed within two semesters (24
Weeks)
Yes
Reliability – The system should load at any time and provide reliable
information. Any errors will be handed by the system and not affect the user
Yes
85
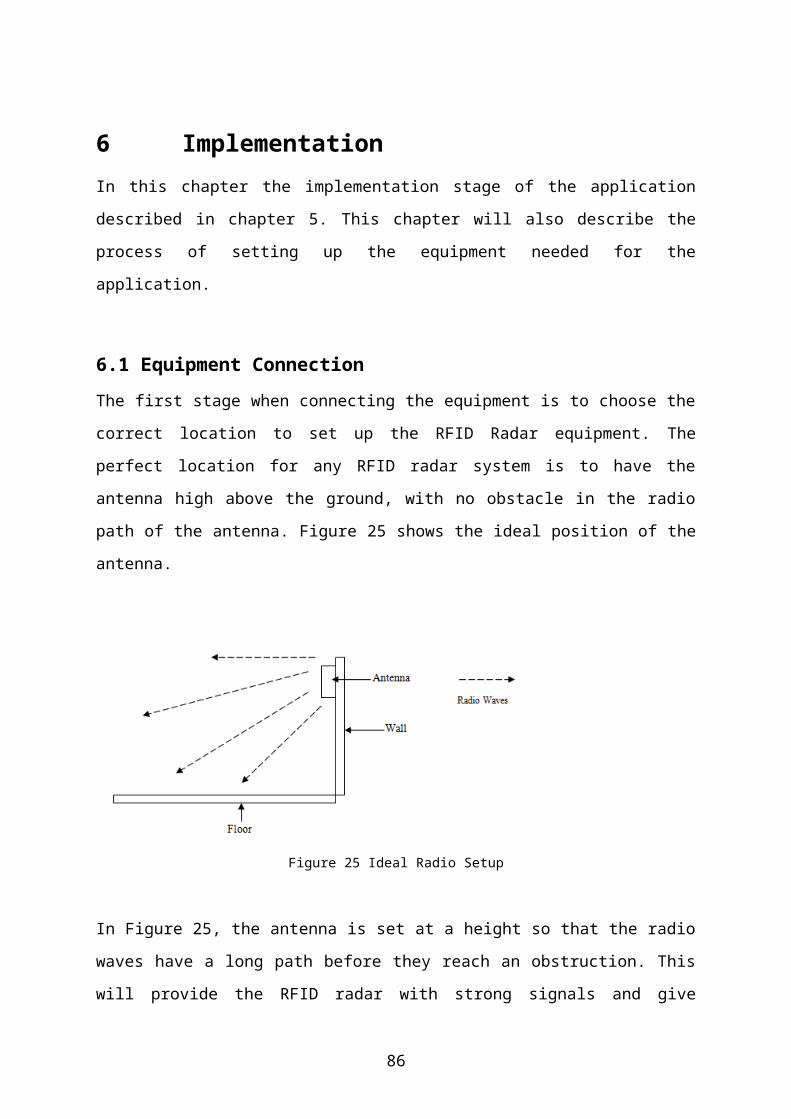
experience
Performance – The system must load and warn the user if tags have not
returned. The retrieval of information about tags should be instantaneous, if
there is a delay then the system will display a message to the user thus to
improve the user experience
Yes
Extensibility – The software should be written in such a way as to allow
extra functionality to be added in the future, at any time add-ons and or
extensions can be added to the system to accommodate for different
scenarios
Yes
Maintainability – Software code must be well-structured, readable and well-
commented to allow for the implementation of extra functionality. This
system will also use external configuration files to insure that no information
is hard coded
Yes
Scalability – The number of tags tracked by the system within the monitored
area should be limited only by the reader’s input and output capabilities
Yes
Efficiency – The software should use as little resources as possible to
perform at an acceptable level
Yes
The user interface must conform to HCI standards Yes
Table 18 Non-Functional Requirements Evaluation
8.3 Future Work
Due to time constraints the created system only contains a small number of features however
these are the essential features. Extra futures could have been added if more time was
allocated for the development stage, such as allowing the user edit the systems configuration
directly from the system UI. This would mean that the user would not have to manually edit
the configuration files that accompany the system. A mailing system that would send the user
email updates on equipment that needed to tested or equipment that was flagged as an issue
could have been added, the main issue with is was developing the notification system to
manage the mail that was sent to the user.
Due to weather conditions it was not possible to test the radar system in a outdoor location
meaning that the system was unable to get a 100% accurate calibration, other locations could
86

have been tested also such as testing the radar system on location in a fire station or in
different types of rooms.
The system could also be adapted in the future to fit the application of any company by
allowing the user to specify the rules for the alerts and the layout of the tag database. This
means that the system could be deployed to any scenario.
87

9 Conclusion It has been discussed that location determination can be carried out with the aid of many
different technologies, across a number of scenarios. Many of the most popular and easy to
use technologies have proved to have major flaws in the scalability, reliability and accuracy.
All of these factors prove to be the main reasons for choosing a tracking technology, with the
recent incline of advancements in RFID technologies and the ever increasing implementation
of RFID system. There is no doubt that RFID is one of the fastest growing technologies not
only in the location determination industry but in other industries such as the vehicle toll and
identification industry.
This project aimed to investigate the use and implementation of RFID systems in small and
large scale operations. Also the ability to meet the needs of the scenario discussed in chapter
1 using the system proposed in chapter 4 and 5.the scenario was of the inventory management
system of a fire service. In the process of creating, implementing and testing the proposed
RFID system, the system was able to demonstrate how RFID systems can expose the
limitations of RFID for location determination.
The proposed system was required to interface with the RFID radar and reader to give data on
the location of RFID tags. The system then worked with a database to provide more
information on each tag that was detected by the RFID radar. The application also tracked
multiple tags and how some tags related to each other.
The database and application structure were defined in the design phase with the use of UML
diagrams, which defined how each component would integrate together. The system
requirements including the user, functional, non-functional, software and hardware
requirements, where also defined in the design phase.
The development phase was documented in chapter 6 with descriptions of the systems UI and
how the system worked with code abstracts taking from the application. The following
chapter discussed the testing phase. This was the longest phase as implications with the RFID
reader and reader surfaced in the form of calibration issues and radio signal strength. The test
88

carried out exposed the strengths and weaknesses of the RFID radar and reader to give a
deeper view into the inner workings of RFID radio technology.
During the test it was discovered that the RFID equipment cannot work efficiently in
environments with large amounts of metal objects that could block radio signals. This means
that the system would not be able to meet the needs of a fire service as the tags what would
be needed to track would all be inside of a fire engine. A standard fire engine has a thick
metal shell which would block all RFID radio signals. The test also found that large bodies of
water with opaque containers can affect the readability of RFID tags, this would also applied
to the fire server scenario as the fire engine would be carrying large bodies of water.
To conclude the project had been a success in investigating factors that affect the readability
of RFID tags and the different environmental factors of RFID radio signals, also the
successful production of a prototype application that met the needs of the specific scenario.
Although the testing has shown that RFID technology is not the best for location detection in
area with a high number metal and water obstructions. RFID technology is growing faster
everyday and more advancements are being made with the technology and maybe in the
future RDIF technology will be able to overcome the issues found in the testing of the system
and could someday be deployed as a low cost location detection system.
89

10 References
Grafinkel.S, Rosenberg.B (2006) RFID Applications, Security, and Privacy, Pearson
Education Inc, ISBN 0-321-29096-8
BBC news (Thursday, 2 November 2006), Britain is 'surveillance society’, Available at:
http://news.bbc.co.uk/1/hi/uk/6108496.stm
Google Patent Search TRANSPONDER APPARATUS AND SYSTEM Available at:
http://www.google.com/patents?vid=3713148
Ubisense (2009), Available at: http://www.ubisense.net/en
Lahiri.S (2005) RFID Sourcebook, Pearson IBM Press, ISBN 0-13-185137-3
Global (2009), How Inferred Works, Available at:
http://www.glolab.com/pirparts/infrared.html
How Stuff works (2009), How Bluetooth Surveillance Works, Available at:
http://electronics.howstuffworks.com/bluetooth-surveillance2.htm
ZigBee Alliance (2009), Available at: http://www.zigbee.org/
RS-232 Specification (2009), Available at: http://www.lammertbies.nl/comm/info/RS-
232_specs.html
RS-485 Tech Info (2009), Available at: http://www.arcelect.com/RS485_info_Tutorial.html
RFID Journal (2009), A Summary of RFID Standards, Available at:
http://www.rfidjournal.com/article/articleview/1335/1/129/
Waldner.J (2008), Nanocomputers and Swarm Intelligence, London: ISTE John Wiley &
Sons. pp. 205–214. ISBN 1847040020.
E-Z pass (2009), Available at: http://www.ezpass.com/static/faq/index.shtml
Global Positioning System (GPS) (2009), Available at: http://www.gps.gov/
Finkenzeller.K (1999), RFID handbook : radio-frequency identification fundamentals and
application, Chichester, ISBN 0471988510
90

Appendix A: Test Cases – Active Tags No. Test Result
1 pass tag through radar range
Tags appeared on the screen as they reached the range of the radar
2 pass tag into range and turn radar off
Tags appeared on the screen and when the radar was turned off they did not show anymore
3 Place tag in the range of the radar then turn radar on
Tags appeared on the screen as soon as the radar is turned on
4 pass all the tags through the radar range
Each tag showed on the screen when they were in range of the radar
5 pass all the tags into range of the radar and turn off the radar
Each tag showed on the screen until the radar was turned off
6 Place all tags in range of the radar then turn the radar on
Each tag showed on screen when the radar was turned on
7 pass a tag in range of the radar turn off the radar do not move tag then turn the radar back on
Tags appeared on the screen until the radar was turned off and the tags reappeared once the radar was turned off
8 pass all tags in range of radar and place in different locations do not move tags. reboot radar
Tags in closer locations showed more on screen than the tags that where further away from the radar
9 place a metal obstruction in front of the tag
Tags where not able to be read while behind the metal
10 place a opaque bottle of water in front of the tag
Tags appeared on screen but with a weak reading from the radar and after a distance of 2 meters the tags could not be read
11 place a clear bottle in front of the tag
Tags appeared on the screen at all distances
11.01
place a clear bottle in front of the tag wrapped with paper
Tags appeared on screen but with a weak reading from the radar and after a distance of 2 meters the tags could not be read
12 place a thick piece of fabric in front of the tag
Tags appeared on screen but with a weak reading from the radar and as the distance between the tag and the radar increased the signal got weaker
12.01
place the tag into a coat pocket
Tags appeared on screen but with a weak reading from the radar and as the distance between the tag and the radar increased the signal got weaker
13 place the tag behind a piece of wood
Tags appeared on screen at all distance
14 place a piece of plastic in front of the tag
Tags appeared on screen but with a weak reading from the radar and as the distance between the tag and the radar increased the signal got weaker
15 place a piece of plastic coved with paper in front of the tag
Tags appeared on screen but with a weak reading from the radar and as the distance between the tag and the radar increased the signal got weaker
91

16 place a piece of tinfoil in front of the tag (non-shiny side)
Tags appeared on screen with a weak signal from the radar, the tags not being read at 4 meters distance between the radar and the tag
16.01
place a piece of tinfoil in front of the tag (shiny side)
Tags appeared on screen with a extremely week signal and the tags could not be read at a distance of 30 centimetres
16.02
warp the tag in tinfoil (shiny side out)
Tags could not be read at any distance
17 place a tag in a anti-static bag
Tags appeared on screen with a weak signal and could not be read at a distance of 2 meters
18 place a tag behind glass (window of the test room)
Tags appeared on screen with strong signal
19 place the tag on a wall outside the room
Tags appeared on screen with a weak signal
20 place the tag behind a person
Tags appeared on screen with a weak signal
92

Appendix B: Test Cases – Passive tagsNo. Test Result
1 Turn radar on and pass tag through radar range Tags appeared on the screen as they reached the range of the radar
2 Turn radar on pass tag into range and turn radar off
Tags appeared on the screen and when the radar was turned off they did not show anymore
3 Place tag in the range of the radar then turn radar on
Tags appeared on the screen as soon as the radar is turned on
4 Turn radar on and pass all the tags through the radar range
Each tag showed on the screen when they were in range of the radar
5 Turn radar on and pass all the tags into range of the radar and turn off the radar
Each tag showed on the screen until the radar was turned off
6 Place all tags in range of the radar then turn the radar on
Each tag showed on screen when the radar was turned on
7 Turn on radar and pass a tag in range of the radar turn off the radar do not move tag then turn the radar back on
Tags appeared on the screen until the radar was turned off and the tags reappeared once the radar was turned off
8 Turn on radar and pass all tags in range of the radar and place in different locations do not move tags and turn off radar then turn the radar back on
Tags in closer locations showed more on screen than the tags that where further away from the radar
9 turn on the radar and place a metal obstruction in front of the tag
Tags where not able to be read while behind the metal
10 Turn on the radar and place a opaque bottle of water in front of the tag
Tags appeared on screen but with a weak reading from the radar and after a distance of 2 meters the tags could not be read
11 Turn on the radar and place a clear bottle in front of the tag
Tags appeared on the screen with weak signal and tags could not be read at 2 meters
12 Turn on the radar and place a thick piece of fabric in front of the tag
Tags appeared on screen but with a weak reading from the radar and as the distance between the tag and the radar increased the signal got weaker
12.01
Turn the radar on a place the tag into a coat pocket
Tags appeared on screen but with a weak reading from the radar and as the distance between the tag and the radar increased the signal got weaker tags could not be read at 2 meters
13 Turn on the radar and place the tag behind a piece of wood
Tags appeared on screen at all distance
14 Turn the radar on and place a piece of plastic in front of the tag
Tags appeared on screen but with a weak reading from the radar and as the distance between the tag and the radar increased the signal got weaker
15 Turn the radar on and place a piece of plastic coved with paper in front of the tag
Tags appeared on screen but with a weak reading from the radar and as the distance between the tag and the radar increased the signal got weaker
93

16 Turn the radar on a place a piece of tinfoil in front of the tag (non-shiny side)
Tags appeared on screen with a weak signal from the radar, the tags not being read at 4 meters distance between the radar and the tag
16.01
Turn the radar on a place a piece of tinfoil in front of the tag (shiny side)
Tags appeared on screen with a extremely week signal and the tags could not be read at a distance of 15 centimetres
16.02
Turn the radar on and warp the tag in tinfoil (shiny side out)
Tags could not be read at any distance
17 Turn the radar on place a tag in a anti-static bag Tags could not be read 18 Turn on the radar and place a tag behind glass
(window of the test room) Tags appeared on screen with strong signal
19 Turn on the radar and place the tag on a wall outside the room
Tags appeared on screen with a weak signal
20 Turn on the radar and place the tag behind a person
Tags could not be read
94

Appendix C: Test Case 4 Map
95
Radar Antenna
Cardboard Box
Desk
Desk
Desk
Cardboard Box
Cardboard Box
Chair

96

Appendix D: Source code
MainForm.cs
using System;using System.Collections.Generic;using System.Data.OleDb;using System.IO.Ports;using System.Text;using System.Windows.Forms;using System.Configuration;
namespace Radar{ public partial class MainForm : Form { // Connection to Databse located in the install folder private OleDbConnection _connection = new OleDbConnection(ConfigurationManager.ConnectionStrings["DataBaseConnectionString"].ConnectionString); private SerialPort _port = new SerialPort("COM5", 19200, Parity.None, 8, StopBits.One); private StringBuilder _data = new StringBuilder(); private List<Tag> _tags = new List<Tag>(); private string _station; private List<Alert> _alerts = new List<Alert>();
public MainForm() { InitializeComponent();
// create event handler for data recided through com port _port.DataReceived += PortDataReceived; _port.ReadTimeout = -1; _listManageTags.Columns.Add("Name", 120, HorizontalAlignment.Left); _listManageTags.Columns.Add("Tag ID", 100, HorizontalAlignment.Left); _listManageTags.Columns.Add("Current Location", 120, HorizontalAlignment.Left); _listManageTags.Columns.Add("Status", 50, HorizontalAlignment.Left); _listManageTags.Columns.Add("Last Changed", 150, HorizontalAlignment.Left); _listManageTags.Columns.Add("Engine No", 70, HorizontalAlignment.Left); _listManageTags.Columns.Add("Description", 500, HorizontalAlignment.Left);
_listAlerts.Columns.Add("Name", 120, HorizontalAlignment.Left); _listAlerts.Columns.Add("TagID", 120, HorizontalAlignment.Left); _listAlerts.Columns.Add("Alert Sent", 120, HorizontalAlignment.Left); _listAlerts.Columns.Add("Reason", 120, HorizontalAlignment.Left);
}
# region ############# Event handlers ###################
private void StatusChangedTag(object sender, EventArgs e) { //update database to reflect the status change Tag tag = (Tag) sender; RadarHelper.OpenConnection(); switch (tag.ItemEngine) { case "item": RadarHelper.AddEditRecords("UPDATE Equipment SET Status='" + tag.Status + "' WHERE TagID='" + tag.Id + "'"); RadarHelper.AddEditRecords("UPDATE Equipment SET LastStatusChange='" + DateTime.Now.ToString() + "' WHERE TagID='" + tag.Id + "'"); break; case "engine": RadarHelper.AddEditRecords("UPDATE Engine SET Status='" + tag.Status + "' WHERE TagID='" + tag.Id + "'"); RadarHelper.AddEditRecords("UPDATE Engine SET LastStatusChange='" + DateTime.Now.ToString() +
97

"' WHERE TagID='" + tag.Id + "'"); break; }
RadarHelper.CloseConnection(); }
private void RangeChangedTag(object sender, EventArgs e) { Tag tag = (Tag)sender; DateTime fiveMinFromNow = DateTime.Now.AddMinutes(-1); if (tag.OldRange && tag.InRange == false && tag.LastStatusChange <= fiveMinFromNow) { switch (tag.Status) { case "IN": tag.Status = "OUT"; tag.LastStatusChange = DateTime.Now; break; case "OUT": tag.Status = "IN"; tag.LastStatusChange = DateTime.Now; break; } } }
private void _txtBasicSearch_KeyPress(object sender, KeyPressEventArgs e) { //check is the enter key has been pressed if (e.KeyChar == (char)Keys.Return) { _btnBasicSearch_Click(sender, e); } }
private void _chbAdvancedSearchOnOff_CheckedChanged(object sender, EventArgs e) { if (_chbAdvancedSearchOnOff.Checked) { _gboAdvancedSearch.Enabled = true; PopulateLocationSearchcbo(); PopulateStatusSearchcbo(); PopulateEngineSearchcbo();
} else { _gboAdvancedSearch.Enabled = false; } }
/// <summary> /// Event handler for the comport /// </summary> private void PortDataReceived(object sender, SerialDataReceivedEventArgs e) { try { _data.Append(_port.ReadExisting()); } catch (Exception ex) { MessageBox.Show(ex.Message, "ERROR", MessageBoxButtons.OK); } }
# endregion
#region ############# Timers ##################
private void _timerRangeChnage_Tick(object sender, EventArgs e) { if (_lboRadarLiveFeed.Items.Count != 0) {
98

foreach (Tag tag in _tags) { int temp = 0; for (int i = 0; i < _lboRadarLiveFeed.Items.Count; i++) { if (_lboRadarLiveFeed.Items[i].ToString().Contains(tag.Id)) { tag.InRange = true; temp = 1; } } if (temp == 0) tag.InRange = false; } } else { foreach (Tag tag in _tags) { tag.InRange = false; } } }
private void _timerCheckData_Tick(object sender, EventArgs e) { if (_data.ToString().EndsWith("\n\r")) { _lboRadarLiveFeed.Items.Clear();
string[] splitter = { "\r\n", "\n\r" }; string[] tagArray = _data.ToString().Split(splitter, StringSplitOptions.None);
foreach (string s in tagArray) { if (s.StartsWith("B")) { Tag tag = RadarHelper.GetTag(s.Substring(0, 9)); _lboRadarLiveFeed.Items.Add(s + "\t " + tag.Name); if (!_tags.Contains(tag)) { tag.RangeChanged += RangeChangedTag; tag.StatusChanged += StatusChangedTag; _tags.Add(tag); }
} }
_data = new StringBuilder(); } else if (_data.Length == 0) { _lboRadarLiveFeed.Items.Clear(); } }
#endregion
# region ############ Update methods #################
private void UpdateManageTagsList(OleDbDataReader reader) {
if (reader.HasRows) { _listManageTags.Items.Clear(); while (reader.Read()) { ListViewItem item = new ListViewItem(reader.GetString(0)); // Name item.SubItems.Add(reader.GetString(1)); // TagID item.SubItems.Add(RadarHelper.GetStationName(reader.GetString(2))); // Current location item.SubItems.Add(reader.GetString(3)); // Status item.SubItems.Add(reader.GetDateTime(4).ToString()); // last Changed item.SubItems.Add(reader.GetString(6)); // engine No.
99

item.SubItems.Add(reader.GetString(5)); // add the item to the listview _listManageTags.Items.Add(item); } } else { MessageBox.Show("ERROR no results where could for that search, please try again", "ERROR", MessageBoxButtons.OK, MessageBoxIcon.Error); } }
# endregion
# region ########### Populating combo boxes ###########
/// <summary> /// populates the Engines avable for searching /// </summary> private void PopulateEngineSearchcbo() { _cboEngineSearch.Items.Clear(); _cboEngineSearch.Items.Add("Any");
RadarHelper.OpenConnection(); OleDbDataReader reader = RadarHelper.QueryDb("SELECT RegNumber FROM Engine"); List<String> engines = new List<string>();
while (reader.Read()) { _cboEngineSearch.Items.Add(reader.GetString(0)); }
RadarHelper.CloseConnection();
_cboEngineSearch.SelectedIndex = 0; }
private void PopulateEngineSearchcbo(string station) { _cboEngineSearch.Items.Clear(); _cboEngineSearch.Items.Add("Any"); RadarHelper.OpenConnection(); OleDbDataReader reader = RadarHelper.QueryDb("SELECT RegNumber FROM Engine WHERE Station='" + RadarHelper.GetStationRefNumber(station) + "'"); while (reader.Read()) { _cboEngineSearch.Items.Add(reader.GetString(0)); }
RadarHelper.CloseConnection();
_cboEngineSearch.SelectedIndex = 0; }
/// <summary> /// populates the Statu's avable for searching /// </summary> private void PopulateStatusSearchcbo() { _cboStatusSearch.Items.Add("Any"); _cboStatusSearch.Items.Add("OUT"); _cboStatusSearch.Items.Add("IN");
_cboStatusSearch.SelectedIndex = 0;
}
/// <summary> /// populates the locations avable for searching /// </summary> private void PopulateLocationSearchcbo() { _cboLocationSearch.Items.Add("Any");
RadarHelper.OpenConnection();
100

OleDbDataReader reader = RadarHelper.QueryDb("SELECT StationName FROM Station");
List<String> locations = new List<string>();
while (reader.Read()) { _cboLocationSearch.Items.Add(reader.GetString(0)); }
RadarHelper.CloseConnection();
_cboLocationSearch.SelectedIndex = 0; }
private void _cboLocationSearch_SelectedIndexChanged(object sender, EventArgs e) { if (_cboLocationSearch.SelectedItem.ToString() == "Any" || _cboLocationSearch.SelectedIndex == -1) { PopulateEngineSearchcbo(); } else { PopulateEngineSearchcbo(_cboLocationSearch.SelectedItem.ToString()); } }
# endregion
# region ########### Buttons ###########
/// <summary> /// turn the radar on and off also turn on/off timmers /// </summary> /// <param name="sender"></param> /// <param name="e"></param> private void _btnRadarOnOff_Click(object sender, EventArgs e) { try { if (!_port.IsOpen && _btnRadarOnOff.Text == "ON") { _port.Open(); _btnRadarOnOff.Text = "OFF"; _timerCheckData.Start(); _timerRangeChnage.Start(); } else if (_port.IsOpen && _btnRadarOnOff.Text == "OFF") { _port.Close(); _btnRadarOnOff.Text = "ON"; _timerCheckData.Stop(); _timerRangeChnage.Stop(); } } catch (Exception) { DialogResult messageResult = MessageBox.Show( "Error occoured when trying to connect to the radar, check that the radar is connected", "Connection ERROR", MessageBoxButtons.RetryCancel);
// if retry id selected then try the port again if (messageResult == DialogResult.Retry) { _btnRadarOnOff_Click(sender, e); } }
}
private void _btnTest_Click(object sender, EventArgs e) {
AddEditTagForm add = new AddEditTagForm(); add.ShowDialog();
101

}
private void _btnBasicSearch_Click(object sender, EventArgs e) { RadarHelper.OpenConnection(); OleDbDataReader readerName = RadarHelper.QueryDb("SELECT * FROM Equipment WHERE Name='" + _txtBasicSearch.Text + "'"); OleDbDataReader readerTagId = RadarHelper.QueryDb("SELECT * FROM Equipment WHERE TagID='" + _txtBasicSearch.Text + "'");
if (!readerName.HasRows) { if (!readerTagId.HasRows) { MessageBox.Show("Error no results could be found, please try again", "ERROR", MessageBoxButtons.OK, MessageBoxIcon.Error); RadarHelper.CloseConnection(); _txtBasicSearch.Focus(); return; }
UpdateManageTagsList(readerTagId); } else { UpdateManageTagsList(readerName); }
RadarHelper.CloseConnection();
}
private void _btnAdvacnedSearch_Click(object sender, EventArgs e) { RadarHelper.OpenConnection(); string query; if (_cboLocationSearch.SelectedItem.ToString() == "Any") { if (_cboStatusSearch.SelectedItem.ToString() == "Any") { if (_cboEngineSearch.SelectedItem.ToString() == "Any") { query = "SELECT * FROM Equipment"; } else { query = "SELECT * FROM Equipment WHERE Engine='" + _cboEngineSearch.SelectedItem + "'";
} } else if (_cboEngineSearch.SelectedItem.ToString() == "Any") { query = "SELECT * FROM Equipment WHERE Status='" + _cboStatusSearch.SelectedItem + "'"; } else { query = "SELECT * FROM Equipment WHERE Status='" + _cboStatusSearch.SelectedItem + "'" + " AND Engine='" + _cboEngineSearch.SelectedItem + "'"; } } else if (_cboStatusSearch.SelectedItem.ToString() == "Any") { if (_cboEngineSearch.SelectedItem.ToString() == "Any") { query = "SELECT * FROM Equipment WHERE CurrentLocation='" + RadarHelper.GetStationRefNumber(_cboLocationSearch.SelectedItem.ToString()) + "'";
} else {
102

query = "SELECT * FROM Equipment WHERE CurrentLocation='" + RadarHelper.GetStationRefNumber(_cboLocationSearch.SelectedItem.ToString()) + "' AND Engine='" + _cboEngineSearch.SelectedItem + "'"; } } else { if (_cboEngineSearch.SelectedItem.ToString() == "Any") { query = "SELECT * FROM Equipment WHERE CurrentLocation='" + RadarHelper.GetStationRefNumber(_cboLocationSearch.SelectedItem.ToString()) + "' AND Status='" + _cboStatusSearch.SelectedItem + "'"; } else { query = "SELECT * FROM Equipment WHERE CurrentLocation='" + RadarHelper.GetStationRefNumber(_cboLocationSearch.SelectedItem.ToString()) + "' AND Engine='" + _cboEngineSearch.SelectedItem + "'" + " AND Status='" + _cboStatusSearch.SelectedItem + "'"; } }
OleDbDataReader reader = RadarHelper.QueryDb(query); UpdateManageTagsList(reader); RadarHelper.CloseConnection();
}
private void _btnAddManageTags_Click(object sender, EventArgs e) { AddEditTagForm addTag = new AddEditTagForm(); addTag.ShowDialog(); addTag.Dispose(); }
private void _btnEditManagetags_Click(object sender, EventArgs e) { switch (_listManageTags.SelectedItems.Count) { case 0: MessageBox.Show("ERROR: No tag was slected please try again", "ERROR", MessageBoxButtons.OK, MessageBoxIcon.Error); return; default: {
RadarHelper.OpenConnection(); OleDbDataReader reader = RadarHelper.QueryDb("SELECT Station FROM Engine WHERE RegNumber='" +
_listManageTags.SelectedItems[0].SubItems[5].Text + "'"); string station = string.Empty; while (reader.Read()) { station = reader.GetString(0); } RadarHelper.CloseConnection(); if (_station == station) { AddEditTagForm editTagForm = new AddEditTagForm(_listManageTags.SelectedItems[0].SubItems[1].Text); editTagForm.ShowDialog(); } else { MessageBox.Show("ERROR: You can only edit items from your own station", "ERROR", MessageBoxButtons.OK, MessageBoxIcon.Error); } } break; } }
103

private void _btnDeleteManageTags_Click(object sender, EventArgs e) { switch (_listManageTags.SelectedItems.Count) { case 0: MessageBox.Show("ERROR: No tag was slected please try again", "ERROR", MessageBoxButtons.OK, MessageBoxIcon.Error); return; default: if (MessageBox.Show("Are you sure you want to delete the selected item?", "WARING", MessageBoxButtons.YesNo, MessageBoxIcon.Question) == DialogResult.Yes) { RadarHelper.AddEditRecords("DELETE FROM Equipment WHERE TagID='" + _listManageTags.SelectedItems[0].SubItems[1].Text + "'"); MessageBox.Show("Item has been removed from the database", "ITEM REMOVED", MessageBoxButtons.OK, MessageBoxIcon.Information); } else { return; } break; } }
private void _btnLogInOut_Click(object sender, EventArgs e) { switch (_btnLogInOut.Text) { case "Log In": LogIn logIn = new LogIn(); logIn.ShowDialog(); if (logIn.Station() != string.Empty) { _station = logIn.Station(); _btnLogInOut.Text = "Log Out"; _tbMainTab.Enabled = true; RadarHelper.OpenConnection(); _lblCurrentStation.Text = RadarHelper.GetStationName(_station); RadarHelper.CloseConnection(); _timerAlerts.Start(); _timerPopulateAlertList.Start(); } break; case "Log Out": _station = string.Empty; _btnLogInOut.Text = "Log In"; _tbMainTab.Enabled = false; _lblCurrentStation.Text = string.Empty; _timerAlerts.Stop(); _timerPopulateAlertList.Stop(); break; } }
private void _btnClose_Click(object sender, EventArgs e) { Close(); }
private void _ckbShowAllEquip_CheckedChanged(object sender, EventArgs e) { if (_ckbShowAllEquip.Checked) { _cboEngineSearch.Enabled = false; _cboLocationSearch.Enabled = false; _cboStatusSearch.Enabled = false;
RadarHelper.OpenConnection(); OleDbDataReader reader = RadarHelper.QueryDb("SELECT * FROM Equipment"); UpdateManageTagsList(reader);
RadarHelper.CloseConnection(); }
104

else { _cboEngineSearch.Enabled = true; _cboLocationSearch.Enabled = true; _cboStatusSearch.Enabled = true; _listManageTags.Items.Clear(); }
}
# endregion
private void _timerAlerts_Tick(object sender, EventArgs e) { List<Engine> engines = RadarHelper.LoadEngines(_station); _alerts.Clear(); // check is the alert rules have been broken /* 1. If an Engine is IN all the items for that engine should be IN * 2. If an Engine is OUT all the items for that engine should be OUT * 3. The location of the Engine should match the Station that the engine belongs to * 4. The current location of an item should match the station the itme belongs to */
// 1. If an Engine is IN all the items for that engine should be IN foreach (Engine engine in engines) { foreach (Tag tag in engine.Tags) { if (engine.Status == "IN" && tag.Status == "OUT")// 1. If an Engine is IN all the items for that engine should be IN { _alerts.Add(new Alert(tag.Name, tag.Id, "The item is logged as OUT However the engine that the item belongs to is logged as IN")); } if (engine.Status == "OUT" && tag.Status == "IN") // 2. If an Engine is OUT all the items for that engine should be OUT { _alerts.Add(new Alert(tag.Name, tag.Id, "The item is logged as IN However the engine that the item belongs to is logged as OUT")); } if (tag.CurrentLocation != tag.Station) // 4. The current location of an item should match the station the itme belongs to { _alerts.Add(new Alert(tag.Name, tag.Id, "The item is logged as been logged at a different station to its home station")); } }
if (!string.Equals(engine.Location, engine.Station)) // 3. The location of the Engine should match the Station that the engine belongs to { _alerts.Add(new Alert(engine.RegNumber, engine.TagID, "The engine is logged at a different station to its home station")); } }
//foreach (Alert alert in _alerts) //{ // alert.LogAlert(); //}
}
private void _timerPopulateAlertList_Tick(object sender, EventArgs e) { _listAlerts.Clear(); foreach (Alert alert in _alerts) { ListViewItem item = alert.List(); _listAlerts.Items.Add(item); } }
}
105

}
106

RadarHelper.cs
using System;using System.Collections.Generic;using System.Configuration;using System.Data.OleDb;
namespace Radar{
class RadarHelper { // Connection to Databse located in the install folder private static OleDbConnection _connection = new OleDbConnection(ConfigurationManager.ConnectionStrings["DataBaseConnectionString"].ConnectionString);
public static void OpenConnection() { try { _connection.Open(); } catch (Exception) { _connection.Close(); _connection.Open(); } }
public static void CloseConnection() { _connection.Close(); }
public static string GetStationName(string s) { //OpenConnection(); OleDbDataReader reader = QueryDb("SELECT StationName FROM Station WHERE ReferanceNo='" + s + "'"); string stationName = string.Empty; while (reader.Read()) { stationName = reader.GetString(0); } //CloseConnection(); return stationName; }
public static string GetStationRefNumber(string s) { //OpenConnection(); OleDbDataReader reader = QueryDb("SELECT ReferanceNo FROM Station WHERE StationName='" + s + "'"); while (reader.Read()) { s = reader.GetString(0); } //CloseConnection(); return s; }
public static Tag GetTag(string tagID) { OpenConnection(); OleDbDataReader itemReader = QueryDb("SELECT * FROM Equipment WHERE TagID='" + tagID + "'"); OleDbDataReader engineReader = QueryDb("SELECT * FROM Engine WHERE TagID='" + tagID + "'"); Tag tag = null; if (itemReader.HasRows) { while (itemReader.Read()) {
107

tag = new Tag(itemReader.GetString(0), itemReader.GetString(1), itemReader.GetString(3), itemReader.GetDateTime(4), "item"); } } else if(engineReader.HasRows) { while (engineReader.Read()) { tag = new Tag(engineReader.GetString(2), engineReader.GetString(0), engineReader.GetString(3), engineReader.GetDateTime(5), "engine"); } } CloseConnection(); return tag; }
public static OleDbDataReader QueryDb(string s) { OleDbCommand command = new OleDbCommand(s, _connection); return command.ExecuteReader(); }
public static List<string> RemoveDuplicates(List<string> inputList) { Dictionary<string, int> uniqueStore = new Dictionary<string, int>(); List<string> finalList = new List<string>(); foreach (string currValue in inputList) { if (!uniqueStore.ContainsKey(currValue)) { uniqueStore.Add(currValue, 0); finalList.Add(currValue); } } return finalList; }
public static void AddEditRecords(string s) { OpenConnection(); OleDbCommand command = new OleDbCommand(s, _connection); command.ExecuteNonQuery(); CloseConnection(); }
public static bool ItemExists(string s) { OpenConnection(); OleDbDataReader reader = QueryDb("SELECT * FROM Equipment WHERE TagID='" + s + "'"); if (reader.HasRows) { return true; } else { return false; } }
internal static List<Engine> LoadEngines(string station) { List<Engine> engines = new List<Engine>();
OpenConnection(); OleDbDataReader reader = QueryDb("SELECT RegNumber, TagID, Status, Location, Station FROM Engine WHERE Station='" + station + "'"); while (reader.Read()) { engines.Add(new Engine(reader.GetString(0), reader.GetString(1), reader.GetString(2), reader.GetString(3), reader.GetString(4))); }
108

// load items for engines foreach (Engine engine in engines) { engine.PopulateTags(); } CloseConnection(); return engines; } }}
Tag.csusing System;
namespace Radar{ class Tag { private bool _oldRange; private bool _inRange; private string _status; public string ItemEngine; public string Id;
public DateTime LastStatusChange { get; set; } public bool OldRange { get { return _oldRange; } }
public string Name { get; set; } public bool OutRange { get; set; } public string CurrentLocation { get; set; } public string Station { get; set; }
public event EventHandler RangeChanged; public event EventHandler StatusChanged;
public bool InRange { get { return _inRange; } set { _oldRange = _inRange; _inRange = value; if (RangeChanged != null) RangeChanged(this, new EventArgs()); }
}
public string Status { get { return _status; } set { _status = value; if (StatusChanged != null) StatusChanged(this, new EventArgs()); } }
public Tag(string name, string iD, string status, DateTime LastStatusChange, string itemOrEngine) { Name = name; Id = iD; _inRange = false; _status = status; this.LastStatusChange = LastStatusChange; ItemEngine = itemOrEngine;
109

}
public Tag(string name, string iD, string status, string currLoc, string stat) { Name = name; Id = iD; _status = status; CurrentLocation = currLoc; Station = stat; }
}}
Engine.cs
using System;using System.Collections.Generic;using System.Data.OleDb;using System.Linq;using System.Text;
namespace Radar{ class Engine { public string RegNumber; public string TagID; public string Status; public string Location; public string Station; public List<Tag> Tags = new List<Tag>();
public Engine(string regNum, string tag, string status, string loc, string stat) { RegNumber = regNum; TagID = tag; Status = status; Location = loc; Station = stat; }
public void PopulateTags() { OleDbDataReader reader = RadarHelper.QueryDb("SELECT Name, TagID, Status, CurrentLocation, Station FROM Equipment WHERE Engine='" + RegNumber + "'"); if (reader.HasRows) { while (reader.Read()) { Tags.Add(new Tag(reader.GetString(0), reader.GetString(1), reader.GetString(2), reader.GetString(3), reader.GetString(4))); } } } }}
AddEditTagForm.cs
using System;using System.Data.OleDb;using System.Windows.Forms;using System.Drawing;
namespace Radar{ public partial class AddEditTagForm : Form { private bool _booltagName; private bool _booltagId; private bool _boolStation; private bool _boolstatus; private bool _boolengineNo;
110

private string _stationTemp; private string _engineTemp; private string _mood; private bool _saved;
/// <summary> /// Open the tag dialog for adding a tag /// </summary> public AddEditTagForm() { InitializeComponent(); _mood = "ADD"; _btnAdd.Visible = true; _cboStatus.Items.Add("IN"); _cboStatus.Items.Add("OUT"); RadarHelper.OpenConnection(); PopulateStationcbo(); RadarHelper.CloseConnection(); // set bools _booltagName = false; _booltagId = false; _boolStation = false; _boolstatus = false; _boolengineNo = false;
}
public AddEditTagForm(string tagID) { InitializeComponent(); _mood = "EDIT"; _saved = false; _cboStatus.Items.Add("IN"); _cboStatus.Items.Add("OUT"); _btnSaveEdit.Visible = true; RadarHelper.OpenConnection(); OleDbDataReader reader = RadarHelper.QueryDb("SELECT * FROM Equipment WHERE TagID='" + tagID + "'"); EditPopulateFields(reader); RadarHelper.CloseConnection(); _cboStation.SelectedItem = _stationTemp; _cboEngineNo.SelectedItem = _engineTemp; }
private void EditPopulateFields(OleDbDataReader reader) { if (reader.HasRows) { while (reader.Read()) { _txtName.Text = reader.GetString(0); _txtTagID.Text = reader.GetString(1); PopulateStationcbo(); _stationTemp = RadarHelper.GetStationName(reader.GetString(2)); _cboStatus.SelectedItem = reader.GetString(3); _engineTemp = reader.GetString(6); _txtDescription.Text = reader.GetString(5); } } }
#region ########### populate data ################
private void PopulateStationcbo() { _cboEngineNo.Enabled = false; OleDbDataReader reader = RadarHelper.QueryDb("SELECT StationName FROM Station");
_cboStation.Items.Clear();
while (reader.Read()) { _cboStation.Items.Add(reader.GetString(0)); } }
111

private void PopulateEnginecbo(string station) { OleDbDataReader reader = RadarHelper.QueryDb("SELECT RegNumber FROM Engine WHERE Station='" + RadarHelper.GetStationRefNumber(station) + "'");
_cboEngineNo.Items.Clear();
while (reader.Read()) { _cboEngineNo.Items.Add(reader.GetValue(0)); } _cboEngineNo.Enabled = true; _cboEngineNo.Text = string.Empty; }
#endregion
private void AddEditTagForm_Load(object sender, EventArgs e) {
}
private void _btnAdd_MouseClick(object sender, MouseEventArgs e) { if (_booltagName && _booltagId && _boolstatus && _boolengineNo && _boolStation) { if (!RadarHelper.ItemExists(_txtTagID.Text)) { string tagName = "'" + _txtName.Text + "'"; string tagID = "'" + _txtTagID.Text + "'"; RadarHelper.OpenConnection(); string station = "'" + RadarHelper.GetStationRefNumber(_cboStation.SelectedItem.ToString()) + "'"; RadarHelper.CloseConnection(); string status = "'" + _cboStatus.SelectedItem + "'"; string engineNo = "'" + _cboEngineNo.SelectedItem + "'"; string description = "'" + _txtDescription.Text + "'";
RadarHelper.AddEditRecords("INSERT INTO Equipment VALUES (" + tagName + ", " + tagID + ", " + station + ", " + status + ", " + "'" + DateTime.Now.AddMinutes(-5).ToString() + "'" + ", " + description + ", " + engineNo + ", " + station + ")"); MessageBox.Show("Update: A new item has been added to the database", "UPDATE", MessageBoxButtons.OK, MessageBoxIcon.Information); ClearForm(); } else { MessageBox.Show("ERROR: The tagID already exists please check the ID and try again", "ERROR", MessageBoxButtons.OK, MessageBoxIcon.Error); _txtTagID.Focus(); return; } } else { MessageBox.Show("ERROR: you must fill in all the mandatory feilds.", "ERROR", MessageBoxButtons.OK, MessageBoxIcon.Exclamation); } }
private void _btnSaveEdit_Click(object sender, EventArgs e) { if (RadarHelper.ItemExists(_txtTagID.Text)) { string tagName = "'" + _txtName.Text + "'"; string tagID = "'" + _txtTagID.Text + "'"; RadarHelper.OpenConnection(); string station = "'" + RadarHelper.GetStationRefNumber(_cboStation.SelectedItem.ToString()) + "'";
112

RadarHelper.CloseConnection(); string status = "'" + _cboStatus.SelectedItem + "'"; string engineNo = "'" + _cboEngineNo.SelectedItem + "'"; string description = "'" + _txtDescription.Text + "'";
RadarHelper.AddEditRecords("UPDATE Equipment SET Name=" + tagName + ", TagID=" + tagID + ", CurrentLocation=" + station + ", Status=" + status + ", LastStatusChange='" + DateTime.Now.AddMinutes(-5).ToString() + "', Description=" + description + ", Engine=" + engineNo + ", Station=" + station + "WHERE TagID=" + tagID); MessageBox.Show("Update: You have just updated an item", "UPDATE", MessageBoxButtons.OK, MessageBoxIcon.Information); _saved = true; } }
private void ClearForm() { _txtName.Text = string.Empty; _txtTagID.Text = string.Empty; _cboStation.SelectedIndex = -1; _cboStatus.SelectedIndex = -1; _cboEngineNo.SelectedIndex = -1; _txtDescription.Text = string.Empty;
// clear validation _lblNameX.Text = string.Empty; _lblTagIDX.Text = string.Empty; _lblStationX.Text = string.Empty; _lblStatusX.Text = string.Empty; _lblEngineNoX.Text = string.Empty; }
private void _Close_Click(object sender, EventArgs e) { if (_saved) { Close(); } else { if ( MessageBox.Show( "WARING: You have not saved the details are you sure you wish to leave without saving?", "WARING", MessageBoxButtons.YesNo, MessageBoxIcon.Warning) == DialogResult.Yes) { Close(); } }
} #region ############ Validation ##################
private void _txtName_Leave(object sender, EventArgs e) { if (_mood == "ADD") { if (_txtName.Text == string.Empty) { _lblNameX.ForeColor = Color.Red; _lblNameX.Text = "X"; _booltagName = false; } else { _lblNameX.ForeColor = Color.Green; _lblNameX.Text = "√"; _booltagName = true; } } }
private void _txtTagID_Leave(object sender, EventArgs e) { if (_mood == "ADD") {
113

if (_txtTagID.Text == string.Empty) { _lblTagIDX.ForeColor = Color.Red; _lblTagIDX.Text = "X"; _booltagId = false; } else { _lblTagIDX.ForeColor = Color.Green; _lblTagIDX.Text = "√"; _booltagId = true; } } }
private void _cboStatus_Leave(object sender, EventArgs e) { if (_mood == "ADD") { if (_cboStatus.SelectedIndex == -1) { _lblStatusX.ForeColor = Color.Red; _lblStatusX.Text = "X"; _boolstatus = false; } else { _lblStatusX.ForeColor = Color.Green; _lblStatusX.Text = "√"; _boolstatus = true; } } }
private void _cboEngineNo_Leave(object sender, EventArgs e) { if (_mood == "ADD") { if (_cboEngineNo.SelectedIndex == -1) { _lblEngineNoX.ForeColor = Color.Red; _lblEngineNoX.Text = "X"; _boolengineNo = false; } else { _lblEngineNoX.ForeColor = Color.Green; _lblEngineNoX.Text = "√"; _boolengineNo = true; } } }
private void _cboStation_Leave(object sender, EventArgs e) { if (_mood == "ADD") { if (_cboStation.SelectedIndex == -1) { _lblStationX.ForeColor = Color.Red; _lblStationX.Text = "X"; _boolStation = false; } else { _lblStationX.ForeColor = Color.Green; _lblStationX.Text = "√"; _boolStation = true; } } }
private void _cboStation_SelectedIndexChanged(object sender, EventArgs e) { if (_cboStation.SelectedIndex != -1) { RadarHelper.OpenConnection();
114

PopulateEnginecbo(_cboStation.SelectedItem.ToString()); RadarHelper.CloseConnection(); } }
#endregion
115


