72
SEBI BULLETIN April 2017 VOL. 15 NUMBER 4 (LOGO)

SEBIBULLETIN
April 2017 VOL. 15 NUMBER 4
(LOGO)
SECURITIES AND EXCHANGE BOARD OF INDIA
EDITORIAL COMMITTEE Mr. Ananta BaruaMr. J. RanganayakuluMr. S. V. Murali Dhar Rao
The Securities and Exchange Board of India Bulletin is issued by the Department of Economic and Policy Analysis, Securities and Exchange Board of India under the direction of an Editorial Committee. SEBI is not responsible for accuracy of data/information/interpretations and opinions expressed in the case of signed articles/speeches as authors are responsible for their personal views. SEBI has no objection to the material published herein being reproduced, provided an acknowledgement of the same is made. The soft copy of SEBI Bulletin is available free of cost to the subscribers/readers, who register at [email protected] along with their complete address. A readable version of SEBI Bulletin is available at http://www.sebi.gov.in. Any comments and suggestions on any of the features/sections may be sent to [email protected]
CONTENTS
CAPITAL MARKET REVIEW
GLOBAL MARKET REVIEW - APRIL 2017
HIGHLIGHTS OF DEVELOPMENTS IN INTERNATIONAL SECURITIES MARKET
TABLES
PUBLICATIONS
CAPITAL MARKET REVIEW
I. Trends in Primary Market
A. Public and Rights Issues
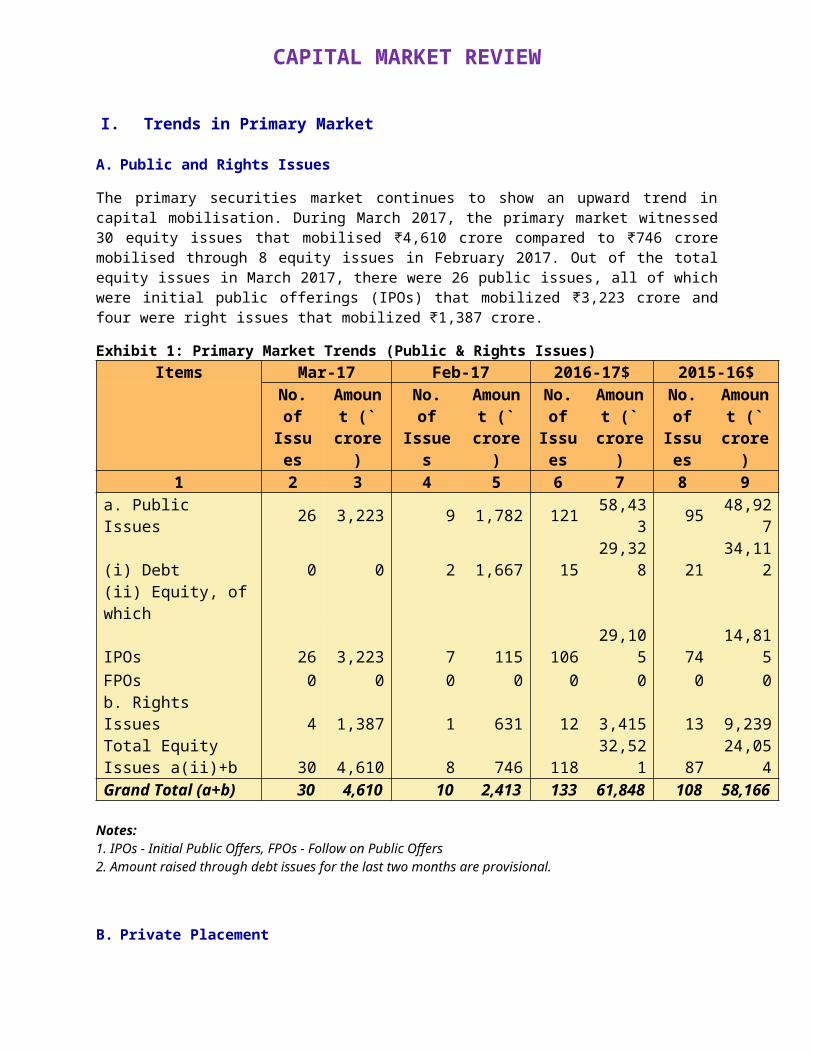
The primary securities market continues to show an upward trend in capital mobilisation. During March 2017, the primary market witnessed 30 equity issues that mobilised ₹4,610 crore compared to ₹746 crore mobilised through 8 equity issues in February 2017. Out of the total equity issues in March 2017, there were 26 public issues, all of which were initial public offerings (IPOs) that mobilized ₹3,223 crore and four were right issues that mobilized ₹1,387 crore.
Exhibit 1: Primary Market Trends (Public & Rights Issues)Items Mar-17 Feb-17 2016-17$ 2015-16$
No. of
Issues
Amount (` crore
)
No. of Issues
Amount (` crore
)
No. of
Issues
Amount (` crore
)
No. of
Issues
Amount (` crore
)
1 2 3 4 5 6 7 8 9
a. Public Issues 26 3,223 9 1,782 121 58,433 95 48,92
7
(i) Debt 0 0 2 1,667 1529,32
8 2134,11
2(ii) Equity, of which
IPOs 26 3,223 7 115 10629,10
5 7414,81
5FPOs 0 0 0 0 0 0 0 0b. Rights Issues 4 1,387 1 631 12 3,415 13 9,239Total Equity Issues a(ii)+b 30 4,610 8 746 118
32,521 87
24,054
Grand Total (a+b) 30 4,610 10 2,413 133 61,84
8 108 58,166
Notes: 1. IPOs - Initial Public Offers, FPOs - Follow on Public Offers 2. Amount raised through debt issues for the last two months are provisional.
B. Private Placement
1. QIPs Listed at BSE and NSE
Qualified Institutional Placement (QIP) is an alternative mode of resource raising available for listed companies to raise funds from domestic market. In a QIP, a listed issuer issues equity shares or non-convertible debt instruments along with warrants and convertible securities other than warrants to Qualified Institutional Buyers only. In March 2017, ₹3626.49 crore was mobilised through one QIP issue
compared to ₹172.8 crore mobilised through one QIP issue in the previous month. (Table 10)
2. Preferential Allotments Listed at BSE and NSEPreferential allotment also serves as an alternative mechanism of resource mobilization wherein a listed issuer issues shares or convertible securities to a select group of persons. There were 27 preferential allotments (amounting to ₹4,170 crore) listed at BSE and NSE together during March 2017, compared to 27 preferential allotments (amounting to ₹1,099 crore) listed during February 2017. (Table 11).
3. Private Placement of Corporate Debt
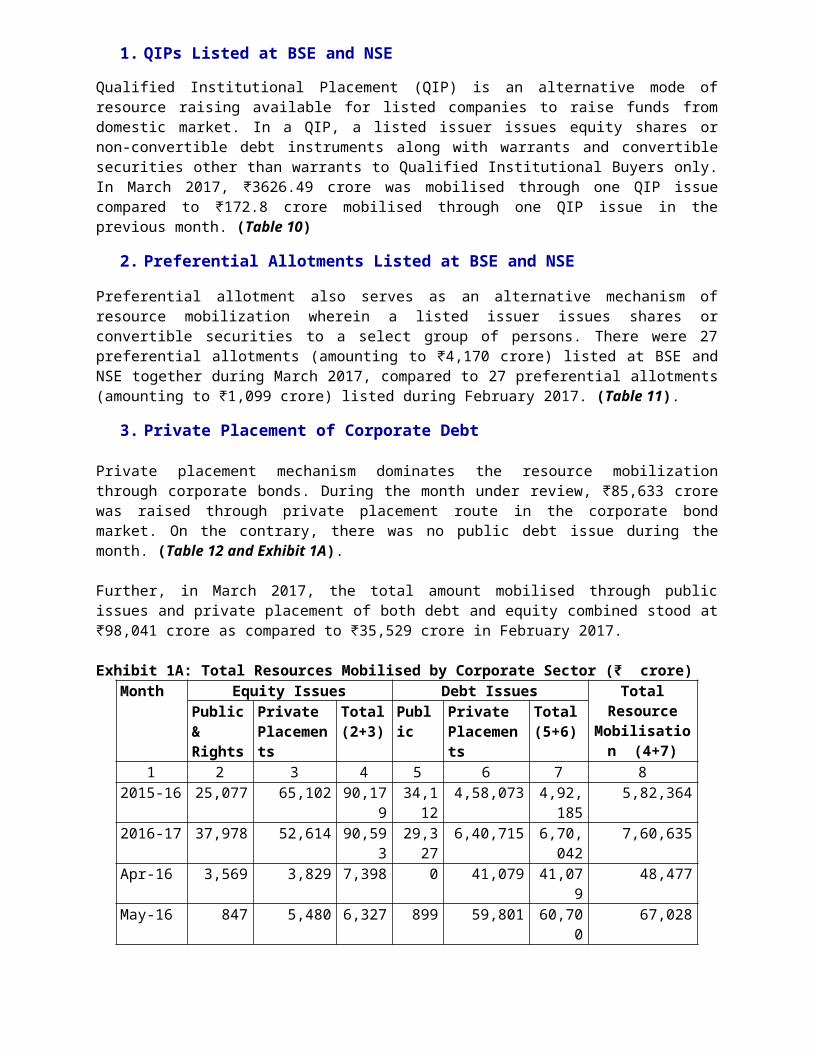
Private placement mechanism dominates the resource mobilization through corporate bonds. During the month under review, ₹85,633 crore was raised through private placement route in the corporate bond market. On the contrary, there was no public debt issue during the month. (Table 12 and Exhibit 1A).
Further, in March 2017, the total amount mobilised through public issues and private placement of both debt and equity combined stood at ₹98,041 crore as compared to ₹35,529 crore in February 2017.
Exhibit 1A: Total Resources Mobilised by Corporate Sector (₹ crore)Month Equity Issues Debt Issues Total
Resource Mobilisatio
n (4+7)
Public & Rights
Private Placements
Total(2+3)
Public
Private Placements
Total(5+6)
1 2 3 4 5 6 7 82015-16 25,077 65,102 90,17
934,1
124,58,073 4,92,1
855,82,364
2016-17 37,978 52,614 90,593
29,327
6,40,715 6,70,042
7,60,635
Apr-16 3,569 3,829 7,398 0 41,079 41,079
48,477
May-16 847 5,480 6,327 899 59,801 60,700
67,028
Jun-16 1,518 2,070 3,589 1,000
33,576 34,576
38,165
Jul-16 1,659 1,525 3,184 500 36,774 37,274
40,458
Aug-16 2,636 580 3,216 14,000
71,165 85,165
88,381
Sep-16 7,703 7,928 15,631
7,493
67,952 75,445
91,076
Oct-16 5,287 7,339 12,626
0 70,396 70,396
83,021
Nov-16 1,209 2,567 3,777 0 38,645 38,645
42,421
Dec-16 1,381 3,201 4,581 0 59,587 59,587
64,168
Jan-17 5,120 9,025 14,145
3,768
45,957 49,725
63,870
Feb-17 2,439 1,272 3,711 1,667
30,151 31,818
35,529
Mar-17 4,610 7,798 12,408
0 85,633 85,633
98,041
Notes: a. Private placement of Equity includes, amount raised through preferential allotments,
QIP and IPP mechanism.b. Public Equity Issues includes IPO, FPO & Rights issues of common equity shares. c. Data pertaining to Debt Issue of March 2017 are provisional
II. Resource Mobilisation by Mutual Funds
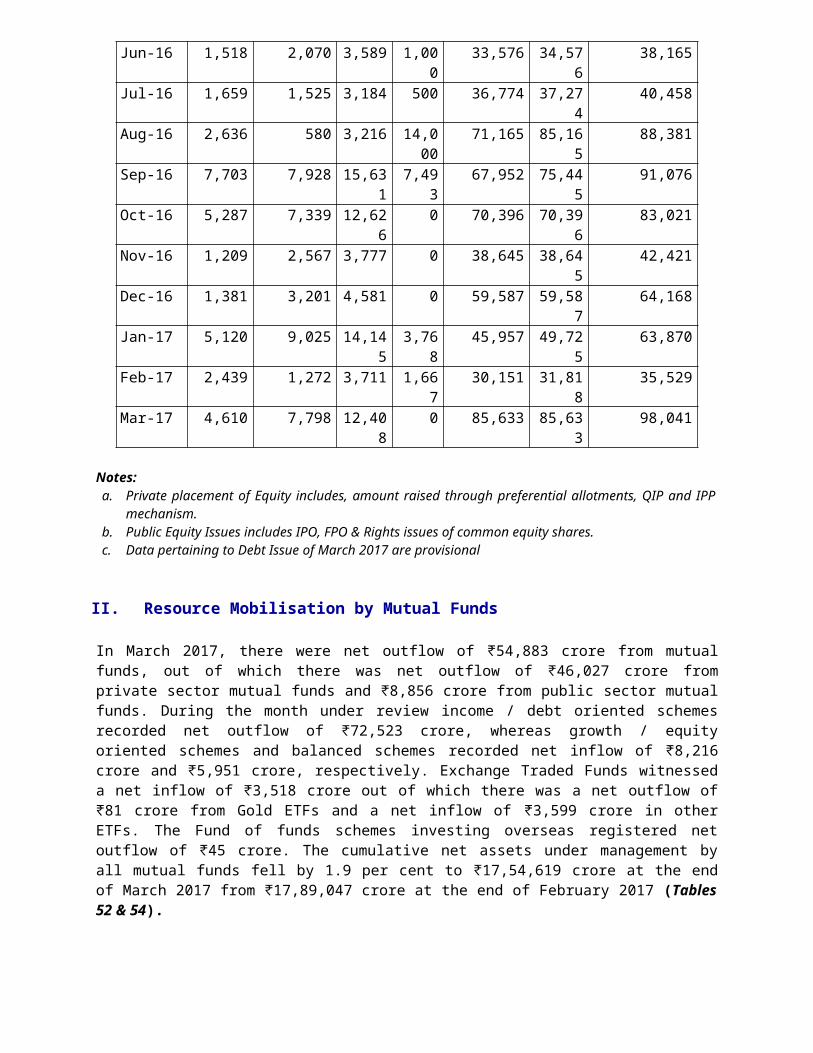
In March 2017, there were net outflow of ₹54,883 crore from mutual funds, out of which there was net outflow of ₹46,027 crore from private sector mutual funds and ₹8,856 crore from public sector mutual funds. During the month under review income / debt oriented schemes recorded net outflow of ₹72,523 crore, whereas growth / equity oriented schemes and balanced schemes recorded net inflow of ₹8,216 crore and ₹5,951 crore, respectively. Exchange Traded Funds witnessed a net inflow of ₹3,518 crore out of which there was a net outflow of ₹81 crore from Gold ETFs and a net inflow of ₹3,599 crore in other ETFs. The Fund of funds schemes investing overseas registered net outflow of ₹45 crore. The cumulative net assets under management by all mutual funds fell by 1.9 per cent to ₹17,54,619 crore at the end of March 2017 from ₹17,89,047 crore at the end of February 2017 (Tables 52 & 54).
III. Trends in the Secondary Market
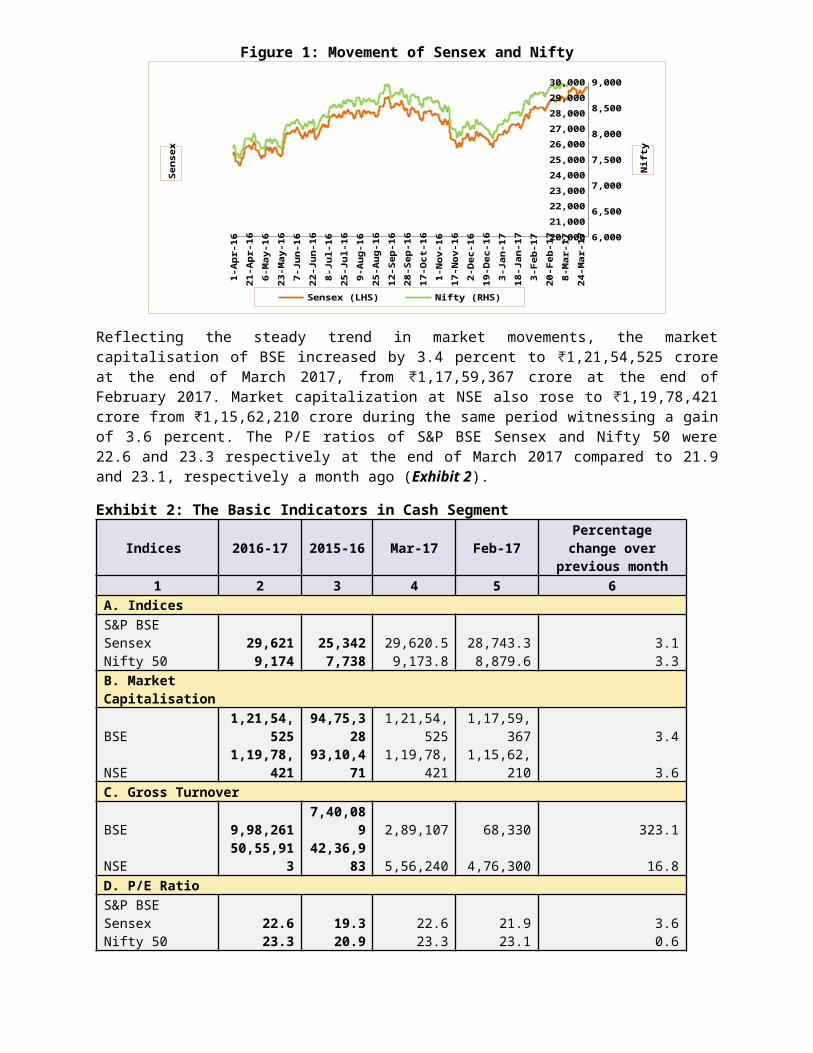
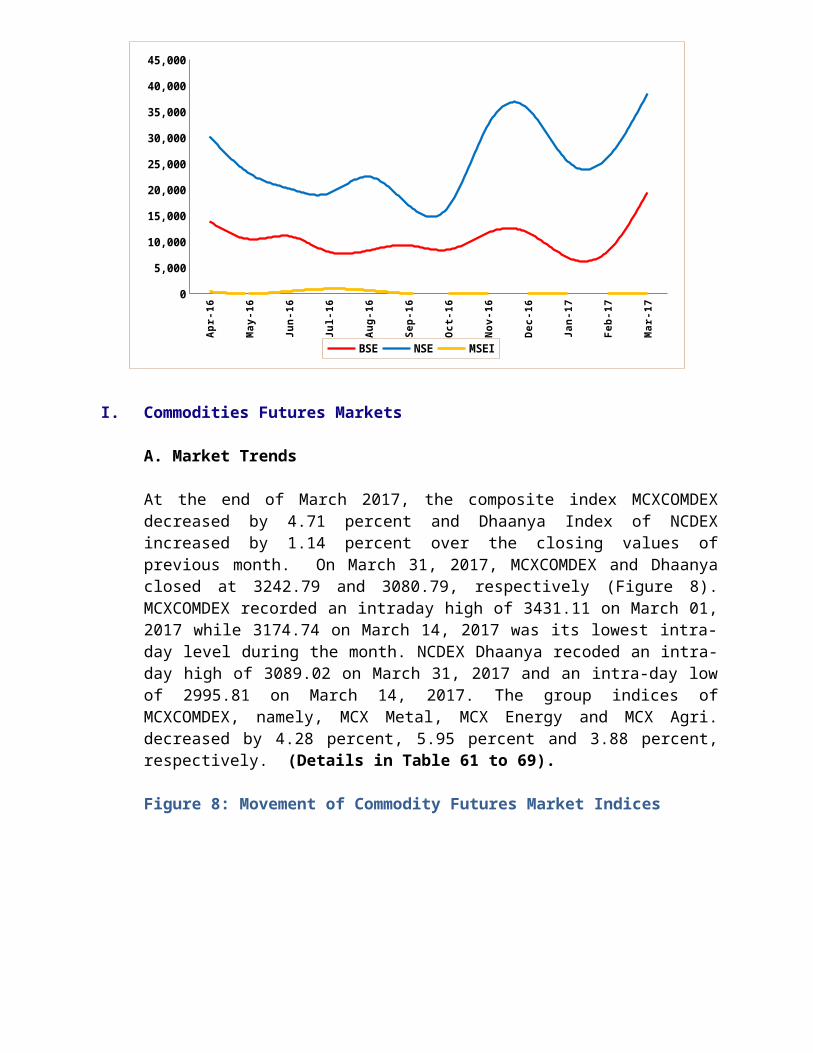
The Indian stock market witnessed moderate gain during March 2017. At the end of March 2017, S&P BSE Sensex closed at 29620.50 witnessing a 3.1 percent gain over its last month’s closing at 28743.32. The Nifty 50 also increased by 3.1 percent to close at 9173.75 at the end of March 2017 compared to previous month’s closing at 8,879.60 (Figure 1). S&P BSE Sensex and Nifty 50 touched their intraday highs of 29824.62 and 9218.40 respectively on March 17, 2017. Both Sensex and Nifty touched their intraday lows of 28716.21 and 8860.10 respectively on March 03, 2017.
Figure 1: Movement of Sensex and Nifty
Apr-
16
May-
16
Jun
-16
Jul-
16
Au
g-1
6
Sep
-16
Oct
-16
Nov
-16
Dec
-16
Jan
-17
Feb-
17
Mar-
1720,000
21,00022,00023,00024,00025,00026,00027,00028,00029,00030,000
6,000
6,500
7,000
7,500
8,000
8,500
9,000
Sensex (LHS) Nifty (RHS)
Sen
sex
Nif
ty
Reflecting the steady trend in market movements, the market capitalisation of BSE increased by 3.4 percent to ₹1,21,54,525 crore at the end of March 2017, from ₹1,17,59,367 crore at the end of February 2017. Market capitalization at NSE also rose to ₹1,19,78,421 crore from ₹1,15,62,210 crore during the same period witnessing a gain of 3.6 percent. The P/E ratios of S&P BSE Sensex and Nifty 50 were 22.6 and 23.3 respectively at the end of March 2017 compared to 21.9 and 23.1, respectively a month ago (Exhibit 2).
Exhibit 2: The Basic Indicators in Cash Segment
Indices 2016-17 2015-16 Mar-17 Feb-17
Percentage change over
previous month1 2 3 4 5 6
A. Indices S&P BSE Sensex 29,621 25,342 29,620.5 28,743.3 3.1Nifty 50 9,174 7,738 9,173.8 8,879.6 3.3B. Market Capitalisation
BSE1,21,54,
52594,75,3
281,21,54,5
251,17,59,3
67 3.4
NSE1,19,78,
42193,10,4
711,19,78,4
211,15,62,2
10 3.6C. Gross Turnover
BSE 9,98,2617,40,08
9 2,89,107 68,330 323.1
NSE50,55,91
342,36,9
83 5,56,240 4,76,300 16.8D. P/E RatioS&P BSE Sensex 22.6 19.3 22.6 21.9 3.6Nifty 50 23.3 20.9 23.3 23.1 0.6E. No.of Listed CompaniesBSE 5,834 5,911 5,834 5,807 0.5NSE 1,817 1,808 1,817 1,850 -1.8
Source: BSE, NSE
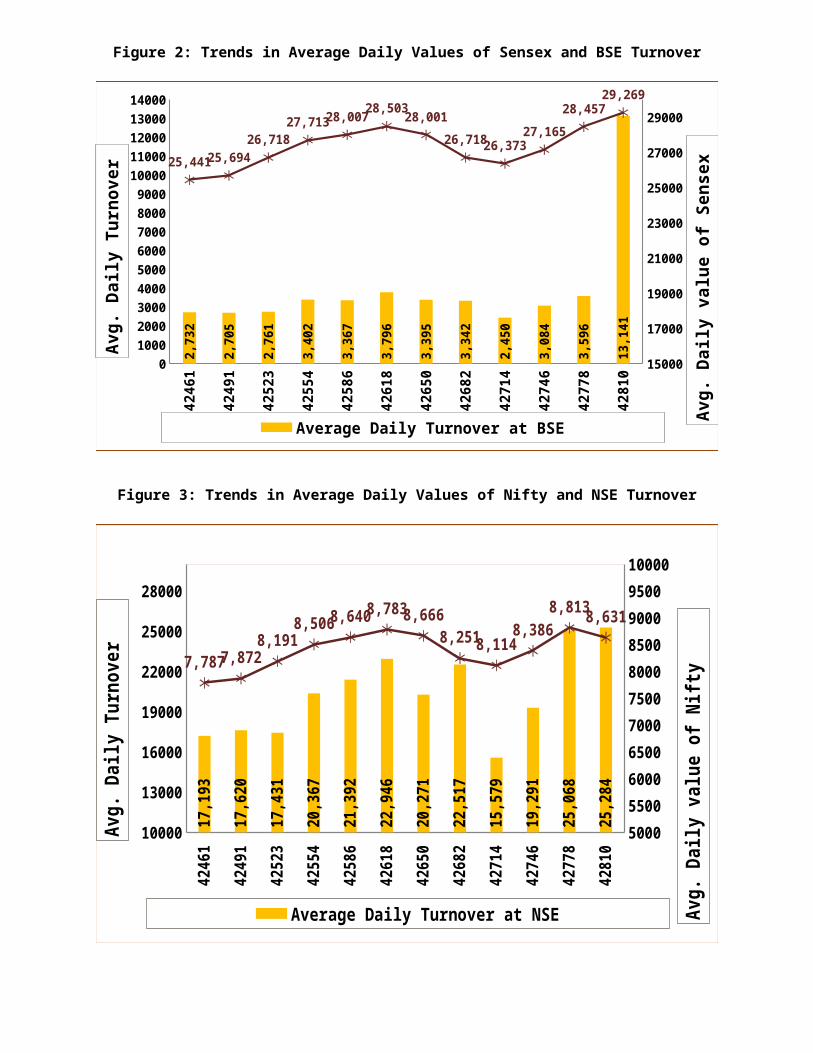
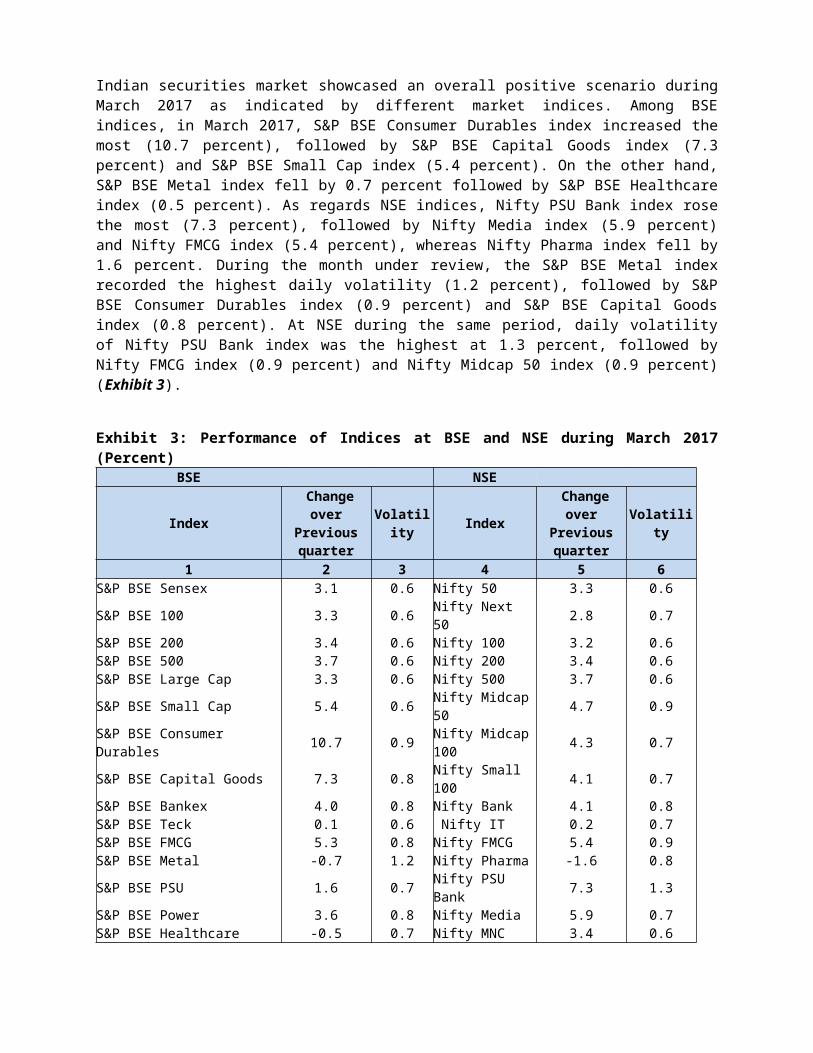
The monthly turnover of BSE (cash segment) increased by 323.1 percent to ₹2,89,107 crore in March 2017 from ₹68,330 crore in February 2017. This sudden hike in the cash segment turnover was caused by Block Deals executed on March 9, 15 and 20. The monthly turnover of NSE (cash segment) also increased by 16.8 percent to ₹5,56,240 crore in March 2017 from ₹4,76,300 crore in February 2017.
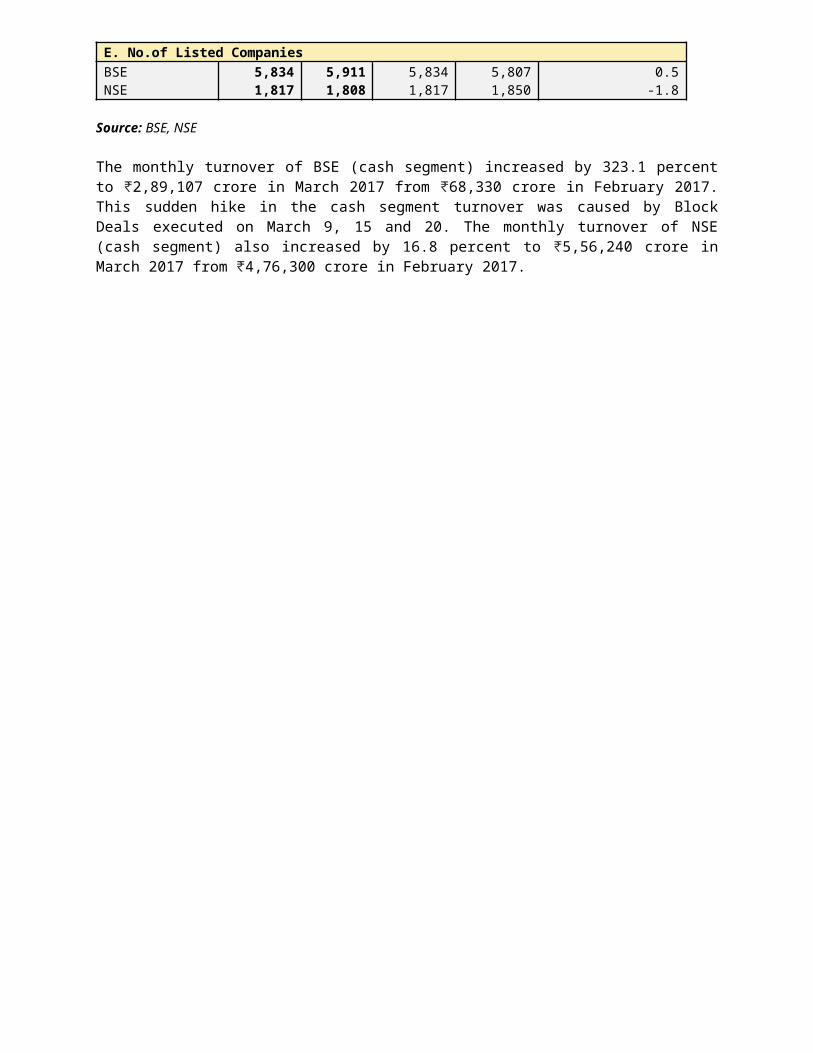
Figure 2: Trends in Average Daily Values of Sensex and BSE Turnover
4246
1
4249
1
4252
3
4255
4
4258
6
4261
8
4265
0
4268
2
4271
4
4274
6
4277
8
4281
0
0100020003000400050006000700080009000
1000011000120001300014000
15000160001700018000190002000021000220002300024000250002600027000280002900030000
2,73
2
2,70
5
2,76
1
3,40
2
3,36
7
3,79
6
3,39
5
3,34
2
2,45
0
3,08
4
3,59
6
13,1
41
25,44125,69426,718
27,71328,00728,50328,00126,71826,373
27,16528,457
29,269
Average Daily Turnover at BSE
Avg.
Dai
ly T
urno
ver
Avg.
Dai
ly v
alue
of S
ense
x
Figure 3: Trends in Average Daily Values of Nifty and NSE Turnover
4246
1
4249
1
4252
3
4255
4
4258
6
4261
8
4265
0
4268
2
4271
4
4274
6
4277
8
4281
0
10000
13000
16000
19000
22000
25000
28000
500055006000650070007500800085009000950010000
17,1
93
17,6
20
17,4
31
20,3
67
21,3
92
22,9
46
20,2
71
22,5
17
15,5
79
19,2
91
25,0
68
25,2
84
7,7877,8728,191
8,5068,6408,7838,6668,2518,114
8,3868,8138,631
Average Daily Turnover at NSE
Avg.
Dai
ly T
urno
ver
Avg.
Dai
ly v
alue
of N
ifty
Indian securities market showcased an overall positive scenario during March 2017 as indicated by different market indices. Among BSE indices, in March 2017, S&P BSE Consumer Durables index increased the most (10.7 percent), followed by S&P BSE Capital Goods index (7.3 percent) and S&P BSE Small Cap index (5.4 percent). On the other hand, S&P BSE Metal index fell by 0.7 percent followed by S&P BSE Healthcare index (0.5 percent). As regards NSE indices, Nifty PSU Bank index rose the most (7.3 percent), followed by Nifty Media index (5.9 percent) and Nifty FMCG index (5.4 percent), whereas Nifty Pharma index fell by 1.6 percent. During the month under review, the S&P BSE Metal index recorded the highest daily volatility (1.2 percent), followed by S&P BSE Consumer Durables index (0.9 percent) and S&P BSE Capital Goods index (0.8 percent). At NSE during the same period, daily volatility of Nifty PSU Bank index was the highest at 1.3 percent, followed by Nifty FMCG index (0.9 percent) and Nifty Midcap 50 index (0.9 percent) (Exhibit 3).
Exhibit 3: Performance of Indices at BSE and NSE during March 2017 (Percent)
BSE NSE
Index Change
over Previous quarter
Volatility Index
Change over
Previous quarter
Volatility
1 2 3 4 5 6S&P BSE Sensex 3.1 0.6 Nifty 50 3.3 0.6S&P BSE 100 3.3 0.6 Nifty Next 50 2.8 0.7S&P BSE 200 3.4 0.6 Nifty 100 3.2 0.6S&P BSE 500 3.7 0.6 Nifty 200 3.4 0.6S&P BSE Large Cap 3.3 0.6 Nifty 500 3.7 0.6S&P BSE Small Cap 5.4 0.6 Nifty Midcap
50 4.7 0.9S&P BSE Consumer Durables 10.7 0.9 Nifty Midcap
100 4.3 0.7
S&P BSE Capital Goods 7.3 0.8 Nifty Small 100 4.1 0.7
S&P BSE Bankex 4.0 0.8 Nifty Bank 4.1 0.8S&P BSE Teck 0.1 0.6 Nifty IT 0.2 0.7S&P BSE FMCG 5.3 0.8 Nifty FMCG 5.4 0.9S&P BSE Metal -0.7 1.2 Nifty Pharma -1.6 0.8S&P BSE PSU 1.6 0.7 Nifty PSU
Bank 7.3 1.3S&P BSE Power 3.6 0.8 Nifty Media 5.9 0.7S&P BSE Healthcare -0.5 0.7 Nifty MNC 3.4 0.6Source: BSE and NSE
IV. Trends in Depository Accounts
The total number of investor accounts at the end of March 2017 was 156 lakh at NSDL (an increase of 0.95 percent over February 2017) and 123 lakh at CDSL (an increase of 1.68 percent over February 2017). The number of investor accounts increased by 6.96 percent at NSDL and by 13.69 percent at CDSL over the number of investors at the respective depositories in March 2016 (Table 58).
V. Trends in Derivatives Segment
A. Equity Derivatives
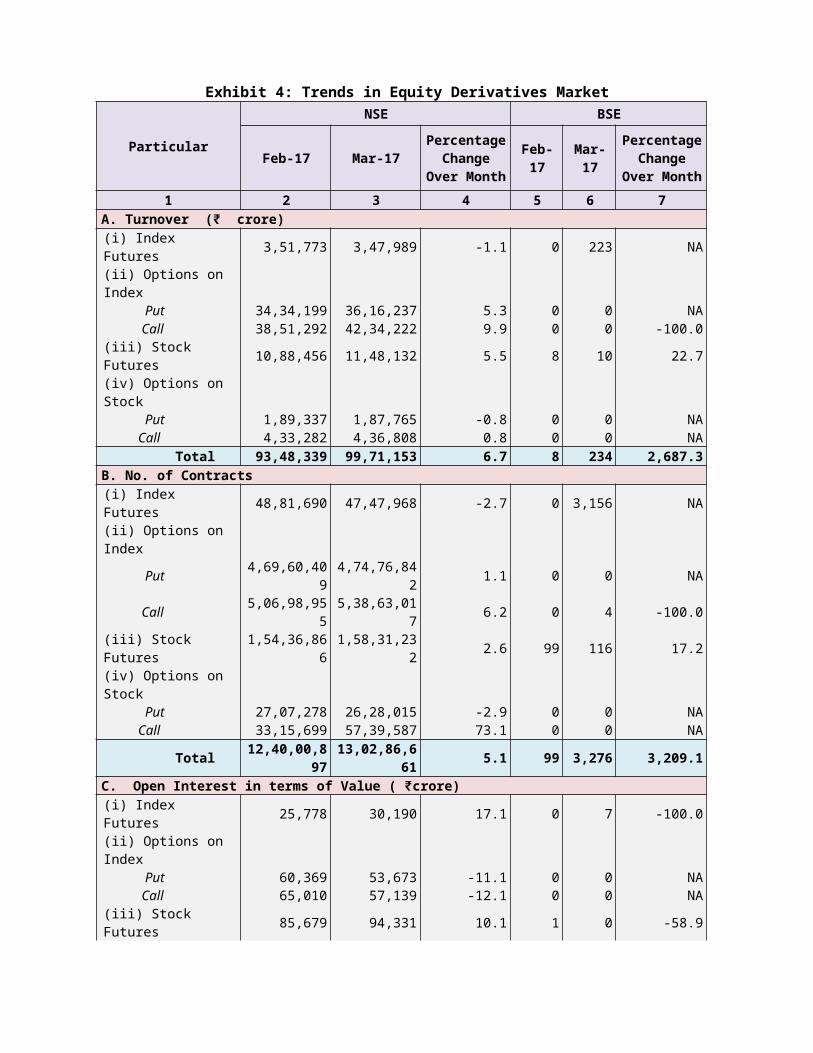
India is one of the most vibrant markets for exchange traded equity derivatives in the world. The trading volumes in the equity derivatives market was 12 times that of the equity cash segment in February 2017. The monthly total turnover in equity derivatives market at NSE rose by 6.7 percent to ₹99,71,153 crore in March 2017 from ₹93,48,339 crore in February 2017 (Figure 4). During the month under review options on index accounted for about 79 percent of the total turnover in the F&O segment at NSE. During March 2017, monthly turnover of index futures fell, whereas monthly turnover of index options, stock futures and stock options increased in turnover compared to the previous month. The open interest in value terms in the equity derivative segment of NSE fell by 1.9 percent to ₹2,49,497 crore as on March 31, 2017 from ₹2,54,230 crore as on February 28, 2017.
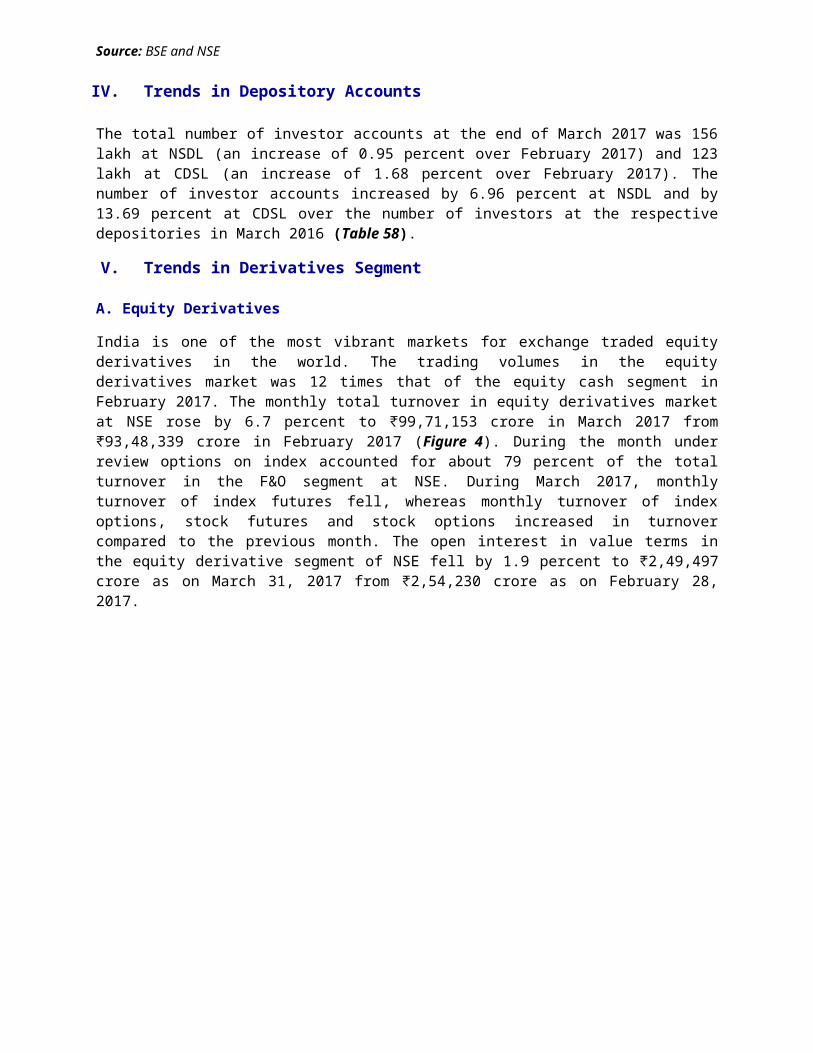
Figure 4: Trends of Equity Derivatives Segment at NSE (₹ crore)
Apr-
16
May
-16
Jun-
16
Jul-1
6
Aug-
16
Sep-
16
Oct-
16
Nov
-16
Dec-
16
Jan-
17
Feb-
17
Mar
-17
50,000
1,00,000
1,50,000
2,00,000
2,50,000
3,00,000
3,50,000
4,00,000
4,50,000
5,00,000
5,50,000
0
20,00,000
40,00,000
60,00,000
80,00,000
1,00,00,000
1,20,00,000
2,99
,737
2,89
,824
3,05
,311
3,34
,886
3,60
,172
4,33
,539
4,09
,294
4,41
,166
3,60
,209 3,95
,458 4,
92,0
18
4,53
,234
Average daily Turnover Monthly Turnover
Aver
age
dai
ly T
urno
ver
Mon
thly
Tur
nove
r
The monthly total turnover in equity derivative segment of BSE increased to ₹234 crore in March 2017 from ₹8 crore in February 2017. The open interest in value terms in equity derivatives segment of BSE increased to ₹8 crore as on March 31, 2016 from ₹1 crore as on February 28, 2017 (Exhibit 4).
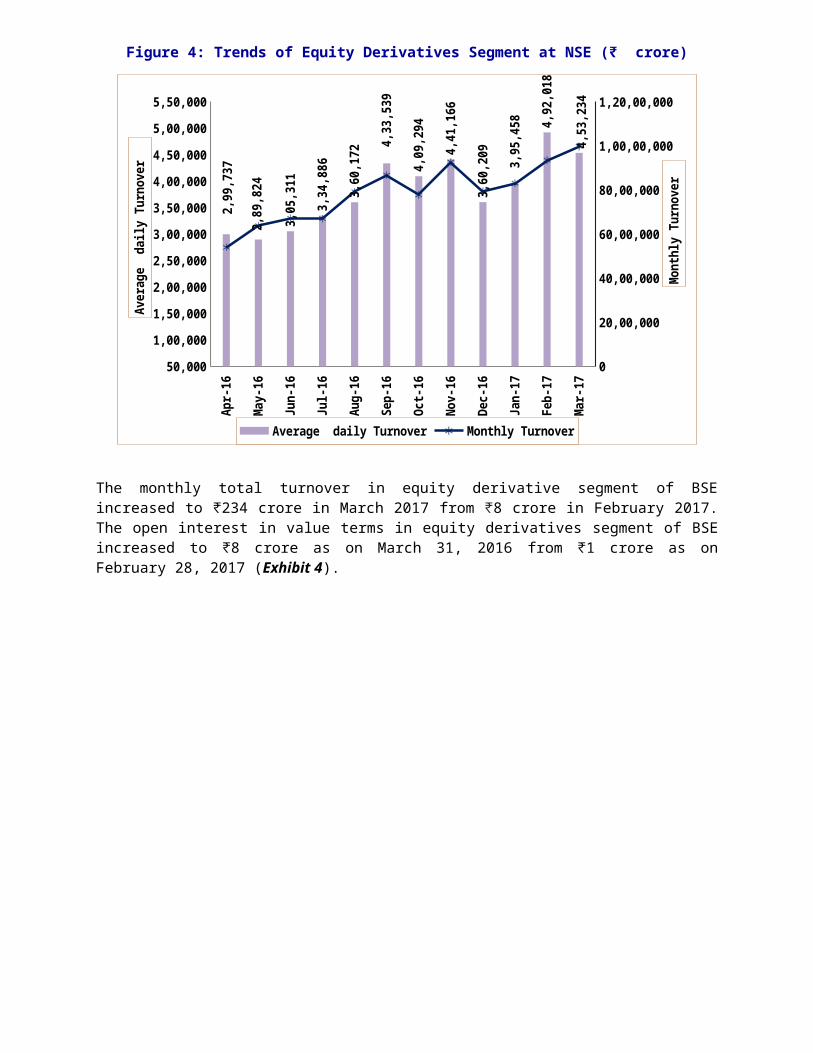
Exhibit 4: Trends in Equity Derivatives Market
Particular
NSE BSE
Feb-17 Mar-17Percentage Change
Over Month
Feb-17
Mar-17
Percentage Change
Over Month
1 2 3 4 5 6 7A. Turnover (₹ crore)(i) Index Futures 3,51,773 3,47,989 -1.1 0 223 NA(ii) Options on Index Put 34,34,199 36,16,237 5.3 0 0 NA Call 38,51,292 42,34,222 9.9 0 0 -100.0(iii) Stock Futures 10,88,456 11,48,132 5.5 8 10 22.7(iv) Options on Stock Put 1,89,337 1,87,765 -0.8 0 0 NA Call 4,33,282 4,36,808 0.8 0 0 NA Total 93,48,339 99,71,153 6.7 8 234 2,687.3B. No. of Contracts (i) Index Futures 48,81,690 47,47,968 -2.7 0 3,156 NA(ii) Options on Index Put 4,69,60,409 4,74,76,842 1.1 0 0 NA Call 5,06,98,955 5,38,63,017 6.2 0 4 -100.0(iii) Stock Futures 1,54,36,866 1,58,31,232 2.6 99 116 17.2(iv) Options on Stock Put 27,07,278 26,28,015 -2.9 0 0 NA Call 33,15,699 57,39,587 73.1 0 0 NA
Total 12,40,00,897
13,02,86,661 5.1 99 3,276 3,209.1
C. Open Interest in terms of Value ( ₹crore)(i) Index Futures 25,778 30,190 17.1 0 7 -100.0(ii) Options on Index Put 60,369 53,673 -11.1 0 0 NA Call 65,010 57,139 -12.1 0 0 NA(iii) Stock Futures 85,679 94,331 10.1 1 0 -58.9(iv) Options on Stock Put 6,166 5,274 -14.5 0 0 NA Call 11,227 8,890 -20.8 0 0 NA Total 2,54,230 2,49,497 -1.9 1 8 588.4D. Open Interest in terms of No of Contracts(i) Index Futures 3,71,379 4,22,593 13.8 0 102 -100.0(ii) Options on Index Put 8,73,614 7,57,034 -13.3 0 0 NA Call 9,31,685 8,01,917 -13.9 0 0 NA(iii) Stock Futures 12,51,267 13,62,099 8.9 14 5 -64.3(iv) Options on Stock Put 87,750 74,015 -15.7 0 0 NA Call 1,61,217 1,24,746 -22.6 0 0 NA
Total 36,76,912 35,42,404 -3.7 14 107 664.3
B. VIX Futures at NSE
NSE introduced futures contracts on India VIX in the Futures & Options segment of NSE w.e.f. February 26, 2014. It is a volatility index based on the NIFTY Index Option prices. From the best bid-ask prices of NIFTY Options contracts, a volatility figure (in percentage) is calculated which indicates the expected market volatility over the next 30 calendar days. This volatility index is a measure of market expectations of near-term. The contract symbol is INDIAVIX and 3 weekly futures contracts were made available for trading. The contracts shall expire on every Tuesday. The tick size is 0.25 and lot size is 550.
India VIX closed at 12.42 at the end of March 2017, lower than 13.79 registered at the end of February 2017 (Figure 5). During January and February 2017 there was no trade in VIX futures contract. The open interest in India VIX contracts was zero at the end of January 2017.
Figure 5: Trends in VIX futures at NSE
Apr
-16
May
-16
Jun
-16
Jul-
16
Aug
-16
Sep
-16
Oct
-16
Nov
-16
Dec
-16
Jan-
17
Feb
-17
Mar
-170.000
2.0004.0006.0008.000
10.00012.00014.00016.00018.00020.000
VIX Index
VIX Index
VIX
C. Currency Derivatives at NSE, BSE and MSEI
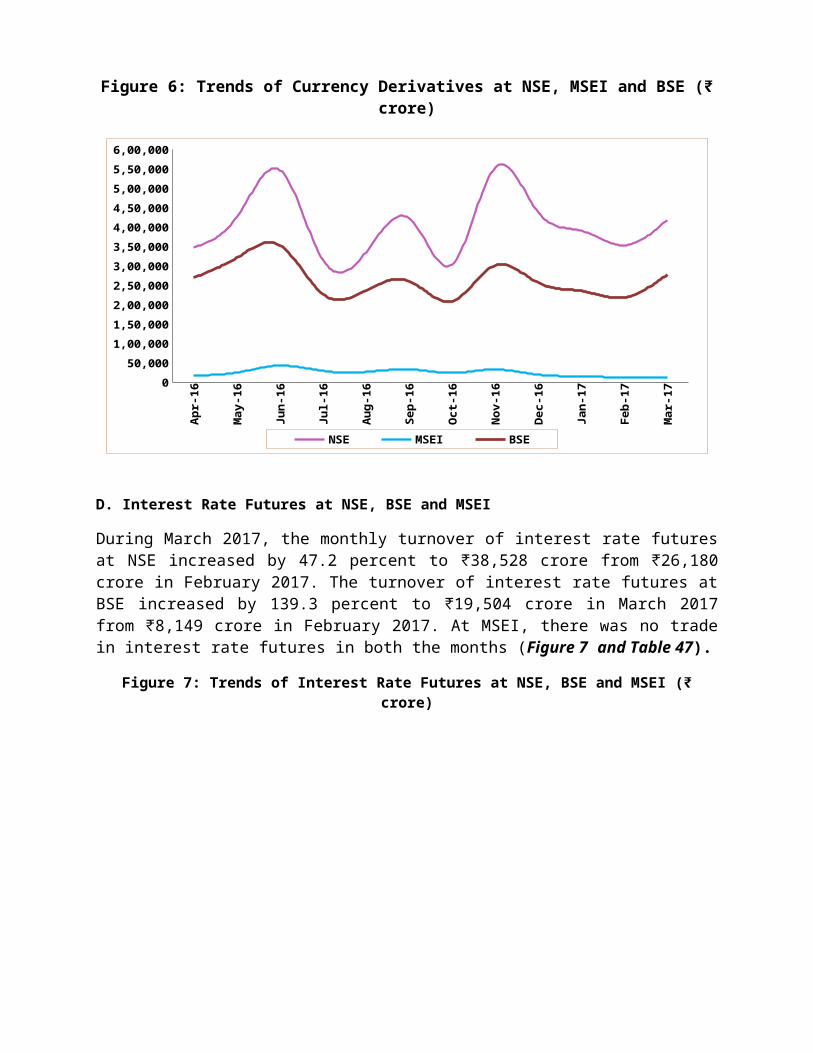
March 2017 witnessed an upturn in currency derivatives trade across exchanges. The monthly turnover of currency derivatives at NSE during March 2017 increased by 18.4 percent to ₹4,18,537 crore from ₹3,53,643 crore in February 2017. During the same time the monthly turnover of currency derivatives at BSE increased by 26.9 percent to ₹2,77,957 crore from ₹2,19,015 crore and the monthly turnover of currency derivatives at MSEI increased by 10.0 percent to ₹13,922 crore from ₹12,659 crore. (Figure 6 and Tables 37, 38 and 39)
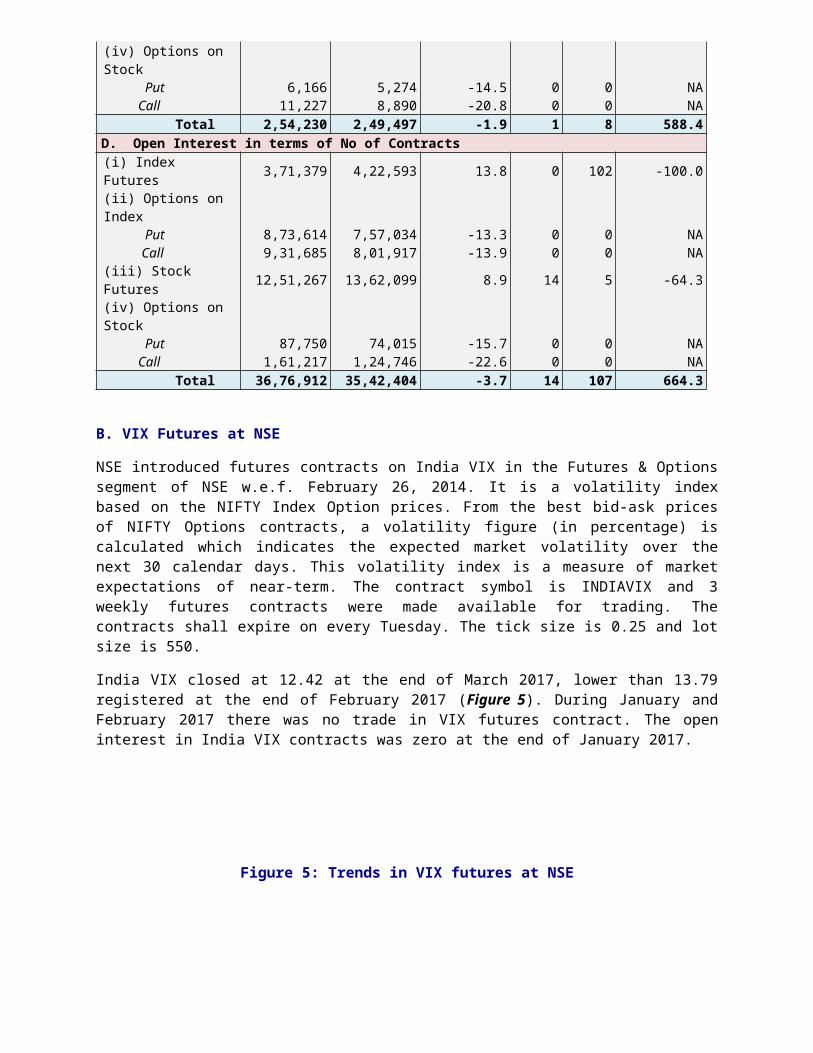
Figure 6: Trends of Currency Derivatives at NSE, MSEI and BSE (₹ crore)
Apr
-16
May
-16
Jun
-16
Jul-
16
Au
g-16
Sep
-16
Oct
-16
Nov
-16
Dec
-16
Jan
-17
Feb
-17
Mar
-170
50,0001,00,0001,50,0002,00,0002,50,0003,00,0003,50,0004,00,0004,50,0005,00,0005,50,0006,00,000
NSE MSEI BSE
D. Interest Rate Futures at NSE, BSE and MSEI
During March 2017, the monthly turnover of interest rate futures at NSE increased by 47.2 percent to ₹38,528 crore from ₹26,180 crore in February 2017. The turnover of interest rate futures at BSE increased by 139.3 percent to ₹19,504 crore in March 2017 from ₹8,149 crore in February 2017. At MSEI, there was no trade in interest rate futures in both the months (Figure 7 and Table 47).Figure 7: Trends of Interest Rate Futures at NSE, BSE and MSEI (₹ crore)
Apr
-16
May
-16
Jun-
16
Jul-
16
Aug
-16
Sep-
16
Oct
-16
Nov
-16
Dec
-16
Jan-
17
Feb-
17
Mar
-17
0
5,000
10,000
15,000
20,000
25,000
30,000
35,000
40,000
45,000
BSE NSE
I. Commodities Futures Markets
A. Market Trends
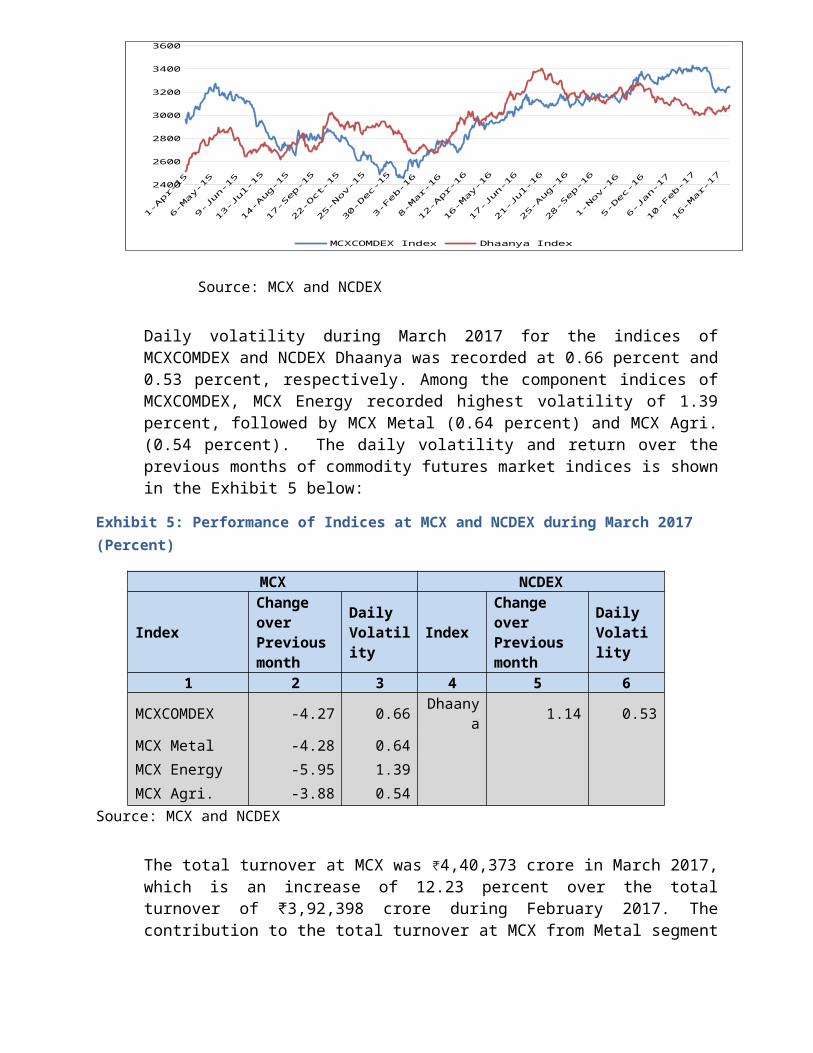
At the end of March 2017, the composite index MCXCOMDEX decreased by 4.71 percent and Dhaanya Index of NCDEX increased by 1.14 percent over the closing values of previous month. On March 31, 2017, MCXCOMDEX and Dhaanya closed at 3242.79 and 3080.79, respectively (Figure 8). MCXCOMDEX recorded an intraday high of 3431.11 on March 01, 2017 while 3174.74 on March 14, 2017 was its lowest intra-day level during the month. NCDEX Dhaanya recoded an intra-day high of 3089.02 on March 31, 2017 and an intra-day low of 2995.81 on March 14, 2017. The group indices of MCXCOMDEX, namely, MCX Metal, MCX Energy and MCX Agri. decreased by 4.28 percent, 5.95 percent and 3.88 percent, respectively. (Details in Table 61 to 69).
Figure 8: Movement of Commodity Futures Market Indices
30-Apr-
15
23-May-
15
15-Jun-1
5
8-Jul-
15
31-Jul-
15
23-Aug-1
5
15-Sep-1
5
8-Oct
-15
31-Oct
-15
23-Nov-
15
16-Dec-
15
8-Jan-1
6
31-Jan-1
6
23-Feb-1
6
17-Mar-
16
9-Apr-
16
2-May-
16
25-May-
16
17-Jun-1
6
10-Jul-
16
2-Aug-1
6
25-Aug-1
6
17-Sep-1
6
10-Oct
-16
2-Nov-
16
25-Nov-
16
18-Dec-
16
10-Jan-1
7
2-Feb-1
7
25-Feb-1
7
20-Mar-
172400
2600
2800
3000
3200
3400
3600
MCXCOMDEX Index Dhaanya Index
Source: MCX and NCDEX
Daily volatility during March 2017 for the indices of MCXCOMDEX and NCDEX Dhaanya was recorded at 0.66 percent and 0.53 percent, respectively. Among the component indices of MCXCOMDEX, MCX Energy recorded highest volatility of 1.39 percent, followed by MCX Metal (0.64 percent) and MCX Agri. (0.54 percent). The daily volatility and return over the previous months of commodity futures market indices is shown in the Exhibit 5 below:
Exhibit 5: Performance of Indices at MCX and NCDEX during March 2017 (Percent)
MCX NCDEX
IndexChange over Previous month
Daily Volatility
IndexChange over Previous month
Daily Volatility
1 2 3 4 5 6MCXCOMDEX -4.27 0.66 Dhaan
ya 1.14 0.53
MCX Metal -4.28 0.64MCX Energy -5.95 1.39MCX Agri. -3.88 0.54
Source: MCX and NCDEX
The total turnover at MCX was ₹4,40,373 crore in March 2017, which is an increase of 12.23 percent over the total turnover of ₹3,92,398 crore during February 2017. The contribution to the total turnover at MCX from Metal segment was at 37.02 percent followed by Energy segment at 34.37 percent, Bullion segment with 25.59 percent and agricultural commodities had a share of 3.02 percent.
The total turnover at NCDEX has increased from ₹31,329 crore in February 2017 to ₹64,077 crore in March 2017, an increase of 104.5
percent. Since June 2016, the entire turnover at NCDEX is contributed by the agricultural commodities segment only.
The total turnover at NMCE has increased from ₹3,036 crore in February 2017 to ₹3,359 crore in March 2017, an increase of 10.6 percent. The entire turnover at NMCE is also contributed by the agricultural commodities segment only.
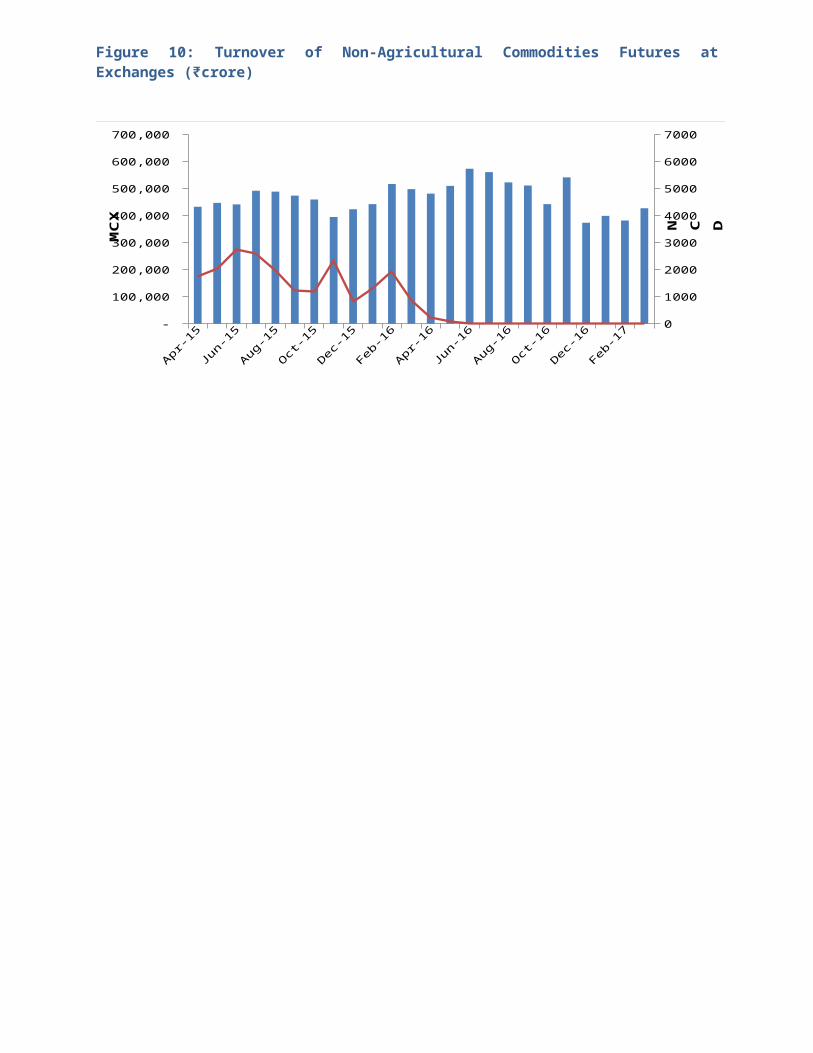
The total turnover in agricultural commodities at all the three national exchanges stood at ₹80,728 crore while that of the non - agricultural commodities stood at ₹4,27,080 crore. The total turnover of agricultural commodities was the highest at NCDEX (₹64,078 crore) followed by MCX (₹13,292 crore) and NMCE (₹3,359 crore) (Figure 9). Presently, the non-agricultural commodities of Bullion, Metals and Energy segments are traded only at MCX. (Figure 10). Details in Table 63, 64, & 65.
Among the regional exchanges, the Chamber of Commerce (CoC), Hapur with only one commodity trading in Mustard Seed contract, recorded a total turnover of ₹664 crore during March 2017 as against total turnover of ₹209 crore during February 2017, an increase of 217.7 percent.
The Rajkot Commodity Exchange Ltd. (RCX), where only castor seed contracts were available has discontinued its trading from December 2016 in respect of castor seed contracts.
Figure 9: Turnover of Agricultural Commodities Futures at National Exchanges (₹crore)
Apr-
15
May
-15
Jun-1
5
Jul-1
5
Aug-
15
Sep-1
5
Oct
-15
Nov-
15
Dec
-15
Jan-1
6
Feb-1
6
Mar
-16
Apr-
16
May
-16
Jun-1
6
Jul-1
6
Aug-
16
Sep-1
6
Oct
-16
Nov-
16
Dec
-16
Jan-1
7
Feb-1
7
Mar
-17 -
20,000
40,000
60,000
80,000
100,000
120,000
-
10,000
20,000
30,000
40,000
50,000
60,000
NCDEX MCX NMCE
NC
DE
X
MC
X a
nd
NM
CE
Figure 10: Turnover of Non-Agricultural Commodities Futures at Exchanges (₹crore)
Apr-15
May
-15
Jun-1
5
Jul-1
5
Aug-15
Sep-1
5
Oct-1
5
Nov-15
Dec-1
5
Jan-1
6
Feb-1
6
Mar
-16
Apr-16
May
-16
Jun-1
6
Jul-1
6
Aug-16
Sep-1
6
Oct-1
6
Nov-16
Dec-1
6
Jan-1
7
Feb-1
7
Mar
-17
-
100,000
200,000
300,000
400,000
500,000
600,000
700,000
0
1000
2000
3000
4000
5000
6000
7000
MCX
MC
X
N C D E X
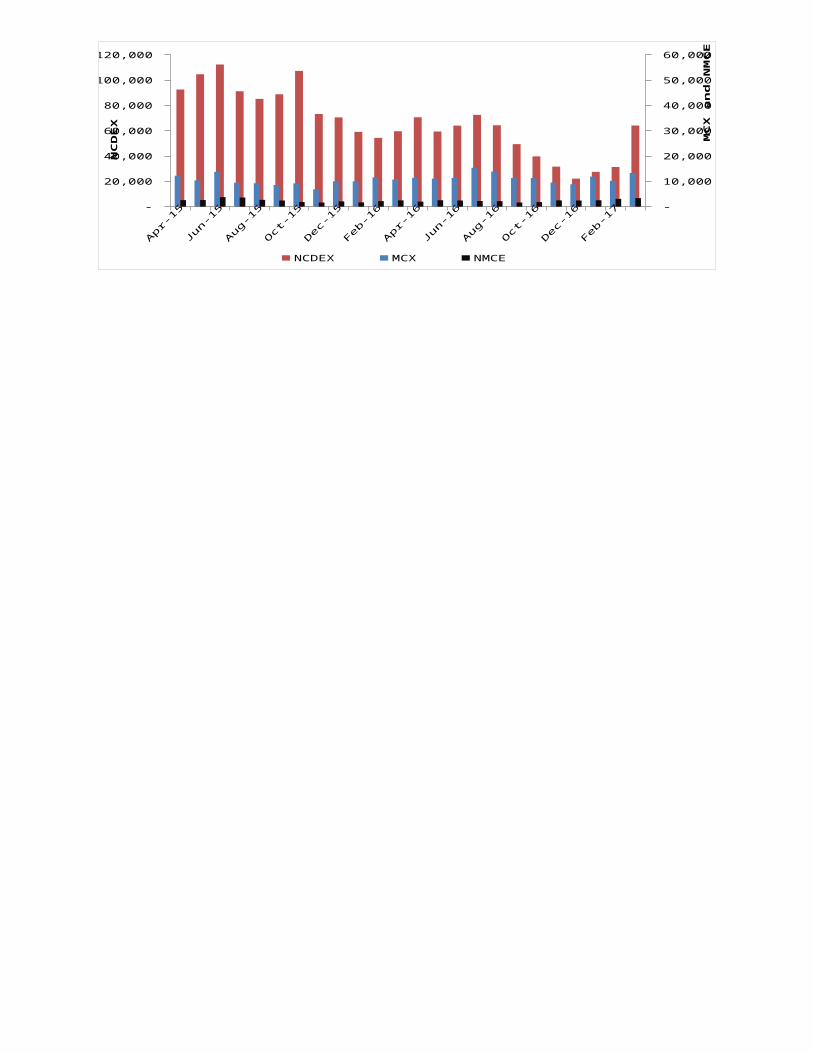
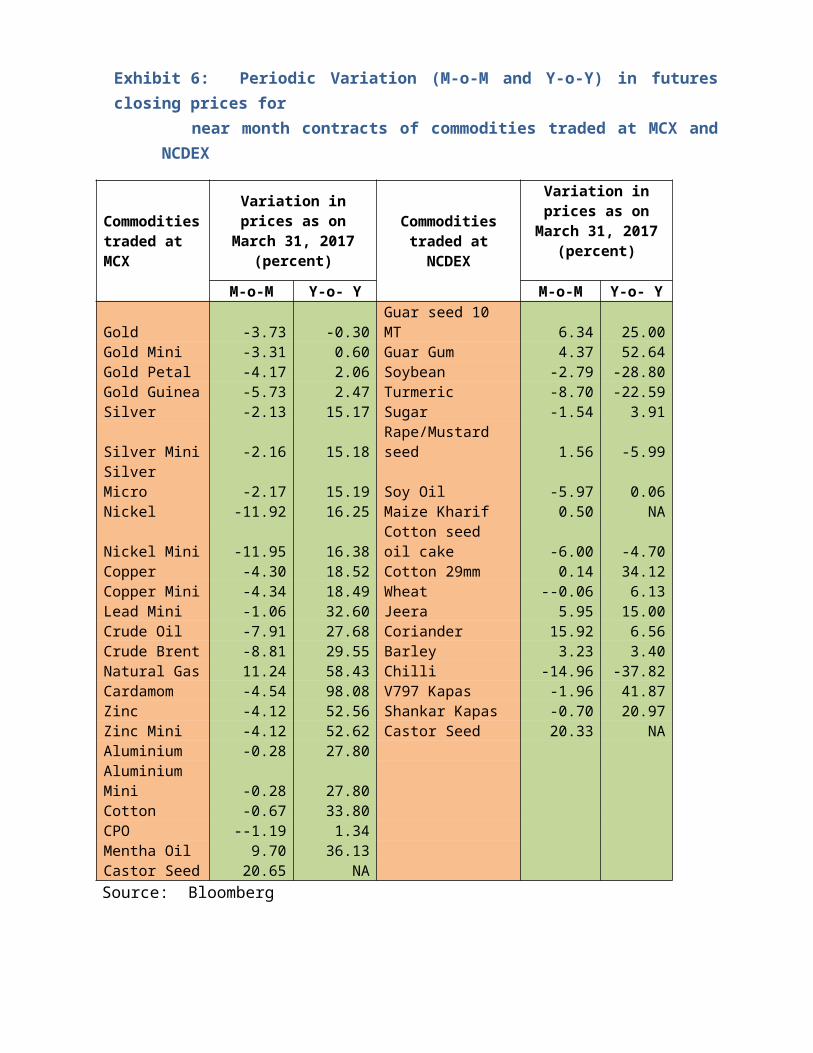
Exhibit 6: Periodic Variation (M-o-M and Y-o-Y) in futures closing prices for
near month contracts of commodities traded at MCX and NCDEX
Commodities traded at MCX
Variation in prices as on March 31, 2017 (percent)
Commodities traded at NCDEX
Variation in prices as on
March 31, 2017 (percent)
M-o-M Y-o- Y M-o-M Y-o- YGold -3.73 -0.30 Guar seed 10 MT 6.34 25.00Gold Mini -3.31 0.60 Guar Gum 4.37 52.64Gold Petal -4.17 2.06 Soybean -2.79 -28.80Gold Guinea -5.73 2.47 Turmeric -8.70 -22.59Silver -2.13 15.17 Sugar -1.54 3.91
Silver Mini -2.16 15.18Rape/Mustard seed 1.56 -5.99
Silver Micro -2.17 15.19 Soy Oil -5.97 0.06Nickel -11.92 16.25 Maize Kharif 0.50 NA
Nickel Mini -11.95 16.38Cotton seed oil cake -6.00 -4.70
Copper -4.30 18.52 Cotton 29mm 0.14 34.12Copper Mini -4.34 18.49 Wheat --0.06 6.13Lead Mini -1.06 32.60 Jeera 5.95 15.00Crude Oil -7.91 27.68 Coriander 15.92 6.56Crude Brent -8.81 29.55 Barley 3.23 3.40Natural Gas 11.24 58.43 Chilli -14.96 -37.82Cardamom -4.54 98.08 V797 Kapas -1.96 41.87Zinc -4.12 52.56 Shankar Kapas -0.70 20.97Zinc Mini -4.12 52.62 Castor Seed 20.33 NA Aluminium -0.28 27.80 Aluminium Mini -0.28 27.80
Cotton -0.67 33.80 CPO --1.19 1.34 Mentha Oil 9.70 36.13 Castor Seed 20.65 NASource: Bloomberg
At the end of March 2017, M-o-M returns among the near month contracts of non-agricultural commodities were positive only for Natural Gas while all other commodities have recorded a negative returns.. Natural Gas futures prices gained by 11.2 percent during the month. While higher M-o-M decline in futures prices was recorded in contracts of Nickel Mini (-12.0 percent), followed by Nickel (-11.9 percent), Brent Crude (-8.8 percent),
Crude Oil (-7.9 percent), Copper and Copper Mini (-4.3 percent each), Zinc and Zinc Mini (both 4.1 percent), Gold and its variants (-3.3 percent to -5.7 percent), Silver and its variants (-2.1 percent to -2.2 percent), Lead Mini (-1.1 percent), Aluminum and Aluminum Mini (-0.3 percent each).
Among the agricultural commodities, the M-o-M upward movement in prices is observed in the near month contracts of Castor Seed (20.6 percent at MCX and 20.3 percent at NCDEX)) followed by Coriander (15.9 percent), Mentha Oil (9.7 percent), Guar Seed 10 MT (6.3 percent), Jeera (5.9 percent), Guar Gum 5 MT (4.4 percent0, Barley (3.2 percent), Rape/Mustard Seed (1.6 percent), Maize Kharif (0.5 percent) and Cotton 29 mm (0.1 percent). While prices declined the most in the contracts of Chilli (-15.0 percent), followed by turmeric (-8.7 percent), Refined Soy Oil and Cotton Seed Oilcake (both -6.0 percent), Cardamom (-4.5 percent), Soybean (-2.8 percent), V797 Kapas (-2.0 percent0, Sugar (-1.5 percent), Crude Palm Oil (-1.2 percent), Cotton and Shankar Kapas (-0.7 percent each) and Wheat (-0.1 percent).
On Y-o-Y basis, futures prices of all the non-agricultural commodities, except Gold closed with positive returns. Among these, Natural Gas futures was the top gainer with 58.4 percent increase, followed by Zinc and Zinc Mini (52.6 percent each), Lead mini (32.6 percent), Brent Crude (29.5 percent), Aluminum and Aluminum Mini (27.8 percent each), Crude Oil (27.7 percent), Copper and Copper Mini (both 18. 5 percent), Nickel Mini (16.4 percent), Nickel (16.3 percent), Silver and its variants (15.2 percent each), Gold Guinea (2.5 percent), Gold Petal (2.1 percent), and Gold Mini (0.6 percent), while marginal decline of 0.30 percent is observed in Gold futures..
Among agricultural commodities, Y-o-Y gains in futures prices was highest for Cardamom at 98.1 percent, followed by Guar Gum at 52.6 percent, V797 Kapas (41.9 percent), Mentha Oil (36.1 percent), Cotton 29 mm (34.1 percent), Cotton (33.8 percent). On the other hand, Y-o-Y return on prices among agricultural commodities were declined the most for Chilly (37.8 percent), followed by Soybean (-28.8 percent), Turmeric (22.6 percent), Rape/Mustard seed (6.0 percent).
II. Trading in Corporate Debt Market
During March 2017, BSE recorded 3,105 trades of corporate debt with a traded value of ₹44,580 crore compared to 1,824 trades with a traded value of ₹23,691 crore recorded in February 2017. At NSE, 7, 646 trades were reported in March 2014 with a traded value of ₹1,47,831 crore compared to 4,490 trades with value of ₹83,928 crore in the previous month (Figure 11 and Table 13).
Figure 11: Trends in Reported Turnover of Corporate Bonds (₹ crore)
Apr-
16
May
-16
Jun
-16
Jul-
16
Au
g-16
Sep-
16
Oct
-16
Nov
-16
Dec
-16
Jan
-17
Feb-
17
Mar-
17
14,
842
17,
335
18,
541
16,
187
19,
400
25,
687
24,
135
25,
784
31,
071
30,
903
23,
691
44,
580
66,
679
65,
225
78,
408
92,
599
90,
213
117,
781
110
,765
112
,682
109
,145
103
,252
83,
928
147
,831
BSE NSE

III. Trends in Institutional Investment
A. Trends in Investment by Mutual Funds
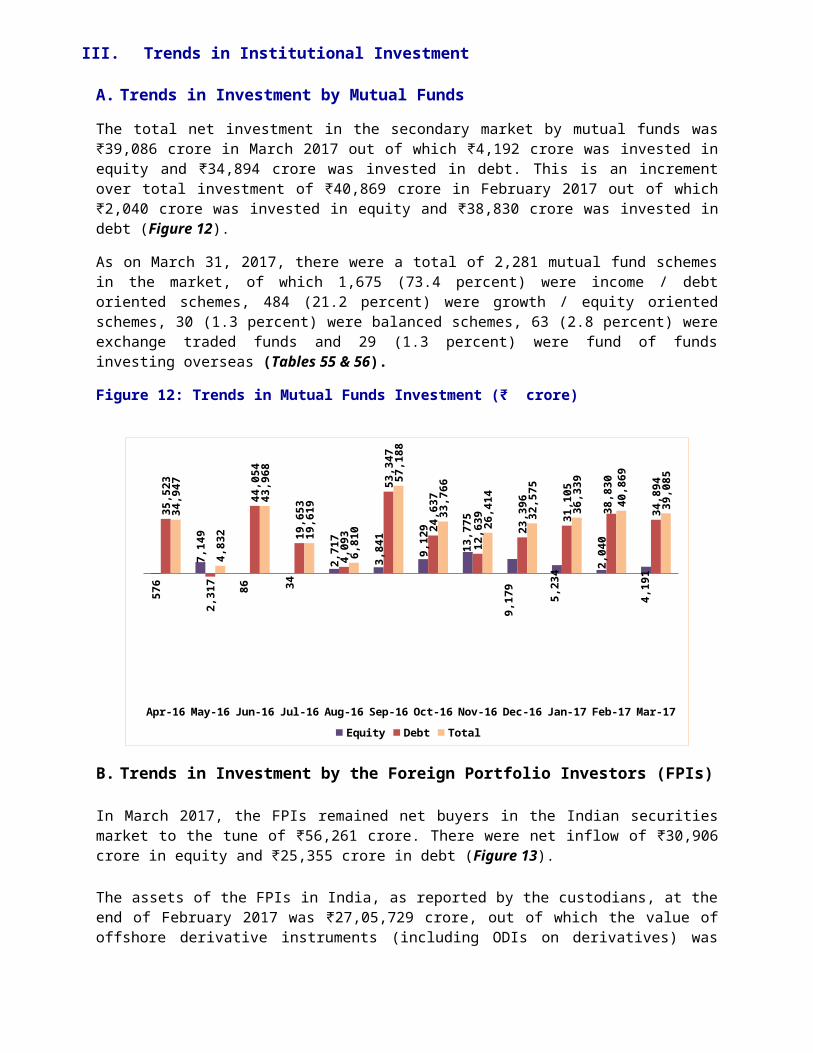
The total net investment in the secondary market by mutual funds was ₹39,086 crore in March 2017 out of which ₹4,192 crore was invested in equity and ₹34,894 crore was invested in debt. This is an increment over total investment of ₹40,869 crore in February 2017 out of which ₹2,040 crore was invested in equity and ₹38,830 crore was invested in debt (Figure 12).
As on March 31, 2017, there were a total of 2,281 mutual fund schemes in the market, of which 1,675 (73.4 percent) were income / debt oriented schemes, 484 (21.2 percent) were growth / equity oriented schemes, 30 (1.3 percent) were balanced schemes, 63 (2.8 percent) were exchange traded funds and 29 (1.3 percent) were fund of funds investing overseas (Tables 55 & 56).
Figure 12: Trends in Mutual Funds Investment (₹ crore)
Apr-16 May-16
Jun-16 Jul-16 Aug-16
Sep-16
Oct-16 Nov-16
Dec-16
Jan-17 Feb-17
Mar-17
576
7,14
9
86 34
2,71
7
3,84
1
9,12
9
13,7
75
9,17
9
5,23
4 2,04
0
4,19
1
35,5
23
2,31
7
44,0
54
19,6
53
4,09
3
53,3
47
24,6
37
12,6
39
23,3
96
31,1
05
38,8
30
34,8
94
34,9
47
4,83
2
43,9
68
19,6
19
6,81
0
57,1
88
33,7
66
26,4
14
32,5
75
36,3
39
40,8
69
39,0
85Equity Debt Total
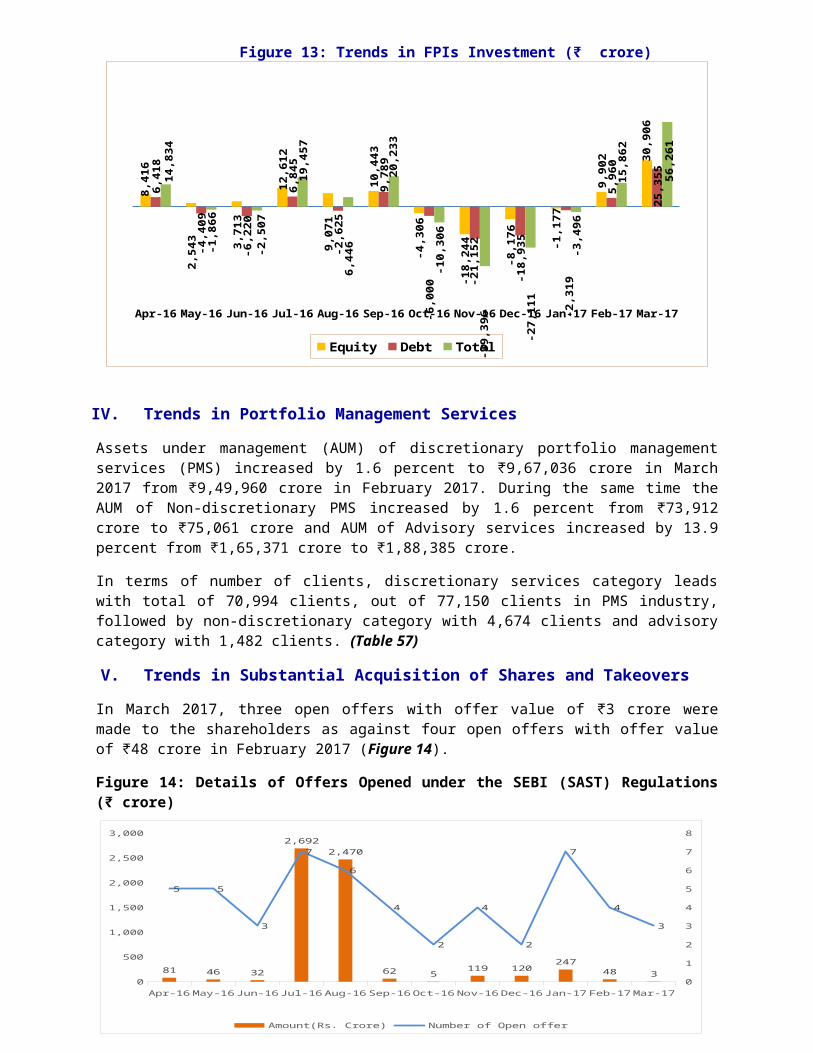
B. Trends in Investment by the Foreign Portfolio Investors (FPIs)
In March 2017, the FPIs remained net buyers in the Indian securities market to the tune of ₹56,261 crore. There were net inflow of ₹30,906 crore in equity and ₹25,355 crore in debt (Figure 13).
The assets of the FPIs in India, as reported by the custodians, at the end of February 2017 was ₹27,05,729 crore, out of which the value of offshore derivative instruments (including ODIs on derivatives) was ₹1,78,437 crore, constituting 6.6 percent of the total assets under custody of FPIs. (Tables 49, 50 & 51)
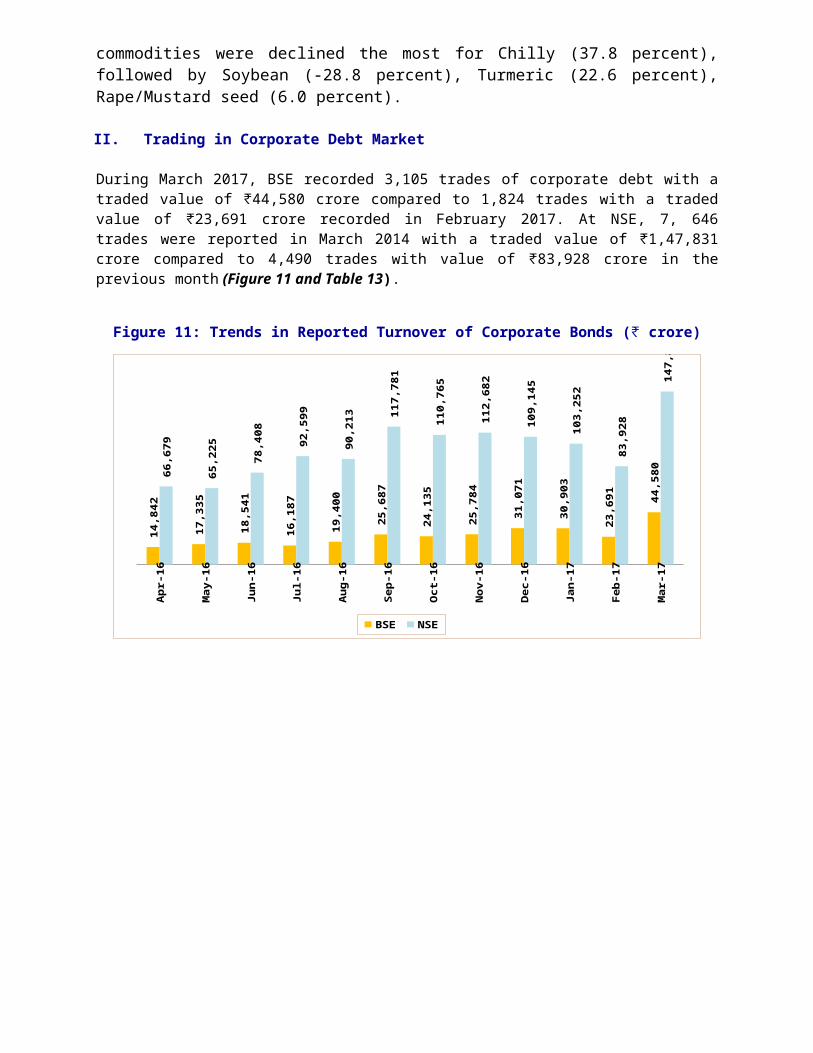
Figure 13: Trends in FPIs Investment (₹ crore)
Apr-16
May-16
Jun-16
Jul-16 Aug-16
Sep-16
Oct-16
Nov-16
Dec-16
Jan-17
Feb-17
Mar-17
8,41
6
2,54
3 3,71
3
12,6
12
9,07
1
10,4
43
-4,3
06
-18,
244
-8,1
76 -1,1
77
9,90
2 30,9
06
6,41
8
-4,4
09
-6,2
20
6,84
5
-2,6
25
9,78
9
-6,0
00
-21,
152
-18,
935
-2,3
19
5,96
0
25,3
5514,8
34
-1,8
66
-2,5
07
19,4
57
6,44
6
20,2
33
-10,
306
-39,
396
-27,
111
-3,4
96
15,8
62
56,2
61
Equity Debt Total
IV. Trends in Portfolio Management Services
Assets under management (AUM) of discretionary portfolio management services (PMS) increased by 1.6 percent to ₹9,67,036 crore in March 2017 from ₹9,49,960 crore in February 2017. During the same time the AUM of Non-discretionary PMS increased by 1.6 percent from ₹73,912 crore to ₹75,061 crore and AUM of Advisory services increased by 13.9 percent from ₹1,65,371 crore to ₹1,88,385 crore.
In terms of number of clients, discretionary services category leads with total of 70,994 clients, out of 77,150 clients in PMS industry, followed by non-discretionary category with 4,674 clients and advisory category with 1,482 clients. (Table 57)
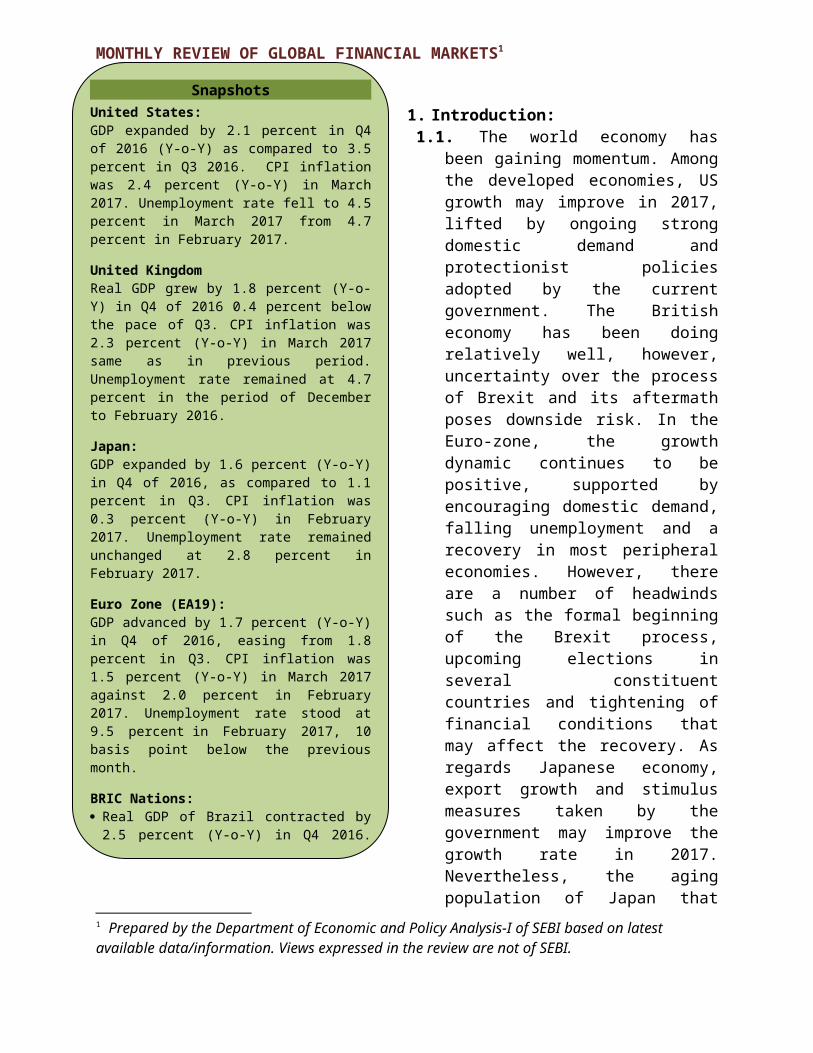
V. Trends in Substantial Acquisition of Shares and Takeovers
In March 2017, three open offers with offer value of ₹3 crore were made to the shareholders as against four open offers with offer value of ₹48 crore in February 2017 (Figure 14).
Figure 14: Details of Offers Opened under the SEBI (SAST) Regulations (₹ crore)
Apr-16 May-16 Jun-16 Jul-16 Aug-16 Sep-16 Oct-16 Nov-16 Dec-16 Jan-17 Feb-17 Mar-170
500
1,000
1,500
2,000
2,500
3,000
0
1
2
3
4
5
6
7
8
81 46 32
2,6922,470
62 5119 120
24748 3
5 5
3
7
6
4
2
4
2
7
4
3
Amount(Rs. Crore) Number of Open offer
Note: February 2017 figures have been revised

MONTHLY REVIEW OF GLOBAL FINANCIAL MARKETS1
1.Introduction:1.1. The world economy has been
gaining momentum. Among the developed economies, US growth may improve in 2017, lifted by ongoing strong domestic demand and protectionist policies adopted by the current government. The British economy has been doing relatively well, however, uncertainty over the process of Brexit and its aftermath poses downside risk. In the Euro-zone, the growth dynamic continues to be positive, supported by encouraging domestic demand, falling unemployment and a recovery in most peripheral economies. However, there are a number of headwinds such as the formal beginning of the Brexit process, upcoming elections in several constituent countries and tightening of financial conditions that may affect the recovery. As regards Japanese economy, export growth and stimulus measures taken by the government may improve the growth rate in 2017. Nevertheless, the aging population of Japan that affects the labour supply and continuing low inflation are keeping growth from moving to higher levels.
1.2. In the emerging economies, while India and China continue to witness high rate of growth, both Russia and Brazil are expected to recover in 2017. Effect of demonetization in India
1 Prepared by the Department of Economic and Policy Analysis-I of SEBI based on latest available data/information. Views expressed in the review are not of SEBI.
SnapshotsUnited States:GDP expanded by 2.1 percent in Q4 of 2016 (Y-o-Y) as compared to 3.5 percent in Q3 2016. CPI inflation was 2.4 percent (Y-o-Y) in March 2017. Unemployment rate fell to 4.5 percent in March 2017 from 4.7 percent in February 2017.
United Kingdom Real GDP grew by 1.8 percent (Y-o-Y) in Q4 of 2016 0.4 percent below the pace of Q3. CPI inflation was 2.3 percent (Y-o-Y) in March 2017 same as in previous period. Unemployment rate remained at 4.7 percent in the period of December to February 2016.
Japan:GDP expanded by 1.6 percent (Y-o-Y) in Q4 of 2016, as compared to 1.1 percent in Q3. CPI inflation was 0.3 percent (Y-o-Y) in February 2017. Unemployment rate remained unchanged at 2.8 percent in February 2017.
Euro Zone (EA19):GDP advanced by 1.7 percent (Y-o-Y) in Q4 of 2016, easing from 1.8 percent in Q3. CPI inflation was 1.5 percent (Y-o-Y) in March 2017 against 2.0 percent in February 2017. Unemployment rate stood at 9.5 percent in February 2017, 10 basis point below the previous month.
BRIC Nations: Real GDP of Brazil contracted by 2.5
percent (Y-o-Y) in Q4 2016. CPI inflation stood at 4.6 percent in March. Unemployment rate increased to 13.2 percent February 2017.
Russia’s GDP advanced by 0.3 percent (Y-o-Y) in Q4 2016. CPI inflation was 4.3 percent (Y-o-Y) in March 2017. Unemployment rate decreased slightly to 5.4 percent in March 2017.
India’s real GDP grew by 7.0 percent (Y-o-Y) in Oct-Dec quarter of 2016 as compared to 7.4 percent in Jul-Sept
is ebbing fast and it is expected that the country will witness robust growth in 2017. China on the other hand is suffering from property bubble and slowing growth rate. However, much depends on the effect of protectionism being implemented by the current US government.

2.Major Recent Developments Across the Globe2.1. Development aid rises again in 2016 but flows to poorest
countries dipDevelopment aid reached a new peak of USD 142.6 billion in 2016, an increase of 8.9 percent from year before after adjusting for exchange rates and inflation. A rise in aid spent on refugees in donor countries boosted the total – but even stripping out refugee costs aid rose 7.1 percent, according to official data collected by the OECD Development Assistance Committee. Despite this progress, the 2016 data show that bilateral (country to country) aid to the least-developed countries fell by 3.9 percent in real terms from 2015 and aid to Africa fell 0.5 percent, as some DAC members backtracked on a commitment to reverse past declines in flows to the poorest countries.
2.2. OECD tax rates on labour income continued decreasing slowly in 2016Taxes on labour income for the average worker across the OECD continued to decrease for the third consecutive year during 2016, dropping to 36 percent of labour costs, according to a new OECD report. The tax wedge on the income of the average worker decreased slightly, to 36 percent, in 2016. Last year’s decline follows a multi-year trend, partially reversing tax wedge increases reported in the years immediately following the global economic crisis.
3.The World Economy:
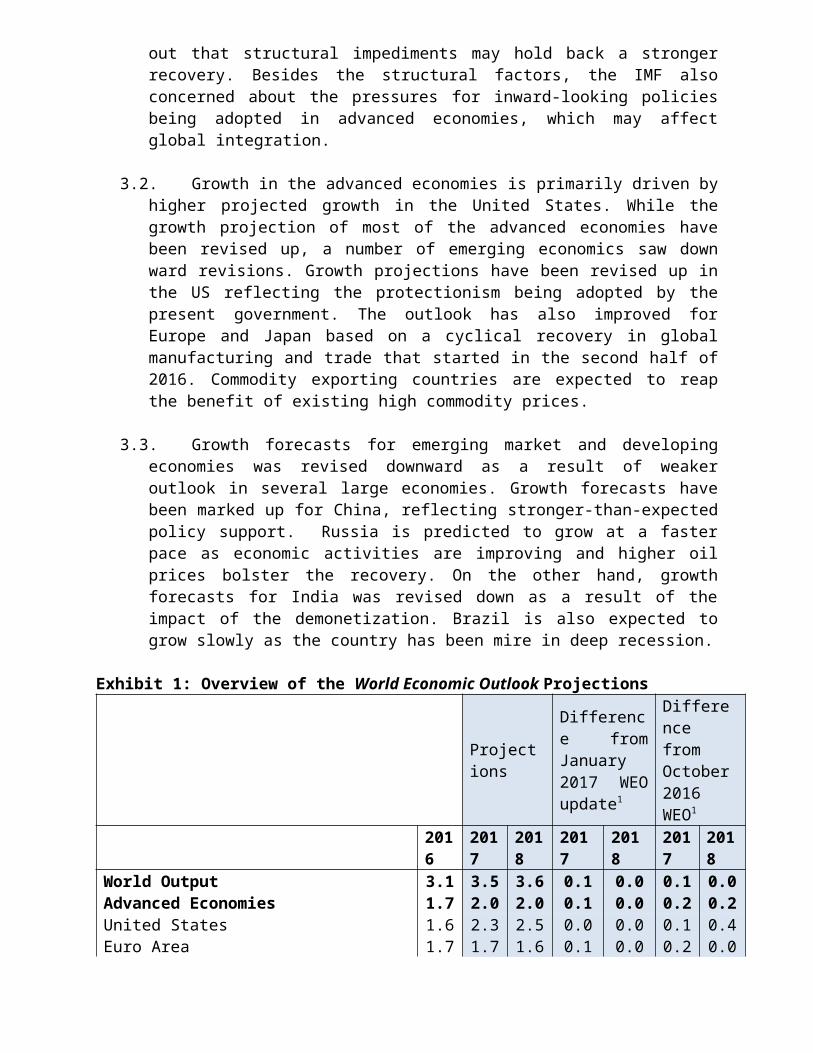
3.1. The IMF in its World Economic Outlook published in April 2017 has slightly revised up the projection of the world growth from 3.1 percent in 2016 to 3.5 percent in 2017 and 3.6 percent in 2018, above the its previous forecast (Table 1). Albeit the upward revision, IMF points out that structural impediments may hold back a stronger recovery. Besides the structural factors, the IMF also concerned about the pressures for inward-looking policies being adopted in advanced economies, which may affect global integration.
3.2. Growth in the advanced economies is primarily driven by higher projected growth in the United States. While the growth projection of most of the advanced economies have been revised up, a number of emerging economics saw down ward revisions. Growth projections have been revised up in the US reflecting the protectionism being adopted by the present government. The outlook has also improved
for Europe and Japan based on a cyclical recovery in global manufacturing and trade that started in the second half of 2016. Commodity exporting countries are expected to reap the benefit of existing high commodity prices.
3.3. Growth forecasts for emerging market and developing economies was revised downward as a result of weaker outlook in several large economies. Growth forecasts have been marked up for China, reflecting stronger-than-expected policy support. Russia is predicted to grow at a faster pace as economic activities are improving and higher oil prices bolster the recovery. On the other hand, growth forecasts for India was revised down as a result of the impact of the demonetization. Brazil is also expected to grow slowly as the country has been mire in deep recession.
Exhibit 1: Overview of the World Economic Outlook Projections
Projections
Difference from January 2017 WEO update1
Difference from October 2016 WEO1
2016
2017
2018
2017
2018
2017
2018
World Output 3.1 3.5 3.6 0.1 0.0 0.1 0.0Advanced Economies 1.7 2.0 2.0 0.1 0.0 0.2 0.2United States 1.6 2.3 2.5 0.0 0.0 0.1 0.4Euro Area 1.7 1.7 1.6 0.1 0.0 0.2 0.0Germany 1.8 1.6 1.5 0.1 0.0 0.2 0.1France 1.2 1.4 1.6 0.1 0.0 0.1 0.0Italy 0.9 0.8 0.8 0.1 0.0 –
0.1–
0.3Spain 3.2 2.6 2.1 0.3 0.0 0.4 0.2European Union 2.0 2.0 1.8 0.2 0.0 0.3 0.0Japan2 1.0 1.2 0.6 0.4 0.1 0.6 0.1United Kingdom 1.8 2.0 1.5 0.5 0.1 0.9 –
0.2Canada 1.4 1.9 2.0 0.0 0.0 0.0 0.1Other Advanced Economies3 2.2 2.3 2.4 0.1 0.0 0.0 0.0Emerging Market and Developing Economies 4.1 4.5 4.8 0.0 0.0 –
0.1 0.0
Brazil –3.6 0.2 1.7 0.0 0.2 –
0.3 0.2
Russia –0.2 1.4 1.4 0.3 0.2 0.3 0.2
India4 6.8 7.2 7.7 0.0 0.0 –0.4 0.0
China 6.7 6.6 6.2 0.1 0.2 0.4 0.2South Africa 0.3 0.8 1.6 0.0 0.0 0.0 0.0
Low-Income Developing Countries 3.6 4.7 5.3 0.0 –0.1 –0.2 0.1
Middle East and North Africa 3.8 2.3 3.2 –0.6 –0.1 –0.9
–0.2
Notes:1Difference based on rounded figures for the current, January 2017 World Economic Outlook Update, and October 2016 World Economic Outlook forecasts.2Japan’s historical national accounts figures reflect a comprehensive revision by the national authorities, released in December 2016. The main revisions are theswitch from the System of National Accounts 1993 to the System of National Accounts 2008 and the updating of the benchmark year from 2005 to 2011.3Excludes the G7 (Canada, France, Germany, Italy, Japan, United Kingdom, United States) and euro area countries.4For India, data and forecasts are presented on a fiscal year basis and GDP from 2011 onward is based on GDP at market prices with FY2011/12 as a base year.
Source: IMF
The Organisation for Economic Co-operation and Development (OECD)2:
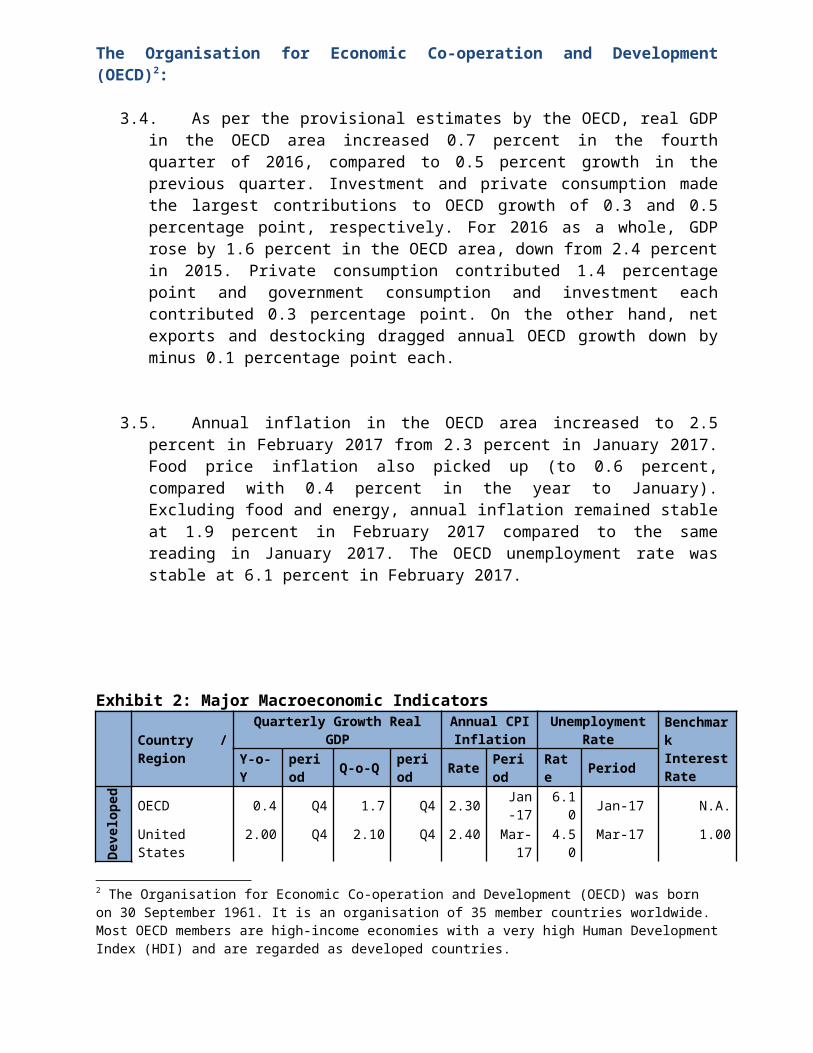
3.4. As per the provisional estimates by the OECD, real GDP in the OECD area increased 0.7 percent in the fourth quarter of 2016, compared to 0.5 percent growth in the previous quarter. Investment and private consumption made the largest contributions to OECD growth of 0.3 and 0.5 percentage point, respectively. For 2016 as a whole, GDP rose by 1.6 percent in the OECD area, down from 2.4 percent in 2015. Private consumption contributed 1.4 percentage point and government consumption and investment each contributed 0.3 percentage point. On the other hand, net exports and destocking dragged annual OECD growth down by minus 0.1 percentage point each.
3.5. Annual inflation in the OECD area increased to 2.5 percent in February 2017 from 2.3 percent in January 2017. Food price inflation also picked up (to 0.6 percent, compared with 0.4 percent in the year to January). Excluding food and energy, annual inflation remained stable at 1.9 percent in February 2017 compared to the same reading in January 2017. The OECD unemployment rate was stable at 6.1 percent in February 2017.
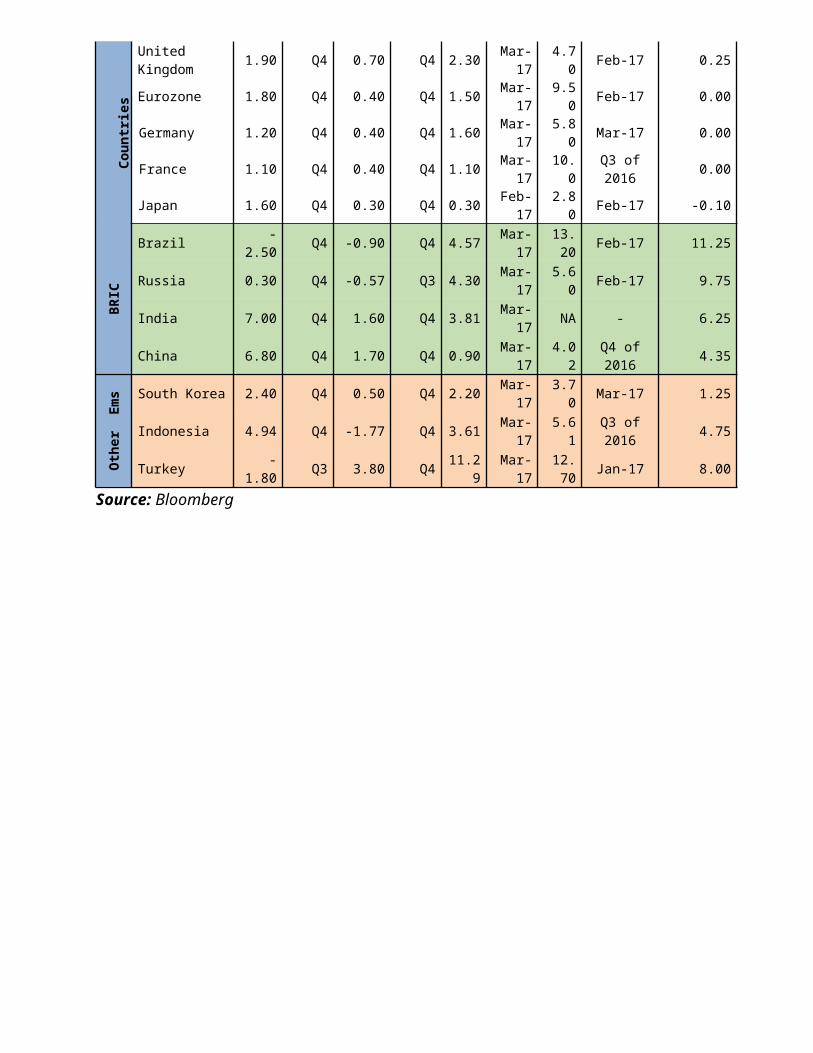
Exhibit 2: Major Macroeconomic Indicators
Country / Region
Quarterly Growth Real GDP
Annual CPI Inflation
Unemployment Rate
Benchmark Interest Rate
Y-o-Y
period Q-o-Q perio
dRate
Period
Rate Period
Dev
elop
ed C
ount
ries
OECD 0.4 Q4 1.7 Q4 2.30 Jan -17 6.10 Jan-17 N.A.
United States 2.00 Q4 2.10 Q4 2.40 Mar-
17 4.50 Mar-17 1.00United Kingdom 1.90 Q4 0.70 Q4 2.30 Mar-
17 4.70 Feb-17 0.25
Eurozone 1.80 Q4 0.40 Q4 1.50 Mar-17 9.50 Feb-17 0.00
Germany 1.20 Q4 0.40 Q4 1.60 Mar-17 5.80 Mar-17 0.00
France 1.10 Q4 0.40 Q4 1.10 Mar-17 10.0 Q3 of
2016 0.00
Japan 1.60 Q4 0.30 Q4 0.30 Feb-17 2.80 Feb-17 -0.10
2 The Organisation for Economic Co-operation and Development (OECD) was born on 30 September 1961. It is an organisation of 35 member countries worldwide. Most OECD members are high-income economies with a very high Human Development Index (HDI) and are regarded as developed countries.
BR
IC
Brazil -2.50 Q4 -0.90 Q4 4.57 Mar-17
13.20 Feb-17 11.25
Russia 0.30 Q4 -0.57 Q3 4.30 Mar-17 5.60 Feb-17 9.75
India 7.00 Q4 1.60 Q4 3.81 Mar-17 NA - 6.25
China 6.80 Q4 1.70 Q4 0.90 Mar-17 4.02 Q4 of
2016 4.35
Oth
er E
ms South Korea 2.40 Q4 0.50 Q4 2.20 Mar-
17 3.70 Mar-17 1.25
Indonesia 4.94 Q4 -1.77 Q4 3.61 Mar-17 5.61 Q3 of
2016 4.75
Turkey -1.80 Q3 3.80 Q4 11.29
Mar-17
12.70 Jan-17 8.00
Source: Bloomberg
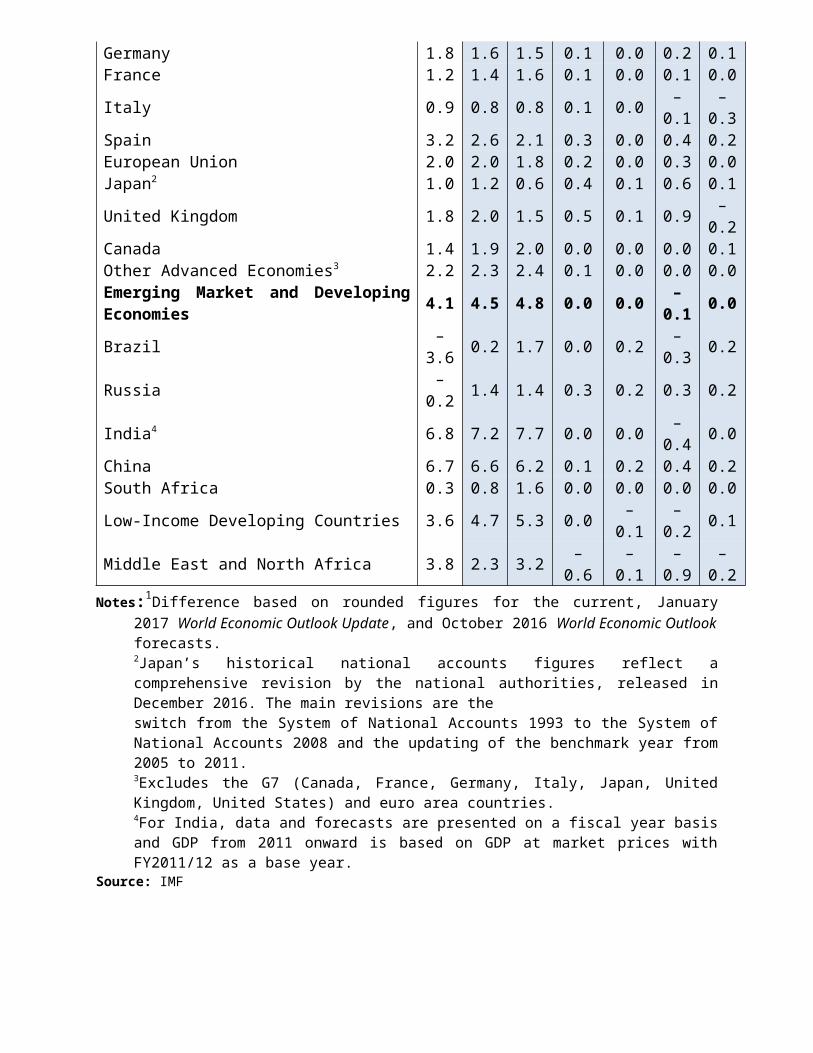
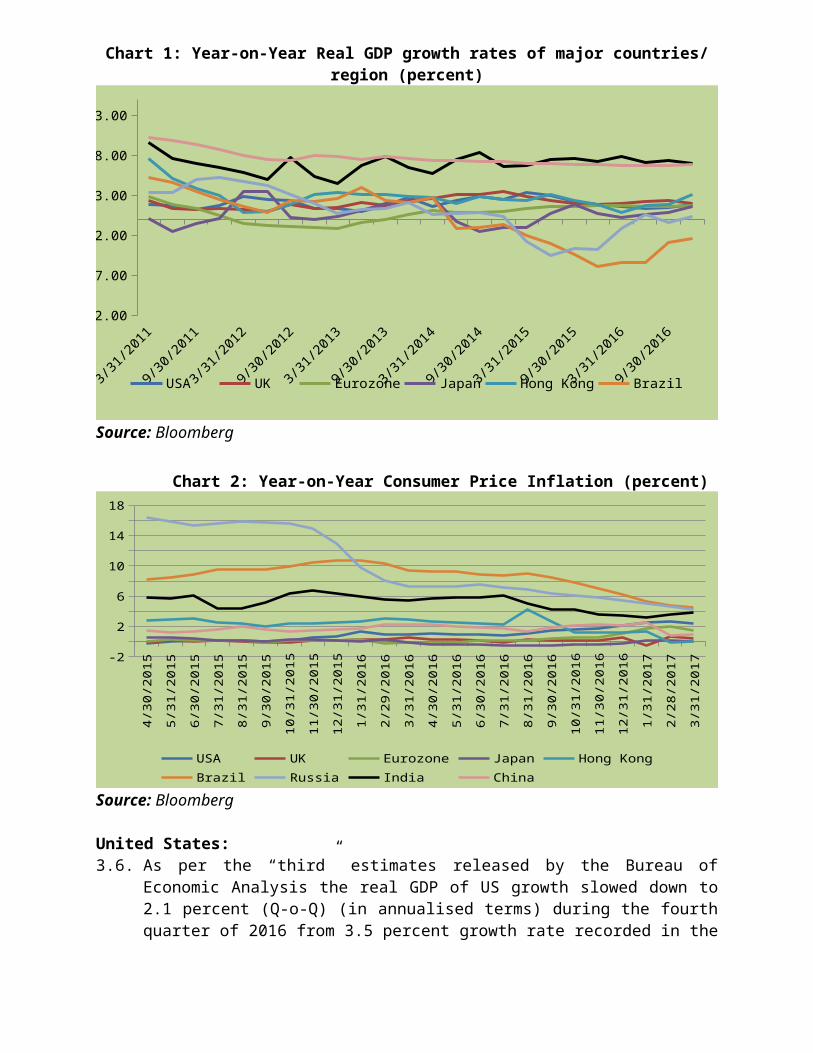
Chart 1: Year-on-Year Real GDP growth rates of major countries/ region (percent)
Mar-11
Jun-11
Sep-11
Dec-11
Mar-12
Jun-12
Sep-12
Dec-12
Mar-13
Jun-13
Sep-13
Dec-13
Mar-14
Jun-14
Sep-14
Dec-14
Mar-15
Jun-15
Sep-15
Dec-15
Mar-16
Jun-16
Sep-16
Dec-16
-12.00
-7.00
-2.00
3.00
8.00
13.00
USA UK Eurozone Japan Hong Kong Brazil Russia India
Source: Bloomberg
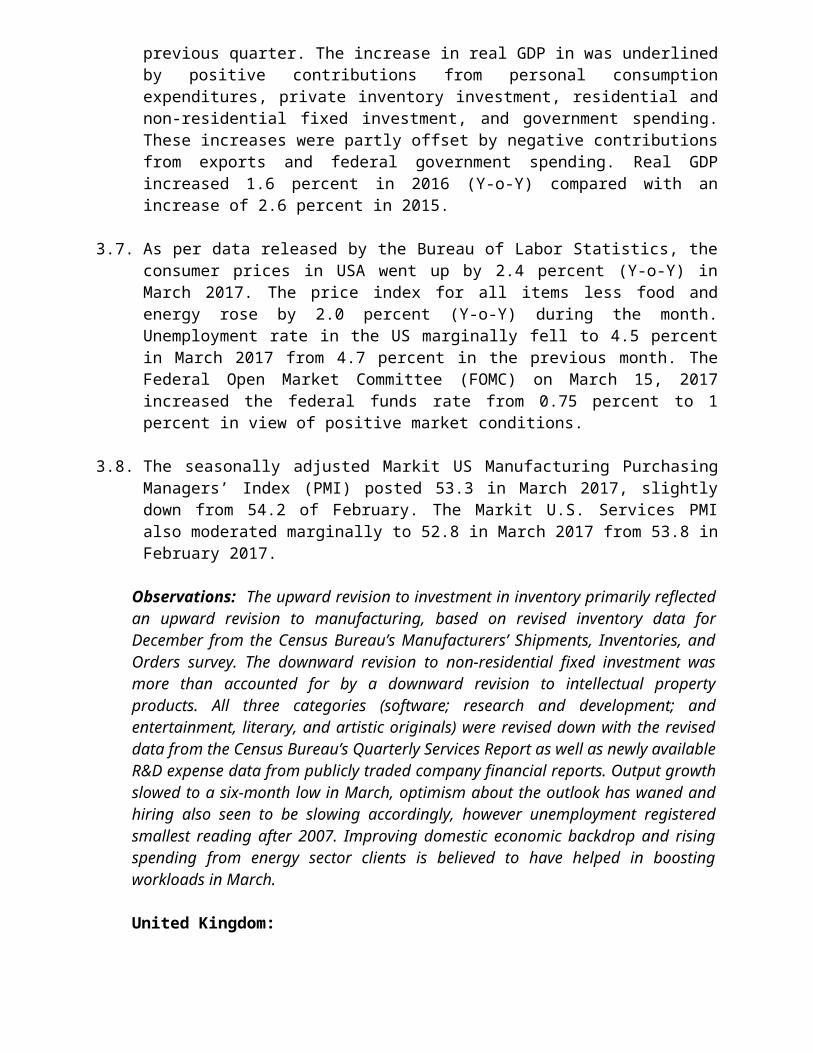
Chart 2: Year-on-Year Consumer Price Inflation (percent)
Apr
-15
May
-15
Jun-
15
Jul-1
5
Aug
-15
Sep-
15
Oct
-15
Nov
-15
Dec
-15
Jan-
16
Feb-
16
Mar
-16
Apr
-16
May
-16
Jun-
16
Jul-1
6
Aug
-16
Sep-
16
Oct
-16
Nov
-16
Dec
-16
Jan-
17
Feb-
17
Mar
-17-2
0
2
4
6
8
10
12
14
16
18
USA UK Eurozone Japan Hong KongBrazil Russia India China
Source: Bloomberg
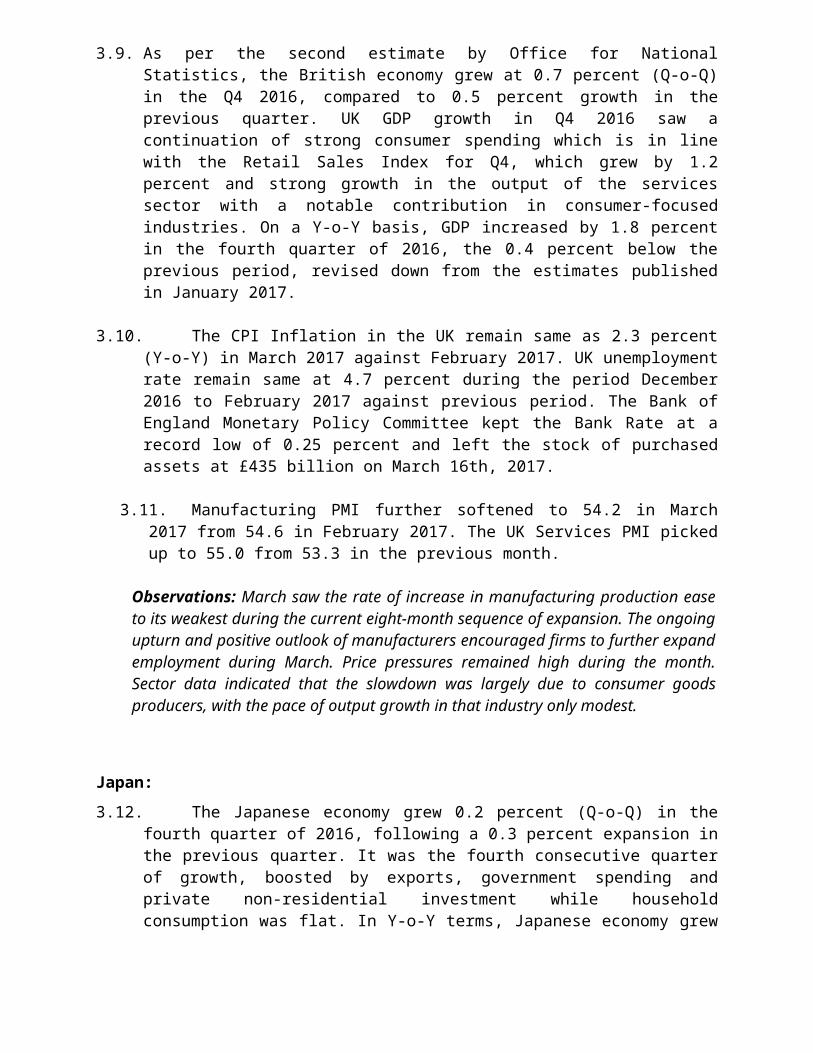
United States:3.6. As per the “third” estimates released by the Bureau of Economic
Analysis the real GDP of US growth slowed down to 2.1 percent (Q-o-Q) (in annualised terms) during the fourth quarter of 2016 from 3.5 percent growth rate recorded in the previous quarter. The increase in real GDP in was underlined by positive contributions from personal consumption expenditures, private inventory investment, residential

and non-residential fixed investment, and government spending. These increases were partly offset by negative contributions from exports and federal government spending. Real GDP increased 1.6 percent in 2016 (Y-o-Y) compared with an increase of 2.6 percent in 2015.
3.7. As per data released by the Bureau of Labor Statistics, the consumer prices in USA went up by 2.4 percent (Y-o-Y) in March 2017. The price index for all items less food and energy rose by 2.0 percent (Y-o-Y) during the month. Unemployment rate in the US marginally fell to 4.5 percent in March 2017 from 4.7 percent in the previous month. The Federal Open Market Committee (FOMC) on March 15, 2017 increased the federal funds rate from 0.75 percent to 1 percent in view of positive market conditions.
3.8. The seasonally adjusted Markit US Manufacturing Purchasing Managers’ Index (PMI) posted 53.3 in March 2017, slightly down from 54.2 of February. The Markit U.S. Services PMI also moderated marginally to 52.8 in March 2017 from 53.8 in February 2017.
Observations: The upward revision to investment in inventory primarily reflected an upward revision to manufacturing, based on revised inventory data for December from the Census Bureau’s Manufacturers’ Shipments, Inventories, and Orders survey. The downward revision to non-residential fixed investment was more than accounted for by a downward revision to intellectual property products. All three categories (software; research and development; and entertainment, literary, and artistic originals) were revised down with the revised data from the Census Bureau’s Quarterly Services Report as well as newly available R&D expense data from publicly traded company financial reports. Output growth slowed to a six-month low in March, optimism about the outlook has waned and hiring also seen to be slowing accordingly, however unemployment registered smallest reading after 2007. Improving domestic economic backdrop and rising spending from energy sector clients is believed to have helped in boosting workloads in March.
United Kingdom:3.9. As per the second estimate by Office for National Statistics, the
British economy grew at 0.7 percent (Q-o-Q) in the Q4 2016, compared to 0.5 percent growth in the previous quarter. UK GDP growth in Q4 2016 saw a continuation of strong consumer spending which is in line with the Retail Sales Index for Q4, which grew by 1.2 percent and strong growth in the output of the services sector with a notable contribution in consumer-focused industries. On a Y-o-Y basis, GDP increased by 1.8 percent in the fourth quarter of 2016, the 0.4 percent below the previous period, revised down from the estimates published in January 2017.
3.10. The CPI Inflation in the UK remain same as 2.3 percent (Y-o-Y) in March 2017 against February 2017. UK unemployment rate remain same at 4.7 percent during the period December 2016 to February 2017 against previous period. The Bank of England Monetary Policy Committee kept the Bank Rate at a record low of 0.25 percent and left the stock of purchased assets at £435 billion on March 16th, 2017.
3.11. Manufacturing PMI further softened to 54.2 in March 2017 from 54.6 in February 2017. The UK Services PMI picked up to 55.0 from 53.3 in the previous month.
Observations: March saw the rate of increase in manufacturing production ease to its weakest during the current eight-month sequence of expansion. The ongoing upturn and positive outlook of manufacturers encouraged firms to further expand employment during March. Price pressures remained high during the month. Sector data indicated that the slowdown was largely due to consumer goods producers, with the pace of output growth in that industry only modest.
Japan:3.12. The Japanese economy grew 0.2 percent (Q-o-Q) in the fourth quarter
of 2016, following a 0.3 percent expansion in the previous quarter. It was the fourth consecutive quarter of growth, boosted by exports, government spending and private non-residential investment while household consumption was flat. In Y-o-Y terms, Japanese economy grew by 1.6 percent (Y-o-Y) during Q4 of 2016 compared to 1.1 percent (Y-o-Y) in Q3 of 2016.
3.13. Consumer prices in Japan increased by 0.3 percent in February 2017, compared to a 0.4 percent rise in January. While prices of food eased sharply, inflation was steady for transport and cost of housing continued to fall.
3.14. The seasonally adjusted unemployment rate in Japan fell to 2.8 percent in February of 2017 from 3.0 percent in the previous month, below market expectations.
3.15. The Bank of Japan left its key short-term interest rate unchanged at -0.1 percent at its March 2017 meeting, hours after the Federal Reserve raised its benchmark rate. While the BoJ’s decision was in line with market expectations, it also highlighted the diverging monetary policy trends among major central banks.
Observations: Japan is walking on a tightrope in terms of its economic
recovery. A weak yen and a pick-up in global demand are fueling growth in the all-important external sector. .Exports from Japan jumped by 12 percent year-on-year in March 2017.The manufacturing PMI of Japan fell to 52.4 in March of 2017, compared to 53.3 in February while the services PMI in Japan slightly rose to 52.9 in March of 2017 from 52.3 in February.CPI inflation increased by 0.3 percent in February. Interest rate was cut below 0 percent in March while unemployment rate fell to 2.8 percent during February 2017.
Euro Area (EA19)3:
3.16. The real GDP growth in the Euro area was posted 1.7 percent in the Q4 of 2016 (Y-o-Y). In Q-o-Q terms, the Euro Area economy growth rate also increased to 0.4 percent (Q-o-Q) in Q4 of 2016 as compared to the previous quarter. Among the largest economies in the Euro area, the GDP growth of Germany, France and Austria increased to 0.4 percent, 0.4 percent and 0.6 percent as compared to 0.1 percent, 0.2 percent and 0.5 percent respectively in Q3. In contrast, economic growth decelerated in Cyprus and Italy to 0.5 percent and 0.2 percent as compared to 0.8 percent and 0.3 percent respectively.
3.17. Eurozone annual inflation decreased to 1.5 percent year-on-year in March 2017 easing from 2 percent increase over the previous month. It is the lowest inflation rate in three months, due to slowdown in energy prices. The highest annual rates were recorded in Latvia (3.3 percent), Lithuania (3.2 percent) and Estonia (3 percent) while Inflation eased in in Germany (1.5 percent) and Italy (1.4 percent) while was stable in France(1.4 percent).
3.18. The seasonally-adjusted unemployment rate in the Eurozone dropped to 9.5 percent in February 2017, as compared to 9.6 in January 2017. This remains the lowest rate recorded in the euro area since May 2009. Among the Member States, the lowest unemployment rates were recorded in the Czech Republic (3.4 percent) ,Germany (3.9 percent) and Malta( 4.1 percent); while the highest unemployment rates were observed in Greece (23.1 percent in December 2016) and Spain (18.0 percent).
3.19. The European Central Bank held its benchmark refinancing rate at 0 percent for the ninth consecutive meeting and left the pace of its bond-purchases unchanged on March 9th, as widely expected. Policymakers confirmed the monthly asset purchases will run at the
3 The Eurozone or the Euro area is a monetary union of 19 of the 28 European Union (EU) member states which have adopted the euro as their common currency. The Eurozone consists of Austria, Belgium, Cyprus, Estonia, Finland, France, Germany, Greece, Ireland, Italy, Latvia, Lithuania, Luxembourg, Malta, Netherlands, Portugal, Slovakia, Slovenia, and Spain.
current monthly pace of €80 billion until March, and from April, they are intended to continue at a monthly pace of €60 billion until the end of the year. Both the deposit rate and the lending rate were also left steady at -0.4 percent and 0.25 percent, respectively.
Observations: Momentum is clearly firming in the Eurozone’s economy. A firmer labour market and stronger economy will support the healthy expansion of the Eurozone in the coming year. The Eurozone Manufacturing PMI rose marginally to 56.2 in March of 2017 while services PMI registered 56.0 in March. Despite further monetary policy accommodation, headline inflation remains close to zero, and long-term inflation expectations are still below the European Central Bank’s policy target. Also in the January meeting, ECB indicated that it would remain flexible on meeting its bond-buying objectives.
Brazil:
3.20. The Brazilian GDP Annual Growth Rate contracted by 2.5 percent (Y-o-Y) in the December quarter of 2016, performing worse than market expectations. It was the eleventh straight quarter of contraction for the country, mainly on account of decline in both household consumption and fixed investment.
3.21. Consumer prices in Brazil went up by 4.6 percent (Y-o-Y) in March 2017, easing down from a 4.8 percent rise in the February 2017 meeting the market expectations. The Central Bank of Brazil executed another 100 basis point cut in its benchmark SELIC rate to 11.25 percent .It is the fifth straight rate decline, bringing borrowing costs to the lowest since November of 2014 amid slowing inflation and a sticky contraction.Unemployment Rate in Brazil increased for the fourth consecutive month registering at 13.2 percent in February 2017, up from 12.6 percent rate recorded in January 2017.
China:
3.22. The Chinese economy expanded by 6.9 percent in the March quarter of 2017, compared to a 6.8 percent growth figure in the December quarter, surpassing market expectations of a 6.8 percent predicted growth. This growth was supported by faster rises in industrial output, retail sales and fixed-asset investment while fiscal spending surged.
3.23. Consumer prices in China increased by 0.9 percent (Y-o-Y) during March 2017, following a 0.8 rise in February 2017 slightly less than market expectations of 1.0 percent rise. The People's Bank of China has kept benchmark one-year lending rate unchanged at 4.35 percent and has been the same since last cut of 25 basis point in October,
2015. Unemployment rate in China fell slightly to 4.02 percent in the December quarter of 2016 from 4.04 percent in the September quarter.
Russia:
3.24. The Russian economy advanced 0.3 percent(Y-o-Y) in the fourth quarter of 2016, following 0.4 percent contraction in the previous period. It was the first expansion since the fourth quarter of 2014. This year, the gradual economic recovery is expected to be supported by higher oil prices and the continuation of a disciplined policy approach, as Russian authorities seem determined to persist with prudent policymaking.
3.25. Consumer prices in Russia decreased to 4.3 percent (Y-o-Y) in March 2017, following a 4.6 percent growth in the previous month. Given the faster-than-expected decline in inflation, the Central Bank of Russia unexpectedly cut the monetary policy rate by 25 basis points to 9.75 percent at its March meeting .Russian unemployment rate declined to 5.4 percent in March of 2017 from 5.6 percent in the previous month and below market expectations of 5.6 percent.
4.Review of Global Financial Markets: 4.1. International stocks recorded solid gains for U.S. dollar-based
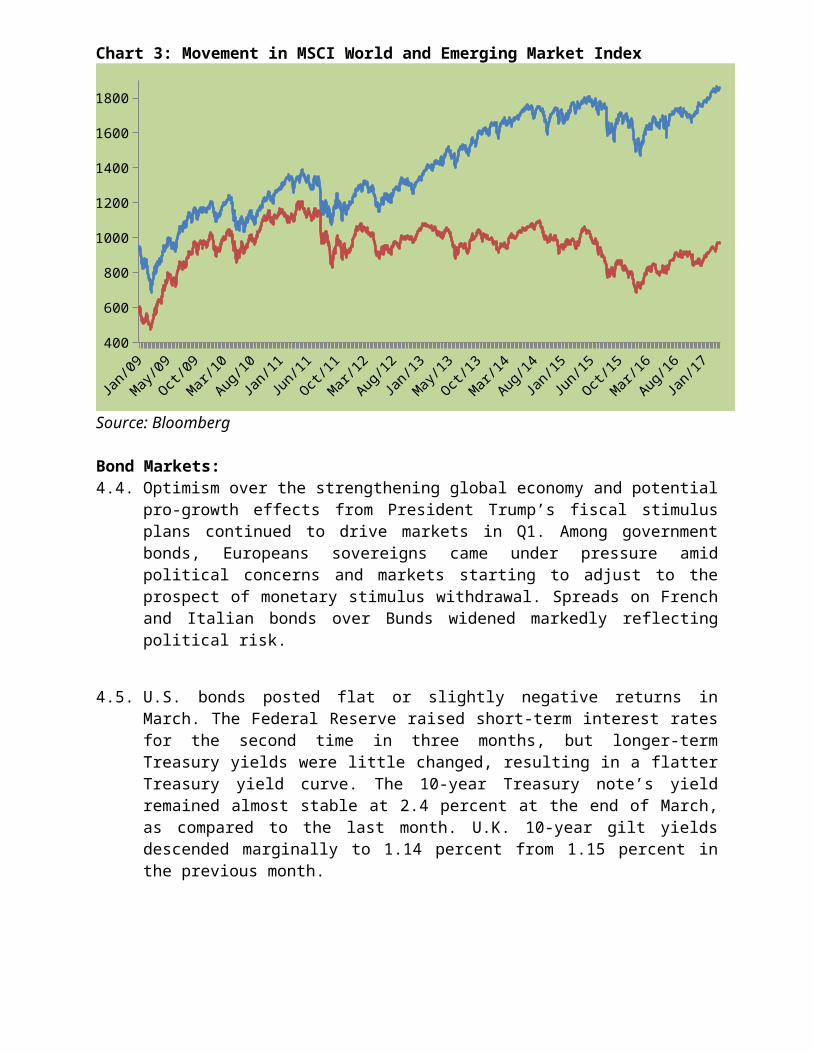
investors in March as equities rose in all 10 sectors. Strengthening economic data, rising inflation, favorable currency exchange rates, and less uncertainty following key elections in Europe aided the rally. Eurozone equities delivered robust gains amid upbeat economic releases and receding political worries following the win for the centre-right in the Dutch elections. UK equities gained, supported by solid corporate results and merger & acquisition activity. Japanese stocks saw positive but muted returns with the yen gradually appreciating over the quarter. The MSCI Emerging Markets index outperformed the MSCI World index. However, gap between gains of the two indices was wider in March 2017 as compared to the preceding month.
4.2. During March 2017, Emerging markets rose for the fourth straight month in March as indicators worldwide pointed to stronger economic growth and the U.S. Federal Reserve showed no urgency about future interest rate hikes after raising rates for the first time this year. The MSCI Emerging Markets index posted a strong gain, with US dollar weakness providing a tailwind to returns. In China, the weaker US dollar also served to alleviate concerns over capital outflows while economic data stabilised. Indian equities rallied as GDP growth appeared to shrug off demonetisation concerns. By contrast, Russia posted a negative return and was the weakest index market. A decline
in energy prices and reduced optimism towards a significant improvement in relations with the West were the key headwinds. Greece also recorded a negative return with banking stocks leading the market lower.
4.3. MSCI World Index, which is a leading indicator for tracking the overall performance of stock markets in developed markets witnessed marginal increase of 0.8 percent. On the other hand, MSCI Emerging Market Index registered a notable increase of 2.3 percent during March 2017. (Chart 3).
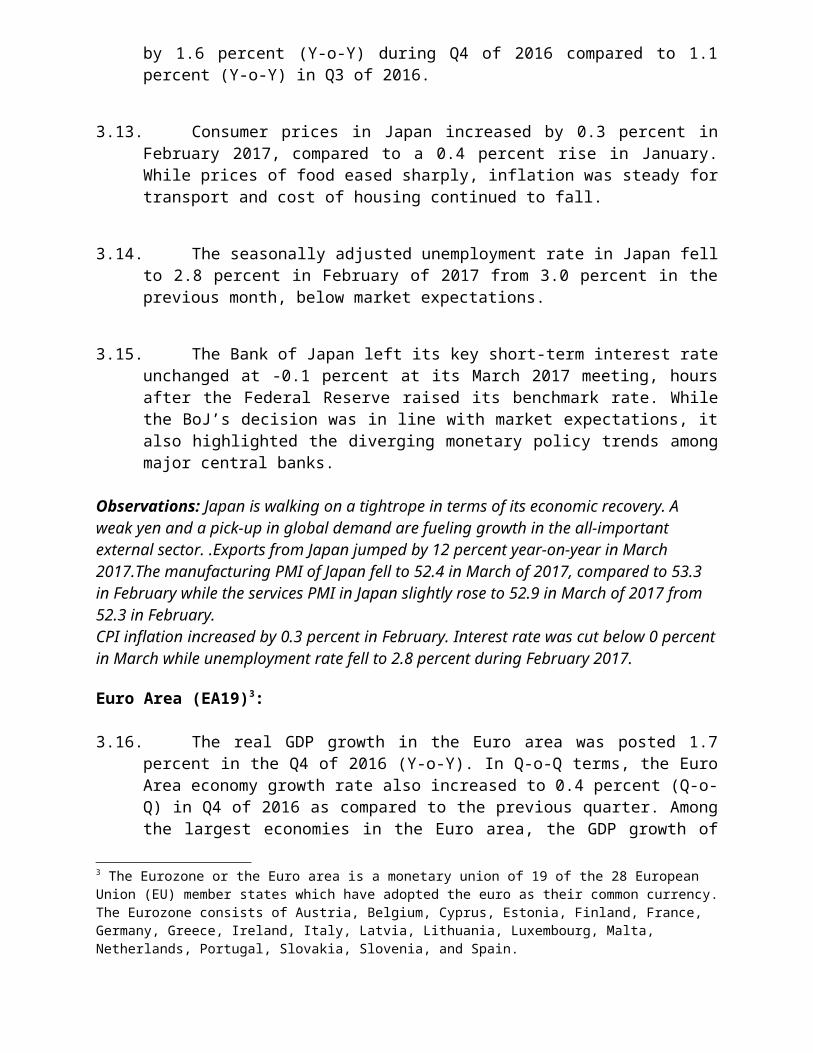
Chart 3: Movement in MSCI World and Emerging Market Index
Jan-13
Apr-1
3Jul
-13
Oct-13
Jan-14
Apr-1
4Jul
-14
Oct-14
Jan-15
Apr-1
5Jul
-15
Oct-15
Jan-16
Apr-1
6Jul
-16
Oct-16
Jan-17
400
600
800
1000
1200
1400
1600
1800
MSCI WORLD MSCI Emerging Market
Source: Bloomberg
Bond Markets:4.4. Optimism over the strengthening global economy and potential pro-
growth effects from President Trump’s fiscal stimulus plans continued to drive markets in Q1. Among government bonds, Europeans sovereigns came under pressure amid political concerns and markets starting to adjust to the prospect of monetary stimulus withdrawal. Spreads on French and Italian bonds over Bunds widened markedly reflecting political risk.
4.5. U.S. bonds posted flat or slightly negative returns in March. The Federal Reserve raised short-term interest rates for the second time in three months, but longer-term Treasury yields were little changed, resulting in a flatter Treasury yield curve. The 10-year Treasury note’s yield remained almost stable at 2.4 percent at the end of March, as compared to the last month. U.K. 10-year gilt yields descended marginally to 1.14 percent from 1.15 percent in the previous month.
4.6. The 10 year German bond yields increased from 0.2 percent to 0.3 percent at the end of March 2017. The 10 year government bond yield of China has remained almost stable to 3.3 percent. The yield of India ascended to 6.7 percent while the Russian bond yield fell to 8.3 percent in March 2017.
Chart4: Movement in 10 year bond yield of major countries
Apr
-15
May
-15
Jun-
15
Jul-
15
Aug
-15
Sep-
15
Oct
-15
Nov
-15
Dec
-15
Jan-
16
Feb-
16
Mar
-16
Apr
-16
May
-16
Jun-
16
Jul-
16
Aug
-16
Sep-
16
Oct
-16
Nov
-16
Dec
-16
Jan-
17
Feb-
17
Mar
-17
0
2
4
6
8
10
12
14
16
18
Germany US UK IndiaChina Brazil Russia
Source: Bloomberg
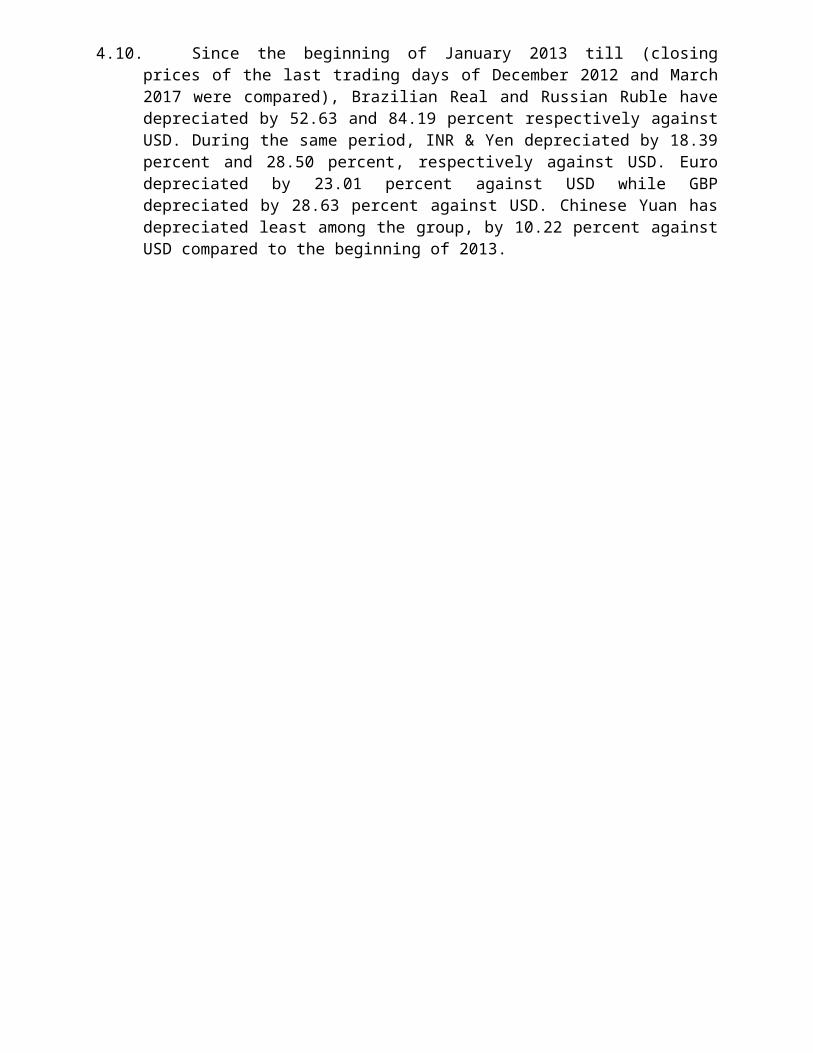
Currency Market:4.7. During March 2017 (by comparing the closing prices of the close of
last trading days of the February and March), the U.S. dollar (USD) lost against 5 out of 7 currencies evaluated against it (i.e. INR, YEN, GBP, EURO, Real, Yuan and Ruble). The currencies gained Ruble 3.71, INR 2.74, GBP 0.98, EURO 0.84 and YEN 0.56 percent respectively against Dollar. The currencies lost against it were Real with 1.08 percent and Yan with 0.25 percent respectively.
4.8. US Dollar Index, an index representing the strength of dollar against basket of other major currencies, observed to be 100.35 on close of March 2017, it lost 0.76 percent against the basket of major currencies during March 2017, and was 1.74 percent above of the close of last trading day the 2015.
4.9. Comparing the closing prices of currencies in 2015 with the closing price of March, GBP lost 17.52, Yuan; 5.91 and Euro; 1.51 percent respectively. Real and Ruble were the highest appreciating currencies with growth of 21.00 and 22.38 percent respectively followed by Yen 7.41 percent and INR 1.94.
4.10. Since the beginning of January 2013 till (closing prices of the last trading days of December 2012 and March 2017 were compared), Brazilian Real and Russian Ruble have depreciated by 52.63 and 84.19 percent respectively against USD. During the same period, INR & Yen depreciated by 18.39 percent and 28.50 percent, respectively against USD. Euro depreciated by 23.01 percent against USD while GBP depreciated by 28.63 percent against USD. Chinese Yuan has
depreciated least among the group, by 10.22 percent against USD compared to the beginning of 2013.
Chart 5: Movement of major currencies against US Dollar ($)
Jan-
13Fe
b-13
Mar
-13
May
-13
Jun-
13Ju
l-13
Sep-
13Oc
t-13
Dec-1
3Ja
n-14
Feb-
14Ap
r-14
May
-14
Jul-1
4Au
g-14
Sep-
14No
v-14
Dec-1
4Ja
n-15
Mar
-15
Apr-1
5Ju
n-15
Jul-1
5Au
g-15
Oct-1
5No
v-15
Dec-1
5Fe
b-16
Mar
-16
May
-16
Jun-
16Ju
l-16
Sep-
16Oc
t-16
Nov-
16Ja
n-17
Feb-
17
-180
-160
-140
-120
-100
-80
-60
-40
-20
0
20
INR YEN GBP EURO Real Yuan RubleSource: Bloomberg
Trend in Market Indices:4.11. Major stock indices all over the world exhibited a quite positive trend
during March 2017. Amongst the developed markets CAC 40 of France witnessed a notable increase of 4.8 percent, followed by DAX of Germany increasing by 3.6 percent and Straits Times of Singapore increasing by 2.5 percent during March 2017.On the contrary, a fall of 1.1 percent was registered by Nikkei 225 of Japan, followed by 0.7 percent by USA’s Dow Jones during the similar period.
4.12. As regards the emerging market indices, Stock Market Select of Chile led the way with an increase of 9.7 percent, followed by Hermes of Egypt which increased by 9.0 percent and Mexico’s Bolsa which recorded an increase of 3.6 percent during March 2017. On the contrary, a fall of 2.7 percent was registered by Karachi 30 of Pakistan , followed by Brasil’s Bovespa declining by 2.5 percent and Budapest Stock Exchange of Hungary declining by 1.3 percent during the same period.
Chart 6: Trend in Major Developed Market Indices
Jan-
12M
ar-1
2M
ay-1
2Ju
l-12
Sep-
12N
ov-1
2Ja
n-13
Mar
-13
May
-13
Jul-1
3Se
p-13
Nov
-13
Jan-
14M
ar-1
4M
ay-1
4Ju
l-14
Sep-
14N
on-1
4Ja
n-15
Mar
-15
May
-15
Jul-1
5Se
p-15
Nov
-15
Jan-
16M
ar-1
6M
ay-1
6Ju
l-16
Sep-
16N
ov-1
6Ja
n-17
Mar
-17
0
5000
10000
15000
20000
25000
0
5000
10000
15000
20000
25000
Source: Bloomberg
Chart 7: Trend in Market Indices of BRIC Nations
Feb-
13Ap
r-13
Jun-
13Au
g-13
Oct
-13
Dec
-13
Feb-
14Ap
r-14
Jun-
14Au
g-14
Oct
-14
Dec
-14
Feb-
15Ap
r-15
Jun-
15Au
g-15
Oct
-15
Dec
-15
Feb-
16Ap
r-16
Jun-
16Au
g-16
Oct
-16
Dec
-16
Feb-
17
10000
20000
30000
40000
50000
60000
70000
80000
90000
1000
1500
2000
2500
3000
3500
4000
4500
5000
BSE SENSEX (RHS) Brazil Bovespa (RHS)Russian Traded (LHS) China Shanghai Composite (LHS)
Source: Bloomberg
Market Capitalisation:4.13. Market capitalisation of major countries in the world, at the end of
March 2017, is given in table A6 and is illustrated in Chart 8. The market capitalisation of all the major countries increased significantly during the month of March 2017.
4.14. Among major developed markets, the market capitalisation of France, U.K, Singapore and Australia increased significantly by 6.6 percent, 3.2 percent, 3.7 percent and 2.3 percent respectively during March 2017. The market capitalisation of Hong Kong and Japan increased marginally by 1.2 percent and 0.3 percent respectively at the end of March 2017.
4.15. As regards the emerging markets, the market capitalisation showed positive trend for most of the countries. The market capitalisation of India increased by 6.4 percent to USD 1.8 trillion while market capitalisation of China is increased marginally by 0.6 percent to USD 6.8 trillion. The market capitalisation of Brazil descended significantly by 3.2 percent while South Korea’s market capitalisation increased by 5.4 percent. Market capitalisation of South Africa remained stable while Chile soared up by 6.7 percent. Russia and Colombia showed increase in their market capitalisation and rose by 2.2 percent and 5.5 percent at the end of March 2017.
Chart 8: Trend in Market Capitalisation of Major Exchanges (US$ Trillion)
Ap
r-1
5
May
-15
Jun
-15
Jul-
15
Au
g-1
5
Sep
-15
Oct
-15
No
v-1
5
Dec
-15
Jan
-16
Feb
-16
Mar
-16
Ap
r-1
6
May
-16
Jun
-16
Jul-
16
Au
g-1
6
Sep
-16
Oct
-16
No
v-1
6
Dec
-16
Jan
-17
Feb
-17
Mar
-170
1000000
2000000
3000000
4000000
5000000
6000000
7000000
8000000
9000000
10000000
10
5000010
10000010
15000010
20000010
25000010
30000010
Japan (LHS) India (LHS) Brazil (LHS) China (LHS)Russia (LHS) South Africa (LHS) USA (RHS)
Source: Bloomberg
Derivatives Market: 4.16. Among the major stock exchanges covered in the review (Table A4 &
A5), during March 2017, the monthly notional turnover of index

futures in CME Group was the highest at USD 6530 billion followed by EUREX (USD 2376 billion), Japan Exchange Group (USD 1238 billion) and ICE Futures US (USD 906 billion). In case of Index options, Korea Exchange recorded the monthly turnover of USD 3495 billion followed by CME Group (USD 2725 billion) and EUREX (USD 1338 billion). Chicago Board Options Exchange recorded highest number of contracts traded in Index option category, with 44.5 million contracts traded in March 2017, followed by EUREX (36.8 million contracts), Korea Exchange (33.3 million contracts) and CME Group (17.6 million contracts).
4.17. In case of Stock Options, BM&FBOVESPA recorded highest volume (67.8 million contracts) in terms of contracts traded on the major world exchanges followed by Nasdaq - US (48.7 million contracts), Chicago Board Options Exchange (36.3 million contracts), NYSE (24.3 million contracts) and EUREX (18.2 million contracts). In case of Stock Futures, Korea Exchange remains the number one exchange in terms of number of contracts traded with monthly volume of 19.9 million contracts, followed by Moscow Exchange (19.9 million contracts), EUREX (9.1 million contracts) and Thailand Futures Exchange (4.4 million contracts).
5.Review of Indian Economy5.1. As per the latest available release of Ministry of Statistics and
Programme Implementation for quarterly estimates of GDP for Q3 of 2016-17. As per the estimates, quarterly GVA (Gross Value Added) at basic price for Q3 of 2016-17 has shown a growth rate of 6.6 percent (Y-o-Y). Agriculture sector's GVA at basic price has been estimated at 6.0 percent in Q3 of 2016-17 as against -2.2 percent in Q3 of 2015-16. Quarterly GVA at basic prices for Q3 of 2016-17 from manufacturing sector grew by 8.3 percent as compared to growth of 12.8 percent in Q3 of 2015-16. For the financial, real estate and professional services sector, quarterly GVA at basic prices for Q3 2016-17 grew by 3.1 percent as compared to growth of 10.4 percent in Q3 2015-16.
5.2. GDP in Q3 of 2016-17 has shown a growth rate of 7.0 percent (Y-o-Y). The International Monetary Fund has marginally trimmed India's economic growth forecasts to 6.6 percent and 7.2 percent for 2016 and 2017 respectively.
5.3. The Nikkei India Manufacturing PMI (Purchasing Managers’ Index) stood at 50.7 in February compared to 50.4 in January, the latest reading which showed the indices crossing 50 attributes to growth of both new orders and output. The Nikkei India Services PMI Index noted a contraction to 50.3 in February, from 48.7 in January, improving marginally from the reading of previous month.
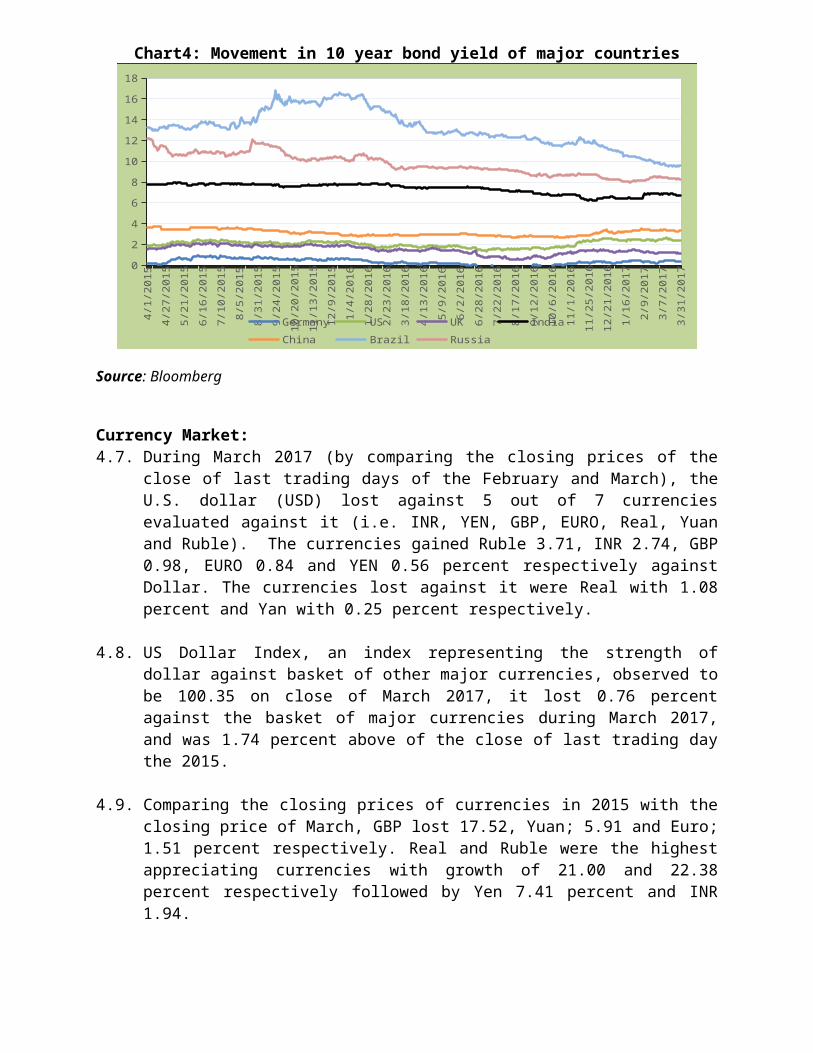
Exhibit 3: Quarterly Estimates of GVA (Y-o-Y) (at 2011-12 prices)
Items
2014-15
2015-16 2015-16 2016-17
(1st
RE) (PE) Q1 Q2 Q3 Q4 Q1 Q2 Q3
1. Agriculture & allied activities -0.2 1.2 2.6 2.3 -
2.2 2.3 1.9 3.8 6.0
2. Industry
Mining & Quarrying 10.8 7.4 11.2 13.9 13.3 8.6 -
0.3 -1.3 7.5
Manufacturing 5.5 9.3 8.5 10.3 12.8 9.3 9.0 6.9 8.3
Electricity, Gas, Water Supply & Other Utility Services
8 6.6 2.5 5.9 4.1 9.3 9.6 3.8 6.8
3. Services Construction 4.4 3.9 4.8 0.0 3.2 4.5 1.7 3.4 2.7 Trade, Hotel, Transport,
Communication and services related to broadcasting
9.8 9 10.6 8.9 9.6 9.9 8.2 6.9 7.2
Financial, Real Estate & Professional Services 10.6 10.3 10.2 13.1 10.
4 9.1 8.7 7.6 3.1
Public Administration, Defense and Other services
10.7 6.6 6.3 7.2 7.5 6.4 9.9 11.0 11.9
Items
2014-15
2015-16 2015-16 2016-17
(1st
RE) (PE) Q1 Q2 Q3 Q4 Q1 Q2 Q3
Gross Value Added at Basic Price 7.1 7.2 7.2 7.3 6.9 7.4 6.9 6.7 6.
6
GDP 7.2 7.6 7.5 7.6 7.2 7.9 7.2 7.4 7.0
RE- Revised Estimates; PE- Provisional EstimatesSource: CSO
Index of Industrial Production5.4. India’s General Index of Industrial Production (IIP) contracted by 1.2
percent in February 2017, against 1.9 percent growth recorded in February 2016 (both over the corresponding period in the previous year), with manufacturing contracted by 2.0 percent as compared to its 0.6 percent growth in previous year. Electricity grew at 0.3 percent in February as compared to 9.6 percent growth in previous year. Mining grew by 3.3 percent in February, compared to a growth of 5.0 percent in previous year. During April-February 2016-17, the IIP grew 0.4 percent, against 2.6 percent growth recorded in April-February 2015-16.
Inflation5.5. India's CPI inflation grew by 3.81 percent in March, as compared to
3.65 percent in February. Food prices (as measured by CFPI) showed a rise of 1.93 percent in March as compared to 2.01 percent in February. The Repo rate currently stands at 6.25 percent.
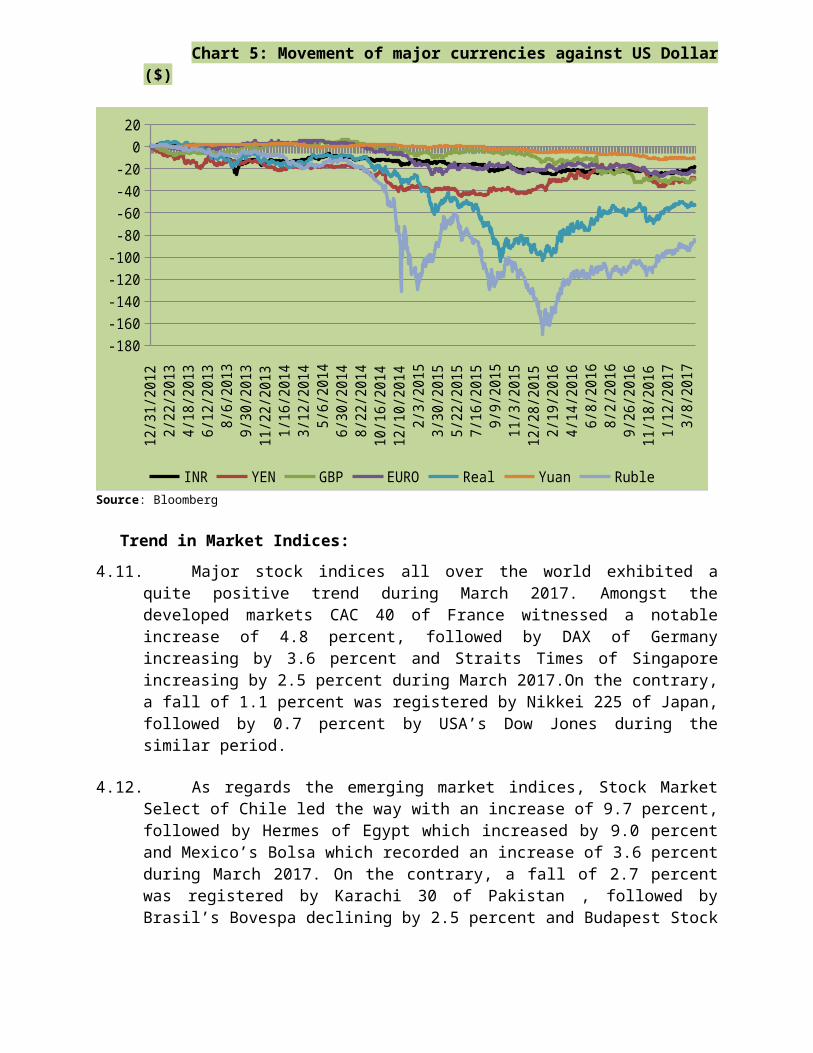
Chart 10: Inflation as measured by WPI and CPI (in percent)
April May Jun Jul Aug Sep Oct Nov Dec Jan Feb Mar0
1
2
3
4
5
6
7
5.395.76 5.77
6.07
5.05
4.39 4.23.63 3.41
3.173.65 3.81
4.87 5.01
5.4
3.69 3.744.41
55.41
5.61 5.695.18
4.83
WPI and CPI Inflation Comparisons
CPI Inflation in 2016-17 CPI Inflation in 2015-16
Source: CSO, RBI, Office of Economic Advisor
Trade – Exports and Imports5.6. In continuation with the with the double digit growth exhibited by
exports during February 2017, exports during March 2017 for the first time exhibited a double digit positive growth of 27.59 percent in dollar terms valued at US$ 29.23 billion as compared to US$ 22.91 billion during March 2016. Imports increased by nearly 45.25 percent to USD 39.67 billion in March 2017 from 27.31 billion in March 2016. The merchandise trade deficit was USD 105.72 billion in during April-March 2016-17, 10.95 percent lower than the deficit of USD 118.72 billion. Taking merchandise and services together, overall trade deficit for April- March 2016-17 was estimated at USD 46.42 billion, which is 14.49 percent lower than the deficit of USD 54.29 billion during April-March 2015-16.
Foreign Exchange Reserves5.7. Since the end of March 2016, forex reserves have increased by about
USD 9,778.50 million. The reserves were recorded at USD 369.95 billion as on February 24, 2017. (Exhibit 4)
Exhibit 4: Foreign Exchange Reserves (USD billion)
Mar 31, 2017
Feb 24, 2017
Jan 27, 2017
Dec 30, 2016
Total Reserves 370.0 362.8 361.6 360.3Foreign Currency Assets 346.3 339.8 339.2 336.6Gold 19.9 19.2 18.6 20.0

SDRs 1.4 1.4 1.4 1.4Reserve Position in the IMF 2.3 2.3 2.3 2.3
Source: RBI
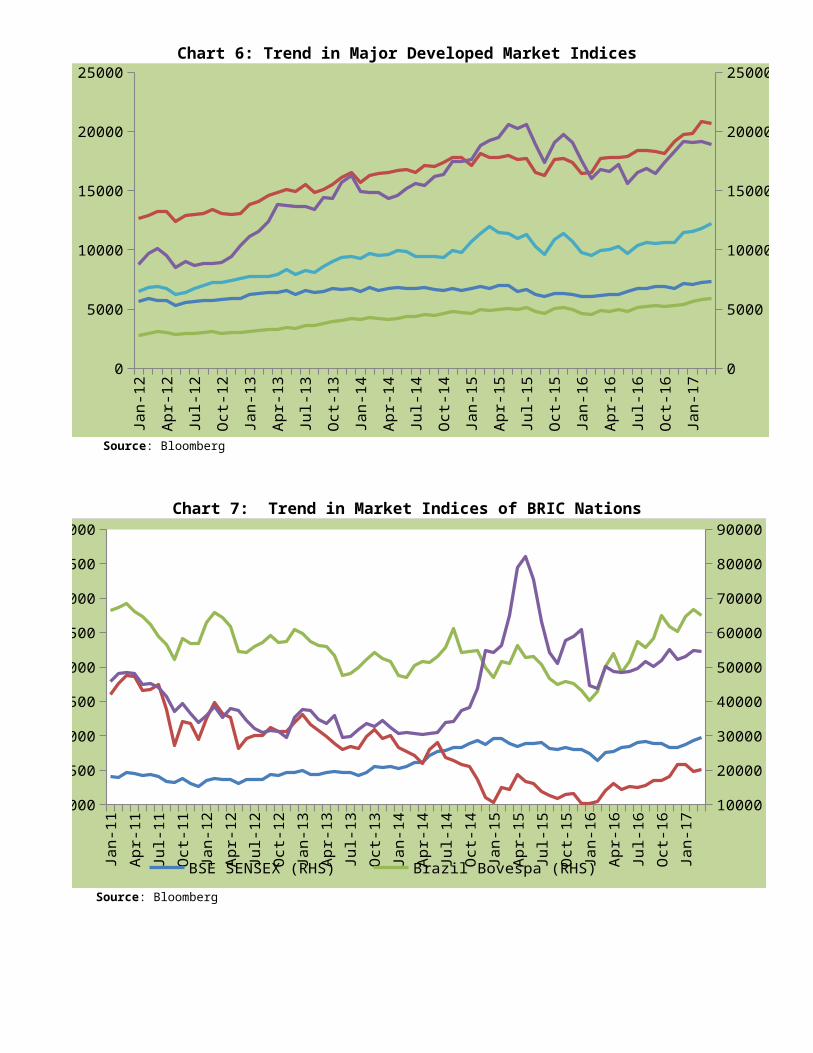
5. Annex Tables:Table A1: Trend in major International Indices
Country IndexAs on As on
March*,2016
As on March*,2015 March*, 2017
1 2 3 4 5
Australia All Ordinaries 5861.9 5151.8 5903.835
France CAC 40 5033.6 4385.1 5089.64Germany Dax 11966.2 9965.5 12256.43Hong Kong HSI Hang Seng 24900.9 20776.7 24111.59Japan NIKKEI Nikkei 225 19207 16758.7 18909.26Singapore STI Straits Times 3447 2840.9 3175.11UK FTSE 100 6773 6174.9 7322.92USA DOW JONES Dow Jones Industrial
Average 17776.1 17685.1 20663.22USA NASDAQ Composite Nasdaq Composite 4900.9 4869.8 5911.738
India (BSE) Sensex 27957.5 25341.9 29620.5
India (NSE) Nifty 50 8491 7738.4 9173.75Brazil Bovespa 51150.2 50055.3 64984.07
Chile Stock Market Select 3916.9 3937.5 4783.42
China Shanghai SE Composite IX 3747.9 3003.9 3222.514
Colombia IGBC General 9998.9 9871.5 10150.68Egypt Hermes 828.8 687.3 1167.812
Hungary Budapest Stock Exchange 19689.2 26451 31634.26
Indonesia Jakarta Composite 5518.7 4845.4 5568.106Malaysia FTSE Bursa Malaysia
KLCI 1830.8 1717.6 1740.09Mexico Bolsa 43724.8 45881.1 48541.56Pakistan Karachi 30 19232.3 19167.5 25615.6
Russia Russian Traded 1222.8 1203.3 1509.67
South Africa FTSE/JSE Africa All Share 52182 52250.3 52056.06
Taiwan Taiwan Taiex 9586.4 8744.8 9811.52
Thailand Stock Exchange of Thai 1505.9 1407.7 1575.11Turkey ISE National 100 80846 83268 88947.4
*Indices are as on last trading day of the month,Source: Bloomberg
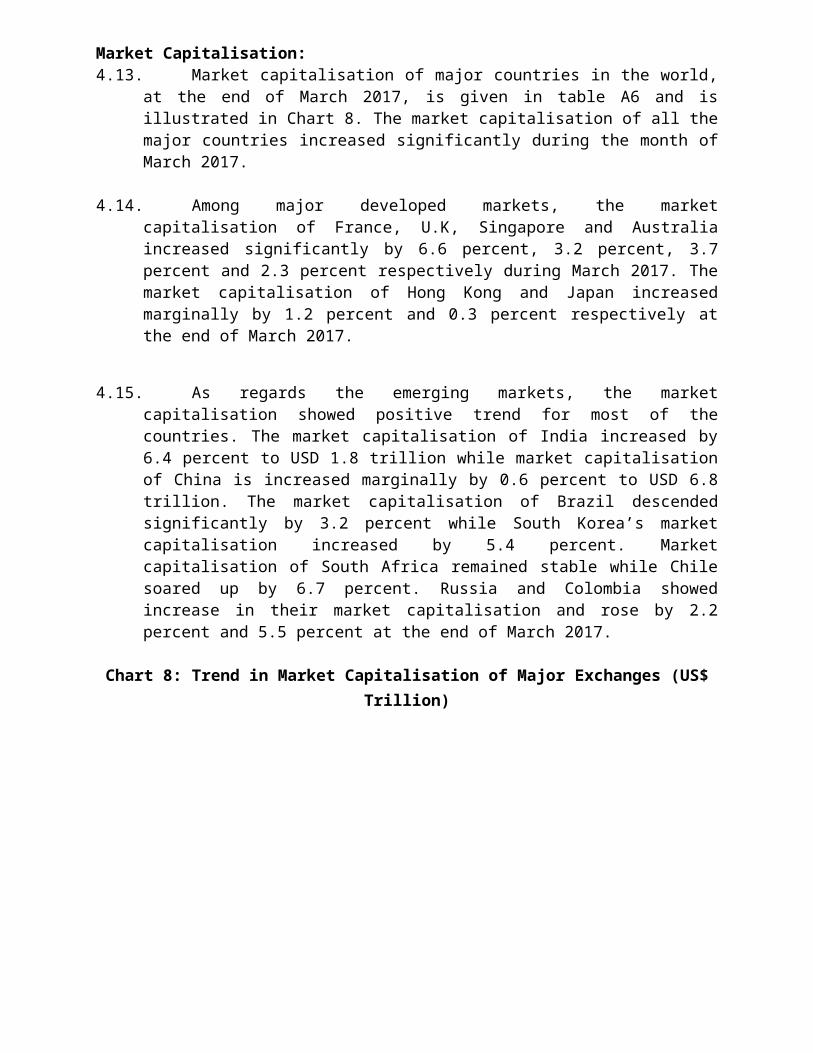
Table A2: Volatility and P/E Ratio of Major International Indices
Country Index
Volatility (per cent) P/E Ratio
Feb-17
Mar-17
Feb-17
Mar-17
1 2 3 4 5 6Developed Markets Australia All Ordinaries 0.4 0.6 16.2 16.4France CAC 40 0.6 0.6 14.3 15.1Germany Dax 0.6 0.6 13.7 14.0Hong Kong HSI Hang Seng 0.6 0.7 11.9 12.0Japan NIKKEI Nikkei 225 0.8 0.9 NA NASingapore STI Straits Times 0.6 0.6 14.4 14.7UK FTSE 100 0.3 0.5 14.8 14.8USA DOW JONES Dow Jones Industrial
Average0.3 0.5 17.4 17.2
USA NASDAQ Composite
Nasdaq Composite 0.3 0.6 22.2 22.5
Emerging Markets India (BSE) S&P Sensex 0.5 0.6 21.1 21.8India (NSE) Nifty 50 0.5 0.6 21.7 21.9Argentina Indice Bolsa General 0.9 1.1 18.4 18.9Brazil Bovespa 1.0 1.3 12.9 12.1Chile Stock Market Select 0.4 0.7 15.7 17.8China Shanghai SE
Composite IX0.5 0.5 13.6 13.7
Colombia IGBC General 0.7 0.6 NA NAEgypt Hermes 1.3 0.9 10.1 11.3Hungary Budapest Stock
Exchange1.1 1.3 11.8 11.2
Indonesia Jakatra Composite 0.4 0.5 15.6 16.5Malaysia FTSE Bursa Malaysia
KLCI0.3 0.5 16.1 16.5
Mexico Bolsa 0.7 0.7 17.4 18.2Pakistan Karachi 30 0.6 0.7 10.7 10.8Russia Russian Traded 1.0 1.6 6.1 6.0South Korea Kospi Index 0.4 0.5 NA NASouth Africa FTSE/JSE Africa All
Share0.7 0.7 14.8 15.2
Taiwan Taiwan Taiex 0.4 0.5 14.6 13.4Thailand Stock Exchange of
Thai0.4 0.4 15.1 15.5
Turkey ISE National 100 0.8 0.8 8.8 8.9NA.: Not AvailableSource: Bloomberg,
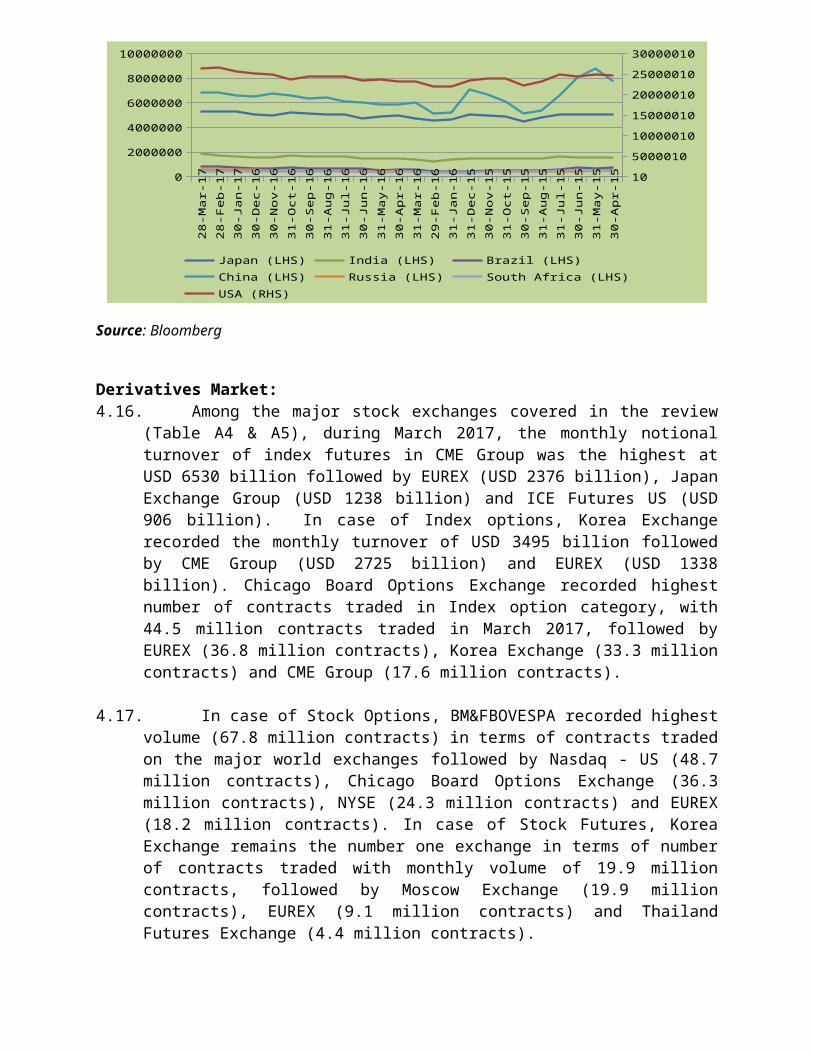
Table A3: Investment Flows – New capital Raised by Shares and Bonds in the Major Exchanges
Stock ExchangeFeb-17 Mar-17
Bonds(USD
Million)
Equity(USD
Million)
Total(USD
Million)
Bonds(USD
Million)
Equity(USD
Million)
Total(USD
Million)Australian Securities Exchange NA 915 915 NA 2,945 2,945BME Spanish Exchanges NA 953 953 NA 6,519 6,519Bolsa de Comercio de Buenos Aires 6,314 NA 6,314 NA NA NABorsa Istanbul 5,542 0 5,542 7,613 4 7,617Euronext NA 2,181 2,181 NA 7,913 7,913Hong Kong Exchanges and Clearing 8,136 1,788 9,925 17,139 3,793 20,932Irish Stock Exchange 1,324 2 1,326 1,869 69 1,938Japan Exchange Group Inc. 3,739 1,309 5,049 NA NA NAJohannesburg Stock Exchange 3,496 274 3,770 3,610 934 4,543Korea Exchange 45,715 90 45,805 43,122 223 43,346London SE Group 37,502 NA 37,502 NA NA NAMoscow Exchange 16,056 NA 16,056 20,024 NA 20,024Nasdaq - US NA 271 271 NA 266 266Nasdaq Nordic Exchanges 6,354 86 6,439 4,701 0 4,701NYSE NA 8,666 8,666 NA 10,848 10,848Oslo Bors 3,232 229 3,461 5,010 667 5,677Shanghai Stock Exchange NA 7,326 7,326 NA 7,303 7,303Shenzhen Stock Exchange 476 4,351 4,827 675 9,476 10,151Singapore Exchange 26,825 65 26,890 33,575 97 33,672SIX Swiss Exchange 5,559 NA 5,559 6,208 NA 6,208Tel-Aviv Stock Exchange 3,115 146 3,262 3,477 117 3,594TMX Group 44 3,569 3,613 203 3,341 3,544Warsaw Stock Exchange NA 13,831 13,831 NA 55 55
NA: Not AvailableSource: World Federation of Exchanges
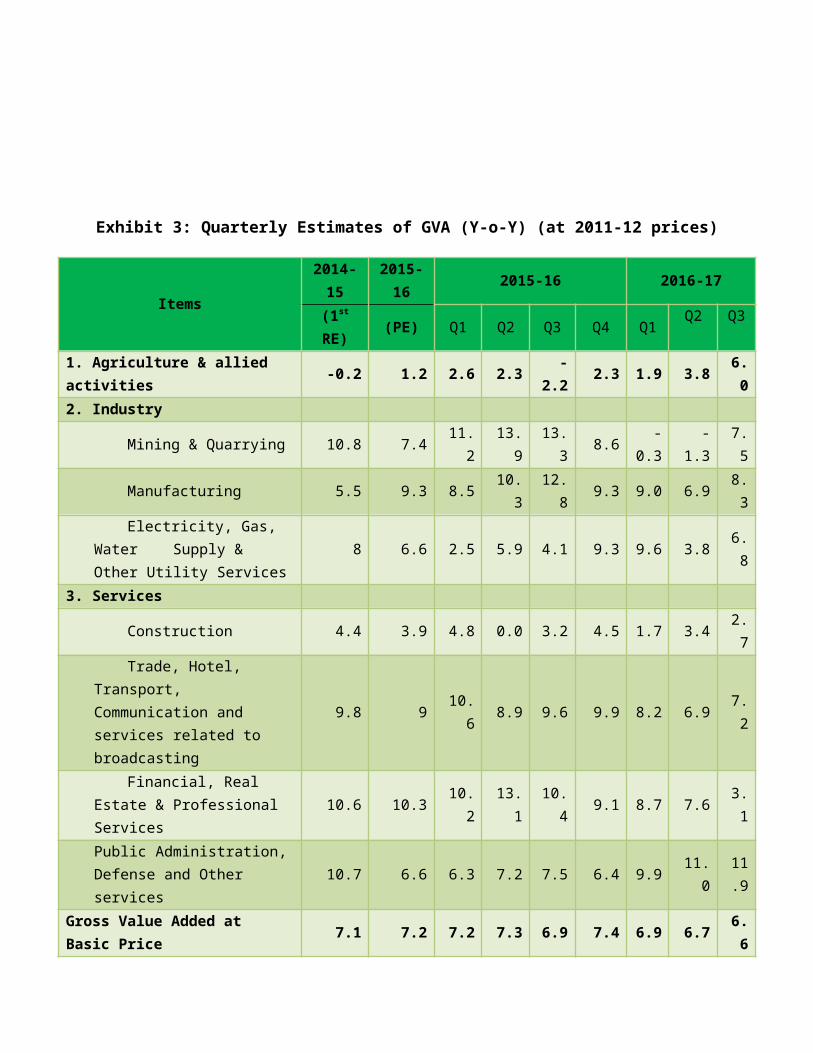
Table A4: Monthly Turnover in Derivatives (Stock options and Stock futures) in major Stock Exchanges
Exchange
Mar-17Stock options Stock futures
Number ofcontracts
traded
Notionalturnover
(USD Million)
Number ofcontracts
traded
Notionalturnover
(USD Million)
Americas BM&FBOVESPA 6,78,48,982 47,013 0 0Bolsa de Comercio de Buenos Aires NA NA NA NAChicago Board Options Exchange 3,63,17,076 NA NA NANasdaq - US 4,86,58,374 NA NA NANYSE 2,42,84,253 4,525 NA NA Asia - Pacific Australian Securities Exchange 85,08,129 14,831 2,98,893 483Hong Kong Exchanges and Clearing 76,32,461 19,770 10,727 50Japan Exchange Group 45,354 NA NA NAKorea Exchange 10,51,705 NA 1,98,78,972 15,669TAIFEX 21,063 64 15,27,813 7,299Thailand Futures Exchange NA NA 43,62,031 NA Europe - Africa - Middle East Athens Derivatives Exchange 1,892 1 19,22,212 149BME Spanish Exchanges 21,29,590 1,867 22,77,580 1,638Borsa Istanbul 5,42,463 92 5,23,669 82EUREX 1,81,70,661 85,561 91,13,060 44,657Euronext 58,77,512 18,585 5,784 20Johannesburg Stock Exchange 11,75,983 43 22,14,835 1,835Moscow Exchange 2,28,223 61 1,98,75,522 5,549Nasdaq Nordic Exchanges 20,17,898 3,267 4,38,382 700Oslo Bors 3,44,360 197 3,89,167 222Tehran Stock Exchange 20,38,604 0 0 0Tel-Aviv Stock Exchange 59,860 439 NA NA
NA: Not AvailableSource: World Federation of Exchanges
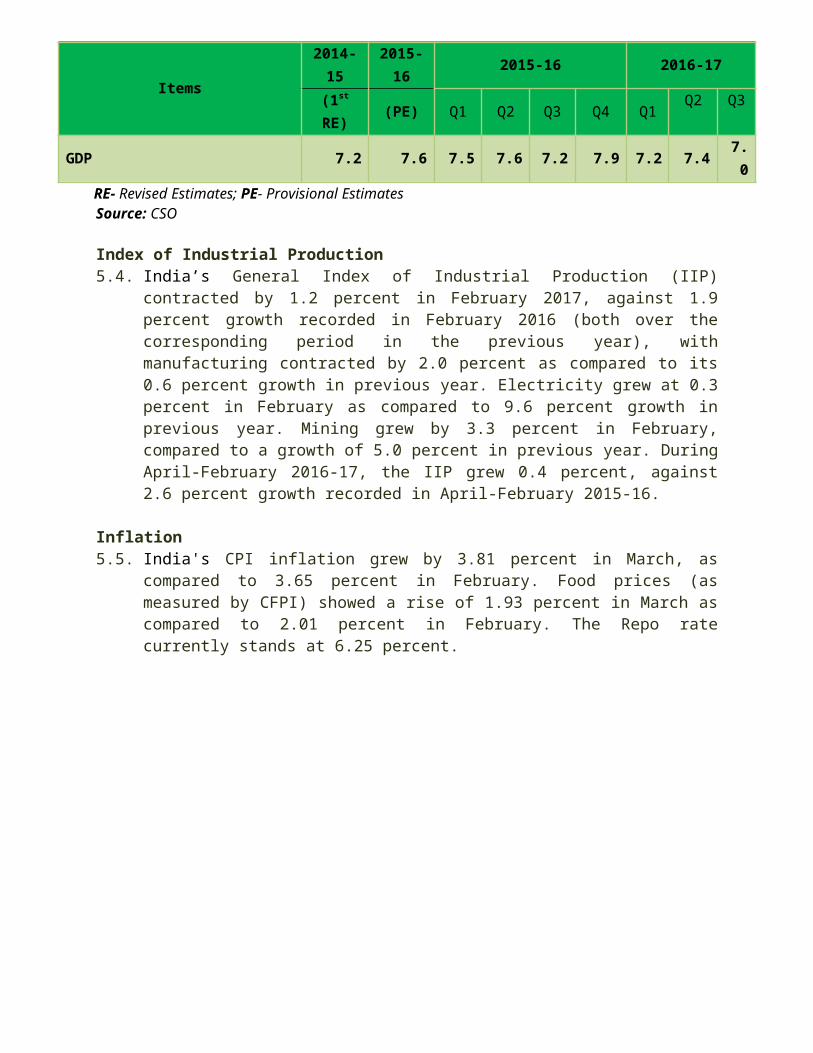
Table A5: Monthly Turnover in Derivatives (Index options and Index futures) in major Stock Exchanges
Exchange
Mar-17Stock index options Stock index futures
Number of contracts
traded
Notionalturnover
(USD Million)
Number of contracts
traded
Notionalturnover
(USD Million)
Americas BM&FBOVESPA 18,40,512 16,156 2,33,68,050 1,31,765Chicago Board Options Exchange 4,44,75,510 NA NA NACME Group 1,76,16,734 27,24,650 5,57,01,576 65,29,990ICE Futures US 15,375 2,110 96,83,445 9,05,761MexDer 2,370 61 1,49,996 3,243Nasdaq - US 2,14,923 NA NA NA Asia - Pacific Australian Securities Exchange 8,88,916 40,265 17,57,482 1,87,589Hong Kong Exchanges and Clearing 29,56,606 2,67,177 67,13,074 6,28,179Japan Exchange Group 24,66,462 NA 2,55,13,705 12,38,010Korea Exchange 3,33,24,909 34,95,250 42,10,058 3,59,905Singapore Exchange 4,80,449 NA 1,23,92,339 NATAIFEX 1,57,85,637 2,54,523 51,21,227 2,30,830Thailand Futures Exchange 68,039 NA 27,12,498 NA Europe - Africa - Middle East Athens Derivatives Exchange 6,462 24 75,799 281BME Spanish Exchanges 2,21,281 2,311 6,70,945 58,260Borsa Istanbul 27,071 80 30,41,104 9,095EUREX 3,68,47,492 13,38,010 5,38,51,076 23,75,660Euronext 12,86,727 69,576 39,44,615 2,48,278Johannesburg Stock Exchange 5,86,305 327 30,15,379 59,287Moscow Exchange 39,28,263 7,809 1,85,14,959 39,703Nasdaq Nordic Exchanges 4,71,568 8,264 40,65,172 57,520Oslo Bors 99,954 57 2,78,615 159Tel-Aviv Stock Exchange 30,54,892 NA NA NAWarsaw Stock Exchange 27,198 151 6,74,549 7,491
NA: Not AvailableSource: World Federation of Exchanges
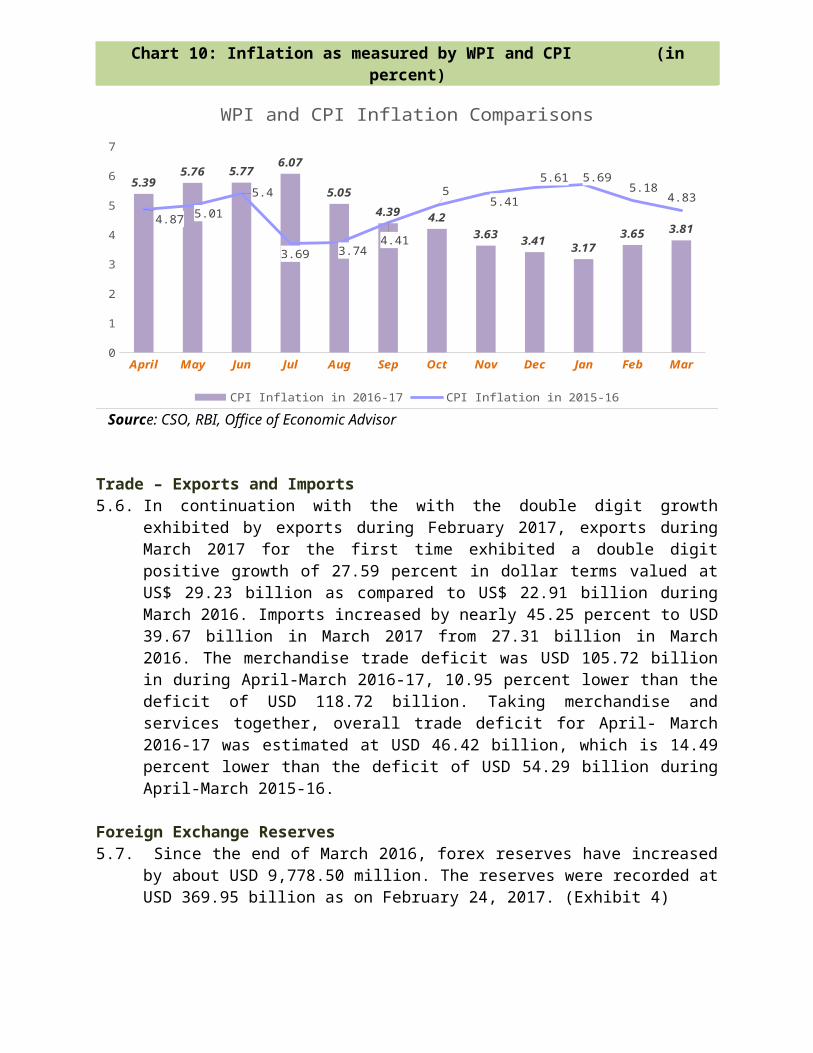
Table A6: Market Capitalisation of major Stock Exchanges (US$ Million)
Stock Exchange Jan-17 Feb-17 Mar-17
M-o-M change( perc
ent)1 2 3 4 5
Developed Markets Australia 12,29,790 12,47,883 12,76,501 2.3France 19,84,591 19,59,635 20,89,366 6.6
Germany 19,55,633 19,38,153 20,12,933 3.9
Hong Kong 42,36,160 43,41,631 43,92,097 1.2
Japan 52,72,042 53,07,604 53,23,905 0.3
Singapore 5,05,519 5,15,699 5,34,994 3.7
UK 31,73,147 31,89,555 32,92,228 3.2
USA 2,56,93,050 2,65,35,725 2,64,59,999 (0.3) Emerging Markets
India 16,86,066 17,60,639 18,72,766 6.4
Argentina 70,213 74,550 79,974 7.3
Brazil 7,74,510 8,26,966 8,00,661 (3.2)
Chile 2,17,748 2,23,923 2,38,972 6.7
China 66,09,474 68,42,645 68,86,228 0.6
Colombia 1,05,504 1,03,106 1,08,731 5.5
Egypt 35,079 39,505 38,360 (2.9)
Hungary 23,372 23,232 22,886 (1.5)
Indonesia 4,28,746 4,36,879 4,52,572 3.6
Malaysia 3,66,764 3,73,187 3,88,111 4.0
Mexico 3,11,858 3,30,407 3,70,890 12.3
Pakistan 95,026 92,973 91,620 (1.5)
Russia 6,09,008 5,80,653 5,93,306 2.2
South Korea 12,93,988 13,17,014 13,87,760 5.4
South Africa 4,37,043 4,48,911 4,48,789 (0.0)
Taiwan 10,00,923 10,60,302 10,79,318 1.8
Thailand 4,33,863 4,27,047 4,40,985 3.3
Turkey 1,70,535 1,78,919 1,84,826 3.3
M-o-M: Month on Month.
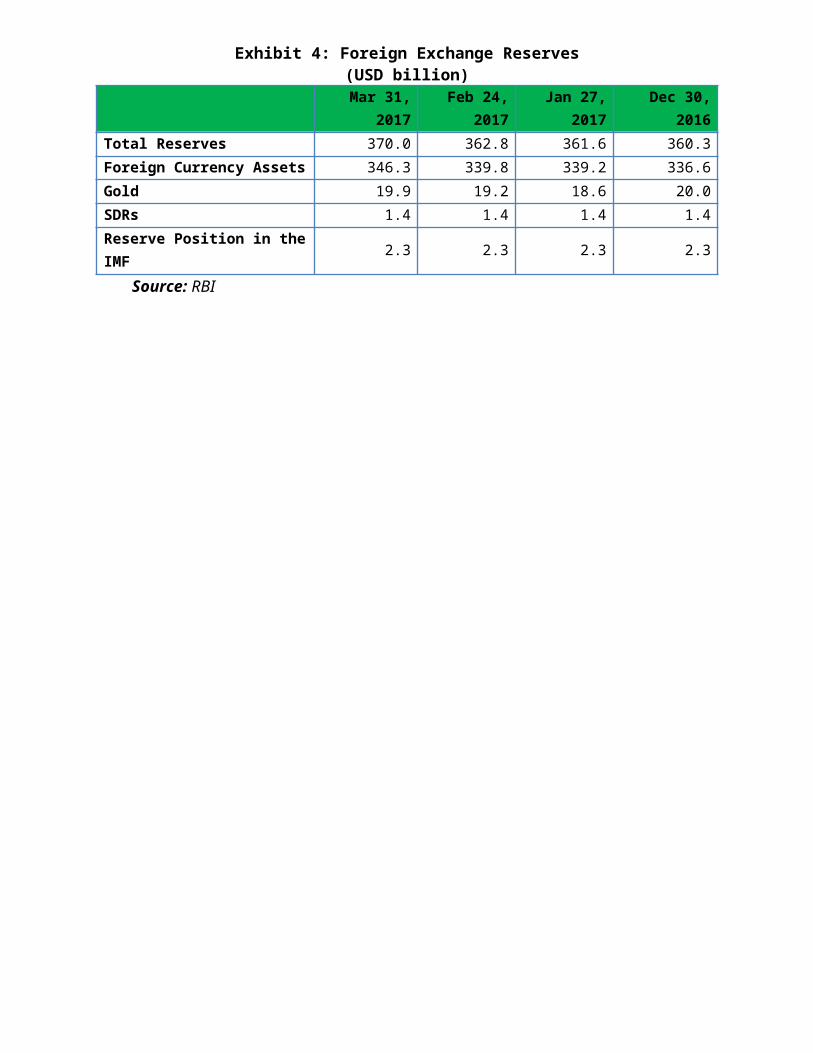
Source: Bloomberg
Sources:1. OECD database2. Bureau of Economic Analysis (US)3. Bureau of Labor Statistics (US)4. The Conference Board (US)5. The Federal Reserve System (US) 6. Institute for Supply Management (US)7. Office for National Statistics (UK)8. Bank of England (UK)9. The Cabinet Office (Japan)10. Statistics Bureau, Director-General for Policy Planning
(Statistical Standards) (Japan)11. Bank of Japan12. Eurostat (EA18 and EU27)13. European Central Bank (EA18)14. InstitutoBrasileiro de Geografia e Estatística (Brazilian
Institute of Geography and Statistics)15. Banco Central do Brasil (Central Bank of Brazil)16. Federal State Statistics Service (Russian Federation)17. The Central Bank of the Russian Federation18. The Central Statistical Office (India)19. Office of the Economic Adviser to the Government of India20. The Reserve Bank of India21. National Bureau of Statistics of China 22. Peoples Bank of China23. Markit Financial Information Services24. World Federation of Exchanges25. Bloomberg26. BSE Ltd.27. The National Stock Exchange28. The Bank of Korea29. Bank Indonesia30. Central Bank of The Republic of Turkey31. IMF32. World Bank
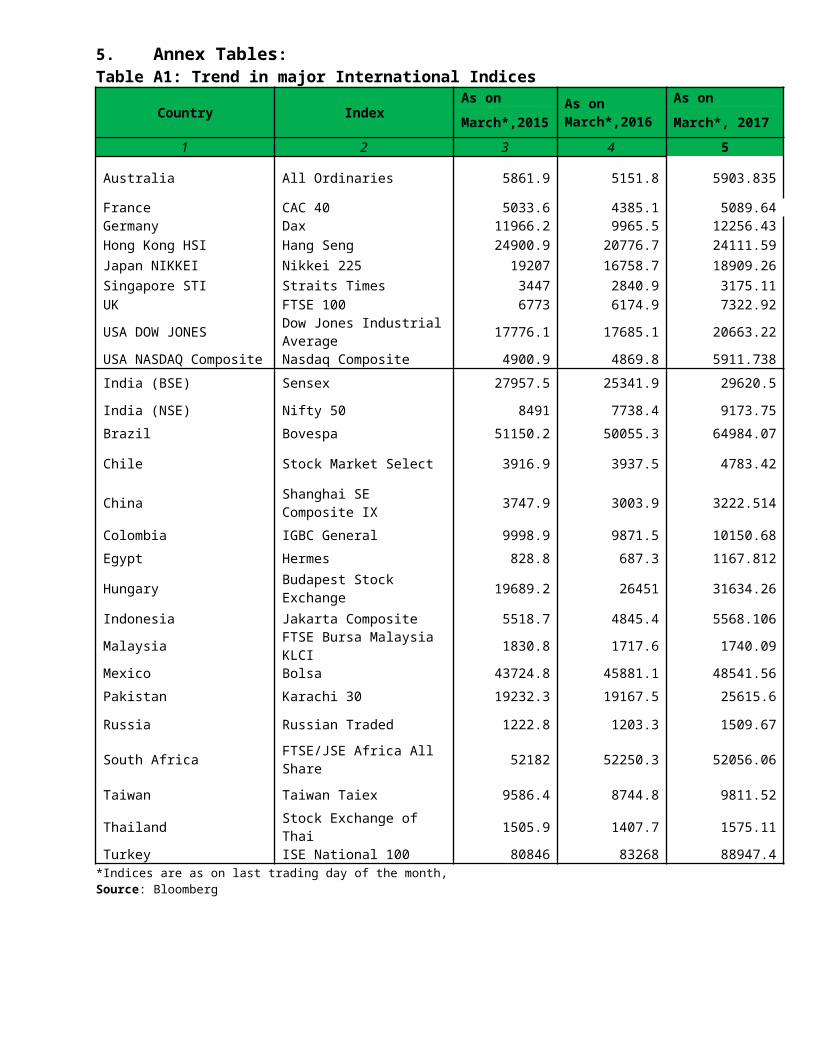
HIGHLIGHTS OF DEVELOPMENTS IN INTERNATIONAL SECURITIES MARKET
1. SEC Adopts T+2 Settlement Cycle for Securities Transactions
22nd March, 2017: The Securities and Exchange Commission today adopted an amendment to shorten by one business day the standard settlement cycle for most broker-dealer securities transactions. Currently, the standard settlement cycle for these transactions is three business days, known as T+3. The amended rule shortens the settlement cycle to two business days, T+2. The amended rule is designed to enhance efficiency, reduce risk, and ensure a coordinated and expeditious transition by market participants to a shortened standard settlement cycle. Broker-dealers will be required to comply with the amended rule beginning on Sept. 5, 2017.Source: https://www.sec.gov/news/press-release/2017-68-0
2. IOSCO finds little evidence of declining secondary corporate bond market liquidity.
7th March, 2017: A report published by IOSCO has found no substantial evidence showing that liquidity in
the secondary corporate bond markets between 2004 and 2015 has deteriorated markedly from historic norms for non-crisis periods. The report, titled Examination of Liquidity of the Secondary Corporate Bond Markets, presents a data driven analysis of secondary corporate bond market during 2004 and 2015, with a specific focus on liquidity. The report reveals that there have been meaningful changes to the characteristics and structure of corporate bond markets, caused by new technology, the growth of electronic trading venues, and changes in execution models and dealer inventory levels. The report’s findings confirm that corporate bond markets remain fragmented among national and regional OTC markets, and differ substantially across jurisdictions.Source: www. iosco.org/news/pdf/IOSCONEWS454.pdf3. IOSCO approves the enhanced
standard for cross-border enforcement cooperation
31st March, 2017: The members of IOSCO have approved the Enhanced Multilateral Memorandum of Understanding
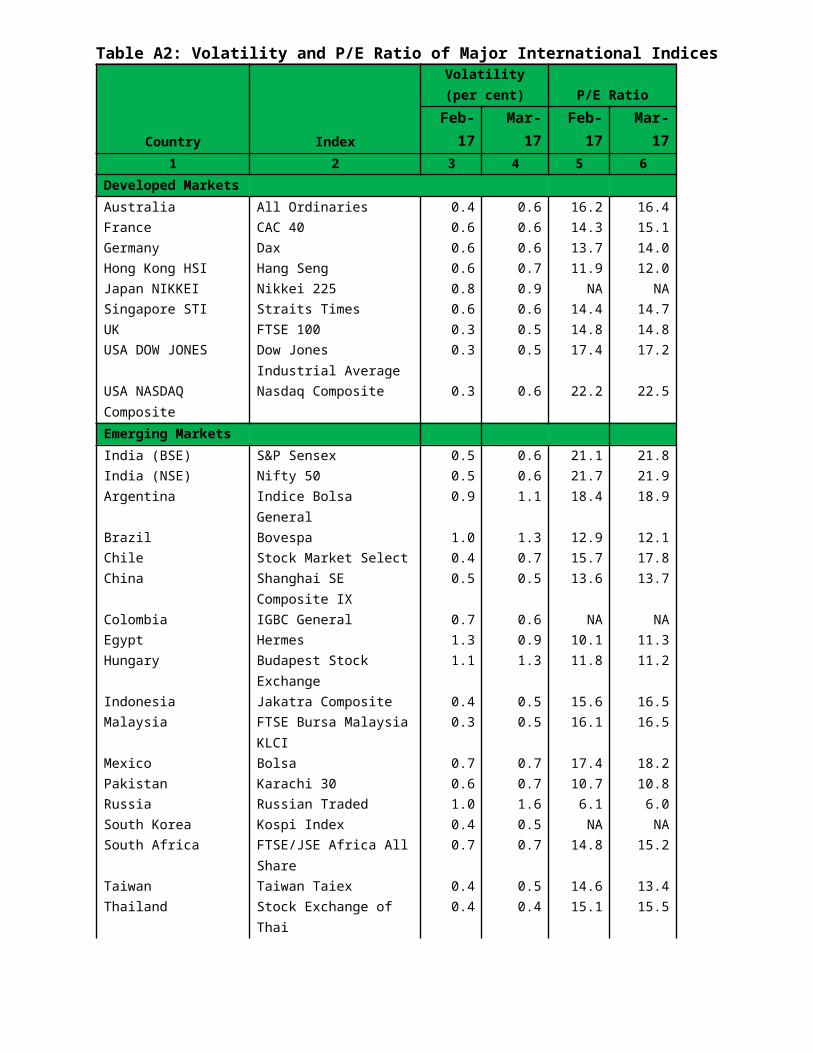
Concerning Consultation and Cooperation and the Exchange of Information (EMMoU), which offers securities regulators new enforcement powers for responding to the challenges arising from recent developments in global financial markets. Both the MMOU and the EMMoU provide a mechanism for securities regulators to share essential investigative material, such as beneficial ownership information, and securities and derivatives transaction records, including banking and brokerage records. The EMMoU, provides for additional enforcement powers that IOSCO believes are necessary for continuing to safeguard the integrity and stability of markets, protect investors, and deter misconduct and fraud. The ACFIT powers, as they are known, will enable members to:A: Obtain and share Audit work papers, communications and other
information relating to the audit or review of financial statements;C: Compel physical attendance for testimony;F: Freeze assets if possible or, if not, advise and provide information on how to freeze assets, at the request of another signatory;I: Obtain and share existing Internet service provider records, including with the assistance of a prosecutor, court or other authority, and to obtain the content of such communications from authorized entities; and T: Obtain and share existing Telephone records, including with the assistance of a court, prosecutor, or other authority, and to obtain the content of such communications from authorized entities. In addition, the EMMoU envisages the obtaining and sharing of existing communications records held by regulated firms. Source: www. iosco.org/news/pdf/IOSCONEWS456.pdf


