+ All Categories
Home > Documents > biblio.ugent.be€¦ · Web viewThe use of diameter distension waveforms as an alternative for...

biblio.ugent.be€¦ · Web viewThe use of diameter distension waveforms as an alternative for...

Date post: 10-Jun-2018
Category:
Upload: hanhu
View: 213 times
Download: 0 times
Share this document with a friend
33
Carotid pulse pressure from diameter waveforms The use of diameter distension waveforms as an alternative for tonometric pressure to assess carotid blood pressure Jan Kips 1,2 , Floris Vanmolkot 3 , Dries Mahieu 1 , Sebastian Vermeersch 2 , Isabelle Fabry 1 , Jan de Hoon 3 , Luc Van Bortel 1 , Patrick Segers 2 1 Heymans Institute of Pharmacology, Ghent University Hospital, Gent, Belgium 2 bioMMeda, IBiTech, Ghent University, Gent, Belgium 3 Center for Clinical Pharmacology, University Hospital Gasthuisberg (KULeuven), Leuven, Belgium Total word count (incl. abstract and references): 4363 Abstract: 257 # figures: 4 # tables: 3 1
Transcript

Carotid pulse pressure from diameter waveforms

The use of diameter distension waveforms as an alternative for tonometric

pressure to assess carotid blood pressure

Jan Kips1,2, Floris Vanmolkot3, Dries Mahieu1, Sebastian Vermeersch2, Isabelle Fabry1, Jan de

Hoon3, Luc Van Bortel1, Patrick Segers2

1 Heymans Institute of Pharmacology, Ghent University Hospital, Gent, Belgium

2 bioMMeda, IBiTech, Ghent University, Gent, Belgium

3 Center for Clinical Pharmacology, University Hospital Gasthuisberg (KULeuven), Leuven,

Belgium

Total word count (incl. abstract and references): 4363

Abstract: 257

# figures: 4

# tables: 3

Correspondence to: Jan Kips, Ghent University, bioMMeda, Institute Biomedical

Technology, De Pintelaan 185, B-9000 Gent, Belgium. Tel: +32/9/3320042; Fax:

+32/9/3324159; e-mail: [email protected]

Keywords: blood pressure, pulse pressure, large arteries, non-invasive assessment,

applanation tonometry, echo-tracking

1

Carotid pulse pressure from diameter waveforms

Abstract

Proper non-invasive assessment of carotid artery pressure ideally uses waveforms recorded at two

anatomical locations: the brachial and the carotid artery. Calibrated diameter distension

waveforms could provide a more widely applicable alternative for local arterial pressure

assessment than applanation tonometry. This approach might be of particular use at the brachial

artery, where the feasibility of a reliable tonometric measurement has been questioned. The aim

of this study was to evaluate an approach based on distension waveforms obtained at the brachial

and carotid arteries. This approach will be compared to the traditional pulse pressures obtained

through tonometry at both the carotid and brachial arteries (used as reference) and the more

recently proposed approach of combining tonometric readings at the brachial artery with linearly

or exponentially calibrated distension curves at the carotid artery. Local brachial and carotid

diameter distension and tonometry waveforms were recorded in 148 subjects (119 women; aged

19-59 yrs). The morphology of the waveforms was compared by the form factor and the root-

mean squared error. The difference between the reference carotid PP and the PP obtained from

brachial and carotid distension waveforms was smaller (0.9(4.9) mmHg or 2.3%) than the

difference between the reference carotid PP and the estimates obtained using a tonometric and a

distension waveform (-4.8(2.5) mmHg for the approach using brachial tonometry and linearly

scaled carotid distension, and 2.7(6.8) mmHg when using exponentially scaled carotid distension

waves). We therefore recommend to stick to one technique on both the brachial and the carotid

artery, either tonometry or distension, when assessing carotid blood pressure non-invasively.

2

Carotid pulse pressure from diameter waveforms

Introduction:

Central (aortic) blood pressure has gained clinical interest, mainly because some studies have

suggested that it has a higher predictive value for cardiovascular events than peripheral (brachial)

blood pressure (Agabiti-Rosei et al. 2007;Chirinos et al. 2005;Dart et al. 2006;McEniery et al.

2008;Roman et al. 2007;Safar et al. 2002;Williams et al. 2006). Carotid blood pressure is often

used as a surrogate for central aortic blood pressure. An invasive study showed carotid pulse

pressure (PP) to differ by only 1.8 mmHg from central aortic PP (Van Bortel et al. 2001) .

Unlike mean arterial pressure (MAP), pulse pressure is not constant throughout the large artery

tree, but increases towards the periphery (Nichols & O'Rourke 2005;Safar & London 1994) ,

implying that brachial pulse pressure will generally be higher than aortic or carotid pulse

pressure. The latter can be obtained non-invasively following a well-known, linear calibration

technique, using applanation tonometry on the brachial and carotid artery combined with brachial

oscillometry (Segers et al. 2005;Verbeke et al. 2005) . However, high-quality tonometric readings

require a well-trained operator and may be more difficult to perform in elderly and particularly

obese patients (Nichols & O'Rourke 2005) .

Recently (Vermeersch et al. 2008), two alternative approaches for estimating carotid artery

pressures, using a combination of applanation tonometry performed at the brachial artery and

either linearly or exponentially calibrated diameter distension waveforms at the carotid artery,

were compared to the more common approach of using applanation tonometry on brachial and

carotid artery. Using calibrated diameter distension waveforms instead of tonometric waveforms

avoids the technical difficulties and necessary operator skills associated with applanation

3

Carotid pulse pressure from diameter waveforms

tonometry (Van Bortel et al. 2001). The assessment of diameter distension waveforms of

superficial arteries can be performed accurately by ultrasound wall tracking algorithms (Hoeks et

al. 1990;Hoeks et al. 1997;Rabben et al. 2002) which requires less training and can more easily

be performed in obese patients. These alternative approaches, however, still rely for calibration

on tonometry readings performed at the level of the brachial artery, of which the feasibility of

performing a reliable tonometric measurement has been questioned recently (O'Rourke, Adji, &

Hoegler 2005;O'Rourke & Takazawa 2009b).

It is the aim of this study to evaluate a methodology for non-invasive estimation of carotid pulse

pressure based solely on diameter distension waveforms obtained at the brachial and carotid

arteries. The results of this approach will be compared to the pulse pressures obtained through

tonometry at both the carotid and brachial arteries and to the more recently proposed approach of

combining tonometric readings at the brachial artery with linearly or exponentially calibrated

diameter distension curves at the carotid artery. As an intermediary step, the morphology of

brachial and carotid tonometry and distension waveforms will be compared and the mean arterial

pressure (MAP) will be computed using either tonometry or distension curves.

4

Carotid pulse pressure from diameter waveforms

Methods:

Study population

Brachial (BA) and common carotid artery (CCA) distension (D) and tonometer (T) waveforms

recorded for two previous studies were used (de Hoon et al. 2003;Vanmolkot, Van Bortel, &

Hoon 2007). A total number of 148 subjects were selected, none of whom had a history of

cerebrovascular or cardiovascular disease, arterial hypertension (>90/140 mmHg), diabetes

mellitus, hyperlipidaemia (total cholesterol >6.5 mmol/l), or were currently pregnant or lactating.

Subjects on regular use of vasoactive drugs were excluded. Subjects were allowed 10-15 min of

rest in a temperature controlled environment before the examinations.

Measurement of local pressure and distension

Brachial oscillometric blood pressure was measured using either an Omron 705IT ( OMRON

Healthcare, Hoofddorp, The Netherlands; 100 subjects), either a Dinamap 950 (Critikon Inc,

Tampa, Florida; 48 subjects). Applanation tonometry was performed using a Millar pen-type

tonometer (SPT 301, Millar Instruments, Houston, Texas) and computer software (SphygmoCor,

Atcor Medical, Sydney, Australia). Distension waveforms were obtained with an ultrasound wall

tracking system (Esaote AU5 or Scanner 350, Esaote-Pie Medical, the Netherlands). An

ultrasound probe holder was used at the brachial artery to ensure that the distension curves were

not deformed by the pressure exerted on the probe.

Waveform calibration

5

Carotid pulse pressure from diameter waveforms

At the brachial artery, both tonometry and distension waveforms were linearly calibrated using

SBP and DBP obtained from oscillometry. For each waveform type, MAP was calculated as the

arithmetic mean of the scaled waveform. Hence, for each subject, two estimates are given: MAPT

obtained from the tonometric waveform, and MAPD obtained using the distension waveform,

respectively.

At the carotid artery, diameter waveforms were calibrated using a linear and an exponential

calibration scheme. Both calibration schemes are based on the assumption that DBP and MAP

remain constant throughout the large arteries. In the linear calibration scheme, the diameter

waveform is calibrated by assigning the minimum and mean value of the curve to the brachial

DBP and MAPT or MAPD, respectively (Van Bortel et al. 2001). For the exponential calibration,

an iterative procedure was followed as first described by Meinders et al (Meinders & Hoeks

2004). In brief, the diameter waveforms are scaled assuming an intrinsic exponential relation

between pressure and diameter: p (t )=pd exp[∝( d2(t )d2

d

−1)],where p(t) is the pressure waveform, d(t) the diameter waveform, pd the diastolic blood pressure,

dd the diastolic diameter and the wall rigidity coefficient. An iterative scheme can be followed

to calculate based on DBP and MAPT.

In summary, by combining brachial and carotid tonometer and distension waveforms, we obtain

four different estimates of carotid PP indicated by the following subscripts:

(i) PTT: using brachial and carotid tonometer waveforms (considered here as the reference

value)

(ii) PTDlin: using brachial tonometer and linearly scaled carotid distension waveforms

(Vermeersch et al. 2008)

6

Carotid pulse pressure from diameter waveforms

(iii) PTDexp: using brachial tonometer and exponentially scaled carotid distension

waveforms (Vermeersch et al. 2008)

(iv) PDD: using linearly scaled brachial and carotid distension waveforms

PTT will be considered as the reference method in further analyses since it is accepted to be the

most accurate non-invasive method to assess local pressure (Van Bortel et al. 2001).

Waveform comparisons

To assess whether scaled diameter waveforms can be used as a surrogate for tonometry

waveforms and to investigate the impact of the different calibration methods, two morphological

parameters are calculated to quantify the overall agreement between the scaled diameter and the

tonometric waves. The root-mean-squared error (RMSE) is a measure of the absolute difference

between the scaled diameter and tonometry waveforms and, as such, allows to quantify how

closely the values of the waveforms match across the entire waveform. RMSE is calculated

between the reference carotid waveform (PTT) and each of the five other approaches (generically

called ‘Papprox’ hereafter) as : RMSE=√[∑1

n

( P¿,i−PTT , i )2

n ]. The form factor (FF) (Chemla et al. 2002) is a measure of how peaked the waveform is, and is

defined as the ratio of the difference between the mean and minimum value of the wave and its

amplitude (maximal – minimal value): FF=mean−minimumamplitude , see Figure 1. Unlike RMSE, FF is

independent of calibration for the linear calibration scheme, which allows a comparison between

carotid distension and tonometry waves, irrespective of which curve was used at the brachial

7

Carotid pulse pressure from diameter waveforms

artery. Moreover, the form factors of brachial and carotid curves are important determinants of

the carotid pulse pressure, which renders them more relevant for this study than the overall match

between two waveforms as expressed by the RMSE-value.

Statistical analysis

Data are presented as mean (standard deviation). Relative errors in mean and peak pressure are

reported with respect to pulse pressure measured at the brachial artery with cuff

sphygmomanometry. Correlation between variables was assessed using Pearson correlation

coefficients. Effects of gender were assessed using ANOVA analysis. P-values lower than 0.05

were considered as statistically significant. To assess the major determinants of the differences in

carotid PP estimates, a stepwise forward multiple linear regression analysis was performed

including age, gender, length, BMI and brachial PP as potential factors. Only the factors that

were significant in univariate analysis were entered into multivariate analysis. A univariate

general linear model was constructed to assess whether the form factor differed between the

carotid and brachial artery, and between distension and tonometer waveforms. All analyses were

performed using SPSS 15 (SPSS Inc., Chicago, IL, USA).

8

Carotid pulse pressure from diameter waveforms

Results:

General clinical characteristics of the population can be found in Table 1.

Comparing waveforms by form factor

When comparing tonometry and distension waveforms at the same location by their form factor,

we find a higher FF for distension than for tonometry waveforms at both the brachial and the

carotid site (Table 2A). When looking at differences between brachial and carotid artery

waveforms, we find brachial FF (both FFD and FFT) to be lower than carotid FF (Table 2A).

However, the relation between the form factor of the tonometer and distension waveforms is not

different for the carotid and brachial artery, as can be seen in Figure 2. The interaction term

between location (brachial or carotid) and technique (tonometer or distension) was not significant

(p=0.75) in the general linear model.

Additionally, both brachial and carotid FF (both FFD and FFT) were significantly higher in

women than in men. This difference remained significant after correction for height and heart

rate.

MAPD versus MAPT

The use of diameter distension waveforms instead of tonometry waveforms to calculate MAP

introduces a difference of 6.2% or 2.8(1.8) mmHg. MAPD was higher than MAPT: 88.8(7.8)

versus 86.0(8.0) mmHg. There was an excellent correlation between both estimates (R=0.97), but

the difference was highly significant (P<0.001), see Figure 3.

9

Carotid pulse pressure from diameter waveforms

Carotid pulse pressure

Table 2B lists the resulting carotid pulse pressure values for the different approaches, as well as

the RMSE values associated with each approach. PDD, the pressure waveform obtained via

linearly scaled diameter waveforms at the brachial and carotid artery, yields the carotid PP closest

to the reference technique: 40.8 (7.8) mmHg compared to 39.9 (8.7) mmHg for PTT. The

difference between both techniques was depending on age only (Table 3). Figure 4 shows the

correlation between the reference carotid PP (PPTT) and the value obtained with three other

approaches, as well as the corresponding Bland-Altman plots. PTDlin, the approach using brachial

tonometry and linearly scaled carotid diameter waveforms yielded the highest correlation

(R=0.97) and the smallest RMSE with the reference technique. However, PTDlin underestimates

the carotid PP on average by 4.8 mmHg.

Discussion:

The results from the present study suggest that, when diameter distension waves are used as an

alternative to tonometry pressure readings at the carotid and/or brachial arteries, it is

recommended to measure diameter distension waves at both the brachial and carotid artery,

instead of combining tonometer waves at one artery with distension waves at the other artery.

Although previous studies have assessed carotid pressure using only diameter distension waves

(Van Bortel et al. 2001) or using brachial tonometry and carotid distension waves (Vermeersch et

al. 2008), an approach in which carotid pulse pressure is calculated using brachial and carotid

distension curves has not been tested before. Given the reported problems with brachial

tonometry, this approach might have clinical relevance. Furthermore, it should be noted that

10

Carotid pulse pressure from diameter waveforms

calibrated tonometric curves might not exactly coincide with invasively measured pressure

waves, due to limitations inherent to the principle of applanation tonometry. In theory, there

should be a constant balance between (internal) blood pressure and applied pressure, i.e. a

constant position throughout the cardiac cycle. This creates a problem during peak and late

systole where the rebound may induce temporarily an outward motion and, hence, an

underestimation of blood pressure. Likewise a pressure overestimation can be anticipated in early

systole. Another issue with applanation tonometry is the questioned reliability in obese subjects.

The tonometer has to sense through more (fatty) tissue, and the artery cannot confidently be

flattened as there is less direct support of bone behind the artery.

Brachial and carotid distension waveforms were found to be significantly “flatter” (i.e., having a

higher form factor) than the corresponding tonometric waves. The fact that distension waveforms

were flatter than tonometric waveforms can be explained by the non-linear pressure-diameter

relationship, which blunts at higher pressures (i.e., the vessel distends less with increasing

pressure due to the increasing recruitment of collagen fibers in the stretched vessel wall). This

non-linear relation between pressure and diameter was the rationale for using an exponential

calibration scheme (Meinders & Hoeks 2004). A particular consequence of the difference in

“peakedness” between tonometry and diameter-tracings is that the MAP determined from the

area under the brachial distension waveform is on average 2.8 mmHg (6.2% of the pulse

pressure) higher than MAP obtained via brachial tonometer waveforms. This difference in MAP

has an important impact on the differences between the various carotid pressure waves, since

each calibration method on the carotid artery is strictly dependent on the (brachial) MAP.

Although the two MAP-estimates correlate well, this correlation is highly enhanced by the use of

11

Carotid pulse pressure from diameter waveforms

the same (sphygmomanometrically obtained) SBP and DPB to scale the brachial pressure and

distension waveforms for each subject. To eliminate this effect, one could compare MAPT-DBP

to MAPD-DBP. Given, however, the definition of the form factor and the fact that PP at the

brachial artery is the same, irrespective the waveform measuring technique, the ‘unscaled’

correlation is nothing but the relation between FFD and FFT at the brachial artery, which is

displayed in Figure 2.This correlation is notably lower (R=0.47).

When comparing the different carotid pulse pressure values, the difference between PPDD and

PPTT is the lowest, being 0.9 (4.9) mmHg or 2.3%. It is even lower than the difference between

MAPD and MAPT, which seems to imply that a part of the difference introduced by using a

distension waveform at the brachial level is compensated by the second use of a distension

waveform at the carotid artery. This can easily be understood when taking into account that

P PCCA=FFBA

FFCCAPP BA (Segers et al. 2009). This illustrates that the pulse pressure at the carotid

artery is determined by the ratio of the brachial and carotid form factor. Therefore, systematic

differences in FFBA and FFCCA are partially compensated for. MAP, on the other hand, is

determined by the brachial form factor only. When using tonometer curves at both sites, the ratio

FFBA/FFCCA is 0.88 (see Table 2A) versus 0.90 when using distension data at both sites,

explaining why the difference between PPDD and PPTT is smaller than the difference between

PPTDlin or PPTDexp with PPTT, respectively (where the ratio FFBA/FFCCA is 0.78 and 0.92,

respectively).

Using brachial tonometer and carotid distension waves to calculate carotid pulse pressure (PPTDlin)

yielded the estimate with the highest correlation with PPTT, but a considerable underestimation of

12

Carotid pulse pressure from diameter waveforms

4.8(2.5) mmHg when compared to PPTT. This in line with the results of Vermeersch et al., who

found the same approach to underestimate PPTT by 6.4 mmHg in a large population of middle-

aged people (Vermeersch et al. 2008). They found that the underestimation was highly dependent

on brachial PP, with increasing underestimation for higher brachial PP. We could confirm this

dependency on brachial PP in our population (Table 3), which also explains why our PPTDlin

performs somewhat better than in the study of Vermeersch et al., where the average brachial

pulse pressure was higher (56.2 vs. 45.2 mmHg).

The added value of an exponential calibration scheme for carotid diameter distension waves in

combination with brachial artery tonometry is arguable. Although exponential calibration yields a

form factor and pulse pressure closer to the reference (FFT and PPTT, respectively), the overall fit

between the exponentially scaled diameter waveform and the tonometric reference waveform was

poorer than for a linearly scaled diameter waveform (Table 2B).

Theoretically, two other –non-reported - approaches to obtain a carotid pressure wave are

possible: a first one combining brachial distension curves with carotid tonometry, and a second

one using linearly scaled brachial distension and exponentially scaled carotid distension curves.

Both methods were tested on the study population, but yielded considerable overestimations of

carotid PP: 16% and 25%, respectively (data not shown).

One important limitation of this study is the absence of invasive pressure data as a reference to

compare the results of the different non-invasive approaches. Furthermore, the limited sample

size and age range of our population may hamper the generalizability of our results. A final point

of debate is the questioned practical feasibility of brachial applanation tonometry as argued by

13

Carotid pulse pressure from diameter waveforms

O’Rourke and colleagues (O'Rourke, Adji, & Hoegler 2005;O'Rourke & Takazawa 2009a) .

Figure 3 shows that the relation between the form factor of the tonometer and distension

waveforms is not different for the carotid and brachial artery in our population. Since it can be

reasonably assumed that the reliability of distension measurements is the same at the carotid and

brachial artery, this may suggest that applanation tonometry was acquired with a similar degree

of reliability at the brachial and carotid artery and supports the feasibility of applanation

tonometry as a reliable technique to obtain non-invasive pressure waveforms at the brachial

artery.

In conclusion we can state that, when aiming to assess carotid artery pressure non-invasively, the

use of linearly scaled diameter distension waves at the brachial and carotid artery introduces only

a small error (0.9 mmHg) compared to the gold standard approach with brachial and carotid

tonometry curves. Therefore, it is recommended to stick to one technique, either tonometry or

diameter distension waves, rather than using a mix of both techniques.

Acknowledgements

Jan Kips is a recipient of Vlaamse Interuniversitaire Raad research grant VLADOC 2007-0013-

396.

14

Carotid pulse pressure from diameter waveforms

Figure captions

Figure 1: Distension waves (black) obtained via echo-tracking are less peaked than tonometric

waves (grey). The tonometric wave was normalized, whereas the distension wave was calibrated

to have same mean and minimal value as the tonometric wave.

Figure 2: Relation between distension and tonometric form factors at brachial and carotid artery:

regression plots (A,B) and Bland-Altman plots (C,D).

Figure 3: Agreement between the (brachial) mean arterial pressure obtained via tonometric

waves (MAPT) and the MAP obtained via distension waves (MAPD). Regression plot (left) and

Bland-Altman plot (right).

Figure 4: Relation between the different estimates of carotid pulse pressure: regression plots (A-

C) and Bland-Altman plots (D-F).

15

Carotid pulse pressure from diameter waveforms

Tables

Table 1: General description of the study population

Table 2: 2A:Mean (SD) values of brachial and carotid form factors derived from tonometer

(FFT), linearly scaled distension waves (FFDlin) and exponentially scaled distension waves

(FFDexp). 2B: Mean (SD) values of PP and RMSE for the different carotid pressure waveforms.

PP=Pulse Pressure;RMSE=root-mean-squared error.

Table 3: Influence of confounding factors on the difference in carotid pulse pressure estimates.

HR=heart rate [bpm]; PPbra=brachial PP from oscillometry [mmHg].

16

Carotid pulse pressure from diameter waveforms

Table 1

  Mean±SDsubjects (male/female) 148 (29/119)

Age [years] 29.6 (10.1)

Weight [kg] 66.8 (11.6)

Length [cm] 171.0 (7.8)

BMI [kg/m²] 22.8 (3.3)

SBP [mmHg] 113.2 (9.8)

DBP [mmHg] 68.0 (7.1)

PP [mmHg] 45.2 (7.4)

Heart rate [bpm] 64.4 (9.0)

Table 2A

  mean (SD)brachial FFT 40.0 (3.8)

FFD 46.2 (3.3)

carotid FFT 45.4 (3.3)

FFDlin 51.4 (3.0)

FFDexp 43.6 (6.3)

17

Carotid pulse pressure from diameter waveforms

Table 2B

PP [mmHg] RMSE [mmHg]  Mean SD Mean SD

PTT 39.9 8.7       

PDD 40.8 7.8 5.0 2.1

PTDlin 35.1 7.3 3.5 1.8

 PTDexp 42.5 12.7 3.9 2.5

Table 3

Variable Determinant (cumulative) R²

SE normalised

PPDD-PPTT Age 0.10-

0.16 0.04 -0.32

PPTDlin-PPTT PPbra 0.21-

0.13 0.02 -0.39

Age + PPbra 0.29-

0.09 0.02 -0.36

Age + HR + PPbra 0.34 0.06 0.017 0.24

PPTDexp-PPTT Age 0.42 0.36 0.04 0.53

Age + HR 0.51 0.21 0.04 0.34

Age + HR +

PPbra 0.54 0.18 0.05 0.20

References

18

Carotid pulse pressure from diameter waveforms

Agabiti-Rosei, E., Mancia, G., O'Rourke, M. F., Roman, M. J., Safar, M. E., Smulyan, H., Wang, J. G., Wilkinson, I. B., Williams, B., & Vlachopoulos, C. 2007, "Central blood pressure measurements and antihypertensive therapy a consensus document", Hypertension, vol. 50, no. 1, pp. 154-160.

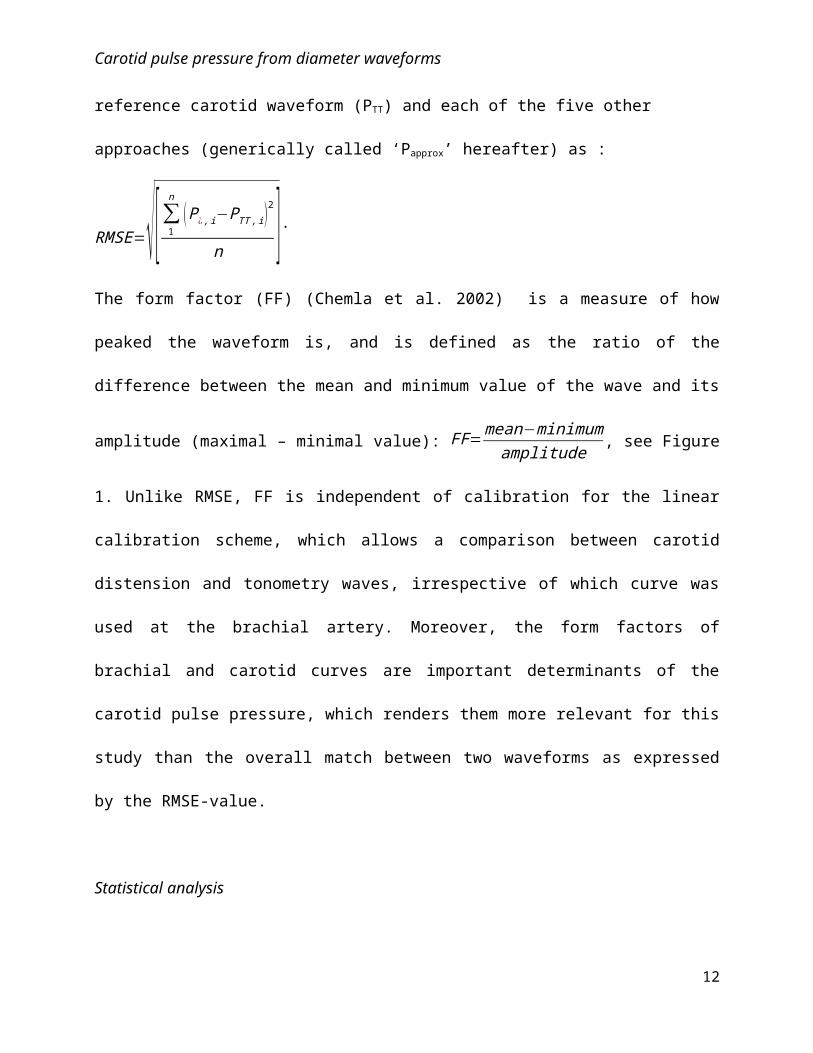
Chemla, D., Hebert, J. L., Aptecar, E., Mazoit, J. X., Zamani, K., Frank, R., Fontaine, G., Nitenberg, A., & Lecarpentier, Y. 2002, "Empirical estimates of mean aortic pressure: advantages, drawbacks and implications for pressure redundancy", Clinical Science, vol. 103, no. 1, pp. 7-13.

Chirinos, J. A., Zambrano, J. P., Chakko, S., Veerani, A., Schob, A., Willens, H. J., Perez, G., & Mendez, A. J. 2005, "Aortic pressure augmentation predicts adverse cardiovascular events in patients with established coronary artery disease", Hypertension, vol. 45, no. 5, pp. 980-985.

Dart, A. M., Gatzka, C. D., Kingwell, B. A., Willson, K., Cameron, J. D., Liang, Y. L., Berry, K. L., Wing, L. M. H., Reid, C. M., Ryan, P., Beilin, L. J., Jennings, G. L. R., Johnston, C. I., Mcneil, J. J., MacDonald, G. J., Morgan, T. O., & West, M. J. 2006, "Brachial blood pressure but not carotid arterial waveforms predict cardiovascular events in elderly female hypertensives", Hypertension, vol. 47, no. 4, pp. 785-790.

de Hoon, J. N., Willigers, J. M., Troost, J., Struijker-Boudier, H. A., & Van Bortel, L. M. 2003, "Cranial and peripheral interictal vascular changes in migraine patients", Cephalalgia, vol. 23, no. 2, pp. 96-104.

Hoeks, A. P. G., Brands, P. J., Smeets, F. A. M., & Reneman, R. S. 1990, "Assessment of the Distensibility of Superficial Arteries", Ultrasound in Medicine and Biology, vol. 16, no. 2, pp. 121-128.

Hoeks, A. P. G., Willekes, C., Boutouyrie, P., Brands, P. J., Willigers, J. M., & Reneman, R. S. 1997, "Automated detection of local artery wall thickness based on M-line signal processing", Ultrasound in Medicine and Biology, vol. 23, no. 7, pp. 1017-1023.

McEniery, C. M., McDonnell, B., Munnery, M., Wallace, S. M., Rowe, C. V., Cockcroft, J. R., & Wilkinson, I. B. 2008, "Central pressure: Variability and impact of cardiovascular risk factors - The Anglo-Cardiff Collaborative Trial II", Hypertension, vol. 51, no. 6, pp. 1476-1482.

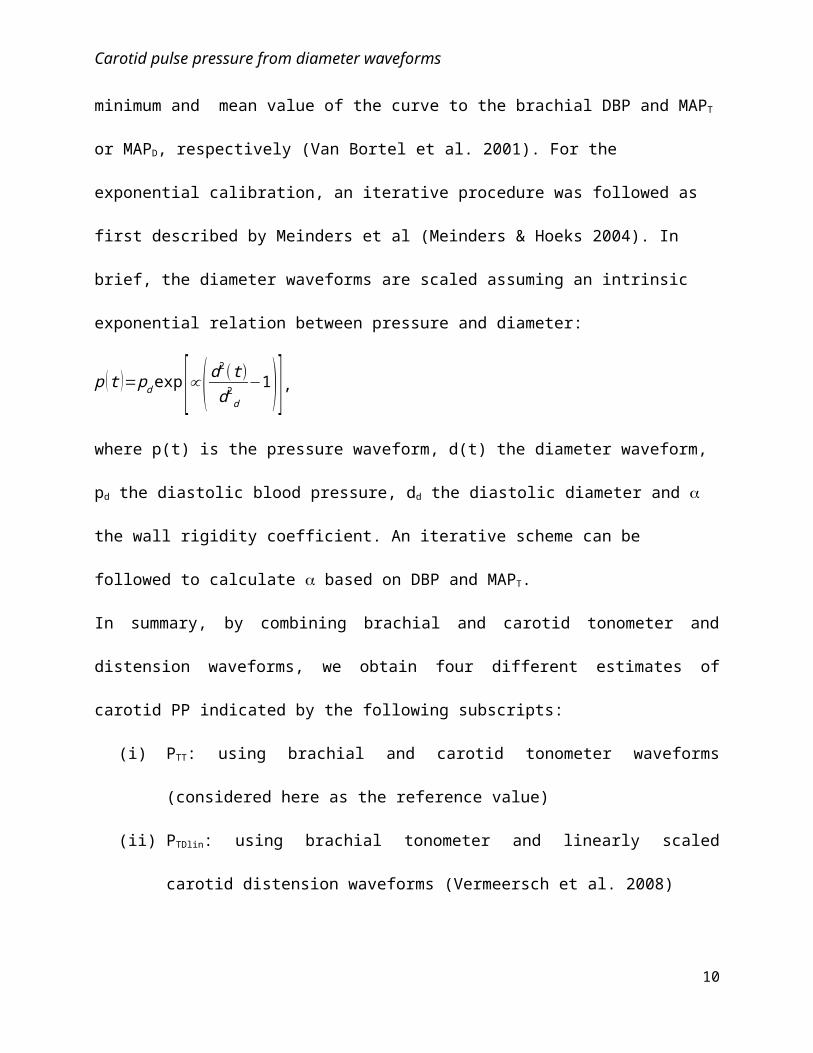
Meinders, J. M. & Hoeks, A. P. G. 2004, "Simultaneous assessment of diameter and pressure waveforms in the carotid artery", Ultrasound in Medicine and Biology, vol. 30, no. 2, pp. 147-154.

Nichols, W. W. & O'Rourke, M. F. 2005, McDonald's Blood Flow in Arteries.

O'Rourke, M. F., Adji, A., & Hoegler, S. 2005, "Calibration of noninvasively recorded upper-limb pressure waves", Hypertension, vol. 46, no. 5, p. E15.

O'Rourke, M. F. & Takazawa, K. 2009b, Flawed measurement of brachial tonometry for calculating aortic pressure?.

O'Rourke, M. F. & Takazawa, K. 2009a, Flawed measurement of brachial tonometry for calculating aortic pressure?.

Rabben, S. I., Bjaerum, S., Sorhus, V., & Torp, H. 2002, "Ultrasound-based vessel wall tracking: An auto-correlation technique with RF center frequency estimation", Ultrasound in Medicine and Biology, vol. 28, no. 4, pp. 507-517.

19

Carotid pulse pressure from diameter waveforms

Roman, M. J., Devereux, R. B., Kizer, J. R., Lee, E. T., Galloway, J. M., Ali, T., Umans, J. G., & Howard, B. V. 2007, "Central pressure more strongly relates to vascular disease and outcome than does brachial pressure - The strong heart study", Hypertension, vol. 50, no. 1, pp. 197-203.

Safar, M. E., Blacher, J., Pannier, B., Guerin, A. P., Marchais, S. J., Guyonvarc'h, P. M., & London, G. M. 2002, "Central pulse pressure and mortality in end-stage renal disease", Hypertension, vol. 39, no. 3, pp. 735-738.

Safar, M. E. & London, G. M. 1994, The arterial system in human hypertension, Blackwell Scientific Publications.

Segers, P., Mahieu, D., Kips, J., Rietzschel, E., De Buyzere, M., De Bacquer, D., Bekaert, S., De Backer, G., Gillebert, T., Verdonck, P., & Van Bortel, L. 2009, "Amplification of the Pressure Pulse in the Upper Limb in Healthy, Middle-Aged Men and Women", Hypertension, vol. 54, no. 2, pp. 414-420.

Segers, P., Rietzschel, E., Heireman, S., De Buyzere, M., Gillebert, T., Verdonck, P., & Van Bortel, L. 2005, "Carotid tonometry versus synthesized aorta pressure waves for the estimation of central systolic blood pressure and augmentation index", American Journal of Hypertension, vol. 18, no. 9, pp. 1168-1173.

Van Bortel, L. M., Balkestein, E. J., van der Heijden-Spek, J., Vanmolkot, F. H., Staessen, J. A., Kragten, J. A., Vredeveld, J. W., Safar, M. E., Struijker-Boudier, H. A., & Hoeks, A. P. 2001, "Non-invasive assessment of local arterial pulse pressure: comparison of applanation tonometry and echo-tracking", Journal of Hypertension, vol. 19, no. 6, pp. 1037-1044.

Vanmolkot, F. H., Van Bortel, L. M., & Hoon, J. N. 2007, "Altered arterial function in migraine of recent onset", Neurology, vol. 68, no. 19, pp. 1563-1570.

Verbeke, F., Segers, P., Heireman, S., Vanholder, R., Verdonck, P., & Van Bortel, L. M. 2005, "Noninvasive assessment of local pulse pressure - Importance of brachial-to-radial pressure amplification", Hypertension, vol. 46, no. 1, pp. 244-248.

Vermeersch, S. J., Rietzschel, E. R., De Buyzere, M. L., De Bacquer, D., De Backer, G., Van Bortel, L. M., Gillebert, T. C., Verdonck, P. R., & Segers, P. 2008, "Determining carotid artery pressure from scaled diameter waveforms: comparison and validation of calibration techniques in 2026 subjects", Physiological Measurement, vol. 29, no. 11, pp. 1267-1280.

Williams, B., Lacy, P. S., Thom, S. M., Cruickshank, K., Stanton, A., Collier, D., Hughes, A. D., & Thurston, H. 2006, "Differential impact of blood pressure-lowering drugs on central aortic pressure and clinical outcomes - Principal results of the Conduit Artery Function Evaluation (CAFE) study", Circulation, vol. 113, no. 9, pp. 1213-1225.

20

Carotid pulse pressure from diameter waveforms

21


Recommended