47
? What Do I What Do I use? use? Numasizin Numasizin g g
| Date post: | 16-Dec-2015 |
| Category: |
Documents |
| Upload: | sophia-parrish |
| View: | 212 times |
| Download: | 0 times |

?
What Do I What Do I use?use?
NumasizingNumasizing

Compressed air is an energy medium thatCompressed air is an energy medium that must be conserved, Numasizing has been must be conserved, Numasizing has been developed to use this resource more developed to use this resource more effectively.effectively.
What Is Numasizing?What Is Numasizing?

What Is Numasizing?What Is Numasizing?
Numasizing is a technique which takes into Numasizing is a technique which takes into account all of the physical specifications account all of the physical specifications of a of a circuit and results circuit and results in a in a tailor made tailor made circuit designed circuit designed
to the customer’s to the customer’s targets.targets.

What Is Numasizing?What Is Numasizing?
Numasizing is not based on theoretical Numasizing is not based on theoretical approach or mathematical model. A data base approach or mathematical model. A data base of over 250,000 test firings of cylinders allows of over 250,000 test firings of cylinders allows Numatics to predict components and Numatics to predict components and pressures with confidence.pressures with confidence.

The Numasizing Process is...The Numasizing Process is...
A + B + C = DA + B + C = D
A.A. Establishing Customer ObjectivesEstablishing Customer Objectives
B.B. Delineating All Circuit SpecificationsDelineating All Circuit Specifications
C.C. Selecting All Circuit ComponentsSelecting All Circuit Components
D.D. Results in Obtaining Customer GoalsResults in Obtaining Customer Goals

The Numasizing Process is...The Numasizing Process is...
A.A. Establishing Customer ObjectivesEstablishing Customer Objectives
1.1. Increase ProductivityIncrease Productivity
2.2. Optimum Energy UtilizationOptimum Energy Utilization
3.3. Minimum Component SizeMinimum Component Size
The Numasizing Process is...The Numasizing Process is...
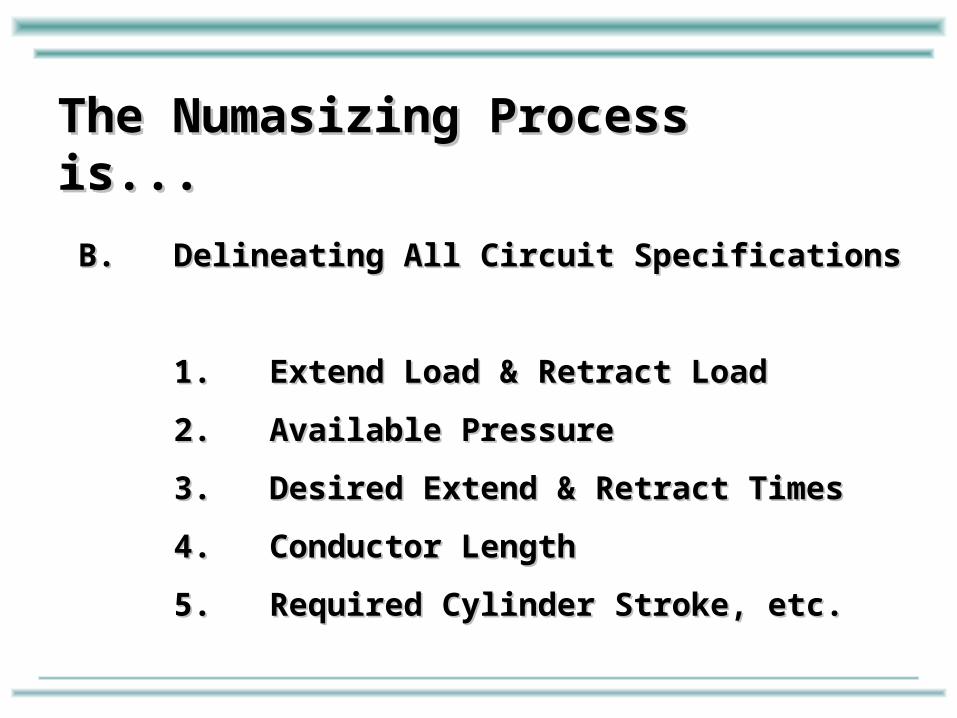
B.B. Delineating All Circuit SpecificationsDelineating All Circuit Specifications
1.1. Extend Load & Retract LoadExtend Load & Retract Load
2.2. Available PressureAvailable Pressure
3.3. Desired Extend & Retract TimesDesired Extend & Retract Times
4.4. Conductor LengthConductor Length
5.5. Required Cylinder Stroke, etc.Required Cylinder Stroke, etc.

Generating
Numasizing Computer Bank
INTO….The Numasizing Process is...The Numasizing Process is...
C.C. Selecting All Circuit ComponentsSelecting All Circuit Components
All components in the pneumatic system All components in the pneumatic system starting at the valve through the exhaust starting at the valve through the exhaust port such as the valve, fittings, conductor, port such as the valve, fittings, conductor, regulator and actuator.regulator and actuator.

The Numasizing Process...The Numasizing Process...
D.D. Results in Obtaining Customer GoalsResults in Obtaining Customer Goals
1.1. Actuator Response TimeActuator Response Time
2.2. Compressed Air CostCompressed Air Cost
3.3. Air ConsumptionAir Consumption
4.4. Pressure OptimizationPressure Optimization
5.5. Compatible SizesCompatible Sizes

Effecting PneumaticsEffecting Pneumatics

Knowledge of a pneumatic circuit design begins with an understanding of the term
Cv is essentially a dimensionless number used to express the CONDUCTANCE VALUE of a pneumatic device.All fixed orifice devices in a pneumatic system have a conductance value and therefore a certain capability to flow.
The larger the CThe larger the Cvv --- the greater the flow. --- the greater the flow.
Typically, the greater the CTypically, the greater the Cvv of the entire circuit, of the entire circuit,
the faster the devices in the circuit will respond.the faster the devices in the circuit will respond.
CCvv

CVV = Valve CV
CVFC = Flow Control CV
CVO = Orifice CV
CVP = Pipe CV
CVC = Cylinder Port CV
CVF = Fitting CV
CVV = 4.0 CVFC = 4.5
2.99
CVO = 1.12
1.05
CVP = 4.8 CVC = 6.0 CVF = 7.0
1.03
1.01
2.99
2.47
2.19
2.06
2.000
CVV = 4.0 CVFC = 4.5 CVO = 4.37 CVP = 4.8 CVC = 6.0 CVF = 7.0
1.000
CVV CVFC CVS2 2 2
1 1 1 + =
4 4.5 2.992 2 2
1 1 1 + =

Relation Between CRelation Between Cvsvs & Actuator & Actuator Stroke Time (T)Stroke Time (T)
Stroke time is inversely proportional to Cvs
Stroke time is directly proportional to system exhaust volume
1,092 ft/sec (vel of air - unconfined)
400 ft/sec (vel of air - in a straight conductor)
80 in/sec (vel of actuator piston & rod)
Cvs T (sec) 1 4.0 2 2.0 4 1.0 8 0.5

CCvv of Fittings are Established by of Fittings are Established by Calculating an Equivalent Conductor Calculating an Equivalent Conductor
Length Utilizing a Length Utilizing a K Factor Factor
Once the ID and the line length has been determined --- plus all the fittings equivalent length has been added, we can calculate the Cv of the CONDUCTOR.
Formula: Le’ = n K d”
Equivalent Length = number of fittings x K (feet) factor x ID (inches)
Formula: Le + Lc = Lt
Equivalent Length + Conductor Length = Total Length

CCvv of Fittings are Established by of Fittings are Established by Calculating an Equivalent Conductor Calculating an Equivalent Conductor
Length Utilizing a Length Utilizing a K Factor FactorFitting K Values:Device K Factor
Swing Check Valves, fully open 11
90 Degree Standard Elbow 2.545 Degree Standard Elbow 1.390 Degree Long Radius Elbow 1.5Reducer (1 Size) 1.5Enlarger (1 Size) 2“Y” Fitting 1
Standard TeeFlow Through Run 1.5Flow Through Branch 5

ELBOWSBRANCH TEE K = 5
BENDS
10 x I.D. minimumK = 0
K = 1.5RUN TEE
x
K = 0
K = 1K = 1 Y Fitting
R=3 x I.D. Long Radius K =1.5R=1.5 x I.D. Std. Elbow K = 2.5R=0 x I.D. SHARP 90° K = 5.0
The more significant the change in flow direction, the greater the restriction and therefore the greater the K factor.

Formula: Cv (port)= 23 x Ds
Ds = smallest I.D. in a port
2
To calculate Cv we need to determine the smallest I.D. (DS) of whatever component is in the port of the cylinder.
Reducing the port size with a bushing reduces the flow capability of the port.
The smallest orifice will determine the effective Cv .
What is the cylinder’s CWhat is the cylinder’s Cv v ??
C3.0
3/8 NPT
1/4 NPT
ID .364 - 1/4 NPT Pipe, SCH .40vC3.0C5.6v
ID .493 - 3/8 NPT PipeSCH. 40

.406” ID - ControllinControlling g DimensioDimensionn
Ftg. 1/2 Tube to 3/8 NPT ID = .406
1/2 Steel Tube - .43” ID
3/8 NPT
How shall we decide which ID conductor to use?
The CThe Cv v of a cylinder port is based on the of a cylinder port is based on the
smallest I.D. entering that portsmallest I.D. entering that port

.406” ID
3/8 NPT
1/2 Nylon Tube = .38” ID -- NOW becomes the Controlling Controlling DimensionDimension for the CYLINDER PORT.
A fitting that accepts steel tubing will have a larger effective orifice than a fitting for plastic or poly tubing because the wall thickness for plastic / poly tubing is so much greater.
The CThe Cv v of a cylinder port is based on the of a cylinder port is based on the
smallest I.D. entering that portsmallest I.D. entering that portFtg. 1/2 Tube to 3/8 NPT ID = .406

Flow
Flow
Flow
Flow
Flow
Flow
Flow
Flow
CCdd = 0.98 = 0.98 CCvv = 28.8d = 28.8d 22
CCdd = 0.92 = 0.92 CCvv = 27.0d = 27.0d 22
CCdd = 0.82 = 0.82 CCvv = 24.1d = 24.1d 22
CCdd = 0.80 = 0.80 CCvv = 23.5d = 23.5d 22
CCdd = 0.72 = 0.72 CCvv = 21.2d = 21.2d 22
CCdd = 0.65 = 0.65 CCvv = 19.1d = 19.1d 22
CCdd = 0.61 = 0.61 CCvv = 18.0d = 18.0d 22
CCdd = 0.53 = 0.53 CCvv = 15.6d = 15.6d 22
Various orifice discharge coefficients Cd and their related Cv
All openings = d” (diameter)All openings = d” (diameter)

Optimized Drilling for Intersecting Optimized Drilling for Intersecting HolesHoles

There is an optimum conductor ID for each application.
Choose the best commercially available size.
Too small a conductor ID and there is RESTRICTION; too large and it becomes a VOLUME CHAMBER.
The LENGTH of the conductor now must be considered.
ConductorI.D.
Time
0
0
3/16” I.D. Tubing
1/16” I.D. Tubing
1/8” I.D. Tubing

The Bends - a practical example:The Bends - a practical example:Given: 3/8 NPT Sch.40 pipe has an I.D. of 0.493” or essentially 1/2”
Conductor Length Cv
10’ (3/8 NPT) 3.0
20’ (3/8 NPT) 2.1
30’ (3/8 NPT) 1.75
The direct distance between the valve and the cylinder is 10’.
We choose to pipe the circuit with an additional 10’ (because it looks better).
If we used (8) 90 degree standard elbows (K=2.5) between the valve and
cylinder, it would have an equivalent length of 10’:
Le’ = nKd”
Le’ = 8 x 2.5 x 1/2” = 10’
We have penalized the cylinders’ speed by reducing the efficiency of the circuit.
By identifying the weak link, we can improve our circuit.

The most common way of adjusting a cylinder’s speed is with a FLOW CONTROL.
FREE FLOW
C BOTTOM PORTL
TO CYLINDER
SizeModel
Number *Free Flow
Controlled Flow
1/4 NPTF3/8 NPTF1/2 NPTF3/4 NPTF
2FC23FC24FC35FC3
2.32.76.07.5
2.02.45.56.0
MODEL SELECTION AND FLOW CAPACITY (CMODEL SELECTION AND FLOW CAPACITY (CVV) CHART) CHART
** For optional bottom port, add B to model number (e.g..., 4FC3B
A flow control cannot conserve compressed air, reduce force, or speed up a circuit. If utilize bottom port If utilize bottom port
option:option:2.442.866.367.95
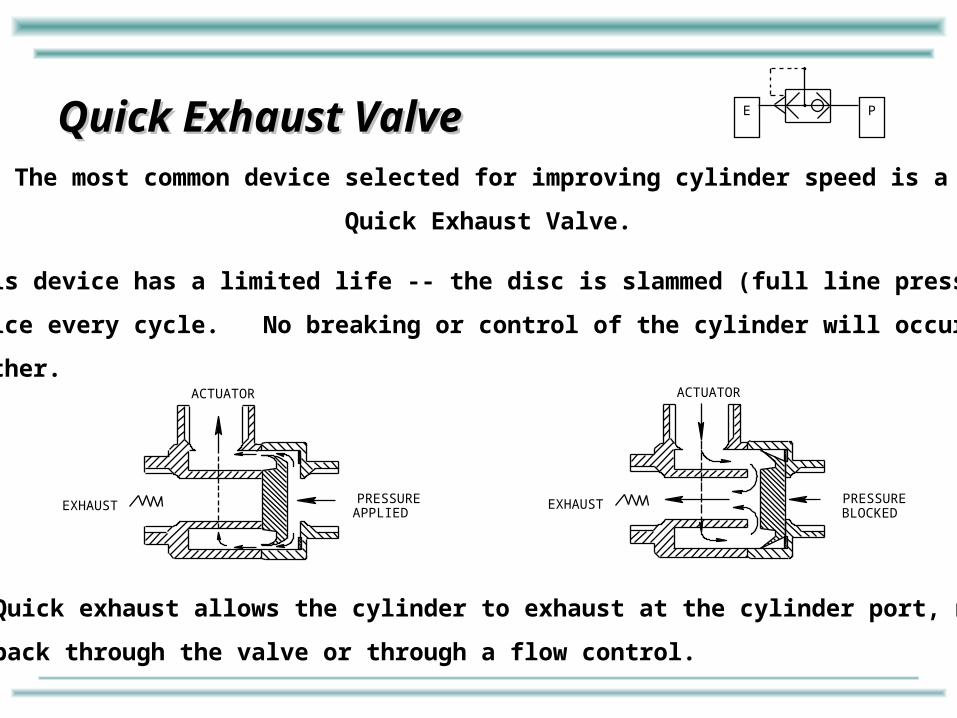
Quick Exhaust ValveQuick Exhaust ValveThe most common device selected for improving cylinder speed is a
Quick Exhaust Valve.
PRESSUREAPPLIED
ACTUATOR
EXHAUST PRESSUREBLOCKED
ACTUATOR
EXHAUST
This device has a limited life -- the disc is slammed (full line pressure)
twice every cycle. No breaking or control of the cylinder will occur
either.
Quick exhaust allows the cylinder to exhaust at the cylinder port, not
back through the valve or through a flow control.
E P

LeLxFLf
Pe = 75 Pr = 75
Loads on a CylinderLoads on a Cylinder On any cylinder, there are threeLOADS resisting movement. Thecylinder must overcome each load before it can extend or retract.
Let’s examine each load separately.
Cylinders, typically, must have some friction in sealing the piston against the cylinder wall and also the rod --- Load Lf.
Work that the cylinder performs is expressed as Le for extend and Lr for retract directions of movement.
The crucial load, however, is Lx --- the EXHAUST BACK PRESSURELOAD.
FLf
Lx Lr
Pe = 75 Pr = 75

Return Stroke
LOAD10 # in 0.45 SEC
75 PSIG
Extend Stroke
SupplyExhaust
LOAD60 # in .4 SEC
75 PSIG
SAMPLE PROBLEM:Move a load in the specific times, given 75 psig supply.
Cylinder Response Cylinder Response Time in SecondsTime in Seconds
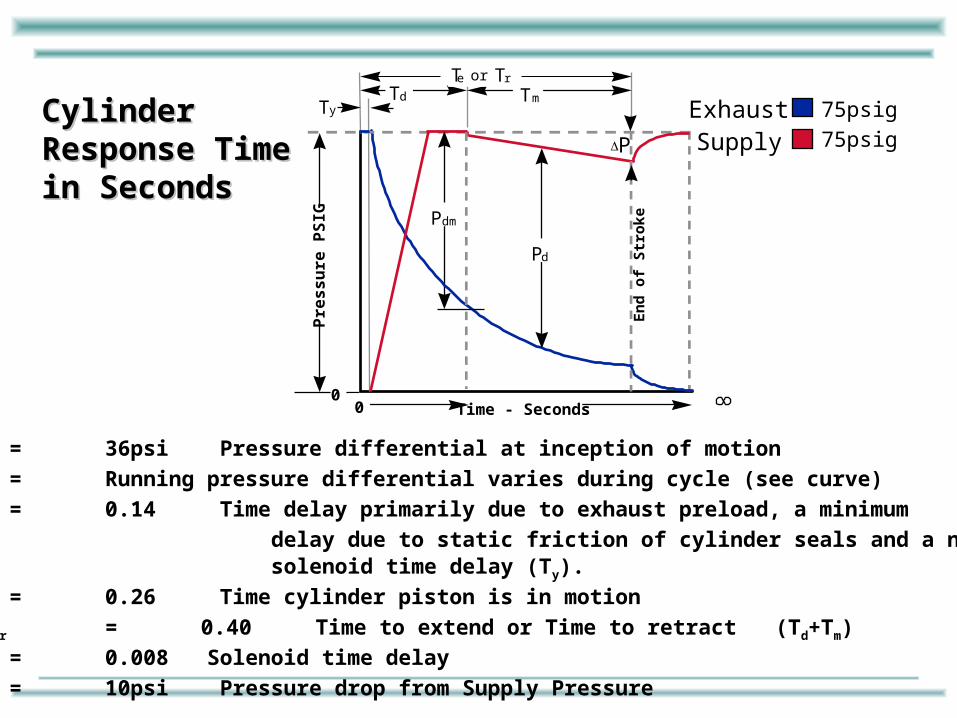
ExhaustSupply
75psig
75psig
Pdm = 36psi Pressure differential at inception of motionPd = Running pressure differential varies during cycle (see curve)Td = 0.14 Time delay primarily due to exhaust preload, a minimum
delay due to static friction of cylinder seals and a negligible solenoid time delay (Ty).
Tm = 0.26 Time cylinder piston is in motionTe or Tr = 0.40 Time to extend or Time to retract (Td+Tm)Ty = 0.008 Solenoid time delayP = 10psi Pressure drop from Supply Pressure
Pd
TdTy
P
Pdm
mT
En
d o
f S
trok
e
Pre
ssu
re P
SIG
Time - Seconds00
TT re or

LeLxFLf
Pe = 49 Pr = 21
FLf
Lx Lr
Pe = 49 Pr = 21
Pressures Fit The Load Pressures Fit The Load
Select the cylinder pressures based on required force.
Consider what the cylinder must do in each direction and select the required pressure for each individual action.

Extend Stroke LOAD60 # in 0.40 SEC
21 PSIG
49 PSIG
SupplyExhaust
LOAD10 # in 0.45 SEC
Return Stroke
21 PSIG
49 PSIG
Now that the ideal pressures have been selected, what results can beobserved?
Cylinder Response Cylinder Response Time in SecondsTime in Seconds
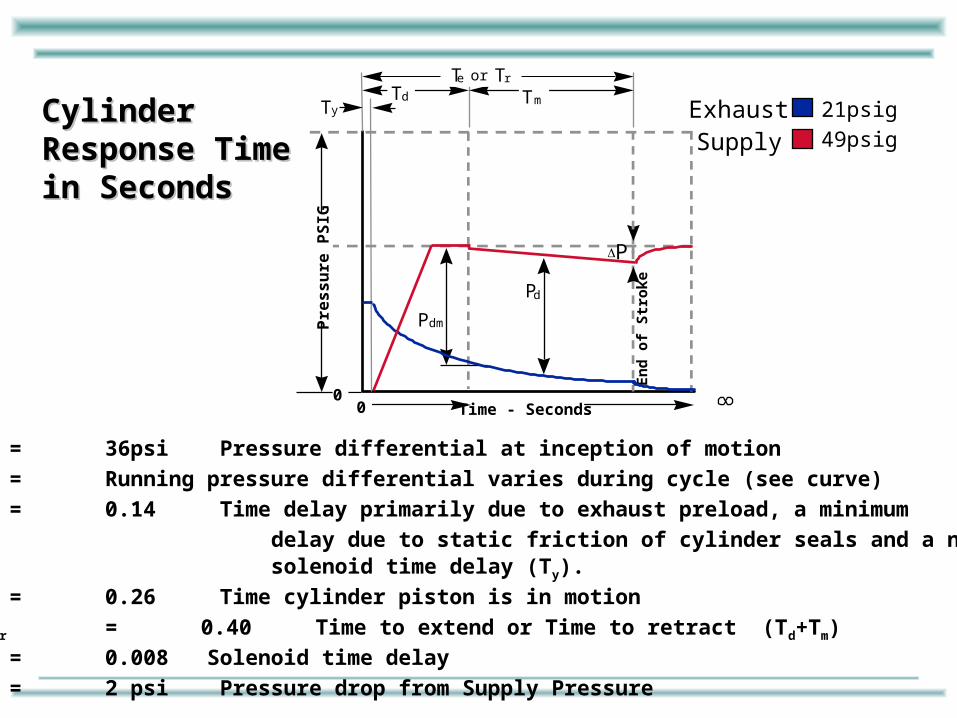
ExhaustSupply
21psig
49psig
Pdm = 36psi Pressure differential at inception of motionPd = Running pressure differential varies during cycle (see curve)Td = 0.14 Time delay primarily due to exhaust preload, a minimum
delay due to static friction of cylinder seals and a negligible solenoid time delay (Ty).
Tm = 0.26 Time cylinder piston is in motionTe or Tr = 0.40 Time to extend or Time to retract (Td+Tm)Ty = 0.008 Solenoid time delayP = 2 psi Pressure drop from Supply Pressure
Pdm
Pd
En
d o
f S
trok
e
TmTd
Pre
ssu
re P
SIG
Time - Seconds00
P
Ty
TT re or

Dual Pressure Dual Pressure Response Time Response Time in Secondsin Seconds
Pdm = 36psi Pressure differential at inception of motionPd = Running pressure differential varies during cycle (see curve)Td = 0.09 Time delay primarily due to exhaust preload, a minimum
delay due to static friction of cylinder seals and a negligible solenoid time delay (Ty).
Tm = 0.19 Time cylinder piston is in motionTe or Tr = 0.28 Time to extend or Time to retract (Td+Tm)Ty = 0.008 Solenoid time delayP = 0.4 psi Pressure drop from initial Supply Pressure
ExhaustSupply
20psig
75psig
ExhaustSupply
75psig
75psig
Initial:
Pd
En
d o
f S
troke
Td
Ty
Pre
ssu
re P
SIG
Time - Seconds00
00
En
d o
f S
troke
Pdm
Time saved frominitial pressureconditions (0.11)
Tm
Te or Tr
P

Surv
ey #
Surv
ey #
Pe/P
r
Pe/P
r
Bore
Bore
Te/T
r
Te/T
r
CPM
CPM
FC’s
FC’s
$ Co
st/M
$ Co
st/M
$ Ca
pita
l
$ Ca
pita
l
E
xpen
ses
Expe
nses
$ Ope
rating
$ Ope
rating
Cost
Cost
HP
Requi
red
HP
Requi
red
2 75/75 1.50 .40/.45 70 yes 476 257 4.75 1.34
2B 75/75 2.00 .23/.14 163 no 1733 287 2.08 4.89
3 49/21 1.50 .40/.45 70 no 229 230 4.75 0.65
4 61/35 1.50 .40/.45 70 no 289 217 4.75 0.81
5 70/31 1.25 .40/.45 70 no 219 190 4.75 0.62Compressor pressure for all surveys are kept at 100 PSIG
Valve Cv‘s and costs for survey #’s 2, 2B, 3, 4 and 5 are respectively, 2.05 - $85, 2.05 - $85, 0.41 - $58, .25 - $45, 0.25 - $45
3/8” NPT Pipe conductor cost $25 and 1/8” NPT costs $20
Cylinder costs for 2.0”, 1.5” & 1.25” bores are respectively $152, $102 and $75
A pair of flow controls cost $20 and a pair of regulators cost $50
Survey #2 ($85+$25+$102+$20+$25 = $257) O.E.M. would select #5 because of minimum capital investment
Survey #2B ($85+$25+$152+$102+$50 = $287) End user would select #2B because of low cost/pc
Survey #3 ($58+$20+$102+$50 = $230) Facilities would select #3 because of lowest pressure
Survey #4 ($45+$20+$102+$50 = $217) demands or #5 because of minimum HP requirement
Survey #5 ($45+$20+$75+$50 = $190) depending on the major objective of facilities engineer

2-1/2 Seconds 40 Minutes 300 Hours
Dynamic Seals With LubricationFlow of O-Ring into Metallic Surfaces
“The theory has been proposed and generally accepted that the increase of friction on standing is caused by the rubber O-ring flowing into the microfine grooves or surface irregularities of the mating part. As a general rule for a 70º durometer rubber against an 8 micro-inch surface, the maximum break-out friction which will develop in a system is three times the running friction.”
Friction is always a factor with dynamic seals. Obviously, the more dynamic seals --- the greater the friction.
We can assume the cylinder has been sized properly to overcome the Le and Lr loads.
Lx --- the exhaust back pressure load --- is determined by the ability of the cylinder’s ports to allow exhaust to escape; the Cv of the cylinder.

Effective Orifice --- Effective Orifice --- Valves: Valves: As with cylinders, VALVEVALVE CCvv is determined not by the port
of the valve, but by the smaller orifice of the fitting in the port. Port Size (NPT)
10/321/8 1/4 3/8 1/2 3/4 1 1 1/4 Valve Size
MK 3 .18 .35*
MK 7 .2 .4*
MK 8 .3 .8 1.0*
MK 15 .4 1.1 1.4 1.5*
MK 55 .6 2.0 2.854.0 5.0 5.55*
*there is no improvement in the valve’s Cv beyond this point
Consider: System Cv equals the combination ofCylinder Cv ~ Conductor and Fittings Cv ~ Valve Cv
and any additional devices in the circuit

Critical Pressure Ratio: Critical Pressure Ratio:
P
80“““““““““
=1 P+P2
P P2P Q0
102030404550607080
8070605040353020100
028384345.546““““
1At start, there is 80 psig available and the needle valve is closed. As the needle valve is slowly opened, in P increments of 5 and 10 psi, the flow is noted.
OBSERVEEven with a larger P --- FLOW DOES NOT CONTINUE TO INCREASE.
Air has reached CRITICAL FLOW and FLOW cannot increase.Terminal velocity occurs at the CRITICAL PRESSURE RATIO
= .53 P2
P1 P1 = .47P
Q (SCFM)P1 P2
P
Needle Valve
Flow meter

Terminal Velocity: Terminal Velocity:
A jet engine takes air in, compresses the air with fuel, and then ignites the mixture.
At some point, air cannot enter the engine any faster. No matter how much more fuel is added --- the plane cannot go any faster.
The limiting factor is AIR FLOW, supply to the engine.
In a pneumatic circuit, the cylinder reaches TERMINAL VELOCITYwhen the air cannot enter and/or exit the circuit any faster. This occurs at
P1= .47P

Terminal Velocity for a Terminal Velocity for a Cylinder: Cylinder:
IF a properly sized cylinder had • air supplying and • exhausting at the • CRITICAL PRESSURE DROP RATIO THE PNEUMATIC CYLINDER WOULD BE AT
TERMINAL VELOCITY for that TERMINAL VELOCITY for that particular circuit. particular circuit. To improve cycle time we must improve the smallest Cv of the system and maintain the critical pressure ratio.
Therefore:HOW FAST CAN AN AIR CYLINDER CYCLE?
8012
3 4 567
x1000r/min
H
CF
E

If Energy Waste Was This If Energy Waste Was This Obvious,Obvious,
You’d Put A Stop To ItYou’d Put A Stop To It

Benefits of Dual Pressure: Benefits of Dual Pressure:
Percent Cost Savings Attainable
Utilizing Numasizing in
Industrial Pneumatic Systems
Retract Pressure (PSIG)
Exte
nd
Pre
ssu
re (
PS
IG)
90
80
70
60
50
40
30
0% 5.0 9.2 14.8 19.1 24.0 28.9
10.0 14.1 19.8 24.0 28.9 33.9
18.4 24.0 28.2 33.9 38.8
29.6 33.9 38.8 43.7
38.1 43.0 47.9
47.8 52.9
57.8
90 80 70 60 50 40 30
Why NUMASIZE?
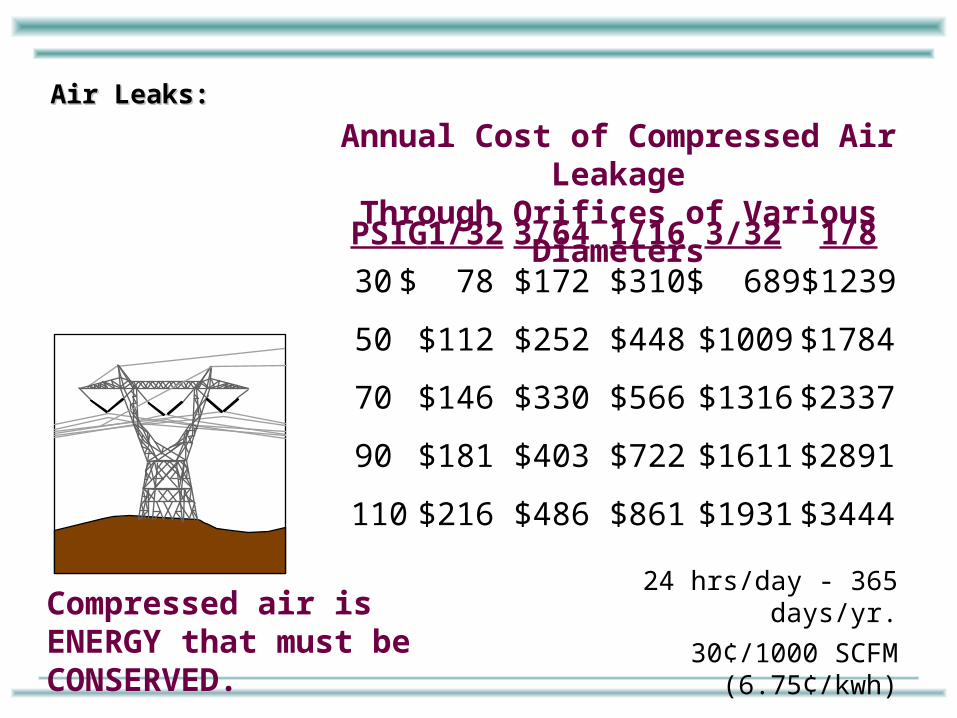
Air Leaks: Air Leaks:
Annual Cost of Compressed Air Leakage
Through Orifices of Various Diameters
30 $ 78 $172 $310 $ 689$1239
50 $112 $252 $448 $1009$1784
70 $146 $330 $566 $1316$2337
90 $181 $403 $722 $1611$2891
110$216 $486 $861 $1931$3444
PSIG1/323/64 1/16 3/32 1/8
24 hrs/day - 365 days/yr.
30¢/1000 SCFM (6.75¢/kwh)
Compressed air is ENERGY that must be CONSERVED.

Resource Cost: Resource Cost:
Average Compressor H.P. In Use based upon
4 s.c.f.m./H.P. - 30¢/1000 s.c.f. -
6.75¢/kwh
Compressed Air Cost
4000375035003250300027502500225020001750150012501000750500250
100020003000400050006000
1 shift/day - 250 days/year
2 shifts/day - 2
50 days/year
3 shift
s/day
- 250 d
ays/
year
24 h
ours
/day
- 3
65 d
ays/
year
Cost
to G
en
era
te C
om
pre
ssed
Air
($1,0
00’s
)
Horsepower

Total Energy Production: Total Energy Production:
1990 FUEL SOURCES -- Production of ENERGY
38,470,000 BPDOE (Barrels Per Day Oil Equivalent)
(81.44 Quadrillion BTU's or Quads)
Electrical Segment of Industry
4,860,000 BPDOE (10.26 Quads) 34%
37% 20%16%
COAL 23.3%
8,960,000 BPDOE
NAT. GAS 24.0%
9,230,000 BPDOE
HYDRO 3.5%
1,350,000 BPDOE
NUCLEAR 7.0%
2,690,000 PBDOE
INDUSTRIAL14,200,000 BPDOE
RESIDENTIAL7,700,000 BPDOE
COMMERCIAL6,170,000 BPDOE
OTHER0.3%
120,000 PBDOE
OIL 41.9%
16,120,000 BPD
Transportation
10,400,000 PBDOE
27%
CONSUMPTION
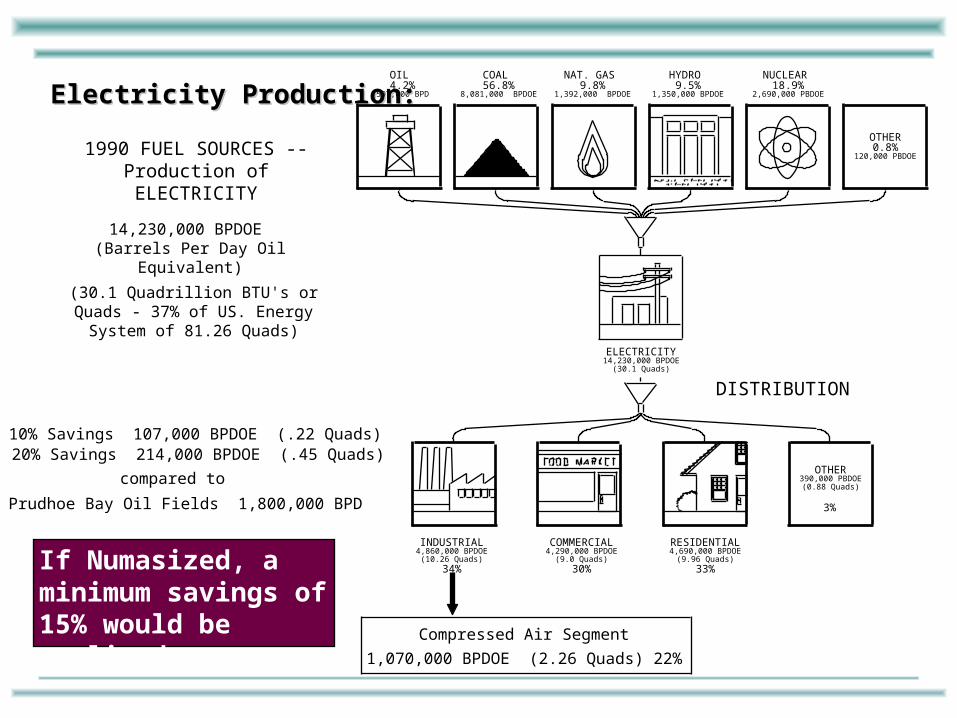
Electricity Production: Electricity Production:
10% Savings 107,000 BPDOE (.22 Quads)20% Savings 214,000 BPDOE (.45 Quads)
compared to
Prudhoe Bay Oil Fields 1,800,000 BPD
1990 FUEL SOURCES -- Production of ELECTRICITY
14,230,000 BPDOE (Barrels Per Day Oil Equivalent)
(30.1 Quadrillion BTU's or Quads - 37% of US. Energy System of
81.26 Quads)
DISTRIBUTION
COAL 56.8%
8,081,000 BPDOE
NAT. GAS 9.8%
1,392,000 BPDOE
HYDRO 9.5%
1,350,000 BPDOE
NUCLEAR 18.9%
2,690,000 PBDOE
INDUSTRIAL4,860,000 BPDOE
(10.26 Quads)34%
RESIDENTIAL4,690,000 BPDOE
(9.96 Quads)33%
COMMERCIAL4,290,000 BPDOE
(9.0 Quads)30%
OTHER0.8%
120,000 PBDOE
OIL 4.2%
597,000 BPD
ELECTRICITY14,230,000 BPDOE
(30.1 Quads)
OTHER390,000 PBDOE
(0.88 Quads)
3%
If Numasized, a minimum savings of 15% would be realized.
Compressed Air Segment
1,070,000 BPDOE (2.26 Quads) 22%

Conceptual View Point: Conceptual View Point:
The preceding two slides/charts are based on Energy Information Administration (EIA) surveys. There were some slight differences between the 1990 and the updated figures for 1990 as published in the October 1991 report. Some variations also showed up when comparing the figures of National Business, Electric World, Pipe and Gas Journal, etc. with those of EIA. Since the deviations were minor (mostly due to independent rounding), we have reconciled all of them as to render uniform results. From a conceptual viewpoint and from the ultimate potential savings and increased productivity aspect, they have no bearing as the differences are miniscule.
Also, we have incorporated in these figures the fact that 1,033,100 BTU’s (EIA from utilities) is required to generate 100 Kwhrs of electricity (due to losses in conversion and transmission), while 300 Kwhrs are needed to produce 1,024,000 BTU’s of heat (1 Kwhrs = 3413 BTU’s).
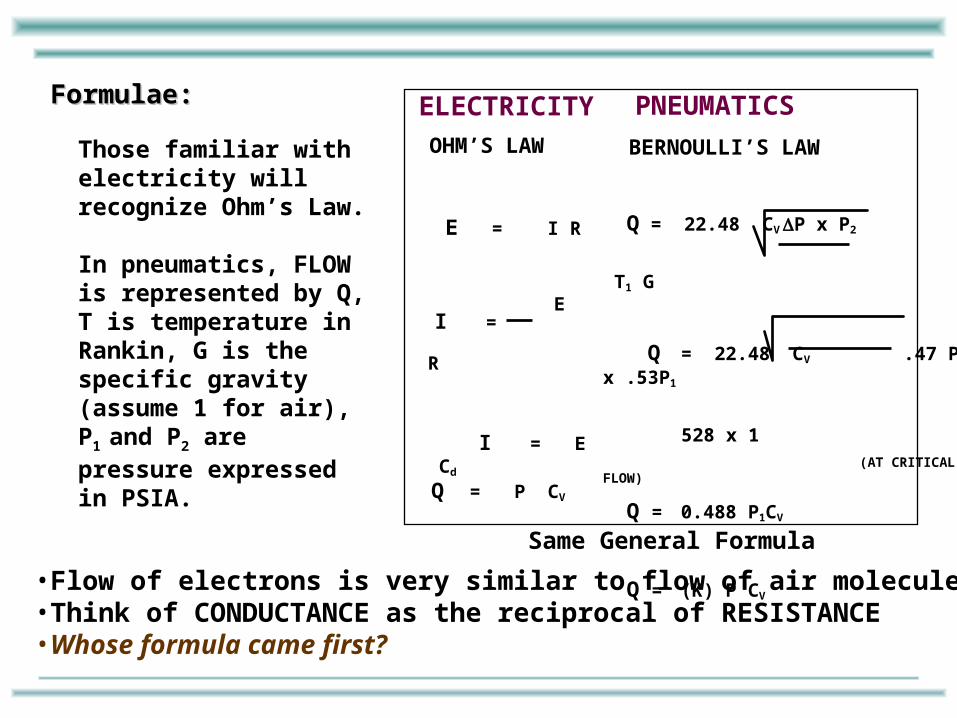
Formulae: Formulae:
•Flow of electrons is very similar to flow of air molecules•Think of CONDUCTANCE as the reciprocal of RESISTANCE•Whose formula came first?
Those familiar with electricity will recognize Ohm’s Law.
In pneumatics, FLOW is represented by Q, T is temperature in Rankin, G is the specific gravity (assume 1 for air), P1
and P2 are pressure expressed in PSIA.
Same General Formula
E = I R
E
R
I = E Cd
ELECTRICITYOHM’S LAW
I =
Q = P CV
PNEUMATICS
BERNOULLI’S LAW
Q = 22.48 CV P x P2
T1 G
Q = 22.48 CV .47 P1 x .53P1
528 x 1 (AT CRITICAL FLOW)
Q = 0.488 P1CV
Q = (K) P CV

Your Most Important Design Tool


